Embed Size (px)
Citation preview

Malaysia Economic MonitorBrain Drain
April 2011
www.worldbank.org/my
THE WORLD BANK

How is the economy performing post-recovery?

90
95
100
105
110
115
120
07 Q1
Q3 08 Q1
Q3 09 Q1
Q3 10 Q1
Q3
GDP level without crisis (sa)
Actual GDP level (sa)
9.2%
6.3%
MALAYSIA ECONOMIC MONITOR
Real GDP growth, QoQ , sa, percent
Growth momentum picked up late 2010.... but output losses from the crisis persist
3
2.4
0.4
-0.3
-2.5
-3.7
2.7 2.4
3.1
1.71.4
-1.0
2.6
-4
-3
-2
-1
0
1
2
3
Q1 08
Q2 08
Q3 08
Q4 08
Q1 09
Q2 09
Q3 09
Q4 09
Q1 10
Q2 10
Q3 10
Q4 10
Actual and simulated GDP levels (sa), Q1 2008=100
Note: No-crisis scenario assumes quarterly growth
at averages of 2002-07.

Inflationary pressure is building....but remains benign in regional context
MALAYSIA ECONOMIC MONITOR
CPI inflation, YoY, percent
4
-8
-6
-4
-2
0
2
4
6
8
Jan-09 Jul-09 Jan-10 Jul-10 Jan-11
Month-on-Month
Year-on-year
-4
-2
0
2
4
6
8
Aug-09 Feb-10 Aug-10 Feb-11
Indonesia
Malaysia
China
Thailand
CPI inflation: YoY and MoM (3mma, saar), percent

Export recovery lagged the region’s....a decline in structural competitiveness?
MALAYSIA ECONOMIC MONITOR
Goods export volume in USD, rebased to Jan 2007=100
5
Note: Export volume of Jan 2011 relative to Jan 07 (=100) in brackets
55
75
95
115
135
155
175
Jan-08 Jan-09 Jan-10 Jan-11
China
Indonesia
Malaysia
Korea
E&E export value, sa, rebased to Jan 2008=100
50
70
90
110
130
150
170
2007M01 2008M01 2009M01 2010M01 2011M01
Hong Kong SAR, China (127)
Korea Republic (138)
Malaysia (117)
Singapore (131)
Thailand (124)
Taiwan, China (130)

Foreign direct investment rebounded....but remains well below potential
MALAYSIA ECONOMIC MONITOR 6
Total FDI inflows, USD billion (UNCTAD data)
Actual and simulated average annual FDI inflows from
24 OECD economies during 2007-09, USD billion,
OECD bilateral FDI data
15.3
7.1
5.5
3.8
0 4 8 12 16
Best practice
Partial improvement
Predicted
Actual
3.9 3.8
0.6
3.22.5
4.64.1
6.1
8.6
7.2
1.4
8.6
0
1
2
3
4
5
6
7
8
9
99 00 01 02 03 04 05 06 07 08 09 10

What is the outlook for growth?
MALAYSIA ECONOMIC MONITOR

In the near term, output is expected to resume growth at pre-crisis rates
MALAYSIA ECONOMIC MONITOR
Actual and forecast real GDP growth, year-on-year, percent
8
6.5
4.7
-1.7
7.2
5.3 5.5
-2
0
2
4
6
8
2007 2008 2009 2010 2011f 2012f

Over the medium term, the challenge is to escape the middle income trap....
MALAYSIA ECONOMIC MONITOR 9
Real GDP growth, percent
-8
-6
-4
-2
0
2
4
6
8
10
12
1961 1967 1973 1979 1985 1991 1997 2003 2009-30
-20
-10
0
10
20
30
40
0 10000 20000 30000 40000
Malaysia
Korea
Hong
Kong
Singapore
Annual growth over 1962-2009 in GNI per capita against level

..... and book further success in reducing poverty and inequality
MALAYSIA ECONOMIC MONITOR
Gini coefficient of inequality and poverty incidence
10
0%
10%
20%
30%
40%
50%
60%
0.40
0.42
0.44
0.46
0.48
0.50
0.52
0.54
1970 1989 1997 2002 2009
Inequality (left)
Poverty (right)
0.3
0.4
0.8
1.1
1.3
2.0
3.2
3.6
3.8
4.2
6.3
8.4
9.8
12.0
42.9
0 10 20 30 40 50
W.P. Labuan
Melaka
N.Sembilan
W.P.KL
Perlis
P.Pinang
Pahang
Selangor
Terengganu
Johor
Kelantan
Perak
Kedah
Sarawak
Sabah
Share of national poor in 2009, percent

The reform agenda: progress has been made, but implementation needs to be accelerated
• Assessment and articulation: significant progress– Frank assessments– Bottom-up and private-sector led approaches– Sound structure of the reform agenda
• Implementation: more needs to be done– New frameworks to facilitate implementation– Positive sentiment on NKEA projects– Interviews suggest skepticism on NEM
• Addressing cross-cutting issues is key, else:– Project-based growth acceleration not sustained– Underlying competitiveness eroded
MALAYSIA ECONOMIC MONITOR 11

Whither the Brain Drain?

Why a report on brain drain?
MALAYSIA ECONOMIC MONITOR
An impediment to Vision 2020?• Malaysia needs talent
• Talent seems to be leaving
A subject of debate and controversy• Anecdotes are abundant
• Systematic studies are few
A topic that raises many questions• How large is the brain drain?
• What is its economic impact?
• How can policymakers respond?
13

(1) How large is the brain drain?
MALAYSIA ECONOMIC MONITOR
• The Malaysian diaspora is estimated at one million as of 2010
• The diaspora is geographically concentrated and ethnically skewed
• About a third of all migration represents brain drain
14

Diaspora is estimated conservatively at 1 million, of which a third is brain drain
Note: in thousands
MALAYSIA ECONOMIC MONITOR 15
827
1,023 1,023
1,415 1,415
277306
335365
453
0
200
400
600
800
1,000
1,200
1,400
Baseline S1 S2 S3 S4
Diaspora in 2010
Brain drain in 2010
conservative estimateAssumptions on
Singapore nonresidents
Share
Malaysian
Share
skilled
Base 0% 0%
S1 15% 15%
S2 15% 30%
S3 45% 15%
S4 45% 30%

Singapore’s nonresident population has grown rapidly
Evolution of population in Singapore, thousands
MALAYSIA ECONOMIC MONITOR 16
2,1942,623
2,9853,230
87
112
287
541
131
311
754
1,305
0
1000
2000
3000
4000
5000
1980 1990 2000 2010
Nonresidents
Permanent residents
Citizens

Diaspora and brain drain are concentrated in just a few countries
Share in diaspora, by destination country
MALAYSIA ECONOMIC MONITOR 17
2%
4%
10%
5%
3%
15%
54%
2%
2%
6%
6%
7%
10%
57%
0% 10% 20% 30% 40% 50% 60%
New Zealand
Canada
United States
United Kingdom
Brunei
Australia
Singapore
Diaspora in 2010
Brain drain in 2010

The rate of brain drain remains elevated.....
Estimates of yearly growth in skilled-migrant population, 25+, 2000-2010
MALAYSIA ECONOMIC MONITOR 18
0.5%
2.6%
2.9%
3.5%
4.7%
4.7%
0% 1% 2% 3% 4% 5% 6%
Canada
United Kingdom
Australia
United States
Brunei
New Zealand
Singapore
4.2%
average
6.0%

6%10%
49%
70%
78% 79%
70%
18%
23%
34%
56%
65%68%
71%
0%
20%
40%
60%
80%
Brunei UK New Zealand USA Australia Canada
1990 2000
Singapore
35%
2010
.... because migration to Singapore is becoming primarily skilled migrationShare of skilled migrants at destination in total migrants at destination, 25+, percent
MALAYSIA ECONOMIC MONITOR 19

(2) What is the economic impact of brain drain?
MALAYSIA ECONOMIC MONITOR
• Brain drain is aggravated by a narrow skill base and a lack of compensating inflows
• Brain drain imposes costs, but can also bring benefits
• Brain drain has likely contributed to an erosion of the already narrow skill base
20

Brain drain is intense relative toa narrow skill base
Gross emigration rate, percent, OECD destinations
MALAYSIA ECONOMIC MONITOR 21
1.2%
4%
8%
11%
14%
30%
1.3%
3%
10%
26%
25%
33%
0% 10% 20% 30%
Japan
China
Korea
Malaysia
Singapore
Hong Kong
1990 20005% global
average
20%
34%
adding Singapore*

Brain drain is not alleviated by compensating inflow of skilled migrants
MALAYSIA ECONOMIC MONITOR 22
0
5
10
15
20
25
30
35
40
1982 1986 1990 1996 2000 2004 2008
Share of migrants with no formal education
Share of migrants with primary education
0
2
4
6
8
10
12
14
1982 1986 1990 1996 2000 2004 2008
Share of migrants in total employment

Brain drain has likely eroded the quality of the skill base
Number of weeks to fill vacancy for skilled technician
MALAYSIA ECONOMIC MONITOR 23
8.8
5.3 5.13.8 3.7 3.4 3.2 2.9
1.6
0
2
4
6
8
10
Bra
zil
20
03
Ma
laysia
20
07
Th
aila
nd
20
07
Ire
lan
d 2
00
5
Ge
rma
ny 2
00
5
Ko
rea
20
05
Ind
ia 2
00
2
Ru
ssia
20
05
Ind
on
esia
20
03
Percent of managers considering skill set of local
skilled production workers ‘poor’ or ‘very poor’.
0 10 20 30 40 50
IT
English language proficiency
Professional communication
Creativity/innovation
Technical/professional
Problem solving
Numerical
Time management
Leadership
Adaptability
Social
Teamworking
Manufacturing
Services
(3) How can policies address brain drain?
MALAYSIA ECONOMIC MONITOR
• Brain drain is a wave to be ridden, not a tide to be turned
• It is a symptom of underlying factors, not a problem in itself
• To address the brain drain at its root, the productivity and inclusiveness agendas are key
• Targeted policies to facilitate the flow of talent can complement but not substitute
24

Brain drain is a symptom of underlying factors... productivity and inclusiveness are key
Source: Survey of the diaspora
MALAYSIA ECONOMIC MONITOR 25
12%
19%
23%
28%
30%
54%
60%
66%
0% 10% 20% 30% 40% 50% 60% 70%
Livability
Study and return
Politics
Safety and security
Study and stay on
Compensation
Social injustice
Career prospects
Percent of respondents listing factor among top three concerns

Brain drain requires a comprehensive approach: (a) Boosting productivity to raise wages....
Note: TFP = total factor productivity
MALAYSIA ECONOMIC MONITOR 26
4.4
1.3
3.4
2.2
-0.4
2.3
7.8
4.5
-1
1
3
5
7
87-97 98-07 87-97 98-07 87-97 98-07 87-97 98-07
Services Industry Agriculture Memo: Manufacturing
TFP
Land
Skills
Capital
Contribution to labor productivity growth, percentage points

....by addressing the supply side (improving education system)
MALAYSIA ECONOMIC MONITOR 27
0 10 20 30 40 50 60
Negeri …
Kelantan
Kedah
Pulau Pinang
Sabah
Johor
Melaka
Selangor
KL
Perlis
Perak
Sarawak
Terengganu
Pahang
Urban
Rural
TIMMS score of 13-year olds in science, by percentile Share of 14 year old with math score below 400, TIMMS
200 400 600 800
Indonesia
Int'l average
Thailand
Malaysia
Australia
US
Hong Kong, China
Russian
Korea
Japan
England
Taiwan, China
Singapore
10th (Science)
90th (Science)

....and addressing the demand side (promoting innovation and competition)
Share of firms considering ‘lack of appropriate source of finance’ as factor hampering innovation activities, according to importance
MALAYSIA ECONOMIC MONITOR 28
10%
30%23% 24%
43%19%
38% 55% 47%
41%71%
32%23%
29%
15%
0%
20%
40%
60%
80%
100%
1990-94 1997-99 2000-01 2002-04 2005-08
Not important or slightly important
Moderately important
Very important
14 1416
20
0
5
10
15
20
25
Manufacturing firms Services firms
2002
2007
Share of firms indicating ‘anti-competitive practices’ as ‘severe’ of ‘very severe’ problem, 2002-2007, percentage points
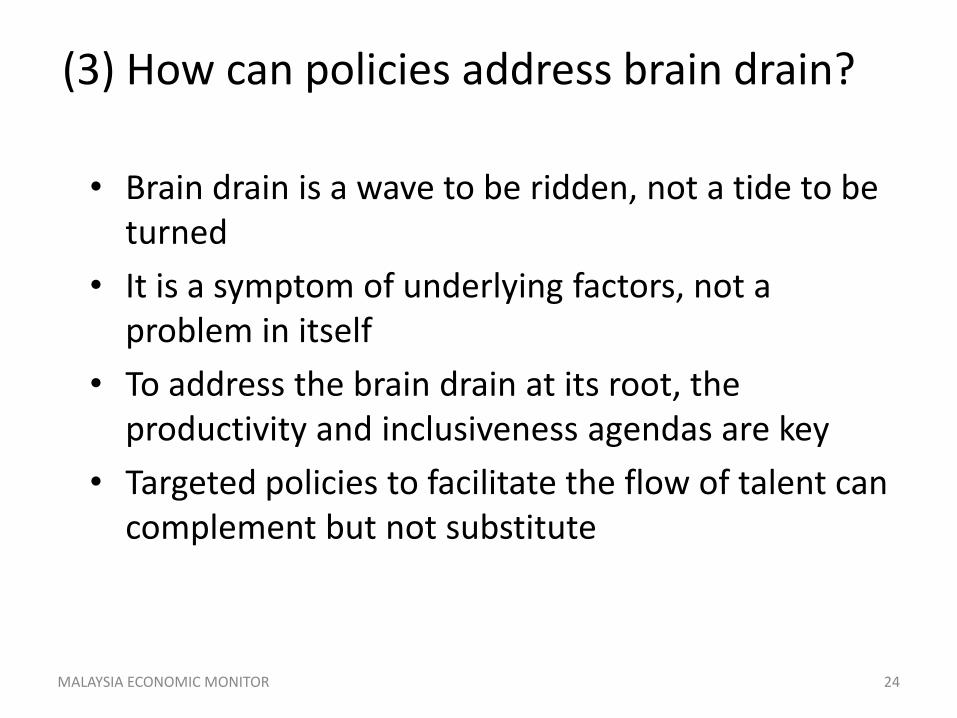
Brain drain requires a comprehensive approach:(b) Enhancing inclusiveness to leverage on all talent
Share in Malaysian resident diaspora in Singapore, by ethnicity,
MALAYSIA ECONOMIC MONITOR 29
85%
9%
5%
88%
6%5%
0%
20%
40%
60%
80%
Chinese Malay Indian
2000
2010
61%
18%
10%6%
2.3% 2.2%
0%
10%
20%
30%
40%
50%
60%
Chinese
English
Malay
Indian
Other Asian
Other
Share of Malaysian adults in US by language group, 2000

With enabling conditions in place, talent management and diaspora engagement can complement
Expatriates, thousands, by sector employed. Peninsular Malaysia only
MALAYSIA ECONOMIC MONITOR 30
7 5 5 6 4 3 5
19
15 1618 22
22 21
17
13 13
1210
7 7
0
10
20
30
40
50
2004 2005 2006 2007 2008 2009 2010
Manufacturing
Services
Other

Thank you
MALAYSIA ECONOMIC MONITOR 31