Embed Size (px)
Citation preview

1
MALAWI mVAM Bulletin #7: July 2016
Food security continues to deteriorate in the south
Key points:
Food security is worsening in most of the southern districts of Malawi. Negative coping levels remain the highest in the southern and central region.
As maize prices continue to rise, purchasing power has fallen in almost all monitored districts. It is lowest in the southern region, where maize and pulses are most expensive.
WFP/ Gregory Barrow
Prolonged and severe El Niño-induced dryness sharply reduced maize
production in 2016, causing an estimated deficit of 770,000 mt. This has
resulted in record high prices. The Malawi Vulnerability Assessment
Committee (MVAC) forecasts that around 6.5 million people (39 percent of the
population) will not be able to meet their annual minimum food requirements
in 2016/2017.
Source: MVAC: National Food and Nutrition Security Forecast: April 2016 to
March 2017
Situation Update
Average age of
respondents 29
Housing wall type
Head of household
Female: 43%
Male: 57%
2,750 Interviewed households
Cement: 14%
Baked brick: 42%
Unbacked brick: 24%
Mud: 17%
N/A: 4%

2
mVAM Bulletin #7: July 2016
Source: mVAM / July 2016
Map 1: median rCSI by aggregated district
Negative coping levels increase in the south
Nationally, the reduced Coping Strategy Index (rCSI)1 remained stable at 23 between June and July,
with 96 percent of households engaging in at least one negative coping strategy.
However, the rCSI deteriorated in the southern aggregated districts of Blantyre-Mwanza-Neno-Balaka
(from 17 to 22), Chikwawa-Nsanje (from 20 to 24) and Machinga-Mangochi (from 21 to 24). rCSI
remains the highest in the central aggregated districts of Dowa-Ntchisi-Kasungu-Mchinji, Dedza-
Ntcheu and Nkhotakota-Salima (Map 1). The southern and central areas were those most affected by
the El Niño-induced drought.
In the north, negative coping levels improved compared to June, particularly in the aggregated
districts of Mzimba-Karonga-Rumphi. Northern districts have had a better harvest than other regions,
as they experienced more favourable weather conditions (source: Food and Agriculture Organization).
Wall types are used as a proxy indicator to determine a household’s socio-economic status. The July
rCSI was the same as in June both for poorer households (with unbaked brick and mud walls) and for
those better off (with cement and baked brick walls). Better off households are resorting less to
negative coping strategies than those worse off (Figure 1).
July results confirm that households led by women are engaging more in negative coping strategies
than those led by men (Figure 2).
Figure 1: median rCSI by wall type
Source: mVAM / July 2016
1 The reduced coping strategies index expresses the frequency and severity of the mechanisms that households use to access food. The more negative coping strategies households implement, the higher the rCSI.
Figure 2: median rCSI by head of household
Source: mVAM / July 2016
3
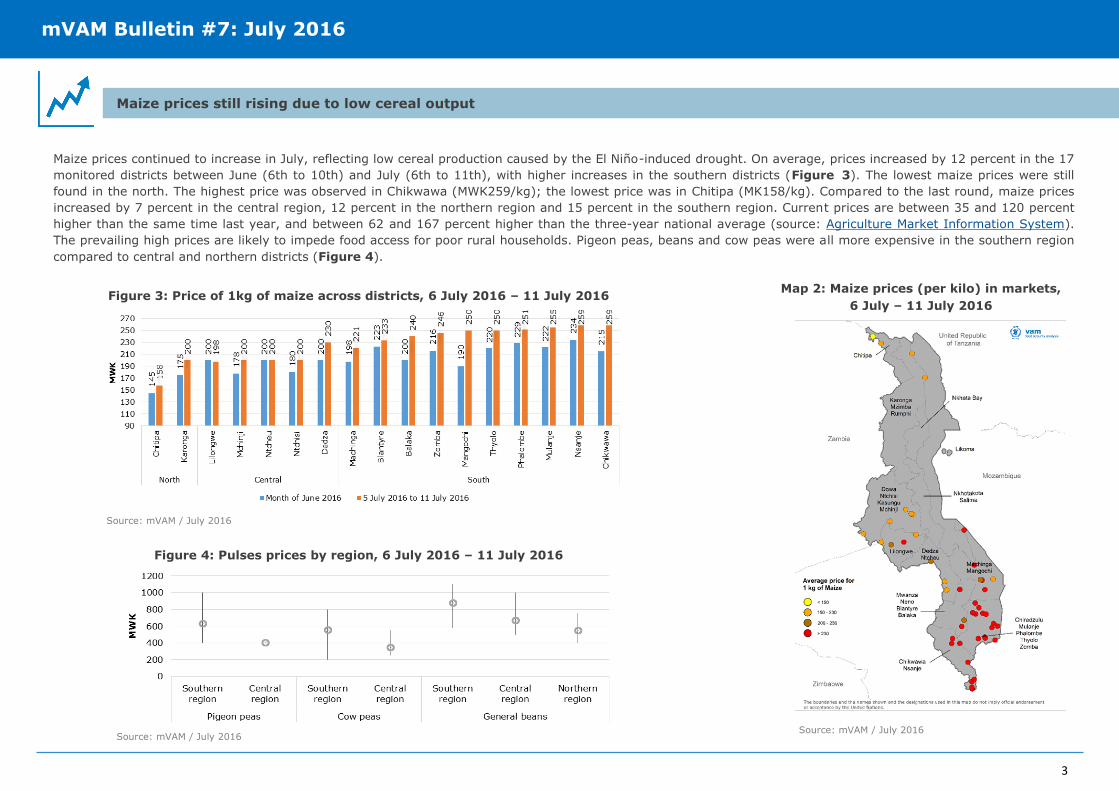
Maize prices still rising due to low cereal output
Maize prices continued to increase in July, reflecting low cereal production caused by the El Niño-induced drought. On average, prices increased by 12 percent in the 17
monitored districts between June (6th to 10th) and July (6th to 11th), with higher increases in the southern districts (Figure 3). The lowest maize prices were still
found in the north. The highest price was observed in Chikwawa (MWK259/kg); the lowest price was in Chitipa (MK158/kg). Compared to the last round, maize prices
increased by 7 percent in the central region, 12 percent in the northern region and 15 percent in the southern region. Current prices are between 35 and 120 percent
higher than the same time last year, and between 62 and 167 percent higher than the three-year national average (source: Agriculture Market Information System).
The prevailing high prices are likely to impede food access for poor rural households. Pigeon peas, beans and cow peas were all more expensive in the southern region
compared to central and northern districts (Figure 4).
Map 2: Maize prices (per kilo) in markets,
6 July – 11 July 2016
Source: mVAM / July 2016
Figure 3: Price of 1kg of maize across districts, 6 July 2016 – 11 July 2016
Figure 4: Pulses prices by region, 6 July 2016 – 11 July 2016
Source: mVAM / July 2016
Source: mVAM / July 2016
mVAM Bulletin #7: July 2016
4
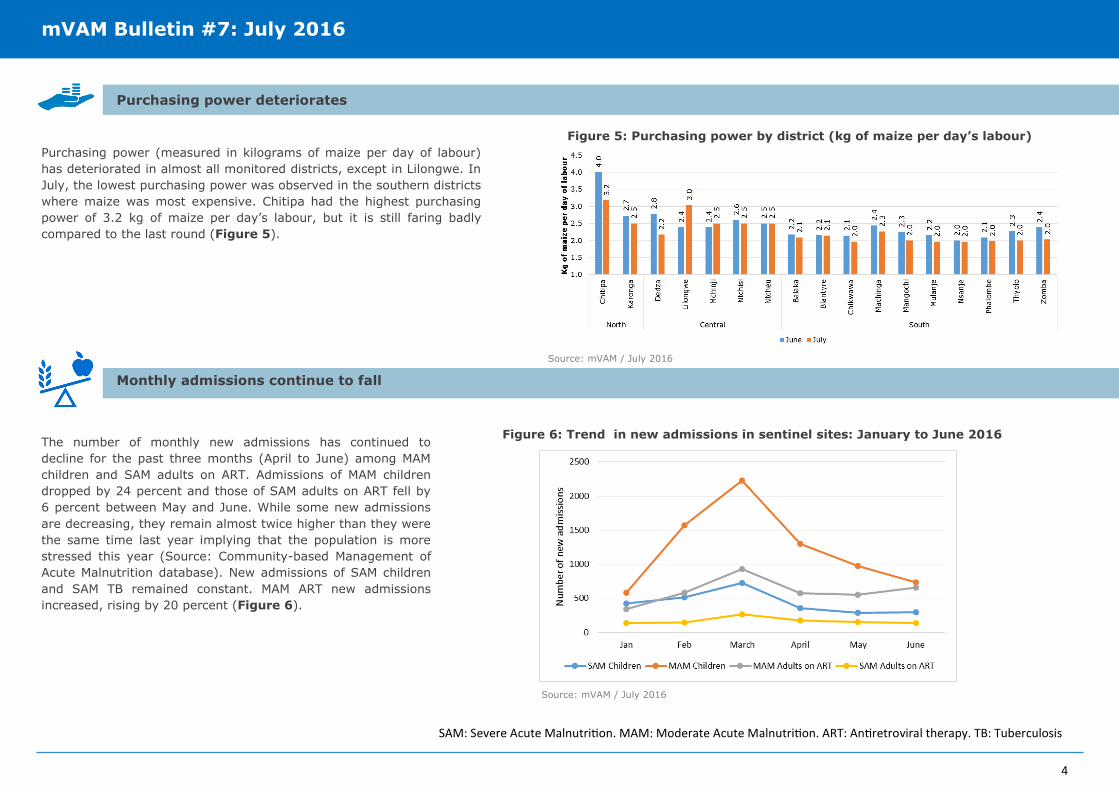
Figure 5: Purchasing power by district (kg of maize per day’s labour)
Purchasing power deteriorates
Monthly admissions continue to fall
WFP/Photographer
Purchasing power (measured in kilograms of maize per day of labour)
has deteriorated in almost all monitored districts, except in Lilongwe. In
July, the lowest purchasing power was observed in the southern districts
where maize was most expensive. Chitipa had the highest purchasing
power of 3.2 kg of maize per day’s labour, but it is still faring badly
compared to the last round (Figure 5).
The number of monthly new admissions has continued to
decline for the past three months (April to June) among MAM
children and SAM adults on ART. Admissions of MAM children
dropped by 24 percent and those of SAM adults on ART fell by
6 percent between May and June. While some new admissions
are decreasing, they remain almost twice higher than they were
the same time last year implying that the population is more
stressed this year (Source: Community-based Management of
Acute Malnutrition database). New admissions of SAM children
and SAM TB remained constant. MAM ART new admissions
increased, rising by 20 percent (Figure 6).
Figure 6: Trend in new admissions in sentinel sites: January to June 2016
Source: mVAM / July 2016
Source: mVAM / July 2016
mVAM Bulletin #7: July 2016
SAM: Severe Acute Malnutrition. MAM: Moderate Acute Malnutrition. ART: Antiretroviral therapy. TB: Tuberculosis
Coco Ushiyama [email protected]
Arif Husain [email protected]
Jean-Martin Bauer [email protected]
Andrew Odero [email protected]
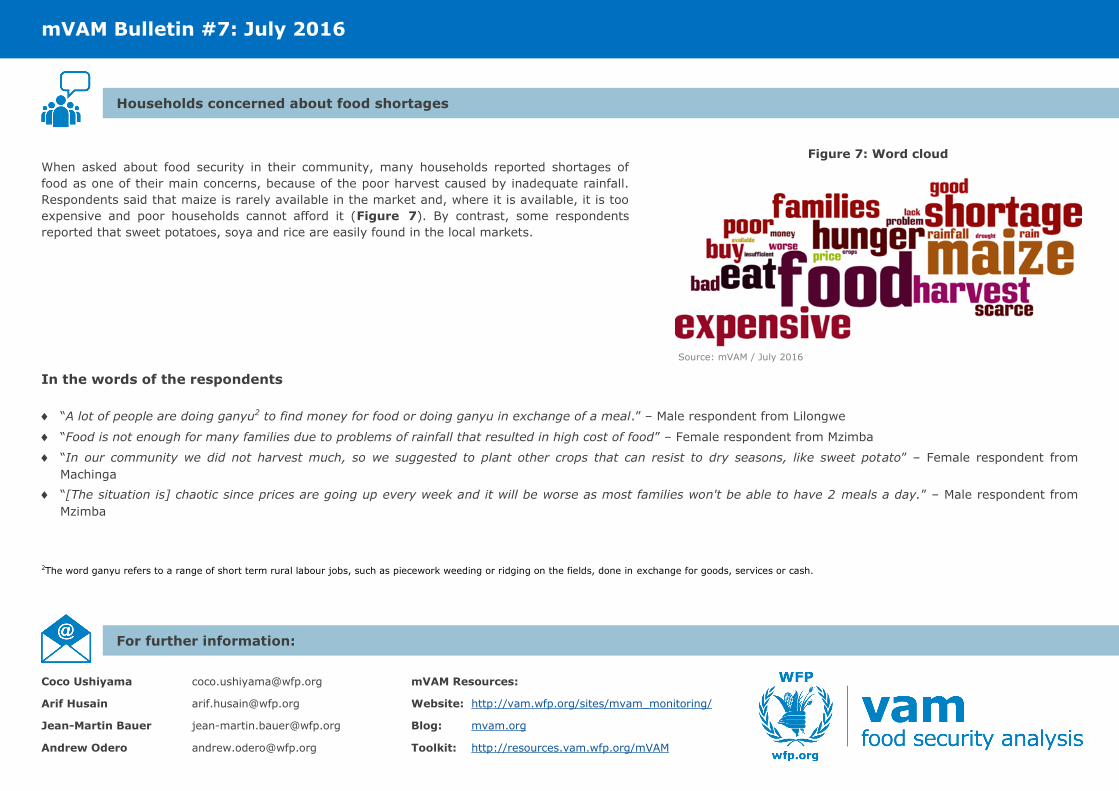
Figure 7: Word cloud
Households concerned about food shortages
When asked about food security in their community, many households reported shortages of
food as one of their main concerns, because of the poor harvest caused by inadequate rainfall.
Respondents said that maize is rarely available in the market and, where it is available, it is too
expensive and poor households cannot afford it (Figure 7). By contrast, some respondents
reported that sweet potatoes, soya and rice are easily found in the local markets.
mVAM Resources:
Website: http://vam.wfp.org/sites/mvam_monitoring/
Blog: mvam.org
Toolkit: http://resources.vam.wfp.org/mVAM
For further information:
Source: mVAM / July 2016
In the words of the respondents
“A lot of people are doing ganyu2 to find money for food or doing ganyu in exchange of a meal.” – Male respondent from Lilongwe
“Food is not enough for many families due to problems of rainfall that resulted in high cost of food” – Female respondent from Mzimba
“In our community we did not harvest much, so we suggested to plant other crops that can resist to dry seasons, like sweet potato” – Female respondent from
Machinga
“[The situation is] chaotic since prices are going up every week and it will be worse as most families won't be able to have 2 meals a day.” – Male respondent from
Mzimba
mVAM Bulletin #7: July 2016
2The word ganyu refers to a range of short term rural labour jobs, such as piecework weeding or ridging on the fields, done in exchange for goods, services or cash.