Embed Size (px)
Citation preview
MAKING THE CASE TO STAKEHOLDERS LINKING POLICY AND ENVIRONMENTAL STRATEGIES TO HEALTH OUTCOMES YMCA OF THE USA
REVISED 10.21.2011
AUDIENCE
Collaborations or
coalitions considering
policy, systems, or
environmental changes to
reduce the prevalence of
chronic disease in their
communities
QUICK SUMMARY
Scientific evidence about the need
for and efficacy of policy, systems,
or environmental change strategies
Explanations to help make the case
for policy, systems, or environmental
change strategies, whose health
outcomes are not often immediate

This publication was supported by Cooperative Agreement number DP001686-2 from the Centers for Disease Control and Prevention (CDC) and grant funding from the Robert Wood Johnson Foundation (RWJF). Its contents are solely the responsibility of the authors and do not necessarily represent the views of the Centers for Disease Control and Prevention or RWJF.
Copyright © 2011 YMCA of the USA. All rights reserved.
CONTENTS I. INTRODUCTION ....................................................................................... 1 Why This Guide Was Created .......................................................................... 2 How This Guide Was Created and What This Guide Provides ................................ 2 How to Use This Guide—Making the Case to Decision Makers .............................. 3 Additional Considerations ............................................................................... 3
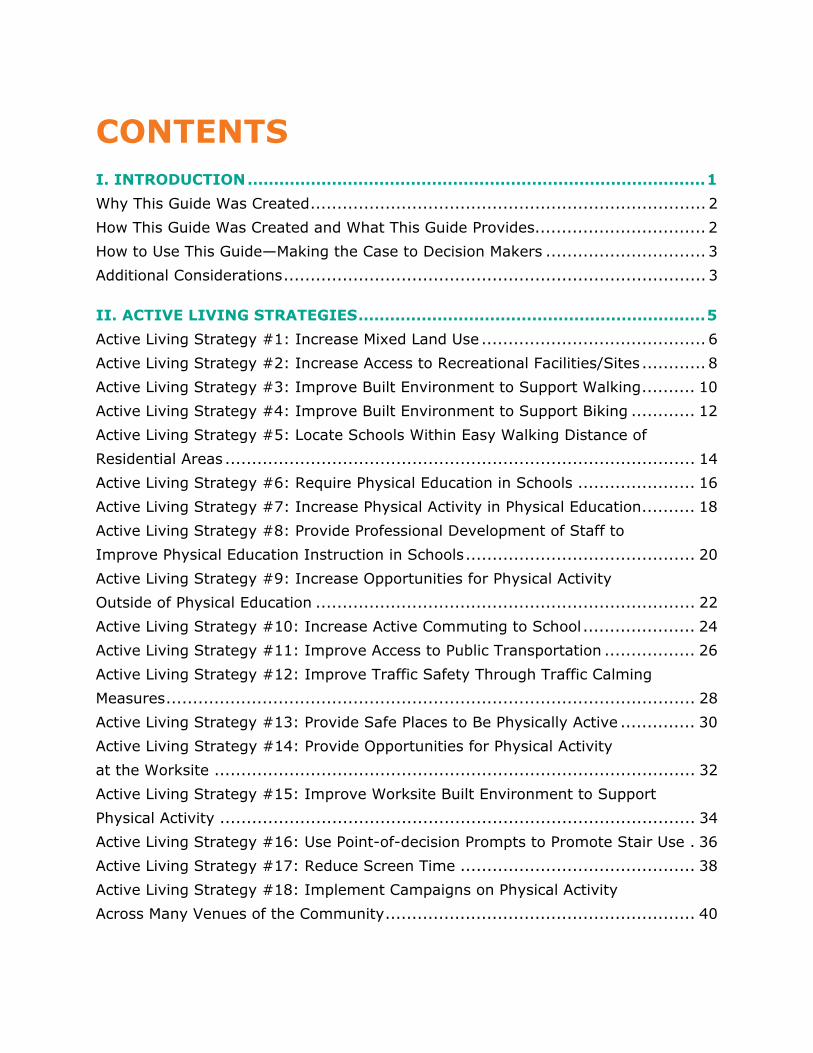
II. ACTIVE LIVING STRATEGIES .................................................................. 5 Active Living Strategy #1: Increase Mixed Land Use .......................................... 6 Active Living Strategy #2: Increase Access to Recreational Facilities/Sites ............ 8 Active Living Strategy #3: Improve Built Environment to Support Walking .......... 10 Active Living Strategy #4: Improve Built Environment to Support Biking ............ 12 Active Living Strategy #5: Locate Schools Within Easy Walking Distance of Residential Areas ........................................................................................ 14 Active Living Strategy #6: Require Physical Education in Schools ...................... 16 Active Living Strategy #7: Increase Physical Activity in Physical Education .......... 18 Active Living Strategy #8: Provide Professional Development of Staff to Improve Physical Education Instruction in Schools ........................................... 20 Active Living Strategy #9: Increase Opportunities for Physical Activity Outside of Physical Education ....................................................................... 22 Active Living Strategy #10: Increase Active Commuting to School ..................... 24 Active Living Strategy #11: Improve Access to Public Transportation ................. 26 Active Living Strategy #12: Improve Traffic Safety Through Traffic Calming Measures ................................................................................................... 28 Active Living Strategy #13: Provide Safe Places to Be Physically Active .............. 30 Active Living Strategy #14: Provide Opportunities for Physical Activity at the Worksite .......................................................................................... 32 Active Living Strategy #15: Improve Worksite Built Environment to Support Physical Activity ......................................................................................... 34 Active Living Strategy #16: Use Point-of-decision Prompts to Promote Stair Use . 36 Active Living Strategy #17: Reduce Screen Time ............................................ 38 Active Living Strategy #18: Implement Campaigns on Physical Activity Across Many Venues of the Community .......................................................... 40
LINKING POLICY AND ENVIRONMENTAL STRATEGIES TO HEALTH OUTCOMES | page ii
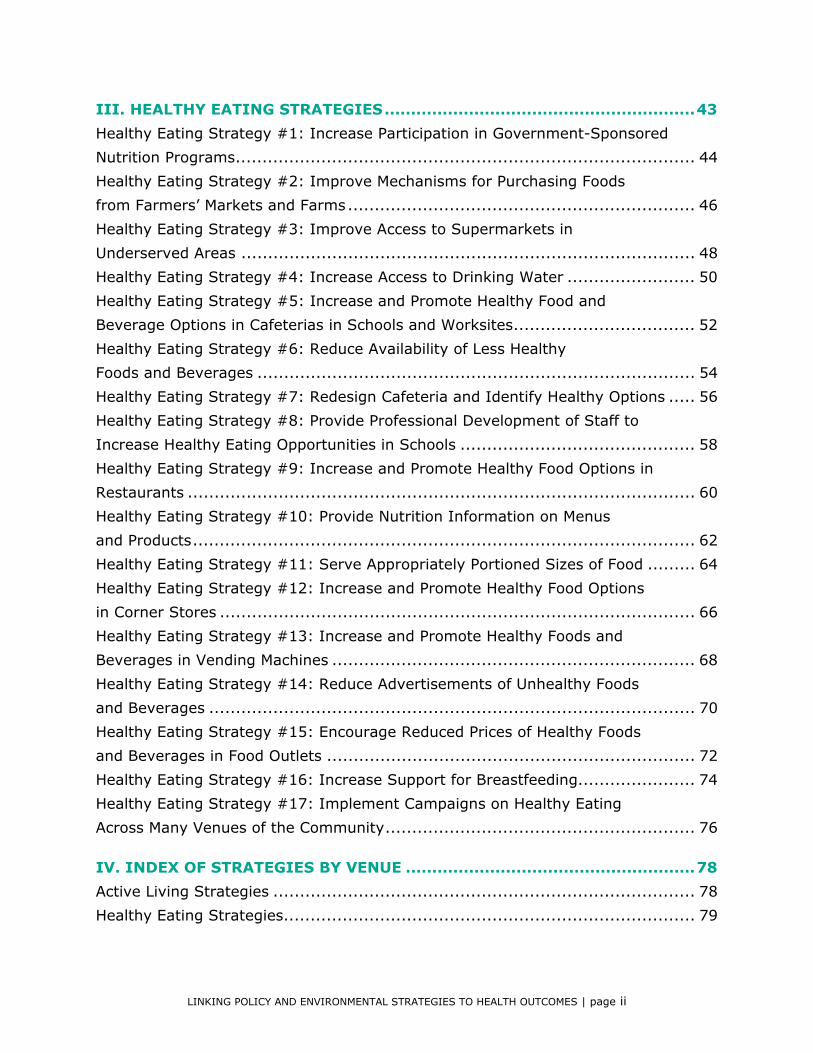
III. HEALTHY EATING STRATEGIES ........................................................... 43 Healthy Eating Strategy #1: Increase Participation in Government-Sponsored Nutrition Programs ...................................................................................... 44 Healthy Eating Strategy #2: Improve Mechanisms for Purchasing Foods from Farmers’ Markets and Farms ................................................................. 46 Healthy Eating Strategy #3: Improve Access to Supermarkets in Underserved Areas ..................................................................................... 48 Healthy Eating Strategy #4: Increase Access to Drinking Water ........................ 50 Healthy Eating Strategy #5: Increase and Promote Healthy Food and Beverage Options in Cafeterias in Schools and Worksites .................................. 52 Healthy Eating Strategy #6: Reduce Availability of Less Healthy Foods and Beverages .................................................................................. 54 Healthy Eating Strategy #7: Redesign Cafeteria and Identify Healthy Options ..... 56 Healthy Eating Strategy #8: Provide Professional Development of Staff to Increase Healthy Eating Opportunities in Schools ............................................ 58 Healthy Eating Strategy #9: Increase and Promote Healthy Food Options in Restaurants ............................................................................................... 60 Healthy Eating Strategy #10: Provide Nutrition Information on Menus and Products .............................................................................................. 62 Healthy Eating Strategy #11: Serve Appropriately Portioned Sizes of Food ......... 64 Healthy Eating Strategy #12: Increase and Promote Healthy Food Options in Corner Stores ......................................................................................... 66 Healthy Eating Strategy #13: Increase and Promote Healthy Foods and Beverages in Vending Machines .................................................................... 68 Healthy Eating Strategy #14: Reduce Advertisements of Unhealthy Foods and Beverages ........................................................................................... 70 Healthy Eating Strategy #15: Encourage Reduced Prices of Healthy Foods and Beverages in Food Outlets ..................................................................... 72 Healthy Eating Strategy #16: Increase Support for Breastfeeding...................... 74 Healthy Eating Strategy #17: Implement Campaigns on Healthy Eating Across Many Venues of the Community .......................................................... 76
IV. INDEX OF STRATEGIES BY VENUE ....................................................... 78 Active Living Strategies ............................................................................... 78 Healthy Eating Strategies ............................................................................. 79

LINKING POLICY AND ENVIRONMENTAL STRATEGIES TO HEALTH OUTCOMES | page 1
I. INTRODUCTION
Obesity, overweight, and chronic diseases are at epidemic levels in communities across the United States. As a response to this crisis, YMCA of the USA’s Healthier Communities Initiatives—Pioneering Healthier Communities (PHC), Statewide Pioneering Healthier Communities (SPHC), and Action Communities for Health Innovation and EnVironmental ChangE (ACHIEVE)—work to facilitate collaborative engagement among community leaders to bring about positive change. These initiatives strive to create sustainable improvements in the health and well-being of community members through policy and environmental change strategies. These initiatives are supported by the Centers for Disease Control and Prevention (CDC) and the Robert Wood Johnson Foundation (RWJF). Communities that are currently involved in these initiatives have successfully made changes that have resulted in increased access to physical activity opportunities and/or increased access to healthy foods.
In a recent survey of 91 of our communities, we found that these sites have fostered 14,459 changes in their communities, affecting up to 34.3 million lives. Below are examples of these changes.
• 112 sidewalks have been designed or improved to increase physical activity options
• 71 traffic safety improvements or enhancements have been made to increase physical activity options
• 52 “Complete Streets” have opened and been made accessible to all users—bikes, pedestrians, people with disabilities, etc.
• 1,262 afterschool sites have made their snacks or meals healthier
• 767 schools have changed the food available in their vending machines or sold outside the lunch line
• 368 worksites have improved food choices available in meetings
• 1,261 afterschool sites have added or increased the amount of physical activity in their curricula
• 866 worksites have incentivized their employees to engage in physical activity or nutrition education
LINKING POLICY AND ENVIRONMENTAL STRATEGIES TO HEALTH OUTCOMES | page 2
WHY THIS GUIDE WAS CREATED
Over the years, YMCA of the USA (Y-USA) has been asked by numerous communities for help in making the case for pursuing policy and environmental strategies to improve healthy eating and active living. Pursuing these changes can be a challenging task because their results are often not immediate. If desired health outcomes are not immediately seen by decision makers, how do communities convey the potentially significant impact strategies can have on the long-term health and well-being of the community? What evidence can communities provide their decision makers to help demonstrate the positive health effects that can result from pursuing these strategies in their community?
With these questions in mind, YMCA of the USA and Stanford University’s Health Improvement Program at the Stanford Prevention Research Center, with funding from the Centers for Disease Control and Prevention, created Making the Case to Stakeholders: Linking Policy and Environmental Strategies to Health Outcomes, to demonstrate, with a handful of strategies, the connection that can be made between policy and environmental strategies and longer term outcomes. This guide was designed to assist communities to better understand potential outcomes of the policy and environmental change objectives targeting healthy eating and active living.
HOW THIS GUIDE WAS CREATED AND WHAT THIS GUIDE PROVIDES
This guide illustrates how certain strategies can lead to specific short-term, intermediate, and long-term outcomes. The strategies covered in this guide are those that have been recommended by national health authorities such as the Centers for Disease Control and Prevention, Institute of Medicine, and Robert Wood Johnson Foundation to prevent obesity in the United States, and they represent only a handful of potential strategies.
Our efforts have been to document the scientific evidence of success that is possible following successful implementation of specific strategies. When evidence of impact from policy or environmental changes was lacking from scientifically robust studies, we utilized findings from cross-sectional studies (an observation of a population at one point in time) and expert recommendations.
For example, if you are interested in promoting a policy change that supports increased participation in government-sponsored nutrition programs, the guide presents examples of strategies that assist in accomplishing this objective. The guide then lists changes over time that might result from implementing those strategies through a path diagram, ending with the ultimate potential outcome of improved health. Each illustration also includes a description of the setting in which the research occurred (e.g., community-wide, schools)

LINKING POLICY AND ENVIRONMENTAL STRATEGIES TO HEALTH OUTCOMES | page 3
and provides highlights from the reviewed evidence as well as the references that support the presented evidence.
HOW TO USE THIS GUIDE—MAKING THE CASE TO DECISION MAKERS
When communicating with decision makers about why a specific change is important, you can walk step-by-step through the scientific evidence for the short-term, intermediate, and long-term outcomes for that strategy.
This guide can be an informative tool for communities to help educate about the expected outcomes of a specific policy or environmental change. The expected short-term, intermediate, and long-term outcomes provided in this guide are based on those found both in the scientific literature as well as from community examples. The hope is that this guide will provide evidence for leaders to use when making decisions on improving health in their own community.
“Improved health” is the ultimate outcome we are hoping to achieve, and this is reflected in each illustration. Improved health means reduced risk for chronic diseases (including obesity) and increased quality of life.
ADDITIONAL CONSIDERATIONS
It is important for users of this guide to understand that the outcomes associated with the strategies presented are POTENTIAL outcomes. The documented research is not an exhaustive list; rather, it represents a collection of promising evidence of a link between some recommended strategies and positive health outcomes. Some strategies may result in more sizable outcomes than others, but all outcomes are likely to be subject to the specific setting, culture, and demographics of the population as well as the leadership, coordination, and support in the community.
Whereas each strategy has been documented in a separate diagram to illustrate specifically related outcomes, communities are encouraged to combine as many strategies as possible to see the greatest impact on reduction of chronic disease and improved overall health.
It is also important to note that this guide is not intended to outline advocacy strategies, policy change mechanisms, or advocacy venues, nor is it an endorsement of using federal or foundation funding from Y-USA to engage in lobbying activities. Indeed, funding provided by Y-USA’s Healthier Communities Initiative to Ys and their communities cannot be used for lobbying activities. Lobbying includes three aspects: (1) expressing an opinion (support or

LINKING POLICY AND ENVIRONMENTAL STRATEGIES TO HEALTH OUTCOMES | page 4
opposition); (2) on a piece of legislation or regulation; and (3) to a policymaker who is in a position to influence that policy.
And finally, what this document does is simply link some strategies recommended by national health authorities such as the Centers for Disease Control and Prevention, Institute of Medicine, and Robert Wood Johnson Foundation to the outcome evidence base. It is not, and should not be considered, a list of YMCA of the USA’s recommended or endorsed strategies. It is a tool, in response to the needs of our communities, to link strategies with possible health outcomes so that potential long-term benefits can be part of the conversation of improving the health of our communities. For a comprehensive list of Y-USA’s legislative priorities, please visit http://www.ymca.net/for-policy-makers/.
The literature review is current as of November 2010.
II. ACTIVE LIVING STRATEGIES

LINKING POLICY AND ENVIRONMENTAL STRATEGIES TO HEALTH OUTCOMES | page 6
POLICY/ ENVIRONMENTAL CHANGES
SHORT-TERM OUTCOMES
INTERMEDIATE OUTCOMES
LONG-TERM OUTCOME
Increase mixed land use • Institute strategies for promoting mixed land use • Encourage street-scale urban design • Encourage nonmotorized transportation improvements • Educate city planners about importance of promoting physical
activity
Setting: Community-at-large, neighborhoods
• More supportive built environment • Increased nonresidential destinations within walking or biking
distance • Safe, attractive, and direct pathways to destinations
• More walkable neighborhoods • More opportunities to engage in physical activity through
nonmotorized transportation
• Increased physical activity
POTENTIALLY LEADS TO
IMPROVED HEALTH
ACTIVE LIVING STRATEGY #1: INCREASE MIXED LAND USE
When people’s jobs, homes, and retail activities are located close together, they are more likely to be physically active. Mixed land use policy interventions can be effective in promoting physical activity.

LINKING POLICY AND ENVIRONMENTAL STRATEGIES TO HEALTH OUTCOMES | page 7
ACTIVE LIVING STRATEGY #1: INCREASE MIXED LAND USE (CONTINUED)
Research has shown that residents from neighborhoods with better land use mix are more likely to achieve the recommended level of physical activity. Level of physical activity has been found to be significantly related to the number of shops and transit stops in the neighborhood, sidewalks on streets, bicycle facilities, and low-cost recreational facilities. In the Netherlands, communities that have increased mixed land use have seen an increased prevalence of walking. Consequently, mixed land use policy interventions can be effective in promoting physical activity. Educating county officials and city planners on the importance of increasing physical activity as a goal in city planning is an important element of this policy/environmental change.
References: 1) Aytur, S.A. Rodriguez, D., Evenson, K., Catellier, D. Rosamond, W. (2007). Promoting active community
environments through land use and transportation planning. American Journal of Health Promotion, 21(4S), 397–407.
2) Boehmer, T.K., Hoehner, C.M., Deshpande, A.D., Ramirez, L.K. Brownson, R.C. (2007). Perceived and observed neighborhood indicators of obesity among urban adults. International Journal of Obesity, 31(6), 968–977.
3) Frank, L.D., Schmid, T.L., Sallis, J.F., Chapman, J., & Saelens, B.E. (2005). Linking objectively measured physical activity with objectively measured urban form: Findings from SMARTRAQ. American Journal of Preventive Medicine, 28(2) Supplement 2, 117–125.
4) Heath, G.W., Brownson, R.C., Kruger, J., Miles, R., Powell, K.E., Ramsey, L.T., and the Task Force on Community Preventive Services. (2006). The effectiveness of urban design and land use and transport policies and practices to increase physical activity. Journal of Physical Activity and Health, 3(S1), S55–S76.
5) Saelens, B.E., Sallis, J.F., Frank, L.D. (2006). Environmental correlates of walking and cycling: Findings from the transportation, urban design, and planning literatures. Journal of Physical Activity and Health, 3(S1), S55–S76.
6) Sallis, J.F., Bowles, H.R., Bauman, A., Ainsworth, B.E., Bull, F.C., Craig, C.L., Sjostrom, M.,...Bergman, P. (2009). Neighborhood environments and physical activity among adults in 11 countries. American Journal of Preventive Medicine, 36(6), 484–490.
7) Salvesen, D., Evenson, K.R., Rodriguez, D.A., Brown, A. (2008). Factors influencing implementation of local policies to promote physical activity: A case study of Montgomery County, Maryland. Journal of Public Health Management and Practice, 14(3), 280–288.
8) Schwanen, T., Dijst, M., Dieleman, F.M. (2004). Policies for urban form and their impact on travel: The Netherlands experience, Urban Studies, 41, 579–603.
LINKING POLICY AND ENVIRONMENTAL STRATEGIES TO HEALTH OUTCOMES | page 8
POLICY/ ENVIRONMENTAL CHANGES
SHORT-TERM OUTCOMES
INTERMEDIATE OUTCOMES
LONG-TERM OUTCOME
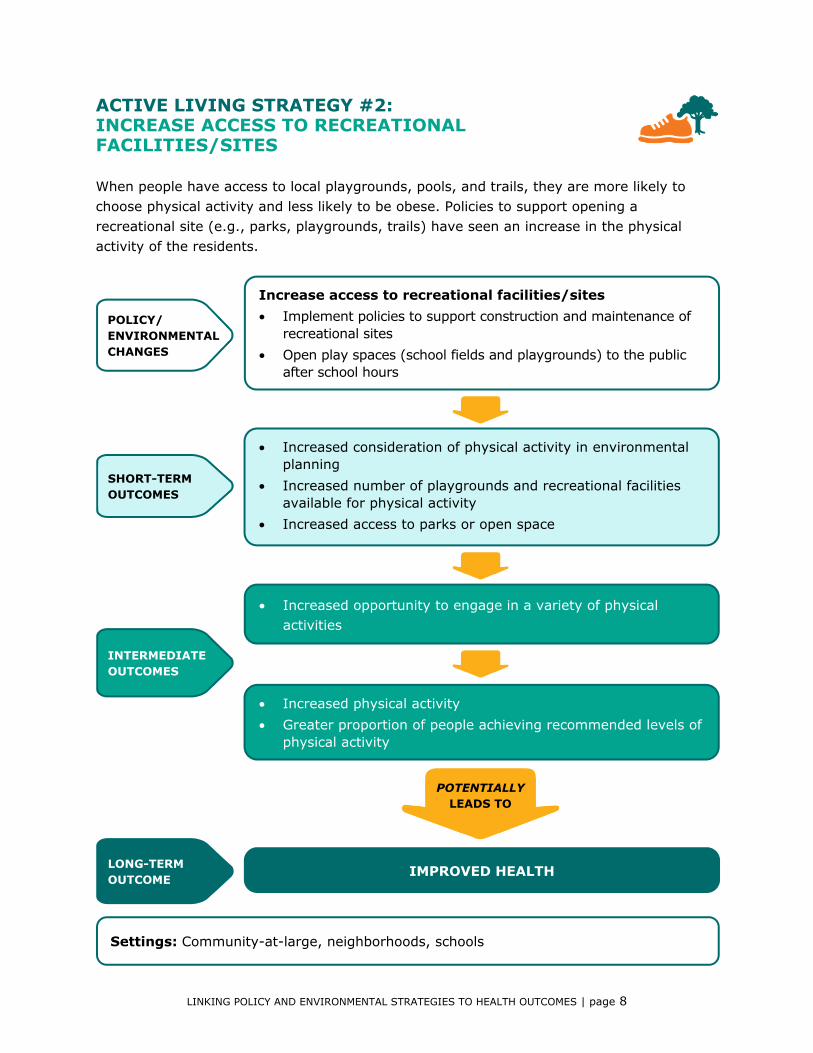
Increase access to recreational facilities/sites • Implement policies to support construction and maintenance of
recreational sites • Open play spaces (school fields and playgrounds) to the public
after school hours
Settings: Community-at-large, neighborhoods, schools
• Increased consideration of physical activity in environmental planning
• Increased number of playgrounds and recreational facilities available for physical activity
• Increased access to parks or open space
• Increased opportunity to engage in a variety of physical activities
• Increased physical activity • Greater proportion of people achieving recommended levels of
physical activity
POTENTIALLY LEADS TO
IMPROVED HEALTH
ACTIVE LIVING STRATEGY #2: INCREASE ACCESS TO RECREATIONAL FACILITIES/SITES
When people have access to local playgrounds, pools, and trails, they are more likely to choose physical activity and less likely to be obese. Policies to support opening a recreational site (e.g., parks, playgrounds, trails) have seen an increase in the physical activity of the residents.
LINKING POLICY AND ENVIRONMENTAL STRATEGIES TO HEALTH OUTCOMES | page 9
ACTIVE LIVING STRATEGY #2: INCREASE ACCESS TO RECREATIONAL FACILITIES/SITES (CONTINUED)
The presence of a recreational facility (e.g., footpath, club, pool) is associated with an increased likelihood of engaging in recommended levels of physical activity and decreased odds of being overweight within a community. Communities with policies to support opening a recreational site (e.g., parks, playgrounds, trails) have seen an increase in the physical activity of the residents. For example, opening elementary school playgrounds after school hours provides communities with opportunities for outdoor activities. An introduction of trails may also increase physical activity for people who are not habitual exercisers.
References: 1) Bourdeaudhuij, I.D., Sallis, J.F., & Saelens, B.E. (2003). Environmental correlates of physical activity in
a sample of Belgian adults. American Journal of Health Promotion, 18(1), 83–92.
2) Cohen, D.A., Ashwood, J.S., Scott, M.M., Overton, A., Evenson, K.R., Staten, L.K., Porter, D., McKenzie, T.L., & Catellier, D. (2006). Public parks and physical activity among adolescent girls. Pediatrics, 118(5), 1381–1389.
3) Gordon-Larsen, P., Nelson, M.C., Page, P., & Popkin, B.M. (2006). Inequality in the built environment underlies key health disparities in physical activity and obesity. Pediatrics, 117(2), 417–424.
4) Gordon, P.M., Zizzi, S.J., & Pauline, J. (2004). Use of a community trail among new and habitual exercises: A preliminary assessment. Preventing Chronic Disease, Public Health Research, Practice and Policy, 1(4).
5) Humpel, N., Owen, N., & Leslie, E. (2002). Environmental factors associated with adults' participation in physical activity. American Journal of Preventive Medicine, 22, 188–199.
6) Norman, G.J., Nutter, S.K., Ryan, S., Sallis, J., Calfas, K.J., & Patrick, K. (2006). Community design and access to recreational facilities as correlates of adolescent physical activity and body-mass index. Journal of Physical Activity and Health, 3(S1), S118–S128.
7) Play 'N' Close to Home, St. Petersburg, Florida. (n.d.). From Play Matters: A study of best practices to inform local policy and process in support of children's play. Washington, D.C. http://kaboom.org/docs/documents/pdf/playmatters/Play_Matters_Extended_Case_Studies.pdf. Retrieved November 15, 2010.
8) Powell, L.M., Chaloupka, F.J., Slater, S.J., Johnston, L.D., & O'Malley, P.M. (2007). The availability of local-area commercial physical activity-related facilities and physical activity among adolescents. American Journal of Preventive Medicine, 33, (4S), S292–S300.
9) Sharing Play Space and Responsibility, Tucson, Arizona. (n.d.). From Play Matters: A study of best practices to inform local policy and process in support of children's play. Washington, D.C. http://kaboom.org/docs/documents/pdf/playmatters/Play_Matters_Extended_Case_Studies.pdf. Retrieved November 15, 2010.Vuori, I., Lankenau, B., & Pratt, M. (2004). Physical activity policy and program development: the experience in Finland. Public Health Reports, 119, 331–345.
10) Vuori, I., Lankenau, B., & Pratt, M. (2004). Physical activity policy and program development: the experience in Finland. Public Health Reports, 119, 331–345.
LINKING POLICY AND ENVIRONMENTAL STRATEGIES TO HEALTH OUTCOMES | page 10
POLICY/ ENVIRONMENTAL CHANGES
SHORT-TERM OUTCOMES
INTERMEDIATE OUTCOMES
LONG-TERM OUTCOME
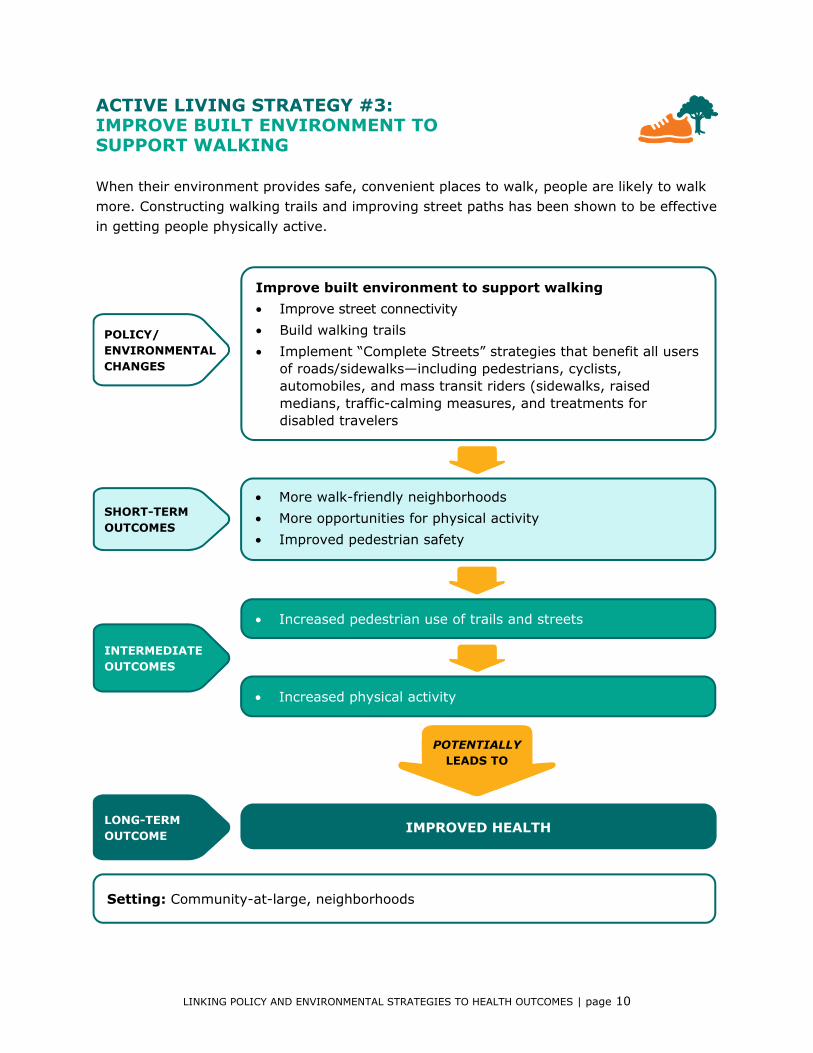
Improve built environment to support walking • Improve street connectivity • Build walking trails • Implement “Complete Streets” strategies that benefit all users
of roads/sidewalks—including pedestrians, cyclists, automobiles, and mass transit riders (sidewalks, raised medians, traffic-calming measures, and treatments for disabled travelers
Setting: Community-at-large, neighborhoods
• More walk-friendly neighborhoods • More opportunities for physical activity • Improved pedestrian safety
• Increased pedestrian use of trails and streets
• Increased physical activity
POTENTIALLY LEADS TO
IMPROVED HEALTH
ACTIVE LIVING STRATEGY #3: IMPROVE BUILT ENVIRONMENT TO SUPPORT WALKING
When their environment provides safe, convenient places to walk, people are likely to walk more. Constructing walking trails and improving street paths has been shown to be effective in getting people physically active.

LINKING POLICY AND ENVIRONMENTAL STRATEGIES TO HEALTH OUTCOMES | page 11
ACTIVE LIVING STRATEGY #3: IMPROVE BUILT ENVIRONMENT TO SUPPORT WALKING (CONTINUED)
In general, constructing walking trails and improving street paths has been shown to be effective in getting people physically active, especially people who are at highest risk for inactivity. Variables such as younger age, more education, having physically active neighbors, having sidewalks or trails available, proximity to shops, and using a mall for walking were associated with increased walking behaviors. Implementing a “Complete Streets” policy has been found to increase pedestrian safety and encourage walking and biking. In summary, making improvements to the built environment to support walking has the potential to increase residents’ physical activity levels and consequently to improve health.
References: 1) Addy, C.L., Wilson, D.K., Kirtland, K.A., Ainsworth, B.E., Sharpe, P., & Kimsey, D. (2004). Associations
of perceived social and physical environmental supports with physical activity and walking behavior. American Journal of Public Health, 94(3), 440–443.
2) Urban 4 Health, Inc. & The American Public Health Association. (2010). The hidden health costs of transportation. http://www.apha.org/NR/rdonlyres/F84640FD-13CF-47EA-8267-E767A1099239/0/HiddenHealthCostsofTransportationShortFinal.pdf. Retrieved November 15, 2010.
3) Brownson, R.C., Baker, E.A., Boyd, R.L., Caito, N.M., Duggan, K., Housemann, R.A., Kreuter, M.W., Mitchell, T., Motton, F., Pulley, C., Schmid, T.L., & Walton, D. (2004). A community-based approach to promoting walking in rural areas. American Journal of Preventive Medicine, 27(1), 28–34.
4) Brownson, R.C., Housemann, R.A., Brown, D.R., Jackson-Thompson, J., King, A.C., Malone, B.R., & Sallis, J.F. (2000). Promoting physical activity in rural communities. American Journal of Preventive Medicine, 18(3), 235–241.
5) Evenson, K.R., Herring, A.H., & Huston, S.L. (2005). Evaluating change in physical activity with the building of a multi-use trail. American Journal of Preventive Medicine, 28(2S2), 177–185.
6) Handy, S., Cao, X., & Mokhtarian, P. (2006). Self-selection in the relationship between the built environment and walking. Journal of the American Planning Association, 72(1), 55–74.
7) Sallis, J.F., Bowles, H.R., Bauman, A., Ainsworth, B.E., Bull, F.C., Craig, C.L., Sjostrom, M., & Bergman, P. (2009). Neighborhood environments and physical activity among adults in 11 countries. American Journal of Preventive Medicine, 36(6), 484–490.
8) Sharpe, P.A., Granner, M.L., Hutto, B.E., Wilcox, S., Peck, L., & Addy, C.L. (2008). Correlates of physical activity among African American and White women. American Journal of Health Behavior, 32(6), 701–713.
9) National Complete Streets Coalition. (n.d.). Let’s complete America’s streets. Retrieved November 15, 2010, from www.completestreets.org.

LINKING POLICY AND ENVIRONMENTAL STRATEGIES TO HEALTH OUTCOMES | page 12
POLICY/ ENVIRONMENTAL CHANGES
SHORT-TERM OUTCOMES
INTERMEDIATE OUTCOMES
LONG-TERM OUTCOME
Improve built environment to support biking • Install bicycle lanes • Provide bike racks • Build community trails and bikeways • Implement “Complete Streets” policies • Increase network of bicycle paths, bike routes, bike parking,
and traffic-calming measures
Setting: Community-at-large, neighborhoods
• More bike-friendly streets • More opportunities for physical activity • Improved safety and convenience for bicyclists
• Increased bicycling
• Increased physical activity
POTENTIALLY LEADS TO
IMPROVED HEALTH
ACTIVE LIVING STRATEGY #4: IMPROVE BUILT ENVIRONMENT TO SUPPORT BIKING
Bicycling is an accessible, convenient form of physical activity that people will choose more often when their environment provides safe, convenient places to bike. The use of bicycling has greatly increased in countries that have policies to make bicycling safer, faster, and more convenient.
LINKING POLICY AND ENVIRONMENTAL STRATEGIES TO HEALTH OUTCOMES | page 13
ACTIVE LIVING STRATEGY #4: IMPROVE BUILT ENVIRONMENT TO SUPPORT BIKING (CONTINUED)
There is a strong relationship between bicycling infrastructure and bicycling for recreation and commuting. The use of bicycling has greatly increased in countries that have policies to make bicycling safer, faster, and more convenient. Installing bicycle lanes has a significant impact on bicycle traffic. In contrast, factors found to reduce the use of a bikeway include distance from bikeway, busy street barrier, and presence of hills. Installing separate bike paths provides even greater safety and convenience for cyclists. Creating a built environment that is supportive of biking has the potential to increase residents’ physical activity levels and, consequently, improve health.
References: 1) Dill, J., & Carr, T. (2003). Bicycle commuting and facilities in major US cities: If you build them,
commuters will use them. Transportation Research Record, 1828, 03-04134, 116–123.
2) Director-General of Transport. (1995). A review of bicycle policy and planning developments in Western Europe and North America-A Literature Search. Government of South Australia.
3) Hunt, J.D., & Abraham, J.E. (2007). Influences on Bicycle Use. Transportation: Planning, Policy, Research, Practice, 34, 453–470.
4) Macbeth, A.G. (1999). Bicycle lanes in Toronto. Institute of Transportation Engineers, 69(4).
5) Pucher, J. (1997). Bicycling boom in Germany: A revival engineered by public policy. Transportation Quarterly, 51(4), 31–46.
6) Rietveld, P., & Daniel, V. (2004). Determinants of bicycle use: Do municipal policies matter? Transportation Research Park A, 38, 531–550.
7) Slater, S.J., Ewing, R., Powell, L.M., Chaloupka, R.J., Johnston, L.D., & O’Malley, P.M. (2010). The association between community physical activity settings and youth physical activity, obesity, and body mass index. Journal of Adolescent Health, 47(5), 496–503.
8) Troped, P.J., Saunders, R.P., Pate, R.R., Reininger, B., & Addy, C.L. (2001). Associations between self-reported and objective physical environmental factors and use of a community rail-trail. Preventive Medicine, 32(2), 191–200.
9) National Complete Streets Coalition. (n.d.). Let’s complete America’s streets. Retrieved November 15, 2010, from www.completestreets.org.

LINKING POLICY AND ENVIRONMENTAL STRATEGIES TO HEALTH OUTCOMES | page 14
POLICY/ ENVIRONMENTAL CHANGES
SHORT-TERM OUTCOMES
INTERMEDIATE OUTCOMES
LONG-TERM OUTCOME
Locate schools within easy walking distance of residential areas • Eliminate minimum acreage requirements for schools • Reduce requirement for school square footage • Improve coordination between educators and city planners • Encourage schools to be placed centrally • Give preference to renovation of old schools over new school
development
Setting: Community-at-large, neighborhoods, schools
• Better collaboration between school board and city planners • More schools developed in neighborhoods • Decreased unwanted sprawl • Preserved schools in urban areas through renovations
• More walkable schools • Increased physical activity as children can walk/bike to school • Reduced traffic and emissions
POTENTIALLY LEADS TO
IMPROVED HEALTH
ACTIVE LIVING STRATEGY #5: LOCATE SCHOOLS WITHIN EASY WALKING DISTANCE OF RESIDENTIAL AREAS
Neighborhood schools have many benefits to children, families, and the environment. Schools that are located in neighborhoods near residential areas are more walkable and help children stay active by walking and biking to school.
LINKING POLICY AND ENVIRONMENTAL STRATEGIES TO HEALTH OUTCOMES | page 15
ACTIVE LIVING STRATEGY #5: LOCATE SCHOOLS WITHIN EASY WALKING DISTANCE OF RESIDENTIAL AREAS (CONTINUED)
Schools that are located in neighborhoods near residential areas are more walkable and help children stay active by walking or biking to school. Many states have enacted policies that encourage schools to be preserved or developed centrally. For example, Maryland does not have any minimum acreage requirements for schools, which helps reduce the likelihood of urban sprawl. Laws in Vermont, Florida, and Maryland encourage coordination of school site planning between the school board and government agencies. In Vermont, funding for school renovations is given precedence over funding for new school development. Based on a model conducted by the EPA, neighborhood schools would reduce traffic, increase walking and biking by 13 percent, and reduce emissions by 15 percent.
References: 1) Kouri, C. (1999). Wait for the Bus: How Low Country School Site Selection and Design Deter Walking to
School and Contribute to Urban Sprawl. South Carolina Coastal Conservation League, Duke University - Terry Sanford Institute of Public Policy. www.eric.ed.gov/ERICWebPortal/recordDetail?accno=ED451681. Retrieved November 15, 2010.
2) United States Environmental Protection Agency (2003). Travel and environmental implications of school sitting. EPA 231-R-03-004. http://www.epa.gov/smartgrowth/pdf/school_travel.pdf. Retrieved November 15, 2010.
LINKING POLICY AND ENVIRONMENTAL STRATEGIES TO HEALTH OUTCOMES | page 16
POLICY/ ENVIRONMENTAL CHANGES
SHORT-TERM OUTCOMES
INTERMEDIATE OUTCOMES
LONG-TERM OUTCOME
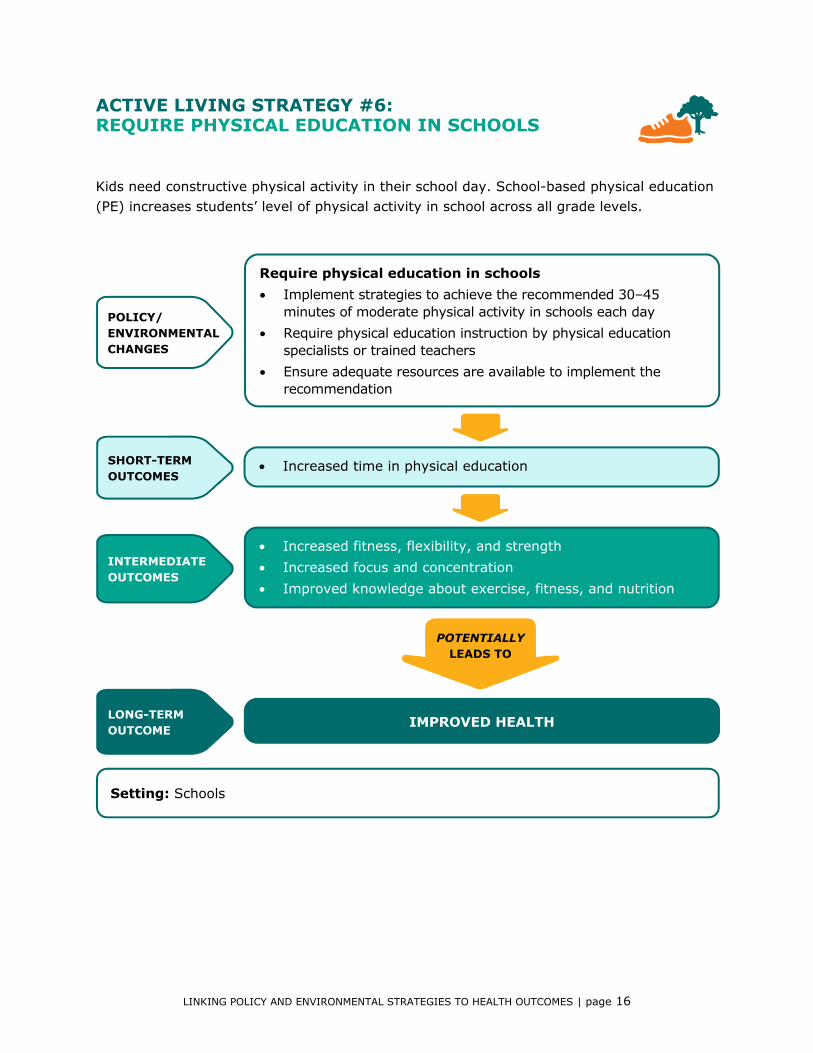
Require physical education in schools • Implement strategies to achieve the recommended 30–45
minutes of moderate physical activity in schools each day • Require physical education instruction by physical education
specialists or trained teachers • Ensure adequate resources are available to implement the
recommendation
Setting: Schools
• Increased time in physical education
• Increased fitness, flexibility, and strength • Increased focus and concentration • Improved knowledge about exercise, fitness, and nutrition
POTENTIALLY LEADS TO
IMPROVED HEALTH
ACTIVE LIVING STRATEGY #6: REQUIRE PHYSICAL EDUCATION IN SCHOOLS
Kids need constructive physical activity in their school day. School-based physical education (PE) increases students’ level of physical activity in school across all grade levels.

LINKING POLICY AND ENVIRONMENTAL STRATEGIES TO HEALTH OUTCOMES | page 17
ACTIVE LIVING STRATEGY #6: REQUIRE PHYSICAL EDUCATION IN SCHOOLS (CONTINUED)
Evidence indicates that school-based physical education (PE) increases students’ level of physical activity in school across all grade levels. However, compliance with recommended physical activity guidelines varies across schools, often being higher in younger populations. A literature review documents beneficial effects of physical education on musculoskeletal health, cardiovascular health, adiposity in overweight youth, mental health, academic performance, and bone health. Reduced classroom time due to PE has not been shown to have a negative impact on academic performance. There is a wealth of evaluated physical education curricula that could be readily utilized to increase physical activity in schools and thus potentially improve the health of young generations.
References: 1) Evenson, K.R., Ballard, K., Lee, G., & Ammerman, A. (2009). Implementation of a school-based state
policy to increase physical activity. Journal of School Health, 79(5), 231–238.
2) Pate, R.R., Freedson, P.S., Sallis, J.F., Taylor, W.C., Sirard, J., Trost, S.G., & Dowda, M. (2002). Compliance with physical activity guidelines: Prevalence in a population of children and youth. Annals of Epidemiology, 12(5), 303–308.
3) Sallis, J.F., McKenzie, T.L., Alcaraz, J.E., Kolody, B., Faucette, N., & Hovell, M. (1997). The effects of a 2-year physical education program (SPARK) on physical activity and fitness in elementary school students. American Journal of Public Health, 87(8), 1328–1334.
4) Strong, W.B., Malina, R.M., Blimkie, C.J., Daniels, S.R., Dishman, R.K., Gutin, B., Hergenroeder, A.C., Must, A., Nixon, P.A., Pivarnik, J.M., Rowland, T., Trost, S., & Trudeau, F. (2005). Evidence based physical activity for school-age youth. Journal of Pediatrics, 146(6).

LINKING POLICY AND ENVIRONMENTAL STRATEGIES TO HEALTH OUTCOMES | page 18
POLICY/ ENVIRONMENTAL CHANGES
SHORT-TERM OUTCOMES
INTERMEDIATE OUTCOMES
LONG-TERM OUTCOME
Increase physical activity in physical education • Increase intensity of physical education classes • Provide physical education teachers training, consultation, and
feedback • Incorporate high-intensity classes into physical education • Set goals in physical education • Avoid practices that result in sedentary time for some students
during physical education classes
Setting: Schools
• Improved teachers’ instructional skills • Improved existing physical education classes
• Increased level of physical activity • Increased moderate to vigorous physical activity
• Increased aerobic fitness • Reduced risk profiles for cardiovascular illness • Increased classroom performance
POTENTIALLY LEADS TO
IMPROVED HEALTH
ACTIVE LIVING STRATEGY #7: INCREASE PHYSICAL ACTIVITY IN PHYSICAL EDUCATION
When schools make the most of physical activity options, kids can improve their health and academic performance. Increasing the level of physical activity in physical education classes has been shown to have a positive impact on students’ health.
LINKING POLICY AND ENVIRONMENTAL STRATEGIES TO HEALTH OUTCOMES | page 19
ACTIVE LIVING STRATEGY #7: INCREASE PHYSICAL ACTIVITY IN PHYSICAL EDUCATION (CONTINUED)
Increasing the level of physical activity in physical education classes has been shown to have a positive impact on students’ health. This can be accomplished without requiring additional time or resources by training physical education and classroom teachers on how to incorporate more moderate to vigorous physical activity into their existing programs. Some physical education interventions showed a significant impact on body-mass index (BMI), cholesterol, and blood pressure in comparison with the control group. Studies have shown that spending more time in physical education does not have harmful effects on academic achievement but instead may actually improve performance.
References: 1) Carlson, S.A., Fulton, J.E., Lee, S.M., Maynard, M.L., Brown, D.R., Kohl, H.W., & Dietz, W.H. (2008).
Physical education and academic achievement in elementary school: Data from the Early Childhood Longitudinal Study. American Journal of Public Health, 98(4), 721–727.
2) Coe, D.P., Pivarnik, J.M., Womack, C.J., Reeves, M.J., & Malina, R.M. (2006). Effect of physical education and activity levels on academic achievement in children. Medicine and Science in Sports and Exercise, 38(8), 1515–1519.
3) Ewart, C.K., Young, D.R., & Hagberg, J.M. (1998). Effects of a school-based aerobic exercise on blood pressure in adolescent girls at risk for hypertension. American Journal of Public Health, 88(6), 949–951.
4) Gortmaker, S.L., Peterson, K., Wiecha, J., Sobol, A.M., Dixit, S., Fox, M.K., & Laird, N. (1999). Reducing obesity via a school-based interdisciplinary intervention among youth. Archives of Pediatric and Adolescent Medicine, 153, 409–418.
5) Harrell, J.S., McMurrary, R.G., Gansky, S.A., Bangdiwala, S.I., & Bradley, C.B. (1999). A public health vs. a risk-based intervention to improve cardiovascular health in elementary school children: The Cardiovascular Health in Children Study. American Journal of Public Health, 89(10), 1529–1535.
6) Luepker, R.V., Perry, C.l., McKinlay, S.M., Nader, P.R., Parcel, G.S., Stone, E.J., Webber, L.S., Elder, J.P., Feldman, H.A., Johnson, C.C., Kelder, S.H., & Wu, M. (1996). Outcomes of a field trial to improve children's dietary patterns and physical activity. Journal of American Medical Association, 275(10), 768–776.
7) Manios, Y., Moschandreas, J., Hatzis, C., & Kafatos, A. (1999). Evaluation of a health and nutrition education program in primary school children of Crete over a three-year period. Preventive Medicine, 28, 149–159.
8) McKenzie, T.L., Nader, P.R., Strikmiller, P.K., Yang, M., Stone, E.J., Perry, C.L., Taylor, W.C., Epping, J.N., Feldman, H.A., Luepker, R.V., & Kelder, S.H. (1996). School physical education: effect of the child and adolescent trial for cardiovascular health. Preventive Medicine, 25, 423–431.
9) McKenzie, T.L., Sallis, J., Prochaska, J., Conway, T., Marshall, S., & Rosengard, P. (2004). Evaluation of a two-year middle-school physical education intervention: M-SPAN. Medicine and Science in Sports and Exercise, 36(8), 1382–1388.
10) Sallis, J.F., McKenzie, T.L., Kolody, B., Lewis, M., Marshall, S., & Rosengard, P. (1999). Effects of health-related physical education on academic achievement: Project SPARK. Research Quarterly for Exercise and Sport, 70(2), 127–134.
LINKING POLICY AND ENVIRONMENTAL STRATEGIES TO HEALTH OUTCOMES | page 20
POLICY/ ENVIRONMENTAL CHANGES
SHORT-TERM OUTCOMES
INTERMEDIATE OUTCOMES
LONG-TERM OUTCOME
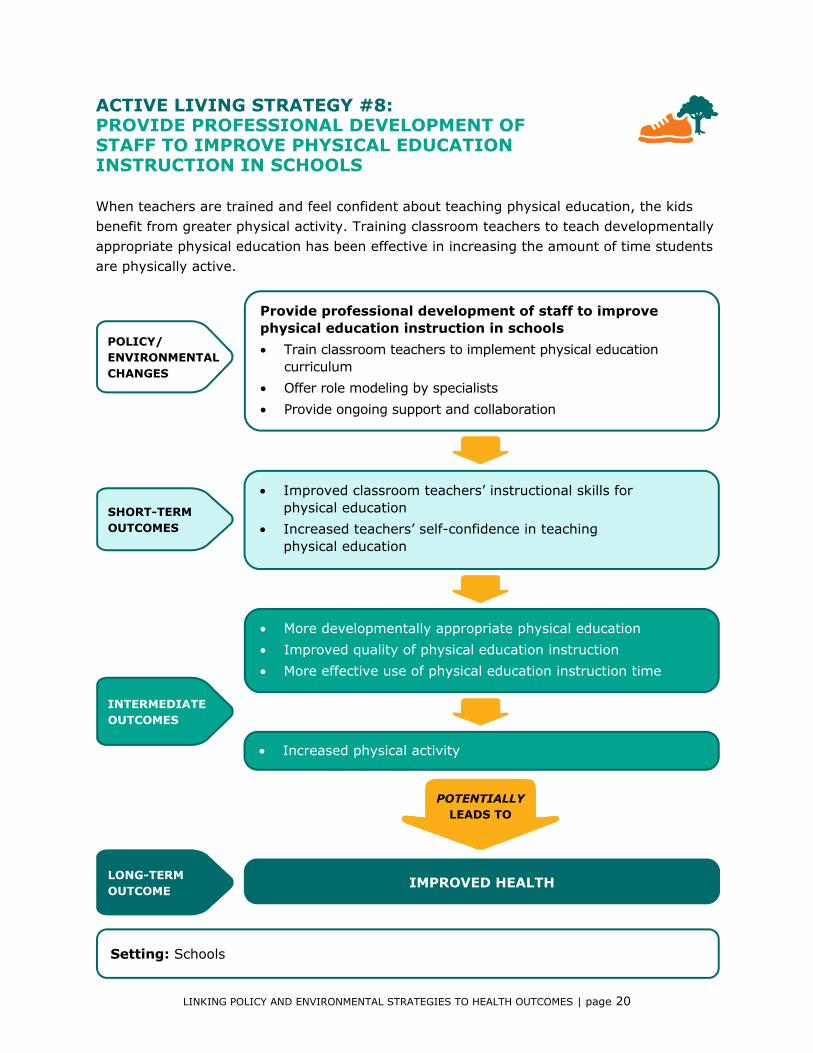
Provide professional development of staff to improve physical education instruction in schools • Train classroom teachers to implement physical education
curriculum • Offer role modeling by specialists • Provide ongoing support and collaboration
Setting: Schools
• Improved classroom teachers’ instructional skills for physical education
• Increased teachers’ self-confidence in teaching physical education
• More developmentally appropriate physical education • Improved quality of physical education instruction • More effective use of physical education instruction time
• Increased physical activity
POTENTIALLY LEADS TO
IMPROVED HEALTH
ACTIVE LIVING STRATEGY #8: PROVIDE PROFESSIONAL DEVELOPMENT OF STAFF TO IMPROVE PHYSICAL EDUCATION INSTRUCTION IN SCHOOLS
When teachers are trained and feel confident about teaching physical education, the kids benefit from greater physical activity. Training classroom teachers to teach developmentally appropriate physical education has been effective in increasing the amount of time students are physically active.

LINKING POLICY AND ENVIRONMENTAL STRATEGIES TO HEALTH OUTCOMES | page 21
ACTIVE LIVING STRATEGY #8: PROVIDE PROFESSIONAL DEVELOPMENT OF STAFF TO IMPROVE PHYSICAL EDUCATION INSTRUCTION IN SCHOOLS (CONTINUED)
Programs designed to train classroom teachers to teach developmentally appropriate physical education have been effective in increasing the amount of time students are physically active. Trained teachers have the potential to increase the quality and intensity of physical education. By supporting staff’s professional development to enhance physical education instruction, schools equip teachers to lead more effective physical education classes. Consequently, students become more active during physical education classes. Teachers have also reported satisfaction with the training and increased self-confidence in teaching physical education.
References: 1) Faucette, N., Nugent, P., Sallis, J.F., & McKenzie, T.L. (2002). I'd rather chew on aluminum foil.
Overcoming classroom teachers' resistance to teaching physical education. Journal of Teaching in Physical Education, 21, 287–308.
2) Kain, J., Leyton, B., Concha, F., Salazar, G., Lobos, L., & Vio, F. (2010). Effect of counseling school teachers on healthy lifestyle on the impact of a program to reduce childhood obesity. Revista Medica de Chile, 138(2), 181–187.
3) Martin, M.W., Martin, S., & Rosengard, P. (2010). PE2GO: Program evaluation of a physical activity program in elementary schools. Journal of Physical Activity and Health, 7(5), 677–684.
4) Sallis, J.F., McKenzie, T.L., Kolody, B., Lewis, M., Marshall, S., & Rosengard, P. (1999). Effects of health-related physical education on academic achievement: Project SPARK. Research Quarterly for Exercise and Sport, 70(2), 127–134.
5) Sheman, C., Tran, C., & Alves, Y. (2010). Elementary school classroom teacher delivered physical education: costs, benefits, and barriers. Physical Educator, Winter, 2–17.

LINKING POLICY AND ENVIRONMENTAL STRATEGIES TO HEALTH OUTCOMES | page 22
POLICY/ ENVIRONMENTAL CHANGES
SHORT-TERM OUTCOMES
INTERMEDIATE OUTCOMES
LONG-TERM OUTCOME
Increase opportunities for physical activity outside of physical education • Promote leisure time physical activity • Implement after school physical activity program • Incorporate physical activities (e.g., “Energizers”) into the
classroom • Change recess time to before lunch • Paint or redesign the playgrounds • Use coaches or games to facilitate play during recess
Setting: Schools, community-at-large
• Increased opportunities for physical activity
• Increased physical activity • Increased physical fitness • Enhanced school performance • Improved student behavior (on-task, calmer, fewer conflicts)
POTENTIALLY LEADS TO
IMPROVED HEALTH
ACTIVE LIVING STRATEGY #9: INCREASE OPPORTUNITIES FOR PHYSICAL ACTIVITY OUTSIDE OF PHYSICAL EDUCATION
Including physical activity in everyday curricula contributes to improving classroom behavior and performance and reducing conflict. School-based interventions have been found to be effective in increasing physical activity outside of physical education.
LINKING POLICY AND ENVIRONMENTAL STRATEGIES TO HEALTH OUTCOMES | page 23
ACTIVE LIVING STRATEGY #9: INCREASE OPPORTUNITIES FOR PHYSICAL ACTIVITY OUTSIDE OF PHYSICAL EDUCATION (CONTINUED)
Increasing opportunities for physical activity outside physical education through innovative ways has been shown to increase physical activity among students. School-based interventions have been found to be effective in increasing physical activity outside of physical education. Providing classroom activity breaks, adding markings on playgrounds, implementing recess before lunch, providing structured games during recess, and offering afterschool programs have resulted in increased physical activity levels, improvement in classroom behavior, improvement in performance, and less classroom conflict.
References: 1) Ahamed, Y., Macdonald, H., Reed, K., Naylor, P.J., Liu-Ambrose, T., & Mckay, H. (2007). School-based
physical activity does not compromise children's academic performance. American and Science in Sports and Exercise, 39(2), 371–376.
2) Annesi, J.J. (2006). Relations of physical self-concept and self-efficacy with frequency of voluntary physical activity in preadolescents: Implications for after-school care programming. Journal of Psychosomatic Research, 61, 515–520.
3) Hopper, C., Muonz, K., Gruber, M., MacConnie, S., Schonfeldt, B., & Shunk, T. (1996). A school-based cardiovascular exercise and nutrition program with parent participation: An evaluation study. Children's Health Care, 25(3), 221–235.
4) Mahar, M.T., Murphy, S.K., Rowe, D.A., Golden, J., Shields, T., & Raedke, T.D. (2006). Effects of a classroom-based program on physical activity and on-task behavior. Medicine and Science in Sports and Exercise, 38, 2086–2094.
5) Parker-Pope, T. (2010). Play, then eat: Shift may bring gains at school. New York Times. Sharon Elementary School in Robbinsville, N.J.
6) Playworks. (2006–2007). Harvard Family Research Project. Evaluation report: Case study of the first year of Sports4Kids at the Ohrenberger Elementary School in Boston, Massachusetts.
7) Playworks, Baltimore, Maryland (n.d.). From Play Matters, A study of best practices to inform local policy and process in support of children's play, 1–67. Washington, D.C. http://kaboom.org/docs/documents/pdf/playmatters/Play_Matters_Extended_Case_Studies.pdf. Retrieved November 15, 2010.
8) Ridgers, N.D., Stratton, G., Fairclough, S.J., & Twisk, J. (2007). Long-term effects of a playground markings and physical structures on children's recess physical activity levels. Preventive Medicine, 44, 393–397.
9) Robert Wood Johnson Foundation. (2010). The state of play. Gallup Survey of Principals on School Recess. http://www.rwjf.org/files/research/stateofplayrecessreportgallup.pdf. Retrieved November 15, 2010.
10) Stratton, G., & Mullan, E. (2005). The effect of multicolor playground markings on children's physical activity level during recess. Preventive Medicine, 41, 828–833.
11) Trevino, R.P., Yin, Z., Hernandez, A., Hale, D.E., Garcia, O.A., & Mobley, C. (2004). Impact of the Bienestar School-Based Diabetes Mellitus Prevention Program on fasting capillary glucose levels. Archives of Pediatric and Adolescent Medicine, 158, 911–917.

LINKING POLICY AND ENVIRONMENTAL STRATEGIES TO HEALTH OUTCOMES | page 24
POLICY/ ENVIRONMENTAL CHANGES
SHORT-TERM OUTCOMES
INTERMEDIATE OUTCOMES
LONG-TERM OUTCOME
Increase active commuting to school • Support walk-to-school and Safe Routes to School programs • Use Safe Routes to School grants to create safer walking and
biking routes to school • Encourage students and families to walk/bike to school
Setting: Community-at-large, neighborhoods, schools
• Needs in area assessed • Students and families educated and encouraged to walk/bike
to school • A safer route to school through engineering and reinforcement
(crosswalks, sidewalks, crossing guard, etc.)
• Empowered students and families walking or biking to school • Improved walkability and bikability to schools • Improved safety/reduction in injury for walkers/bikers
• Increased number of students walking to school
POTENTIALLY LEADS TO
IMPROVED HEALTH
• Increased overall physical activity throughout the day • Increased fitness
ACTIVE LIVING STRATEGY #10: INCREASE ACTIVE COMMUTING TO SCHOOL
Active commuting promotes higher levels of overall physical activity and fitness as well as enhanced long-term health. Policies to create a safe route to school increase students’ walking or biking to school.

LINKING POLICY AND ENVIRONMENTAL STRATEGIES TO HEALTH OUTCOMES | page 25
ACTIVE LIVING STRATEGY #10: INCREASE ACTIVE COMMUTING TO SCHOOL (CONTINUED)
Policies to create a safe route to school increase students walking or biking to school. Efforts to educate and encourage students and parents to walk/bike to school and to reduce barriers to walking/biking to school through engineering and enforcement have shown increases in active commuting to school. Furthermore, students who walked/biked to school had higher levels of overall physical activity and fitness than students who did not commute actively to school. Supporting programs that encourage active commuting is an effective strategy to increase physical activity and thus potentially enhance long-term health.
References: 1) Alexander, L.M., Inchley, J., Todd, J., Currie, D., Cooper, A.R., & Currie, C. (2005). The broader impact
of walking to school among adolescents: Seven-day accelerometry based study. BMG, 331, 1061–1062.
2) Cooper, A.R., Wedderkopp, N., Wang, H., Andersen, L.B., Froberg, K., & Page, A.S. (2006). Active travel to school and cardiovascular fitness in Danish children and adolescents. Medicine & Science in Sports & Exercise, 38(10):1724–17316.
3) Eyler, A., Brownson, R., Doescher, M., Evenson, K.R., Fesperman, C.E., Litt, J.S., Pluto, D., & Schmid, T.L. (2008). Policies related to active transport to and from school: A multisite case study. Health Education Research, 23(6), 963–975.
4) Mendoza, J., Levinger, D., & Johnston, B. (2009). Pilot evaluation of a walking school bus program in a low-income, urban community. BMC Public Health, 9, 122.
5) Metcalf, B., Voss, L., Jeffery, A., Perkins, J., & Wilkin, T. (2004). Physical activity cost of the school run: Impact on schoolchildren of being driven to school. BMJ, 329, 832–3.
6) Saksvig, B.I., Catellier, D.J., Pfeiffer, K., Schmitz, K.H., Conway, T., Going, S., Ward, D., & Treuth, M.S. (2007). Travel by walking before and after school and physical activity among adolescent girls. Archives of Pediatrics and Adolescent Medicine, 161(2), 153–158.
7) Staunton, C.E., Hubsmith, D., & Kallins, W. (2003). Promoting safe walking and biking to school: The Marin County success story. American Journal of Public Health, 93(9), 1431–1434.
8) The Freiker Project, Boulder, Colorado. (n.d.). From Play Matters: A study of best practices to inform local policy and process in support of children's play. Washington, D.C. http://kaboom.org/docs/documents/pdf/playmatters/Play_Matters_Extended_Case_Studies.pdf. Retrieved November 15, 2010.
9) U.S. Centers for Disease Control and Prevention. (2005). Barriers to children walking to or from school-United States 2004. Morbidity and Mortality Weekly Report, 54(38), 949–952. http://www.cdc.gov/mmwr/preview/mmwrhtml/mm5438a2.htm.
LINKING POLICY AND ENVIRONMENTAL STRATEGIES TO HEALTH OUTCOMES | page 26
POLICY/ ENVIRONMENTAL CHANGES
SHORT-TERM OUTCOMES
INTERMEDIATE OUTCOMES
LONG-TERM OUTCOME
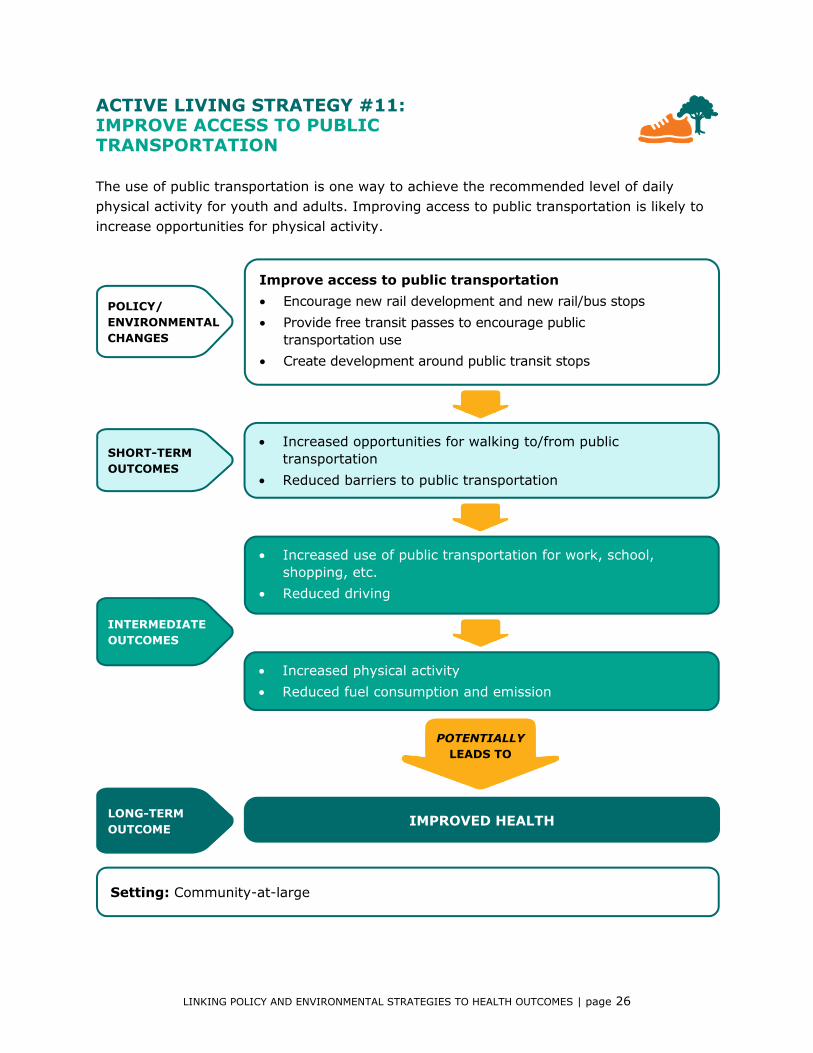
Improve access to public transportation • Encourage new rail development and new rail/bus stops • Provide free transit passes to encourage public
transportation use • Create development around public transit stops
Setting: Community-at-large
• Increased opportunities for walking to/from public transportation
• Reduced barriers to public transportation
• Increased use of public transportation for work, school, shopping, etc.
• Reduced driving
• Increased physical activity • Reduced fuel consumption and emission
POTENTIALLY LEADS TO
IMPROVED HEALTH
ACTIVE LIVING STRATEGY #11: IMPROVE ACCESS TO PUBLIC TRANSPORTATION
The use of public transportation is one way to achieve the recommended level of daily physical activity for youth and adults. Improving access to public transportation is likely to increase opportunities for physical activity.

LINKING POLICY AND ENVIRONMENTAL STRATEGIES TO HEALTH OUTCOMES | page 27
ACTIVE LIVING STRATEGY #11: IMPROVE ACCESS TO PUBLIC TRANSPORTATION (CONTINUED)
Improving access to public transportation is likely to increase opportunities for physical activity by enabling people to walk to and from the transit stop. This can help populations at high risk for obesity, particularly underserved populations, achieve the recommended level of daily physical activity. It has been shown that commuters who used a light rail system to travel to/from work had a lower risk of becoming obese. Another study found that university students with increased access to public transportation, through a free transit pass from the university, increased their use of public transportation for school and nonschool trips. Increased use of public transportation also reduces individual vehicle trips and related emission, potentially magnifying the positive impact on health.
References: 1) Besser, L.M., & Dannenberg, A.L. (2005). Walking to public transit: Steps to help meet physical activity
recommendations. American Journal of Preventive Medicine, 29(4), 273–280.
2) Brown, B., & Werner, C. (2007). A new rail stop-tracking moderate physical activity bouts and ridership. American Journal of Preventive Medicine, 33(4), 306–309.
3) MacDonald, J.M., Stokes, R.J., Cohen, D.A., Kofner, A., & Ridgeway, G.K. (2010). The effect of light rail transit on body mass index and physical activity. American Journal of Preventive Medicine, 39(2), 105–112.
4) Meyer, J., & Beimborn, E. (1996). Evaluation of an innovative transit pass program: the UPASS. A Report to the Wisconsin Department of Transportation.
LINKING POLICY AND ENVIRONMENTAL STRATEGIES TO HEALTH OUTCOMES | page 28
POLICY/ ENVIRONMENTAL CHANGES
SHORT-TERM OUTCOMES
INTERMEDIATE OUTCOMES
LONG-TERM OUTCOME
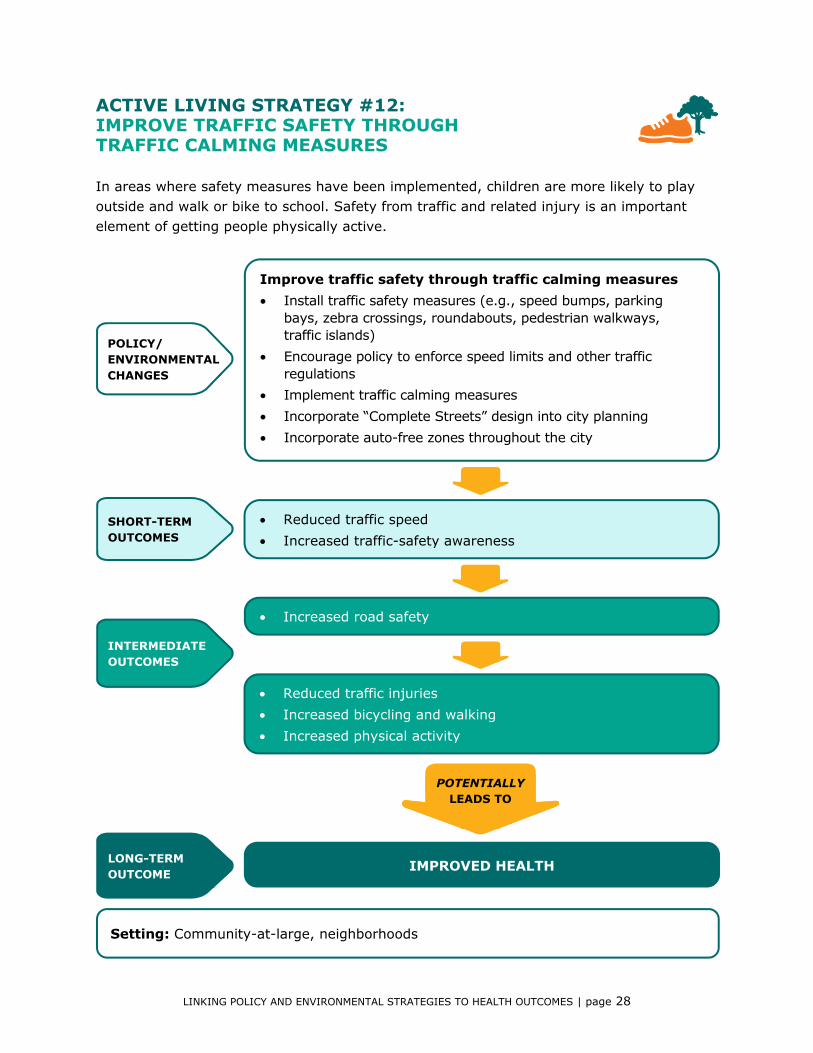
Improve traffic safety through traffic calming measures • Install traffic safety measures (e.g., speed bumps, parking
bays, zebra crossings, roundabouts, pedestrian walkways, traffic islands)
• Encourage policy to enforce speed limits and other traffic regulations
• Implement traffic calming measures • Incorporate “Complete Streets” design into city planning • Incorporate auto-free zones throughout the city
Setting: Community-at-large, neighborhoods
• Reduced traffic speed • Increased traffic-safety awareness
• Increased road safety
• Reduced traffic injuries • Increased bicycling and walking • Increased physical activity
POTENTIALLY LEADS TO
IMPROVED HEALTH
ACTIVE LIVING STRATEGY #12: IMPROVE TRAFFIC SAFETY THROUGH TRAFFIC CALMING MEASURES
In areas where safety measures have been implemented, children are more likely to play outside and walk or bike to school. Safety from traffic and related injury is an important element of getting people physically active.
LINKING POLICY AND ENVIRONMENTAL STRATEGIES TO HEALTH OUTCOMES | page 29
ACTIVE LIVING STRATEGY #12: IMPROVE TRAFFIC SAFETY THROUGH TRAFFIC CALMING MEASURES (CONTINUED)
Safety from traffic and related injury is an important element of getting people physically active. Implementing traffic calming measures has the potential to reduce traffic injuries and increase bicycling and walking. A study reported a 10 to 15 percent reduction in injury accidents following the implementation of traffic calming schemes in the United States. In residential areas, the reduction reaches 25 percent. Children are more likely to play outside and walk or bike to school in areas that have speed bumps, crosswalks, roundabouts, and other safety measures installed. Outside the United States, policies to improve traffic safety have dramatically reduced traffic deaths in the Netherlands and Germany. These policies include the implementation of auto-free zones, lower speed limits, and strict regulations protecting pedestrians and bicyclists.
References: 1) Bunn, F., Collier, T., Frost, C., Ker, K., Roberts, I., & Wentz, R. (2003). Traffic calming for the
prevention of road traffic injuries: Systematic review and meta-analysis. Injury Prevention, 9, 200–204.
2) Elvik, R. (2001). Area-wide urban traffic calming schemes: a meta-analysis of safety effects. Accident Analysis and Prevention, 33(3), 327–336
3) Leden, L, Wikstrom, P-E, Garder, P., & Rosander, P. (2006). Safety and accessibility effects of code modifications and traffic calming of an arterial road. Accident Analysis and Prevention, 38, 455–461.
4) Macbeth, A.G. (1999). Bicycle lanes in Toronto. Institute of Transportation Engineers, 69(4), 6.
5) Morrison, D., Thomson, H., & Petticrew, M. (2004). Evaluation of the health effects of a neighborhood traffic calming scheme. Journal of Epidemiology and Community Health, 59(10), 837–840.
6) Tester, J.M., Rutherford, G.W., Wald, Z., & Rutherford, M.W. (2004). A matched case control study evaluating the effectiveness of speed humps in reducing child pedestrian injuries. American Journal of Public Health, 94(4), 646–650.
7) Pucher, J., & Dijkstra, L. (2003). Promoting safe walking and cycling to improve public health: Lessons from the Netherlands and Germany. American Journal of Public Health, 93(9), 1509–1516.
LINKING POLICY AND ENVIRONMENTAL STRATEGIES TO HEALTH OUTCOMES | page 30
POLICY/ ENVIRONMENTAL CHANGES
SHORT-TERM OUTCOMES
INTERMEDIATE OUTCOMES
LONG-TERM OUTCOME
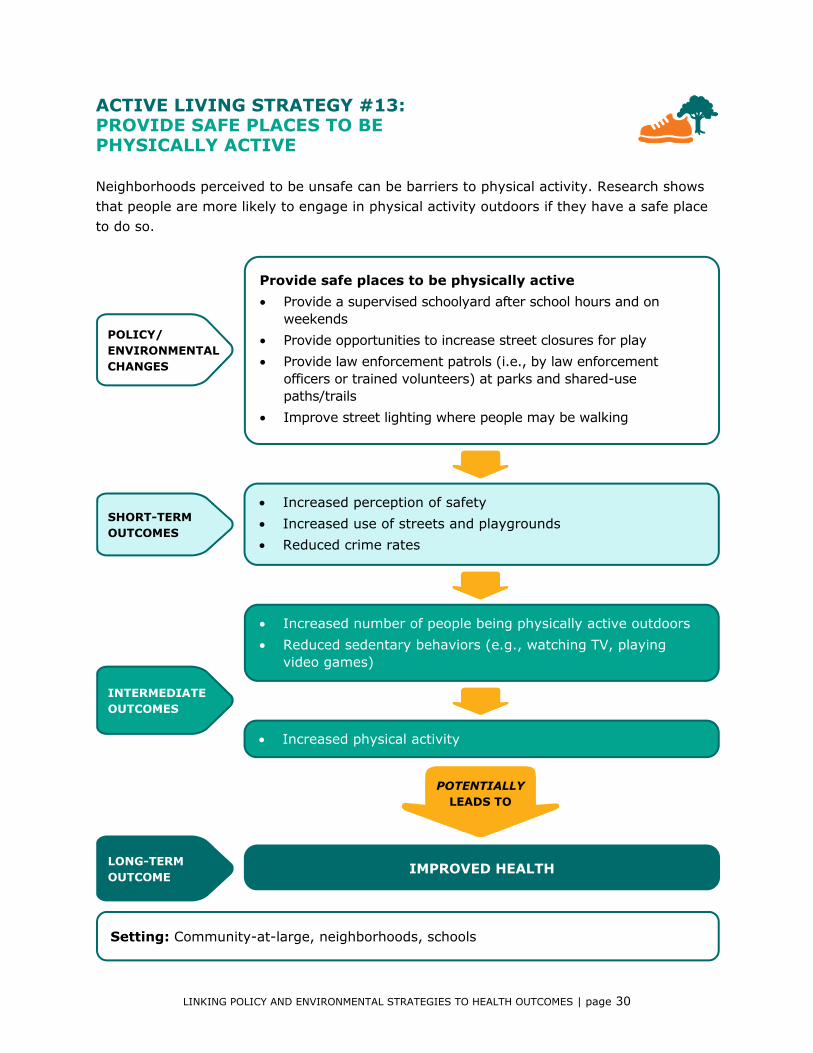
Provide safe places to be physically active • Provide a supervised schoolyard after school hours and on
weekends • Provide opportunities to increase street closures for play • Provide law enforcement patrols (i.e., by law enforcement
officers or trained volunteers) at parks and shared-use paths/trails
• Improve street lighting where people may be walking
Setting: Community-at-large, neighborhoods, schools
• Increased perception of safety • Increased use of streets and playgrounds • Reduced crime rates
• Increased number of people being physically active outdoors • Reduced sedentary behaviors (e.g., watching TV, playing
video games)
• Increased physical activity
POTENTIALLY LEADS TO
IMPROVED HEALTH
ACTIVE LIVING STRATEGY #13: PROVIDE SAFE PLACES TO BE PHYSICALLY ACTIVE
Neighborhoods perceived to be unsafe can be barriers to physical activity. Research shows that people are more likely to engage in physical activity outdoors if they have a safe place to do so.
LINKING POLICY AND ENVIRONMENTAL STRATEGIES TO HEALTH OUTCOMES | page 31
ACTIVE LIVING STRATEGY #13: PROVIDE SAFE PLACES TO BE PHYSICALLY ACTIVE (CONTINUED)
Research shows that people are more likely to engage in physical activity outdoors if they have a safe place to do so. This is especially true for women and children. Living in a neighborhood perceived to be unsafe has been found to be a barrier to physical activity. Implementing specific measures can improve the safety of the area. Some interventions that have effectively provided safe environments for physical activity include opening school playgrounds after school hours and on weekends, closing streets to traffic, and improving street lighting on pedestrian walkways. A study found that inner-city elementary school children reduced screen time over a two-year period after being provided with a supervised schoolyard for use after school hours. Another study found that adults increased their use of a pedestrian walkway and reported feeling safer following lighting improvements.
References: 1) Bennett, G.G., McNeil, L.H., Wolin, K.Y., Duncan, D.T., Puleo, E., & Emmons, K.M. (2007). Safe to walk?
Neighborhood safety and physical activity among public housing residents. Public Library of Science Medicine, 4(10), 1599–1606.
2) Farley, T.A., Meriwether, R.A., Baker, E.T., Watkins, L.T., Johnson, C.C., & Webber, L.S. (2007). Safe play spaces to promote physical activity in inner-city children: Results from a pilot study of an environmental intervention. American Journal of Public Health, 97(9), 1625–1631.
3) Gomez, J.E., Johnson, B.A., Selva, M., & Sallis, J.F. (2004). Violent crime and outdoor physical activity among inner-city youth. Preventive Medicine, 39, 876–881.
4) Streets Renaissance Campaign, New York City. (n.d.). From Play Matters: A study of best practices to inform local policy and process in support of children's play. Washington, D.C. http://kaboom.org/docs/documents/pdf/playmatters/Play_Matters_Extended_Case_Studies.pdf. Retrieved November 15, 2010.
5) Painter, K. (1996). The influence of street lighting improvements on crime, fear and pedestrian street use, after dark. Landscape and Urban Planning, 35, 193.
LINKING POLICY AND ENVIRONMENTAL STRATEGIES TO HEALTH OUTCOMES | page 32
POLICY/ ENVIRONMENTAL CHANGES
SHORT-TERM OUTCOMES
INTERMEDIATE OUTCOMES
LONG-TERM OUTCOME
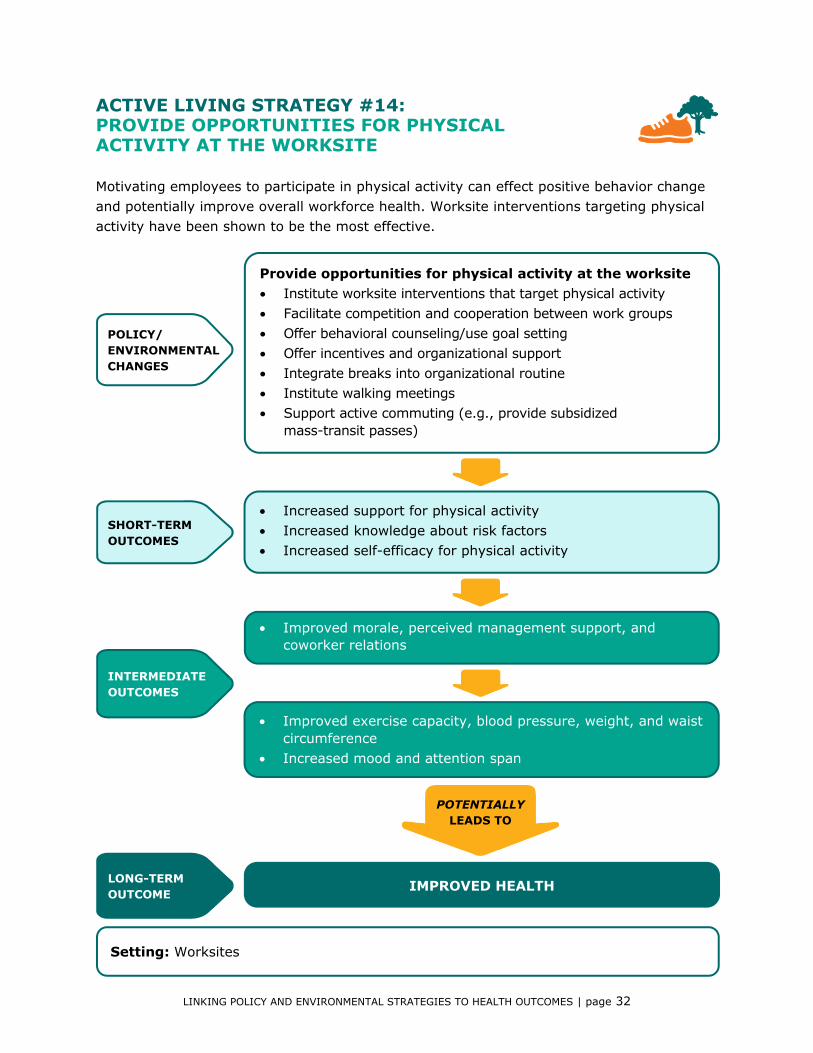
Provide opportunities for physical activity at the worksite • Institute worksite interventions that target physical activity • Facilitate competition and cooperation between work groups • Offer behavioral counseling/use goal setting • Offer incentives and organizational support • Integrate breaks into organizational routine • Institute walking meetings • Support active commuting (e.g., provide subsidized
mass-transit passes)
Setting: Worksites
• Increased support for physical activity • Increased knowledge about risk factors • Increased self-efficacy for physical activity
• Improved morale, perceived management support, and coworker relations
• Improved exercise capacity, blood pressure, weight, and waist circumference
• Increased mood and attention span
POTENTIALLY LEADS TO
IMPROVED HEALTH
ACTIVE LIVING STRATEGY #14: PROVIDE OPPORTUNITIES FOR PHYSICAL ACTIVITY AT THE WORKSITE
Motivating employees to participate in physical activity can effect positive behavior change and potentially improve overall workforce health. Worksite interventions targeting physical activity have been shown to be the most effective.

LINKING POLICY AND ENVIRONMENTAL STRATEGIES TO HEALTH OUTCOMES | page 33
ACTIVE LIVING STRATEGY #14: PROVIDE OPPORTUNITIES FOR PHYSICAL ACTIVITY AT THE WORKSITE (CONTINUED)
Interventions targeting physical activity specifically have been shown to be the most effective worksite interventions. Worksite interventions use team competition, goal setting, and behavioral counseling as mechanisms for motivating behavior change. Although worksite interventions face challenges such as motivating participants to register for the program, retaining participation, and long-term maintenance of positive behavior change; a literature review shows modest effects in weight loss at 6–12 months, increases in moderate to vigorous physical activity, and reductions in cardiovascular risk factors. Other innovative ideas, such as integrating work breaks, even as short as 10 minutes, have resulted in meaningful health benefits. These strategies are well received individually and organizationally and have the potential to improve the health of the workforce.
References: 1) Anderson, L.M., Quinn, T.A., Glanz, K., Ramirez, G., Kahwati, L.C., Johnson, D.B., & Katz, D.L. (2009).
The effectiveness of worksite nutrition and physical activity interventions for controlling employee overweight and obesity: A systematic review. American Journal of Preventive Medicine, 37(4), 340–57.
2) Dishman, R.K., DeJoy, D.M., Wilson, M.G., & Vandenberg, R.J. (2008). Move to improve: A randomized workplace trial to increase physical activity. American Journal of Preventive Medicine, 36(2), 133–141.
3) Gomel, M., Oldenburg, B., Simpson, J.M., & Owen, N. (1993). Work-site cardiovascular risk reduction: A randomized trial of health assessment, education, counseling, and incentives. American Journal of Public Health, 83(9), 1231–1238.
4) Healthy Eating Active Living Cities Campaign. (n.d.). Be a city with a healthy workforce. Retrieved November 15, 2010, from http://www.healcitiescampaign.org/resources.html.
5) Pedersen, M.T., Blangsted, A.K., Andersen, L.L., Jorgensen, M.B., Hansen, E.A., & Sjogaard, G. (2009). The effect of worksite physical activity intervention on physical capacity, health, and productivity: A 1-year randomized controlled trial. Journal of Occupational and Environmental Medicine, 51(7), 759–770.
6) Pegus, C., Bazzarre, T., Brown, J., & Menzin, J. (2002). Effect of the Heart At Work Program on awareness of risk factors, self-efficacy and health behaviors. Journal of Occupational and Environmental Medicine, 44(3).
7) Pressler, A., Knebel, U., Esch, S., Kolbl, D., Esefeld, K., Scherr, J., Haller, B., Schmidt-Trucksass, A., Krcmar, H., Halle, M., & Leimeister, J.M. (2010). An internet-delivered exercise intervention for workplace health promotion in overweight sedentary employees: A randomized trial. Preventive Medicine, 51, 234–239.
8) Stunkard, A.J., Yopp Cohen, R., & Felix, M.R.J. (1989). Weight loss competitions at the worksite: How they work and how well. Preventive Medicine, 18, 460–474.
9) Yancey, A. (2009). Integrating physical activity and healthy eating into organizational routine. In UCLA Kaiser Permanente Center for Health Equity, Presentations. Retrieved November 15, 2010, from http://healthequity.ucla.edu/presentations.php.
LINKING POLICY AND ENVIRONMENTAL STRATEGIES TO HEALTH OUTCOMES | page 34
POLICY/ ENVIRONMENTAL CHANGES
SHORT-TERM OUTCOMES
INTERMEDIATE OUTCOMES
LONG-TERM OUTCOME
Improve worksite built environment to support physical activity
• Build on-site walking paths • Provide on-site physical activity facilities or discounts on gym
memberships
Setting: Worksites
• Increased physical support for physical activity • Increased social support for physical activity
• More frequent active commuting to/from work • Better concentration, alertness, and job satisfaction • Increased physical activity
POTENTIALLY LEADS TO
IMPROVED HEALTH
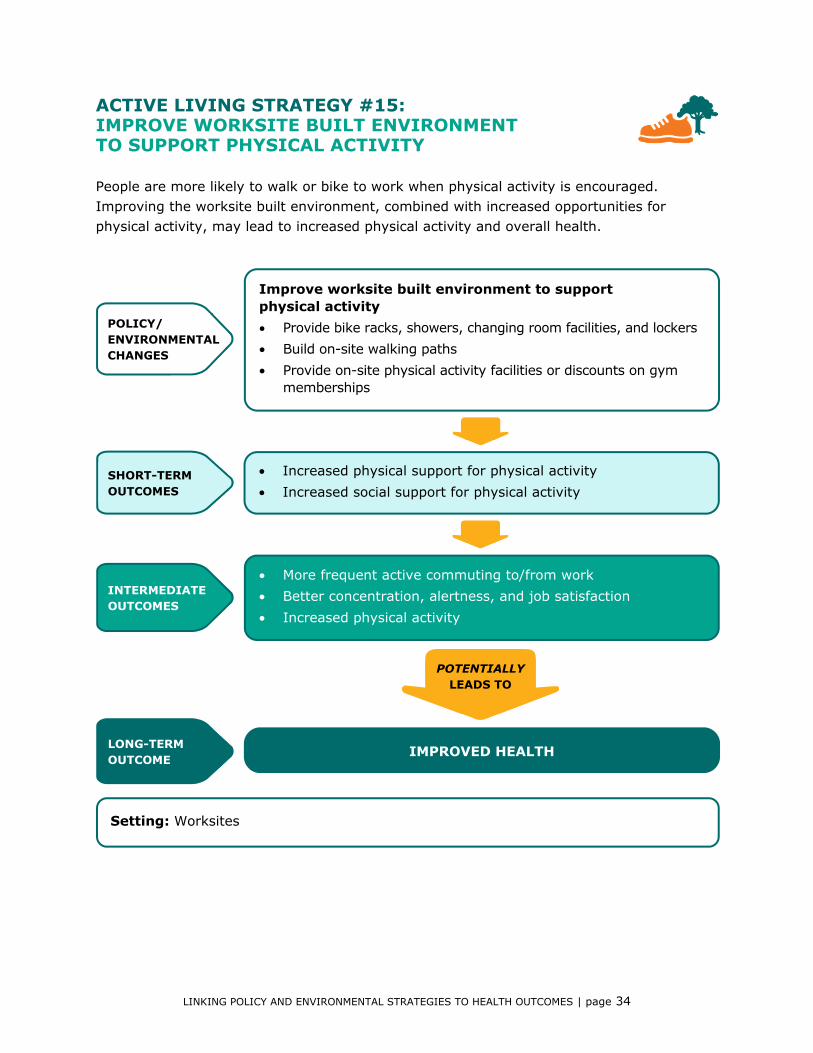
ACTIVE LIVING STRATEGY #15: IMPROVE WORKSITE BUILT ENVIRONMENT TO SUPPORT PHYSICAL ACTIVITY
People are more likely to walk or bike to work when physical activity is encouraged. Improving the worksite built environment, combined with increased opportunities for physical activity, may lead to increased physical activity and overall health.
LINKING POLICY AND ENVIRONMENTAL STRATEGIES TO HEALTH OUTCOMES | page 35
ACTIVE LIVING STRATEGY #15: IMPROVE WORKSITE BUILT ENVIRONMENT TO SUPPORT PHYSICAL ACTIVITY (CONTINUED)
The impact of the worksite’s built environment (e.g., walking tracks, fitness facilities) varies across studies. A recent study found that people who reported more worksite support for engaging in physical activity were more likely to walk or bike to work once a week. In particular, women who perceived cultural and physical supports in the workplace were significantly more likely to walk or bike to work. Improving the worksite built environment, combined with increased opportunities for physical activity at the worksite, may lead to increased physical activity and potentially improved overall health.
References: 1) Anderson, L.M., Quinn, T.A., Glanz, K., Ramirez, G., Kahwati, L.C., Johnson, D.B., & Katz, D.L. (2009).
The effectiveness of worksite nutrition and physical activity interventions for controlling employee overweight and obesity: A systematic review. American Journal of Preventive Medicine, 37(4), 340–57.
2) Emmons, K., Linnan, L., Shadel, W., Marcus, B., & Abrams, D. (1999). The Working Healthy Project: A worksite health-promotion trial targeting physical activity, diet, and smoking. Journal of Occupational and Environmental Medicine, 41(7).
3) Engbers, L.H., van Poppel, M., Chin, A., Paw, M., & van Mechelen, W. (2005). Worksite health promotion programs with environmental changes: A systematic review. American Journal of Preventive Medicine, 29(1), 61–70.
4) Kaczynski, A.T., Bopp, M.J., & Wittman, P. (2010). Association of workplace supports with active commuting. Preventing Chronic Disease: Public Health Research, Practice and Policy, 7(6).
5) Pegus, C., Bazzarre, T., Brown, J., & Menzin, J. (2002). Effect of the Heart At Work Program on awareness of risk factors, self-efficacy and health behaviors. Journal of Occupational and Environmental Medicine, 44(3).

LINKING POLICY AND ENVIRONMENTAL STRATEGIES TO HEALTH OUTCOMES | page 36
POLICY/ ENVIRONMENTAL CHANGES
SHORT-TERM OUTCOMES
INTERMEDIATE OUTCOMES
LONG-TERM OUTCOME
Use point-of-decision prompts to promote stair use
•
Setting: Community-at-large, Worksites
• Increased stair use • Increased awareness of risk factors for illness
• Increased physical activity • Reduced risk behaviors
POTENTIALLY LEADS TO
IMPROVED HEALTH
ACTIVE LIVING STRATEGY #16: USE POINT-OF-DECISION PROMPTS TO PROMOTE STAIR USE
Promoting physical activity through signs that highlight its benefits and art and music that make active environments more attractive can stimulate more physical activity in multiple settings. Simple environmental changes to encourage people to take the stairs have increased stair use in various public places.
LINKING POLICY AND ENVIRONMENTAL STRATEGIES TO HEALTH OUTCOMES | page 37
ACTIVE LIVING STRATEGY #16: USE POINT-OF-DECISION PROMPTS TO PROMOTE STAIR USE (CONTINUED)
Simple environmental changes to promote stair use (such as posting signs that promote the health benefits of stair use and making staircases more pleasant with artwork displays or music) have significantly increased stair use in various public places (e.g., shopping malls, train stations, airports) and university buildings. When signs promoting the health and weight-control benefits of stair use were placed beside escalators with adjacent stairs or near the stairs, significant increases in stair use were observed across age, gender, and race/ethnicity groups, in both obese and non-obese people.
References: 1) Andersen, R.E., Franckowiak, S.C., Snyder, J., Bartlett, S.J., & Fontaine, R. K. (1998). Can inexpensive
signs encourage the use of stairs? Results from a community intervention. Annals of Internal Medicine, 129, 363–369.
2) Boutelle, K.N., Jeffery, R.W., Murray, D.M., & Schmitz, K.H. (2001). Using signs, artwork, and music to promote stair use in a public building. American Journal of Public Health, 91, 2004–2006.
3) Brownell, K.D., Stunkard, A.J., & Albaum, J.M. (1980). Evaluation and modification of exercise patterns in the natural environment. American Journal of Psychiatry, 137, 1540–1545.
4) Coleman, K.J., & Gonzalez, E.C. (2001). Promoting stair use in a US–Mexico border community. American Journal of Public Health, 91, 2007–2009.
5) Kerr, J., Eves, F.F., & Carroll, D. (2001). Six-month observational study of prompted stair climbing. Preventive Medicine, 33, 422–427.
6) Kerr, J., Eves, F.F., & Carroll, D. (2001). Getting more people on the stairs: The impact of a new message format. Journal of Health Psychology, 6(5):495–500.
7) Marshall, A.L., Bauman, A.E., Patch, C., Wilson, J., & Chen, J. (2002). Can motivational signs prompt increases in incidental physical activity in an Australian health-care facility? Health Education Research, 17(6), 743–749.
LINKING POLICY AND ENVIRONMENTAL STRATEGIES TO HEALTH OUTCOMES | page 38
POLICY/ ENVIRONMENTAL CHANGES
SHORT-TERM OUTCOMES
INTERMEDIATE OUTCOMES
LONG-TERM OUTCOME
Reduce Screen time
•
Setting: Community-at-large, schools
• Reduced television viewing • Reduced sedentary behaviors • Increased time for physical activity
• Reduced energy intake • Increased physical activity
POTENTIALLY LEADS TO
IMPROVED HEALTH
• Decreased BMI and overweight • Improved fitness
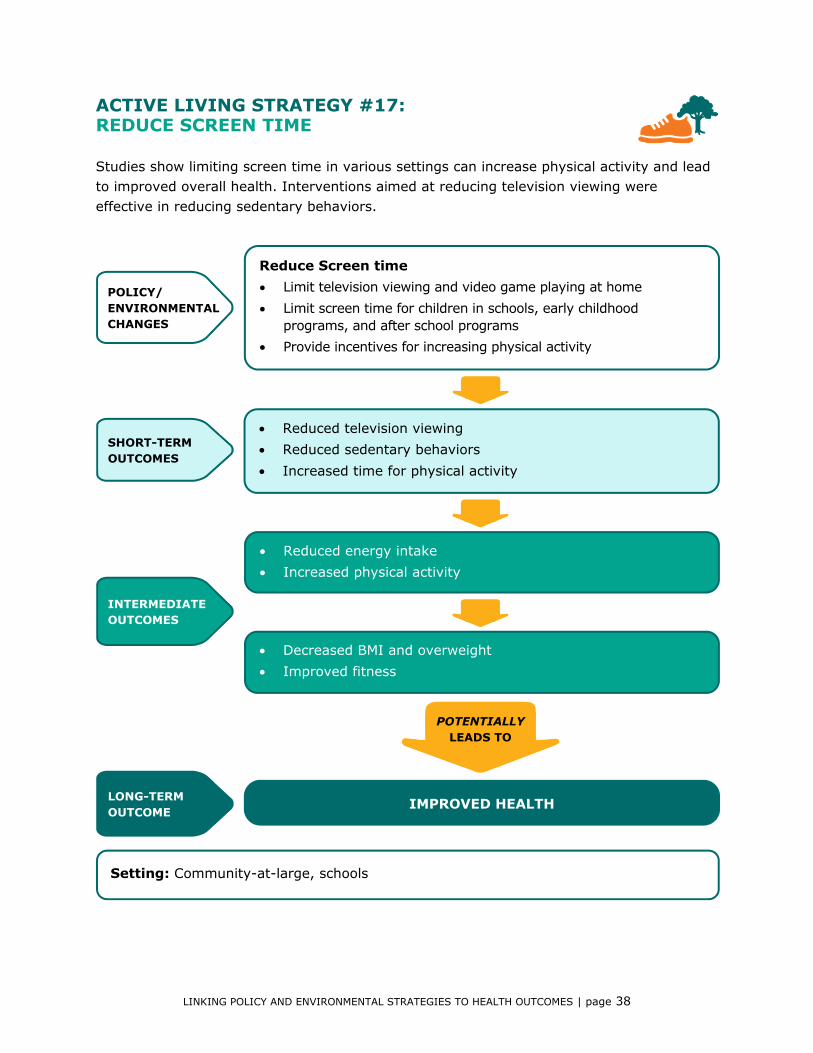
ACTIVE LIVING STRATEGY #17: REDUCE SCREEN TIME
Studies show limiting screen time in various settings can increase physical activity and lead to improved overall health. Interventions aimed at reducing television viewing were effective in reducing sedentary behaviors.
LINKING POLICY AND ENVIRONMENTAL STRATEGIES TO HEALTH OUTCOMES | page 39
ACTIVE LIVING STRATEGY #17: REDUCE SCREEN TIME (CONTINUED)
Interventions aimed at reducing television viewing were effective in reducing sedentary behaviors. Most studies showed significant positive outcomes associated with reduced television viewing. These positive outcomes included fewer meals eaten in front of the television, reduced energy intake, and in some cases significant increases in physical activity and decreases in percent overweight, BMI, and body fat. Implementing policies to limit screen time in various settings can be an effective strategy to increase physical activity and thus lead to improved overall health.
References: 1) Epstein, L.H., Paluch, R.A., Gordy, C.C., & Dorn, J. (2000). Decreasing sedentary behaviors in treating
pediatric obesity. Archives of Pediatric and Adolescent Medicine, 154(3), 220–226.
2) Epstein, L.H., Roemmich, J.N., Robinson, J.L., Paluch, R.A., Winiewicz, D.D., Fuerch, J.H., & Robinson, T.N. (2008). A randomized trial of the effects of reducing television viewing and computer use on body mass index in young children. Archives of Pediatric and Adolescent Medicine, 162(3), 239–245.
3) Gortmaker, S.L., Peterson, K., Wiecha, J., Sobol, A.M., Dixit, S., Fox M.K., & Laird, N. (1999). Reducing obesity via a school-based interdisciplinary intervention among youth. Archives of Pediatric and Adolescent Medicine, 153(4), 409–418.
4) Otten, J., Jones, K., Littenberg, B., & Harvey-Berino, J. (2009). Effects of television viewing reduction on energy intake and expenditure in overweight and obese adults. Archives of Internal Medicine, 169(22), 2109–2115.
5) Robinson, T.N. (1999). Reducing children's television viewing to prevent obesity. JAMA, 282(16), 1561–1567.
6) The Switch Program, Cedar Rapids, Iowa. (n.d.). From Play Matters: A study of best practices to inform local policy and process in support of children's play. Washington, DC. http://kaboom.org/docs/documents/pdf/playmatters/Play_Matters_Extended_Case_Studies.pdf. Retrieved November 15, 2010.
LINKING POLICY AND ENVIRONMENTAL STRATEGIES TO HEALTH OUTCOMES | page 40
POLICY/ ENVIRONMENTAL CHANGES
SHORT-TERM OUTCOMES
INTERMEDIATE OUTCOMES
LONG-TERM OUTCOME
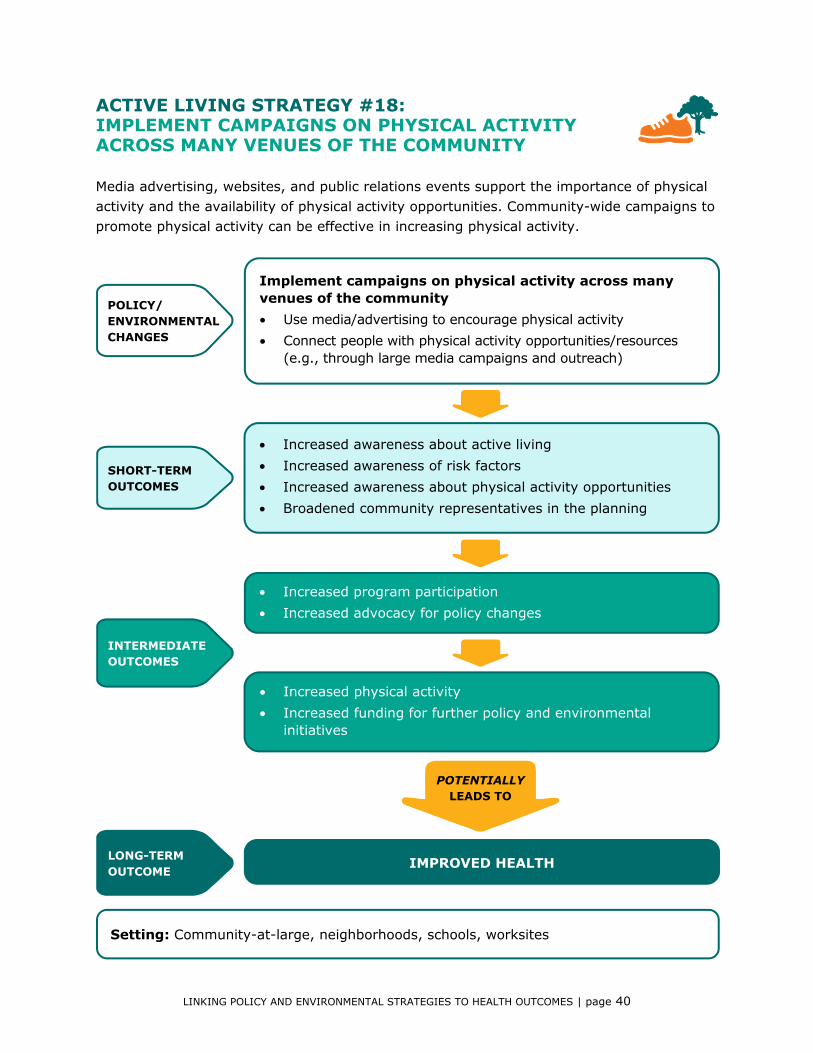
Implement campaigns on physical activity across many venues of the community • Use media/advertising to encourage physical activity • Connect people with physical activity opportunities/resources
(e.g., through large media campaigns and outreach)
Setting: Community-at-large, neighborhoods, schools, worksites
• Increased awareness about active living • Increased awareness of risk factors • Increased awareness about physical activity opportunities • Broadened community representatives in the planning
• Increased program participation • Increased advocacy for policy changes
• Increased physical activity • Increased funding for further policy and environmental
initiatives
POTENTIALLY LEADS TO
IMPROVED HEALTH
ACTIVE LIVING STRATEGY #18: IMPLEMENT CAMPAIGNS ON PHYSICAL ACTIVITY ACROSS MANY VENUES OF THE COMMUNITY
Media advertising, websites, and public relations events support the importance of physical activity and the availability of physical activity opportunities. Community-wide campaigns to promote physical activity can be effective in increasing physical activity.

LINKING POLICY AND ENVIRONMENTAL STRATEGIES TO HEALTH OUTCOMES | page 41
ACTIVE LIVING STRATEGY #18: IMPLEMENT CAMPAIGNS ON PHYSICAL ACTIVITY ACROSS MANY VENUES OF THE COMMUNITY (CONTINUED)
Community-wide campaigns to promote physical activity have been shown to be effective in increasing physical activity. Using media advertising (e.g., newspapers, TV, radio), websites, and public relations events in campaigns to promote physical activity have increased awareness of the importance of physical activity and the availability of physical activity programs. These campaigns also saw increases in participation in physical activity programs. The campaigns led to increased public support and advocacy for policy changes that, in turn, increased opportunities for funding to advance policy and environmental initiatives aimed at increasing physical activity in the community.
References: 1) Brownson, R., Smith, C., Pratt, M., Mack, N., Jackson-Thompson J., Dean, C.G., Dabney, S., &
Wilkerson, J.C. (1996). Preventing cardiovascular disease through community-based risk reduction: The Bootheel Heart Health Project. American Journal of Public Health, 86, 206–213.
2) Huberty, J.L., Dodge, T., Peterson, K., & Balluff, M. (2009). Active Omaha: The journey to an active living environment. American Journal of Preventive Medicine, 37(6S2), S428–S435.
3) Reger, B., Cooper, L., Booth-Butterfield, S., Smith, H., Bauman, A., Wootan, M., Middlestadt, S., Marcus, B., & Greer, F. (2002). Wheeling Walks: A community campaign using paid media to encourage walking among sedentary older adults. Preventive Medicine, 25, 285–292.
4) Thomas, I.M., Sayers, S.P., Godon, J.L., & Reilly, S.R. (2009). Bike, walk, and wheel: A way of life in Columbia, Missouri. American Journal of Preventive Medicine, 37(6S2), S322–S328.

LINKING POLICY AND ENVIRONMENTAL STRATEGIES TO HEALTH OUTCOMES | page 42

III. HEALTHY EATING STRATEGIES

LINKING POLICY AND ENVIRONMENTAL STRATEGIES TO HEALTH OUTCOMES | page 44
POLICY/ ENVIRONMENTAL CHANGES
SHORT-TERM OUTCOMES
INTERMEDIATE OUTCOMES
LONG-TERM OUTCOME
Increase participation in government-sponsored nutrition programs • Increase promotion efforts, education resources, and outreach • Simplify application, reporting, and reimbursement process • Relax eligibility requirements • Increase coupon distribution (e.g., for farmers’ markets) • Increase the use of Electronic Benefit Transfer (EBT) machines
Setting: Community-at-large, schools
• Increased awareness of government-sponsored programs • Increased number of people eligible for program benefits • Removed administrative complexity for program participation
• Increased participation in government-sponsored programs • Increased voucher use • Increased purchase of healthy fresh farm foods
• Healthier food and beverage consumption
POTENTIALLY LEADS TO
IMPROVED HEALTH
HEALTHY EATING STRATEGY #1: INCREASE PARTICIPATION IN GOVERNMENT- SPONSORED NUTRITION PROGRAMS
Government-sponsored nutrition programs have a wide reach to low-income populations. Studies have found that strategies focusing on program enhancements increased participation in government-sponsored programs.

LINKING POLICY AND ENVIRONMENTAL STRATEGIES TO HEALTH OUTCOMES | page 45
HEALTHY EATING STRATEGY #1: INCREASE PARTICIPATION IN GOVERNMENT-SPONSORED NUTRITION PROGRAMS (CONTINUED)
Government-sponsored nutrition programs—such as Women, Infants, and Children (WIC); Farmers’ Market Nutrition Program (FMNP); and Summer Food Service Program—have a wide reach to low-income populations, enhancing nutrition education and access to healthy food. Studies have found that strategies focusing on program enhancements such as simplifying the application process, improving outreach and nutrition education, providing coupons for use at farmers’ markets, and making Electronic Benefit Transfer (EBT) machines more widely available increased participation in government-sponsored programs. For example, significantly more children participated in the Summer Nutrition Program in states where the reporting process was streamlined. In addition, policies that reduced reporting requirements increased eligibility for, and participation in, government-sponsored nutrition programs. One could expect subsequent increases in healthy food consumption that would result in improved health in the long term.
References: 1) Conrey, E., Frongillo, E., Dollahite, J., & Griffin, M. (2003). Integrated program enhancements increased
utilization of farmers' market nutrition program. Journal of Nutrition, 133, 1841–1844.
2) Food Research and Action Center. (2008). Hunger doesn’t take a vacation: Summer nutrition status report 2008. Washington, DC.
3) Rose, D., Habicht, J-P., & Devaney, B. (1998). Household participation in the Food Stamp and WIC programs increases the nutrient intakes of preschool children. The Journal of Nutrition, 128(3).
4) Shak, L., Mikkelsen, L., & Chehimi, S. (2010). Recipes for change: Healthy food in every community. PolicyLink, Prevention Institute, & Convergence Partnership. http://www.preventioninstitute.org/component/jlibrary/article/id-266/127.html. Retrieved November 15, 2010.
5) U.S. Department of Agriculture, Food and Nutrition Service (2008). Trends in food stamp participation rates: 2000–2006 (summary). http://www.fns.usda.gov/ora/menu/Published/snap/FILES/Participation/Trends2000-2006.pdf. Retrieved November 15, 2010.

LINKING POLICY AND ENVIRONMENTAL STRATEGIES TO HEALTH OUTCOMES | page 46
POLICY/ ENVIRONMENTAL CHANGES
SHORT-TERM OUTCOMES
INTERMEDIATE OUTCOMES
LONG-TERM OUTCOME
Improve mechanisms for purchasing foods from farmers’ markets and farms • Provide vouchers and coupons for use at farmers’ markets • Provide baskets of vegetables and fruits from farmers’ market to
at-risk populations
Setting: Community-at-large, schools
• Increased healthy food options • Improved affordability of vegetables and fruits • Increased intention to purchase more nutritious foods
• Increased purchases of fresh produce from farmers’ markets • Increased likelihood of return visits to farmers’ markets
• Increased consumption of farm fresh food • Increased business for local farmers
POTENTIALLY LEADS TO
IMPROVED HEALTH
HEALTHY EATING STRATEGY #2: IMPROVE MECHANISMS FOR PURCHASING FOODS FROM FARMERS’ MARKETS AND FARMS
Purchasing food from farmers’ markets has wide-reaching impact. Providing vouchers to low-income populations increased vegetable and fruit consumption. Supplying school salad bars with fresh produce from farmers’ markets increased salad bar participation across all grade levels.
LINKING POLICY AND ENVIRONMENTAL STRATEGIES TO HEALTH OUTCOMES | page 47
HEALTHY EATING STRATEGY #2: IMPROVE MECHANISMS FOR PURCHASING FOODS FROM FARMERS’ MARKETS AND FARMS (CONTINUED)
Studies have found that improving mechanisms for purchasing foods from farmers’ markets has wide-reaching impact. For example, providing vouchers to low-income populations (seniors and WIC participants) for use at farmers’ markets increased vegetable and fruit consumption. In addition, providing homebound elders baskets of vegetables and fruits from farmers’ markets increased the percentage of elders who consumed five or more vegetables and fruits daily. Supplying school salad bars with fresh produce from farmers’ markets dramatically increased salad bar participation in schools across all grade levels. These increases in fresh produce consumption are expected to result in improved health.
References: 1) Anderson, J.V., Bybee, D., Brown, R., Mclean, D., Garcia, E., Breer, L., & Schillo, B. (2001). 5 a Day
Fruit and Vegetable intervention improves consumption in a low income population. Journal of the American Dietetic Association, 101(2), 195–202.
2) Anliker, J.A., Winne, M., & Drake, L.T. (1992). An evaluation of the Connecticut Farmer's Market Coupon Program. Journal of Nutrition Education, 24, 185–191.
3) Conrey, E., Frongillo, E., Dollahite, J., & Griffin, M. (2003). Integrated program enhancements increased utilization of farmers' market nutrition program. Journal of Nutrition, 133, 1841–1844.
4) Henchy, G. (2008). New healthy WIC food packages: Farmers' markets can play a key role in providing fruits and vegetables. Food Research and Action Center. http://www.frac.org/WIC/pdf/newfood/WIC_newfood_farmarket.pdf. Retrieved November 15, 2010.
5) Kunkel, M.E., Luccia, B., & Moore, A.C. (2003). Evaluation of the South Carolina Seniors Farmers' Market Nutrition Education Program. Journal of American Dietetic Association, 103, 880–883.
6) Johnson, D.B., Beaudoin, S., Smith, L.T., Beresford, S.A., & LoGerfo, J.P. (2004). Increasing fruit and vegetable intake in homebound elders: The Seattle Farmers' Market Nutrition Pilot Program. Preventing Chronic Disease, 1(1): A03.
7) Mascarenhas, M., & Gottlieb, R. (2008). The farmers market salad bar: Assessing the first three years of the Santa Monica-Malibu Unified School District Program. Occidental, A: Community Food Security Project Urban and Environmental Policy Institute, Occidental College, 1–24. http://www.farmtoschool.org/newsletter/mar08/index.htm.

LINKING POLICY AND ENVIRONMENTAL STRATEGIES TO HEALTH OUTCOMES | page 48
POLICY/ ENVIRONMENTAL CHANGES
SHORT-TERM OUTCOMES
INTERMEDIATE OUTCOMES
LONG-TERM OUTCOME
Improve access to supermarkets in underserved areas • Increase supermarket development • Provide public transit to/from grocery stores in underserved
areas
Setting: Community-at-large (low-income neighborhoods and underserved areas)
• Increased number of supermarkets • Increased access to healthier foods and beverages • Creation of jobs
• Increased purchase of healthier foods and beverages • Increased supermarket revenue • Increased customer satisfaction • Increased customer loyalty • Positive cycle of economic investment
• Healthier food and beverage consumption
POTENTIALLY LEADS TO
IMPROVED HEALTH
HEALTHY EATING STRATEGY #3: IMPROVE ACCESS TO SUPERMARKETS IN UNDERSERVED AREAS
A lack of supermarkets has been shown to contribute to unhealthy eating and poor health outcomes. Increasing access to supermarkets in low-income neighborhoods improves access to healthier foods and beverages.

LINKING POLICY AND ENVIRONMENTAL STRATEGIES TO HEALTH OUTCOMES | page 49
HEALTHY EATING STRATEGY #3: IMPROVE ACCESS TO SUPERMARKETS IN UNDERSERVED AREAS (CONTINUED)
A lack of supermarkets in underserved areas is believed to contribute to unhealthy eating and poor health outcomes in those communities. There is evidence that increasing access to supermarkets in low-income neighborhoods through public transit and increased supermarket development improves access to healthier foods and beverages. Supermarkets offering transportation services see an increase in revenue from fresh produce and other perishable items. The service is also effective in attracting and retaining customers. Incentives, new regulatory frameworks, involvement of nonprofit agencies and political leadership, and subsidy models have been recommended as strategies to attract planners and supermarket chains to underserved areas. The successful development of supermarkets consequently leads to the creation of jobs. The positive cycle of economic investment improves the supply of healthier foods and beverages and potentially leads to improved health of the members of the community who now have better access to healthier food sources.
References: 1) Mohan, V., & Cassady, D. (2002). Center for Advanced Studies in Nutrition and Social Marketing.
Supermarket shuttle programs: A feasibility study of supermarkets located in low-income, transit dependent, urban neighborhoods in California. University of California, Davis.
2) Gottlieb, R., Fisher, A., Dohan, M., et al. (1996). Community Food Security Coalition. Homeward bound: Food-related transportation strategies in low income and transit-dependent communities. UC Transportation Center.
3) Giang, T., Karpyn, A., Laurison, H.B., Hillier, A., & Perry, R.D. (2008). Closing the gap in underserved communities: The creation of the Pennsylvania Fresh Food Financing Initiative. Journal of Public Health Management Practice, 14(3), 272–279.
4) Hartford Food Systems. (2006). Connecticut's supermarkets: Can new strategies address the geographic gaps? http://www.hartfordfood.org.
5) Pothukuchi, K. (2005). Attracting supermarkets to inner-city neighborhoods: Economic development outside the box. Economic Development Quarterly, 19(3): 232–244.
6) Powell, L.M., Auld, M.C., Chaloupka, F.J., O’Malley, P.M., & Johnston, L.D. (2007). Associations between access to food stores and adolescent body mass index. American Journal of Preventive Medicine, 33(4Suppl), S301–S307.
7) Rudd Center for Food Policy & Obesity (2008). Access to Healthy foods in low-income neighborhoods: Opportunities for public policy. Rudd Report: Yale University. http://www.yaleruddcenter.org/resources/upload/docs/what/reports/RuddReportAccesstoHealthyFoods2008.pdf. Retrieved November 15, 2010.

LINKING POLICY AND ENVIRONMENTAL STRATEGIES TO HEALTH OUTCOMES | page 50
POLICY/ ENVIRONMENTAL CHANGES
SHORT-TERM OUTCOMES
INTERMEDIATE OUTCOMES
LONG-TERM OUTCOME
Increase access to drinking water
•
Setting: Schools, worksites, community-at-large
• Increased availability of a healthy source of water • Increased awareness about water being a good beverage choice
• Increased consumption of water • Decreased consumption of unhealthy (sugared) beverages • Reduced thirst • Increased concentration • Improved performance at sports
POTENTIALLY LEADS TO
IMPROVED HEALTH
HEALTHY EATING STRATEGY #4: INCREASE ACCESS TO DRINKING WATER
Young people benefit from drinking water, especially in place of sugar-added drinks. Schools can affect kids’ health through beverage policies that raise awareness and increase the availability of healthier beverages. Providing accessible drinking water has been shown to increase water consumption.

LINKING POLICY AND ENVIRONMENTAL STRATEGIES TO HEALTH OUTCOMES | page 51
HEALTHY EATING STRATEGY #4: INCREASE ACCESS TO DRINKING WATER (CONTINUED)
Studies have found that providing accessible drinking water increases water consumption dramatically at schools, especially when water containers are also available. Campaigns to promote the health benefits of water positively have influenced awareness and consumption. In addition, changes in school beverage policies have increased the availability and consumption of healthier beverages. Increased concentration and better performance at sports have also been reported with water consumption. Water consumption is also associated with reduced overweight.
References: 1) Chandran, K. (2009). Improving water consumption in schools: Challenges, promising practices, and
next steps. California Food Policy Advocates. http://cfpa.net/water/water_issue_brief.pdf.
2) Loughridge, J.L., & Barratt, J. (2005). Does the provision of cooled filtered water in secondary school cafeterias increase water drinking and decrease the purchase of soft drinks? The British Dietetic Association Ltd, 18, 281–286.
3) Muckelbauer, R., Libuda, L., Clausen, K., Toschke, A.M., Reinehr, T., & Kersting, M. (2009). Promotion and provision of drinking water in schools for overweight prevention: Randomized, controlled cluster trial. Pediatrics, 123(4), e661–e667.
4) Patel, A., & Cabana, M. (2010). Encouraging healthy beverage intake in child care and school settings, Current Opinion in Pediatrics. Dec;22(6):779–84.
5) Ritenbaugh, C., Teufel-Shone, N.I., Aickin, M.G., Joe, J.R., Poirier, S., Dillingham, D.C., Johnson, D., Henning, S., Cole, S.M., & Cockerham, D. (2003). A lifestyle intervention improves plasma insulin levels among Native American high school youth. Preventive Medicine, 36 (3), 309–319.

LINKING POLICY AND ENVIRONMENTAL STRATEGIES TO HEALTH OUTCOMES | page 52
POLICY/ ENVIRONMENTAL CHANGES
SHORT-TERM OUTCOMES
INTERMEDIATE OUTCOMES
LONG-TERM OUTCOME
Increase and promote healthy food and beverage options in cafeterias in schools and worksites
•
Setting: Schools, worksites
• Increased availability/access to healthy foods and beverages • Increased exposure to a variety of new fresh foods • Increased support for choosing healthy foods • Increased sales of healthier foods
• Increased number of fruits/vegetables being consumed each day • Reduced consumption of desserts • Increased healthier food and beverage consumption
POTENTIALLY LEADS TO
IMPROVED HEALTH
HEALTHY EATING STRATEGY #5: INCREASE AND PROMOTE HEALTHY FOOD AND BEVERAGE OPTIONS IN CAFETERIAS IN SCHOOLS AND WORKSITES
Increasing healthy choices in a cafeteria increases the sale of healthy food. Studies show that students choose three times as many vegetables at cafeteria salad bars compared to other meal options.
LINKING POLICY AND ENVIRONMENTAL STRATEGIES TO HEALTH OUTCOMES | page 53
HEALTHY EATING STRATEGY #5: INCREASE AND PROMOTE HEALTHY FOOD AND BEVERAGE OPTIONS IN CAFETERIAS IN SCHOOLS AND WORKSITES (CONTINUED)
Studies have shown that increasing healthy choices in a cafeteria increases the sale of healthy food in general. Studies in school settings have found that students chose three times as many servings of vegetables at the salad bar in comparison to the other meal choices. Further research has found that students with more healthy food options in the cafeteria perceived greater support for choosing healthy foods as compared to students with less healthy options. Furthermore, nutrition campaigns that reinforced nutrition education with increased availability of healthy foods in cafeterias saw a reduction in the incidence of overweight. Strategies that increase availability of healthy choices and prohibit the sale of sugary beverages and foods with minimal nutritional value have the potential to reduce the incidence of overweight.
References: 1) Brillinger, R., Ohmart, J., & Feenstra, G. (2003). The Crunch Lunch Manual: A case study of the Davis
Joint Unified School District Farmers Market Pilot Salad Bar Program and a fiscal analysis model. University of California, Davis, Sustainable Agricultural Research and Education Program. http://www.sarep.ucdavis.edu/cdpp/farmtoschool/crunchlunch32003.pdf.
2) French, S., Story, M., Fulkerson, J., & Hannan, P. (2004). An environmental intervention to promote lower-fat food choices in secondary schools: Outcomes of the TACOS study. American Journal of Public Health, 94 (9), 1507–1512.
3) Foster, G.D., Sherman, S., Borradaile, K.E., Grundy, K.M., Vander Veur, S.S., Nachmani, J., Karpyn, A., Kumanyika, S., & Shults, J. (2008). A policy-based school intervention to prevent overweight and obesity. Pediatrics, 121(4).
4) Jeffery, R.W., French, S.A., Raether, C., & Baxter, J.E. (1994). An environmental intervention to increase fruit and salad purchases in a cafeteria. Preventive Medicine, 23(6), 788–792.
5) Jordan, K., Erickson, E., Cox, R., Carlson, E., Heap, E., Friedrichs, M., Moyer-Mileur, L., Shen, S., & Mihalopoulos, N. (2008). Evaluation of the Gold Medal Schools Program. Journal of the American Dietetic Association, 108 (11).
6) Sanchez-Vaznaugh, E., Sanchez, B., Baek, J., & Crawford, P. (2010). Competitive food and beverage policies: Are they influencing childhood overweight trends? Health Affairs, 29(3), 436–446.
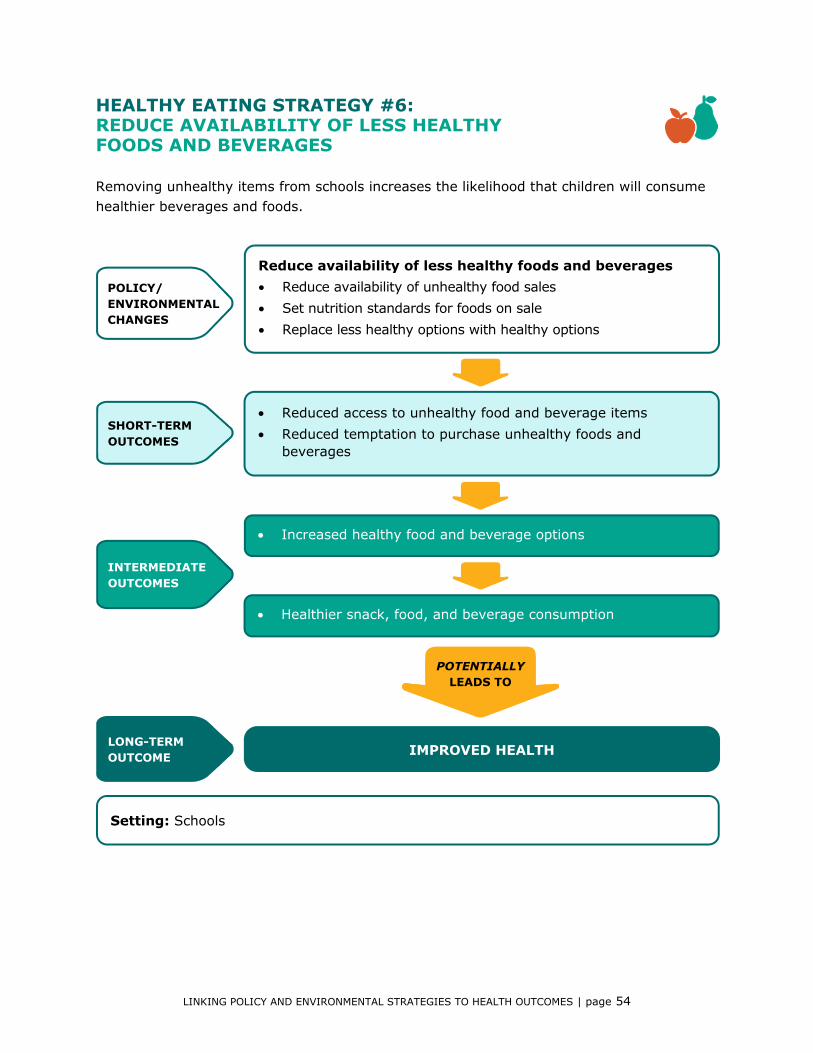
LINKING POLICY AND ENVIRONMENTAL STRATEGIES TO HEALTH OUTCOMES | page 54
POLICY/ ENVIRONMENTAL CHANGES
SHORT-TERM OUTCOMES
INTERMEDIATE OUTCOMES
LONG-TERM OUTCOME
Reduce availability of less healthy foods and beverages • Reduce availability of unhealthy food sales • Set nutrition standards for foods on sale • Replace less healthy options with healthy options
Setting: Schools
• Reduced access to unhealthy food and beverage items • Reduced temptation to purchase unhealthy foods and
beverages
• Increased healthy food and beverage options
• Healthier snack, food, and beverage consumption
POTENTIALLY LEADS TO
IMPROVED HEALTH
HEALTHY EATING STRATEGY #6: REDUCE AVAILABILITY OF LESS HEALTHY FOODS AND BEVERAGES
Removing unhealthy items from schools increases the likelihood that children will consume healthier beverages and foods.
LINKING POLICY AND ENVIRONMENTAL STRATEGIES TO HEALTH OUTCOMES | page 55
HEALTHY EATING STRATEGY #6: REDUCE AVAILABILITY OF LESS HEALTHY FOODS AND BEVERAGES (CONTINUED)
Research has shown that removing unhealthy items from schools increases the likelihood that children will consume healthier beverages and foods. An increasing number of schools have adopted nutrition guidelines for competitive foods. Studies show that school food policies that restrict the sale of unhealthy foods and beverages lead to decreased availability of unhealthy food and beverage items and increased availability of healthy options. In turn, this change can result in healthier snack, food, and beverage consumption and can be effective in reducing childhood obesity. A study predicted an 18 percent reduction in prevalence of overweight or obesity in schools that prohibit the sale of unhealthy food during school meals.
References: 1) Dority, B.D., McGarvey, M.G., & Kennedy, P.F. (2010). Marketing foods and beverages in schools: The
effect of school food policy on students’ overweight measures. Journal of Public Policy & Marketing, 29(2), 204–218.
2) Institute of Medicine. (2007). Nutrition standards for foods in schools: Leading the way toward healthier youth. http://www.iom.edu/cms/3788/30181/42502.aspx.
3) Patel, A., & Cabana, M. (2010). Encouraging healthy beverage intake in child care and school settings. Current Opinion in Pediatrics. Dec;22(6):779–84.
4) Ritenbaugh, C., Teufel-Shone, N.I., Aickin, M.G., Joe, J.R., Poirier, S., Dillingham, D.C., Johnson, D., Henning, S., Cole, S.M., & Cockerham, D. (2003). A lifestyle intervention improves plasma insulin levels among Native American high school youth. Preventive Medicine, 36 (3), 309–319.
5) Schwartz, M., Novak, S., & Fiore, S. (2009). The impact of removing snacks of low nutritional value from middle schools. Health Education & Behavior, 36(6), 999–1011.

LINKING POLICY AND ENVIRONMENTAL STRATEGIES TO HEALTH OUTCOMES | page 56
POLICY/ ENVIRONMENTAL CHANGES
SHORT-TERM OUTCOMES
INTERMEDIATE OUTCOMES
LONG-TERM OUTCOME
Redesign cafeteria and identify healthy options • Move nutritious foods to the start of the line • Make the fruit and salad bar more attractive and visible • Provide more descriptive names for food • Provide health claims on food items • Encourage use of trays • Decrease the size of the dish • Create a speedy “healthy express” checkout line
Setting: Schools, community-at-large (restaurants), worksites
• Easier recognition of healthier foods and beverages • Increased support for making healthy choices • Increased feasibility to purchase healthier foods and
beverages
• Increased purchase of healthy food and beverages
• Increased consumption of healthy food and beverages • Reduced choice of unhealthy foods and desserts
POTENTIALLY LEADS TO
IMPROVED HEALTH
HEALTHY EATING STRATEGY #7: REDESIGN CAFETERIA AND IDENTIFY HEALTHY OPTIONS
Presenting healthier foods in attractive, informative ways that highlight their health benefits affects people’s attitudes about those foods. Changing the cafeteria layout, improving presentation of vegetables and fruits, and identifying healthier items increase consumption of healthy food and beverages.
LINKING POLICY AND ENVIRONMENTAL STRATEGIES TO HEALTH OUTCOMES | page 57
HEALTHY EATING STRATEGY #7: REDESIGN CAFETERIA AND IDENTIFY HEALTHY OPTIONS (CONTINUED)
Research has found that changing the cafeteria layout, improving presentation of vegetables and fruits, and identifying healthier items facilitate the selection of healthier items and increase consumption of healthy food and beverages, especially as part of a multicomponent intervention. For example, placing salad bars in more visible, central locations and putting fruit in a more attractive container led to increased sales. Additional research has shown that favorable nutrition information and health claims on menus result in more favorable attitudes and increased purchase intentions even when the item is not purchased.
References: 1) Bronx Health Reach. Bronx healthy hearts. Retrieved November 15, 2010, from:
http://www.institute2000.org/bhr/work/nutrition_and_fitness/bronx_healthy_hearts.
2) Economos, C.D., Folta, S.C., Goldberg, J., Hudson, D., Collins, J., Baker, Z., Lawson, E., & Nelson, M. (2009). A community-based restaurant initiative to increase availability of healthy menu options in Somerville, Massachusetts: Shape Up Somervile. Preventing Chronic Disease, 6(3), A102.
3) Fitzpatrick, M., Chapman, G., & Barr, S. (1997). Lower-fat menu items in restaurants satisfy customers. Journal of the American Dietetic Association, 97 (5), 510–514.
4) Foster, G.D., Sherman, S., Borradaile, K.E., Grundy, K.M., Vander Veur, S.S., Nachmani, J., Karpyn, A., Kumanyika, S., & Shults, J. (2008). A policy-based school intervention to prevent overweight and obesity. Pediatrics, 121(4).
5) Jordan, K., Erickson, E., Cox, R., Carlson, E., Heap, E., Friedrichs, M., Moyer-Mileur, L., Shen, S., & Mihalopoulos, N. (2008). Evaluation of the Gold Medal Schools Program. Journal of the American Dietetic Association, 108 (11).
6) Kozup, J., Creyer, E., & Burton, S. (2003). Making healthful food choices: The influence of health claims and nutrition information on consumers' evaluation of packaged food products and restaurant menu items. Journal of Marketing, 67(2), 19–34.
7) Patterson P.M., Acharya R.N., Schmitz T.G., Foerster, S.B., Hill, E., Jones, A., & Bohm, E. (2002). Analysis of the effects of a healthy dining campaign on sales of healthy menu items. Proceedings from American Agricultural Economics Association Annual Meeting. Long Beach, CA. http://ageconsearch.umn.edu/bitstream/19892/1/sp02pa04.pdf. Retrieved November 15, 2010.
8) Wansink, B., Just, D., & McKendr, J. (2010). Lunch Line Redesign. New York Times. http://www.nytimes.com/interactive/2010/10/21/opinion/20101021_Oplunch.html. Retrieved November 15, 2010.

LINKING POLICY AND ENVIRONMENTAL STRATEGIES TO HEALTH OUTCOMES | page 58
POLICY/ ENVIRONMENTAL CHANGES
SHORT-TERM OUTCOMES
INTERMEDIATE OUTCOMES
LONG-TERM OUTCOME
Provide professional development of staff to increase healthy eating opportunities in schools • Train staff as part of a multicomponent school nutrition
intervention • Support integration of nutrition education into classroom
instruction • Train food service providers to follow healthy food preparation
procedures (e.g., prepare food with less sodium and fat)
Setting: Schools
• Improved qualifications of staff
• Improved instruction by staff of healthy eating behaviors • Integrated nutrition education in classroom instruction • Prepared healthier food by food service staff
• Increased provision of healthier foods in school meals • Improved healthy eating behaviors in students
POTENTIALLY LEADS TO
IMPROVED HEALTH
HEALTHY EATING STRATEGY #8: PROVIDE PROFESSIONAL DEVELOPMENT OF STAFF TO INCREASE HEALTHY EATING OPPORTUNITIES IN SCHOOLS
Improving staff instruction and providing healthier foods in schools can lead to a reduction of overweight and improvements in health. School interventions that include teacher training are effective in improving eating behaviors in students.

LINKING POLICY AND ENVIRONMENTAL STRATEGIES TO HEALTH OUTCOMES | page 59
HEALTHY EATING STRATEGY #8: PROVIDE PROFESSIONAL DEVELOPMENT OF STAFF TO INCREASE HEALTHY EATING OPPORTUNITIES IN SCHOOLS (CONTINUED)
Evidence suggests that school interventions that include teacher training are effective in improving eating behaviors in students. With the training, teachers are able to provide nutrition education as part of their classroom curricula and in turn can influence children’s food choices. In addition, interventions that train cooks how to reduce the sodium and fat content of school lunches are particularly effective in reducing children’s energy intake from fat. Improved instruction and providing healthier foods in schools can lead to reduction of overweight and improved health.
References: 1) Foster, G.D., Sherman, S., Borradaile, K.E., Grundy, K.M., Vander Veur, S.S., Nachmani, J., Karpyn, A.,
Kumanyika, S., & Shults, J. (2008). A policy-based school intervention to prevent overweight and obesity, Pediatrics, 121(4).
2) Snyder, M.P., Story, M., & Trenkner, L. (1992). Reducing fat and sodium in school lunch programs: the LUNCHPOWER! Intervention Study. Journal of Dietetic Association, 92(9), 1087–1091.
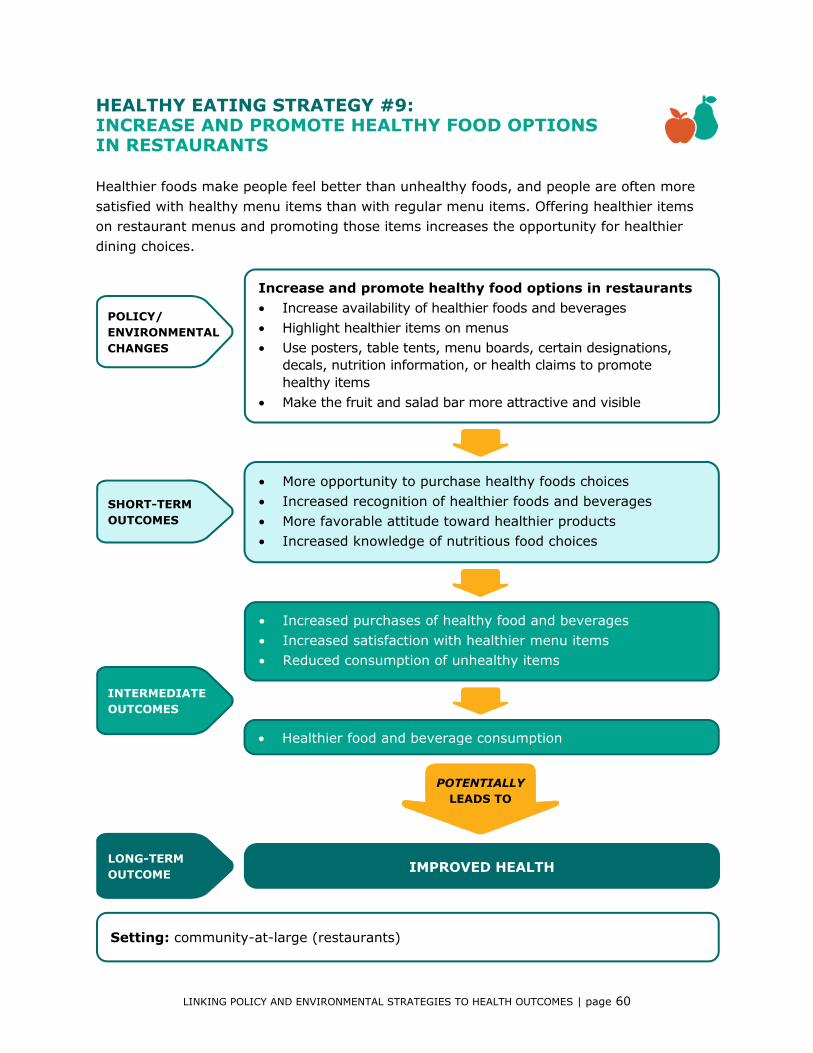
LINKING POLICY AND ENVIRONMENTAL STRATEGIES TO HEALTH OUTCOMES | page 60
POLICY/ ENVIRONMENTAL CHANGES
SHORT-TERM OUTCOMES
INTERMEDIATE OUTCOMES
LONG-TERM OUTCOME
Increase and promote healthy food options in restaurants • Increase availability of healthier foods and beverages • Highlight healthier items on menus • Use posters, table tents, menu boards, certain designations,
decals, nutrition information, or health claims to promote healthy items
• Make the fruit and salad bar more attractive and visible
Setting: community-at-large (restaurants)
• More opportunity to purchase healthy foods choices • Increased recognition of healthier foods and beverages • More favorable attitude toward healthier products • Increased knowledge of nutritious food choices
• Increased purchases of healthy food and beverages • Increased satisfaction with healthier menu items • Reduced consumption of unhealthy items
• Healthier food and beverage consumption
POTENTIALLY LEADS TO
IMPROVED HEALTH
HEALTHY EATING STRATEGY #9: INCREASE AND PROMOTE HEALTHY FOOD OPTIONS IN RESTAURANTS
Healthier foods make people feel better than unhealthy foods, and people are often more satisfied with healthy menu items than with regular menu items. Offering healthier items on restaurant menus and promoting those items increases the opportunity for healthier dining choices.

LINKING POLICY AND ENVIRONMENTAL STRATEGIES TO HEALTH OUTCOMES | page 61
HEALTHY EATING STRATEGY #9: INCREASE AND PROMOTE HEALTHY FOOD OPTIONS IN RESTAURANTS (CONTINUED)
Offering healthier items on restaurant menus and promoting those items increases the opportunity for customers to make healthier dining choices. Studies have found that with more availability of healthy choices, the demand for healthier items increases, although this effect was not consistently significant over time across studies. In addition, satisfaction with healthy menu items was significantly higher than satisfaction with regular menu items. Customers who patronized restaurants that promoted healthy options were found to recognize the healthier menu items and increase their consumption of these healthier items at the restaurant.
References: 1) Bronx Health Reach. Bronx healthy hearts. Retrieved November 15, 2010, from:
http://www.institute2000.org/bhr/work/nutrition_and_fitness/bronx_healthy_hearts.
2) Economos, C.D., Folta, S.C., Goldberg, J., Hudson, D., Collins, J., Baker, Z., Lawson, E., & Nelson, M. (2009). A community-based restaurant initiative to increase availability of healthy menu options in Somerville, Massachusetts: Shape Up Somerville. Preventing Chronic Disease, 6(3), A102.
3) Fitzpatrick, M., Chapman, G., & Barr, S. (1997). Lower-fat menu items in restaurants satisfy customers. Journal of the American Dietetic Association, 97(5), 510–514.
4) Patterson P.M., Acharya R.N., Schmitz T.G., Foerster, S.B., Hill, E., Jones, A., & Bohm, E. (2002). Analysis of the effects of a healthy dining campaign on sales of healthy menu items. Proceedings from American Agricultural Economics Association Annual Meeting. Long Beach, CA. http://ageconsearch.umn.edu/bitstream/19892/1/sp02pa04.pdf. Retrieved November 15, 2010.
5) Richard L., O’Loughlin, J.O, Masson, P., & Devost, S. (1999). Healthy menu intervention in restaurants in low-income neighborhoods: A field experience. Journal of Nutrition Education, 31(1): 54–59.
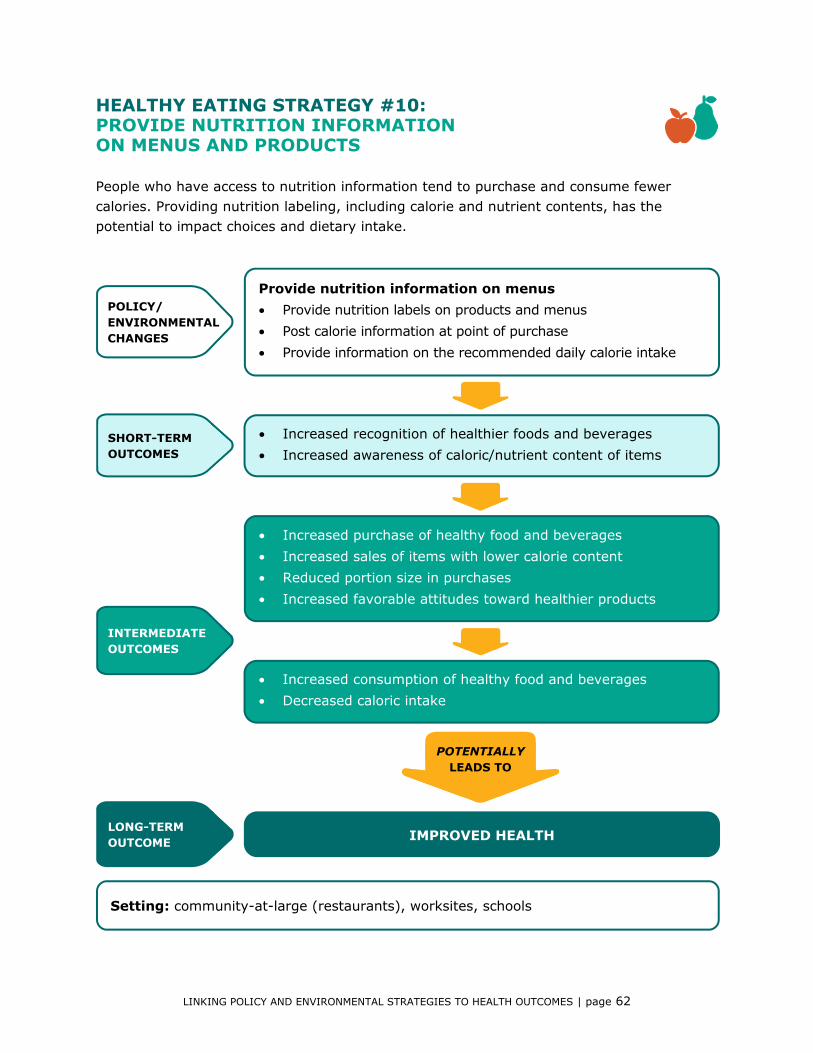
LINKING POLICY AND ENVIRONMENTAL STRATEGIES TO HEALTH OUTCOMES | page 62
POLICY/ ENVIRONMENTAL CHANGES
SHORT-TERM OUTCOMES
INTERMEDIATE OUTCOMES
LONG-TERM OUTCOME
Provide nutrition information on menus • Provide nutrition labels on products and menus • Post calorie information at point of purchase • Provide information on the recommended daily calorie intake
Setting: community-at-large (restaurants), worksites, schools
• Increased recognition of healthier foods and beverages • Increased awareness of caloric/nutrient content of items
• Increased purchase of healthy food and beverages • Increased sales of items with lower calorie content • Reduced portion size in purchases • Increased favorable attitudes toward healthier products
• Increased consumption of healthy food and beverages • Decreased caloric intake
POTENTIALLY LEADS TO
IMPROVED HEALTH
HEALTHY EATING STRATEGY #10: PROVIDE NUTRITION INFORMATION ON MENUS AND PRODUCTS
People who have access to nutrition information tend to purchase and consume fewer calories. Providing nutrition labeling, including calorie and nutrient contents, has the potential to impact choices and dietary intake.

LINKING POLICY AND ENVIRONMENTAL STRATEGIES TO HEALTH OUTCOMES | page 63
HEALTHY EATING STRATEGY #10: PROVIDE NUTRITION INFORMATION ON MENUS AND PRODUCTS (CONTINUED)
Providing nutrition labeling including calorie and nutrient contents on products or menus has the potential to impact ordering and dietary intake. Several, but not all, studies in this analysis reported a significant reduction in calories purchased and consumed by people who received menus with calorie information. When there was no reduction in calories purchased, many people still reported that the calorie labeling influenced purchasing behavior. Providing recommended daily caloric requirement also decreased eating later in the day.
References: 1) Bassett, M.T., Dumanovsky, T., Huang, C., Silver, L.D., Young, C., Nonas, C., Matte, T.D., Chideya, S.,
& Frieden, T.R. (2008). Purchasing behavior and calorie information at fast-food chains in New York City. American Journal of Public Health, 98(8), 1457–1459.
2) Bollinger, B., Leslie, P., & Sorensen, A. (2010). Calorie posting in chain restaurants; Stanford. Working paper.
3) Burton, S., Creyer, E., Kees, J., & Huggins, K. (2006). Attacking the obesity epidemic: The potential health benefits of providing nutrition information in restaurants. American Journal of Public Health, 96(9),1669–1675.
4) Elbel, B., Kersh, R., Brescoll, V., & Dixon, L. (2009). Calorie labeling and food choices: A first look at the effects on low-income people in New York City. Health Affairs, 1110–1121.
5) Harnack, L.J., French, S.A., Oakes, J.M., Story, M.T., Jeffery, R.W., & Rydell, S.A. (2008). Effects of calorie labeling and value size pricing on fast food meal choices: Results from an experimental trial. International Journal of Behavioral Nutrition and Physical Activity, 5, 1–13.
6) Lowe, M., Tappe, K., Butryn, M., Annunziato, R., Coletta, M., Ochner, C., & Rolls, B. (2010). An intervention study targeting energy and nutrient intake in worksite cafeterias. Eating Behaviors, 11(3), 144–151.
7) Roberto, C., Larsen, P., Agnew, H., Baik, J., & Brownell, K. (2010). Evaluating the impact of menu labeling on food choices and intake. American Journal of Public Health, 100(2), 312–318.
8) Yamamoto, J.A., Yamamoto, J.B., & Yamamoto, B.E. (2005). Adolescent fast food and restaurant ordering behavior with and without calorie and fat content menu information. Journal of Adolescent Health, 37(5), 297–402.
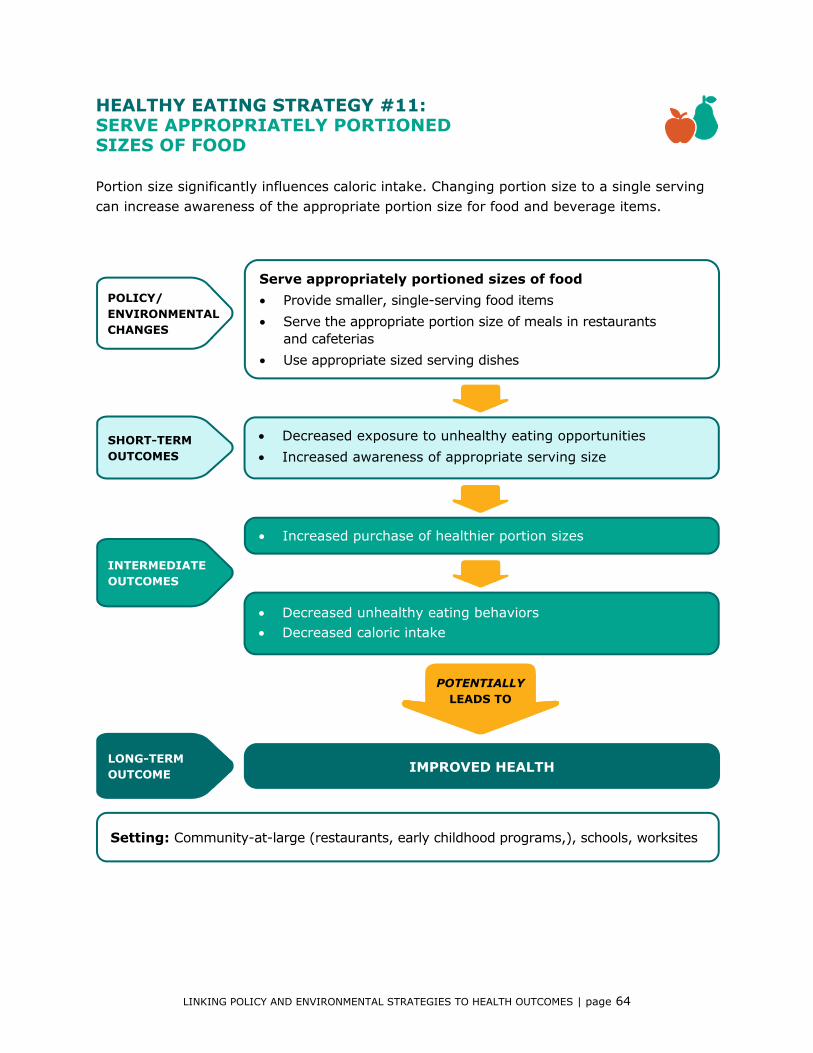
LINKING POLICY AND ENVIRONMENTAL STRATEGIES TO HEALTH OUTCOMES | page 64
POLICY/ ENVIRONMENTAL CHANGES
SHORT-TERM OUTCOMES
INTERMEDIATE OUTCOMES
LONG-TERM OUTCOME
Serve appropriately portioned sizes of food • Provide smaller, single-serving food items • Serve the appropriate portion size of meals in restaurants
and cafeterias • Use appropriate sized serving dishes
Setting: Community-at-large (restaurants, early childhood programs,), schools, worksites
• Decreased exposure to unhealthy eating opportunities • Increased awareness of appropriate serving size
• Increased purchase of healthier portion sizes
• Decreased unhealthy eating behaviors • Decreased caloric intake
POTENTIALLY LEADS TO
IMPROVED HEALTH
HEALTHY EATING STRATEGY #11: SERVE APPROPRIATELY PORTIONED SIZES OF FOOD
Portion size significantly influences caloric intake. Changing portion size to a single serving can increase awareness of the appropriate portion size for food and beverage items.
LINKING POLICY AND ENVIRONMENTAL STRATEGIES TO HEALTH OUTCOMES | page 65
HEALTHY EATING STRATEGY #11: SERVE APPROPRIATELY PORTIONED SIZES OF FOOD (CONTINUED)
Studies have found that portion size significantly influences caloric intake. That is, people were more likely to consume more calories when offered larger portion sizes. Furthermore, changing portion sizes to a single serving increased awareness of the appropriate portion sizes for food and beverage items. Decreasing the size of the bowl also reduced the serving size of the meal significantly. In an early childhood program setting, children increased their vegetable intake as portion sizes increased when a vegetable was offered as a first course. Changing portion sizes has the potential to lead to significant and sustained impact on food intake.
References: 1) Antonuk, B., & Block, L.G. (2006). The effect of single serving versus entire package nutritional
information on consumption norms and actual consumption of a snack food. Journal of Nutrition Education and Behavior, 38(6), 365–370.
2) Cullen, K.W., & Thompson, D.I. (2005). Texas school food policy changes related to middle school a la carte/snack bar foods: Potential savings in kilocalories. Journal of the American Dietetic Association, 105(12), 1952–1954.
3) Diliberti, N., Bordi, P.L., Conklin, M.T., Roe, L.S., & Rolls, B.J. (2004). Increased portion size leads to increased energy intake in a restaurant meal. Obesity Research, 12(3), 562–568.
4) Mendoza, J.A., Watson, K., & Cullen, K.W. (2010). Changes in dietary energy density after implementation of the Texas Public School Nutrition Policy. Journal of the American Dietetic Association, 110(3), 434–440.
5) Rolls, B.J., Morris, E.L., & Roe, L.S. (2002). Portion size of food affects energy intake in normal-weight and overweight men and women. American Journal of Clinical Nutrition, 76(6), 1207–1213.
6) Rolls, B.J., Roe, L.S., & Meengs, J.S. (2006). Reductions in portion size and energy density of foods are additive and lead to sustained decreases in energy intake. American Journal of Clinical Nutrition, 83(1), 11–17.
7) Spill, M.K., Birch, L.L., Roe, L.S., & Rolls, B.J. (2010). Eating vegetables first: the use of portion size to increase vegetable intake in preschool children. American Journal of Clinical Nutrition, 91, 1237–1243.
8) Wansink, B., Just, D., & McKendr, J. (2010). Lunch line redesign. New York Times. http://www.nytimes.com/interactive/2010/10/21/opinion/20101021_Oplunch.html. Accessed November 15, 2010.
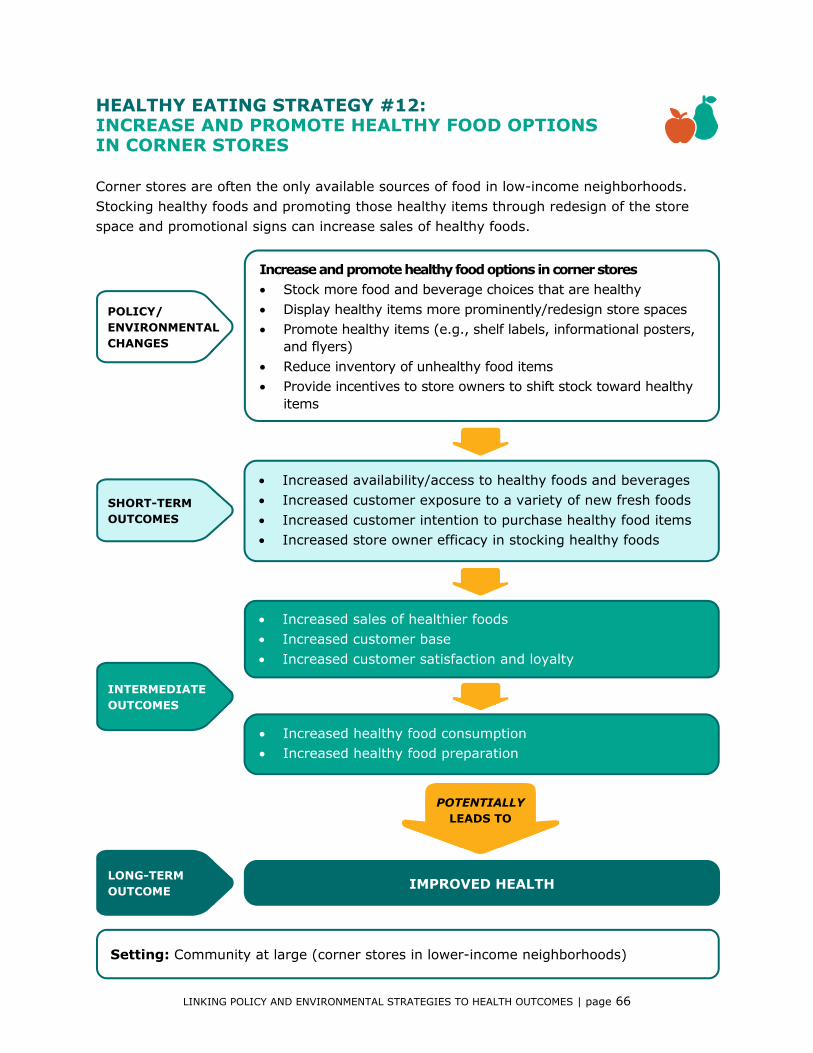
LINKING POLICY AND ENVIRONMENTAL STRATEGIES TO HEALTH OUTCOMES | page 66
POLICY/ ENVIRONMENTAL CHANGES
SHORT-TERM OUTCOMES
INTERMEDIATE OUTCOMES
LONG-TERM OUTCOME
Increase and promote healthy food options in corner stores • Stock more food and beverage choices that are healthy • Display healthy items more prominently/redesign store spaces • Promote healthy items (e.g., shelf labels, informational posters,
and flyers) • Reduce inventory of unhealthy food items • Provide incentives to store owners to shift stock toward healthy
items
Setting: Community at large (corner stores in lower-income neighborhoods)
• Increased availability/access to healthy foods and beverages • Increased customer exposure to a variety of new fresh foods • Increased customer intention to purchase healthy food items • Increased store owner efficacy in stocking healthy foods
• Increased sales of healthier foods • Increased customer base • Increased customer satisfaction and loyalty
• Increased healthy food consumption • Increased healthy food preparation
POTENTIALLY LEADS TO
IMPROVED HEALTH
HEALTHY EATING STRATEGY #12: INCREASE AND PROMOTE HEALTHY FOOD OPTIONS IN CORNER STORES
Corner stores are often the only available sources of food in low-income neighborhoods. Stocking healthy foods and promoting those healthy items through redesign of the store space and promotional signs can increase sales of healthy foods.

LINKING POLICY AND ENVIRONMENTAL STRATEGIES TO HEALTH OUTCOMES | page 67
HEALTHY EATING STRATEGY #12: INCREASE AND PROMOTE HEALTHY FOOD OPTIONS IN CORNER STORES (CONTINUED)
In low-income neighborhoods, corner stores are often the only readily available sources of food for residents. Research has shown that stocking healthy foods and promoting those healthy items in corner stores through redesign of the store space and promotional signs typically had a significant increase on sales of healthy foods (e.g., produce). Furthermore, with training and education, store owners showed increased willingness to stock and sell healthy food and a greater self-efficacy to do so. Interactive nutrition education sessions provided through corner stores increased healthy food intentions and healthy food preparation in customers. Together, these positive changes are expected to improve residents’ health.
References: 1) Bodor, J.N., Ulmer, V.M., Dunaway, L.F., Farley, T.A., & Rose, D. (2010). The rationale behind small
food store interventions in low-income urban neighborhoods: Insights from New Orleans. Journal of Nutrition, 140(6), 1185–1188.
2) Bolen, E., & Hecht, K. (2003). California Food Policy Advocates. Neighborhood groceries: New access to healthy food in low-income communities. San Francisco, California.
3) D.C. Hunger Solutions. (2010). Pushing vegetables, fruits on the corner. Howard University News Service. http://www.hunewsservice.com/special-projects/food-deserts/pushing-vegetables-fruits-on-the-corner-1.1481276.
4) Gittelsohn, J., Song, H.J., Suratkar, S., Kumar, M.B., Henry, E.G., Sharma, S., Mattingly, M., & Anliker, J.A. (2010). An urban food store intervention positively affects food-related psychosocial variables and food behaviors. Health Education & Behavior, 37(3).
5) Hartford Food Systems. (2007). Strategies that work: Healthy food retailers in Hartford’s neighborhoods. www.hartfordfood.org.
6) Healthy Corner Stores Network. (2010). Twenty corner stores selling produce in Detroit. Supermarket News. http://healthycornerstores.org.
7) NYC Healthy Bodegas Initiative. (2010). Healthy Bodegas Report, Department of Health & Mental Hygiene, Center for Economic Opportunity. http://www.nyc.gov/html/doh/html/cdp/cdp_pan_hbi.shtml.
8) Song, H.J., Gittelsohn, J., Kim, M., Suratkar, S., Sharma, S., & Anliker, J., (2009). A corner store intervention in a low-income urban community is associated with increased availability and sales of some healthy foods. Public Health Nutrition, 12(11), 2060–2067.
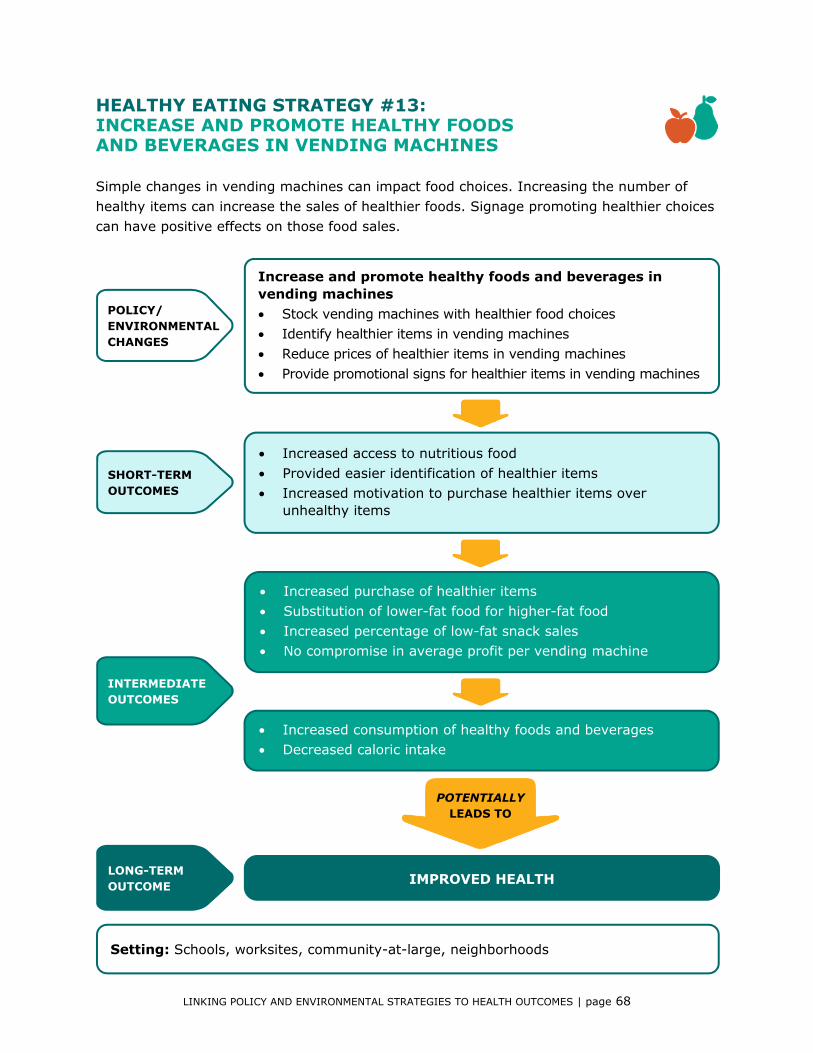
LINKING POLICY AND ENVIRONMENTAL STRATEGIES TO HEALTH OUTCOMES | page 68
POLICY/ ENVIRONMENTAL CHANGES
SHORT-TERM OUTCOMES
INTERMEDIATE OUTCOMES
LONG-TERM OUTCOME
Increase and promote healthy foods and beverages in vending machines • Stock vending machines with healthier food choices • Identify healthier items in vending machines • Reduce prices of healthier items in vending machines • Provide promotional signs for healthier items in vending machines
Setting: Schools, worksites, community-at-large, neighborhoods
• Increased access to nutritious food • Provided easier identification of healthier items • Increased motivation to purchase healthier items over
unhealthy items
• Increased purchase of healthier items • Substitution of lower-fat food for higher-fat food • Increased percentage of low-fat snack sales • No compromise in average profit per vending machine
• Increased consumption of healthy foods and beverages • Decreased caloric intake
POTENTIALLY LEADS TO
IMPROVED HEALTH
HEALTHY EATING STRATEGY #13: INCREASE AND PROMOTE HEALTHY FOODS AND BEVERAGES IN VENDING MACHINES
Simple changes in vending machines can impact food choices. Increasing the number of healthy items can increase the sales of healthier foods. Signage promoting healthier choices can have positive effects on those food sales.

LINKING POLICY AND ENVIRONMENTAL STRATEGIES TO HEALTH OUTCOMES | page 69
HEALTHY EATING STRATEGY #13: INCREASE AND PROMOTE HEALTHY FOODS AND BEVERAGES IN VENDING MACHINES (CONTINUED)
Simple changes in vending machines can impact food choices. Studies have found that increasing healthy items in vending machines increased the sales of healthier food (e.g., low-fat snacks) in both adolescent and adult populations. Signage promoting healthier choices had small but significant positive effects on those food sales. Also, reduced prices for healthy items increased sales of these items. The increases in percentage of healthier snack sales were observed without a decrease in vending profit.
References: 1) French, S.A., Hannan, P.J., Harnack, L.J., Mitchell, N.R., Toomey, T.L., & Gerlach, A. (2010). Pricing and
availability intervention in vending machines at four bus garages. American College of Occupational and Environmental Medicine, 53(1Supp).
2) French, S.A., Jeffery, R.W., Story, M., Breitlow, K.K., Baxter, J.S., Hannan, P., & Snyder, M.P. (2001). Pricing and promotion effects on low-fat vending snack purchases: The CHIPS Study. American Journal of Public Health, 91,112–117.
3) French, S.A., Jeffery, R.W., Story, M., Hannan, P., & Snyder, M.P. (1997). A pricing strategy to promote low fat snack choices through vending machines. American Journal of Public Health, 87:849–851.
4) LaFee, S. (2003). Healthy choices, healthy budgets: California schools find ways to bolster the lunch line bottom line. California Schools, 61(4), 16–20, 42–48.
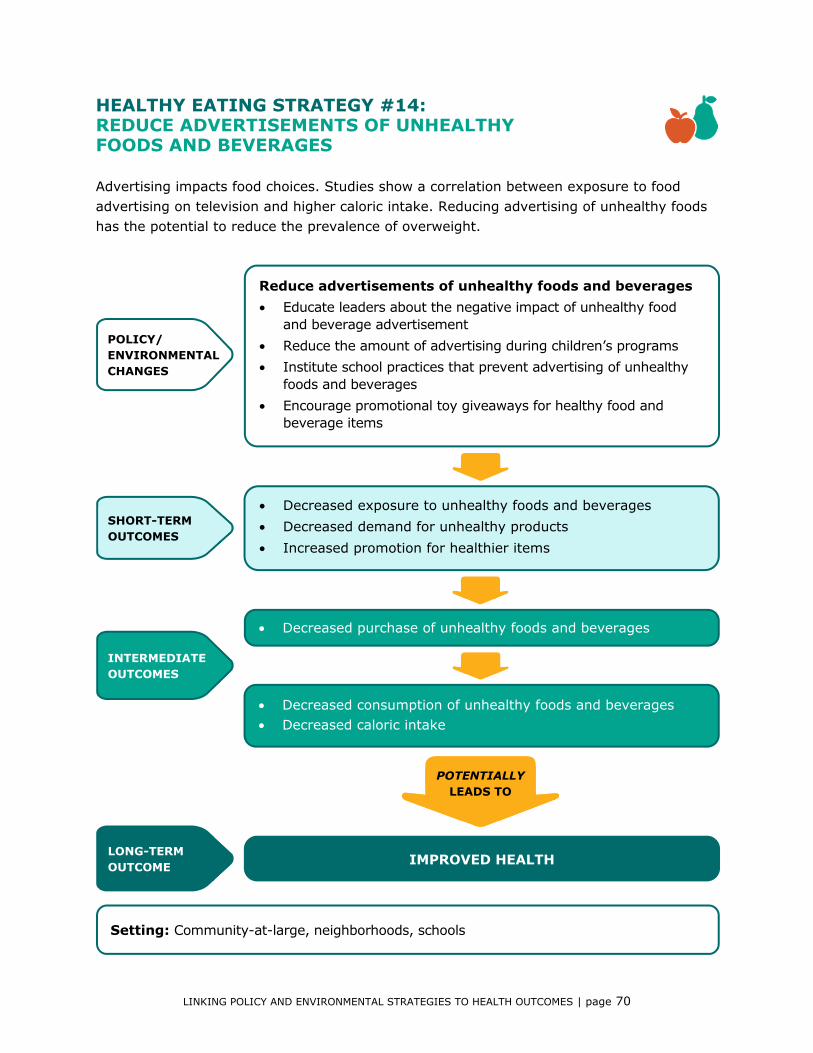
LINKING POLICY AND ENVIRONMENTAL STRATEGIES TO HEALTH OUTCOMES | page 70
POLICY/ ENVIRONMENTAL CHANGES
SHORT-TERM OUTCOMES
INTERMEDIATE OUTCOMES
LONG-TERM OUTCOME
Reduce advertisements of unhealthy foods and beverages • Educate leaders about the negative impact of unhealthy food
and beverage advertisement • Reduce the amount of advertising during children’s programs • Institute school practices that prevent advertising of unhealthy
foods and beverages • Encourage promotional toy giveaways for healthy food and
beverage items
Setting: Community-at-large, neighborhoods, schools
• Decreased exposure to unhealthy foods and beverages • Decreased demand for unhealthy products • Increased promotion for healthier items
• Decreased purchase of unhealthy foods and beverages
• Decreased consumption of unhealthy foods and beverages • Decreased caloric intake
POTENTIALLY LEADS TO
IMPROVED HEALTH
HEALTHY EATING STRATEGY #14: REDUCE ADVERTISEMENTS OF UNHEALTHY FOODS AND BEVERAGES
Advertising impacts food choices. Studies show a correlation between exposure to food advertising on television and higher caloric intake. Reducing advertising of unhealthy foods has the potential to reduce the prevalence of overweight.
LINKING POLICY AND ENVIRONMENTAL STRATEGIES TO HEALTH OUTCOMES | page 71
HEALTHY EATING STRATEGY #14: REDUCE ADVERTISEMENTS OF UNHEALTHY FOODS AND BEVERAGES (CONTINUED)
Advertising impacts food choices. Studies show a positive correlation between exposure to food advertising on television and higher caloric intake. How commercial advertising of foods contributes to the prevalence of obesity (directly or indirectly through inactivity) is yet unknown; but prohibiting advertisement of unhealthy items has the potential to reduce prevalence of overweight in children and adolescents, particularly males. In addition, a preliminary evaluation of the recent ban on giving toys away with unhealthy food/meals found that the ordinance led to revised menu boards that highlighted which meals met the nutritional requirements.
References: 1) Chou, S.Y., Rashad, I., & Grossman, M. (2008). Fast-food restaurant advertising on television and its
influence on childhood obesity. The Journal of Law and Economics, 51(4), 599–618.
2) Kaiser Family Foundation. (2004). The role of media in childhood obesity. http://www.kff.org/entmedia/upload/The-Role-Of-Media-in-Childhood-Obesity.pdf, Retrieved November 15, 2011.
3) Otten, J. (2010). Changes at fast food restaurants in response to the 2010 Santa Clara County, CA toy ordinance; Stanford University. Working paper.
4) Powell, L., Szczypka, G., & Chaloupka, F. (2010). Trends in exposure to television food advertisements among children and adolescents in the United States. Archives of Pediatric Adolescent Medicine, 164(9), E1–E9.
5) Robinson, T. (1999). Reducing children's television to prevent obesity: A randomized control trial. JAMA, 282, 1561–1567.
6) Veerman, J.L., Van Beeck, E.F., Barendregt, J.J., & Mackenbach, J.P. (2009). By how much would limiting TV food advertising reduce childhood obesity? European Journal of Public Health, 19(4), 365–369.
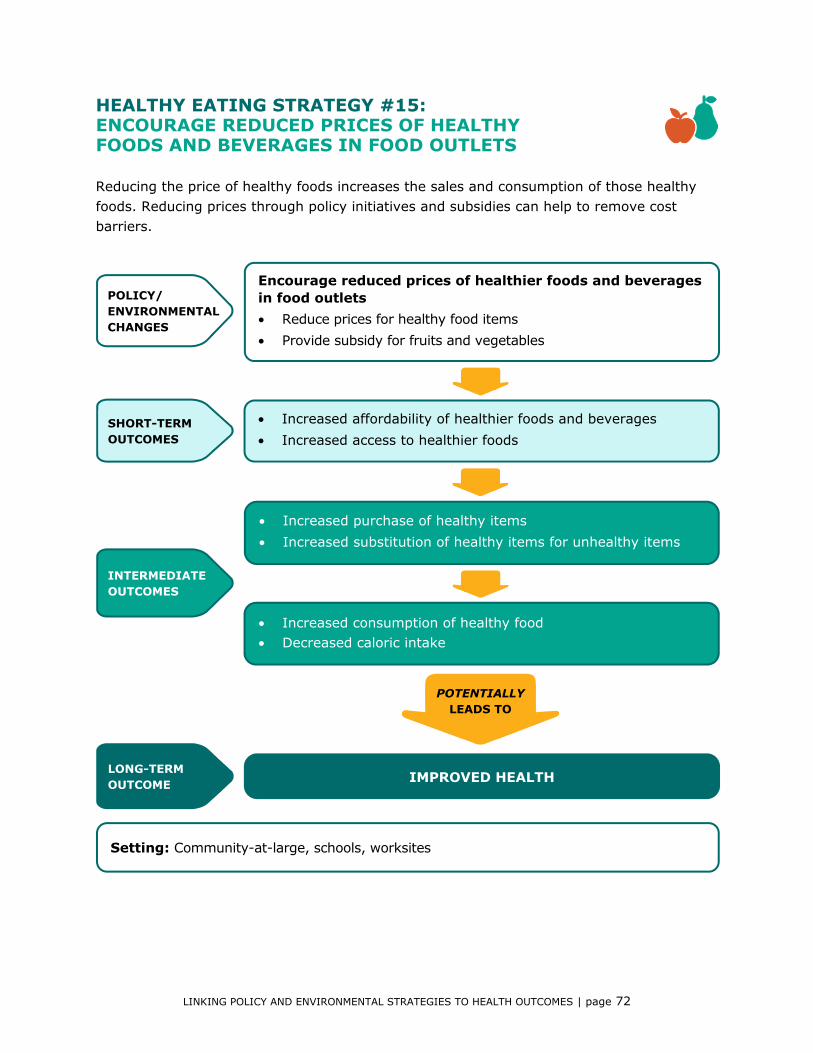
LINKING POLICY AND ENVIRONMENTAL STRATEGIES TO HEALTH OUTCOMES | page 72
POLICY/ ENVIRONMENTAL CHANGES
SHORT-TERM OUTCOMES
INTERMEDIATE OUTCOMES
LONG-TERM OUTCOME
Encourage reduced prices of healthier foods and beverages in food outlets • Reduce prices for healthy food items • Provide subsidy for fruits and vegetables
Setting: Community-at-large, schools, worksites
• Increased affordability of healthier foods and beverages • Increased access to healthier foods
• Increased purchase of healthy items • Increased substitution of healthy items for unhealthy items
• Increased consumption of healthy food • Decreased caloric intake
POTENTIALLY LEADS TO
IMPROVED HEALTH
HEALTHY EATING STRATEGY #15: ENCOURAGE REDUCED PRICES OF HEALTHY FOODS AND BEVERAGES IN FOOD OUTLETS
Reducing the price of healthy foods increases the sales and consumption of those healthy foods. Reducing prices through policy initiatives and subsidies can help to remove cost barriers.

LINKING POLICY AND ENVIRONMENTAL STRATEGIES TO HEALTH OUTCOMES | page 73
HEALTHY EATING STRATEGY #15: ENCOURAGE REDUCED PRICES OF HEALTHY FOODS AND BEVERAGES IN FOOD OUTLETS (CONTINUED)
Evidence suggests that price reductions on healthy food in schools and worksites are an effective strategy to increase the sales and consumption of the healthy food—as long as the cost remains reduced. Furthermore, studies found that consumption increased with steeper price discounts. Reducing prices through policy initiatives (e.g., USDA School Breakfast Program, WIC) and subsidies is a recommended approach to removing cost barriers to healthy food and increasing vegetable and fruit consumption. For example, a targeted subsidy for vegetables and fruits in the WIC program increased vegetable and fruit intake, which was sustained over time. These changes predict reduced overweight and improved health.
References: 1) Dong, D., & Lin, B. (2009). Fruit and vegetable consumption by low-income Americans: Would a price
reduction make a difference? USDA. A Report from the Economic Research Service, 70.
2) Epstein, L., Dearing, K., Paluch, R., Roemmich, J.N., & Cho, D. (2007). Price and maternal obesity influence purchasing of low- and high-energy dense foods. American Journal of Clinical Nutrition, 86(4), 914–922.
3) French, S., Story, M., Jeffery, R.W., Snyder, P., Eisenberg, M., Sidebottom, A., & Murray, D. (1997). A pricing strategy to promote fruit and vegetable purchase in high school cafeterias. Journal of American Dietetic Association, 97(9), 1008–1010.
4) Herman, D.R., Harrison, G.G., Abdelmonem, A, & Jenks, E. (2008). Effect of a targeted study on intake of fruits and vegetables among low-income women in the special supplemental nutrition program for women, infants, and children. Am J Public Health, 98(1), 98–105.
5) Horgen, KB, & Brownell, KD. (2002). Comparison of price change and health message interventions in promoting healthy food choices. Health Psychology, 21(5), 505–512.
6) Jeffery, R.W., French, S.A., Raether, C., & Baxter, J.E. (1994). An environmental intervention to increase fruit and salad purchases in a cafeteria. Preventive Medicine, 23(6), 788–792.
7) Kennedy, E., & Davis, C. (1998). US Department of Agriculture School Breakfast Program. The American Journal of Clinical Nutrition, 67(suppl), 798S–803S.
8) Powell, L., Zhao, Z., & Wang, Y. (2009). Food prices and fruit and vegetable consumption among young American adults. Health and Place, 15, 1064–1070.

LINKING POLICY AND ENVIRONMENTAL STRATEGIES TO HEALTH OUTCOMES | page 74
POLICY/ ENVIRONMENTAL CHANGES
SHORT-TERM OUTCOMES
INTERMEDIATE OUTCOMES
LONG-TERM OUTCOME
Increase support for breastfeeding • Enhance breastfeeding education • Provide written educational material • Create supportive environment (e.g., signs, posters) • Provide breast pumps and locations to breastfeed • Use peer counseling • Provide hospital-based intervention programs
Setting: Community-at-large, worksites
• Increased awareness around the benefits of breastfeeding
• Provided a supportive environment for breastfeeding • Increased positive attitude and acceptability for breastfeeding • Increased feelings of social support for breastfeeding
• Improved breastfeeding practices
POTENTIALLY LEADS TO
IMPROVED HEALTH
HEALTHY EATING STRATEGY #16: INCREASE SUPPORT FOR BREASTFEEDING
Breastfed children have shown a reduced risk of overweight and obesity. Increasing awareness and acceptance of breastfeeding through policies that support breastfeeding in the workplace can increase breastfeeding practices.
LINKING POLICY AND ENVIRONMENTAL STRATEGIES TO HEALTH OUTCOMES | page 75
HEALTHY EATING STRATEGY #16: INCREASE SUPPORT FOR BREASTFEEDING (CONTINUED)
Breastfed children have shown reduced risk of overweight and obesity. Efforts to increase support for breastfeeding programs have the potential to improve breastfeeding practices. Increasing awareness and acceptance of breastfeeding through enhanced support—especially hospital-based educational programs—has been successful in increasing breastfeeding initiation and duration, particularly for low-income women. Peer counseling has also been significantly associated with breastfeeding initiation over the first three months post-partum. In contrast, research has shown that providing women discharge packs with free formula has a negative impact on breastfeeding. Policies that support breastfeeding in the workplace will likely remove barriers and extend breastfeeding practices more widely.
References: 1) Ahluwalia, I.B., Tessaro, I., Grummer-Strawn, L.M., MacGowan, C., & Benton-Davis, S. (2000).
Georgia's breastfeeding promotion program for low-income women. Pediatrics, 105(6), E85.
2) Chapman, D.J., Damio, G., Young, S., & Perez-Escamilla, R. (2004). Effectiveness of breastfeeding peer counseling in a low-income, predominantly Latina population. Archives of Pediatric & Adolescent Medicine, 158, 897–902.
3) Condon, L. (2010). Cut out for breastfeeding: changing attitudes to breastfeeding. Community Practitioner, 83(4).
4) Division of Nutrition and Physical Activity: Research to Practice Series No. 4: Does breastfeeding reduce the risk of pediatric overweight? Atlanta: Centers for Disease Control and Prevention, 2007. www.cdc.gov/nccdphp/dnpa/nutrition/pdf/breastfeeding_r2p.pdf. Retrieved November 15, 2010.
5) Guise, J.M., Palda, V., Westhoff, C., Chan, B., Helfand, M., & Lieu, T. (2003). The effectiveness of primary care-based interventions to promote breastfeeding: Systematic evidence review and meta-analysis for the US preventive services task force. Annals of Family Medicine, 1, 70–78.
6) National Conference of State Legislatures (2009). 50 states summary of breastfeeding laws. http://www.ncsl.org/programs/health/breast50.htm.
7) Rosenberg, K.D., Eastham, C.A., Kasehagen, L.J., & Sandoval, A.P. (2008). Marketing infant formula through hospitals: The impact of commercial hospital discharge packs on breastfeeding. American Journal of Public Health, 98(2), 290–295.
8) Ryser, F.G. (2004). Breastfeeding attitudes, intention, and initiation in low-income women: The effect of the best start program. Journal of Human Lactation, 20(3), 300–5.

LINKING POLICY AND ENVIRONMENTAL STRATEGIES TO HEALTH OUTCOMES | page 76
POLICY/ ENVIRONMENTAL CHANGES
SHORT-TERM OUTCOMES
INTERMEDIATE OUTCOMES
LONG-TERM OUTCOME
Implement campaigns on healthy eating across many venues of the community • Provide multi-component nutrition interventions in schools (e.g.,
nutrition education, staff training, and parent outreach) • Use mass media to encourage healthy eating behaviors • Implement point-of-purchase programs in restaurants,
supermarkets, cafeterias to promote campaign message
Setting: Community-at-large, neighborhoods, schools, worksites
• Increased awareness of healthy eating • Increased support for healthy eating
• Increased healthy eating behaviors • Increased demand for healthy foods
• Increased healthier food and beverage consumption
POTENTIALLY LEADS TO
IMPROVED HEALTH
HEALTHY EATING STRATEGY #17: IMPLEMENT CAMPAIGNS ON HEALTHY EATING ACROSS MANY VENUES OF THE COMMUNITY
Social marketing can be an effective tool to support healthy eating and lead to improved health. Campaigns on healthy eating raise public awareness about healthy eating and increase consumption and sales of healthy foods.

LINKING POLICY AND ENVIRONMENTAL STRATEGIES TO HEALTH OUTCOMES | page 77
HEALTHY EATING STRATEGY #17: IMPLEMENT CAMPAIGNS ON HEALTHY EATING ACROSS MANY VENUES OF THE COMMUNITY (CONTINUED)
Campaigns on healthy eating have been found to raise public awareness about healthy eating and disease prevention and increase consumption and sales of healthy foods. A nutrition intervention at school has the potential to reduce the incidence of overweight in children. Nationwide health education campaigns have been shown to have a long-term impact (one year post-campaign) on the sale and consumption of healthier food and beverage items. Thus, social marketing can be an effective tool to improve nutrition knowledge, attitudes, and behavior, improving support for healthy eating and eventually leading to improved health.
References: 1) Foerster, S.B., Kizer, K.W., Disogra, L.K., Bal, D.G., Krieg, B.F., & Bunch, K.L. (1995). California's 5 a
day—for better health! campaign: An innovative population-based effort to effect large-scale dietary change. American Journal of Preventive Medicine, 11(2), 124–131.
2) Foster, G.D., Sherman, S., Borradaile, K.E., Grundy, K.M., Vander Veur, S.S., Nachmani, J., Karpyn, A., Kumanyika, S., & Shults, J. (2008). A policy-based school intervention to prevent overweight and obesity. Pediatrics, 121(4), e794–e802.
3) NSW Go for 2&5 2008 Campaign Evaluation pamphlet. http://www.gofor2and5.com.au/campaign.aspx?c=5&a=41&s=118&t=119&n=396#Publications.
4) Pollard, C.M., Miller, M.R., Daly, A.M., Crouchley, K.E., O'Donoghue, K.J., Lang, A.J., & Binns, C.W. (2008). Increasing fruit and vegetable consumption: Success of the Western Australian Go for 2&5 Campaign. Public Health Nutrition, 11(3), 314–320.
5) Reger, B., Wootan, M.G., Booth-Butterfield, S., & Smith, H. (1998). 1% or less: A community-based nutrition campaign. Public Health Reports, 113(5), 410–419.
6) Samuels S. (1993). Project LEAN: Lessons learned from a national social marketing campaign. Public Health Reports, 108(1), 45–53.
7) Sorenson, G., Stoddard, A., Peterson, K., Cohen, N., Hunt, M.K., Stein, E., Palombo, R., & Lederman, R. (1999). Increasing fruit and vegetable consumption through worksites and families in the Treatwell 5-a-day study. American Journal of Public Health, 89(1), 54–60.
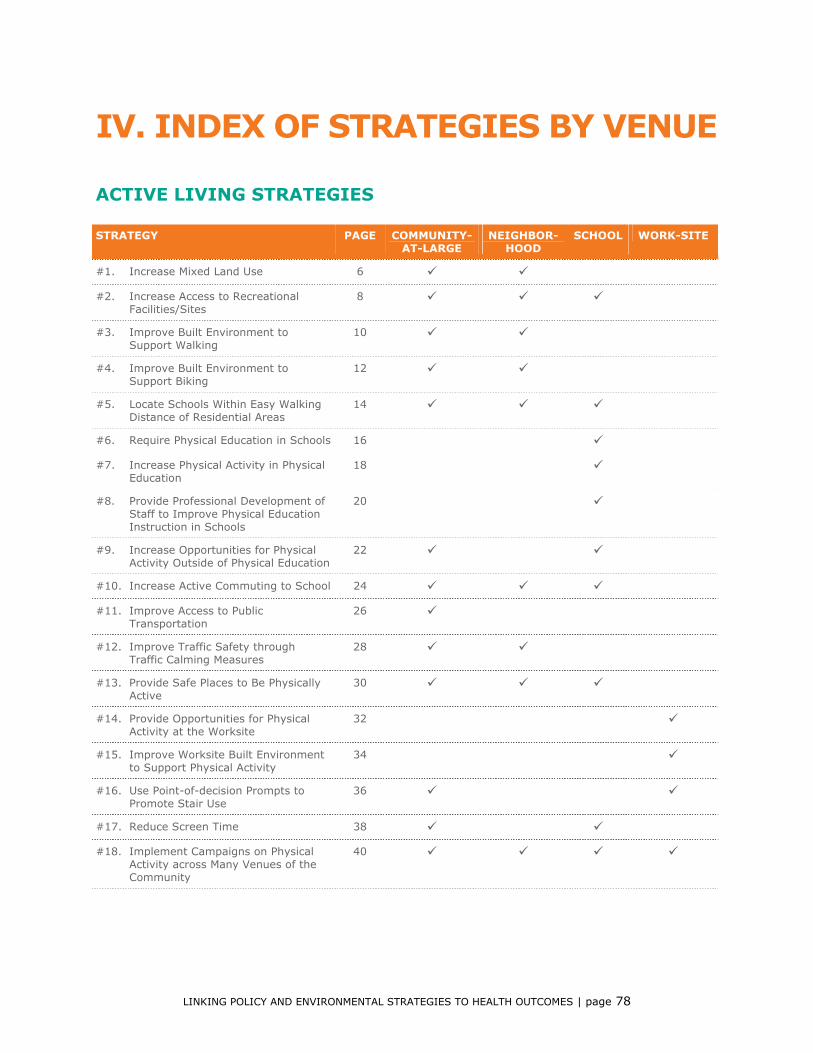
LINKING POLICY AND ENVIRONMENTAL STRATEGIES TO HEALTH OUTCOMES | page 78
IV. INDEX OF STRATEGIES BY VENUE
ACTIVE LIVING STRATEGIES
STRATEGY PAGE COMMUNITY-AT-LARGE
NEIGHBOR-HOOD
SCHOOL WORK-SITE
#1. Increase Mixed Land Use 6
#2. Increase Access to Recreational Facilities/Sites
8
#3. Improve Built Environment to Support Walking
10
#4. Improve Built Environment to Support Biking
12
#5. Locate Schools Within Easy Walking Distance of Residential Areas
14
#6. Require Physical Education in Schools 16
#7. Increase Physical Activity in Physical Education
18
#8. Provide Professional Development of Staff to Improve Physical Education Instruction in Schools
20
#9. Increase Opportunities for Physical Activity Outside of Physical Education
22
#10. Increase Active Commuting to School 24
#11. Improve Access to Public Transportation
26
#12. Improve Traffic Safety through Traffic Calming Measures
28
#13. Provide Safe Places to Be Physically Active
30
#14. Provide Opportunities for Physical Activity at the Worksite
32
#15. Improve Worksite Built Environment to Support Physical Activity
34
#16. Use Point-of-decision Prompts to Promote Stair Use
36
#17. Reduce Screen Time 38
#18. Implement Campaigns on Physical Activity across Many Venues of the Community
40
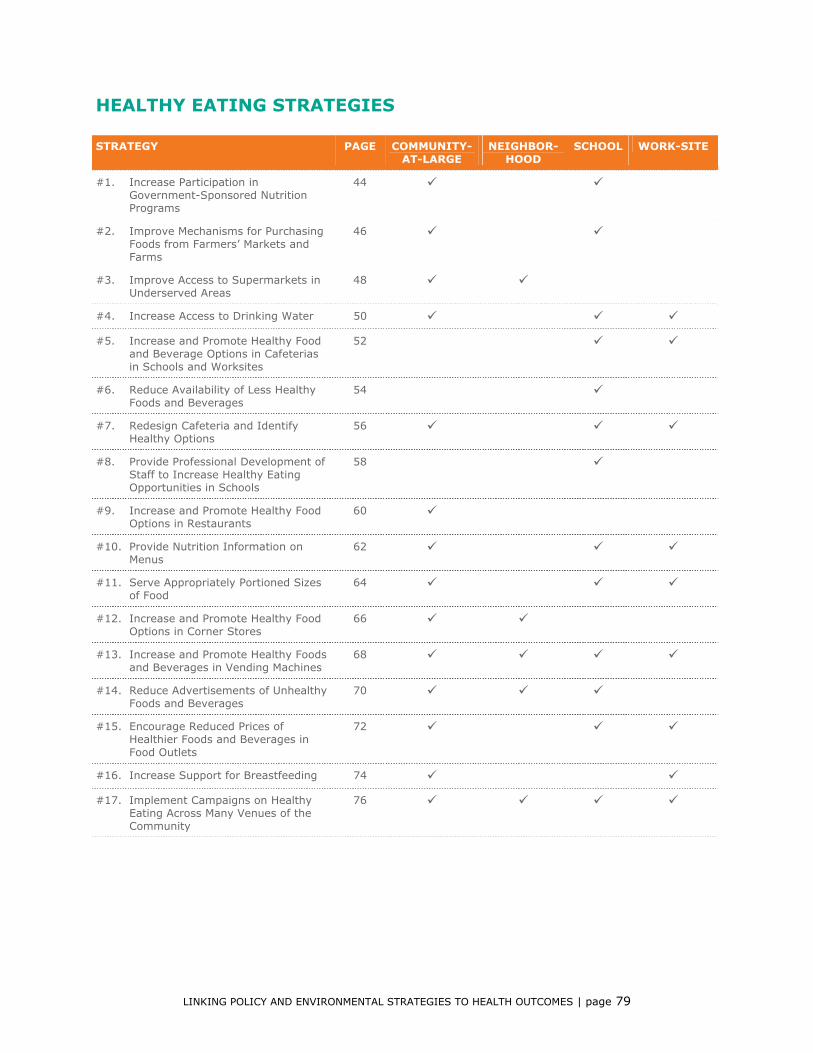
LINKING POLICY AND ENVIRONMENTAL STRATEGIES TO HEALTH OUTCOMES | page 79
HEALTHY EATING STRATEGIES
STRATEGY PAGE COMMUNITY-AT-LARGE
NEIGHBOR-HOOD
SCHOOL WORK-SITE
#1. Increase Participation in Government-Sponsored Nutrition Programs
44
#2. Improve Mechanisms for Purchasing Foods from Farmers’ Markets and Farms
46
#3. Improve Access to Supermarkets in Underserved Areas
48
#4. Increase Access to Drinking Water 50
#5. Increase and Promote Healthy Food and Beverage Options in Cafeterias in Schools and Worksites
52
#6. Reduce Availability of Less Healthy Foods and Beverages
54
#7. Redesign Cafeteria and Identify Healthy Options
56
#8. Provide Professional Development of Staff to Increase Healthy Eating Opportunities in Schools
58
#9. Increase and Promote Healthy Food Options in Restaurants
60
#10. Provide Nutrition Information on Menus
62
#11. Serve Appropriately Portioned Sizes of Food
64
#12. Increase and Promote Healthy Food Options in Corner Stores
66
#13. Increase and Promote Healthy Foods and Beverages in Vending Machines
68
#14. Reduce Advertisements of Unhealthy Foods and Beverages
70
#15. Encourage Reduced Prices of Healthier Foods and Beverages in Food Outlets
72
#16. Increase Support for Breastfeeding 74
#17. Implement Campaigns on Healthy Eating Across Many Venues of the Community
76

YMCA OF THE USA 101 N Wacker Drive, Chicago IL 60606 800 872 9622 www.ymca.net