Embed Size (px)
Citation preview

Master Thesis for Business Administration
Making rational decisions about IT projects using
Enterprise Architecture
A case study conducted at ASML Netherlands N.V.
Author: N.M. Laarhuis
Institute: University of Twente, Enschede, The Netherlands
Graduation Company: ASML Netherlands N.V.
Place/Date: Eindhoven, 22 February 2016
Version: Final
First Supervisor: Dr. A.B.J.M. Wijnhoven
University of Twente, Faculty of Behavioural, Management and Social
Sciences (BMS)
Second Supervisor: Dr. Ir. L.L.M. van der Wegen
University of Twente, Faculty of Behavioural, Management and Social
Sciences (BMS)
Company Supervisor: Ir. H.G.A. ter Horst
ASML Netherlands N.V

Title page
Title: Making rational decisions about IT projects using Enterprise
Architecture
Sub-Title: A case study conducted at ASML Netherlands N.V.
Author: N.M. Laarhuis
Student number: ████████
Place/Date: Eindhoven, 22 February 2016
Master Program: Business Administration
Specialization: Information Management
Institute: University of Twente, Enschede, The Netherlands
Graduation Company: ASML Netherlands N.V.
Veldhoven, The Netherlands
First Supervisor: Dr. A.B.J.M. Wijnhoven
University of Twente, Faculty of Behavioural, Management and Social
Sciences (BMS)
Second Supervisor: Dr. Ir. L.L.M. van der Wegen
University of Twente, Faculty of Behavioural, Management and Social
Sciences (BMS)
Company Supervisor: Ir. H.G.A. ter Horst
ASML Netherlands N.V.

Version Information
Version: Date: Description: Author:
Final 22-02-2016 Final version N.M. Laarhuis
Distribution List
Name: Organization:
“If you can’t measure it, you can’t manage it”
-- William Edwards Deming (1900-1993),
American statistician, professor, author, lecturer and consultant

i
Acknowledgements
While writing this thesis, I realized that once I finished it one of the most beautiful periods in my life
would come to an end. During this period I have not only learned a lot, but I have also had some
wonderful experiences and met many interesting people. This thesis marks not only the completion of my
M.Sc. in Business Administration, but also of a memorable period at the University of Twente. However,
new challenges are already on the horizon: On 10 April I will become Graduate Analyst CRM at
Cognizant Technology Solutions. I would like to thank all of the people who made this eventually happen
for me.
During this final phase of my study, I have had the opportunity to work on my thesis at ASML
Netherlands N.V. I would first like to thank █████ ███████, Director of the OSI Department, for
giving me the opportunity to write my thesis at one of the world’s most interesting and inspiring
companies. Second, I would like to thank ██████ ███ █████, my supervisor at the company.
During my period at ASML, ██████ always had a clear view and vision regarding my thesis topic, and
I really enjoyed our fruitful discussions. His knowledge and background helped me to overcome some
difficult hurdles that I was really struggling with.
I would also like to thank both Fons Wijnhoven and Leo van der Wegen for their valuable academic
input. The great amount of time they invested in helping me to conduct this research had a significant
influence on the outcomes. The level of detail of their feedback showed how critically and attentively
they read each new version of my thesis, and they pushed me during every new feedback session to get
the maximum out of myself and this research by asking very pertinent questions.
Furthermore, I would like to thank ██████ ████ ████████, ██████ ███████, █████
█████████, ██████ ████████ and ██████ ███ ████ for the time they spent listening
to my story and for providing me with valuable feedback during our interviews. In addition, I would like
to thank the people who helped to create the enterprise architecture model I needed for my case study as
well as other people at ASML who provided me with interesting insights.
I had a great time at the OSI department of ASML while preparing my thesis. All of the intelligent,
inspiring and friendly people created an environment in which I could excel. I would especially like to
thank all of the people from the “PMO corner,” which is where I spent the most time. I will not quickly
forget the nice times we shared together.

ii
Last but not least, I would like to thank my family and friends. I am especially grateful to my parents and
my sister, whose great support and input have brought me to the point where I am today. While I was
working on this project, they were always willing to listen to my stories and explanations and to hear
about my progress. These conversations helped me to determine where I was heading, and I am pretty
sure I could not have done this without their help.
Eindhoven, February 2016
Nick Laarhuis

iii
Management summary
IT has transformed from supporting single activities to providing landscapes in which multiple
information systems support multiple activities and processes. A result is that IT has become increasingly
interwoven with organizations. Many organizations still see IT as a cost center driven on efficiency
instead of using the capabilities it offers to position themselves as business enablers.
One of the critical topics linked to this is IT valuation; how exactly can organizations create business
value from their IT investments? Most organizations struggle with the complexity associated with IT
investment decisions. Choices based on as many alternatives and criteria as possible would probably lead
to the most convenient outcome. Such a pure rational approach is hardly possible in practice given that
alternatives and criteria are not always available or clear to the decision-maker. In addition, people do not
have the capacity to process the vast amount of information related to IT investments. A consequence is
that decision-makers rely on less rational ways of decision-making and do not base their choices on
complete information. This is mostly the moment when political processes pre-dominate the decision-
making process. ██ ██ ████ ███ ████ ██ ████ ████ ███ ███ ███████████
█████ ███ ██████████ █████████ ██ ██████ █████████, ███ ██ ████ ██
██ ███ ██████ █████ ███ ███████ ██████████ ██████ ██████████ ████
██████ ███████████ ███ ███ ██.
The literature research revealed that in order to create IT-based value from an IT investment, enterprise
architecture is an important part of the solution. For the most part, IT investments do not create business
value directly; they instead do so indirectly by enhancing processes. Enterprise architecture, and more
specifically the modeling language of ArchiMate, offers organizations an opportunity to create a holistic
overview of their organization and make the relations between the organizational goals, business
processes and the supporting IT transparent.
While political processes are considered to have bad influences on organizational performance, it is
necessary to achieve a better balance between rationality and political processes. Increasing rationality in
the decision-making process can establish a better balance, but political processes can never be fully
erased. As stated before, people are not purely rational given that they are limited by their reasoning
capacity. This limitation does not preclude the enhancement of rationality by so-called “rationality
carriers.” It is known that the complexity surrounding IT investments makes it eventually difficult to
make well-informed and founded investment decisions.

iv
We could thus try to eliminate parts of the complexity and simplify the process; alternatively we could
also follow the approach of this thesis and keep the process as rational as possible by increasing the
reasoning capacity of the decision-maker. Different methods to prioritize an IT investment portfolio are
presented in this thesis. However, none of them fully meets all of the requirements. They provide us with
a good direction to work in, but a new multi-criteria approach based on enterprise architecture is
proposed.
In order to determine if the proposed method fulfills the expectations, it is tested in at ASML. The case
study is two folded: it includes both semi-structured interviews and a practical application of the method.
The interviews are split into two groups: people who should work with the method (prepare the decision)
and people who should base their investment decisions on more comprehensive information provided
through the proposed method. To add value to the practical application component of the study, a
workshop with the participants of the former group was arranged.
The ASML case study revealed that the proposed method in this thesis has the ability to increase
rationality in the decision-making process and thereby decrease the less rational parts (e.g. political
processes). Following such a procedural rational approach has the ability to increase the quality of IT
investment decisions. However, to maintain objectivity strict guidelines are necessary using the proposed
method. The case reveals also that the proposed method requires a certain maturity level to be able to
make decisions.

Table of contents
List of figures ............................................................................................................................... vii
List of tables................................................................................................................................ viii
1. Introduction ............................................................................................................................... 1
1.1 Problem statement ............................................................................................................................... 1
1.1.1 Objective ....................................................................................................................................... 5
1.2 Central research question .................................................................................................................... 5
1.2.1 Research questions ........................................................................................................................ 5
1.3 Motivation ........................................................................................................................................... 5
1.3.1 Relevance for the scientific community ....................................................................................... 5
1.3.2 Relevance for ASML Netherlands N.V. ....................................................................................... 6
1.4 Research method ................................................................................................................................. 6
1.5 Scope ................................................................................................................................................... 8
1.6 Document structure ............................................................................................................................. 8
2. Literature review .................................................................................................................... 10
2.1 Decision-making process .................................................................................................................. 10
2.2 Decision-making ............................................................................................................................... 13
2.3 Lack of reasoning capacity ................................................................................................................ 17
2.4 Lack of knowledge and information.................................................................................................. 18
2.5 Complexity of IT investment decisions ............................................................................................. 20
2.5.1 Ways to reduce complexity ........................................................................................................ 22
2.5.2 Ways to increase reasoning capacity .......................................................................................... 26
2.6 Conclusion ......................................................................................................................................... 39
3. Proposed method ..................................................................................................................... 40
3.1 Process steps ...................................................................................................................................... 41
3.2 Excel tool ........................................................................................................................................... 46
4. Evaluation of the investment decision method ..................................................................... 53
4.1 Case study and methodology ............................................................................................................. 53
4.1.1 Objectives ................................................................................................................................... 54
4.1.2 Scope .......................................................................................................................................... 54
4.1.3 Timeframe................................................................................................................................... 55
4.1.4 Sampling method ........................................................................................................................ 55

4.1.5 Research material ........................................................................................................................ 56
4.2 Difficulties/problems encountered .................................................................................................... 56
4.3 Semi-structured interviews ................................................................................................................ 57
4.4 Practical application (unscheduled down process)/workshop ........................................................... 60
4.5 Results ............................................................................................................................................... 62
5. Conclusions and recommendations ....................................................................................... 63
5.1 Conclusions ....................................................................................................................................... 63
5.2 Next Steps for ASML ........................................................................................................................ 66
5.3 Future research .................................................................................................................................. 68
6. References ................................................................................................................................ 70
Appendix A: Enterprise architecture and modelling language ArchiMate ........................... A
Appendix B: Determining the importance scores for Bedell’s method .................................. D
Appendix C: Explanation of the calculations made Bedell’s method ...................................... E
Appendix D: Sample calculation of Bedell’s method ................................................................. I
Appendix E: Case description of a fictitious power utility firm .............................................. Q
Appendix F: Visual representation of the investment options................................................. U
Appendix G: Detailed process steps semi-structured interviews ........................................... W
Appendix H: The process used to execute unscheduled and scheduled maintenance (ASML)
...................................................................................................................................................... AA
Appendix I: Result of the workshop session at ASML ........................................................... BB

vii
List of figures
Figure 1 - Translating IT investment into IT based value using mediating factors ..................................... 2
Figure 2 - IT investment translated into IT based value and reverse by EA ................................................. 4
Figure 3 - Relationships among ISDT components ...................................................................................... 6
Figure 4 - Example of a decision-making process (procedural rationality) ................................................ 11
Figure 5 - Lack of rationality in decision-making ...................................................................................... 13
Figure 6 - Decisions vs. outcomes ............................................................................................................. 14
Figure 7 - The decision quality chain ......................................................................................................... 15
Figure 8 - Complexity of IT investment decisions...................................................................................... 21
Figure 9 - Mirror roles between business and IT at KLM ......................................................................... 25
Figure 10 - Example of project dependencies ............................................................................................ 27
Figure 11 – Example of a pairwise comparison matrix ............................................................................. 29
Figure 12 - Different levels mentioned in Bedell’s method (1985) ........................................................... 31
Figure 13 - Strategic importance vs. Effectiveness .................................................................................... 32
Figure 14 - Overview of Bedell’s method. ................................................................................................ 33
Figure 15 - Generalized rule for calculating effectiveness ........................................................................ 34
Figure 16 - Generalized rule for calculating importance ........................................................................... 35
Figure 17 – The core ArchiMate framework extended with business goals ............................................... 36
Figure 18 - Example of an extended version of Bedell’s method (Fictitious case) ................................... 38
Figure 19 - Comparison of current prioritization methods ......................................................................... 40
Figure 20 - Architecture model fictitious case Swedish power utility firm ................................................ 42
Figure 21 - PIs in high-performance computation service .......................................................................... 43
Figure 22 - Examples of influence rates (i.e. MCA weights) ..................................................................... 43
Figure 23 – Example scoring matrix .......................................................................................................... 44
Figure 24 - Start screen of the Excel tool (adding services and performance indicators) ........................... 47
Figure 25 - Visual representation of the PIs in the KPI reporting tool ....................................................... 48
Figure 26 - Formula builder in KPI reporting tool ...................................................................................... 49
Figure 27 - KPI tree within the ASML KPI reporting tool (causal model) ................................................ 50
Figure 28 - Scores of current situation and investment options .................................................................. 51
Figure 29 - Adding investment options....................................................................................................... 51
Figure 30 - Result screen (scores) ............................................................................................................... 52
Figure 31 - Result screen (portfolios) ......................................................................................................... 52
Figure 32 - Level 1 ASML process map / portfolio domain of OSI ........................................................... 54
Figure 33 - Maturity levels CMMI ............................................................................................................. 66
Figure 34 - CMMI Model for IT investment decision-making ................................................................... 67
Figure 35 - Capability Maturity Model Integration .................................................................................... 67
Figure 36 - High-level roadmap to increase maturity level ........................................................................ 68

viii
List of tables
Table 1 - Governance principles and practices at KLM ............................................................................ 24
Table 2 - Notations used in the real option model ..................................................................................... 28
Table 3 - Participants interviews ................................................................................................................. 56
Table 4 - Stakeholders within CS/IT ........................................................................................................... 56

1
1. Introduction
This chapter introduces the topic of this thesis, namely: prioritizing a portfolio of IT projects using
enterprise architecture. The problem statement is first placed into a theoretical context (1.1); thereafter the
research goal of this thesis and how it can be achieved by answering the research questions are presented
(1.2). Then main theories and concepts from the scientific literature and the extent to which this research
contributes to the literature base are also described. As this research is conducted with a case study at
ASML Netherlands N.V., an explanation of the relevance for this company is also provided (1.3). The
research method used for this research is explained next (1.4), followed by the scope (1.5) and general
structure of this thesis (1.6).
1.1 Problem statement
In the 1990s, IT started to become increasingly important for organizations. The serious expansion of IT
from those early days until now has provided organizations with great potential to increase their
performance. One of the critical issues over time has been: exactly how organizations can create business
value from their IT investments (Mukhopadhyay, Kekre, & Kalathur, 1995).
In general, deciding what investments an organization should make can be a difficult task. When it comes
to IT investments, it is even more difficult. This is related to the fact that the costs and benefits
corresponding to IT investments are hard to both identify and quantify. In addition to the tangible factors,
there are also significant intangible factors that influence these investments (Powell, 1992).
Kohli and Grover (2008) provide us with the term “IT Valuation” to describe the research stream dealing
with the relation between IT and organizational performance. Their research started with the thesis that
“IT with its complementary resources can create value manifested at different levels and, while causality
is elusive, we can understand how to create differential value by extending our knowledge of
complementary and mediating factors in the value creation process” (Kohli & Grover, 2008, p. 27). This
relationship is illustrated in the simple flow chart below (see figure 1). In order to create different types of
value and at different organizational levels, we need a better understanding of how IT investments
interact with these mediating factors (e.g. organizational changes, complementary resources, alignment,
capabilities) (Kohli & Grover, 2008).

2
Figure 1 - Translating IT investment into IT based value using mediating factors (Kohli & Grover, 2008)
Buschle and Quartel (2011) complement this by saying that IT usually does not directly contribute to a
company’s goals and requirements, but rather indirectly to accomplishing them. A holistic overview of
the organization is necessary for achieving the right evaluation of IT project proposals (Buschle &
Quartel, 2011).
During the last decade, most large organizations spent up to almost 90% of their IT budgets on
maintaining their current IT infrastructure (Quartel, Steen, & Lankhorst, 2010). This resulted in only a
small piece of the financial pie remaining for innovative IT projects. The underlying trend was that most
organizations saw (and still see) their IT as a cost-center instead of a value-center (Venkatraman, 1997).
This view results in IT budget allocation being based mainly on the efficiency and cost criteria of the
accompanying IT artifact.
If organizations look at IT value instead of IT costs it should be possible to determine the extent to which
IT investments contribute to their organizational goals (Quartel, Steen, & Lankhorst, 2010). Powell
(1992) already mentioned a significant presence of intangible benefits that makes IT project valuation
more challenging. In addition to these intangible benefits, the current interconnectedness of all different
kinds of IT within an organization makes it difficult to assign certain value to an IT artifact. This was
easier in the past, as information systems typically supported only one single process. These days, IT
applications and services support various business activities that in turn contribute to different business
goals (Powell, 1992) (Quartel, Steen, & Lankhorst, 2010). Judging from the fact that IT is continuing to
become increasingly important for organizations, an improvement in IT will almost certainly result in an
improvement of the organization.
Since IT often plays supporting role, it generates few to no direct revenue streams. As a result, the value
of IT should be derived from the processes it supports. The valuation of IT can be complex given that IT
can be used by several processes and in different activities and that this complexity can become greater
when an organization’s dependency on IT increases.

3
Because it is very difficult to value IT investments, rational multi-criteria analysis (MCA) approaches are
often ignored and replaced with more political processes. Eisenhardt and Bourgeois (1988) define politics
as: “the observable, but often covert, actions by which executives enhance their power to influence a
decision. These actions include behind-the-scenes coalition formation, offline lobbying and cooptation
attempts, withholding information, and controlling agendas” (Eisenhardt & Bourgeois, 1988, p. 737).
This definition is appropriate within the context of ASML. The Operational Structural Improvements
(OSI) department of ASML is responsible for executing all (not product related) structural improvement
projects Operations & Order Fulfillment activities. Final decisions concerning which projects will be
included in the OSI portfolio are not based purely on rational grounds and might be influenced by
political processes. These decisions are made by vice-presidents of the company’s operational areas for
which OSI executes projects and programs (i.e. Planning, Logistics, Productions, Customer Support,
Quality and Process Improvements and Facility Management) (ASML Information Manager Customer
Support, September 9, 2015). These individuals all have their own views on “what is best for ASML,” but
they cannot be expected to have the overview or expertise required to place IT investments in their full
context. Technical details related to IT investments are difficult to interpret for many people, which make
it difficult for the IT side to make a case. The eventual decision-makers’ lack of expertise could
negatively influence the quality of their decisions. In addition to the earlier mentioned political processes,
the IT side also has difficulties placing investment options in a proper context, which makes it difficult for
them to express their full value (Mukhopadhyay, Kekre, & Kalathur, 1995).
Current decision support tools are usually not sufficient to provide a complete picture of a certain IT
investment’s contribution to the organization. Traditional cost-benefit analyses are mostly insufficient
given that they do not take the managerial flexibility that is inherent in IT investment options into
account. Managerial flexibility is defined as “responding to a change or new situation in business
conditions” (Angelou & Economides, 2008, p. 479). In addition, some prioritization methods which I will
discuss in the literature part of this thesis do not account for intangible benefits, risks or other factors
related to IT investments (Angelou & Economides, 2008). Other research in this field reveals several
methods, but none of them provides an accurate overview of these investments’ mutual dependencies and
interaction with the current IT landscape (Bardhan, Bagchi, & Sougstad, 2004) (Buschle & Quartel,
2011).

4
This brings us back to the earlier mentioned thesis of Kohli and Grover (2008), which stated that
companies will be better capable of understanding the way an IT investment eventually generates
business value. In this research the mediating factors will be clarified using another current IT topic
namely enterprise architecture (EA) (Quartel, Steen, & Lankhorst, 2010). Figure 2 shows how the
mediating factors are expressed in EA and how IT investments could result in IT based value.
Figure 2 - IT investment translated into IT based value and reverse by EA
Using the modeling framework of EA enables us to determine the extra value IT investment can create on
the business side. It gives us the possibility to retrieve the contribution of such an investment on the
organization’s goals. When EA is used to represent the complementary and mediating factors in the value
creation process, causality no longer needs to be elusive.
The aim of the literature review is to provide us with an EA-based MCA method that enables a more
rationalist evaluation of investment options. The purpose of this approach is to increase rationality in the
decision-making process and thereby to decrease the influence of political processes, which should
eventually lead to a higher quality decision. Providing better insight into how IT investments contribute to
organizational goals will improve the cognitive ability of decision-makers and thus increase rationality
within the process.
In theory, this seems very logical and feasible. However, will the method proposed in this thesis be as
straightforward in the real world? The underlying questions are as follows: What obstacles do we face
when using the proposed method in a real life setting? How can we make the proposed method applicable
in practice? And last but not least, does using the proposed method eventually lead to better quality
decisions? These questions lead to the following research goal:

5
1.1.1 Objective
The aim of this research is to develop an MCA method for prioritizing a portfolio of IT investments using
EA. The research will evaluate the proposed method’s practicality and impact on decision-making.
1.2 Central research question
What is the contribution of an MCA approach that uses EA to prioritize IT projects?
1.2.1 Research questions
Sub-question 1: What is the current state of research on prioritizing a portfolio of IT investments using
MCA and EA?
Sub-question 2: How could current MCA methods, used in IT investment prioritization decisions, be
improved based on previously researched strengths and weaknesses?
Sub-question 3: Is the method developed using MCA and EA feasible for decision-makers?
Sub-question 4: What are the limits of a rational approach for IT investment decisions?
1.3 Motivation
1.3.1 Relevance for the scientific community
From a scientific point of view, this research contributes in three ways. First, it provides a detailed case
study of the difficulties with generating business value from IT investments. Next, it provides practical
approaches on how these difficulties could be overcome by using MCA and EA. Finally, it answers the
question: What is the contribution of an MCA approach that uses EA to prioritize IT projects?

6
1.3.2 Relevance for ASML Netherlands N.V.
At ASML the OSI department is responsible for all of the (non-product-driven) structural improvement
projects within Operations and Order Fulfillment. Operations comprise six different domains, each with
its own objectives and interests. Currently, decisions regarding what projects or programs to incorporate
into the OSI portfolio are not based on full knowledge. By using an EA-based approach, ASML will be
better able to show why certain investment options contribute more to organizational goals, thereby
making the eventual decision more obvious for all stakeholders involved in the decision-making process.
1.4 Research method
The general structure of this research is based on information system design theory (ISDT). In a paper
published in 1992, Walls, Widmeyer and El Sawy advocate the use of design science concepts for
research in areas such as engineering, architecture, arts and information systems. According to these
researchers, the goal of a theory based on the design concept is “to prescribe both the properties an
artifact should have if it is to achieve certain goals and method(s) of artifact construction” (Walls,
Widmeyer, & El Sawy, 1992, p. 41).
Design theories show how explanatory, predictive or normative theories can be put to practical use. If an
artifact that embodies the laws of interaction of an explanatory or predictive theory is designed and
constructed, and that artifact then satisfies its design requirements, then it provides a measure of empirical
support for theory (Walls, Widmeyer, & El Sawy, 1992). Figure 3 gives the relation between the
aforementioned concepts.
Figure 3 - Relationships among ISDT components

7
Walls et al. define design as both a product and a process. As a product, design is "a plan of something to
be done or produced,” whereas as a process it is a way to conceive a particular artifact that satisfies all
requirements (Walls, Widmeyer, & El Sawy, 1992, p. 42). This thesis elaborates on prioritization
methods for IT investments using a product oriented design theory constituting of kernel theories,
meta-requirements and meta-designs. Finally, the evaluation of the key design propositions is done using
a case study at ASML.
The following descriptions are used in the product oriented design theory approach:
Kernel theories: Theories that are well established and recognized by the natural and social sciences and
that will influence the meta-requirements. The literature review provides us with different approaches to
prioritize a portfolio of IT projects. These approaches are used as kernel theories to identify the meta-
requirements in the subsequent step. This should provide an answer to the first research question: what is
the current state of research on prioritizing a portfolio of IT investments using MCA and EA?
Meta-requirements: Meta-requirements describe the class of problems addressed in the research. Kernel
theories are used to establish the prioritization requirements, which are in turn used to develop a method
that is based on MCA and uses EA.
Meta-design: Meta-design involves the construction of design science-based theories that describe
possible artifacts or classes of artifacts that satisfy the meta-requirements. Design components are
established from the earlier identified requirements. This answers the second question: how could current
MCA methods, used in IT investment prioritization decisions, be improved based on previously
researched strengths and weaknesses?
Testable design product propositions: Elements that can be tested to determine if what was defined in the
meta-design stage satisfies the set of meta-requirements that were established to construct theories in the
second step of the research. In order to evaluate the key design propositions, the proposed method will be
integrated into an Excel tool (i.e. artifact) and tested in a case study at ASML. The case contains two
components. The first part consists of a practical application of the method. In the second part,
stakeholders are confronted with the proposed approach (i.e. semi-structured interviews). The case study
can be used to answer the third and fourth questions, namely: is the method developed using MCA and EA
feasible for decision-makers? And what are the limits of a rational approach for IT investment decisions?
8
A convenience sample (i.e. a sample that is easy to attain) is used for the case study. In this instance, the
sample contains stakeholders ASML’s Customer Support (CS) process and a simplified version of that
process. I chose this particular process because my ASML supervisor’s network made it easy for me to
make CS contacts in the company, while time constraints led me to select convenience sampling. In the
sample I defined two different groups:
Content group: These individuals should be able to work with the proposed method (i.e. they prepare the
decisions).
Decision group: These individuals should be able to make prioritization decisions based on the
information provided using the method (‘i.e. they are involved in the eventual decision’).
1.5 Scope
The practical application at ASML is done using a simplified version of the unscheduled down process
(USD), which is a sub-process within CS. Conducting semi-structured interviews with content and
decisions groups within CS should make it clear if this approach is feasible and what its impact will be on
the quality of decisions. It should be noted that this is the first time that the method is tested in practice.
This case can therefore be seen as a first attempt to evaluate its feasibility and impact on decision quality.
1.6 Document structure
Chapter 2 – Literature review
As mentioned earlier, the literature review is used to demonstrate the current knowledge base available on
decision-making surrounding IT investments. This chapter is constructed as follows. It starts by
describing decision-making in general as well a framework for decision quality that is commonly used at
ASML. It then describes two ways in which complexity surrounding IT investments can be addressed
(one that follows the rational approach and another that focuses on less rational possibilities). These two
options are then described using current prioritization methods that are found in the literature.

9
The chapter ends with a summary of the requirements for the proposed method. This chapter answers the
first research question: what is the current state of research on prioritizing a portfolio of IT investments
using MCA and EA?
Chapter 3 – Proposed method
This chapter describes the MCA method that is based on EA and should meet the requirements outlined
within the literature review. It contains both a general description and concrete process steps that are to be
followed when using this approach. This chapter also elaborates on the Excel tool (i.e. artifact) that
incorporates the proposed method and supports the calculations that it requires. This chapter provides an
answer for research questions two: how could current MCA methods, used in IT investment prioritization
decisions, be improved based on previously researched strengths and weaknesses?
Chapter 4 – Evaluation of the investment decision method
Chapter 4 starts with a clear description of the case study at ASML, including information of the specific
business process that is chosen to demonstrate the proposed method in a real world example. It also
provides information about the people who are incorporated into the case and the reason why they are
selected. The chapter ends with an operationalization of the proposed method and summaries of the semi-
structured interviews. The case study answers the third and fourth question, namely: is the method
developed using MCA and EA feasible for decision-makers? And what are the limits of a rational
approach for IT investment decisions?
Chapter 5 – Conclusions and recommendations
This chapter provides the answers to the general research question and sub-questions and offers
recommendations for other organizations that are searching for a rational method for decision-making.
For ASML, it describes the next steps the company is advised to follow if it decides to embrace this
method. The chapter ends with directions for future research in this field and suggestions as to how it
could build upon the foundation of this study.

10
2. Literature review
This literature review provides an overview of a common decision-making process and demonstrates how
the way that decision-makers pass through this process determines the eventual outcome. Given that the
focus of this thesis is on the decision-making process surrounding IT investments, the chapter also
elaborates on the complexity that is inherent in these particular investment decisions (which should clarify
the impact this complexity has on the decision-making process). The literature discusses two approaches
that an organization could use to deal with the complexity surrounding IT investments, namely:
complexity reduction or increasing ones information processing capacity. This separation is used to frame
the current prioritization methods available in the literature.
2.1 Decision-making process
As stated in the introduction, the focus of this thesis is on the decision-making process surrounding IT
investments. However, in order to better clarify exactly what this thesis is trying to improve, I begin with
a short introduction to the decision-making process and I show that how we pass through this process
determines the outcome.
Everyone has to make choices in their daily lives. What should I eat for dinner tonight? What will be the
best next step in my career? What is the best business strategy to follow? Every decision represents a
choice between alternative solutions (Dessler & Phillips, 2007). Saaty (2008) agrees with this and states
that everyone is a fundamental decision-maker. Whether consciously or unconsciously, everything we do
is the result of some decision.
Many people believe that problem-solving and decision-making are interchangeable given that most
decisions are prompted by a problem (although this is not always the case; for instance, we may have two
job offers to choose from) (Dessler & Phillips, 2007). As stated by Tversky and Kahneman (1981): “A
decision problem is defined by the acts or options among which one must choose, the possible outcomes
or consequences of these acts, and the contingencies or conditional probabilities that relate outcomes to
acts” (Tversky & Kahneman, 1981, p. 453).

11
Developing and analyzing alternatives and eventually making a choice is recognized as the decision-
making process. Dean and Sharfman (1993) complement on this and define procedural rationality as
“the extent to which the decision-process involves the collection of information relevant to the decision
and the reliance upon analysis of this information in making the choice” (Dean & Sharfman, 1993, p.
589). From the aforementioned information, we should be able to define the following process steps that
are necessary to arrive at a decision:
1. Define the problem;
2. Clarify the objectives (i.e. criteria and weights);
3. Identify alternatives;
4. Analyze the consequences; and
5. Make a choice (i.e. decide).
Figure 4 gives a graphical representation of the five steps mentioned above.
Figure 4 - Example of a decision-making process (procedural rationality)
Not every decision-maker approaches the process in the same way. However, the way in which one
passes through the process will eventually determine the outcome. The example of someone looking for a
new job can be used to illustrate this. During a job search someone could choose to collect criteria related
to all of the available jobs, rank those criteria on importance and use logic and calculations to determine
what job will best suits him or her.
Pro
cedu
ral
Rat
ion
alit
y
Enterprise Architecture

12
While doing so would probably identify the job that suits best the needs of the job seeker, almost no one
uses such an approach. To make the decision easier, most job seekers limit the number of jobs (i.e.
alternatives) and criteria (e.g. will only consider flexibility, opportunities, security, reputation and salary).
Although this will still result in the “best” job within the limited set of alternatives being identified, not
restricting the set of alternatives would probably yield a job that even better matches the preferences.
Another job seeker could ignore this optimizing process and just pick a job because it gives him or her
best feeling or offers the highest salary. The same process is still being followed, but it is only based on
one single or two criteria and probably just a few alternatives.
Following the classical models of choice rationality means that the decision-maker has knowledge of all
the available alternatives and is able to compute the consequences of following each of these alternatives.
It also calls for certainty in the evaluation (both present and future) of the consequences and the ability to
compare these consequences no matter how diverse and heterogeneous they may be (Simon, 1979).
Rationality (i.e. choice rationality) is discussed more in-depth in later parts of this chapter. However, in
order to see how the rational method proposed in this thesis will alter the decision-making process, it is
helpful to keep this description of rationality in mind.
Given that decision-making is a research field in itself; I believe it is necessary to explain what is within
the scope of this thesis (i.e. what parts of the decision-making process I want to improve) and what is
beyond it. The research will not offer guidelines for determining which alternatives (i.e. IT investments)
organizations should consider. Furthermore, although it is also not within the scope of this research to
prescribe protocols for determining criteria and weights, I do briefly discuss them below seeing as I need
them in order to properly apply the proposed method during the case study.
The theme throughout this research concerns the rationalistic and political processes and the desirability
of both. I now elaborate on the parts of the decision process that this research is attempting to improve.
Structuring the decision-making process along the lines of EA will alter the decision-making process as
follows:
- It gives the decision-maker the obligation to consider more alternatives; and
- It clarifies and structures the criteria and weights used in the decision-making process.
Later chapters clarify how this is reflected in the proposed method and provide sufficient information to
place this research into a proper context.

13
2.2 Decision-making
I mentioned in the previous part that the way in which decision-makers navigate the decision-making
process determines the eventual outcome of that process. The literature provides us with various ways in
which decision-makers run through the decision-making process. Before going deeper into rational
decision-making, I start with an overview of the most well-known approaches to the decision-making
process.
Several papers discuss the different ways in which people approach the decision-making process
(Eisenhardt & Zbaracki, 1992) (Ranganathan & Sethi, 2002). Simon (1955) explains at one end the more
rational process, using a linear three-stage model of intelligence, design and choice (Simon, 1955). On the
other end is the garbage can model provided by Cohen, March and Olsen (1972), which could be best
described as organized anarchies. In this model, decision-making processes are chance events that happen
due to the confluence of opportunities, problems and solutions, and people (Cohen, March, & Olsen,
1972). Alternatively, Pettigrew (1973) and Eisenhardt and Bourgeois (1988) suggest that the decision-
making process is a political process of bargaining and negotiating between the decision-makers. In this
view organizations could be recognized as collections of individuals with different goals (Pettigrew,
1973) (Eisenhardt & Bourgeois, 1988). Generally speaking, decision-making processes have two distinct
dimensions, namely rationality and politics (Dean & Sharfman, 1993) (Ranganathan & Sethi, 2000).
The decision-making processes surrounding IT-investments have been investigated by many researchers
in recent years. In relation to making complex decisions, managers often do not rely on rationality when
reaching certain outcomes (Bannister & Remenyi, 2000). Despite the fact that both rational and political
elements are found in practice, non-rational practices still dominate IT investment decisions; this might
also be the case at ASML. Although decisions makers are intentionally rational, they are constrained by
their reasoning capacity and incomplete information, which result in less completely rational decisions
(Ranganathan & Sethi, 2002). Figure 5 provides a graphical representation of this division. I will discuss
both issues in next parts of this chapter.
Figure 5 - Lack of rationality in decision-making

14
The study by Dean and Sharfman (1996) focused mainly on the influence process of making a decision
has on decision-making effectiveness, and they found significant evidence that the process influences the
outcome. Different processes lead to different choices, which is to say that decision-making processes
influence the choices an organization make. And while different choices lead to different outcomes, not
all outcomes are equally good (Dean & Sharfman, 1996).
Before going into the process of “good decisions”, it is necessary to understand the difference between
decisions and outcomes. Good decisions can have both good and bad outcomes, as can bad decisions. It is
logical that we expect our good decisions to yield more good outcomes than bad outcomes (and vice versa
when we make bad decisions). Figure 6 gives a good representation of these differences. As the common
saying goes, “a good decision never turns into a bad decision, and a bad decision never turns into a good
decision”. A decision has a quality at the time it is made, which clarifies why decisions are not judged on
their outcomes but rather on the process used to make them (Matheson & Matheson, 1998). This is
exactly what procedural rationality is about.
Figure 6 - Decisions vs. outcomes (Matheson & Matheson, 1998)
In order to demonstrate exactly what I try to improve with the proposed method, the decision quality
framework is used. This framework developed by practitioners associated with Stanford University and
the Strategic Decisions Group is a commonly used practice at ASML (ASML Senior Decision Support
Expert, October 23, 2015). According to this approach, the following six elements ultimately determine
the quality of decisions: framing, alternatives, information, values, logic and implementation. These
elements are depicted in figure 7. The eventual quality of the decision is as high as the quality of the
weakest of these six elements. Within each element, a quality level of 100% is defined as the point at
which marginal effort is not justified by the benefit it would produce (Keisler, 2011).

15
Figure 7 - The decision quality chain (Matheson & Matheson, 1998)
Decision-makers enhance the quality of decisions by executing their six decision rights (Matheson &
Matheson, 1998). These six elements may be described as follows:
1. Appropriate frame: A decision frame that structures a decision in the context most relevant to its
needs. The appropriate frame is the correct background, setting, and context for a decision.
2. Creative, doable alternatives: Creative alternatives that give a decision-maker the obligation to
select from viable and distinct choices. Creative, doable alternatives are preconditions for any
decision. If there are no alternatives, there is no decision.
3. Meaningful, reliable information: Relevant and reliable information upon which decision-makers
can base their decisions. It requires that the right information is brought to bear on the decision.
4. Clear values and trade-offs: Clear values and trade-offs are found by establishing criteria for
measuring the value of alternatives and how the company will make rational trade-offs among them.
5. Logically correct reasoning: Requires bringing together the inputs of the previous dimensions to
determine which alternatives will create the most value.
6. Commitment to follow-through: An effective decision leader who will gain alignment and be
committed to action. The best decision is useless if the organization will not implement it.

16
According to a decision support expert at ASML, the method proposed in this thesis will contribute to
three of these six dimensions: “the decision support tool developed in your research primarily focuses on
information (input for the tool), reasoning (calculations in the tool) and values (performance indicators in
the tool). Be aware that the eventual quality of the decision will be as high as the weakest of all six
elements, so don’t lose the other dimension out of sight” (ASML Senior Decision Support Expert,
November 12, 2015). As made clear earlier, the aim of this research is also to oblige the decision-maker
to consider more alternatives. In order to place decisions in the right setting and context enterprise
architecture serves as the appropriate frame. The proposed method therefore also contributes to the first
element of the decisions quality framework.
To understand how the proposed method in this thesis helps to increase rationality in the decision-making
process; the epistemological branch of philosophy must be considered. Epistemology is the study of
knowledge and justified belief (Steup, 2005), and rationalism is the movement within epistemology that
believes reason is the chief source of knowledge (Johnson & Christensen, 2014). Wijnhoven (2009) adds
that “rationalism is any view appealing to reason as a source of knowledge or justification” (Wijnhoven,
2009, p. 4). In this thesis I adhere to this view and state that reason should be the primary source of
judgment.
Enterprise architecture is used to create insight in the IT landscape and lay the foundation for the causal
model that helps to calculate the IT based value of certain IT investments. ArchiMate is the modelling
language used in this thesis and is particularly suitable to create the causal model. The chain of reasoning
made clear by ArchiMate provides the facts needed to prove that certain investment options are better
than others. The choice for the ArchiMate language is rather self-explanatory by the fact that other
frameworks such as TOGAF do not have a layered structure that can be used to install causal links. The
basics of both EA and modelling language ArchiMate are described in Appendix A.
From the previous we know that ArchiMate provide us with a holistic overview of an organization and
link IT to business and organizational goals. As proposed by Sarasvathy (2001), we can use the causal
chains visualized in ArchiMate in two ways: causation and effectuation. Causation is the process through
which an outcome is known and a mean is selected to create that outcome. The effectuation process works
the other way around: it focuses on a fixed set of means and selects between outcomes that could be
created by that set (Sarasvathy, 2001).

17
If we apply both causation and effectuation to the proposed method in this thesis, we could use the
causality chains in ArchiMate to create a causal model. The business goals could be recognized as fixed
outcomes that can be realized through supporting key performance indicators (KPI’s), which in turn could
be realized by the supporting application and infrastructure layer. For an effectuation process, the
causality could be used to identify new business that could be realized with the current architecture. For
the purpose of this thesis I focus on a causation process in which we prioritize certain (IT) investment
options to achieve given organizational goals.
From a theoretical perspective, this paragraph should clarify the impact the proposed method will have on
the quality of IT investment decisions. The following parts discuss the main reasons decisions-making
processes lack rationality, namely: lack of reasoning capacity and lack of knowledge and information.
2.3 Lack of reasoning capacity
According to Eisenhardt and Zbaracki (1992), decision-making processes could be best recognized as an
interweaving of both bounded rational and political processes. The decision-makers are bounded
rationally in that they are limited by their reasoning capacity but engage in a cycle among rational
decision-making steps.
March (1978) defines bounded rationality as “a normative sensible adjustment to the costs and character
of information gathering and processing by human beings” (March J. , 1978, p. 589). However, this
definition does not say anything about embedding rationality in technological artifacts or tools to support
actors in the decision-making process and thereby make them more rational than they actually look.
Cabantous and Grond (2011) talk about “rational carriers” that regulate and support decision-makers,
which I discuss more in-depth later on (Cabantous & Gond, 2011).
Lindblom discussed two types of decision-making (root vs. branch) back in 1959. The root method is
completely rational and involves decisions being made at the root of the problem. At that time Lindblom
already recognized that this complete rational method does not work given that people are bounded
rational and that organizational problems are too complex. On the other side he mentioned the branch
method (a successive limited comparison). In this method, decisions are made in small steps and the
results of each previous act are checked before the next step is taken.

18
As one must wade through the mud and large steps are not possible, Lindblom dubbed this the “muddling
though” method. Decision-makers should make use of the root method, although they should also keep in
mind that it may not be feasible in practice (Lindblom, 1959).
Researchers like March (1978) and Gigerenzer (2008) state that in general, people in complex situations
do not have the reasoning capacity to make purely rational decisions and therefore looking for other
options (March J. , 1978) (Gigerenzer, 2008). The fact that decision-makers lack reasoning capacity
causes decision-makers to rely on other ways to approach the process, such as politics or heuristics.
Researchers such as Gigerenzer (2008) have found evidence that supports heuristics; indeed Gigerenzer
states that heuristics will even lead to higher decision outcomes then rational optimization.
“A heuristic is a strategy that ignores part of the information, with the goal of making decisions more
quickly, frugally, and/or accurately than more complex method” (Gigerenzer & Gaissmaier, 2011, p.
454).
In later parts of this chapter I discuss a few generally accepted social heuristics that can be used as mental
shortcuts easing the cognitive load of the decision-maker.
2.4 Lack of knowledge and information
In addition to the fact that decision-makers are constraint by their reasoning capacity, it is known that
ratio is not evident in many decision-making processes. When decisions are made in fuzzy environments,
the goals and/or constraints in the decision-making process are usually vague and the boundaries of
decision alternatives are not defined sharply. In real-world decision-making, such an environment nearly
always prevails. Decisions are based on alternatives whose goals, constraints and consequences are not
precisely known (Bellman & Zadeh, 1970).
Gigerenzer and Gaissmaier (2011) add that there are two types of worlds: small and large. In the small
world, all relevant alternatives, their corresponding consequences and probabilities are known; the future
is certain. In contrast, the large world could be recognized as the aforementioned fuzzy environment of
Bellman and Zadeh (1970).

19
In this latter situation, some relevant information is unknown (or must be estimated from samples) and the
future is uncertain (Gigerenzer & Gaissmaier, 2011) (Bellman & Zadeh, 1970). Both Savage (1954) and
Simon (1979) emphasize that in large world situations, we could no longer assume that rational models
automatically provide the best solution (Simon, 1979) (Savage, 1954).
Decisions often follow the desires and subsequent choices of the most powerful people. People attempt to
change the power structure by engaging in political tactics such as coalition formation, cooptation, the
strategic use of information and the employment of outside experts (Eisenhardt & Zbaracki, 1992).
Within organizations a typical source of political behavior is the conflicting objectives stakeholders have.
Business managers regularly use several tactics to influence IT appraisals (Berghout, Nijland, & Grant,
2005). According to Eisenhardt and Zbaracki (1992), people in the political model are rational on an
individual level but not so collectively. Organizations could be recognized as coalitions of people with
competing interests. Although they share the same overall goals (such as profitability), they also have
conflicting interests. In nearly every group decision, it is ultimately the most powerful group member that
determines the outcome (Eisenhardt & Zbaracki, 1992).
Berghout et al. argue that “rationalism or counter tactics may counteract influence techniques in an
attempt to get behind the cloak and dagger side of organizations power and politics, but politics and
power in decision-making cannot and should not be filtered out” (Berghout, Nijland, & Grant, 2005, p.
31).
There are several studies that provide support that decisions taken within organizations reflect the
preferences of powerful people or groups (Hills & Mahoney, 1978) (Pfeffer & Moore, 1980) (Pfeffer &
Salancik, 1974). Some studies state that politics are common in IT investment decisions and some even
posit that power and politics could not be eliminated from these decisions completely (Ranganathan &
Sethi, 2000) (Berghout, Nijland, & Grant, 2005). It has been shown that politics could have a negative
influence on an organization’s performance. Several case studies conducted by Einsenhardt and
Bourgeois (1988) provide evidence that reducing politics could have positive effects on the efficiency and
profitability of organizations (Eisenhardt & Bourgeois, 1988).

20
Dean and Sharfman (1996) complement Eisenhardt and Bourgeois (1988) by providing evidence that
managers who collect information and use analytical techniques make more effective decisions than the
managers who do not. In addition, managers who engage in politics and power or push hidden agendas
are less effective than those who do not (Dean & Sharfman, 1996).
In some decision-making processes it is known that ratio is completely ignored. Janis (1972, 1982)
mentioned “groupthink” as an example of a situation in which this is the case. Groupthink can be seen as
the desperate drive to reach consensus on a decision within a group at any cost. When concurrence-
seeking becomes dominant in a cohesive in-group, it tends to override realistic the appraisal of alternative
courses of action. In such situations it is clear that most ratios are ignored in the eventual decision (Janis,
1972) (Janis, 1982).
2.5 Complexity of IT investment decisions
According to Ranganathan and Sethi (2002), taking as many alternatives and variables as possible into
account would increase the rationality of the decision-making process (Ranganathan & Sethi, 2002).
However, the problem with rationality and the reason why many organizations instead rely on politics
emerges here.
In the introduction to this thesis the complexity surrounding IT investment focuses mostly on the
difficulty of establishing and defining the different factors (both tangible and intangible) attached to such
investments. Kohli and Grover (2008) note that it is also hard to find the relation between an IT
investment on one end and business value on the other (Powell, 1992) (Kohli & Grover, 2008).
Furthermore, IT investment decisions are often made by decision-makers who do not have any
background in IT; for them it is even more difficult to gain insight in the effect that certain investments
might have.
Additionally, causes the large number of variables, alternatives and relations between them needed for
rational decision-making this “classic” complexity. The theory of bounded rationality tells us the same
story: it states that an attempt to be rational is bounded (or limited) by the enormous complexity of these
decision problems (Meijer, 1998).

21
We humans are not able to process the large amount of complex information needed for rational
decisions, which Simon (1955) refers to as our limited reasoning capacity. On a similar note, March
(1978) states that people are limited by their cognitive capabilities (Simon, 1955) (March J. , 1978).
As stated by Bannister and Remenyi (2000), there is currently a limit on the rationality employed in the
decision-making process surrounding IT Investments. A few reasons have already been mentioned;
however, the limitations of the existing valuation methods used in IT investment decisions also force
decision-makers to rely on “gut feelings” (Bannister & Remenyi, 2000).
The literature provides two main movements in relation to dealing with complexity around decision-
making. The first is in line with the bounded rationality theory. Meijer (1998) mentions that this first
movement seeks to reduce complexity by decomposing the decision process, which means decreasing the
number of criteria and alternatives (Meijer, 1998). A second movement is in line with the proposition of
this thesis to keep the decision-making process as rationalistic as possible. In line with Cabantous and
Grond (2011), this could be achieved by increasing the reasoning capacity of decision-makers using so
called “rationality carriers” (Cabantous & Gond, 2011). March (2006) talks about technologies related to
model-based rationality (March J. , 2006). The main idea is that these artifacts could embed rational
models to support the decision-maker in the decision-making process. The result is two streams of
thoughts about how to deal with the complexity surrounding IT investments (see figure 8).
Figure 8 - Complexity of IT investment decisions
From the proposition of this thesis it is clear that my intention is not to reduce complexity. However, in
order to make the process as rationalistic as possible, it is precisely the aim to increase the reasoning
capacity by introducing an artifact to solve this problem. Using a tool-based decision support model
would enable us to extend the cognitive capabilities of decision-makers and therefore hold on to
rationality.

22
Available IT project valuation methods
A few valuation methods have already been mentioned in the introduction to this thesis. In order to find a
way to determine the business value of the IT investment, a tool with practical applicability is needed.
The current literature base provides us many means and methods, but most of them do not fulfill the
needs of current (IT) organizations and only cover one or two requirements related to IT project
valuation. I discuss each method and why I think it does not meet our preferences below. This eventually
results in pros and cons that could be used as requirements for the proposed method. To do so I mainly
focus on methods that increase rationality within the decisions-making process and consider in particular
those that increase the information processing capacity. However, in order to paint a complete picture I
also briefly elaborate the methods that try to reduce complexity.
2.5.1 Ways to reduce complexity
Although the focus of this thesis is on a method to improve the reasoning capacity of decision-makers, it
is not argued that methods to reduce complexity could not be valuable for organizations; one approach
does not preclude the other. It should be recognized, for example, that proper IT governance could be
very valuable, if not necessary for applying, a certain decision-making method.
Social heuristics
As stated earlier, people are bounded rationally by their limited reasoning capabilities. Heuristics can be
mental shortcuts that ease the cognitive load of making a decision. These heuristics (or mental shortcuts)
are in place to fill the gap that originates from the cognitive limitations of decision-makers. Social
heuristics could be used as bounded rationality tools to guide decisions in complex and uncertain
environments. Below I discuss a few generally accepted social heuristics (Hertwig & Herzog, 2009)
(Gigerenzer & Gaissmaier, 2011), namely
1. The recognition heuristic, which is based on recognition retrieved from memory. If only one or
two options are available, then the option recognized has a higher value for certain criteria.
2. The fluency heuristic, which is also a mental heuristic. Here the option that is processed more
fluently, faster or more smoothly than another has a higher value.
3. The take-the-best heuristic. In this case, the eventual decision is made on the first criterion that
effectively discriminates between the options.

23
Business case
The business case is a traditional and much used approach for project proposal assessment. Indeed, it lies
at the heart of every project that uses the PRINCE2 (projects in controlled environments, version 2)
methodology. The business case format is not prescribed in the PRINCE2 methodology, although some
guidelines are offered. Given that PRINCE2 does not provide companies with a predefined business case
template, the format could vary from one company to another (Portman, 2009). “The business case
presents the optimum mix of information used to judge whether the project is (and remains) desirable,
viable an achievable and therefore worthwhile investing in“ (Office of Government Commerce, 2009, p.
21). Lankhorst, Quartel and Steen (2012) state that IT is traditionally viewed from a cost-center
perspective when conducting business case calculations, which usually results in more intangible factors
being more or less neglected in the decision-making process (Lankhorst, Quartel, & Steen, 2012). The
business case approach mostly relies on basic cost-benefit analysis which does not meet the requirements
of rationality. The business case mainly focuses on the financial aspects of an investment proposal and is
therefore recognized as a method for reducing complexity instead of enhancing peoples’ reasoning
capabilities. The following calculations can be seen as an attempt to increase this reasoning capacity
(however, since they explicitly focus on financials and neglect the many non-financial factors related to
IT investment proposals, they are classified as being complexity reducing within this thesis).
- Net Present Value (NPV)
- Return on Investment (ROI)
- Discounted Cash Flow (DCF)
As stated by Angelou and Economides (2008), traditional finance theory proposes analyzing budget
allocation requests using the DCF methodology. The problem with this method is that it does not properly
account for the flexibility needed in relation to IT investment decisions.
An investment proposal (Infrastructure project, e.g. new server) could for example have a negative NPV
but provides the organization with an opportunity to set up a later business-value adding project. In such a
case, other benefits than those provided in the stand-alone business case should be taken into account
(Angelou & Economides, 2008).

24
Enterprise governance of IT
The enterprise governance of IT (EGIT), or the more commonly used term of governance of IT, is an
integral part of overall enterprise governance. It gives business and IT people a direction for their
responsibilities in the support of both business and IT alignment. It also addresses the definition and
implementation of formal processes, structures and relational mechanisms in the organization to fulfill the
responsibilities on both the business and IT sides. In the end, IT governance should be a first step in
generating business value from the IT organization (Van Grembergen & De Haes, 2009). The mind-shift
is best described by Weill and Ross (2009): “If senior managers do not accept accountability for IT, the
company will inevitably throw its IT budget at a myriad of tactical initiatives with no significant impact
on organizational capabilities” (Weill & Ross, 2009, p. 9). It is precisely this mind-shift that the Dutch
airliner KLM experienced in 2001. Such a mind-shift formed the basis for the company to completely
overhaul its IT governance, starting with appointing a new CIO. The rest of this section provides a short
description of this case in which KLM transformed its governance, based on the work of De Haes,
Gemke, Thorp and van Grembergen (2011) (De Haes, Gemke, Thorp, & Van Grembergen, 2011).
In this case, one of the first steps was to reconnect loosely coupled IT functions that were scattered
throughout the organization. This was done by installing a CIO Office to support the CIO function. The
primary task of the new CIO was then to re-establish the governance principles and practices of KLM,
with the main goal of providing all stakeholders with a better understanding of both the cost and value of
IT. The reason was that a better understanding would eventually lead to improved decisions on what and
how to potentially outsource.
Table 1 - Governance principles and practices at KLM (De Haes, Gemke, Thorp, & Van Grembergen, 2011)
1. The business should not experience a difference between working with an internal or external IT provider.
2. The WHAT and HOW (and WHY) should be differentiated.
3. The demand-function should be improved by creating a business demand office for each business domain.
4. The supply-function should be improved by creating an innovation organizer and service manager for each business domain.
5. Monthly decision meetings on WHAT and HOW should be convened (Management & IT).
6. The focus should be on the costs that can be influenced either in full or in part, split between innovation and continuity.
7. Each innovation (investment) should have one business owner to whom all costs are charged.
8. Each service (continuity) should have one business owner to whom all costs are charged.
9. There should be a top-down budget framework and simplified budget process.
10. Activity-based costing should be applied to processing primary cost to product cost.

25
Governance principle six represents one of the most important changes, as a clear differentiation was
made between continuity and innovation budget. The responsibilities and authorities are stressed along
two dimensions, namely IT function and IT cost. By splitting the IT costs into two different areas, the
investment decisions that come along with those areas are also split. A clear differentiation was also made
between business and IT responsibilities. This resulted in four different areas, with each its own authority
and responsibilities in IT investment decisions. As this framework provides clear boundaries for the four
areas and the responsible managers, much of the complexity is reduced. Figure 9 gives a graphical
representation of the organizational changes KLM made.
Figure 9 - Mirror roles between business and IT at KLM (De Haes, Gemke, Thorp, & Van Grembergen, 2011)
Restructuring IT governance certainly adds value to an organization. At KLM it took away much of the
complexity faced by individual decision-makers by restricting their governance. Although such a
restructuring does not provide us with guidelines about how investment decisions are later made, it could
be of real value (and is likely a prerequisite) for implementing the eventual method for increasing
decision-makers reasoning capacity.

26
2.5.2 Ways to increase reasoning capacity
In order to make the decision-making process more rational, the reasoning capacity must be increased. In
accordance with Cabantous and Grond (2011), this could be effectuated by transferring the computations
to so-called “rationality carriers” (Cabantous & Gond, 2011). The methods mentioned below try to cope
with vast amounts of information. I also discuss why these approaches do not meet the requirements.
Nested real option valuation approach
Bardhan, Bagchi and Sougstad (2004) combine project interdependencies and a real option approach in an
attempt to increase reasoning capacity. More explicitly, the nested real option approach models project
interdependencies as real options. The real option approach provides managers with flexibility in their
investment decisions. For example, an IT infrastructure project could have a negative NPV when
considered on a stand-alone-basis, but it could provide a manager with the option to launch future value-
added services for application development (Bardhan, Bagchi, & Sougstad, 2004).
The main contribution of Bardhan, Bagchi and Sougstad (2004) is that they develop a nested real option
model that incorporates project interdependencies for project valuation. Other studies mostly use real
options to make go no-go decisions concerning single projects and thereby ignore project
interdependencies. It could be the case that projects are broken down into different phases that are funded
separately. For example one phase might not be attractive on its own (e.g. an infrastructure project), but
this phase might enable the execution of future phases and together complete the entire project. The idea
is that phase one projects deserve partial credit for the future benefits they enables (Bardhan, Bagchi, &
Sougstad, 2004).
A modern-day example is a good way to get a better sense of the real option. Company X is a 21st
century biotechnology company that specializes in human genomics. It obtained two patents for a new
technology that it developed, which it plans to use as the basis for developing a new product. Because the
product’s potential market is uncertain, management does not want to commit to fully investing in its
development and chooses to create an option to sell the technology if at any time during the development
effort it becomes clear that the product’s future payoff would not be favorable (Kodukula & Papudesu,
2006).

27
A value net is used to take into consideration all of the stakeholders that could benefit from a certain IT
investment. A value net is defined as “a map that links a firm to various player segments: customer,
competitors, suppliers and complementary/partners who increase the value of a company’s services to its
customers” (Bardhan, Bagchi, & Sougstad, 2004, p. 36). It serves as a starting point for the real option
calculations to make sure that all of the added value is taken into account.
Two types of dependencies between projects are recognized: soft decencies and hard dependencies. Soft
dependencies occur when the capabilities created for one project enhance the capabilities required by
another project, whereas hard dependencies occur when the capabilities realized for one project are also
required by one or more of the other projects. The figure below provides an example of a project portfolio
that consists of three phases. Hard dependencies are indicated by solid lines and soft dependencies by
dashed lines (Bardhan, Bagchi, & Sougstad, 2004).
Figure 10 - Example of project dependencies (Bardhan, Bagchi, & Sougstad, 2004)

28
These dependencies are incorporated into the option value calculation of a certain project (Vj). The
formula is constructed as follows:
Vj = BjN(d1j) – Cje-rftN(d2j), where
d1j = [ln(Bj/Cj) + (rft + σj2t/2)]/σj√t, and
d2j = d1j – σj√t, and
Bj = PV(cfj * (1 – Σkskj))
The table below explains the variables used in the option value calculation above.
Table 2 - Notations used in the real option model (Bardhan, Bagchi, & Sougstad, 2004)
Vj Option value of project j.
Bj Present value (PV) of the expected benefits (returns) of project j.
Cj PV of the expected costs of project j.
N(.) Cumulative standard normal probability density function.
σ j 2
Variance of expected project return of project j.
T Time to option expiration.
rt Risk-free interest rate.
rd Risk-adjusted discount rate.
Skj Dependency of project j on project k (expressed in terms of the percentage of the benefit of project j that depends on
project k.
cfj Net cash flows associated with project j.
There are a few disadvantages related to the nested real option method. In addition to the fact that it uses
advanced mathematical calculations that could harm its adoptability, it also entails some other
inconveniences. As mentioned earlier, IT investments deal with qualitative and quantitative benefits;
however, this method lacks non-financial (qualitative) criteria and thereby restricts the decision-maker.
Another important issue is that this method requires all future options and their values to be known, and it
does not provide instructions for calculating them.
The real option-analytic hierarchy process method
The real options-analytic hierarchy process (ROAHP) method combines real options (RO) approach with
the analytic hierarchy process (AHP). The work of Angelou and Economides (2008) in this area is
strongly related to the work of Bardhan, Bagchi and Sougstad (2004).

29
Combining the RO approach with AHP makes it possible to not only consider the financial (quantitative)
criteria related to projects, but also the non-financial (qualitative) criteria. The RO approach used by
Angelou and Economides (2008) is comparable to the approach mentioned in the nested RO section. It
follows the same rule by incorporating the option value of future projects into the NPV of a current
project and thereby calculating the extended net present value (ENPV). Just like the nested RO approach,
it is necessary to calculate the ENPVs of both all possible investments and all possible combinations
(Angelou & Economides, 2008).
The AHP method is proposed for also incorporating the qualitative criteria related to projects. Saaty
developed this approach in the 1970’s in order to organize and analyze complex decisions. Just like other
MCA methods, AHP scores the alternatives on certain weighted criteria. It evaluates each alternative with
respect to each criterion and then multiples that evaluation by that criterion’s importance. This can be
expressed by the following formula: (Bhushan & Rai, 2007)
where Ri = Total score of the ith alternative
aij = the actual value of the ith alternative on the jth criteria
wj = the weight or importance of the jth criteria
The AHP method differs from conventional MCA methods in the way it determines the weight of the
different criteria. Saaty (2008) states: “To make comparisons, we need a scale of numbers that indicates
how many times more important or dominant one element is over another element with respect to the
criteria or property with respect to which they are compared” (Saaty, 2008, p. 85). A pairwise comparison
is made to determine the weights and show how much more important one criterion is than another.
Figure 11 gives an example of how such a pairwise comparison looks like.
Figure 11 – Example of a pairwise comparison matrix (Saaty, 2008)

30
In the figure above we can see that for example that the opportunities criterion is four times as important
as the flexibility criterion. This integer means in between slightly more important and more important.
The weights are calculated by dividing each single entry by the sum of its column. The weight of each
criterion is then determined by the average of each row. We can see that the salary criterion is most
important in this example.
In ROAHP, the outcome of the ENPV is used as one of these criteria. In comparison with the above-
mentioned example, we can say that the outcome of the ENPV is the financial (i.e. quantitative) criterion
of salary, as financial criteria are often most important. It is therefore obvious that the monetary criterion
yield the highest rates. Furthermore, the other criteria are qualitative.
This ROAHP method overcomes some flaws of the previously mentioned nested RO method by also
incorporating qualitative criteria. However, this method also has some drawbacks. Angelou and
Economides (2008) do not provide guidelines for scoring the alternatives. The RO model in this method
still needs information on a certain investment’s future options before the calculations can be made, but
this information is not always available. Finally, the pairwise comparison is an additional step that might
be undesirable and as these weights have to be determined by the decision-maker this step cannot be
transferred to a computer system.
Bedell’s method
The method stems from 1985, when IT was considered in a completely different manner than it is today.
In the intervening years, IT has developed significantly and its use within organizations has been greatly
enhanced. Although Bedell’s method is fairly outdated, I mention it here to bolster the ultimate
foundation of the method proposed in this thesis.
The main purpose of Bedell’s method is to link information systems (IT) to business value in a systematic
and transparent manner. Extensive prior research is not needed given that most of the analysis is done by
management assessment. The method has been embraced in portfolio valuation literature and successfully
applied in many organizations (Schuurman, Berghout, & Powell, 2008).

31
This method basically provides decision support at four different levels of an organization as illustrated in
figure 12 below. The first (on top) level represents the organization in its entirety while the second
consists of the business processes, the third describes the activities that shape those business processes
and the fourth (or lowest) level is composed of the information systems that support these activities
(Buschle & Quartel, 2011).
Figure 12 - Different levels mentioned in Bedell’s method (1985) (Buschle & Quartel, 2011)
This is translated into three basic questions, and answering these questions is the method’s main goal.
1. Should the organization invest in IT in general?
2. For which business process should the investment be made?
3. Which concrete investments should be made, in terms of new IT or enhancements to existing
information systems?
The portfolios mentioned in this method build around two axes: importance and effectiveness.
Furthermore, these portfolios will eventually help to answer the three basic questions cited above.
Answers to these questions can be found by comparing the importance and effectiveness of IT for the tree
highest levels. An example of such a comparison is given in figure 13.

32
(Strategic) importance: The activities that are supported by the information systems are critically
important if the business process or organization is to achieve the strategic objectives. (To-be situation)
Effectiveness: The information systems are effective when they have has high technical quality, are cost-
effective and are functionally appropriate. (As-is situation)
Figure 13 - Strategic importance vs. Effectiveness (Buschle & Quartel, 2011)
As mentioned earlier, using this method does not require extensive prior research. There are only four
variables that need to be determined before the calculations can be made.
The current importance of each business process to the organization. (IBO)
The current importance of each activity to the business process. (IAB)
The general effectiveness of information systems in relation to the business processes.
The potential general importance of information systems to the business processes
The diagram in Appendix B is used to determine the required importance scores.
The calculations described in the figure below are then performed using a bottom-up approach (while the
final analysis uses the reverse top-down approach). An extensive explanation of the different calculations
made in this method can be found in Appendix C, while Appendix D contains a small valuation example
that uses Bedell’s method (Schuurman, Berghout, & Powell, 2008) (Buschle & Quartel, 2011).

33
Figure 14 - Overview of Bedell’s method. (Buschle & Quartel, 2011)
Extending Bedell’s method to EA valuation
According to Buschle and Quartel (2011), a few limitations with Bedell’s original model necessitate some
adjustments. As made clear earlier, EA provides us with a holistic organizational overview that shows the
causal links between IT and the organizational goals via the business processes/services. As mentioned
above, Bedell’s method was not developed for use in conjunction with EA. This relates to the fact that at
the time when this method was developed, IT was organized in a slightly different manner: systems were
used locally and not interconnected into a company-wide network of systems and applications (Buschle &
Quartel, 2011).
After the extensions made here, Bedell’s method should be suitable for use in today’s IT world. The
adaptations will also ensure that the method is capable of being used in conjunction with EA as well as
with the ArchiMate modelling language (both of which are described in detail in Appendix A). Before I
discuss the additions made by Buschle and Quartel, it is important to first briefly elaborate on the
limitations associated with Bedell’s method.

34
The first constraint is that as described by Bedell in 1985, the method has a fixed layer structure that does
not allow business processes to be divided into sub-processes or an additional service layer (e.g. business
services between the business and the organization) to be added. While it is currently common for
companies to use certain activities in multiple business processes, Bedell’s basic method does not allow
network structures. The method also assumes a one-on-one relation between activities and information
systems and does not support an application service or component level as structured in ArchiMate.
Finally, it does not allow a layer to be crosscut. It is thus not possible to link an information system
directly to a business process without the intervention of an activity (Buschle & Quartel, 2011).
The idea behind extending Bedell’s method is that new methods are too often being developed without
building on the existing knowledge base. Buschle and Quartel (2011) therefore tried to overcome the
aforementioned limitation and thereby improve an existing method. These days IT systems and services
are increasingly interwoven and both the business and business processes could be supported by multiple
IT systems. The derivation rule should therefore be changed from a one-one-one rule to an N-to-N rule. In
comparison with the fixed structure of Bedell’s method, EA also recognizes some additional layers, e.g.
organizational goals and the services provided by the different layers (namely business, application and
infrastructure). These service layers are characteristics of service-oriented architecture (SOA), as
described in more detail in the following section.
Following the SOA approach means that a business process is not supported directly by an application;
the support is instead provided indirectly (via a service). The figure below represents an example in which
the effectiveness (E) of some IT element (S) is calculated for some arbitrary architecture element X. The
dashed lines indicate that the elements C[i] may contribute indirectly to X, while C [i] represents the
element to which the IT element contributes directly. This should be taken as input for the calculation of
E(S,X).
Figure 15 - Generalized rule for calculating effectiveness (Buschle & Quartel, 2011)

35
In order to calculate the effectiveness of S on X, the importance calculation (as represented in the figure
below) should be taken into account. The importance calculations is required for each element C[i] for X,
i.e. I(C[i],X) (Buschle & Quartel, 2011).
Figure 16 - Generalized rule for calculating importance (Buschle & Quartel, 2011)
It is possible in SOA that not only services from lower levels are used, but also services that are delivered
at the same level. This is in contrast to Bedell’s method, which uses a strict hierarchical structure. In order
to prevent cyclic used-by/contribution dependencies, we should apply the architecture principle. This
principle states that a service may not invoke a higher-level service. Another way to resolve cyclic
dependencies is to decompose the involved elements (Buschle & Quartel, 2011). First, I discuss the
concepts ARMOR and SOA before I demonstrate how the aforementioned calculations will work in the
EA modelling language of ArchiMate.
ARMOR
ARMOR was established as language for modeling the business goals into a framework (Engelsman,
Quartel, Jonkers, & Sinderen, 2010). A paper by Quartel, Engelsman, Jonkers and Sinderen (2009)
eloquently explains why EA contributes to IT investment prioritization by visualizing the causal chains.
The ARMOR language visualizes the further refinement of goals into sub-goals, which are then realized
through business services and processes. This facilitates the forward tracing from stakeholder concerns to
business services and processes (and possibly the supporting applications and technology) that provide a
solution for these concerns, but also the backward tracing from business services and processes to the
goals and concerns of the stakeholders. The next chapter clarifies how ArchiMate and ARMOR relate to
the prioritization method mentioned in this thesis (Quartel, Engelsman, Jonkers, & Sinderen, 2009).
Figure 17 shows the behavior aspect of ArchiMate for all the three layers in ArchiMate, extended with
business goals.

36
Figure 17 – The core ArchiMate framework extended with business goals
SOA
Service-oriented architecture represents a set of design principles that enable units of functionality to be
provided and consumed as services. IT has made great strides in software engineering, but it is also
receiving increasing attention in other disciplines. The interesting thing is that the service concept applies
equally well to both the business and the software applications (Lankhorst M. , 2009).
Services provide the “units of business” that represent value propositions within a value chain or business
process. In order to achieve the ultimate flexibility in business and IT design, this essentially simple
concept can and should be used in all levels of the EA not just in software engineering (Lankhorst M. ,
2009).
The Open Group defines SOA as: “an architectural style that supports service-orientation. Service-
orientation is a way of thinking in terms of services and service-based development and the outcomes of
services”.
If SOA is related to the approach used in ArchiMate, we can see that a service is defined between all the
three layers (i.e. business, applications and infrastructure). This is exactly the concept of SOA: multiple
IT functions or transactions supporting a business process through a service (ASML Information Manager
Customer Support, October 25, 2015).
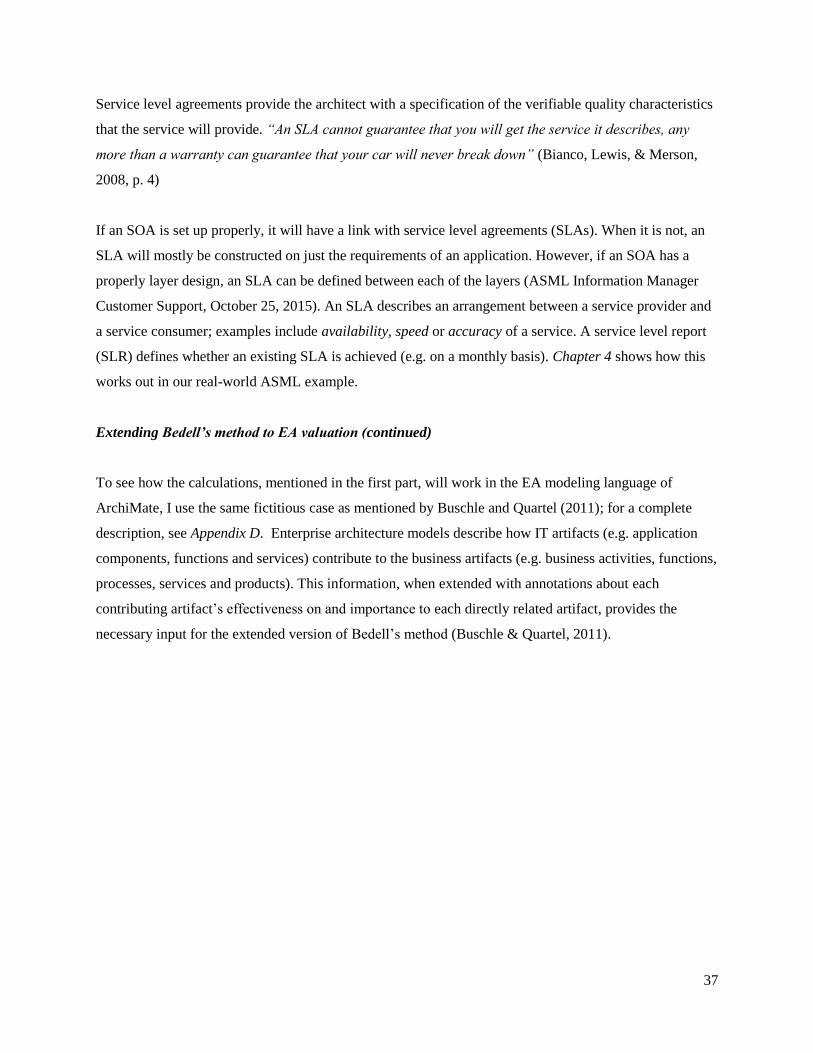
37
Service level agreements provide the architect with a specification of the verifiable quality characteristics
that the service will provide. “An SLA cannot guarantee that you will get the service it describes, any
more than a warranty can guarantee that your car will never break down” (Bianco, Lewis, & Merson,
2008, p. 4)
If an SOA is set up properly, it will have a link with service level agreements (SLAs). When it is not, an
SLA will mostly be constructed on just the requirements of an application. However, if an SOA has a
properly layer design, an SLA can be defined between each of the layers (ASML Information Manager
Customer Support, October 25, 2015). An SLA describes an arrangement between a service provider and
a service consumer; examples include availability, speed or accuracy of a service. A service level report
(SLR) defines whether an existing SLA is achieved (e.g. on a monthly basis). Chapter 4 shows how this
works out in our real-world ASML example.
Extending Bedell’s method to EA valuation (continued)
To see how the calculations, mentioned in the first part, will work in the EA modeling language of
ArchiMate, I use the same fictitious case as mentioned by Buschle and Quartel (2011); for a complete
description, see Appendix D. Enterprise architecture models describe how IT artifacts (e.g. application
components, functions and services) contribute to the business artifacts (e.g. business activities, functions,
processes, services and products). This information, when extended with annotations about each
contributing artifact’s effectiveness on and importance to each directly related artifact, provides the
necessary input for the extended version of Bedell’s method (Buschle & Quartel, 2011).

38
Figure 18 - Example of an extended version of Bedell’s method (Fictitious case) (Buschle & Quartel, 2011)
*Effectiveness scores only applicable for the IT components in the ArchiMate model.
Although the extensions made by Buschle and Quartel (2011) constitute a good step toward the method I
propose in this thesis, the extended version still have some flaws. The problem is that projects usually do
not improve complete IT components, but rather small parts thereof. The method proposed by Buschle
and Quartel (2011) assumes that an improvement of the Computation Service improves the Customer
Information Service and therefore decreases costs and increase insights in consumption (see figure 18)
(Buschle & Quartel, 2011).
For instance, a project could be concerned with only increasing the capacity of the Linux server and thus
improving the Computation Service’s response time. According to the current method, such a project
would lead to a decrease in cost, whereas an increase could result if the server now requires more
maintenance. This shows that one sub-part of an IT component could have differing influences. The
division of criteria that is made here is therefore not concrete enough. An extension of this method is
needed in order to be able to assess project influences in greater detail.

39
2.6 Conclusion
This conclusion bridges chapters 2 and 3, which show different approaches for prioritizing a portfolio of
IT investments. I have clarified why current approaches do not totally fulfill the requirements for the
prioritization method and shown that EA is an essential component for demonstrating why certain
investments contribute more to organizational goals than others. The paper by Buschle and Quartel (2011)
can be seen as being core to this this research, and chapter 3 shows how it relates to the solution. It is also
important that the SOA is set up correctly, which means that a service is defined between every layer in
ArchiMate (i.e. organization, business, application and infrastructure). If this SOA is set up properly, the
organization should be able to arrange an SLA for these services. This SLA incorporates performance
indicators to which the service provider has to comply; whether the agreed levels are met can be
determined using a service lever report (SLR).
Before I start describing the proposed method, this conclusion provides an overview of the methods
discusses thus far and scores them against certain criteria (as shown in the figure below). The method
proposed in chapter 3 aims to satisfying all of these criteria, which are as follows:
Qualitative element: Does the method generate benefits that cannot be expressed in financials?
Quantitative element: Does the method generate financial investment benefits?
Project interdependencies: Do the investment options have interdependencies (e.g. infrastructure and
application projects)?
Causal model: Does the method use a causal model to show the effects of certain investments?
Ease of Use: Is the method easy to apply (bearing in mind that ease of use depends on the complexity of
the calculations needed for the method and the number of steps that need to be taken)?

40
Figure 19 - Comparison of current prioritization methods
Ease of use (Low, Medium & High)
- Depending on complexity of the calculations needed
- Depending on number of steps that need to be taken to reach a decision
3. Proposed method
In this chapter input from the literature review is used to build a better MCA based on EA. To describe
this method I again use the fictitious case mentioned in the paper of Buschle and Quartel (2011); for
further details see Appendix E. This case describes a simplified version of a Swedish power utility firm
that contains only three business services. Two investment options are added to make it more realistic and
better show the practical applicability of the proposed method (Buschle & Quartel, 2011). A visual
representation of these investment options can be found in Appendix F.
In the previous chapter I mentioned the flaws of the method proposed by Buschle and Quartel (2011). As
projects usually do not improve complete architectural components but rather improve smaller parts of
them, the following two adjustments are necessary to overcome these flaws.
Tak
es in
to a
ccou
nt
qu
an
tita
tive
crit
eria
Tak
es in
to a
ccou
nt
qu
alita
tive
crit
eria
Tak
es in
to a
ccou
nt
pro
ject
in
terd
epen
den
cies
Mak
es u
se o
f a c
au
sal m
od
el
Ease
of
Use
*
Nested Real Option Approach x - x - Low
x x x - Low
x x - x Medium
x x x x Medium
Nested Real Option Approach
ROAHP
Method of Bedell
Extended Method of Bedell

41
- Performance indicators
We should be able to define performance indicators (PIs) for every service in the architecture. For
example, a service delivered by a server can be judged on availability and speed. A good way to establish
these PIs is to use the balance scorecard (BSC) and input from SLAs that are based on the SOA principle.
To keep the model manageable, it is advised not to use too many PIs; a good guideline is to use one per
balance score card (BSC) perspective. In the case study section I will show the chosen PIs during the
workshop sessions.
- Influence factors
In order to create the causal model necessary for rational decision-making we should establish influence
factors between the different PIs. For example, the availability and speed of an application service is
influenced by the availability and speed of the service delivered by the server on which the application
runs. This causality chain should be unfolded by the stakeholders of the service (one layer above)
determining on which level their service is improved by the underlying PIs.
Using the abovementioned alterations to the extended method of Bedell should make causality clear and
measurable. To see how this will works out in the method I propose in this thesis, I next discuss the
related steps that should be taken when using it. This is followed by explaining the steps in the
accompanying Excel tool.
3.1 Process steps
1. Create the ArchiMate model
In the first step organizations should generate their current architecture, which can be a challenge given
that architecture can be very complicated and include a wide variety of business processes and
applications. While the architecture demonstrates the relationship between these components, it will be
insufficient for creating a suitable causal model. See figure 20 below.

42
Figure 20 - Architecture model fictitious case Swedish power utility firm

43
2. Determine PIs
Second, organizations should be able to assign PIs to every service within the architecture (e.g.
availability, accuracy and speed of the High-performance Computation Service). The reason I only apply
PIs to the services is that a service’s performance is what users eventually observe. It is not the intention
to define as many PIs as possible, only those that makes the service important for others. An example is
given in figure 21.
Figure 21 - PIs in high-performance computation service
3. Install influences between PIs
As clarified in the introduction to this chapter, the influence factors between the PIs in the services can be
used to create the causal model. These influence factors are necessary to calculate the scores for the PIs
that are dependent on others. An example is given in figure 22 below.
Figure 22 - Examples of influence rates (i.e. MCA weights)

44
*This kind of visual representation is clear for a simple example. However, one drawn for a real-world
example would be so confusing that it would not add value. Such representations are therefore not
necessary when the method is applied in a real-world setting.
If, for example, the accuracy of the forecasting service is only determined based on the accuracy of the
Statistics Database Service, we could assign an influence factor of 100% (or in terms of MCA; weight).
However, if the score of a PI is determined based on two different PIs (e.g. ratio 30%-70%), these rates
could be seen as relative weights.
4. Give scores to the PIs (not influenced by others)
Not all scores are determined by means of calculations; some are only dependent on the components that
provide the particular service. For example, the uptime of the Customer Database Service is only
dependent on the reliability of the hardware (if we do not take things such as power cuts into account).
The proposed method uses a score scale from 0-10 for all of the services within the architecture. The
availability of a server, for example will be determined as percentage. We therefore need a matrix that
translates percentages into numbers from 0-10. In this example an availability of 71-80% results in a
score of 3. See figure 23 for an example.
Figure 23 – Example scoring matrix (Sibenius Trip, 2014)
0
1
2
3
4
5
6
7
8
9
10
0 52 54 56 58 60 62 64 66 68 70 72 74 76 78 80 82 84 86 88 90 92 94 96 98 100
Availability %
Matrix - Availability
High-performance Computation Service

45
These score scales have to be developed for all of the PIs in the architecture. These matrices are
important, because they make the scoring transparent for both current and future situations. If a project
demands that a server is replaced, these matrices can be used to see what the replaced server’s impact
would be.
5. Calculate remaining scores
If all of the influence factors are installed and the scores for PIs (not influenced by other PIs) are given,
the calculation presented below can be done. The example from figure 22 is used to illustrate how it
works. The PI 1 of Service S2 (PIS2(1)) is determined by PI 2 of Service S3 (PIS3(2)) and PI 3 of Service
S4 (PIS4(3)). For this example we use a score of 6 for PIS3(2) and a score of 3 for PIS4(3). The score for the
availability of the HPC Service can be retrieved (for example) from the matrix in figure 23 (71-80%
Availability).
PIS2(1) = PIS3(2) * Influence factor PLS3(2) on PLS2(1) + PIS4(3) * Influence factor PIS4(3) on PIS2(1)
PIS2(1) = 6 * 30% + 3 * 70% = 3.9
This calculation should be made for all of the PIs right up to the organization’s goals and sub-goals
(which are influenced by the PIs of the business services).
In this chapter it is not necessary to add an extra component to the calculations, as the abovementioned
note does not influence the theoretical model.
Current situation on the organization’s goals
When everything is installed (i.e. performance indicators, influence factors and scores) we should be able
to see the current results for the goals and sub-goals of the organization.
Note: It could sometimes be the case that the score of a PI is partly determined by an intrinsic value of the
service and is therefore not only dependent on the characteristics of the supporting IT service. If this is the
case, an extra component needs to be added to the calculations.

46
6. Apply the investment options
After the current scores for the goals and sub-goals are calculated, we can apply the investment options.
This can be done by adding, removing or adjusting services, scores or influences. When using the method
in this way, we should bear project interdependencies in mind. The increase or decrease of a PI could be
more or less executing two or more investment options simultaneously.
To-be situation on the organization’s goals
This method can be used to model the different investments. Doing so will yield different scores in
relation to the organization goals for these investment options.
7. Choosing among options
In the last step we will be able to select the project that best serves our needs (i.e. contributes to the goal
that is recognized as being the most important at a certain moment). The method still uses the concepts
importance and effectiveness; importance in modelled as influences between PIs and effectiveness is
modelled through the results on the KPIs by the investment options. In the next section prioritization is
made visible using different portfolios generated by the Excel tool.
3.2 Excel tool
In order to complete the large number of calculations necessary for the proposed method, I embed the
method in an Excel tool. The current KPI reporting tool used within ASML contains a certain number of
functionalities that were useful for the Excel tool developed for this thesis. For this reason, a connection
was made between the prioritization tool used in this thesis and the KPI reporting tool used at ASML.
It is interesting how the ASML’s KPI reporting tool relates different KPIs with each other to generate a
KPI tree (i.e. causal model). Two types of KPIs are recognized in the ASML KPI reporting tool namely:
calculated and primary KPIs. A calculated KPI is figured based on underlying primary KPIs. At this
point we are able to show the relation of the KPI tree in the ASML KPI reporting tool with the
prioritization method proposed in this thesis.

47
The proposed method also includes PIs that can be classified as either calculated or primary (the Excel
tool clarifies how exactly this works). In order to demonstrate the proposed method using the Excel tool, I
again use the case of the Swedish utility firm.
1. Adding architecture (i.e. services from architecture) and PIs in Excel tool
Figure 24 shows the start screen of the Excel tool. The screen enables the user to add the services in the
ArchiMate model into to KPI reporting tool of ASML by translating the visual representation from figure
20. As only the PIs in the services are used for the calculations, it is not necessary to add the other
components. The user can add/remove services from the different layers, as well as add/remove PIs from
the specific services. At the top of the architecture the user is able to add/remove goals and sub-goals.
Figure 24 - Start screen of the Excel tool (adding services and performance indicators)
The information entered on the start screen is then used as input for the KPI reporting tool; a visual
representation is provided in the figure below. As can be seen, every performance indicator (i.e. KPI) is
assigned a unique ID.

48
Figure 25 - Visual representation of the PIs in the KPI reporting tool
2. Install influences between PIs
When the services from the architecture and associated PIs are added, it is possible to create causal
relations between the different PIs. The built in formula builder in the KPI reporting tool enables us to
install the different influence factors between the PIs.
Figure 26 shows the formula for calculating the comprehensiveness of the network load dashboard
service in the business services layer. The comprehensiveness is calculated out of three underlying PIs,
namely; information quality (K08602) of the real-time load monitoring service, the comprehensiveness
(K08611) of the statistics service and the comprehensiveness (K08612) of the forecasting services (from
the application services layer).

49
Figure 26 - Formula builder in KPI reporting tool
The KPI reporting tool of ASML has the functionality to generate an overview of the relations between
all the PIs in the dashboard. This gives the opportunity to show the causal model. An example of this
diagram structure is given in figure 27. The red circle shows the calculation made in figure 26.
PI (K08602) 20%
PI (K08611) 40%
PI (K08612) 40%

50
Figure 27 - KPI tree within the KPI reporting tool (causal model)

51
3. Give scores to the PIs
After the influence factors between the PIs are installed, scores can be given to those PIs not influenced
by others (figure 28, left red column). The tool automatically calculates those PIs that are influenced by
other PIs. Eventually, this should yield the current scores for the organizational goals and sub-goals.
Figure 28 - Scores of current situation and investment options
4. Apply investment options
The user can now start entering the investment options in the tool (figure 29). The user is directed back to
the screen in figure 28 after entering the project details. This allows the user to add the scores of the
investment options.
Figure 29 - Adding investment options
Project Description: Costs: Layer:
Customer Application € 95,000.00
ID Project Description Costs Layer
0 Current Situation € 0.00
1 New High Performance Computation Server € 30,000.00 Infrastructure
2 Customer Application € 95,000.00 Application
Add Project

52
Figure 30 shows the results on the organizational goals for both the current situation as for the two
investment options. These scores are used to generate the result screens (portfolios) in figure 31.
Figure 30 - Result screen (scores)
Figure 31 - Result screen (portfolios)

53
4. Evaluation of the investment decision method
This chapter describes the methodology used for the evaluation of the proposed method. The evaluation is
done conducting a case study at ASML. The case contained two parts: a practical application of the
proposed method (which entailed a workshop with the content group) and, semi-structured interviews
with stakeholders (which were utilized to evaluate the proposed methods’ ease of use and impact on
decision-making).
The semi-structured interviews were held with individuals who fall into two different categories, namely:
content and decision.
Content: These individuals should be able to work with the method (i.e. they prepare the decision).
Decision: These individuals should be able to make prioritization decisions based on the information
provided using the method (‘i.e. they make the eventual decisions’).
4.1 Case study and methodology
The case study methodology of Yin (2013) is widely accepted in social science research. Case studies are
preferred in situations where the following three conditions are met:
- The main research questions are “why” and “how” questions;
- The researcher has little or no control over behavioral events; and
- The focus of study is contemporary (as opposed to entirely historical) phenomena.
As the research into ASML meets all of these conditions, case study research best serves our needs. The
definition of case study research used by Yin (2013) is twofold:
“A case study investigates a contemporary phenomenon (‘the case’) in its real-world context, especially
when the boundaries between phenomenon and context may not be clearly evident. […] The second part
of the definition points to case study design and data collection features, such as how data triangulation
helps to address the distinctive technical condition whereby a case study will have more variables of
interest than date points” (Yin, 2013, p. 2).

54
4.1.1 Objectives
This case study has four objectives:
1. To investigate what information is necessary to use the proposed method in its entirety;
2. To investigate how to determine which PIs are important and how to determine the influence factors;
3. To investigate if the proposed method is feasible for the stakeholders; and
4. To investigate the limits of such a rational approach for decision-making.
4.1.2 Scope
The case study conducted within ASML’s OSI department, which is part of the Operations and Order
Fulfillment business function. This department undertakes all structural improvement projects for
Operations and can be seen as the link between business and IT. The improvement projects that it
executes are not product related (i.e. non-PGP).
As shown in the below figure, the OSI department conducts projects and programs within six domains.
The case study entailed selecting one of these domains (namely CS) to evaluate the proposed. To make
the case more feasible, the unscheduled down process (USD) process was selected to demonstrate the
proposed method in a real-world setting (see Appendix H for an illustration of the USD process).
Figure 32 - ████████████████████████

55
4.1.3 Timeframe
Six week were allocated for the case study. I started the semi-structured interviews in parallel with the
practical application of the method. In the first week I met with my company supervisor to discuss who
within CS would be most suitable for the content and decisions groups. As it was sometimes difficult to
people to spare 30/60 minutes that we needed for meetings, the interviews were spread over the five
remaining weeks.
4.1.4 Sampling method
One of the most commonly used sampling methods in the behavior sciences is convenience or accidental
sampling. In this approach the researcher simply uses participants who are ease to attain; they are selected
on the basis of their availability and willingness to respond (Gravetter & Forzano, 2015). Convenience
sampling is far from ideal and may threaten the external validity of our study.
For this research I used staff members from CS for both the semi-structured interviews and the workshop.
For the practical application of the method I used the USD process within CS. I chose this convenience
sample because my company supervisor is Information Manager for CS. Having this connection
shortened lines of communication and facilitated my efforts to make contact.
To increase the success rate of scheduling meetings, my company supervisor first called most of the
participants to inform them what was expected from them and explain the potential benefits of the
research for ASML. These calls were intended to increase staff member’s willingness to participate.

56
4.1.5 Research material
- The below table shows individuals who participated in the semi-structured interviews.
Title Content/Decision group
Information Manager Customer Support Decision group
IT Director Competence Center Sales & Service Decision group
Manager Customer Support World-Wide Projects Decision group
Customer Support Infrastructure Support – Senior Specialist Content group
IT Service Delivery Manager Content group
Global Infrastructure Manager Content group Table 3 - Participants interviews
- The following table indicates the individuals who helped to create the ArchiMate model in order
to test the proposed method’s ease of use.
Title
IT Director Competence Center Operations
Senior Manager Enterprise Architecture
Enterprise Architect
Senior Consultant CS PM QM ETM
Business Architect Customer Support
Key User – Business Application Owner
Business Process Change Manager Table 4 - Stakeholders within CS/IT
- In addition to stakeholders within CS and IT, I also consulted internal process documentation in
drawing early models of the USD process.
4.2 Difficulties/problems encountered
One of the major difficulties during the case study (especially the practical application of the method) was
the absence of ArchiMate models that describe the current ASML landscape. At the moment, no common
language (such as ArchiMate) is available for communicating with each other about investment decisions.

57
A second problem attached to the absence of ArchiMate is the immaturity of knowledge about this
modeling language within the organization, which made it harder to describe and explain the proposed
method to interview participants. In response to the first problem, I arranged a discussion with ASML
staff members from both the IT and the business sides to help generate an ArchiMate model for the
unscheduled down process (USD) within CS. In every conversation I used the same presentation as during
the semi-structured interviews, drawing on a simplified ArchiMate model of the fictitious utility company
(Buschle & Quartel, 2011) as an example. To ensure that I was making progress in my discussions, I
always used input from previous conversations.
4.3 Semi-structured interviews
According to Clifford, French and Valentine (2010), semi-structured interviews are a useful way of
researching, (as the interviewer provides the interviewee the change to explore issues that he or she feels
are important in addition to those covered in the main questions.) A semi-structured interview unfolds in a
conversional manner using a predetermined list of topics or questions, but it also includes the possibility
for deviation (Clifford, French, & Valentine, 2010).
To support the interviews I used a presentation to first introduce the new approach to IT decision-making
before asking questions about it. The following main stages were discussed, Appendix G give a detailed
description of each of these stages:
Process
- Introduction
- Problem statement
- How to solve this problem
- EA (ArchiMate)
- Illustration
- Discussion & questions

58
After conducting the interviews, I wrote a report that I sent together with the presentation to the
participants. I did this to give the participants an opportunity to both review the interview report and look
more closely at the presentation. I asked them to add any information that was missing and to send the
adjusted report back to me. Summaries of the interviews held for each group are provided below.
* It should be noted that all interviews were conducted in Dutch; statements in English included here are
therefore translations.
Decision group:
Information Manager Customer Support
The method as presented during the presentation will constitute a compelling contribution to the decision-
making process and will help us to reduce the complexity inherent to IT investment decisions. Eventually,
it will lead to better control and more focus on the things that really matter. This refers not only to larger
structural improvements (i.e. innovation projects), but also to the smaller (maintenance) jobs that arise on
a day-to-day basis. According to the participant, ArchiMate can serve as a common language between
business and IT; if we speak the same language the proposed prioritization method will serve as a
decision-support tool with distinct merits.
IT Director Competence Center Sales & Service
During this interview we discussed the details of the method quite extensively. In general, this IT director
thinks that such a method should lead to better decisions given that we will have more information and
insight. He noted that in order for such a method to work, we need guidelines for the influence rates and
PIs; without them, the proposed method serves as a platform that facilitates political processes. He feels
that the method will have its limits if we are not able to make the scores and weights objective.
Manager Customer Support World-Wide Projects
We first spoke about the use of SLAs as input for the prioritization method. I mentioned that if we set up
our SOA in the right way, we should be able to define a service layer between the different levels in the
architecture. Furthermore, an SOA that is set up correctly would also enable us to define an SLA on the
service layer between the levels.

59
The PIs mentioned in these SLAs could then serve as input for our prioritization method. According to
this manager, current SLAs are defined for the applications themselves (e.g. COACH SLA) and not on
the services defined between the levels. Our SLAs are internally focused; hence in-case of noncompliance
there is no explicit way to be compensated for at this level. Another issue we discussed had to do with the
scores we will assign to the PIs. The difference between 99% and 100% server availability may look
small, but it could have a large influence. As an example he mentioned a banking company with an online
banking application: 1% of server down time could eventually result in 10 days down time yearly for the
application. This probably has a bad impact on the company’s image. One of the other questions was if it
will be possible to look into the future using this method. How does it incorporate lifecycle management?
How does it deal with the phasing out, maintenance and upgrading of components within the architecture?
His final remark was that the approach needs success criteria in order to be successful.
Content group:
Customer Support Infrastructure Support – Senior Specialist
When I interviewed this participant I discovered that the method I presented has many boundary
conditions that must be met if it is to be used fully. Enterprise architecture serves as a large part of the
solution. This way of working, modeling and thinking is currently not in common use at ASML. The
method has the ability to make the process much more rational and thereby decrease the number of
political processes. This participant stated that it would be difficult to objectively define the different parts
of the method, although having clear guidelines would make it easier.
IT Service Delivery Manager
ASML currently does not have an EA repository, and therefore also lack the knowledge. Using EA with
the ArchiMate modeling language gives us the possibility to link IT to the business side of the company
(and eventually to ASML’s predefined goals). Currently, the greatest challenge is how to make these
links. This is made even harder by the fact that IT and business sides of the house do not speak the same
language. Given the maturity level of the organization, we currently do not define application services
that link IT to the business; however, there is, also a lack of business services that could be linked to our
organizational goals.
60
Currently, business services, level 2/3 (IT Terminology), from SLA documentation is linked with our
applications (e.g. COACH and Maintenance Manager/SMS). There is no bridge between the goals of the
business (i.e. the KPI’s) and our applications.
Global Infrastructure Manager
This participant said: using the proposed method will make the process much more rational; making it
more rational will in turn make the less rational components (i.e. political processes) more visible.
According to him, this is one of the proposed method’s greatest direct benefits and will make the
decision-making process more transparent. He feels that the interaction between services that lead to the
end goals will be made visible. The flaws he mentioned related to the subjectivity of the dependencies
between services and the weights attributed to them. He believes that the new method will not decrease
the political processes without clear guidelines.
4.4 Practical application (unscheduled down process)/workshop
As mentioned under difficulties/problems, the lack of a complete architectural model of ASML was one
of the largest issues I needed to deal with. The scope for the practical application was narrowed down to
one specific process within CS in order to create a simplified model that is easy for most people to
understand and does not add too much information that is not needed explaining and testing the
prioritization method.
To overcome the problems mentioned, I invited several people within CS and IT (see table 4) to assist in
creating the ArchiMate model I needed for the case. This was a difficult job given that most people only
know one part of the ArchiMate model or do not use the same modeling language and structure as
mentioned in this thesis.
As my first attempt was not as fruitful as I expected I also arranged a workshop with the people I had
interviewed earlier as part of the content group. The process I followed for this workshop is presented
below.

61
Process
For the setup of the workshop I used a similar process as during the interviews. Instead of asking
questions and start a discussion at the end, we went together through the steps of the proposed method in
a workshop setting. The workshop had two main parts and duration of two hours.
- Recapitulate the prioritization method I had presented to them earlier.
- Provide details and expectations for each step, following the same steps as in the example.
As input for this workshop I made an ArchiMate model of the unscheduled down (USD) process based on
the conversations I had with several people form CS and IT. In the model I only included those
components and services that I was totally sure of, I kept those, I was not completely sure of, in mind as
input for the discussions during the workshop. In order to make it easy to work on the ArchiMate model
together, I printed the model in A0 and put it on the wall.
* Time issues made it impossible to completely go through all of the prioritization model’s steps.
However, after the workshop we agreed that if all boundary conditions are met, the new approach could
have several merits.
Results
In general I believe that the workshop yielded a great deal of fruitful information, insights and
discussions. The benefits of the new proposed method became clearer to me and the participants as the
discussion progressed.
The results of this session are presented in Appendix I. They may seem somewhat disappointing but I still
think the session represented a good step in the right direction. During the workshop session, consensus
was reached on a couple of topics, namely:
- The ArchiMate model created for the USD process;
- Use of PIs in the services only;
- Use of identical PIs in all the layers; and
- Use of four PIs, namely: Quality, Availability, Capacity and Performance

62
4.5 Results
In this section, the results of the case study are used to provide a general overview of the following topics:
- Results on objectives
- Political processes vs. rationality
- Feasibility of the method
Results on objectives
In the introduction to this chapter the following objectives were mentioned:
1. To investigate what information is necessary to use the proposed method in its entirety;
2. To investigate how to determine which PIs are important and how to determine the influence
factors;
3. To investigate if the proposed method is feasible for the stakeholders; and
4. To investigate the limits of such a rational approach for decision-making.
Due to the difficulties and problems during the case study not all objectives are fulfilled. However, we
know what information is necessary is needed to fill the proposed method. Due to the interviews and
workshop we know that when boundary conditions are met the method can be feasible. The limits of the
method are reached when criteria or influence rates cannot be objectively determined.
Political processes vs. rationality
Political processes will never be erased from a decision making processes and that will also be the case at
ASML. However, the proposed method will increase rationality and establish more transparency. This is
made possible installing the causal chains in the ArchiMate model. The rational parts will become clear,
but also the less rational parts. Enhancing the amount of rationality in the decision-making process
eventually leads to higher quality decisions.

63
Feasibility of the method
The feasibility of the method depends on a lot of boundary conditions. So, the proposed method is
feasible unless these boundary conditions are met. First, the method need guidelines how to determine;
PIs, scores and influence rates to maintain objectivity. Second, organizations should have a certain
maturity level in order to make full use of the proposed method. In the recommendations section more
information about these maturity levels is given.
5. Conclusions and recommendations
This chapter begins with the study’s overall conclusions, which are then used as the basis for
recommending next steps for ASML to take. The chapter ends with some suggestions for future research
and directions for further exploring this prioritization method.
5.1 Conclusions
This conclusions paragraph starts with a general conclusion on decision-making surrounding IT
investments. On an abstract level it shows the theoretical and practical conclusions and already some brief
recommendations. The subsequent subsection gives answers to the research questions and central research
question of this thesis.
General
(IT) decision-making can be seen as a balance between the amount of ratio involved and the amount of
non-rational parts (e.g. political processes). The preposition of this thesis is that increasing ration should
decrease the less rational parts of the decision-making process and thereby increasing the quality of the
decisions.
During the interviews held at ASML and the practical application of the method (including the workshop
session) I found some confirmation that the proposed method potentially could contribute the following
parts; provide more and better information, increase transparency of the tradeoffs and thereby giving also
insight in the less rational parts of the current decision-making process.

64
As I said, the method could potentially increase the quality of IT investment decisions. During the case
study I also found out that the proposed method has some boundary conditions which need to be fulfilled
in order to use the method properly. Guidelines are needed in order to guarantee objectivity in the
process. Organizations should commit on guidelines regarding; how to determine which PIs are important
for them, how these PIs can be scored and about the way they determine the influence rates between these
PIs.
Besides, the aforementioned guidelines does the method require a certain maturity level (three or higher)
in order to make full use of the proposed method (or parts of it). The proposed method has the potential to
increase rationality and thereby decrease the less rational parts (e.g. political processes). By following
such a procedural rational approach as presented in the method the quality of the decisions should be
increased. However, as mentioned earlier requires the method knowledge about the process surrounding
IT investment decisions.
The paper “Measuring and Managing Technological Knowledge” by Bohn (1994) describes a scale for
measuring knowledge about a process. According to Bohn ranges a company’s knowledge about a
process from total ignorance to very formal and accurate mathematical models (complete understanding).
Knowledge about a process allows organizations to make predictions, causal associations, or predictive
decisions about what to do (Bohn, 1994). As there is always some uncertainty in the process full
knowledge could never be reached.
At ASML the following definition of organizational maturity is used: “Organizational Maturity is the
level of an organizations readiness, ability and experience to efficiently perform a given task”. This gives
a strong relation between theory and practice and links with the paper of Bohn (1994).
In order to show how mature ASML is in a certain competence or process (i.e. how much knowledge do
we have of the process), ASML uses the CMMI Maturity Model. CMMI is an acronym for Capability
Maturity Model Integration and is developed by the Carnegie Mellon University and has his origin in the
software development (Kulpa & Johnson, 2008). Section 5.2 provides more information about the CMMI
Maturity Model and fills the model for the purpose of this thesis; a maturity model for decision-making
surrounding IT investments.

65
Answers to the research questions
1. What is the current state of research on prioritizing a portfolio of IT investments using MCA and
Enterprise Architecture?
I showed why current prioritization methods not completely fulfill the requirements. It was also
made clear that in order to show how organizations could create IT based value from their IT
investments, EA is an indispensable part of the solution. Current literature already tries to use EA
in combination with MCA. The method proposed in this thesis build on prior research and
searched to make it practically useful.
2. How could the MCA method be improved on previously researched strength and weaknesses?
The proposed method in this thesis built on a previous developed method. Two adjustments are
made to better meet the requirements set from the field. Building on the work of Buschle and
Quartel (2011), performance indicators and influence rates were added. Both extensions were
needed in order to create the causal model necessary for rational decision-making.
3. Is the method developed using MCA and Enterprise Architecture feasible for decision-makers?
The method will be feasible for decision-makers, but in order to be feasible guidelines are
necessary to ensure objectivity. Besides, a certain maturity (i.e. level 3 or higher) of the
organization required in order to make full use of the proposed method.
4. What are the limits of a rational approach for IT investment decisions?
The method reaches its limits when objectivity is replaced with subjectivity or gut feeling. This
relates to the earlier mentioned guidelines (boundary conditions). If organizations are not able to
objectively determine PIs, scores and influence rates, the proposed method will serve as a
platform where decision-makers could execute their political behavior.

66
Main research question
What is the contribution of a MCA approach using Enterprise Architecture to IT project prioritization?
Using the method proposed in this thesis, gives the decision-makers the possibility to show the
contribution investment options have on the goals of organizations. Given that the method make use of a
causal model contributes to rational decision making which should enhance the quality of these decisions.
5.2 Next Steps for ASML
The conclusion section above made clear that in order to make the proposed method to a success within
ASML a certain maturity level is needed. CMMI is presented to give shape to the different maturity levels
in decisions-making surrounding IT investments. This section is structured as follows; first it will give
general information about the five maturity levels in the CMMI model. Then the maturity model
regarding IT investment decisions will be given and the current level of ASML. This section will end
with a high level roadmap for ASML. CMMI defines the following maturity levels, given in figure 33.
Figure 33 - Maturity levels CMMI
The general descriptions for the various levels of CMMI are used to develop the CMMI model for IT
investment decisions, depicted in figure 34. From the model presented below the current maturity level of
ASML can be retrieved. This is displayed in figure 35.

67
Figure 34 - CMMI Model for IT investment decision-making
Figure 35 - Capability Maturity Model Integration
ASML first needs to decide if they want to continue with this research. If they wish to continue with the
method the following steps needs to be taken into account. ██████, ██████ ██████ ██████
████████████████████████. ██████ ██████ ██████ ██████ ██████
██████ ██████ ██████.
ASML is on the right track. In order to make full use of the proposed method the below roadmap can be
used. This can be a long, time consuming process given that only creating an ArchiMate repository
requires a lot of time and money from a company.

68
Figure 36 - High-level roadmap to increase maturity level
5.3 Future research
This research was a first attempt to test the proposed prioritization method in a practical setting. As
known ASML should grow in maturity if they want to prioritize their IT investment options using the
method proposed in this thesis. This subsection will give some directions for future research with the
intention to strengthen this research topic.
First, I think that Enterprise Architecture can be seen as an indispensable part in prioritizing a portfolio of
IT investments. In order to show the contribution of certain IT investments on the goals of an organization
enterprise architecture (EA) is a necessary component.
One direction for future research could focus on current decision-making surrounding IT investments. If a
research should take the Netherlands in their test case, what percentage of companies currently uses EA
and also what percentage uses EA in their IT investment decisions? Another interesting question could
focus on the reasons to use or not to use EA. Is it purely a financial aspect or are there other aspects that
withhold organizations to use EA.
Another interesting direction for future research could be finding the connection between the following
three topics; Service Oriented Architecture (SOA), Service Level Agreements (SLAs), Service Level
Reports (SLRs) and combined business/IT reporting.

69
Could a better collaboration between these three topics enhance the prioritization method proposed in this
thesis? Is it possible to increase the relation between these topics?
Third research direction could focus on applying the proposed method in another organization with a
higher maturity level regarding EA modelling. A case study could then be used to determine the details of
the proposed method. Questions might be; Are the four performance indicators mentioned in this thesis
sufficient? Do we also need performance indicators in the component of the architecture instead of in the
services only? Is it possible to objectively determine the influence rates between the performance
indicators?
Finally, as mentioned in section 5.2 does this method require a couple of changes in the decision-making
process and also in the organization self. Changes always have to deal with resistance in the organization.
A research could focus on how change management could facilitate a smooth transition.

70
6. References
Angelou, G., & Economides, A. (2008). A Decision Analysis Framework for Prioritizing a Portfolio of
ICT Infrastructure Projects . IEEE Transactions on Engineering Management, 479-495.
Bannister, F., & Remenyi, D. (2000). Instinct and Value in IT Investment Decisions. Journal of
Information Technology, 231-241.
Bardhan, I., Bagchi, S., & Sougstad, R. (2004). Prioritizing a Portfolio of Information Technology
Investment Projects. Journal of Management Information Systems, 33-60.
Bellman, R., & Zadeh, L. (1970). Decision-Making in a Fuzzy Environment. Management Science, 141-
164.
Berghout, E., Nijland, M., & Grant, K. (2005). Seven Ways to get Your Favoured IT Project Accepted -
Politics in IT Evaluation. The Electronic Journal of Information Systems Evaluation, 31-40.
Bhushan, N., & Rai, K. (2007). Strategic Decision Making: Applying the Analytic Hierarchy Process.
Springer Science & Business Media.
Bianco, P., Lewis, G. A., & Merson, P. (2008). Service Level Agreements in Service-Oriented
Architecture Environments. Carnegie Mellon.
Bohn, R. (1994). Measuring and Managing Technological Knowledge. Sloan Management Review, 61-
73.
Buschle, M., & Quartel, D. (2011). Extending the method of Bedell for Enterprise Architecture Valuation.
15th IEEE International Enterprise Distributed Object Computing Workshop (pp. 370-379).
Helsinki: IEEE.
Cabantous, L., & Gond, J.-P. (2011). Rational Decision Making as Performative Praxis: Explaining
Rationality's Externel Retour. Organization Science.
Clifford, N., French, S., & Valentine, G. (2010). Key Methods in Geography. Sage Publications Ltd.
Cohen, M., March, J., & Olsen, J. (1972). A garbage can model of organizational choice. Administrative
science quarterly, 1-25.
De Haes, S., Gemke, D., Thorp, J., & Van Grembergen, W. (2011). The evolution of KLM's enterprise
governance of IT: An ongoing journey form cost-of-it to business-value-of-IT. MIS Quarterly,
109-120.
Dean, J., & Sharfman, M. (1993). Relationship between procedural ratio- nality and political behavior in
strategic decision making. Decision Sciences, 1069-1084.
Dean, J., & Sharfman, M. (1996). Does Decision Process Matter? A Study of Strategic Decision-Making
Effectiveness. Academy of Management Journal, 368-396.
Dessler, G., & Phillips, J. (2007). Managing Now! Cegage Learning.

71
Eisenhardt, K., & Bourgeois, L. (1988). Politics in strategic decision making in high-velocity
environments: Towards a midrange theory. Academy of Management Journal, 737-770.
Eisenhardt, K., & Zbaracki, M. (1992). Strategic Decision Making. Strategic Management Journal, 17-
37.
Engelsman, W., Quartel, D., Jonkers, H., & Sinderen, M. v. (2010, December). Extending enterprise
architecture modelling with business goals and requirements. Enterprise Information Systems, 9-
36.
Gigerenzer, G. (2008). Why Heuristics Work. Perspectives on Psychological Science, 20-29.
Gigerenzer, G., & Gaissmaier, W. (2011). Heuristic Decision Making. Annual review of psychology, 451-
482.
Gravetter, F., & Forzano, L.-A. (2015). Research Methods for the Behavioral Sciences. Cengage
Learning.
Hertwig, R., & Herzog, S. (2009). Fast and Frugal Heuristics: Tools of Social Rationality. The Journal of
The International Social Cognition Network, 661-698.
Hills, F., & Mahoney, T. (1978). University Budgets and Organizational Decision Making. Administrative
Science Quarterly, 454-465.
Janis, I. (1972). Victims of Groupthink: a psychological study of foreign-policy decisions and fiascoes.
Boston: Houghton Mifflin.
Janis, I. (1982). Groupthink: Psychological Studies of Policy Decisions and Fiascoes 2nd Edition.
Boston: Houghton Mifflin.
Johnson, R., & Christensen, L. (2014). Educational Research: Quantitative, Qualitative and Mixed
Approaches. California: SAGE Publications.
Keisler, J. (2011). Portfolio Decision Quality. Portfolio Decision Analysis, 29-51.
Kodukula , P., & Papudesu, C. (2006). Project Valuation Using Real Options: A Practitioner's Guide. J.
Ross Publishing.
Kohli, R., & Grover, V. (2008, January). Business Value of IT: An Essay on Expanding Research
Directions to Keep up with the Times. Journal of the Association for Information Systems, 22-39.
Kulpa , M., & Johnson, K. (2008). Interpreting the CMMI (R): A Process Improvement Approach, Second
Edition. CRC Press.
Lankhorst, M. (2009). Enterprise Architecture at Work: Modelling, Communication and Analysis 2nd.
Springer Publishing Company, Incorporated.
Lankhorst, M., Quartel, D., & Steen, M. (2012). Architecture-Based IT Porftolio Valuation. In F.
Harmsen, E. Proper, F. Schalkwijk, J. Barjis, & S. Overbeek, Practice-Driven Research on
Enterprise Transformation (pp. 78-106). Springer Berlin Heidelberg.

72
Lindblom, C. (1959). The Science of "Muddling Through". Public Administration Review, 79-88.
March, J. (1978). Bounded Rationality, Ambiguity, and the Engineering of Choice. The Bell Journal of
Economics, 587-608.
March, J. (2006). Rationality, foolishness, and adaptive intelligence. Strategic Management, 201-214.
Matheson, J., & Matheson, D. (1998). The Smart Organization. Harvard Business School Publishing.
Meijer, B. (1998). To Manage or not to Manage. In Engineering and Technology Management, 1998.
Pioneering New Technologies: Management Issues and Challenges in the Third Millennium.
IEMC'98 Proceedings., (pp. 279-284).
Mukhopadhyay, T., Kekre, S., & Kalathur, S. (1995, June). Business Value of Information Technology:
A Study of Electronic Data Interchange. MIS Quarterly, 137-156.
Office of Government Commerce. (2009). Managing Successful Projects with PRINCE2. TSO.
Pettigrew, A. (1973). Politics of organizational decision making. London: Tavistock.
Pfeffer, J., & Moore, W. (1980). Power in University Budgeting: A Replication and Extension.
Administrative Science Quarterly, 637-653.
Pfeffer, J., & Salancik, G. (1974). Organizational Decision Making as a Political Process: The Case of a
University Budget. Administrative Science Quarterly, 135-151.
Portman, H. (2009). PRINCE2 in Practice. Zaltbommel: Van Haren Publishing .
Powell, P. (1992, January). Information Technology Evaluation: Is It Different? The Journal of the
Operational Research Society, 29-42.
Quartel, D., Engelsman, W., Jonkers, H., & Sinderen, M. v. (2009). A Goal-Oriented Requirements
Modelling Language for Enterprise Architecture. IEEE International Enterprise Distributed
Object Computing Conference (pp. 3-13). Auckland: IEEE.
Quartel, D., Steen, M. W., & Lankhorst, M. (2010). IT Portfolio Valuation - Using Enterprise
Architecture and Business Requirements Modeling. Enterprise Distributed Object Computing
Conference (EDOC), 2010 14th IEEE International (pp. 3-13). Vitoria: IEEE.
Ranganathan, C., & Sethi, V. (2000). Assessing the impact of decision process on the effectiveness of
strategic IT decisions: A triangulation approach combining qualitative and quantitative methods.
Proceedings of the Twenty First Zntemational Conference on Information System. Brisbane.
Ranganathan, C., & Sethi, V. (2002). Rationality in Strategic Information Technology Decisions: The
Impact of Shared Domain Knowledge and IT Unit Structure*. Decision Sciences, 59-86.
Rijn, R. v., Driel, M., Gils, B. v., Oord, E., & Santema, A. (2013). Wegwijzer voor methoden bij
enterprise-architectuur, 2de, herziene druk. Zaltbommel: Van Haren Publishing.
Saaty, T. (2008). Decision making with analytic hierarchy process. International Journal of Services
Sciences, 83-98.

73
Sarasvathy, S. (2001). Causation and Effectuation: Toward a Theoretical Shift From Economic
Inevitability to Entrepreneural Contingency. Academy of Management Review, 243-263.
Savage, L. (1954). The Foundations of Statistics. New York: Dover Publications.
Schuurman, P., Berghout, E., & Powell, P. (2008, December). Calculating the Importance of Information
Systems: The Method of Bedell Revisited systems. Sprouts: Working Papers on Information
Systems, 1-18.
Sibenius Trip, J. (2014). A rationalistic approach to IT investments using Enterprise Architecture.
Enschede: University of Twente.
Simon, H. (1955). A Behavioral Model of Rational Choice. The Quarterly Journal of Economics, 99-118.
Simon, H. (1979). Rational Decision Making in Business Organizations. The American Economic Review,
493-513.
Steup, M. (2005, Decemeber 14). Epistemology. Retrieved from Stanford Encyclopedia of Philosophy:
http://plato.stanford.edu/entries/epistemology/
Tversky, A., & Kahneman, D. (1981). The Framing of Decisions and the Psychology of Choice. Science,
453-458.
Van Grembergen, W., & De Haes, S. (2009). Enterprise Governance of IT in Practice. In S. De Haes, &
W. Van Grembergen, Enterprise Governance of Information Technology (pp. 21-75). Springer.
Venkatraman, N. (1997). Beyond Outsourcing: Managing IT Resources as a Value Center. Sloan
Management Review, 51-65.
Walls, J., Widmeyer, G., & El Sawy, O. (1992). Building an Information System Design Theory for
Vigilant EIS. Information Systems Research , 36-598.
Weill, P., & Ross, J. (2009). IT Savvy: What Top Executives Must Know to Go from Pain to Gain.
Harvard Business School Publishing.
Wijnhoven, F. (2009). Information Management: An Informing Approach. Routledge.
Yin, R. (2013). Case Study Research Design and Methods. Sage Publications Inc.

A
Appendix A: Enterprise architecture and modelling language ArchiMate
Enterprise Architecture
Enterprise architecture plays a central role in the prioritization method proposed in this thesis. It is
therefore important to know what EA is, how it adds value to a company and the way in which it supports
the rationalistic view on decision-making. In the introduction of this research it is stated that while
causality is elusive, it is difficult to show the business value created by IT investments. We could
understand how to create value by extending our knowledge of the complementary and mediating factors
that create this value (Kohli & Grover, 2008). The prioritization method proposed in this thesis makes use
of EA to provide a holistic overview of the organization and make the causal chains visible in order to
show how investment options create business value.
It is necessary to understand the basics of EA before its connection with the prioritization approach may
be understood. Architecture raises many meanings itself, and even more when it is used in combination
with another term. In IT, the term is also used both appropriately and inappropriately. The addition of
another term to architecture should indicate the topic the architecture relates to. To achieve a more
common understanding the following definition is used for EA.
Lankhorst defines EA as “a coherent whole of principles, methods, and models that are used in the design
and realization of an enterprise's organizational structure, business processes, information systems, and
infrastructure” (Lankhorst M. , 2009, p. 3).
Enterprise architecture should focus on the coherence of the organization, business, information,
applications and technical infrastructure. Using EA in this way reveals the organizational structure and
coherence from a broader vision than solely IT and can add great value to the organization. The emphasis
is on using EA as a management-tool, due to the growing importance of flexibility, transparency and
complexity control within organizations (Rijn, Driel, Gils, Oord, & Santema, 2013).

B
ArchiMate
To provide a structure and frame for the EA that forms the core of this research, I make use of the
ArchiMate language. This language has been developed by a project team from the Telematica Instituut in
cooperation with several Dutch partners from government, industry and academia. Today, ArchiMate is
part of The Open Group, which is a consortium of large companies within the IT sector. The Open Group
acts as a standardization organization and focuses on the development and management of open IT
standards.
The ArchiMate modeling language deconstructs an organization along two orthogonal dimensions: layers
and aspects. The layer concept depicts the different abstraction levels at which an organization can be
modeled.
The layer dimension distinguishes between three main layers:
- The business layer, offers products and services to external customers that are realized by
business processes in an organization;
- The application layer, which is supported by application services realized by (software)
application components; and
- The infrastructure layer, which (as the lowest and the technology layer) provides the
infrastructure services (e.g. processing, storage and communication), needed to run the
applications one level above. These services are realized by system software and communication
devices.
Aspects, on the other hand, represent the different concerns of an organization that need to be modeled
(Quartel, Engelsman, Jonkers, & Sinderen, 2009).
The aspect dimension distinguishes between the following modeling aspects:
- Information (passive structure), which represents the objects on which behavior is performed;
- Behavior, which represents the processes and services performed by the actors and the way in
which they interact; and
- Structure (active), which represents the actors involved and how these relate to each other (e.g.
systems, components, people, department, etc.) and how they relate to each other.

C
The aspect dimensions and the different layers in the ArchiMate language can also be found in the picture
below.
Figure A1 - ArchiMate modeling framework (Quartel, Engelsman, Jonkers, & Sinderen, 2009)
Dimensional structuring makes it possible to model an organization from different viewpoints. The
position along each dimension is characterized as the modeling viewpoint. (Quartel, Engelsman, Jonkers,
& Sinderen, 2009) For the purpose of this thesis I use the behavior viewpoint for all three layer
dimensions, given that we only need the infrastructure & infrastructure services, application components
& application services, business processes and business services of the ArchiMate framework.

D
Appendix B: Determining the importance scores for Bedell’s method
Figure B1 - Determining strategic importance scores (based on Bedell 1985) (Schuurman, Berghout, & Powell, 2008)

E
Appendix C: Explanation of the calculations made Bedell’s method
In a bottom-up approach, the effectiveness of an information system (IS) in relation to the activities is
adjusted on a step-by-step basis for the level of importance of IS to the intended organizational level. The
results are combined into portfolios that are then assed top-down. This appendix describes the equations
necessary at each step to calculate the portfolios (Schuurman, Berghout, & Powell, 2008).
The first step entails calculating the effectiveness of the single IS in relation to the business processes
(ESB). This is done by weighting the effectiveness of the single information system to the activity (ESA)
by the activity to the business process it supports (IAB).
Equation 1)
ESB = ESA * IAB
IAB = Determined using the model in Appendix A.
ESA = Determined by IS management in cooperation with the business organization based on their
perception of the cost-effectiveness, technical quality, and functional appropriateness.
After the effectiveness of IS on the several business processes is determined, the separate calculations can
be combined in order to calculate the total effectiveness of IT in supporting the business processes (EIB).
This can be done by dividing the effectiveness scores of the information systems into the business
processes by the importance scores of the activities to the business processes.
Equation 2)
EIB = ∑(𝐄𝐒𝐁)
∑(𝐈𝐀𝐁)
In order to move a level up, the effectiveness of the information systems to the organization (ESO) can be
calculated by weighting the effectiveness scores of the information systems into the business processes by
the importance scores of the business processes to the organization (IBO).

F
Equation 3)
∑ (ESO) = ∑ (ESB * IBO)
As systems can only contribute to the organization via the activities they enhance we also need to
calculate the importance of the activities to the organization. The importance of the activities to the
business processes are therefore also weighted against the importance of the business processes to the
organization.
Equation 4)
∑ (IAO) = ∑ (IAB * IBO)
After both the effectiveness of the information systems and the importance of the different activities to the
organization are calculated, we should also be able to determine the total effectiveness score of IT to the
organization. This can be done by dividing the effectiveness scores of the information systems into the
organization by the importance scores of the activities to the organization.
Equation 5)
EIO = ∑(𝐄𝐒𝐎)
∑(𝐈𝐀𝐎)
In order to calculate the focus factor (FF), the importance of the business processes to the organization
needs to be weighted against the importance of IT to the business processes.
IIB = Determined by management by taking the maximum scores of IAB for each business process.
Equation 6)
FF = IBO * IIB
One additional calculation needs to be made before we can begin to assess the portfolios. Equation 7
calculates the future potential of information systems to the organization by dividing the FF by the
importance scores of the business processes to the organization.

G
Equation 7)
IIO = ∑(𝐅𝐅)
∑(𝐈𝐁𝐎)
After the above calculations have been made, it should be possible to create the three different portfolios
by applying the right variables. Appendix C provides a sample calculation in which the portfolios are
incorporated.
Portfolios:
- Vertical axis/Horizontal axis
- Importance of IT to the organization/Effectiveness of IT to the organization (organizational level)
- FF/Effectiveness of IT to the business process (business process level)
- Importance of the activity to a certain business process/Effectiveness of the system to a certain
business process (activity/information system level)
In order to prioritize the improvements, we first need to determine the to-be effectiveness of the
information systems. Once the to-be effectiveness is known, it is possible to calculate the added
effectiveness of the improvements.
Equation 8)
Added = (ESA1 – ESA0) * IAO
The project return index (PRI) provides an overview of the improvements. To calculate the PRI, the
added effectiveness is divided by the realization and exploiting cost.
Equation 9)
PRI = 𝑨𝒅𝒅𝒆𝒅
𝐂𝐨𝐬𝐭

H
The main purpose of Bedell’s method is to bring the effectiveness of IT to the organization as close as
possible to the importance of IT to the organization. The organization should therefore best select those
improvements that would bring the future effectiveness of information systems to the organization closest
to the importance.
This can be done by dividing the total of PRIs for the chosen improvements by the total importance of
the activities to the organization.
Equation 10)
EIO1 = EIO0 + ∑(𝐏𝐑𝐈)
∑(𝐈𝐀𝐎)

I
Appendix D: Sample calculation of Bedell’s method
To demonstrate how Bedell’s method works, I use the same example as in the paper by Schuurman,
Berghout and Powell (2008). This example uses a fictitious banking organization to describe the different
steps that need to be taken select which projects to invest in. The process contains a total of 10 steps, each
of which is clearly described below.
Description of the banking company:
Name: International Banking Group (IBG)
The four business processes that are relevant to IBG:
- Asset management
- Transaction banking
- Retail banking
- Services
Figure D1 - Organizational diagram of a fictitious banking organization. (Schuurman, Berghout, & Powell, 2008)
Step 1: Determine the importance of all business processes to the organization (IBO)
This assessment is done by the board of directors using the diagram in Appendix B.

J
Figure D2 - IBO scores for IBG
Step 2: Determine the importance of all activities to the business processes (IAB)
The managers responsible for the respective business processes determine these importance scores using
the same diagram as used in step 1 (see Appendix B).
Figure D3 - IAB scores for IBG
Step 3: Determine the effectiveness of the current systems in place for the different activities
These effectiveness scores are determined jointly by managers from IT several business processes. The
diagram from Appendix B is again used. It can be seen that several activities (i.e. the systems supporting
these activities) have an effectiveness score of zero. The underlying reasons range from efficiency failures
to total lack of (computerized) information systems.

K
Figure D4 - ESA scores for IBG
Step 4: Calculate the effectiveness of the single systems on the business processes and the
effectiveness of IT on the business process
Multiplying the importance of the activities by the business processes and the effectiveness of the
information systems to the activities yields the effectiveness of the information systems to the business
processes (ESB).
Figure D5 - ESB scores for IBG
Combining these calculations enables us to determine the effectiveness of IT for the different business
processes (EIB). This is done by dividing the sum of all ESB scores by the sum of all IAB scores.

L
Figure D6 - EIB scores for IBG
Eventually it is our intention to calculate the current effectiveness of IT to IBG. However, in order to do
so we must first calculate the effectiveness of the systems to the organization (ESO) and the importance
of the activities to the organization (IAO). Dividing the total of ESO by the total score of IAO yields the
current effectiveness of IT to IBG (EIO).
Figure D7 - EIO score for IBG
Step 5: Determine the potential importance of the information systems to the business processes
and calculate the FFs and the potential importance of the information systems to the organization
These potential importance scores are determined based on the information from the previous steps as
well as market knowledge. Here IBG decided to make the process less complex by taking the maximum
IAB scores for each business process.
Figure D8 - IIB scores for IBG

M
In order to calculate the importance of an information system (IIO) to IBG, we should first calculate the
FF. This can be done by multiplying IBO with IIB.
Figure D9 - FF scores for IBG
Step 6: Determine whether to invest in information systems as a whole
Creating the highest level portfolio enables us to determine if IBG should invest in IT as a whole. The
importance of IT to IBG gives us the to-be situation, while the current effectiveness of IT to IBG provide
us with the as-is situation. The idea behind Bedell’s method is that effectiveness and importance should
score equally (see the dotted diagonal from lower-left to upper-right in the below figure).
Figure D10 - Organizational level portfolio

N
Step 7: Determine which business processes to make (IT) investments in
The next portfolio provides us with information about which business processes are most in need of
improvements. It can be seen that asset management and services diverge in particular quite a lot from
their ideal (“positive and negative”).
Figure D11 - Business process level portfolio
Step 8: Determine which activity to invest in for the business process
In this last portfolio, we use the example of asset management.
Figure D12 - Activity level portfolio

O
Step 9/10: Select investment proposals
In the last phase of the portfolio management cycle, IBG must decide which project proposals to
implement (naturally, smaller changes could also be assessed).
Figure D13 - ESA' (i.e. to-be situation) for IBG
Figure D14 - Added ESO and PRI

P
Figure D15 - EIO' scores for different project portfolios
As a project to be realized is dependent on the available resources, IBG should always keep less
ambitious ESAs and less expensive scenarios in mind; after all, they might have a better PRI.

Q
Appendix E: Case description of a fictitious power utility firm
This case description is copied from a paper of Buschle and Quartel (2011). It provides details of a case
study performed at a Swedish power utility firm in September 2009. For ease of use, only a sub-set of the
activities exploited at the utility are considered in this context. The utility owns part of the Swedish power
network and has several thousand customers.
The utility offers three business services: a network load dashboard, rate advice and energy saving
advice.
1. The network load dashboard business service is used with the aim of evaluating the current state of
the electricity network.
Business process:
- Dashboard coordination
Application services: In order to realize the business process of dashboard coordination, the utility uses
three application services:
- Real time monitoring, which entails monitoring the current state of the network;
- Forecasting, which involves forecasting how the power network will perform in the future; and
- Statistics, which are used to evaluate how the electricity network behaved in the past.
Applications:
- Network load monitor
- Network load analyzer
Infrastructure services:
- Measurement database
- Statistics database
- High-performance computation

R
Infrastructure:
- Database and data collection server
- High-performance computation server
2. The rate advice business service aims to help the utility’s customers find the best rates based on their
individual consumption profiles. The utilization of the electricity network is also considered, as the utility
is able to offer lower rates in times of lower utilization.
Business process:
- Tariff advice process
Application services:
- Statistics: Used indirectly via customer advisor (Application)
- Consumption profile
- Select tariff
Application:
- Consumer advisor

S
3. The energy saving advice business service supports the customer in saving energy. It takes the profile
a user has stored in his or her individual account on the utility’s webpage into account. Based on the
customer’s preferences, an individual mix of fossil, nuclear and renewable energy is suggested.
Business process:
- Energy saving advice process
Application service:
- Customer info
Application:
- CRM
Infrastructure service:
- Computation
- Customer database
Infrastructure:
- Linux server
Organizational goals: The utility has the overall goal of being profitable, which should be achieved on a
satisfied customer base (sub-goal customer satisfaction) and a minimal reserve capacity (sub-goal
minimize reserve capacity) in which the main goal is decomposed into.
Customer satisfaction (decomposed into):
- Maximize availability
- Achieve the lowest cost
- Provide insight into consumption

T
The network load dashboard business service contributes to two goals (minimizing reserve
capacity and maximizing availability), seeing as the utility’s employees use it to identify an optimal
overcapacity.
- Minimize reserve capacity
- Maximize availability
The rate advice business service contributes to the lowest cost sub-goal as it helps the customer to
identify the best rate.
- Lowest cost
The energy saving advice business service contributes to the sub-goal insight in consumption
- Insight into consumption
Investment options
1. In order to improve customer satisfaction, we would like to provide customers with more insight
into their energy consumption by providing them access to real-time data pertaining to their
individual situations. In order to do so, we need to develop a supporting application. Furthermore,
in order to secure enough data space and computational power, we also must replace the data
collection server with a more sophisticated model. The cost of developing and maintaining the
application is approximately €85,000 (maintenance costs for the coming three years discounted in
the price), while the new server costs approximately €10,000.
2. An additional project might be to purchase another high performance computation server, which
would decrease the possibility of downtime and thereby increase customer satisfaction (and
reduce costs of loss of data or downtime). Such a server costs approximately €15,000. Another
€15,000 would be required to implement synchronization and perform maintenance.

U
Appendix F: Visual representation of the investment options
Figure F1 - Investment option 1

V
Figure F2 - Investment option 2

W
Appendix G: Detailed process steps semi-structured interviews
During the semi-structured interviews, I used almost the same introductory presentation for the people
from the decision and content groups; only the discussion and end questions were slightly different. This
is logical given that I expected slightly different inputs from both groups. The process I used was as
follows:
- Introduction
The interviews started with mutual personal introductions. I then presented a general introduction to the
research topic and explained the reasons why it had been chosen.
- Problem statements
I next began explaining why ASML needs a different approach for prioritizing its portfolio of IT
investments. I provided some problem statements relating to the current approach and demonstrated what
the results may be.
The problem statements I mentioned in my presentation were as follows:
- The current decision-making process is not considered transparent, and politics may influence
outcomes.
- It is not always apparent why certain investment options contribute more to our organizational
goals than others.
- A lack of information sometimes leads to decisions that are not entirely obvious for all decision-
makers.
I suggested that the results might be:
- That we do not execute the right projects;
- That we do not spend our money effectively; and
- That the decision-making process lacks a backbone.

X
- How to solve this problem
Thereafter I presented a brief overview of the solution’s main direction. I introduced EA as part of the
solution and state that the relations in the EA could be used to create a causal model that should provide
us with insight into the extent to which certain IT investments contribute to our organizational goals. I
noted that reason (i.e. rationality) would serve as the primary source of judgment. In order to make this
visible I used figure G1 in my slide.
Figure G1 – Visual representation of the proposed method
- EA (ArchiMate)
To provide better insight into what I exactly meant with EA and the ArchiMate modeling language, I used
the slide included in the figure below. I also showed the parts of ArchiMate that are required in order to
use the method properly.
Figure G2 - Relation between ArchiMate, SOA and SLAs

Y
I made the following remarks on this slide:
- I only consider the behavior aspect along all the three layers (i.e. business, application and
infrastructure) of ArchiMate. This is sufficient for creating the causal model necessary in the
prioritization method proposed in this thesis.
- I suppose that the ArchiMate model is built using the SOA concepts in which a service is defined
between all layers. For every service layer we should be able to create an SLA that could serve as
input for the prioritization method (i.e. PIs).
- Example of the approach/steps to take in the process
The slide presents the details of the proposed method based on the predefined steps. To make it more
tangible I use the same fictitious case as earlier. The figure below shows the content of this slide.
Figure G3 – Process steps in the prioritization method

Z
- Illustration
In this illustration slide I demonstrate a calculation example of the proposed method. In order to stay
consistent, the same fictitious case mentioned earlier is used.
Figure G4 - Example calculation of the proposed method (from slide)
- Discussion & questions
In the final slide I asked for feedback on the method proposed during the presentation. Although, semi-
structured interviewing was the chosen method the following questions were common along the
interviews:
• What benefits do you see with the proposed method?
• Are we able to make better informed decisions with the information provided by the
method?
• Is the approach easy to use, or do you see some flaws?
• If so, what are these flaws and how do you think we can resolve them?
• Do you think it will be easy to determine the PI’s?
• How could we make this easier?
• Do you think it will be easy to establish the influence factors?
• Does this method decrease politics or just facilitate a platform for political processes?

AA
Appendix H: The process used to execute unscheduled and scheduled
maintenance (ASML)
Figure H1 - █████████████████

BB
Appendix I: Result of the workshop session at ASML
Figure I1 - █████████████████

CC
Figure I2 - █████████████████████


![Rational, unirational and stably rational varietiespirutka/survey.pdf · could be rational (resp. stably rational, resp. retract rational) [30, p.282]. Unirational nonrational varieties](https://img.dokumen.tips/doc/110x75/5f8fad2d18211140cf6c6b61/rational-unirational-and-stably-rational-varieties-pirutka-could-be-rational.jpg)