Embed Size (px)
Citation preview

2012 ANNUAL REPORT
Making our planet more productive
Financial Highlights(Dollar amounts in millions, except per share data)
Year ended December 31, 2012 2011 2010
Reported Amounts:Sales $11,224 $11,252 $10,116Operating profit $2,437 $2,468 $2,082Net income - Praxair, Inc. $1,692 $1,672 $1,195Diluted earnings per share $5.61 $5.45 $3.84
Adjusted Amount(a):Operating profit $2,502 $2,469 $2,167Net income - Praxair, Inc. $1,681 $1,666 $1,476Diluted earnings per share $5.57 $5.43 $4.74
Other Information & Ratios:Cash flow from operations(b) $2,752 $2,455 $1,905Capital expenditures $2,180 $1,797 $1,388After-tax return on capital(c) 13.9% 14.8% 14.5%Return on equity(c) 28.9% 28.1% 26.4%
a) Adjusted amounts are non-GAAP measures. 2012 adjusted amounts exclude the impact of the cost reduction program, pension settlement and income tax benefit related to the U.S. homecare divestiture. 2011 adjusted amounts exclude the impact of a net gain on acquisition and the cost reduction program. 2010 adjusted amounts exclude the impact of the Spain income tax settlement, U.S. homecare divestiture, repatriation of tax benefit and Venezuela currency devaluation. Adjusted amounts are reconciled to reported amounts in the “Non-GAAP Financial Measures” section in Item 7.
b) 2010 cash flow from operations includes a $481 million payment related to the Spain income tax settlement. See “Liquidity, Capital Resources and Other Financial Data” Section in Item 7.
c) After-tax return on capital and return on equity are non-GAAP measures defined in the “Non-GAAP Financial Measures” section in Item 7. Calculations for years prior to 2012 have been adjusted to conform to current year presentation.
SALES
‘10 ‘11 ‘12
$10,116$11,252 $11,224
ADJUSTED DILUTED EARNINGS PER SHARE(a)
‘10 ‘11 ‘12
$4.74$5.43 $5.57
AFTER-TAX RETURN ON CAPITAL(c)
‘10 ‘11 ‘12
14.5% 14.8%13.9%
END MARKETSFood & Beverage
6%
Manufacturing25%
Metals18%
Chemicals10%
Other11%
Aerospace3%
Healthcare8%
Energy11%
Electronics8%
BUSINESS SEGMENTSSurface Technologies
6%
North America50%
South America19%
Europe13%
Asia12%
DISTRIBUTION METHOD
On-site25%
Packaged Gases29%
Other15%
Merchant31%
2012 SALES
Chairman’s LetterDear Shareholder: In 2012, Praxair delivered solid results while navigating through a challenging global economic environment. Strong growth in our North American business was offset by recessionary economic conditions in Europe and Brazil and by the negative currency translation impact of a significantly stronger U.S. dollar against most major currencies. Despite these challenges, our team was able to grow sales 5% and EPS 8% over 2011, excluding the effects of foreign currency, and improve our operating profit as a percent of sales to a record level of 22%.
Praxair generated record operating cash flow of $2.8 billion, an increase of 12% over 2011, which enables us to re-invest in our business for growth. We funded record capital expenditures in 2012, and with a robust backlog of projects entering 2013 and promising opportunities on the horizon, we anticipate our project capital spending will remain at strong levels for years to come. Despite this record level of construction activity, we were able to maintain our ROC at 14% – the best in our industry. In addition, we increased dividends and repurchased shares to increase returns to our shareholders. Just after year-end, we announced the 20th consecutive annual increase in Praxair’s dividend which represents a 21% compounded growth rate over the twenty-year period.
Praxair’s North American business generated solid organic sales growth of 5% and impressive operating profit growth of 10%. We are the largest and only fully-integrated industrial gases company in North America. During the year, we strengthened our franchise with the acquisition of 17 industrial and specialty packaged gases businesses in the United States and Canada. We will start up three hydrogen plants in 2013 to supply oil refiners on the Gulf Coast and we expect to capitalize on a number of proposed chemical projects fueled by the abundance of low cost natural gas in the United States.
Overseas, we remained focused on expanding our footprint and building density in key growth regions. We started up 15 large on-site projects around the world under long-term contracts and signed 13 others. Approximately half of our project backlog today will serve chemical, metal, energy and electronics customers in China, India, Korea, Brazil and Russia. We expect strong project activity in these regions to continue as these economies develop and build out their infrastructures which requires industrial gases.
For the 10th consecutive year, Praxair was selected as a component of the Dow Jones Sustainability World Index. We also marked our fourth consecutive year being named as a top green company by Newsweek, ranking number one in the Standard and Poor’s 500 Materials sector and number four in the worldwide Materials sector. Additionally, our global safety team maintained best-in-class performance in recordable injuries, lost workdays and high severity vehicle accidents – a tribute to the hard work and diligence of our employees around the world.
At Praxair, our employees live our mission of “making our planet more productive.” Our research and development team continues to introduce technologies that help our customers reduce operating costs, increase process efficiencies and improve environmental performance. In 2012, across the globe, our employees contributed more than 85,000 volunteer hours – donating their time to initiatives that promote higher education, support health research and provide resources to disadvantaged families. The efforts of our employees have benefited more than 300,000 people worldwide, affirming that the opportunity to make our planet more productive is both real and inspiring.
2012 was a year of milestones for Praxair. We celebrated two anniversaries – our South American subsidiary, White Martins, celebrated its 100-year anniversary, and we observed the 25th anniversary of our joint venture in Italy with SIAD. We also commemorated our 20th year on the New York Stock Exchange by ringing the closing bell in June.
I am extremely proud of the high-performance culture we have built at Praxair. Our global team remains committed to operational excellence and best-in-class performance, which has served our customers and shareholders well. This dedication, combined with our robust business model which consistently generates strong profits and cash flow, gives me the confidence that our future is indeed promising and secure.
STEVE ANGEL Chairman, President & Chief Executive Officer
February 2013
page i
Financial comparisons are non-GAAP measures.

page ii
Board of Directors
Stephen F. AngelChairman, President & Chief Executive Officer, Praxair, Inc.
Oscar de Paula BernardesManaging Partner, Yguapora Consultoria e Empreendimentos Ltda.; former Chief Executive Officer, Bunge InternationalCompensation & Management Development; Finance & Pension Committees
Bret K. ClaytonGroup Executive and Member of the Executive Committee, Rio Tinto GroupAudit; Governance & Nominating Committees
Nance K. DiccianiFormer President & Chief Executive Officer, Honeywell Specialty MaterialsAudit; Compensation & Management Development Committees
Edward G. GalanteFormer Senior Vice President, ExxonMobil CorporationCompensation & Management Development (Chair); Governance & Nominating Committees
Claire W. GargalliFormer Vice Chairman, Diversified Search CompaniesCompensation & Management Development; Governance & Nominating Committees
Ira D. HallFormer President & Chief Executive Officer, Utendahl Capital Management, L.P.Audit (Chair); Finance & Pension Committees
Raymond W. LeBoeufFormer Chairman & Chief Executive Officer, PPG Industries, Inc.Audit; Governance & Nominating Committees
Larry D. McVayPrincipal, Edgewater Energy, LLC; Former Chief Operating Officer, TNK-BP HoldingAudit; Finance & Pension (Chair) Committees
Wayne T. SmithChairman, President & Chief Executive Officer, Community Health Systems, Inc. Compensation & Management Development; Finance & Pension Committees
Robert L. WoodFormer Chairman, President & Chief Executive Officer, Chemtura CorporationExecutive Session Presiding DirectorFinance & Pension; Governance & Nominating (Chair) Committees
Executive LeadershipStephen F. Angel, Chairman, President & Chief Executive Officer
Scott E. Telesz, Executive Vice President
James S. Sawyer, Executive Vice President & Chief Financial Officer
Eduardo F. Menezes, Executive Vice President & President, North American Industrial Gases
James T. Breedlove, Senior Vice President, General Counsel & Secretary
Raymond P. Roberge, Senior Vice President & Chief Technology Officer
OfficersDomingos H.G. Bulus, Senior Vice President & President, Praxair South America
Murray G. Covello, Vice President, Global Supply Systems
Marc A. Franciosa, Vice President, Information Technology Services
Timothy S. Heenan, Vice President, Tax & Treasury
Elizabeth T. Hirsch, Vice President & Controller
Sunil Mattoo, Vice President, Strategic Planning
Antonio Cesar Miranda, President, Praxair Mexico and Central America
Mark J. Murphy, President, Praxair Surface Technologies, Inc.
Susan M. Neumann, Vice President, Communications & Public Relations
John M. Panikar, President, Praxair Distribution, Inc.
Anne K. Roby, President, Praxair Asia
Sally A. Savoia, Vice President, Human Resources
Todd A. Skare, President, Praxair Europe
Matthew J. White, President, Praxair Canada
Daniel H. Yankowski, President, Global Hydrogen
UNITED STATESSECURITIES AND EXCHANGE COMMISSION
WASHINGTON, D.C. 20549
FORM 10-KÍ ANNUAL REPORT PURSUANT TO SECTION 13 OR 15(d) OF THE
SECURITIES EXCHANGE ACT OF 1934For the fiscal year ended December 31, 2012
OR‘ TRANSITION REPORT PURSUANT TO SECTION 13 OR 15(d) OF THE
SECURITIES EXCHANGE ACT OF 1934For the transition period from to
Commission file number 1-11037
Praxair, Inc.Praxair, Inc.
39 Old Ridgebury Road State of incorporation: DelawareDanbury, Connecticut 06810-5113 IRS identification number: 06-124 9050
Tel. (203) 837-2000Securities registered pursuant to Section 12(b) of the Act:
Title of each class: Registered on:
Common Stock ($0.01 par value) New York Stock ExchangeSecurities registered pursuant to Section 12(g) of the Act: None
Indicate by check mark if the registrant is a well-known seasoned issuer, as defined in Rule 405 of theSecurities Act. Yes Í No ‘
Indicate by check mark if the registrant is not required to file reports pursuant to Section 13 or Section 15(d)of the Act. Yes ‘ No Í
Indicate by check mark whether the registrant (1) has filed all reports required to be filed by Section 13 or15(d) of the Securities Exchange Act of 1934 during the preceding 12 months (or for such shorter period that theregistrant was required to file such reports), and (2) has been subject to such filing requirements for the past 90days. Yes Í No ‘
Indicate by check mark whether the registrant has submitted electronically and posted on its corporate Website, if any, every Interactive Data File required to be submitted and posted pursuant to Rule 405 of RegulationS-T (§232.405 of this chapter) during the preceding 12 months (or for such shorter period that the registrant wasrequired to submit and post such files). Yes Í No ‘
Indicate by check mark if disclosure of delinquent filers pursuant to Item 405 of Regulation S-K is notcontained herein, and will not be contained, to the best of registrant’s knowledge, in definitive proxy orinformation statements incorporated by reference in Part III of this Form 10-K or any amendment to thisForm 10-K. Í
Indicate by check mark whether the registrant is a large accelerated filer, an accelerated filer, a non-accelerated filer, or a smaller reporting company. See definitions of “large accelerated filer,” “accelerated filer,”and “smaller reporting company” in Rule 12b-2 of the Exchange Act.Large accelerated filer Í Accelerated filer ‘ Non- accelerated filer ‘ Smaller reporting company ‘
Indicate by check mark whether the registrant is a shell company (as defined in Rule 12b-2 of theAct). Yes ‘ No Í
The aggregate market value of the voting and non-voting common stock held by non-affiliates as of June 30,2012, was approximately $32 billion (based on the closing sale price of the stock on that date as reported on theNew York Stock Exchange).
At January 31, 2013, 296,188,748 shares of common stock of Praxair, Inc. were outstanding.Documents incorporated by reference:
Portions of the Proxy Statement of Praxair, Inc., for its 2013 Annual Meeting of Shareholders, areincorporated in Part III of this report.
PRAXAIR, INC.
ANNUAL REPORT ON FORM 10-KFor the fiscal year ended December 31, 2012
TABLE OF CONTENTS
Page
Part I
Item 1: Business 3Item 1A: Risk Factors 6Item 1B: Unresolved Staff Comments 10Item 2: Properties 10Item 3: Legal Proceedings 11Item 4: Mine Safety Disclosures 11
Part II
Item 5: Market for Registrant’s Common Equity, Related Stockholder Matters and IssuerPurchases of Equity Securities 12
Item 6: Selected Financial Data 14Item 7: Management’s Discussion and Analysis of Financial Condition and Results of Operations 15Item 7A: Quantitative and Qualitative Disclosures About Market Risk 45Item 8: Financial Statements and Supplementary Data 46Item 9: Changes in and Disagreements with Accountants on Accounting and Financial Disclosure 96Item 9A: Controls and Procedures 96Item 9B: Other Information 96
Part III
Item 10: Directors, Executive Officers and Corporate Governance 97Item 11: Executive Compensation 97Item 12: Security Ownership of Certain Beneficial Owners and Management and Related
Stockholder Matters 97Item 13: Certain Relationships and Related Transactions and Director Independence 98Item 14: Principal Accounting Fees and Services 98
Part IV
Item 15: Exhibits and Financial Statement Schedules 99
Signatures 100
Index to Exhibits 101
2
Praxair, Inc. and Subsidiaries
PART I
ITEM 1. BUSINESS
General
Praxair, Inc. (Praxair or the company) was founded in 1907 and became an independent publicly traded company in 1992.Praxair was the first company in the United States to produce oxygen from air using a cryogenic process and continues to be amajor technological innovator in the industrial gases industry.
Praxair is the largest industrial gas supplier in North and South America, is rapidly growing in Asia, and has strong, well-established businesses in Europe. Praxair’s primary products in its industrial gases business are atmospheric gases (oxygen,nitrogen, argon, rare gases) and process gases (carbon dioxide, helium, hydrogen, electronic gases, specialty gases, acetylene). Thecompany also designs, engineers, and builds equipment that produces industrial gases for internal use and external sale. Thecompany’s surface technologies segment, operated through Praxair Surface Technologies, Inc., supplies wear-resistant and high-temperature corrosion-resistant metallic and ceramic coatings and powders. Praxair’s sales were $11,224 million, $11,252 million,and $10,116 million for 2012, 2011, and 2010, respectively. Refer to Note 18 to the consolidated financial statements for additionalinformation related to Praxair’s reportable segments.
Praxair serves approximately 25 industries as diverse as healthcare and petroleum refining; computer-chip manufacturing andbeverage carbonation; fiber-optics and steel making; and aerospace, chemicals and water treatment. In 2012, 94% of sales weregenerated in four geographic segments (North America, Europe, South America and Asia) primarily from the sale of industrialgases, with the balance generated from the surface technologies segment. Praxair provides a competitive advantage to its customersby continuously developing new products and applications, which allow them to improve their productivity, energy efficiency andenvironmental performance.
Industrial Gases Products and Manufacturing Processes
Atmospheric gases are the highest volume products produced by Praxair. Using air as its raw material, Praxair producesoxygen, nitrogen and argon through several air separation processes of which cryogenic air separation is the most prevalent. As apioneer in the industrial gases industry, Praxair is a leader in developing a wide range of proprietary and patented applications andsupply systems technology. Praxair also led the development and commercialization of non-cryogenic air separation technologiesfor the production of industrial gases. These technologies open important new markets and optimize production capacity for thecompany by lowering the cost of supplying industrial gases. These technologies include proprietary vacuum pressure swingadsorption (“VPSA”) and membrane separation to produce gaseous oxygen and nitrogen, respectively. Praxair also manufacturesprecious metal and ceramic sputtering targets used primarily in the production of semiconductors.
Process gases, including carbon dioxide, hydrogen, carbon monoxide, helium, specialty gases and acetylene are produced bymethods other than air separation. Most carbon dioxide is purchased from by-product sources, including chemical plants, refineriesand industrial processes and is recovered from carbon dioxide wells. Carbon dioxide is processed in Praxair’s plants to producecommercial and food-grade carbon dioxide. Hydrogen and carbon monoxide are produced by either steam methane reforming ofnatural gas or by purifying by-product sources obtained from the chemical and petrochemical industries. Most of the helium soldby Praxair is sourced from certain helium-rich natural gas streams in the United States, with additional supplies being acquiredfrom outside the United States. Acetylene can be produced from calcium carbide and water. Praxair purchases a significantpercentage as a chemical by-product.
Industrial Gases Distribution
There are three basic distribution methods for industrial gases: (i) on-site or tonnage; (ii) merchant liquid; and (iii) packagedor cylinder gases. These distribution methods are often integrated, with products from all three supply modes coming from thesame plant. The method of supply is generally determined by the lowest cost means of meeting the customer’s needs, dependingupon factors such as volume requirements, purity, pattern of usage, and the form in which the product is used (as a gas or as acryogenic liquid).
On-site. Customers that require the largest volumes of product (typically oxygen, nitrogen and hydrogen) and that have arelatively constant demand pattern are supplied by cryogenic and process gas on-site plants. Praxair constructs plants on oradjacent to these customers’ sites and supplies the product directly to customers by pipeline. On-site product supply contractsgenerally are total requirement contracts with terms typically ranging from 10-20 years and containing minimum purchaserequirements and price escalation provisions. Many of the cryogenic on-site plants also produce liquid products for the merchantmarket. Therefore, plants are typically not dedicated to a single customer. Advanced air separation processes allow on-site deliveryto customers with smaller volume requirements. Customers using these systems usually enter into requirement contracts with termstypically ranging from 5-15 years.
3
Merchant. The merchant business is generally associated with distributable liquid oxygen, nitrogen, argon, carbon dioxide,hydrogen and helium. The deliveries generally are made from Praxair’s plants by tanker trucks to storage containers owned orleased and maintained by Praxair or the customer at the customer’s site. Due to distribution cost, merchant oxygen and nitrogengenerally have a relatively small distribution radius from the plants at which they are produced. Merchant argon, hydrogen andhelium can be shipped much longer distances. The agreements used in the merchant business are usually three-to five-yearrequirement contracts.
Packaged Gases. Customers requiring small volumes are supplied products in metal containers called cylinders, undermedium to high pressure. Packaged gases include atmospheric gases, carbon dioxide, hydrogen, helium and acetylene. Praxair alsoproduces and distributes in cylinders a wide range of specialty gases and mixtures. Cylinders may be delivered to the customer’ssite or picked up by the customer at a packaging facility or retail store. Packaged gases are generally sold by purchase orders.
A substantial amount of the cylinder gases sold in the United States is distributed by independent distributors that buymerchant gases in liquid form and repackage the products in their facilities. Packaged gas distributors, including Praxair, alsodistribute welding equipment purchased from independent manufacturers. Over time, Praxair has acquired a number ofindependent industrial gases and welding products distributors at various locations in the United States and continues to sellmerchant gases to other independent distributors. Between its own distribution business, joint ventures and sales to independentdistributors, Praxair is represented in 48 states, the District of Columbia and Puerto Rico.
Surface Technologies
Praxair Surface Technologies is a leading worldwide supplier of coatings services and thermal spray consumables tocustomers in the aircraft, energy, printing, primary metals, petrochemical, textile, and other industries. Its coatings are used toprovide wear resistance, corrosion protection, thermal insulation, and many other surface-enhancing functions which serve toextend component life, enable optimal performance, and reduce operating costs. It also manufactures a complete line of electricarc, plasma and wire spray, and high-velocity oxy-fuel (“HVOF”) equipment.
Inventories – Praxair carries inventories of merchant and cylinder gases, hardgoods and coatings materials to supply products toits customers on a reasonable delivery schedule. On-site plants and pipeline complexes have limited inventory. Inventoryobsolescence is not material to Praxair’s business.
Customers – Praxair is not dependent upon a single customer or a few customers.
International – Praxair is a global enterprise with approximately 62% of its 2012 sales outside of the United States. It conductsindustrial gases business through consolidated companies in Argentina, Bahrain, Belgium, Bolivia, Brazil, Canada, Chile, China,Colombia, Costa Rica, Denmark, Dominican Republic, France, Germany, India, Italy, Japan, South Korea, Mexico, theNetherlands, Norway, Paraguay, Peru, Portugal, Puerto Rico, Russia, Saudi Arabia, Spain, Sweden, Taiwan, Thailand, United ArabEmirates, Uruguay and Venezuela. Societa Italiana Acetilene & Derivati S.p.A. (“S.I.A.D.”), an Italian company accounted for asan equity company, also has established positions in Austria, Bosnia, Bulgaria, Croatia, the Czech Republic, Hungary, Romania,Russia, Serbia, Slovakia, Slovenia and Ukraine. Refrigeration and Oxygen Company Limited (“ROC”), a Middle Eastern companyaccounted for as an equity company, has operations in the United Arab Emirates, Kuwait and Qatar. Praxair’s surface technologiessegment has operations in Brazil, Canada, China, France, Germany, India, Italy, Japan, Singapore, South Korea and the UnitedKingdom.
Praxair’s international business is subject to risks customarily encountered in foreign operations, including fluctuations in foreigncurrency exchange rates, import and export controls, and other economic, political and regulatory policies of local governments.Also, see Item 1A. “Risk Factors” and Item 7A. “Quantitative and Qualitative Disclosures About Market Risk.”
Seasonality – Praxair’s business is generally not subject to seasonal fluctuations to any significant extent.
Research and Development – Praxair’s research and development is directed toward developing new and improved methods forthe production and distribution of industrial gases and the development of new markets and applications for these gases. Thisresults in the development of new advanced air separation and hydrogen process technologies and the frequent introduction of newindustrial gas applications. Research and development for industrial gases is principally conducted at Tonawanda, New York; BurrRidge, Illinois; Shanghai, China; and Bangalore, India.
Praxair conducts research and development for its surface technologies to improve the quality and durability of coatings and theuse of specialty powders for new applications and industries. Surface technologies research is conducted at Indianapolis, Indiana.
Patents and Trademarks – Praxair owns or licenses a large number of United States and foreign patents that relate to a widevariety of products and processes. Praxair’s patents expire at various times over the next 20 years. While these patents and licensesare considered important to our individual businesses, Praxair does not consider its business as a whole to be
4
materially dependent upon any one particular patent, or patent license, or family of patents. Praxair also owns a large number ofvaluable trademarks. Only the “Praxair” trademark is important to our business as a whole.
Raw Materials and Energy Costs – Energy is the single largest cost item in the production and distribution of industrial gases.Most of Praxair’s energy requirements are in the form of electricity, natural gas and diesel fuel for distribution.
The supply of energy has not been a significant issue in the geographic areas where the company conducts business. However,energy availability and price is unpredictable and may pose unforeseen future risks.
For carbon dioxide, carbon monoxide, helium, hydrogen, specialty gases and surface technologies, raw materials are largely purchasedfrom outside sources. Praxair has contracts or commitments for, or readily available sources of, most of these raw materials; however,their long-term availability and prices are subject to market conditions.
Competition – Praxair operates within a highly competitive environment. Some of its competitors are larger in size and capitalbase than Praxair. Competition is based on price, product quality, delivery, reliability, technology and service to customers.
Major competitors in the industrial gases industry both in the United States and worldwide include Air Products and Chemicals,Inc., Airgas Inc., L’Air Liquide S.A., and Linde AG. Principal competitors for the surface technologies businesses are ChromalloyGas Turbine Corporation, a subsidiary of Sequa Corporation, Bodycote, PLC, and Sulzer Ltd. Other competitors in surface coatingtechnologies vary by geographic region.
Employees and Labor Relations – As of December 31, 2012, Praxair had 26,539 employees worldwide. Of this number, 9,693are employed in the United States. Praxair has collective bargaining agreements with unions at numerous locations throughout theworld, which expire at various dates. Praxair considers relations with its employees to be good.
Environment – Information required by this item is incorporated herein by reference to the section captioned “Management’sDiscussion and Analysis – Environmental Matters” in Item 7 of this 10-K.
Available Information – The company makes its periodic and current reports available, free of charge, on or through its website,www.praxair.com, as soon as practicable after such material is electronically filed with, or furnished to, the Securities andExchange Commission (“SEC”). Investors may also access from the company website other investor information such as pressreleases and presentations. Information on the company’s website is not incorporated by reference herein.
In addition, the public may read and copy any materials filed with the SEC at the SEC’s Public Reference Room located at 100 FStreet NE, Washington, D.C. 20549. The public may also obtain information on the operation of the Public Reference Room bycalling the SEC at 1-800-SEC-0330. The SEC also maintains a website, www.sec.gov, that contains reports, proxy informationstatements and other information regarding issuers that file electronically.
Executive Officers – The following Executive Officers have been elected by the Board of Directors and serve at the pleasure ofthe Board. It is expected that the Board will elect officers annually following each annual meeting of shareholders.
Stephen F. Angel, 57, is Chairman and Chief Executive Officer of Praxair, Inc. since 2007. Before this, Mr. Angel served asPresident & Chief Operating Officer from March to December 2006, and as Executive Vice President from 2001 to March 2006. Priorto joining Praxair in 2001, Mr. Angel was General Manager for the General Electric Company Industrial Systems Power Equipmentbusiness from 1999 to 2001, and was General Manager, Marketing and Sales, for General Electric’s Transportation Systems businessfrom 1996 to 1999. Mr. Angel is a director of PPG Industries, Inc., a member of the Board of the U.S.-China Business Council, amember of the U.S.-Brazil CEO Forum, a member of The Business Council, and a member of the Board of the Business Roundtable.
James T. Breedlove, 65, is Senior Vice President, General Counsel and Secretary of Praxair, Inc. and served as Vice President,General Counsel and Secretary from 2004 to 2006. Prior to joining Praxair in 2004, Mr. Breedlove was Senior Vice President andGeneral Counsel at GE Equipment Services from 2002, and from 1992 to 2002 he served as a Senior Vice President of a divisionof General Electric Capital Corp.
Domingos H. G. Bulus, 51, is a Senior Vice President of Praxair, Inc. overseeing Praxair’s businesses in South America, andserved as a Vice President from 2003 to 2011. He is also President of White Martins Gases Industriais Ltda. (“White Martins”),Praxair’s Brazilian subsidiary, since 2003. He served as President of Praxair Asia from 2001 to 2003. Mr. Bulus also served asExecutive Director of the Andean Treaty region for White Martins from 1996 to 2001.
Elizabeth T. Hirsch, 59, is Vice President and Controller of Praxair, Inc. since December 2010. Prior to becoming Controller, sheserved as Praxair’s Director of Investor Relations since 2002 and as Vice President of Investor Relations since October 2010. Shejoined Praxair in 1995 as Director of Corporate Finance and later served as Assistant Treasurer. Previously, she had fifteen years ofexperience in corporate banking, primarily at Manufacturers Hanover Trust Company.
Eduardo F. Menezes, 49, was promoted to Executive Vice President from Senior Vice President effective March 1, 2012. Heoversees Praxair’s North American Industrial Gases and Mexico businesses and Praxair Distribution, Inc. (the packaged gases
5
business). From 2010 to March 2011, he was a Vice President of Praxair with responsibility for the North American IndustrialGases business. From 2007 to 2010, he was President of Praxair Europe. He served as Managing Director of Praxair’s business inMexico from 2004 to 2007, as Vice President and General Manager for Praxair Distribution, Inc. from 2003 to 2004 and as VicePresident, U.S. West Region, for North American Industrial Gases, from 2000 to 2003.
Raymond P. Roberge, 62, was promoted to Senior Vice President from Vice President, effective April 24, 2012, and has been theChief Technology Officer since 2008. He is also responsible for Praxair’s Global Supply Systems, Global Operations Excellenceand Sustainable Development. Mr. Roberge joined Praxair in 1973 in research and development and subsequently held positions inapplications technology, business management, marketing and Accelerated Quality Implementation. In 1996, he became director ofbusiness development for advanced air separation, and added ceramic membrane development to his portfolio two years later.Mr. Roberge moved to Global Supply Systems in 1993 as director of product line development. He became vice president ofPraxair/MRC in 1999, and in 2002 was named vice president, Sales and Business Development, for Praxair Electronics. He becamepresident of Praxair Electronics in 2005.
Sally A. Savoia, 57, is Vice President, Human Resources of Praxair since 2002. She joined Praxair in 1981, holding positions inmarketing, operations and quality before being named business manager, merchant gases, North America, in 1989. In 1993, shewas named associate director, Investor Relations, and the following year became director of Praxair’s worldwide re-engineeringand quality programs. She was named vice president and general manager, Helium and Rare gases, in 1996 and became vicepresident, Healthcare, in 1998.
James S. Sawyer, 56, has been Chief Financial Officer of Praxair since 2000 and was named Executive Vice President and ChiefFinancial Officer in 2006. He was Vice President and Treasurer from 1994 until 2000. He joined Praxair in 1985 and held variousfinancial roles including Finance Director for Europe between 1989 and 1992 and Assistant Treasurer from 1992 through 1994.
Scott E. Telesz, 45, was promoted to Executive Vice President from Senior Vice President, effective March 1, 2012. He isresponsible for Praxair’s business in Asia, Europe/Russia, the Middle East, Praxair Surface Technologies, Strategic Planning, andthe Company’s Global Procurement and Materials Management group. Before joining Praxair in 2010, he was a Vice Presidentfrom 2007 to 2010 of SABIC Innovative Plastics, a major division of Riyadh-based Saudi Basic Industries Corporation, a globalmanufacturer of chemicals, fertilizers, plastics and metals. From 1998 to 2007, he held a variety of general management positionswith General Electric, and from 1989 to 1998, Mr. Telesz held several positions, including Engagement Manager in the UnitedStates and Australia, with McKinsey & Company.
ITEM 1A. RISK FACTORS
Due to the size and geographic reach of the company’s operations, a wide range of factors, many of which are outside of thecompany’s control, could materially affect the company’s future operations and financial performance. Management believes thefollowing risks may significantly impact the company:
General Economic Conditions – Weakening economic conditions in markets in which the company does business may adverselyimpact the company’s financial results and/or cash flows.
Praxair serves approximately 25 diverse industries across more than 50 countries, which generally leads to financial stabilitythrough various business cycles. However, a broad decline in general economic or business conditions in the industries served byits customers could adversely affect the demand for Praxair’s products and impair the ability of our customers to satisfy theirobligations to the company, resulting in uncollected receivables and/or unanticipated contract terminations or project delays. Inaddition, many of the company’s customers are in businesses that are cyclical in nature, such as the chemicals, electronics, metalsand refining industries. Downturns in these industries may adversely impact the company during these cycles. Additionally, suchconditions could impact the utilization of the company’s manufacturing capacity which may require the company to recognizeimpairment losses on tangible assets such as property, plant and equipment as well as intangible assets such as intellectual propertyor goodwill.
Cost and Availability of Raw Materials and Energy – Increases in the cost of energy and raw materials and/or disruption in thesupply of these materials could result in lost sales or reduced profitability.
Energy is the single largest cost item in the production and distribution of industrial gases. Most of Praxair’s energyrequirements are in the form of electricity, natural gas and diesel fuel for distribution. Praxair attempts to minimize the financialimpact of variability in these costs through the management of customer contracts and energy efficiency initiatives. Large customercontracts typically have escalation and pass-through clauses to recover energy and feedstock costs. Such attempts may notsuccessfully mitigate cost variability which could negatively impact its financial condition or results of operations. The supply ofenergy has not been a significant issue in the geographic areas where it conducts business. However, regional energy conditions areunpredictable and may pose future risk.
6

For carbon dioxide, carbon monoxide, helium, hydrogen, specialty gases and surface technologies, raw materials are largelypurchased from outside sources. Praxair has contracts or commitments for, or readily available sources of, most of these rawmaterials; however, their long-term availability and prices are subject to market conditions. A disruption in supply of such rawmaterials could impact the company’s ability to meet contractual supply commitments.
International Events and Circumstances – The company’s international operations are subject to the risks of doing businessabroad and international events and circumstances may adversely impact its business, financial condition or results of operations.
Praxair has substantial international operations which are subject to risks including devaluations in currency exchange rates,transportation delays and interruptions, political and economic instability and disruptions, restrictions on the transfer of funds, theimposition of duties and tariffs, import and export controls, changes in governmental policies, labor unrest, possible nationalizationand/or expropriation of assets, domestic and international tax laws and compliance with governmental regulations. These eventscould have an adverse effect on the international operations in the future by reducing the demand for its products, decreasing theprices at which it can sell its products, reducing the U.S. dollar value of revenue from international operations or otherwise havingan adverse effect on its business. In particular, due to government actions related to business and currency regulations, there isconsiderable risk associated with operations in Venezuela (see Notes 2 and 20 to the consolidated financial statements). AtDecember 31, 2012, Praxair’s sales and net assets in Venezuela were less than 1% of Praxair’s consolidated amounts. Also, theCompany is monitoring developments regarding the collectability of government receivables from healthcare sales to publichospitals in Spain and Italy where economic conditions remain challenging and uncertain. Historically, collection of suchgovernment receivables has extended well beyond the contractual terms of sale; however, payment has always been received. AtDecember 31, 2012, government receivables in Spain and Italy totaled about $88 million.
Global Financial Markets Conditions – Macroeconomic factors may impact the company’s ability to obtain financing or increasethe cost of obtaining financing which may adversely impact the company’s financial results and/or cash flows.
Volatility and disruption in the U.S. and global credit and equity markets, from time to time, could make it more difficult forPraxair to obtain financing for its operations and/or could increase the cost of obtaining financing. In addition, the company’sborrowing costs can be affected by short and long-term debt ratings assigned by independent rating agencies which are based, insignificant part, on the company’s performance as measured by certain criteria such as interest coverage and leverage ratios. Adecrease in these debt ratings could increase the cost of borrowing or make it more difficult to obtain financing. While the impactof volatility in the global credit markets cannot be predicted with certainty, the company believes that it has sufficient operatingflexibility, cash reserves, and funding sources to maintain adequate amounts of liquidity to meet its business needs around theworld.
Competitor Actions – The inability to effectively compete could adversely impact results of operations.
Praxair operates within a highly competitive environment worldwide. Competition is based on price, product quality, delivery,reliability, technology and service to customers. Competitors’ behavior related to these areas could potentially have significantimpacts on the company’s financial results.
Governmental Regulations – The company is subject to a variety of United States and foreign government regulations. Changes inthese regulations could have an adverse impact on the business, financial position and results of operations.
The company is subject to regulations in the following areas, among others:
• Environmental protection;
• Domestic and international tax laws and currency controls;
• Safety;
• Securities laws (e.g., SEC and generally accepted accounting principles in the United States);
• Trade and import/ export restrictions;
• Antitrust matters;
• Global anti-bribery laws;
• Healthcare reimbursement regulations; and
• Conflict minerals
Changes in these or other regulatory areas may impact the company’s profitability, may require the company to spendadditional resources to comply with the regulations, or may restrict the company’s ability to compete effectively in themarketplace. Noncompliance with such laws and regulations could result in penalties or sanctions that could have an adverse
7
impact on the company’s financial results. Environmental protection ,and healthcare reimbursement legislation are discussedfurther below.
Praxair is subject to various environmental and occupational health and safety laws and regulations, including those governingthe discharge of pollutants into the air or water, the storage, handling and disposal of chemicals, hazardous substances and wastes,the remediation of contamination, the regulation of greenhouse gas emissions, and other potential climate change initiatives.Violations of these laws could result in substantial penalties, third party claims for property damage or personal injury, orsanctions. The company may also be subject to liability for the investigation and remediation of environmental contamination atproperties that it owns or operates and at other properties where Praxair or its predecessors have operated or arranged for thedisposal of hazardous wastes. Although management does not believe that any such liabilities will have a material adverse impacton its financial position and results of operations, management cannot provide assurance that such costs will not increase in thefuture or will not become material. See the section captioned “Management’s Discussion and Analysis – Environmental Matters”in Item 7 of this Form 10-K.
Catastrophic Events – Catastrophic events could disrupt the operations of the company and/or its customers and suppliers andmay have a significant adverse impact on the results of operations.
The occurrence of catastrophic events or natural disasters such as hurricanes, health epidemics, acts of war or terrorism, coulddisrupt or delay the company’s ability to produce and distribute its products to customers and could potentially expose thecompany to third-party liability claims. In addition, such events could impact the company’s customers and suppliers resulting intemporary or long-term outages and/or the limitation of supply of energy and other raw materials used in normal businessoperations. These situations are outside the company’s control and may have a significant adverse impact on the company’sfinancial results.
Retaining Qualified Personnel – The inability to attract and retain qualified personnel may adversely impact the company’sbusiness.
If Praxair fails to attract, hire and retain qualified personnel, the company may not be able to develop, market or sell itsproducts or successfully manage its business. Praxair is dependent upon its highly skilled, experienced and efficient workforce tobe successful. Much of Praxair’s competitive advantage is based on the expertise and experience of its key personnel regarding itsmarketing, technology, manufacturing and distribution infrastructure, systems and products. The inability to attract and hirequalified individuals or the loss of key employees in very skilled areas could have a negative effect on the company’s financialresults.
Technological Advances – If the company fails to keep pace with technological advances in the industry or if new technologyinitiatives do not become commercially accepted, customers may not continue to buy the company’s products and results ofoperations could be adversely affected.
Praxair’s research and development is directed toward developing new and improved methods for the production anddistribution of industrial gases and the development of new markets and applications for the use of these gases. This results inthe frequent introduction of new industrial gas applications and the development of new advanced air separation processtechnologies. The company also conducts research and development for its surface technologies to improve the quality anddurability of coatings and the use of specialty powders for new applications and industries. As a result of these efforts, thecompany develops new and proprietary technologies and employs necessary measures to protect such technologies within theglobal geographies in which the company operates. These technologies help Praxair to create a competitive advantage and toprovide a platform for the company to grow its business at greater percentages than the rate of industrial production growth insuch geographies. If Praxair’s research and development activities do not keep pace with competitors or if it does not create newtechnologies that benefit customers, future results of operations could be adversely affected.
Litigation and Governmental Investigations – The outcomes of litigation and governmental investigations may affect thecompany’s financial results.
Praxair is subject to various lawsuits and governmental investigations arising out of the normal course of business that mayresult in adverse outcomes. These actions are based upon alleged environmental, tax, antitrust and personal injury claims,among others. Adverse outcomes in some or all of the claims pending may result in significant monetary damages or injunctiverelief that could adversely affect its ability to conduct business. While management currently believes that resolving all of thesematters, individually or in the aggregate, will not have a material adverse impact on the company’s financial position orliquidity, the litigation and other claims Praxair faces are subject to inherent uncertainties and management’s view of thesematters may change in the future. There exists the possibility of a material adverse impact on the company’s results ofoperations for the period in which the effect of an unfavorable final outcome becomes probable and reasonably estimable.
8

Tax Liabilities – Potential tax liabilities could adversely impact the company’s financial position and results of operations.
Praxair is subject to income and other taxes in both the United States and numerous foreign jurisdictions. The determinationof the company’s worldwide provision for income taxes and other tax liabilities requires judgment and is based on diverselegislative and regulatory structures that exist in the various jurisdictions where the company operates. Although managementbelieves its estimates are reasonable, the ultimate tax outcome may differ from the amounts recorded in its financial statements andmay materially affect the company’s financial results for the period when such determination is made. See Notes 5 and 17 to theconsolidated financial statements of this Form 10-K.
Pension Liabilities – Risks related to our pension benefit plans may adversely impact our results of operations and cash flows.
Pension benefits represent significant financial obligations that will be ultimately settled in the future with employees whomeet eligibility requirements. Because of the uncertainties involved in estimating the timing and amount of future payments andasset returns, significant estimates are required to calculate pension expense and liabilities related to the company’s plans. Thecompany utilizes the services of independent actuaries, whose models are used to facilitate these calculations. Several keyassumptions are used in the actuarial models to calculate pension expense and liability amounts recorded in the consolidatedfinancial statements. In particular, significant changes in actual investment returns on pension assets, discount rates, or legislativeor regulatory changes could impact future results of operations and required pension contributions. For information regarding thepotential impacts regarding significant assumptions used to estimate pension expense, including discount rates and the expectedlong-term rates of return on plan assets. See “Critical Accounting Policies – Pension Benefits” included in “Management’sDiscussion and Analysis of Financial Condition and Results of Operations” in Item 7 of this Form 10-K.
Operational Risks – Operational risks may adversely impact the company’s business or results of operations.
Praxair’s operating results are dependent on the continued operation of its production facilities and its ability to meet customercontract requirements and other needs. Insufficient or excess capacity threatens the company’s ability to generate competitiveprofit margins and may expose the company to liabilities related to contract commitments. Operating results are also dependent onthe company’s ability to complete new construction projects on time, on budget and in accordance with performance requirements.Failure to do so may expose the business to loss of revenue, potential litigation and loss of business reputation.
Also inherent in the management of the company’s production facilities and delivery systems, including storage, vehicletransportation and pipelines, are operational risks that require continuous training, oversight and control. Material operatingfailures at production, storage facilities or pipelines, including fire, toxic release and explosions, or the occurrence of vehicletransportation accidents could result in loss of life, damage to the environment, loss of production and/or extensive propertydamage, all of which may negatively impact the company’s financial results.
Information Technology Systems – The Company may be subject to information technology system failures, network disruptionsand breaches in data security.
Praxair relies on IT systems and networks for business and operational activities, and also stores and processes sensitivebusiness and proprietary information in these systems and networks. These systems are susceptible to outages due to fire, flood,power loss, telecommunications failures, viruses, break-ins and similar events, or breaches of security. Management has takensteps to address these risks and concerns by implementing advanced security technologies, internal controls, network and datacenter resiliency and recovery process. Despite these steps, however, operational failures and breaches of security fromincreasingly sophisticated cyber threats could lead to the loss or disclosure of confidential information, result in regulatory actionsand have a material adverse impact on Praxair’s operations, reputation and financial results.
Acquisitions and Joint Ventures – The inability to effectively integrate acquisitions or collaborate with joint venture partners couldadversely impact the company’s financial position and results of operations.
Praxair has evaluated, and expects to continue to evaluate, a wide array of potential strategic acquisitions and joint ventures.Many of these transactions, if consummated, could be material to its financial condition and results of operations. In addition, theprocess of integrating an acquired company, business or group of assets may create unforeseen operating difficulties andexpenditures. Although historically the company has been successful with its acquisition strategy and execution, the areas wherethe company may face risks include:
• The need to implement or remediate controls, procedures and policies appropriate for a larger public company atcompanies that prior to the acquisition lacked these controls, procedures and policies;
• Diversion of management time and focus from operating existing business to acquisition integration challenges;
• Cultural challenges associated with integrating employees from the acquired company into the existing organization;
9
• The need to integrate each company’s accounting, management information, human resource and other administrativesystems to permit effective management;
• Difficulty with the assimilation of acquired operations and products;
• Failure to achieve targeted synergies; and
• Inability to retain key employees and business relationships of acquired companies.
Foreign acquisitions and joint ventures involve unique risks in addition to those mentioned above, including those related tointegration of operations across different cultures and languages, currency risks and the particular economic, political andregulatory risks associated with specific countries. Also, the anticipated benefit of the company’s acquisitions may not materialize.Future acquisitions or dispositions could result in potentially dilutive issuances of equity securities, the incurrence of debt,contingent liabilities or amortization expenses, or impairments of goodwill, any of which could adversely impact the company’sfinancial results.
ITEM 1B. UNRESOLVED STAFF COMMENTS
Praxair has received no written SEC staff comments regarding any of its Exchange Act reports which remain unresolved.
ITEM 2. PROPERTIES
Praxair’s worldwide headquarters are located in leased office space in Danbury, Connecticut. Other principal administrativeoffices are owned in Tonawanda, New York, and leased in Rio de Janeiro, Brazil; Shanghai, China and Madrid, Spain.
Praxair designs, engineers, manufactures and operates facilities that produce and distribute industrial gases. These industrialgas production facilities and certain components are designed and/or manufactured at its facilities in Tonawanda, New York; BurrRidge, Illinois; Rio de Janeiro, Brazil; Monterrey, Mexico; Shanghai, China; and Bangalore, India. Praxair’s Italian equity affiliate,S.I.A.D., also has such capacity.
Due to the nature of Praxair’s industrial gas products, it is generally uneconomical to transport them distances greater than afew hundred miles from the production facility. As a result, Praxair operates a significant number of production facilities spreadglobally throughout a number of geographic regions.
The following is a description of production facilities for Praxair by segment. No significant portion of these assets was leasedat December 31, 2012. Generally, these facilities are fully utilized and are sufficient to meet our manufacturing needs.
North America
The North America segment operates production facilities in the U.S., Canada and Mexico, approximately 245 of which arecryogenic air separation plants, hydrogen plants and carbon dioxide plants. There are five major pipeline complexes in NorthAmerica located in Northern Indiana, Houston, along the Gulf Coast of Texas, Detroit and Louisiana. Also located throughoutNorth America are packaged gas facilities, specialty gas plants, helium plants and other smaller plant facilities.
Europe
The Europe segment has production facilities primarily in Italy, Spain, Germany, the Benelux region, France, Scandinavia andRussia which include more than 55 cryogenic air separation plants. There are three major pipeline complexes in Europe located inNorthern Spain and the Rhine and Saar regions of Germany. These pipeline complexes are primarily supplied by cryogenic airseparation plants. Also located throughout Europe are specialty gas plants, packaged gas facilities and other smaller plant facilities.
South America
The South America segment operates more than 45 cryogenic air separation plants, primarily located in Brazil. Many of theseplants support a major pipeline complex in Southern Brazil. Also located throughout South America are carbon dioxide plants,packaged gas facilities and other smaller plant facilities.
Asia
The Asia segment has production facilities located primarily in China, Korea, India and Thailand, approximately 40 of whichare cryogenic air separation plants. Also located throughout Asia are noncryogenic air separation, carbon dioxide, hydrogen,packaged gas and other production facilities.
10
Surface Technologies
The surface technologies segment provides coating services and manufactures coating equipment at approximately 40 sites.The majority of these sites are located in the United States and Europe, with smaller operations in Asia, Brazil, India andheadquarters located in Indianapolis, Indiana.
ITEM 3. LEGAL PROCEEDINGS
Information required by this item is incorporated herein by reference to the section captioned “Notes to ConsolidatedFinancial Statements – 17 Commitments and Contingencies” in Item 8 of this 10-K.
ITEM 4. MINE SAFETY DISCLOSURES
Not Applicable
11
PART II
ITEM 5. MARKET FOR REGISTRANT’S COMMON EQUITY, RELATED STOCKHOLDER MATTERS ANDISSUER PURCHASES OF EQUITY SECURITIES
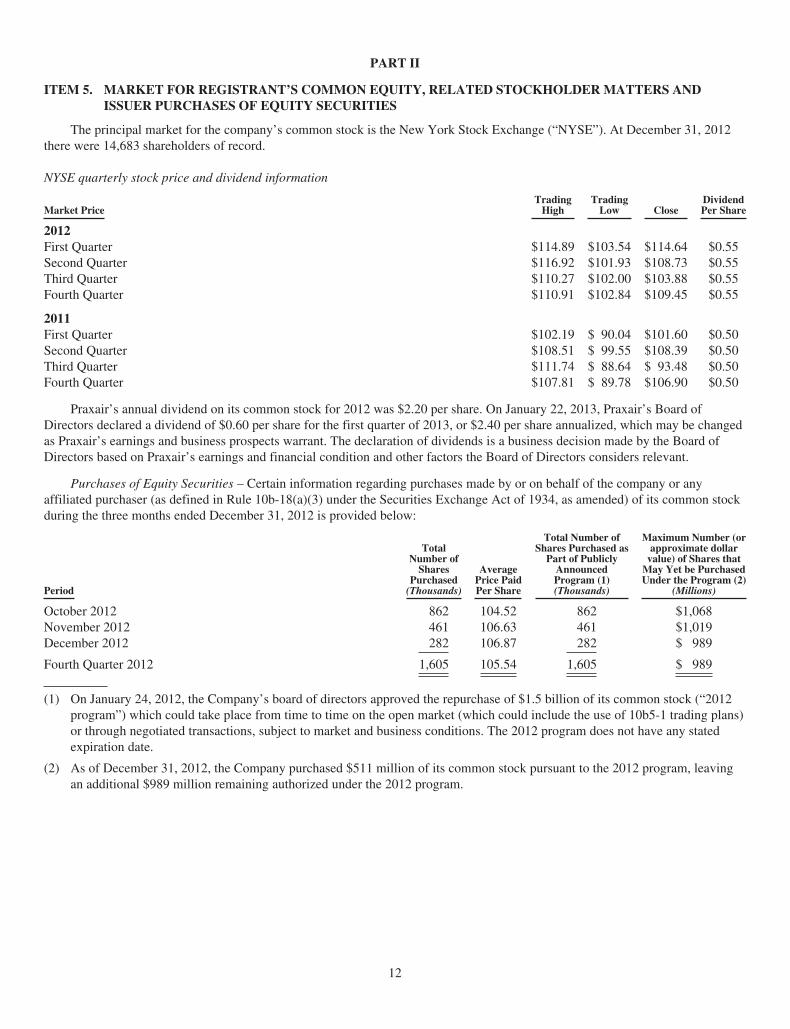
The principal market for the company’s common stock is the New York Stock Exchange (“NYSE”). At December 31, 2012there were 14,683 shareholders of record.
NYSE quarterly stock price and dividend information
Market PriceTrading
HighTrading
Low CloseDividendPer Share
2012First Quarter $114.89 $103.54 $114.64 $0.55Second Quarter $116.92 $101.93 $108.73 $0.55Third Quarter $110.27 $102.00 $103.88 $0.55Fourth Quarter $110.91 $102.84 $109.45 $0.55
2011First Quarter $102.19 $ 90.04 $101.60 $0.50Second Quarter $108.51 $ 99.55 $108.39 $0.50Third Quarter $111.74 $ 88.64 $ 93.48 $0.50Fourth Quarter $107.81 $ 89.78 $106.90 $0.50
Praxair’s annual dividend on its common stock for 2012 was $2.20 per share. On January 22, 2013, Praxair’s Board ofDirectors declared a dividend of $0.60 per share for the first quarter of 2013, or $2.40 per share annualized, which may be changedas Praxair’s earnings and business prospects warrant. The declaration of dividends is a business decision made by the Board ofDirectors based on Praxair’s earnings and financial condition and other factors the Board of Directors considers relevant.
Purchases of Equity Securities – Certain information regarding purchases made by or on behalf of the company or anyaffiliated purchaser (as defined in Rule 10b-18(a)(3) under the Securities Exchange Act of 1934, as amended) of its common stockduring the three months ended December 31, 2012 is provided below:
Period
TotalNumber of
SharesPurchased
(Thousands)
AveragePrice PaidPer Share
Total Number ofShares Purchased as
Part of PubliclyAnnouncedProgram (1)(Thousands)
Maximum Number (orapproximate dollar
value) of Shares thatMay Yet be PurchasedUnder the Program (2)
(Millions)
October 2012 862 104.52 862 $1,068November 2012 461 106.63 461 $1,019December 2012 282 106.87 282 $ 989
Fourth Quarter 2012 1,605 105.54 1,605 $ 989
(1) On January 24, 2012, the Company’s board of directors approved the repurchase of $1.5 billion of its common stock (“2012program”) which could take place from time to time on the open market (which could include the use of 10b5-1 trading plans)or through negotiated transactions, subject to market and business conditions. The 2012 program does not have any statedexpiration date.
(2) As of December 31, 2012, the Company purchased $511 million of its common stock pursuant to the 2012 program, leavingan additional $989 million remaining authorized under the 2012 program.
12
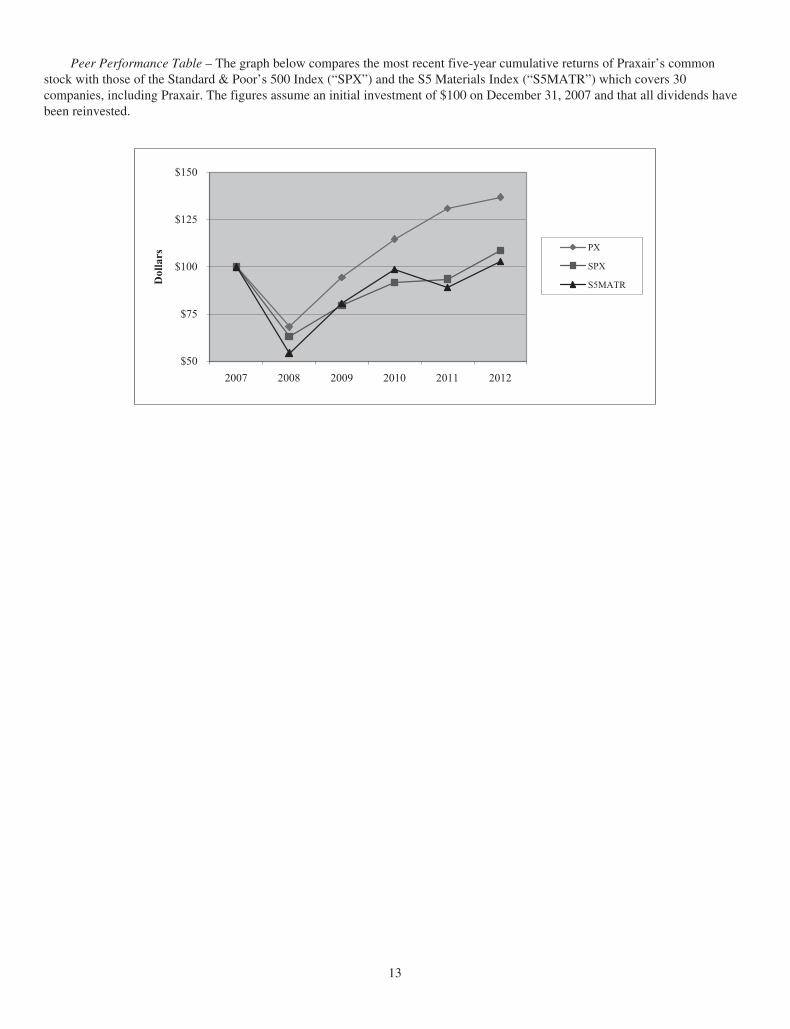
Peer Performance Table – The graph below compares the most recent five-year cumulative returns of Praxair’s commonstock with those of the Standard & Poor’s 500 Index (“SPX”) and the S5 Materials Index (“S5MATR”) which covers 30companies, including Praxair. The figures assume an initial investment of $100 on December 31, 2007 and that all dividends havebeen reinvested.
$50
$75
$100
$125
$150
2007 2008 2009 2010 2011 2012
Dollars
PX
SPX
S5MATR
13
ITEM 6. SELECTED FINANCIAL DATA
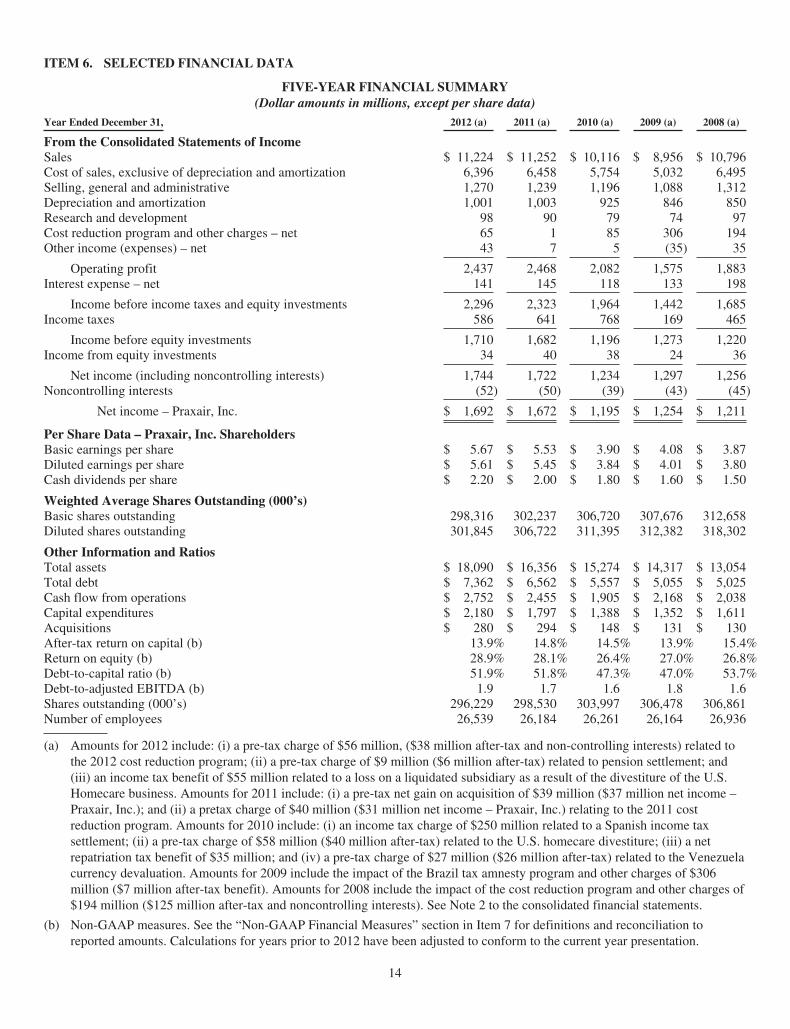
FIVE-YEAR FINANCIAL SUMMARY(Dollar amounts in millions, except per share data)
Year Ended December 31, 2012 (a) 2011 (a) 2010 (a) 2009 (a) 2008 (a)
From the Consolidated Statements of IncomeSales $ 11,224 $ 11,252 $ 10,116 $ 8,956 $ 10,796Cost of sales, exclusive of depreciation and amortization 6,396 6,458 5,754 5,032 6,495Selling, general and administrative 1,270 1,239 1,196 1,088 1,312Depreciation and amortization 1,001 1,003 925 846 850Research and development 98 90 79 74 97Cost reduction program and other charges – net 65 1 85 306 194Other income (expenses) – net 43 7 5 (35) 35
Operating profit 2,437 2,468 2,082 1,575 1,883Interest expense – net 141 145 118 133 198
Income before income taxes and equity investments 2,296 2,323 1,964 1,442 1,685Income taxes 586 641 768 169 465
Income before equity investments 1,710 1,682 1,196 1,273 1,220Income from equity investments 34 40 38 24 36
Net income (including noncontrolling interests) 1,744 1,722 1,234 1,297 1,256Noncontrolling interests (52) (50) (39) (43) (45)
Net income – Praxair, Inc. $ 1,692 $ 1,672 $ 1,195 $ 1,254 $ 1,211
Per Share Data – Praxair, Inc. ShareholdersBasic earnings per share $ 5.67 $ 5.53 $ 3.90 $ 4.08 $ 3.87Diluted earnings per share $ 5.61 $ 5.45 $ 3.84 $ 4.01 $ 3.80Cash dividends per share $ 2.20 $ 2.00 $ 1.80 $ 1.60 $ 1.50
Weighted Average Shares Outstanding (000’s)Basic shares outstanding 298,316 302,237 306,720 307,676 312,658Diluted shares outstanding 301,845 306,722 311,395 312,382 318,302
Other Information and RatiosTotal assets $ 18,090 $ 16,356 $ 15,274 $ 14,317 $ 13,054Total debt $ 7,362 $ 6,562 $ 5,557 $ 5,055 $ 5,025Cash flow from operations $ 2,752 $ 2,455 $ 1,905 $ 2,168 $ 2,038Capital expenditures $ 2,180 $ 1,797 $ 1,388 $ 1,352 $ 1,611Acquisitions $ 280 $ 294 $ 148 $ 131 $ 130After-tax return on capital (b) 13.9% 14.8% 14.5% 13.9% 15.4%Return on equity (b) 28.9% 28.1% 26.4% 27.0% 26.8%Debt-to-capital ratio (b) 51.9% 51.8% 47.3% 47.0% 53.7%Debt-to-adjusted EBITDA (b) 1.9 1.7 1.6 1.8 1.6Shares outstanding (000’s) 296,229 298,530 303,997 306,478 306,861Number of employees 26,539 26,184 26,261 26,164 26,936
(a) Amounts for 2012 include: (i) a pre-tax charge of $56 million, ($38 million after-tax and non-controlling interests) related tothe 2012 cost reduction program; (ii) a pre-tax charge of $9 million ($6 million after-tax) related to pension settlement; and(iii) an income tax benefit of $55 million related to a loss on a liquidated subsidiary as a result of the divestiture of the U.S.Homecare business. Amounts for 2011 include: (i) a pre-tax net gain on acquisition of $39 million ($37 million net income –Praxair, Inc.); and (ii) a pretax charge of $40 million ($31 million net income – Praxair, Inc.) relating to the 2011 costreduction program. Amounts for 2010 include: (i) an income tax charge of $250 million related to a Spanish income taxsettlement; (ii) a pre-tax charge of $58 million ($40 million after-tax) related to the U.S. homecare divestiture; (iii) a netrepatriation tax benefit of $35 million; and (iv) a pre-tax charge of $27 million ($26 million after-tax) related to the Venezuelacurrency devaluation. Amounts for 2009 include the impact of the Brazil tax amnesty program and other charges of $306million ($7 million after-tax benefit). Amounts for 2008 include the impact of the cost reduction program and other charges of$194 million ($125 million after-tax and noncontrolling interests). See Note 2 to the consolidated financial statements.
(b) Non-GAAP measures. See the “Non-GAAP Financial Measures” section in Item 7 for definitions and reconciliation toreported amounts. Calculations for years prior to 2012 have been adjusted to conform to the current year presentation.
14
ITEM 7. MANAGEMENT’S DISCUSSION AND ANALYSIS OF FINANCIAL CONDITION AND RESULTS OFOPERATIONS
The following discussion of the company’s financial condition and results of operations should be read together with itsconsolidated financial statements and notes to the consolidated financial statements included in Item 8 of this Form 10-K.
Page
Business Overview 15Executive Summary – Financial Results & Outlook 16Consolidated Results and Other Information 17Segment Discussion 24Liquidity, Capital Resources and Other Financial Data 33Contractual Obligations 36Off-Balance Sheet Arrangements 37Critical Accounting Policies 37New Accounting Standards 40Fair Value Measurements 40Non-GAAP Financial Measures 40Forward-Looking Statements 44
BUSINESS OVERVIEW
Praxair is the largest industrial gases supplier in North and South America, is rapidly growing in Asia, and has strong, well-established businesses in Europe. The company’s primary products are oxygen, hydrogen, nitrogen, argon, carbon dioxide, helium,electronic gases and a wide range of specialty gases. Praxair Surface Technologies supplies high-performance coatings that protectmetal parts from wear, corrosion and high heat. Praxair’s industrial gas operations are managed on a geographical basis and in2012, 94% of sales were generated in four geographic segments (North America, Europe, South America, and Asia). The surfacetechnologies segment generated the remaining 6% of sales.
Praxair serves approximately 25 industries as diverse as healthcare and petroleum refining; computer-chip manufacturing andbeverage carbonation; fiber-optics and steel making; and aerospace, chemicals and water treatment. The diversity of end marketscreates financial stability for Praxair in varied business cycles.
Praxair generates most of its revenues and earnings through the following 11 core geographies where the company has itsstrongest market positions and where distribution and production operations allow the company to deliver the highest level ofservice to its customers at the lowest cost.
North America South America Europe Asia
United States Brazil Spain ChinaCanada Italy IndiaMexico Germany/Benelux Thailand
Korea
Praxair manufactures and distributes its products through a network of hundreds of production plants, pipeline complexes,distribution centers and delivery vehicles. Major pipeline complexes are located in the United States, Brazil, Spain and Germany.These networks are a competitive advantage, providing the foundation of reliable product supply to the company’s customer base.The majority of Praxair’s business is conducted through long-term contracts which provide stability in cash flow and the ability topass through changes in energy and feedstock costs to customers. The company has significant growth opportunities in diversemarkets including: hydrogen for refining; oxygen for gasification and oxy-fuel applications; and nitrogen and carbon dioxide foroil and gas production.
15
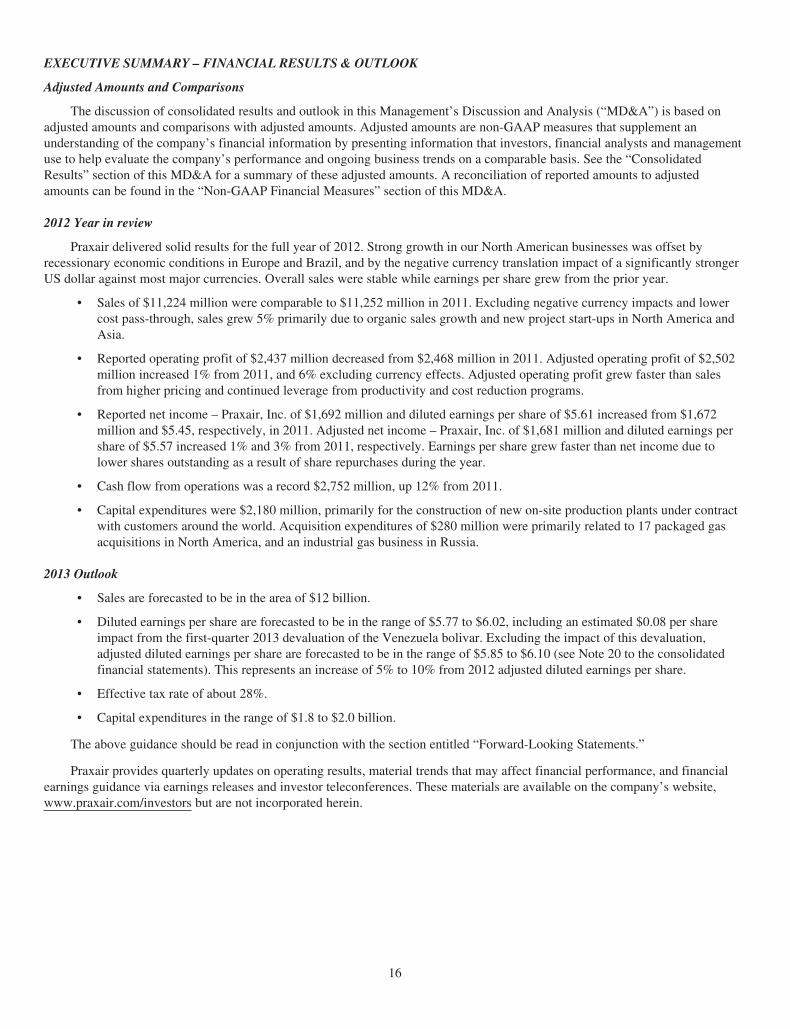
EXECUTIVE SUMMARY – FINANCIAL RESULTS & OUTLOOK
Adjusted Amounts and Comparisons
The discussion of consolidated results and outlook in this Management’s Discussion and Analysis (“MD&A”) is based onadjusted amounts and comparisons with adjusted amounts. Adjusted amounts are non-GAAP measures that supplement anunderstanding of the company’s financial information by presenting information that investors, financial analysts and managementuse to help evaluate the company’s performance and ongoing business trends on a comparable basis. See the “ConsolidatedResults” section of this MD&A for a summary of these adjusted amounts. A reconciliation of reported amounts to adjustedamounts can be found in the “Non-GAAP Financial Measures” section of this MD&A.
2012 Year in review
Praxair delivered solid results for the full year of 2012. Strong growth in our North American businesses was offset byrecessionary economic conditions in Europe and Brazil, and by the negative currency translation impact of a significantly strongerUS dollar against most major currencies. Overall sales were stable while earnings per share grew from the prior year.
• Sales of $11,224 million were comparable to $11,252 million in 2011. Excluding negative currency impacts and lowercost pass-through, sales grew 5% primarily due to organic sales growth and new project start-ups in North America andAsia.
• Reported operating profit of $2,437 million decreased from $2,468 million in 2011. Adjusted operating profit of $2,502million increased 1% from 2011, and 6% excluding currency effects. Adjusted operating profit grew faster than salesfrom higher pricing and continued leverage from productivity and cost reduction programs.
• Reported net income – Praxair, Inc. of $1,692 million and diluted earnings per share of $5.61 increased from $1,672million and $5.45, respectively, in 2011. Adjusted net income – Praxair, Inc. of $1,681 million and diluted earnings pershare of $5.57 increased 1% and 3% from 2011, respectively. Earnings per share grew faster than net income due tolower shares outstanding as a result of share repurchases during the year.
• Cash flow from operations was a record $2,752 million, up 12% from 2011.
• Capital expenditures were $2,180 million, primarily for the construction of new on-site production plants under contractwith customers around the world. Acquisition expenditures of $280 million were primarily related to 17 packaged gasacquisitions in North America, and an industrial gas business in Russia.
2013 Outlook
• Sales are forecasted to be in the area of $12 billion.
• Diluted earnings per share are forecasted to be in the range of $5.77 to $6.02, including an estimated $0.08 per shareimpact from the first-quarter 2013 devaluation of the Venezuela bolivar. Excluding the impact of this devaluation,adjusted diluted earnings per share are forecasted to be in the range of $5.85 to $6.10 (see Note 20 to the consolidatedfinancial statements). This represents an increase of 5% to 10% from 2012 adjusted diluted earnings per share.
• Effective tax rate of about 28%.
• Capital expenditures in the range of $1.8 to $2.0 billion.
The above guidance should be read in conjunction with the section entitled “Forward-Looking Statements.”
Praxair provides quarterly updates on operating results, material trends that may affect financial performance, and financialearnings guidance via earnings releases and investor teleconferences. These materials are available on the company’s website,www.praxair.com/investors but are not incorporated herein.
16
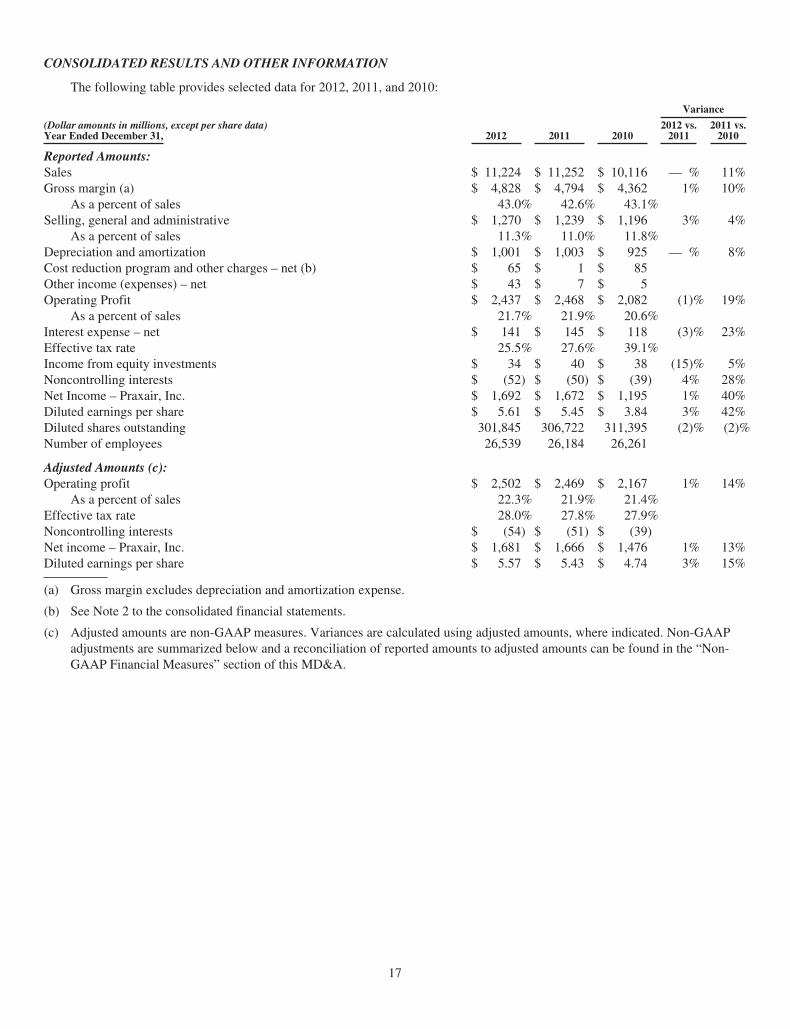
CONSOLIDATED RESULTS AND OTHER INFORMATION
The following table provides selected data for 2012, 2011, and 2010:
(Dollar amounts in millions, except per share data)Year Ended December 31, 2012 2011 2010
Variance
2012 vs.2011
2011 vs.2010
Reported Amounts:Sales $ 11,224 $ 11,252 $ 10,116 — % 11%Gross margin (a) $ 4,828 $ 4,794 $ 4,362 1% 10%
As a percent of sales 43.0% 42.6% 43.1%Selling, general and administrative $ 1,270 $ 1,239 $ 1,196 3% 4%
As a percent of sales 11.3% 11.0% 11.8%Depreciation and amortization $ 1,001 $ 1,003 $ 925 — % 8%Cost reduction program and other charges – net (b) $ 65 $ 1 $ 85Other income (expenses) – net $ 43 $ 7 $ 5Operating Profit $ 2,437 $ 2,468 $ 2,082 (1)% 19%
As a percent of sales 21.7% 21.9% 20.6%Interest expense – net $ 141 $ 145 $ 118 (3)% 23%Effective tax rate 25.5% 27.6% 39.1%Income from equity investments $ 34 $ 40 $ 38 (15)% 5%Noncontrolling interests $ (52) $ (50) $ (39) 4% 28%Net Income – Praxair, Inc. $ 1,692 $ 1,672 $ 1,195 1% 40%Diluted earnings per share $ 5.61 $ 5.45 $ 3.84 3% 42%Diluted shares outstanding 301,845 306,722 311,395 (2)% (2)%Number of employees 26,539 26,184 26,261
Adjusted Amounts (c):Operating profit $ 2,502 $ 2,469 $ 2,167 1% 14%
As a percent of sales 22.3% 21.9% 21.4%Effective tax rate 28.0% 27.8% 27.9%Noncontrolling interests $ (54) $ (51) $ (39)Net income – Praxair, Inc. $ 1,681 $ 1,666 $ 1,476 1% 13%Diluted earnings per share $ 5.57 $ 5.43 $ 4.74 3% 15%
(a) Gross margin excludes depreciation and amortization expense.
(b) See Note 2 to the consolidated financial statements.
(c) Adjusted amounts are non-GAAP measures. Variances are calculated using adjusted amounts, where indicated. Non-GAAPadjustments are summarized below and a reconciliation of reported amounts to adjusted amounts can be found in the “Non-GAAP Financial Measures” section of this MD&A.
17
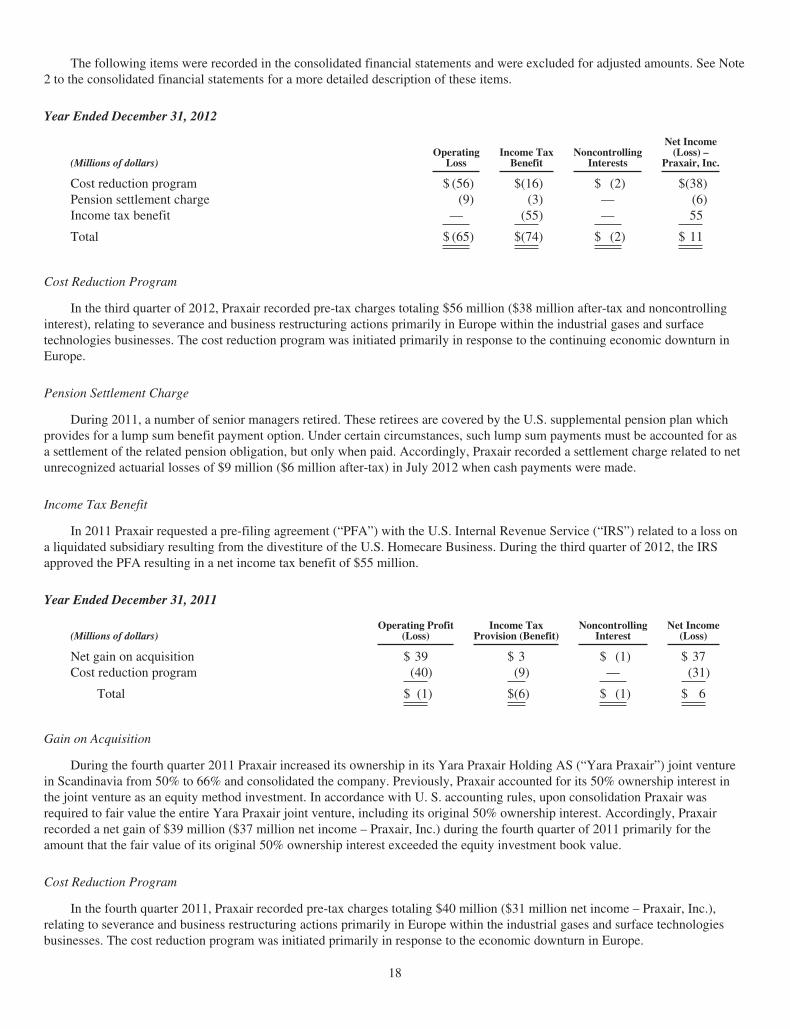
The following items were recorded in the consolidated financial statements and were excluded for adjusted amounts. See Note2 to the consolidated financial statements for a more detailed description of these items.
Year Ended December 31, 2012
(Millions of dollars)Operating
LossIncome Tax
BenefitNoncontrolling
Interests
Net Income(Loss) –
Praxair, Inc.
Cost reduction program $ (56) $(16) $ (2) $(38)Pension settlement charge (9) (3) — (6)Income tax benefit — (55) — 55
Total $ (65) $(74) $ (2) $ 11
Cost Reduction Program
In the third quarter of 2012, Praxair recorded pre-tax charges totaling $56 million ($38 million after-tax and noncontrollinginterest), relating to severance and business restructuring actions primarily in Europe within the industrial gases and surfacetechnologies businesses. The cost reduction program was initiated primarily in response to the continuing economic downturn inEurope.
Pension Settlement Charge
During 2011, a number of senior managers retired. These retirees are covered by the U.S. supplemental pension plan whichprovides for a lump sum benefit payment option. Under certain circumstances, such lump sum payments must be accounted for asa settlement of the related pension obligation, but only when paid. Accordingly, Praxair recorded a settlement charge related to netunrecognized actuarial losses of $9 million ($6 million after-tax) in July 2012 when cash payments were made.
Income Tax Benefit
In 2011 Praxair requested a pre-filing agreement (“PFA”) with the U.S. Internal Revenue Service (“IRS”) related to a loss ona liquidated subsidiary resulting from the divestiture of the U.S. Homecare Business. During the third quarter of 2012, the IRSapproved the PFA resulting in a net income tax benefit of $55 million.
Year Ended December 31, 2011
(Millions of dollars)Operating Profit
(Loss)Income Tax
Provision (Benefit)Noncontrolling
InterestNet Income
(Loss)
Net gain on acquisition $ 39 $ 3 $ (1) $ 37Cost reduction program (40) (9) — (31)
Total $ (1) $(6) $ (1) $ 6
Gain on Acquisition
During the fourth quarter 2011 Praxair increased its ownership in its Yara Praxair Holding AS (“Yara Praxair”) joint venturein Scandinavia from 50% to 66% and consolidated the company. Previously, Praxair accounted for its 50% ownership interest inthe joint venture as an equity method investment. In accordance with U. S. accounting rules, upon consolidation Praxair wasrequired to fair value the entire Yara Praxair joint venture, including its original 50% ownership interest. Accordingly, Praxairrecorded a net gain of $39 million ($37 million net income – Praxair, Inc.) during the fourth quarter of 2011 primarily for theamount that the fair value of its original 50% ownership interest exceeded the equity investment book value.
Cost Reduction Program
In the fourth quarter 2011, Praxair recorded pre-tax charges totaling $40 million ($31 million net income – Praxair, Inc.),relating to severance and business restructuring actions primarily in Europe within the industrial gases and surface technologiesbusinesses. The cost reduction program was initiated primarily in response to the economic downturn in Europe.
18
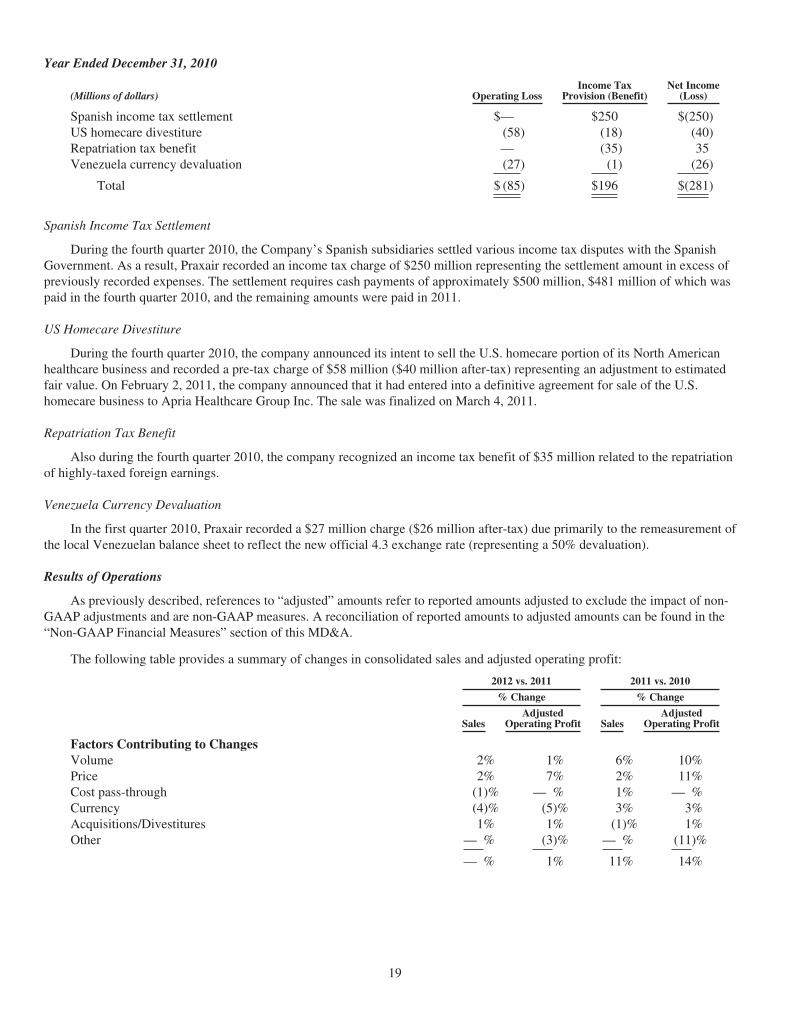
Year Ended December 31, 2010
(Millions of dollars) Operating LossIncome Tax
Provision (Benefit)Net Income
(Loss)
Spanish income tax settlement $— $250 $(250)US homecare divestiture (58) (18) (40)Repatriation tax benefit — (35) 35Venezuela currency devaluation (27) (1) (26)
Total $ (85) $196 $(281)
Spanish Income Tax Settlement
During the fourth quarter 2010, the Company’s Spanish subsidiaries settled various income tax disputes with the SpanishGovernment. As a result, Praxair recorded an income tax charge of $250 million representing the settlement amount in excess ofpreviously recorded expenses. The settlement requires cash payments of approximately $500 million, $481 million of which waspaid in the fourth quarter 2010, and the remaining amounts were paid in 2011.
US Homecare Divestiture
During the fourth quarter 2010, the company announced its intent to sell the U.S. homecare portion of its North Americanhealthcare business and recorded a pre-tax charge of $58 million ($40 million after-tax) representing an adjustment to estimatedfair value. On February 2, 2011, the company announced that it had entered into a definitive agreement for sale of the U.S.homecare business to Apria Healthcare Group Inc. The sale was finalized on March 4, 2011.
Repatriation Tax Benefit
Also during the fourth quarter 2010, the company recognized an income tax benefit of $35 million related to the repatriationof highly-taxed foreign earnings.
Venezuela Currency Devaluation
In the first quarter 2010, Praxair recorded a $27 million charge ($26 million after-tax) due primarily to the remeasurement ofthe local Venezuelan balance sheet to reflect the new official 4.3 exchange rate (representing a 50% devaluation).
Results of Operations
As previously described, references to “adjusted” amounts refer to reported amounts adjusted to exclude the impact of non-GAAP adjustments and are non-GAAP measures. A reconciliation of reported amounts to adjusted amounts can be found in the“Non-GAAP Financial Measures” section of this MD&A.
The following table provides a summary of changes in consolidated sales and adjusted operating profit:
2012 vs. 2011 2011 vs. 2010
% Change % Change
SalesAdjusted
Operating Profit SalesAdjusted
Operating Profit
Factors Contributing to ChangesVolume 2% 1% 6% 10%Price 2% 7% 2% 11%Cost pass-through (1)% — % 1% — %Currency (4)% (5)% 3% 3%Acquisitions/Divestitures 1% 1% (1)% 1%Other — % (3)% — % (11)%
— % 1% 11% 14%
19
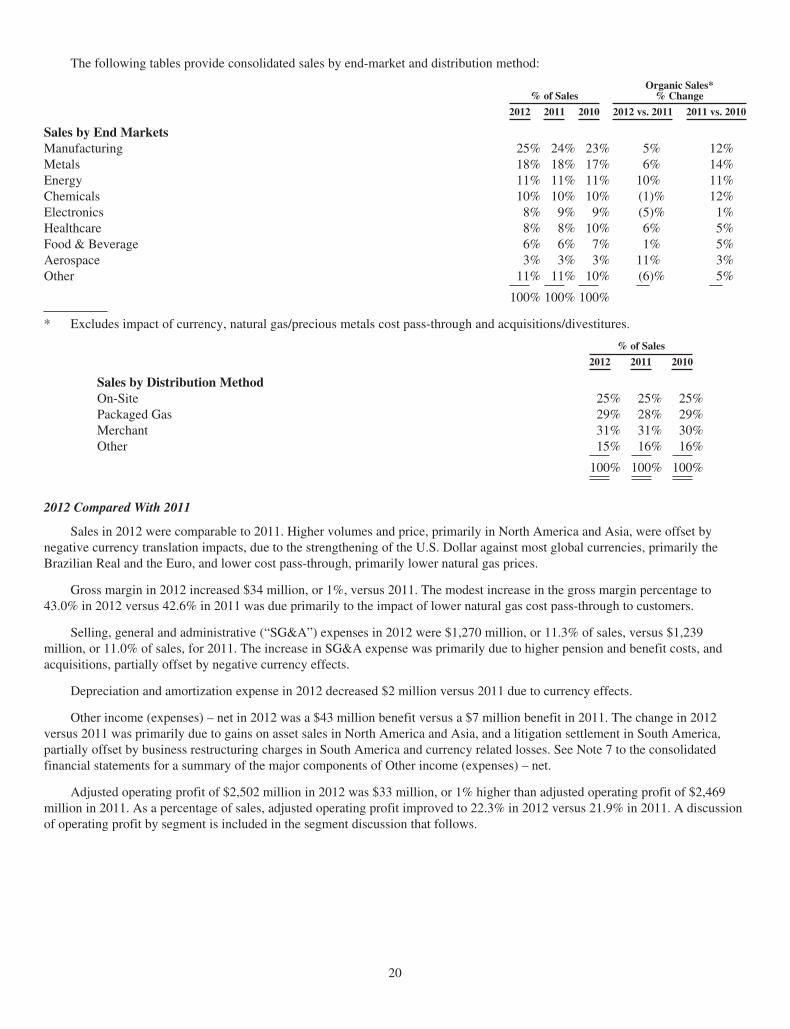
The following tables provide consolidated sales by end-market and distribution method:
% of SalesOrganic Sales*
% Change
2012 2011 2010 2012 vs. 2011 2011 vs. 2010
Sales by End MarketsManufacturing 25% 24% 23% 5% 12%Metals 18% 18% 17% 6% 14%Energy 11% 11% 11% 10% 11%Chemicals 10% 10% 10% (1)% 12%Electronics 8% 9% 9% (5)% 1%Healthcare 8% 8% 10% 6% 5%Food & Beverage 6% 6% 7% 1% 5%Aerospace 3% 3% 3% 11% 3%Other 11% 11% 10% (6)% 5%
100% 100% 100%
* Excludes impact of currency, natural gas/precious metals cost pass-through and acquisitions/divestitures.
% of Sales
2012 2011 2010
Sales by Distribution MethodOn-Site 25% 25% 25%Packaged Gas 29% 28% 29%Merchant 31% 31% 30%Other 15% 16% 16%
100% 100% 100%
2012 Compared With 2011
Sales in 2012 were comparable to 2011. Higher volumes and price, primarily in North America and Asia, were offset bynegative currency translation impacts, due to the strengthening of the U.S. Dollar against most global currencies, primarily theBrazilian Real and the Euro, and lower cost pass-through, primarily lower natural gas prices.
Gross margin in 2012 increased $34 million, or 1%, versus 2011. The modest increase in the gross margin percentage to43.0% in 2012 versus 42.6% in 2011 was due primarily to the impact of lower natural gas cost pass-through to customers.
Selling, general and administrative (“SG&A”) expenses in 2012 were $1,270 million, or 11.3% of sales, versus $1,239million, or 11.0% of sales, for 2011. The increase in SG&A expense was primarily due to higher pension and benefit costs, andacquisitions, partially offset by negative currency effects.
Depreciation and amortization expense in 2012 decreased $2 million versus 2011 due to currency effects.
Other income (expenses) – net in 2012 was a $43 million benefit versus a $7 million benefit in 2011. The change in 2012versus 2011 was primarily due to gains on asset sales in North America and Asia, and a litigation settlement in South America,partially offset by business restructuring charges in South America and currency related losses. See Note 7 to the consolidatedfinancial statements for a summary of the major components of Other income (expenses) – net.
Adjusted operating profit of $2,502 million in 2012 was $33 million, or 1% higher than adjusted operating profit of $2,469million in 2011. As a percentage of sales, adjusted operating profit improved to 22.3% in 2012 versus 21.9% in 2011. A discussionof operating profit by segment is included in the segment discussion that follows.
20
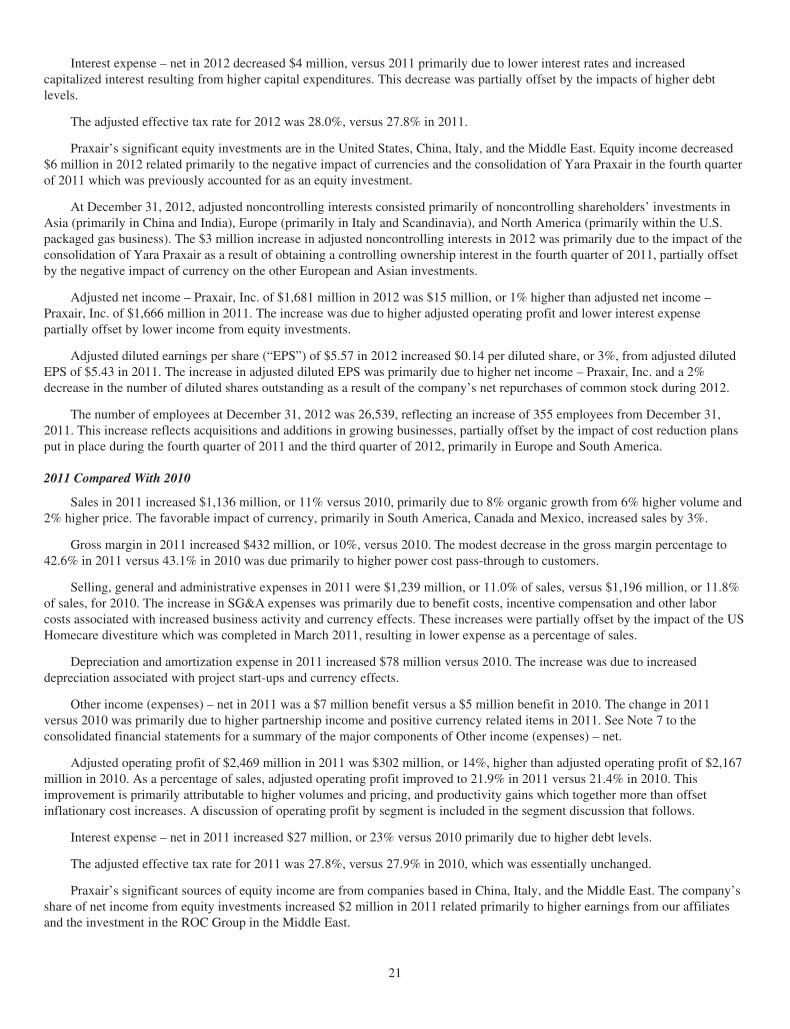
Interest expense – net in 2012 decreased $4 million, versus 2011 primarily due to lower interest rates and increasedcapitalized interest resulting from higher capital expenditures. This decrease was partially offset by the impacts of higher debtlevels.
The adjusted effective tax rate for 2012 was 28.0%, versus 27.8% in 2011.
Praxair’s significant equity investments are in the United States, China, Italy, and the Middle East. Equity income decreased$6 million in 2012 related primarily to the negative impact of currencies and the consolidation of Yara Praxair in the fourth quarterof 2011 which was previously accounted for as an equity investment.
At December 31, 2012, adjusted noncontrolling interests consisted primarily of noncontrolling shareholders’ investments inAsia (primarily in China and India), Europe (primarily in Italy and Scandinavia), and North America (primarily within the U.S.packaged gas business). The $3 million increase in adjusted noncontrolling interests in 2012 was primarily due to the impact of theconsolidation of Yara Praxair as a result of obtaining a controlling ownership interest in the fourth quarter of 2011, partially offsetby the negative impact of currency on the other European and Asian investments.
Adjusted net income – Praxair, Inc. of $1,681 million in 2012 was $15 million, or 1% higher than adjusted net income –Praxair, Inc. of $1,666 million in 2011. The increase was due to higher adjusted operating profit and lower interest expensepartially offset by lower income from equity investments.
Adjusted diluted earnings per share (“EPS”) of $5.57 in 2012 increased $0.14 per diluted share, or 3%, from adjusted dilutedEPS of $5.43 in 2011. The increase in adjusted diluted EPS was primarily due to higher net income – Praxair, Inc. and a 2%decrease in the number of diluted shares outstanding as a result of the company’s net repurchases of common stock during 2012.
The number of employees at December 31, 2012 was 26,539, reflecting an increase of 355 employees from December 31,2011. This increase reflects acquisitions and additions in growing businesses, partially offset by the impact of cost reduction plansput in place during the fourth quarter of 2011 and the third quarter of 2012, primarily in Europe and South America.
2011 Compared With 2010
Sales in 2011 increased $1,136 million, or 11% versus 2010, primarily due to 8% organic growth from 6% higher volume and2% higher price. The favorable impact of currency, primarily in South America, Canada and Mexico, increased sales by 3%.
Gross margin in 2011 increased $432 million, or 10%, versus 2010. The modest decrease in the gross margin percentage to42.6% in 2011 versus 43.1% in 2010 was due primarily to higher power cost pass-through to customers.
Selling, general and administrative expenses in 2011 were $1,239 million, or 11.0% of sales, versus $1,196 million, or 11.8%of sales, for 2010. The increase in SG&A expenses was primarily due to benefit costs, incentive compensation and other laborcosts associated with increased business activity and currency effects. These increases were partially offset by the impact of the USHomecare divestiture which was completed in March 2011, resulting in lower expense as a percentage of sales.
Depreciation and amortization expense in 2011 increased $78 million versus 2010. The increase was due to increaseddepreciation associated with project start-ups and currency effects.
Other income (expenses) – net in 2011 was a $7 million benefit versus a $5 million benefit in 2010. The change in 2011versus 2010 was primarily due to higher partnership income and positive currency related items in 2011. See Note 7 to theconsolidated financial statements for a summary of the major components of Other income (expenses) – net.
Adjusted operating profit of $2,469 million in 2011 was $302 million, or 14%, higher than adjusted operating profit of $2,167million in 2010. As a percentage of sales, adjusted operating profit improved to 21.9% in 2011 versus 21.4% in 2010. Thisimprovement is primarily attributable to higher volumes and pricing, and productivity gains which together more than offsetinflationary cost increases. A discussion of operating profit by segment is included in the segment discussion that follows.
Interest expense – net in 2011 increased $27 million, or 23% versus 2010 primarily due to higher debt levels.
The adjusted effective tax rate for 2011 was 27.8%, versus 27.9% in 2010, which was essentially unchanged.
Praxair’s significant sources of equity income are from companies based in China, Italy, and the Middle East. The company’sshare of net income from equity investments increased $2 million in 2011 related primarily to higher earnings from our affiliatesand the investment in the ROC Group in the Middle East.
21
At December 31, 2011, adjusted noncontrolling interests consisted primarily of noncontrolling shareholders’ investments inAsia (primarily in China and India), Europe (primarily in Italy and Scandinavia), and North America (primarily within the U.S.packaged gas business). The $11 million increase in noncontrolling interests in 2011 was due primarily to higher earnings fromthese business affiliates.
Adjusted net income – Praxair, Inc. of $1,666 million in 2011 was $190 million, or 13% higher than adjusted net income –Praxair, Inc. of $1,476 million in 2010. The increase was due to higher operating profit and increased income from equityinvestments. Adjusted net income grew less than operating profit primarily due to higher interest expense.
Adjusted diluted earnings per share of $5.43 in 2011 increased $0.69 per diluted share, or 15%, from adjusted diluted EPS of$4.74 in 2010. The increase in adjusted diluted EPS was primarily due to higher net income – Praxair, Inc. and benefited from the2% decrease in the number of diluted shares outstanding as a result of the impact of the company’s net repurchases of commonstock during 2011.
The number of employees at December 31, 2011 was 26,184, reflecting a decrease of 77 employees from December 31, 2010.This decrease includes the US Homecare divestiture in March 2011, partially offset by acquisitions and additions in growingbusinesses.
Related Party Transactions
The company’s related parties are primarily unconsolidated equity affiliates. The company did not engage in any materialtransactions involving related parties that included terms or other aspects that differ from those which would be negotiated withindependent parties.
Environmental Matters
Praxair’s principal operations relate to the production and distribution of atmospheric and other industrial gases, whichhistorically have not had a significant impact on the environment. However, worldwide costs relating to environmental protectionmay continue to grow due to increasingly stringent laws and regulations, and Praxair’s ongoing commitment to rigorous internalstandards.
Climate Change
Praxair operates in jurisdictions that have, or are developing, laws and/or regulations to reduce or mitigate the perceivedadverse effects of greenhouse gas (“GHG”) emissions and faces a highly uncertain regulatory environment in this area. Forexample, the U.S. Environmental Protection Agency (“EPA”) has promulgated rules requiring monitoring and controlling GHGemissions and one of these rules regulates GHG emissions from light-duty vehicles and certain large manufacturing facilities,many of which are Praxair suppliers or customers. In addition to these developments in the United States, there has been regulationof GHGs in the European Union under the Emissions Trading System, which have wide implications for our customers and mayimpact certain operations of Praxair in Europe. There are also requirements for mandatory reporting in Quebec, Canada, whichapply to certain Praxair operations and will be used in developing cap-and-trade regulations on GHG emissions, which areexpected to impact certain Praxair facilities. Among other impacts, such regulations are expected to raise the costs of energy,which is a significant cost for Praxair. Nevertheless, Praxair’s customer contracts routinely provide rights to recover increasedelectricity, natural gas, and other costs that are incurred by the company.
Praxair anticipates continued growth in its hydrogen business, as hydrogen is essential to refineries which use it to removesulfur from transportation fuels in order to meet ambient air quality standards in the United States. Hydrogen production plants anda large number of other manufacturing and electricity-generating plants have been identified under California law as a source ofcarbon dioxide emissions and these plants have also become subject to recently promulgated cap-and-trade regulations in that state.Praxair believes it will be able to mitigate the costs of these regulations through the terms of its product supply contracts. However,legislation that limits GHG emissions may impact growth by increasing operating costs and/or decreasing demand.
To manage these potential business risks from potential GHG emission regulation, Praxair actively monitors currentdevelopments, evaluates the direct and indirect business risks, and takes appropriate actions. Among others, actions include:increasing relevant resources and training; consulting with vendors, insurance providers and industry experts; incorporating GHGprovisions in commercial agreements; and conducting regular reviews of the business risks with management. Although there areconsiderable uncertainties, Praxair believes that the business risk from potential regulations can be effectively managed through itscommercial contracts. Additionally, Praxair does not anticipate any material effects regarding its plant operations or businessarising from potential physical risks of climate change. Also, Praxair continuously seeks opportunities to reduce its own energy useand GHG footprint.
At the same time, Praxair may benefit from business opportunities arising from governmental regulation of GHG and otheremissions; rising costs of many energy and natural resources; new technologies to extract natural gas; and the development ofrenewable energy alternatives. Praxair continues to develop new applications technologies that can lower
22
emissions, including GHG emissions, in Praxair’s processes and help customers lower energy consumption and increase productthroughput. Stricter regulation of water quality in emerging economies such as China provide a growing market for a number ofgases, e.g., oxygen for wastewater treatment. Renewable fuel standards in the European Union and U.S. create a market for second-generation biofuels which are users of industrial gases such as oxygen, carbon dioxide, and hydrogen.
Costs Relating to the Protection of the Environment
Environmental protection costs in 2012 included approximately $18 million in capital expenditures and $25 million ofexpenses. Praxair anticipates that future annual environmental protection expenditures will be similar to 2012, subject to anysignificant changes in existing laws and regulations. Based on historical results and current estimates, management does notbelieve that environmental expenditures will have a material adverse effect on the consolidated financial position, the consolidatedresults of operations or cash flows in any given year.
Legal Proceedings
See Note 17 to the consolidated financial statements for information concerning legal proceedings.
Retirement Benefits
Pensions
The net periodic benefit cost for the U.S. and International pension plans was $93 million in 2012, $66 million in 2011 and$57 million in 2010. Consolidated net periodic benefit cost included settlement charges of $10 million, $6 million and $3 million in2012, 2011 and 2010, respectively.
The funded status (pension benefit obligation (“PBO”) less the fair value of plan assets) for the U.S. plans was a deficit of$535 million as December 31, 2012 versus a deficit of $583 million at December 31, 2011. This improvement was due to higherinvestment performance in 2012 and contributions of $165 million.
Global pension contributions were $184 million in 2012, $94 million in 2011 and $124 million in 2010. Estimates for 2013contributions are in the area of $50 million.
Praxair assumes an expected return on plan assets for 2013 in the United States of 8.00%, which is consistent with the long-term expected return on its investment portfolio. Excluding the impact of any settlements, 2013 consolidated pension expense isexpected to be approximately $105 million. The increase is due primarily to an increase in the amortization of net actuarial gains/losses, partially attributable to lower discount rates. The amortization is recognized based on the amount of net actuarial gains/losses above certain thresholds and over the period of either the average remaining service lives or average remaining lifeexpectancies of the retirees.
OPEB
The net periodic benefit cost for postretirement benefits other than pensions (“OPEB”) was $9 million in 2012, $12 million in2011 and $20 million in 2010. The decrease is primarily due to the lower interest costs. The funded status deficit increased $25million during 2012 due primarily to lower discount rates.
In 2013, consolidated net periodic benefit costs for the OPEB plans is expected to be approximately $12 million.
See the Critical Accounting Policies section and Note 16 to the consolidated financial statements for a more detaileddiscussion of the company’s retirement benefits, including a description of the various retirement plans and the assumptions usedin the calculation of net periodic benefit cost and funded status.
Insurance
Praxair purchases insurance to limit a variety of risks, including those related to property, business interruption, third-partyliability and workers’ compensation. Currently, the company self-retains the first $5 million per occurrence for workers’compensation, general and vehicle liability and retains $2.5 million to $5 million per occurrence at its various propertiesworldwide. To mitigate its aggregate loss potential above varying retentions, the company purchases insurance coverage fromhighly rated insurance companies at what it believes are reasonable coverage levels.
At December 31, 2012 and 2011, the company had recorded a total of $28 million and $27 million, respectively, representingan estimate of the retained liability for the ultimate cost of claims incurred and unpaid as of the balance sheet dates. The estimatedliability is established using statistical analysis and is based upon historical experience, actuarial assumptions and professionaljudgment. These estimates are subject to the effects of trends in loss severity and frequency and are subject to a significant degreeof inherent variability. If actual claims differ from the company’s estimates, they will be adjusted at that time and financial resultscould be impacted.
23
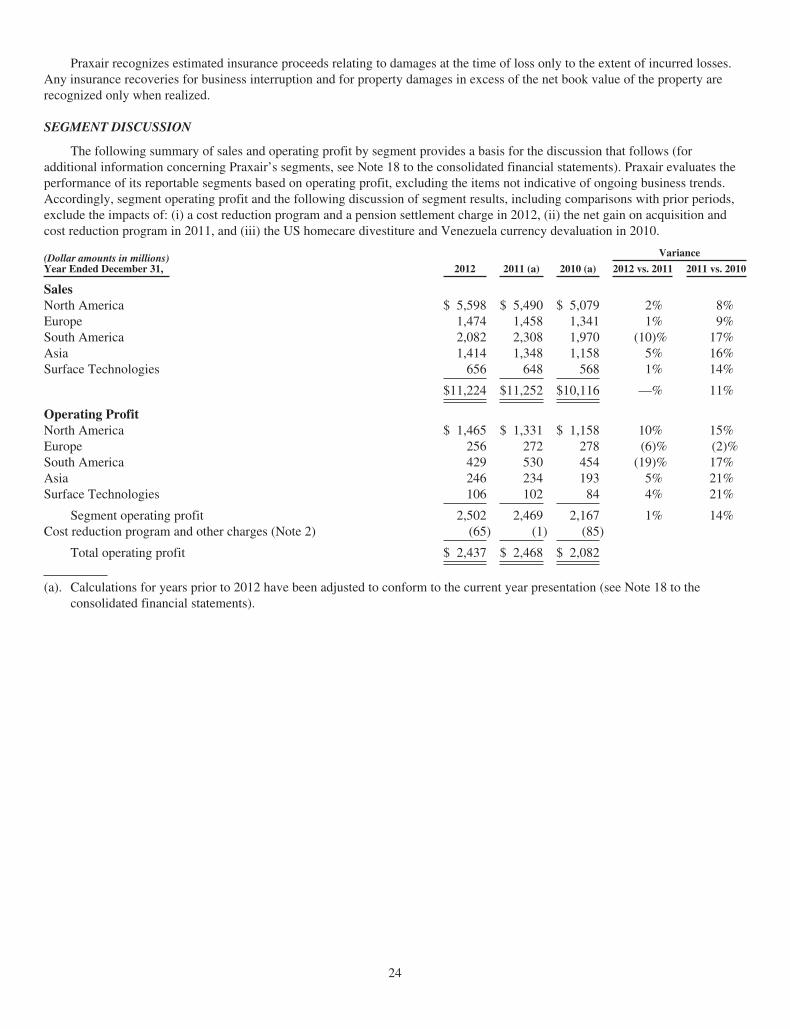
Praxair recognizes estimated insurance proceeds relating to damages at the time of loss only to the extent of incurred losses.Any insurance recoveries for business interruption and for property damages in excess of the net book value of the property arerecognized only when realized.
SEGMENT DISCUSSION
The following summary of sales and operating profit by segment provides a basis for the discussion that follows (foradditional information concerning Praxair’s segments, see Note 18 to the consolidated financial statements). Praxair evaluates theperformance of its reportable segments based on operating profit, excluding the items not indicative of ongoing business trends.Accordingly, segment operating profit and the following discussion of segment results, including comparisons with prior periods,exclude the impacts of: (i) a cost reduction program and a pension settlement charge in 2012, (ii) the net gain on acquisition andcost reduction program in 2011, and (iii) the US homecare divestiture and Venezuela currency devaluation in 2010.
(Dollar amounts in millions)Year Ended December 31,
Variance
2012 2011 (a) 2010 (a) 2012 vs. 2011 2011 vs. 2010
SalesNorth America $ 5,598 $ 5,490 $ 5,079 2% 8%Europe 1,474 1,458 1,341 1% 9%South America 2,082 2,308 1,970 (10)% 17%Asia 1,414 1,348 1,158 5% 16%Surface Technologies 656 648 568 1% 14%
$11,224 $11,252 $10,116 —% 11%
Operating ProfitNorth America $ 1,465 $ 1,331 $ 1,158 10% 15%Europe 256 272 278 (6)% (2)%South America 429 530 454 (19)% 17%Asia 246 234 193 5% 21%Surface Technologies 106 102 84 4% 21%
Segment operating profit 2,502 2,469 2,167 1% 14%Cost reduction program and other charges (Note 2) (65) (1) (85)
Total operating profit $ 2,437 $ 2,468 $ 2,082
(a). Calculations for years prior to 2012 have been adjusted to conform to the current year presentation (see Note 18 to theconsolidated financial statements).
24
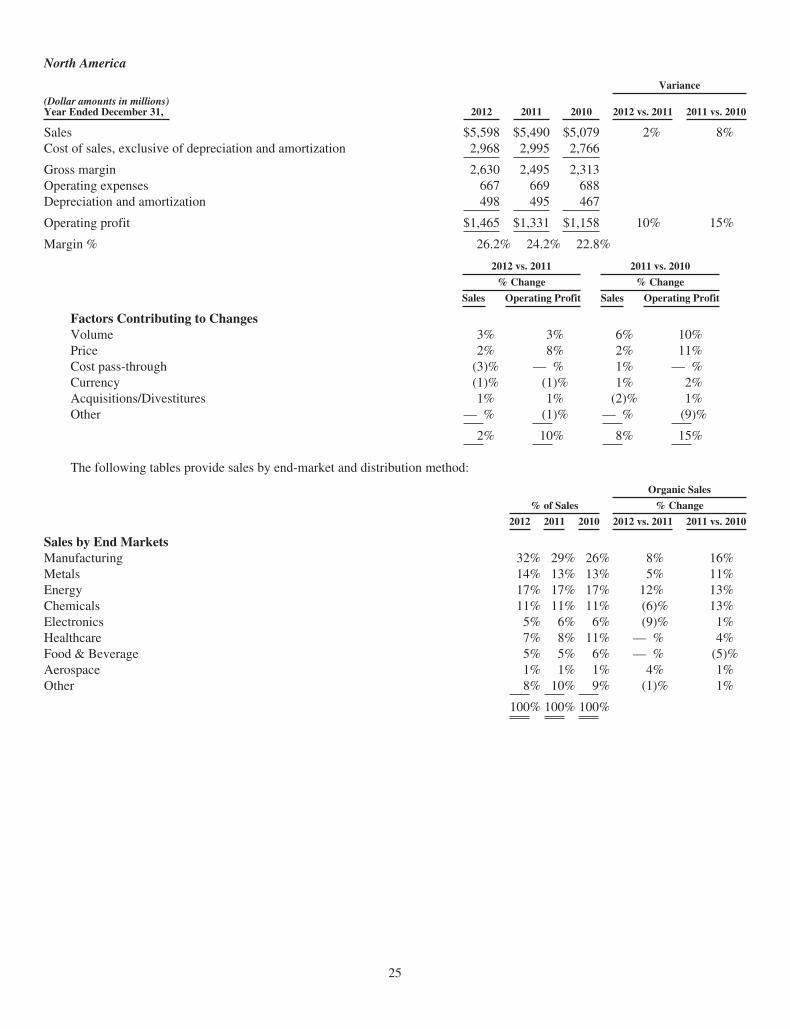
North America
Variance
(Dollar amounts in millions)Year Ended December 31, 2012 2011 2010 2012 vs. 2011 2011 vs. 2010
Sales $5,598 $5,490 $5,079 2% 8%Cost of sales, exclusive of depreciation and amortization 2,968 2,995 2,766
Gross margin 2,630 2,495 2,313Operating expenses 667 669 688Depreciation and amortization 498 495 467
Operating profit $1,465 $1,331 $1,158 10% 15%
Margin % 26.2% 24.2% 22.8%
2012 vs. 2011 2011 vs. 2010
% Change % Change
Sales Operating Profit Sales Operating Profit
Factors Contributing to ChangesVolume 3% 3% 6% 10%Price 2% 8% 2% 11%Cost pass-through (3)% — % 1% — %Currency (1)% (1)% 1% 2%Acquisitions/Divestitures 1% 1% (2)% 1%Other — % (1)% — % (9)%
2% 10% 8% 15%
The following tables provide sales by end-market and distribution method:
Organic Sales
% of Sales % Change
2012 2011 2010 2012 vs. 2011 2011 vs. 2010
Sales by End MarketsManufacturing 32% 29% 26% 8% 16%Metals 14% 13% 13% 5% 11%Energy 17% 17% 17% 12% 13%Chemicals 11% 11% 11% (6)% 13%Electronics 5% 6% 6% (9)% 1%Healthcare 7% 8% 11% — % 4%Food & Beverage 5% 5% 6% — % (5)%Aerospace 1% 1% 1% 4% 1%Other 8% 10% 9% (1)% 1%
100% 100% 100%
25
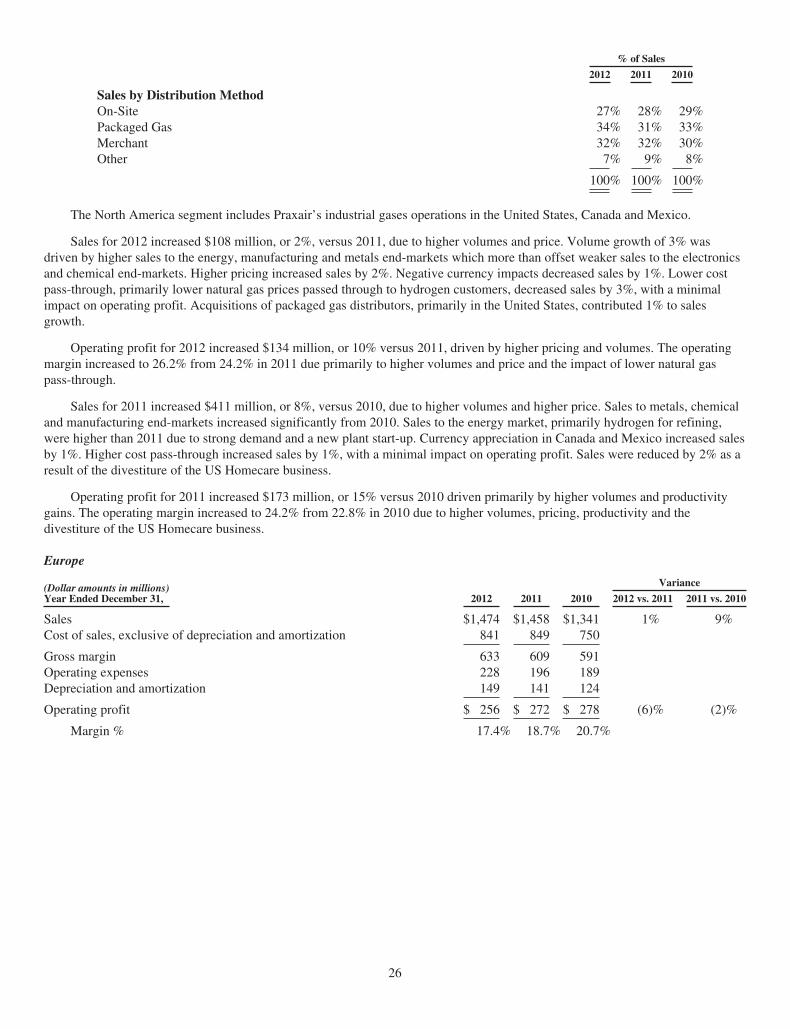
% of Sales
2012 2011 2010
Sales by Distribution MethodOn-Site 27% 28% 29%Packaged Gas 34% 31% 33%Merchant 32% 32% 30%Other 7% 9% 8%
100% 100% 100%
The North America segment includes Praxair’s industrial gases operations in the United States, Canada and Mexico.
Sales for 2012 increased $108 million, or 2%, versus 2011, due to higher volumes and price. Volume growth of 3% wasdriven by higher sales to the energy, manufacturing and metals end-markets which more than offset weaker sales to the electronicsand chemical end-markets. Higher pricing increased sales by 2%. Negative currency impacts decreased sales by 1%. Lower costpass-through, primarily lower natural gas prices passed through to hydrogen customers, decreased sales by 3%, with a minimalimpact on operating profit. Acquisitions of packaged gas distributors, primarily in the United States, contributed 1% to salesgrowth.
Operating profit for 2012 increased $134 million, or 10% versus 2011, driven by higher pricing and volumes. The operatingmargin increased to 26.2% from 24.2% in 2011 due primarily to higher volumes and price and the impact of lower natural gaspass-through.
Sales for 2011 increased $411 million, or 8%, versus 2010, due to higher volumes and higher price. Sales to metals, chemicaland manufacturing end-markets increased significantly from 2010. Sales to the energy market, primarily hydrogen for refining,were higher than 2011 due to strong demand and a new plant start-up. Currency appreciation in Canada and Mexico increased salesby 1%. Higher cost pass-through increased sales by 1%, with a minimal impact on operating profit. Sales were reduced by 2% as aresult of the divestiture of the US Homecare business.
Operating profit for 2011 increased $173 million, or 15% versus 2010 driven primarily by higher volumes and productivitygains. The operating margin increased to 24.2% from 22.8% in 2010 due to higher volumes, pricing, productivity and thedivestiture of the US Homecare business.
Europe
(Dollar amounts in millions)Year Ended December 31,
Variance
2012 2011 2010 2012 vs. 2011 2011 vs. 2010
Sales $1,474 $1,458 $1,341 1% 9%Cost of sales, exclusive of depreciation and amortization 841 849 750
Gross margin 633 609 591Operating expenses 228 196 189Depreciation and amortization 149 141 124
Operating profit $ 256 $ 272 $ 278 (6)% (2)%
Margin % 17.4% 18.7% 20.7%
26
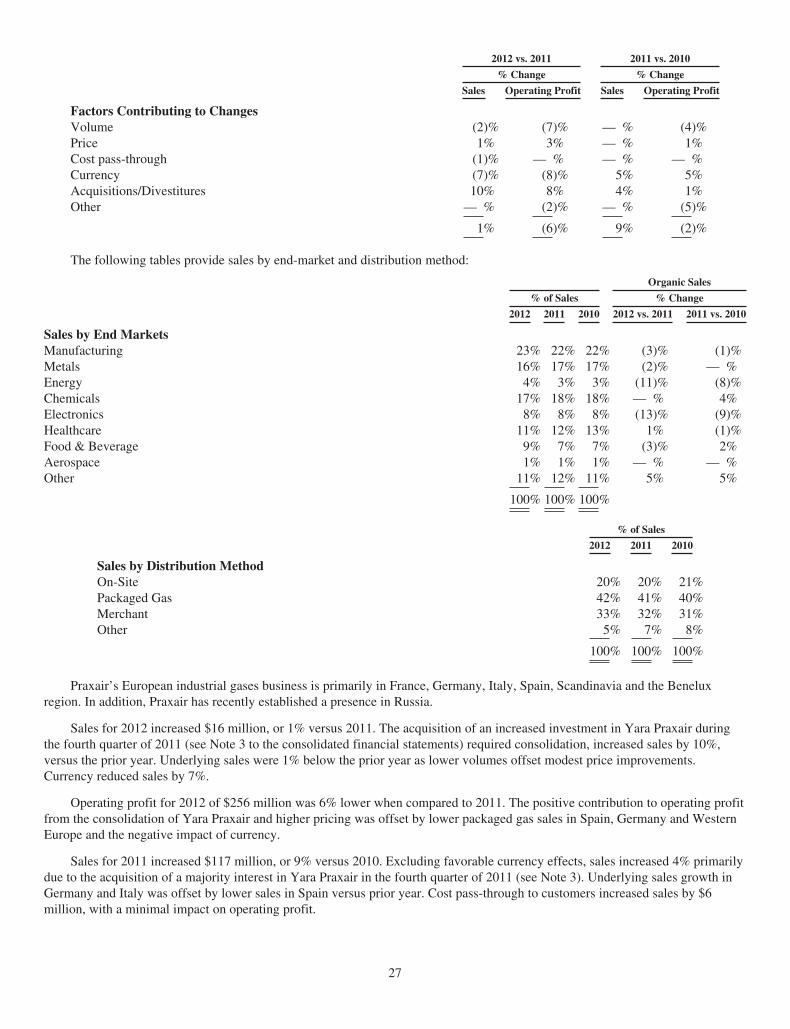
2012 vs. 2011 2011 vs. 2010
% Change % Change
Sales Operating Profit Sales Operating Profit
Factors Contributing to ChangesVolume (2)% (7)% — % (4)%Price 1% 3% — % 1%Cost pass-through (1)% — % — % — %Currency (7)% (8)% 5% 5%Acquisitions/Divestitures 10% 8% 4% 1%Other — % (2)% — % (5)%
1% (6)% 9% (2)%
The following tables provide sales by end-market and distribution method:
Organic Sales
% of Sales % Change
2012 2011 2010 2012 vs. 2011 2011 vs. 2010
Sales by End MarketsManufacturing 23% 22% 22% (3)% (1)%Metals 16% 17% 17% (2)% — %Energy 4% 3% 3% (11)% (8)%Chemicals 17% 18% 18% — % 4%Electronics 8% 8% 8% (13)% (9)%Healthcare 11% 12% 13% 1% (1)%Food & Beverage 9% 7% 7% (3)% 2%Aerospace 1% 1% 1% — % — %Other 11% 12% 11% 5% 5%
100% 100% 100%
% of Sales
2012 2011 2010
Sales by Distribution MethodOn-Site 20% 20% 21%Packaged Gas 42% 41% 40%Merchant 33% 32% 31%Other 5% 7% 8%
100% 100% 100%
Praxair’s European industrial gases business is primarily in France, Germany, Italy, Spain, Scandinavia and the Beneluxregion. In addition, Praxair has recently established a presence in Russia.
Sales for 2012 increased $16 million, or 1% versus 2011. The acquisition of an increased investment in Yara Praxair duringthe fourth quarter of 2011 (see Note 3 to the consolidated financial statements) required consolidation, increased sales by 10%,versus the prior year. Underlying sales were 1% below the prior year as lower volumes offset modest price improvements.Currency reduced sales by 7%.
Operating profit for 2012 of $256 million was 6% lower when compared to 2011. The positive contribution to operating profitfrom the consolidation of Yara Praxair and higher pricing was offset by lower packaged gas sales in Spain, Germany and WesternEurope and the negative impact of currency.
Sales for 2011 increased $117 million, or 9% versus 2010. Excluding favorable currency effects, sales increased 4% primarilydue to the acquisition of a majority interest in Yara Praxair in the fourth quarter of 2011 (see Note 3). Underlying sales growth inGermany and Italy was offset by lower sales in Spain versus prior year. Cost pass-through to customers increased sales by $6million, with a minimal impact on operating profit.
27
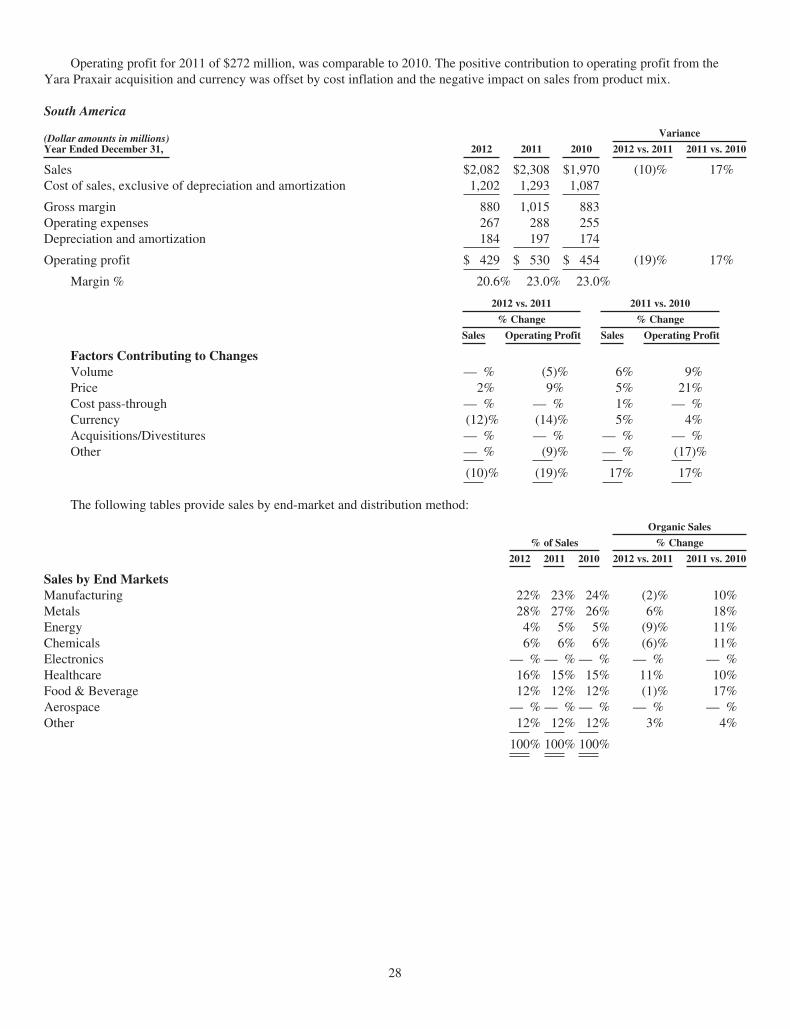
Operating profit for 2011 of $272 million, was comparable to 2010. The positive contribution to operating profit from theYara Praxair acquisition and currency was offset by cost inflation and the negative impact on sales from product mix.
South America
(Dollar amounts in millions)Year Ended December 31,
Variance
2012 2011 2010 2012 vs. 2011 2011 vs. 2010
Sales $2,082 $2,308 $1,970 (10)% 17%Cost of sales, exclusive of depreciation and amortization 1,202 1,293 1,087
Gross margin 880 1,015 883Operating expenses 267 288 255Depreciation and amortization 184 197 174
Operating profit $ 429 $ 530 $ 454 (19)% 17%
Margin % 20.6% 23.0% 23.0%
2012 vs. 2011 2011 vs. 2010
% Change % Change
Sales Operating Profit Sales Operating Profit
Factors Contributing to ChangesVolume — % (5)% 6% 9%Price 2% 9% 5% 21%Cost pass-through — % — % 1% — %Currency (12)% (14)% 5% 4%Acquisitions/Divestitures — % — % — % — %Other — % (9)% — % (17)%
(10)% (19)% 17% 17%
The following tables provide sales by end-market and distribution method:
Organic Sales
% of Sales % Change
2012 2011 2010 2012 vs. 2011 2011 vs. 2010
Sales by End MarketsManufacturing 22% 23% 24% (2)% 10%Metals 28% 27% 26% 6% 18%Energy 4% 5% 5% (9)% 11%Chemicals 6% 6% 6% (6)% 11%Electronics — % — % — % — % — %Healthcare 16% 15% 15% 11% 10%Food & Beverage 12% 12% 12% (1)% 17%Aerospace — % — % — % — % — %Other 12% 12% 12% 3% 4%
100% 100% 100%
28
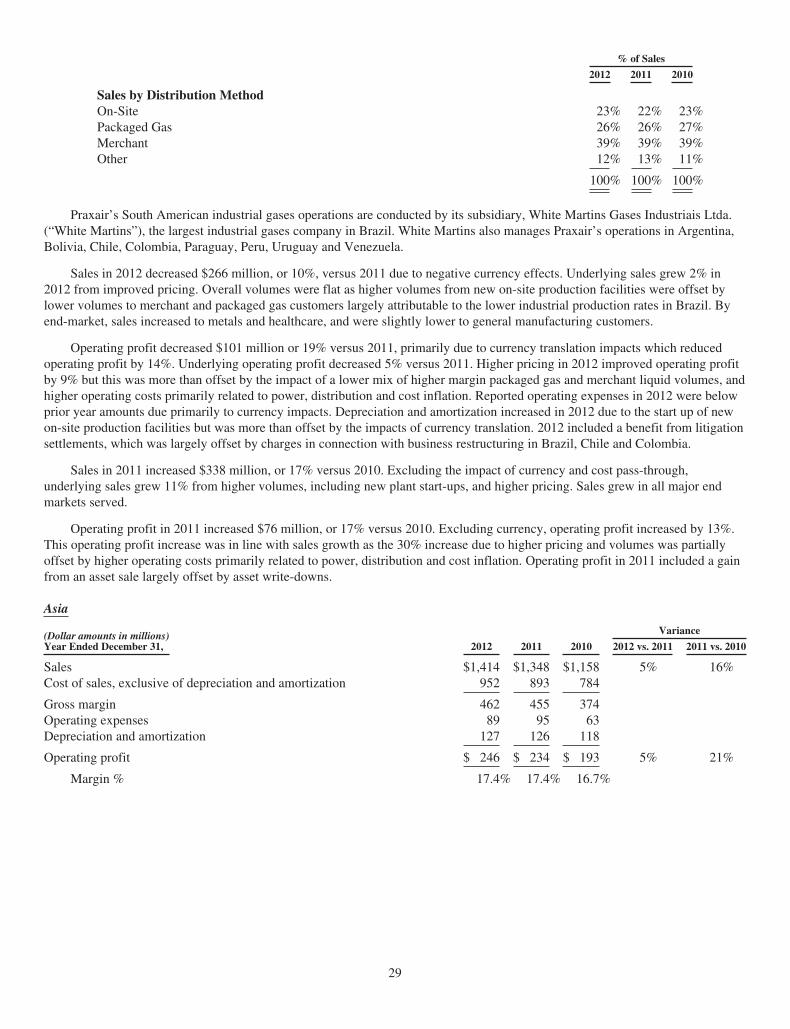
% of Sales
2012 2011 2010
Sales by Distribution MethodOn-Site 23% 22% 23%Packaged Gas 26% 26% 27%Merchant 39% 39% 39%Other 12% 13% 11%
100% 100% 100%
Praxair’s South American industrial gases operations are conducted by its subsidiary, White Martins Gases Industriais Ltda.(“White Martins”), the largest industrial gases company in Brazil. White Martins also manages Praxair’s operations in Argentina,Bolivia, Chile, Colombia, Paraguay, Peru, Uruguay and Venezuela.
Sales in 2012 decreased $266 million, or 10%, versus 2011 due to negative currency effects. Underlying sales grew 2% in2012 from improved pricing. Overall volumes were flat as higher volumes from new on-site production facilities were offset bylower volumes to merchant and packaged gas customers largely attributable to the lower industrial production rates in Brazil. Byend-market, sales increased to metals and healthcare, and were slightly lower to general manufacturing customers.
Operating profit decreased $101 million or 19% versus 2011, primarily due to currency translation impacts which reducedoperating profit by 14%. Underlying operating profit decreased 5% versus 2011. Higher pricing in 2012 improved operating profitby 9% but this was more than offset by the impact of a lower mix of higher margin packaged gas and merchant liquid volumes, andhigher operating costs primarily related to power, distribution and cost inflation. Reported operating expenses in 2012 were belowprior year amounts due primarily to currency impacts. Depreciation and amortization increased in 2012 due to the start up of newon-site production facilities but was more than offset by the impacts of currency translation. 2012 included a benefit from litigationsettlements, which was largely offset by charges in connection with business restructuring in Brazil, Chile and Colombia.
Sales in 2011 increased $338 million, or 17% versus 2010. Excluding the impact of currency and cost pass-through,underlying sales grew 11% from higher volumes, including new plant start-ups, and higher pricing. Sales grew in all major endmarkets served.
Operating profit in 2011 increased $76 million, or 17% versus 2010. Excluding currency, operating profit increased by 13%.This operating profit increase was in line with sales growth as the 30% increase due to higher pricing and volumes was partiallyoffset by higher operating costs primarily related to power, distribution and cost inflation. Operating profit in 2011 included a gainfrom an asset sale largely offset by asset write-downs.
Asia
(Dollar amounts in millions)Year Ended December 31,
Variance
2012 2011 2010 2012 vs. 2011 2011 vs. 2010
Sales $1,414 $1,348 $1,158 5% 16%Cost of sales, exclusive of depreciation and amortization 952 893 784
Gross margin 462 455 374Operating expenses 89 95 63Depreciation and amortization 127 126 118
Operating profit $ 246 $ 234 $ 193 5% 21%
Margin % 17.4% 17.4% 16.7%
29
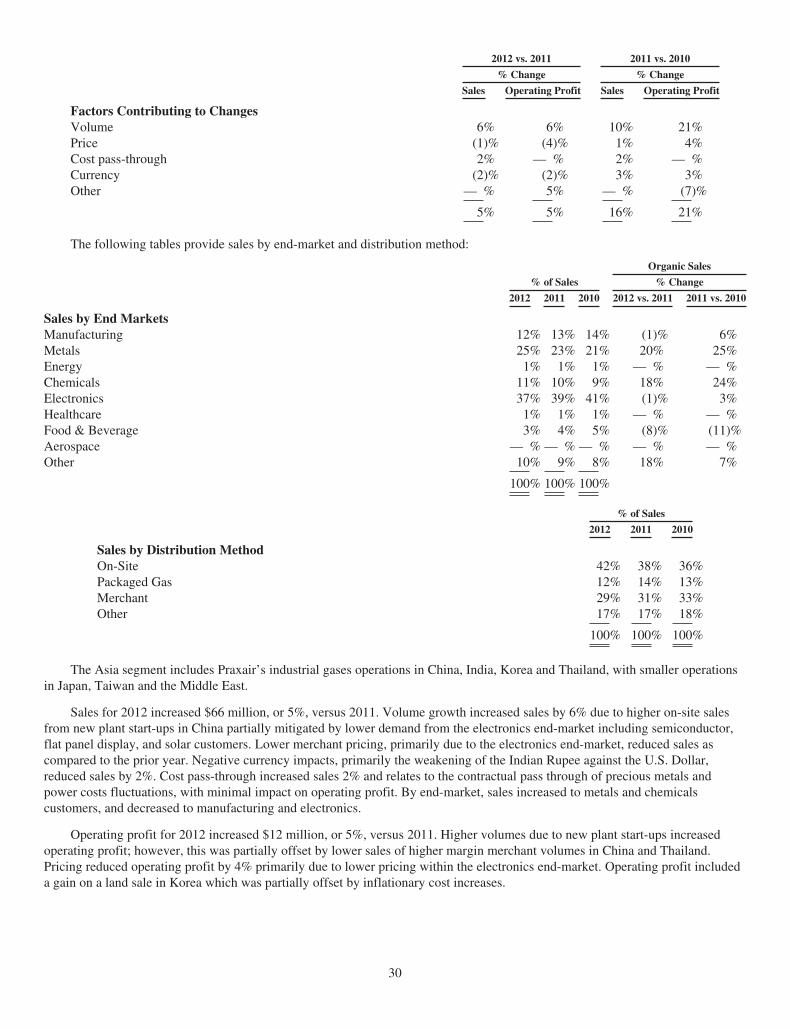
2012 vs. 2011 2011 vs. 2010
% Change % Change
Sales Operating Profit Sales Operating Profit
Factors Contributing to ChangesVolume 6% 6% 10% 21%Price (1)% (4)% 1% 4%Cost pass-through 2% — % 2% — %Currency (2)% (2)% 3% 3%Other — % 5% — % (7)%
5% 5% 16% 21%
The following tables provide sales by end-market and distribution method:
Organic Sales
% of Sales % Change
2012 2011 2010 2012 vs. 2011 2011 vs. 2010
Sales by End MarketsManufacturing 12% 13% 14% (1)% 6%Metals 25% 23% 21% 20% 25%Energy 1% 1% 1% — % — %Chemicals 11% 10% 9% 18% 24%Electronics 37% 39% 41% (1)% 3%Healthcare 1% 1% 1% — % — %Food & Beverage 3% 4% 5% (8)% (11)%Aerospace — % — % — % — % — %Other 10% 9% 8% 18% 7%
100% 100% 100%
% of Sales
2012 2011 2010
Sales by Distribution MethodOn-Site 42% 38% 36%Packaged Gas 12% 14% 13%Merchant 29% 31% 33%Other 17% 17% 18%
100% 100% 100%
The Asia segment includes Praxair’s industrial gases operations in China, India, Korea and Thailand, with smaller operationsin Japan, Taiwan and the Middle East.
Sales for 2012 increased $66 million, or 5%, versus 2011. Volume growth increased sales by 6% due to higher on-site salesfrom new plant start-ups in China partially mitigated by lower demand from the electronics end-market including semiconductor,flat panel display, and solar customers. Lower merchant pricing, primarily due to the electronics end-market, reduced sales ascompared to the prior year. Negative currency impacts, primarily the weakening of the Indian Rupee against the U.S. Dollar,reduced sales by 2%. Cost pass-through increased sales 2% and relates to the contractual pass through of precious metals andpower costs fluctuations, with minimal impact on operating profit. By end-market, sales increased to metals and chemicalscustomers, and decreased to manufacturing and electronics.
Operating profit for 2012 increased $12 million, or 5%, versus 2011. Higher volumes due to new plant start-ups increasedoperating profit; however, this was partially offset by lower sales of higher margin merchant volumes in China and Thailand.Pricing reduced operating profit by 4% primarily due to lower pricing within the electronics end-market. Operating profit includeda gain on a land sale in Korea which was partially offset by inflationary cost increases.
30
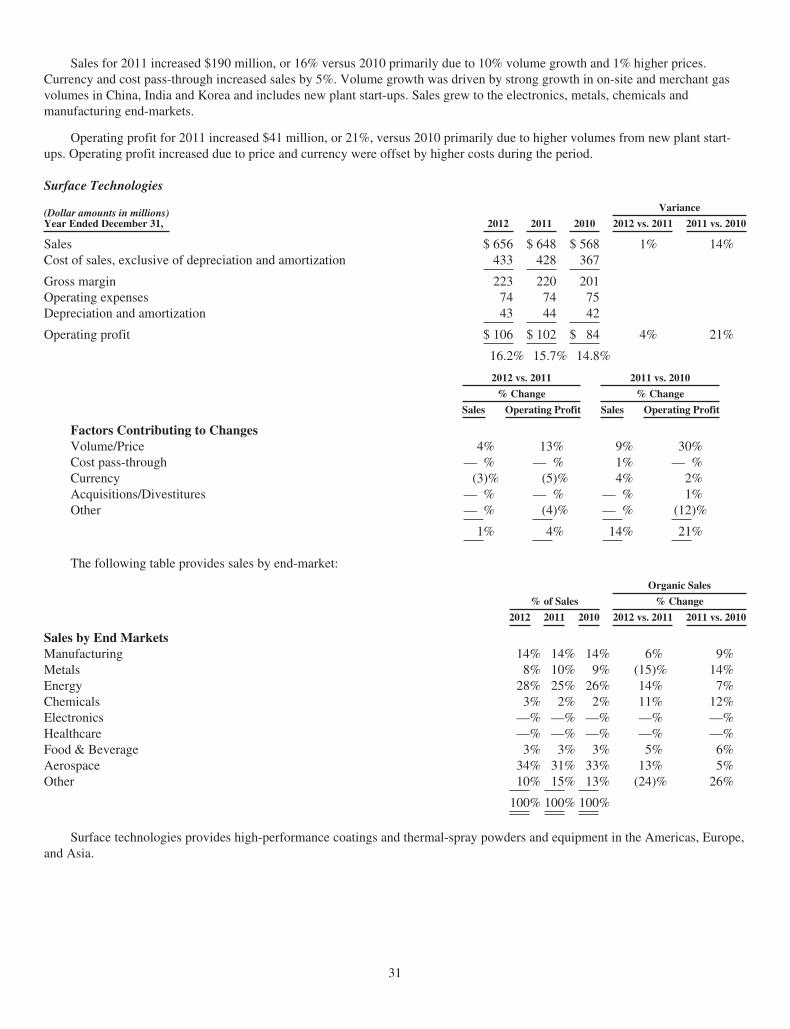
Sales for 2011 increased $190 million, or 16% versus 2010 primarily due to 10% volume growth and 1% higher prices.Currency and cost pass-through increased sales by 5%. Volume growth was driven by strong growth in on-site and merchant gasvolumes in China, India and Korea and includes new plant start-ups. Sales grew to the electronics, metals, chemicals andmanufacturing end-markets.
Operating profit for 2011 increased $41 million, or 21%, versus 2010 primarily due to higher volumes from new plant start-ups. Operating profit increased due to price and currency were offset by higher costs during the period.
Surface Technologies
(Dollar amounts in millions)Year Ended December 31,
Variance
2012 2011 2010 2012 vs. 2011 2011 vs. 2010
Sales $ 656 $ 648 $ 568 1% 14%Cost of sales, exclusive of depreciation and amortization 433 428 367
Gross margin 223 220 201Operating expenses 74 74 75Depreciation and amortization 43 44 42
Operating profit $ 106 $ 102 $ 84 4% 21%
16.2% 15.7% 14.8%
2012 vs. 2011 2011 vs. 2010
% Change % Change
Sales Operating Profit Sales Operating Profit
Factors Contributing to ChangesVolume/Price 4% 13% 9% 30%Cost pass-through — % — % 1% — %Currency (3)% (5)% 4% 2%Acquisitions/Divestitures — % — % — % 1%Other — % (4)% — % (12)%
1% 4% 14% 21%
The following table provides sales by end-market:
Organic Sales
% of Sales % Change
2012 2011 2010 2012 vs. 2011 2011 vs. 2010
Sales by End MarketsManufacturing 14% 14% 14% 6% 9%Metals 8% 10% 9% (15)% 14%Energy 28% 25% 26% 14% 7%Chemicals 3% 2% 2% 11% 12%Electronics —% —% —% —% —%Healthcare —% —% —% —% —%Food & Beverage 3% 3% 3% 5% 6%Aerospace 34% 31% 33% 13% 5%Other 10% 15% 13% (24)% 26%
100% 100% 100%
Surface technologies provides high-performance coatings and thermal-spray powders and equipment in the Americas, Europe,and Asia.
31
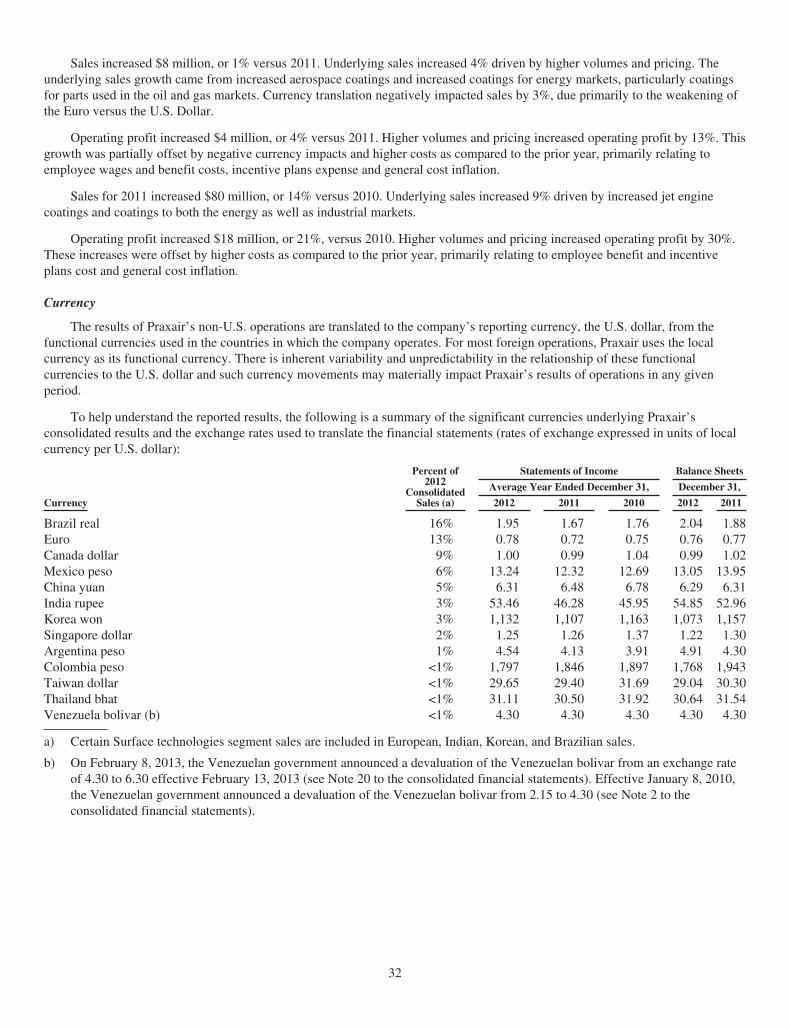
Sales increased $8 million, or 1% versus 2011. Underlying sales increased 4% driven by higher volumes and pricing. Theunderlying sales growth came from increased aerospace coatings and increased coatings for energy markets, particularly coatingsfor parts used in the oil and gas markets. Currency translation negatively impacted sales by 3%, due primarily to the weakening ofthe Euro versus the U.S. Dollar.
Operating profit increased $4 million, or 4% versus 2011. Higher volumes and pricing increased operating profit by 13%. Thisgrowth was partially offset by negative currency impacts and higher costs as compared to the prior year, primarily relating toemployee wages and benefit costs, incentive plans expense and general cost inflation.
Sales for 2011 increased $80 million, or 14% versus 2010. Underlying sales increased 9% driven by increased jet enginecoatings and coatings to both the energy as well as industrial markets.
Operating profit increased $18 million, or 21%, versus 2010. Higher volumes and pricing increased operating profit by 30%.These increases were offset by higher costs as compared to the prior year, primarily relating to employee benefit and incentiveplans cost and general cost inflation.
Currency
The results of Praxair’s non-U.S. operations are translated to the company’s reporting currency, the U.S. dollar, from thefunctional currencies used in the countries in which the company operates. For most foreign operations, Praxair uses the localcurrency as its functional currency. There is inherent variability and unpredictability in the relationship of these functionalcurrencies to the U.S. dollar and such currency movements may materially impact Praxair’s results of operations in any givenperiod.
To help understand the reported results, the following is a summary of the significant currencies underlying Praxair’sconsolidated results and the exchange rates used to translate the financial statements (rates of exchange expressed in units of localcurrency per U.S. dollar):
Percent of2012
ConsolidatedSales (a)
Statements of Income Balance Sheets
Average Year Ended December 31, December 31,
Currency 2012 2011 2010 2012 2011
Brazil real 16% 1.95 1.67 1.76 2.04 1.88Euro 13% 0.78 0.72 0.75 0.76 0.77Canada dollar 9% 1.00 0.99 1.04 0.99 1.02Mexico peso 6% 13.24 12.32 12.69 13.05 13.95China yuan 5% 6.31 6.48 6.78 6.29 6.31India rupee 3% 53.46 46.28 45.95 54.85 52.96Korea won 3% 1,132 1,107 1,163 1,073 1,157Singapore dollar 2% 1.25 1.26 1.37 1.22 1.30Argentina peso 1% 4.54 4.13 3.91 4.91 4.30Colombia peso <1% 1,797 1,846 1,897 1,768 1,943Taiwan dollar <1% 29.65 29.40 31.69 29.04 30.30Thailand bhat <1% 31.11 30.50 31.92 30.64 31.54Venezuela bolivar (b) <1% 4.30 4.30 4.30 4.30 4.30
a) Certain Surface technologies segment sales are included in European, Indian, Korean, and Brazilian sales.
b) On February 8, 2013, the Venezuelan government announced a devaluation of the Venezuelan bolivar from an exchange rateof 4.30 to 6.30 effective February 13, 2013 (see Note 20 to the consolidated financial statements). Effective January 8, 2010,the Venezuelan government announced a devaluation of the Venezuelan bolivar from 2.15 to 4.30 (see Note 2 to theconsolidated financial statements).
32
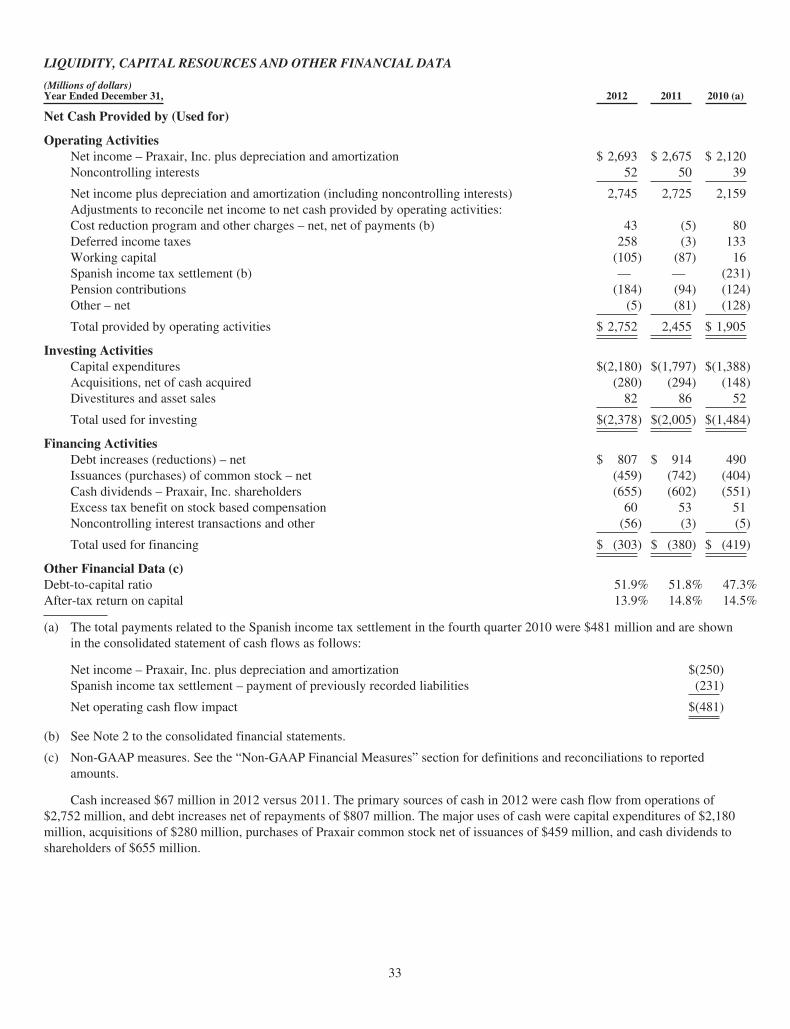
LIQUIDITY, CAPITAL RESOURCES AND OTHER FINANCIAL DATA
(Millions of dollars)Year Ended December 31, 2012 2011 2010 (a)
Net Cash Provided by (Used for)
Operating ActivitiesNet income – Praxair, Inc. plus depreciation and amortization $ 2,693 $ 2,675 $ 2,120Noncontrolling interests 52 50 39
Net income plus depreciation and amortization (including noncontrolling interests) 2,745 2,725 2,159Adjustments to reconcile net income to net cash provided by operating activities:Cost reduction program and other charges – net, net of payments (b) 43 (5) 80Deferred income taxes 258 (3) 133Working capital (105) (87) 16Spanish income tax settlement (b) — — (231)Pension contributions (184) (94) (124)Other – net (5) (81) (128)
Total provided by operating activities $ 2,752 2,455 $ 1,905
Investing ActivitiesCapital expenditures $(2,180) $(1,797) $(1,388)Acquisitions, net of cash acquired (280) (294) (148)Divestitures and asset sales 82 86 52
Total used for investing $(2,378) $(2,005) $(1,484)
Financing ActivitiesDebt increases (reductions) – net $ 807 $ 914 490Issuances (purchases) of common stock – net (459) (742) (404)Cash dividends – Praxair, Inc. shareholders (655) (602) (551)Excess tax benefit on stock based compensation 60 53 51Noncontrolling interest transactions and other (56) (3) (5)
Total used for financing $ (303) $ (380) $ (419)
Other Financial Data (c)Debt-to-capital ratio 51.9% 51.8% 47.3%After-tax return on capital 13.9% 14.8% 14.5%
(a) The total payments related to the Spanish income tax settlement in the fourth quarter 2010 were $481 million and are shownin the consolidated statement of cash flows as follows:
Net income – Praxair, Inc. plus depreciation and amortization $(250)Spanish income tax settlement – payment of previously recorded liabilities (231)
Net operating cash flow impact $(481)
(b) See Note 2 to the consolidated financial statements.
(c) Non-GAAP measures. See the “Non-GAAP Financial Measures” section for definitions and reconciliations to reportedamounts.
Cash increased $67 million in 2012 versus 2011. The primary sources of cash in 2012 were cash flow from operations of$2,752 million, and debt increases net of repayments of $807 million. The major uses of cash were capital expenditures of $2,180million, acquisitions of $280 million, purchases of Praxair common stock net of issuances of $459 million, and cash dividends toshareholders of $655 million.
33
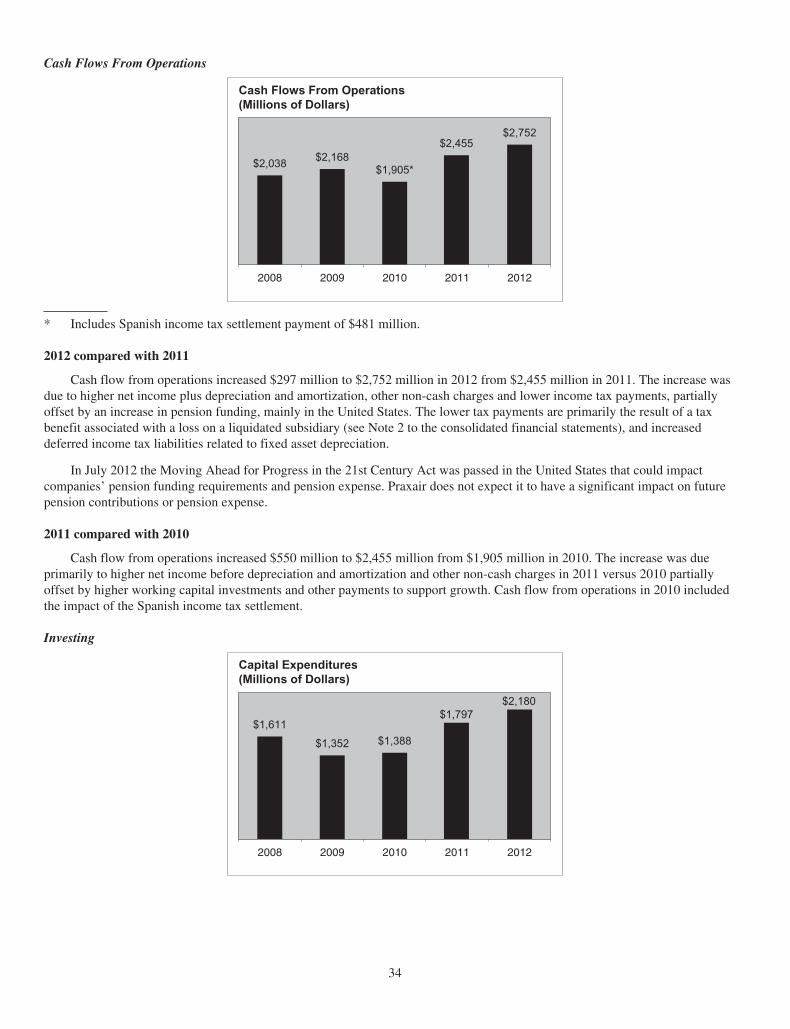
Cash Flows From Operations
Cash Flows From Operations(Millions of Dollars)
2008 2009 2010 2011 2012
$2,038$2,168
$1,905*
$2,752$2,455
* Includes Spanish income tax settlement payment of $481 million.
2012 compared with 2011
Cash flow from operations increased $297 million to $2,752 million in 2012 from $2,455 million in 2011. The increase wasdue to higher net income plus depreciation and amortization, other non-cash charges and lower income tax payments, partiallyoffset by an increase in pension funding, mainly in the United States. The lower tax payments are primarily the result of a taxbenefit associated with a loss on a liquidated subsidiary (see Note 2 to the consolidated financial statements), and increaseddeferred income tax liabilities related to fixed asset depreciation.
In July 2012 the Moving Ahead for Progress in the 21st Century Act was passed in the United States that could impactcompanies’ pension funding requirements and pension expense. Praxair does not expect it to have a significant impact on futurepension contributions or pension expense.
2011 compared with 2010
Cash flow from operations increased $550 million to $2,455 million from $1,905 million in 2010. The increase was dueprimarily to higher net income before depreciation and amortization and other non-cash charges in 2011 versus 2010 partiallyoffset by higher working capital investments and other payments to support growth. Cash flow from operations in 2010 includedthe impact of the Spanish income tax settlement.
Investing
Capital Expenditures(Millions of Dollars)
2008 2009 2010 2011 2012
$1,611
$1,352 $1,388
$1,797$2,180
34
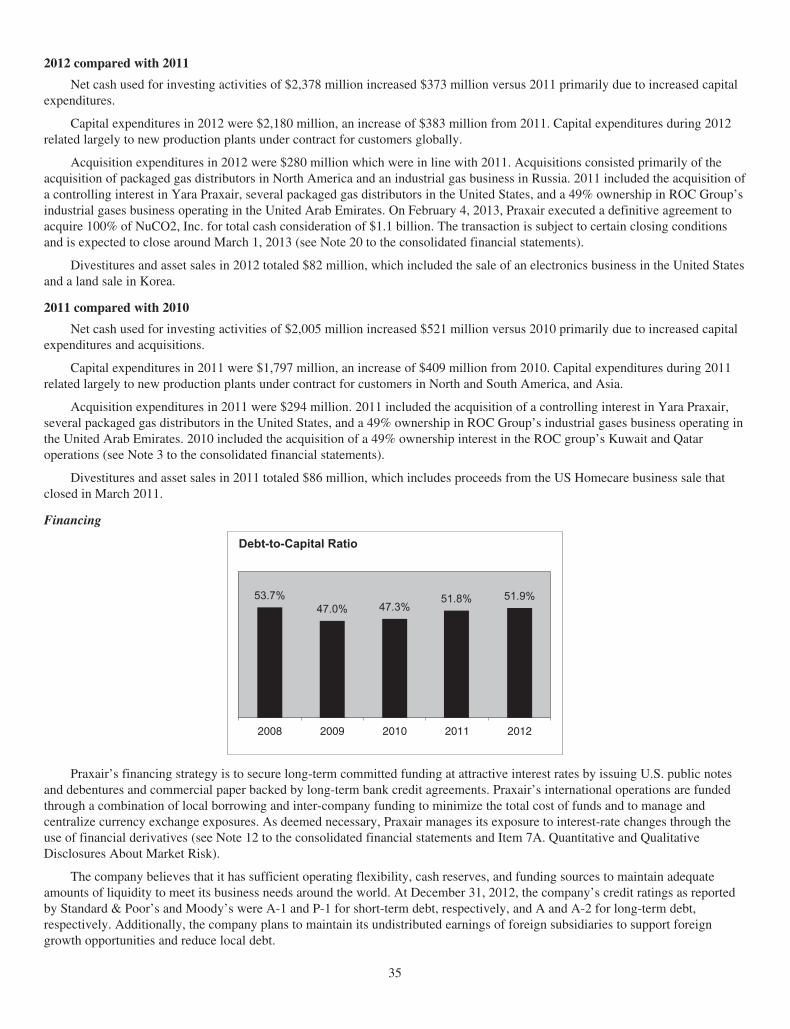
2012 compared with 2011
Net cash used for investing activities of $2,378 million increased $373 million versus 2011 primarily due to increased capitalexpenditures.
Capital expenditures in 2012 were $2,180 million, an increase of $383 million from 2011. Capital expenditures during 2012related largely to new production plants under contract for customers globally.
Acquisition expenditures in 2012 were $280 million which were in line with 2011. Acquisitions consisted primarily of theacquisition of packaged gas distributors in North America and an industrial gas business in Russia. 2011 included the acquisition ofa controlling interest in Yara Praxair, several packaged gas distributors in the United States, and a 49% ownership in ROC Group’sindustrial gases business operating in the United Arab Emirates. On February 4, 2013, Praxair executed a definitive agreement toacquire 100% of NuCO2, Inc. for total cash consideration of $1.1 billion. The transaction is subject to certain closing conditionsand is expected to close around March 1, 2013 (see Note 20 to the consolidated financial statements).
Divestitures and asset sales in 2012 totaled $82 million, which included the sale of an electronics business in the United Statesand a land sale in Korea.
2011 compared with 2010
Net cash used for investing activities of $2,005 million increased $521 million versus 2010 primarily due to increased capitalexpenditures and acquisitions.
Capital expenditures in 2011 were $1,797 million, an increase of $409 million from 2010. Capital expenditures during 2011related largely to new production plants under contract for customers in North and South America, and Asia.
Acquisition expenditures in 2011 were $294 million. 2011 included the acquisition of a controlling interest in Yara Praxair,several packaged gas distributors in the United States, and a 49% ownership in ROC Group’s industrial gases business operating inthe United Arab Emirates. 2010 included the acquisition of a 49% ownership interest in the ROC group’s Kuwait and Qataroperations (see Note 3 to the consolidated financial statements).
Divestitures and asset sales in 2011 totaled $86 million, which includes proceeds from the US Homecare business sale thatclosed in March 2011.
Financing
Debt-to-Capital Ratio
2008 2009 2010 2011 2012
53.7%47.0% 47.3%
51.9%51.8%
Praxair’s financing strategy is to secure long-term committed funding at attractive interest rates by issuing U.S. public notesand debentures and commercial paper backed by long-term bank credit agreements. Praxair’s international operations are fundedthrough a combination of local borrowing and inter-company funding to minimize the total cost of funds and to manage andcentralize currency exchange exposures. As deemed necessary, Praxair manages its exposure to interest-rate changes through theuse of financial derivatives (see Note 12 to the consolidated financial statements and Item 7A. Quantitative and QualitativeDisclosures About Market Risk).
The company believes that it has sufficient operating flexibility, cash reserves, and funding sources to maintain adequateamounts of liquidity to meet its business needs around the world. At December 31, 2012, the company’s credit ratings as reportedby Standard & Poor’s and Moody’s were A-1 and P-1 for short-term debt, respectively, and A and A-2 for long-term debt,respectively. Additionally, the company plans to maintain its undistributed earnings of foreign subsidiaries to support foreigngrowth opportunities and reduce local debt.
35
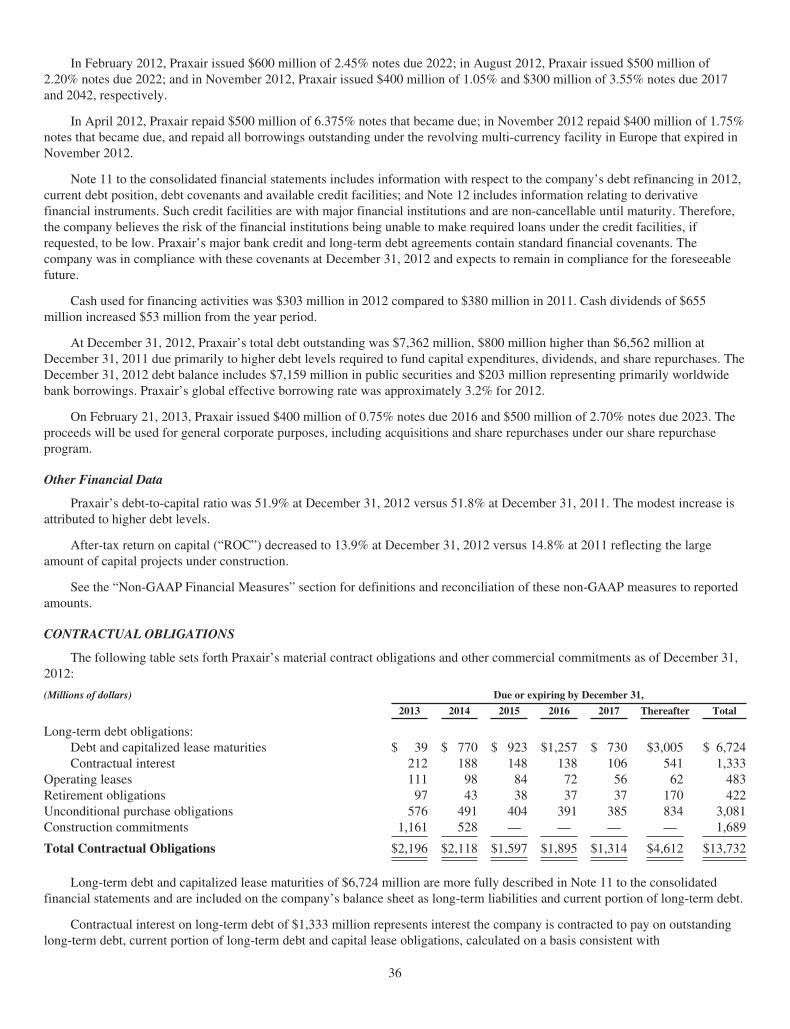
In February 2012, Praxair issued $600 million of 2.45% notes due 2022; in August 2012, Praxair issued $500 million of2.20% notes due 2022; and in November 2012, Praxair issued $400 million of 1.05% and $300 million of 3.55% notes due 2017and 2042, respectively.
In April 2012, Praxair repaid $500 million of 6.375% notes that became due; in November 2012 repaid $400 million of 1.75%notes that became due, and repaid all borrowings outstanding under the revolving multi-currency facility in Europe that expired inNovember 2012.
Note 11 to the consolidated financial statements includes information with respect to the company’s debt refinancing in 2012,current debt position, debt covenants and available credit facilities; and Note 12 includes information relating to derivativefinancial instruments. Such credit facilities are with major financial institutions and are non-cancellable until maturity. Therefore,the company believes the risk of the financial institutions being unable to make required loans under the credit facilities, ifrequested, to be low. Praxair’s major bank credit and long-term debt agreements contain standard financial covenants. Thecompany was in compliance with these covenants at December 31, 2012 and expects to remain in compliance for the foreseeablefuture.
Cash used for financing activities was $303 million in 2012 compared to $380 million in 2011. Cash dividends of $655million increased $53 million from the year period.
At December 31, 2012, Praxair’s total debt outstanding was $7,362 million, $800 million higher than $6,562 million atDecember 31, 2011 due primarily to higher debt levels required to fund capital expenditures, dividends, and share repurchases. TheDecember 31, 2012 debt balance includes $7,159 million in public securities and $203 million representing primarily worldwidebank borrowings. Praxair’s global effective borrowing rate was approximately 3.2% for 2012.
On February 21, 2013, Praxair issued $400 million of 0.75% notes due 2016 and $500 million of 2.70% notes due 2023. Theproceeds will be used for general corporate purposes, including acquisitions and share repurchases under our share repurchaseprogram.
Other Financial Data
Praxair’s debt-to-capital ratio was 51.9% at December 31, 2012 versus 51.8% at December 31, 2011. The modest increase isattributed to higher debt levels.
After-tax return on capital (“ROC”) decreased to 13.9% at December 31, 2012 versus 14.8% at 2011 reflecting the largeamount of capital projects under construction.
See the “Non-GAAP Financial Measures” section for definitions and reconciliation of these non-GAAP measures to reportedamounts.
CONTRACTUAL OBLIGATIONS
The following table sets forth Praxair’s material contract obligations and other commercial commitments as of December 31,2012:
(Millions of dollars) Due or expiring by December 31,
2013 2014 2015 2016 2017 Thereafter Total
Long-term debt obligations:Debt and capitalized lease maturities $ 39 $ 770 $ 923 $1,257 $ 730 $3,005 $ 6,724Contractual interest 212 188 148 138 106 541 1,333
Operating leases 111 98 84 72 56 62 483Retirement obligations 97 43 38 37 37 170 422Unconditional purchase obligations 576 491 404 391 385 834 3,081Construction commitments 1,161 528 — — — — 1,689
Total Contractual Obligations $2,196 $2,118 $1,597 $1,895 $1,314 $4,612 $13,732
Long-term debt and capitalized lease maturities of $6,724 million are more fully described in Note 11 to the consolidatedfinancial statements and are included on the company’s balance sheet as long-term liabilities and current portion of long-term debt.
Contractual interest on long-term debt of $1,333 million represents interest the company is contracted to pay on outstandinglong-term debt, current portion of long-term debt and capital lease obligations, calculated on a basis consistent with
36
planned debt maturities, excluding the interest impact of interest rate swaps. At December 31, 2012, Praxair had fixed-rate debt of$6,239 million and floating-rate debt of $1,123 million. The rate assumed for floating-rate debt was the rate in effect atDecember 31, 2012.
Obligations under operating leases of $483 million represent non-cancellable contractual obligations primarily formanufacturing and distribution equipment and office space. See Note 4 to the consolidated financial statements for further details.
Retirement obligations of $422 million include estimates of pension plan contributions and expected future benefit paymentsfor unfunded pension and postretirement benefits other than pensions (“OPEB”). Pension plan contributions are forecast for 2013only. For purposes of the table, $50 million of contributions have been included for 2013. Expected future unfunded pension andOPEB benefit payments are forecast only through 2022. Contribution and unfunded benefit payment estimates are based uponcurrent valuation assumptions. Estimates of pension contributions after 2013 and unfunded benefit payments after 2022 are notincluded in the table because the timing of their resolution cannot be estimated. Retirement obligations are more fully described inNote 16 to the consolidated financial statements.
Unconditional purchase obligations of $3,081 million represent contractual commitments under various long and short-termtake-or-pay arrangements with suppliers. These obligations are primarily minimum-purchase commitments for helium, electricity,natural gas and feedstock used to produce atmospheric and process gases including a multi-year contract for the purchase of silane.During 2012, payments related to Praxair’s unconditional purchase obligations totaled $1,093 million, including $679 million forelectricity and $207 million for natural gas. A significant portion of these obligations is passed on to customers through similartake-or-pay or other contractual arrangements. Purchase obligations that are not passed along to customers through suchcontractual arrangements are subject to market conditions, but do not represent a material risk to Praxair. At December 31, 2012the total purchase obligation for the silane contract is $166 million. Since the contract was signed, the market for silane has notdeveloped as expected and prices have decreased due to lower demand from the photovoltaics markets, primarily in Asia. AtDecember 31, 2012, Praxair’s current selling prices and estimated future demand for silane are in excess of its contractual purchaseobligations under the contract. The company is continually monitoring market developments.
Construction commitments of $1,689 million represent outstanding commitments to complete authorized construction projectsas of December 31, 2012. A significant portion of Praxair’s capital spending is related to the construction of new productionfacilities to satisfy customer commitments which may take a year or more to complete.
Liabilities for uncertain tax positions totaling $85 million, including interest and penalties, are not included in the tablebecause the timing of their resolution cannot be estimated. See Note 5 to the consolidated financial statements for disclosuressurrounding uncertain income tax positions.
OFF-BALANCE SHEET ARRANGEMENTS
As discussed in Note 17 to the consolidated financial statements, at December 31, 2012, Praxair had entered into variousguarantees and other arrangements, and had undrawn outstanding letters of credit from financial institutions. These arrangementswere entered into in connection with normal business operations and they are not reasonably likely to have a material impact onPraxair’s consolidated financial condition, results of operations, or liquidity.
CRITICAL ACCOUNTING POLICIES
The policies discussed below are considered by management to be critical to understanding Praxair’s financial statements andaccompanying notes prepared in accordance with accounting principles generally accepted in the United States (U.S. GAAP).Their application places significant importance on management’s judgment as a result of the need to make estimates of matters thatare inherently uncertain. Praxair’s financial position, results of operations and cash flows could be materially affected if actualresults differ from estimates made. These policies are determined by management and have been reviewed by Praxair’s AuditCommittee.
Depreciable Lives of Property, Plant and Equipment
Praxair’s net property, plant and equipment at December 31, 2012 was $11,453 million, representing 63% of the company’sconsolidated total assets. Depreciation expense for the year ended December 31, 2012 was $980 million, or 11% of total operatingcosts. Management judgment is required in the determination of the estimated depreciable lives that are used to calculate theannual depreciation expense and accumulated depreciation.
Property, plant and equipment are recorded at cost and depreciated over the assets’ estimated useful lives on a straight-linebasis for financial reporting purposes. The estimated useful life represents the projected period of time that the asset will beproductively employed by the company and is determined by management based on many factors, including historical experiencewith similar assets, technological life cycles, geographic locations and contractual supply relationships with on-site customers.Circumstances and events relating to these assets, such as on-site contract modifications, are monitored to ensure
37
that changes in asset lives or impairments (see “Asset Impairments”) are identified and prospective depreciation expense orimpairment expense is adjusted accordingly. Praxair’s largest asset values relate to cryogenic air-separation production plants withdepreciable lives of principally 15 years.
Based upon the assets as of December 31, 2012, if depreciable lives of machinery and equipment, on average, were increasedor decreased by one year, annual depreciation expense would be decreased by approximately $62 million or increased byapproximately $71 million, respectively.
Pension Benefits
Pension benefits represent financial obligations that will be ultimately settled in the future with employees who meeteligibility requirements. Because of the uncertainties involved in estimating the timing and amount of future payments, significantestimates are required to calculate pension expense and liabilities related to the company’s plans. The company utilizes the servicesof several independent actuaries, whose models are used to facilitate these calculations.
Several key assumptions are used in actuarial models to calculate pension expense and liability amounts recorded in thefinancial statements. Management believes the three most significant variables in the models are the expected long-term rate ofreturn on plan assets, the discount rate, and the expected rate of compensation increase. The actuarial models also use assumptionsfor various other factors, including employee turnover, retirement age, and mortality. Praxair management believes theassumptions used in the actuarial calculations are reasonable, reflect the company’s experience and expectations for the future andare within accepted practices in each of the respective geographic locations in which it operates. Actual results in any given yearwill often differ from actuarial assumptions because of economic and other factors.
The weighted-average expected long-term rates of return on pension plan assets were 8.25% for U.S. plans and 8.70% forinternational plans for the years ended December 31, 2012 and 2011. These rates are determined annually by management based ona weighted average of current and historical market trends, historical and expected portfolio performance and the current andexpected portfolio mix of investments. A 0.50% change in these expected long-term rates of return, with all other variables heldconstant, would change Praxair’s pension expense by approximately $9 million.
The company has consistently used a market-related value of assets rather than the fair value at the measurement date todetermine annual pension expense. The market-related value recognizes investment gains or losses over a five-year period. As aresult, changes in the fair value of assets from year to year are not immediately reflected in the company’s annual pension expense.Instead, annual pension expense in future periods will be impacted as deferred investment gains or losses are recognized in themarket-related value of assets over the five-year period. The consolidated market-related value of assets was $1,959 million, or $10million higher than the fair value of assets of $1,949 million at December 31, 2012. These net deferred investment losses of $10million will be recognized in the calculation of the market-related value of assets ratably over the next four years and will impactfuture pension expense. Future actual investment gains or losses will impact the market-related value of assets and, therefore, willimpact future annual pension expense in a similar manner.
The weighted-average discount rates for pension plan liabilities were 3.90% for U.S. plans and 5.80% for international plans atDecember 31, 2012 (4.70% and 7.00%, respectively, at December 31, 2011). These rates are used to calculate the present value ofplan liabilities and are determined annually by management. The discount rate for the U.S. plans is established utilizing a cash flowmatching model provided by the company’s independent actuaries. The model includes a portfolio of corporate bonds graded Aa orbetter by at least half of the ratings agencies and matches the U.S. plan’s projected cash flows to the calculated spot rates and developsthe single equivalent discount rate which produces the same present value. The discount rates for the remaining international plans arebased on market yields for high-quality fixed income investments representing the approximate duration of the pension liabilities onthe measurement date. A 0.50% increase/decrease in discount rates, with all other variables held constant, would decrease/increasePraxair’s pension expense by approximately $12 million and would impact the PBO by approximately $171 million.
The weighted-average expected rate of compensation increase was 3.25% for U.S. plans and 4.00% for international plans atDecember 31, 2012 and 2011. The estimated annual compensation increase is determined by management every year and is basedon historical trends and market indices. A 0.50% change in the expected rate of compensation increase, with all other variablesheld constant, would change Praxair’s pension expense by approximately $5 million and would impact the PBO by approximately$32 million.
Asset Impairments
Goodwill
At December 31, 2012, the company had goodwill of $2,507 million, which represents the aggregate of the excess purchaseprice for acquired businesses over the fair value of the net assets acquired.
The company performs a goodwill impairment test annually in the second quarter or more frequently if events orcircumstances indicate that an impairment loss may have been incurred, and no impairments were indicated. The company has
38
continuously re-evaluated the likelihood of goodwill impairments in its reporting units subsequent to the second quarter test, anddoes not believe there is indication of impairment for any of its reporting units. At December 31, 2012, Praxair’s enterprise valuewas approximately $40 billion (outstanding shares multiplied by the year-end stock price plus debt, and without any controlpremium) while its total capital was approximately $14 billion.
The impairment test allows an entity to first assess qualitative factors to determine if it is more likely than not that the fairvalue of a reporting unit is less than carrying value. If it is determined, that it is more likely than not that the fair value of areporting unit is less than carrying value then the company will estimate and compare the fair value of its reporting units to theircarrying value, including goodwill. Reporting units are determined based on one level below the operating segment level. Fairvalue is determined through the use of projected future cash flows, multiples of earnings and sales and other factors.
Such analysis requires the use of certain market assumptions and discount factors, which are subjective in nature. Asapplicable, estimated values can be affected by many factors beyond the company’s control such as business and economic trends,government regulation, and technological changes. Management believes that the qualitative factors used to perform its annualgoodwill impairment assessment are appropriate and reasonable. Although the 2012 qualitative assessment indicated that it is morelikely than not that the fair value of each reporting unit substantially exceeded its carrying value, changes in circumstances orconditions affecting this analysis could have a significant impact on the fair value determination, which could then result in amaterial impairment charge to the company’s results of operations.
See Note 9 to the consolidated financial statements for disclosures concerning the carrying value of goodwill by reportablesegment.
Property, Plant and Equipment
Property, plant and equipment is tested for impairment whenever events or changes in circumstances indicate that the carryingamount of an individual asset or asset group may not be recoverable. To assess recoverability, the company compares the estimatedundiscounted future cash flows expected to be generated from the asset or asset group to the carrying amount of the asset or assetgroup. If the undiscounted future cash flows are less than the carrying amount of the asset or asset group, an impairment chargereducing the carrying amount to fair value is required. Fair value is determined based on the most appropriate valuation technique,including discounted cash flows. This analysis requires management to make various subjective estimates and assumptions,including the amount of projected future cash flows related to the asset or asset group, the useful life over which cash flows willoccur and the asset’s residual value, if any.
Income Taxes
At December 31, 2012, Praxair had deferred tax assets of $867 million (net of valuation allowances of $86 million), anddeferred tax liabilities of $1,450 million. At December 31, 2012, uncertain tax positions totaled $142 million (see Notes 1 and 5 tothe consolidated financial statements). Income tax expense was $586 million for the year ended December 31, 2012, or about25.5% of pre-tax income.
In the preparation of consolidated financial statements, Praxair estimates income taxes based on diverse legislative andregulatory structures that exist in various jurisdictions where the company conducts business. Deferred income tax assets andliabilities represent tax benefits or obligations that arise from temporary differences due to differing treatment of certain items foraccounting and income tax purposes. Praxair evaluates deferred tax assets each period to ensure that estimated future taxableincome will be sufficient in character (e.g. capital gain versus ordinary income treatment), amount and timing to result in theirrecovery. A valuation allowance is established when management determines that it is more likely than not that a deferred tax assetwill not be realized to reduce the assets to their realizable value. Considerable judgments are required in establishing deferred taxvaluation allowances and in assessing exposures related to tax matters. As events and circumstances change, related reserves andvaluation allowances are adjusted to income at that time. Praxair’s tax returns are subject to audit and local taxing authorities couldchallenge the company’s tax positions. The company’s practice is to review tax filing positions by jurisdiction and to recordprovisions for uncertain income tax positions, including interest and penalties when applicable. Praxair believes it records and/ordiscloses such potential tax liabilities as appropriate and has reasonably estimated its income tax liabilities and recoverable taxassets. If new information becomes available, adjustments are charged or credited against income at that time. Management doesnot anticipate that such adjustments would have a material adverse effect on the company’s consolidated financial position orliquidity; however, it is possible that the final outcomes could have a material impact on the company’s reported results ofoperations.
Contingencies
The company accrues liabilities for non-income tax contingencies when management believes that a loss is probable and theamounts can be reasonably estimated, while contingent gains are recognized only when realized. If new information becomesavailable or losses are sustained in excess of recorded amounts, adjustments are charged against income at that time.
39
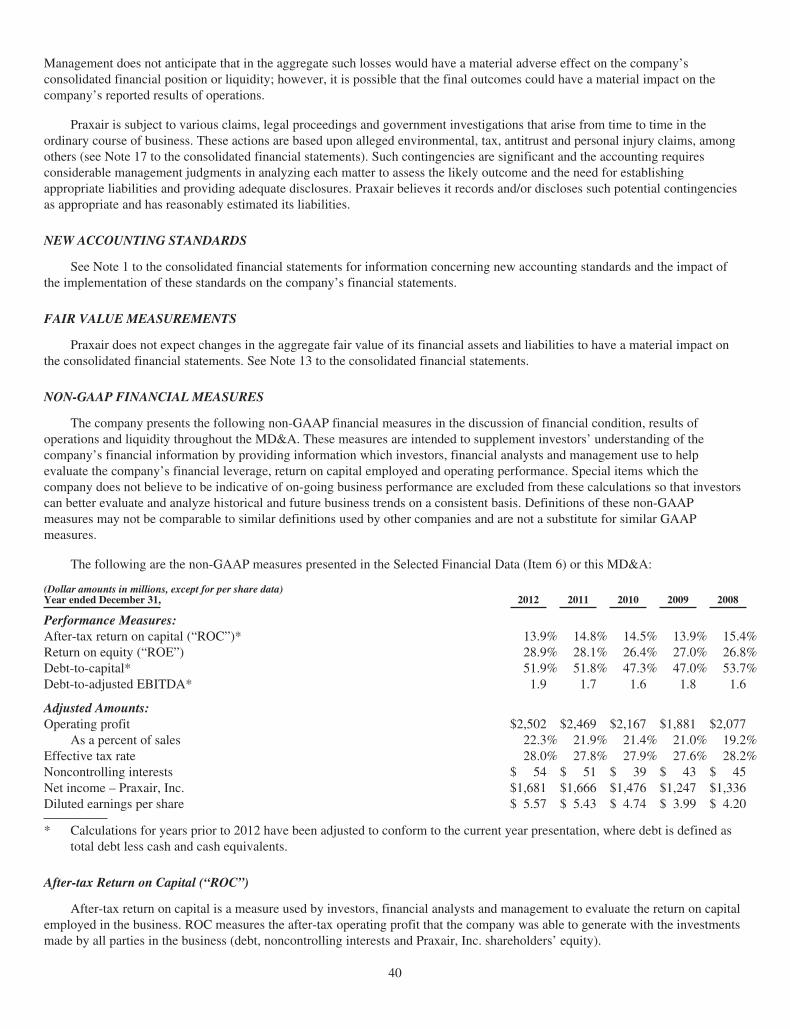
Management does not anticipate that in the aggregate such losses would have a material adverse effect on the company’sconsolidated financial position or liquidity; however, it is possible that the final outcomes could have a material impact on thecompany’s reported results of operations.
Praxair is subject to various claims, legal proceedings and government investigations that arise from time to time in theordinary course of business. These actions are based upon alleged environmental, tax, antitrust and personal injury claims, amongothers (see Note 17 to the consolidated financial statements). Such contingencies are significant and the accounting requiresconsiderable management judgments in analyzing each matter to assess the likely outcome and the need for establishingappropriate liabilities and providing adequate disclosures. Praxair believes it records and/or discloses such potential contingenciesas appropriate and has reasonably estimated its liabilities.
NEW ACCOUNTING STANDARDS
See Note 1 to the consolidated financial statements for information concerning new accounting standards and the impact ofthe implementation of these standards on the company’s financial statements.
FAIR VALUE MEASUREMENTS
Praxair does not expect changes in the aggregate fair value of its financial assets and liabilities to have a material impact onthe consolidated financial statements. See Note 13 to the consolidated financial statements.
NON-GAAP FINANCIAL MEASURES
The company presents the following non-GAAP financial measures in the discussion of financial condition, results ofoperations and liquidity throughout the MD&A. These measures are intended to supplement investors’ understanding of thecompany’s financial information by providing information which investors, financial analysts and management use to helpevaluate the company’s financial leverage, return on capital employed and operating performance. Special items which thecompany does not believe to be indicative of on-going business performance are excluded from these calculations so that investorscan better evaluate and analyze historical and future business trends on a consistent basis. Definitions of these non-GAAPmeasures may not be comparable to similar definitions used by other companies and are not a substitute for similar GAAPmeasures.
The following are the non-GAAP measures presented in the Selected Financial Data (Item 6) or this MD&A:
(Dollar amounts in millions, except for per share data)Year ended December 31, 2012 2011 2010 2009 2008
Performance Measures:After-tax return on capital (“ROC”)* 13.9% 14.8% 14.5% 13.9% 15.4%Return on equity (“ROE”) 28.9% 28.1% 26.4% 27.0% 26.8%Debt-to-capital* 51.9% 51.8% 47.3% 47.0% 53.7%Debt-to-adjusted EBITDA* 1.9 1.7 1.6 1.8 1.6
Adjusted Amounts:Operating profit $2,502 $2,469 $2,167 $1,881 $2,077
As a percent of sales 22.3% 21.9% 21.4% 21.0% 19.2%Effective tax rate 28.0% 27.8% 27.9% 27.6% 28.2%Noncontrolling interests $ 54 $ 51 $ 39 $ 43 $ 45Net income – Praxair, Inc. $1,681 $1,666 $1,476 $1,247 $1,336Diluted earnings per share $ 5.57 $ 5.43 $ 4.74 $ 3.99 $ 4.20
* Calculations for years prior to 2012 have been adjusted to conform to the current year presentation, where debt is defined astotal debt less cash and cash equivalents.
After-tax Return on Capital (“ROC”)
After-tax return on capital is a measure used by investors, financial analysts and management to evaluate the return on capitalemployed in the business. ROC measures the after-tax operating profit that the company was able to generate with the investmentsmade by all parties in the business (debt, noncontrolling interests and Praxair, Inc. shareholders’ equity).
40
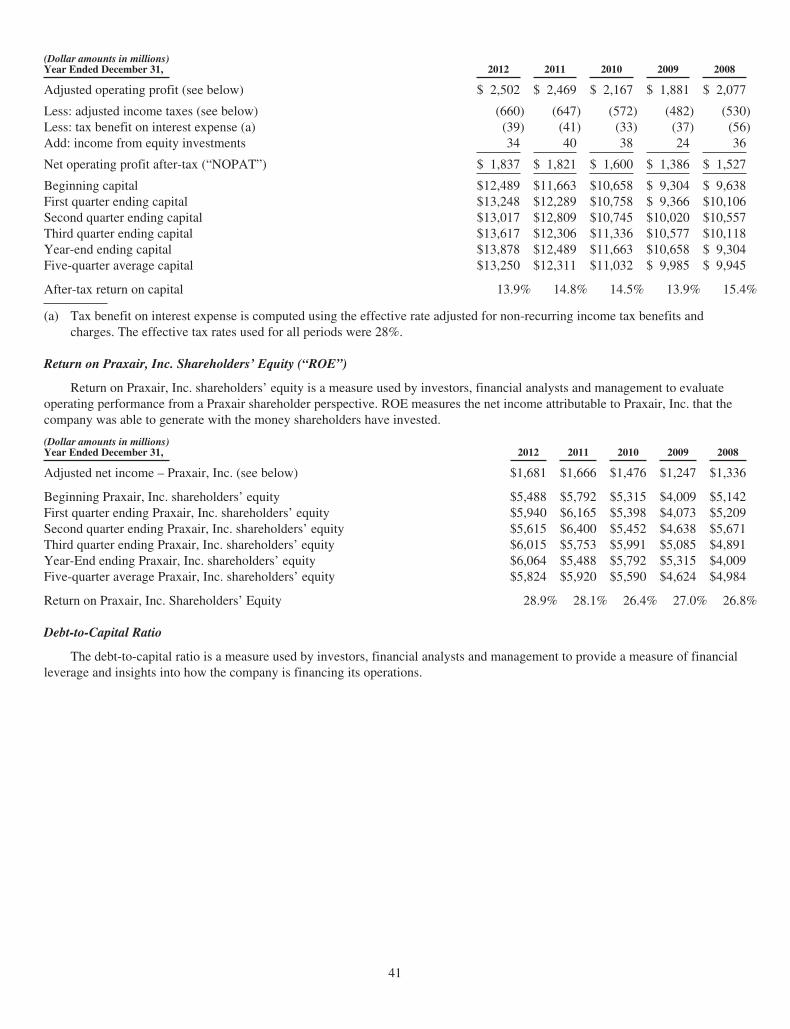
(Dollar amounts in millions)Year Ended December 31, 2012 2011 2010 2009 2008
Adjusted operating profit (see below) $ 2,502 $ 2,469 $ 2,167 $ 1,881 $ 2,077
Less: adjusted income taxes (see below) (660) (647) (572) (482) (530)Less: tax benefit on interest expense (a) (39) (41) (33) (37) (56)Add: income from equity investments 34 40 38 24 36
Net operating profit after-tax (“NOPAT”) $ 1,837 $ 1,821 $ 1,600 $ 1,386 $ 1,527
Beginning capital $12,489 $11,663 $10,658 $ 9,304 $ 9,638First quarter ending capital $13,248 $12,289 $10,758 $ 9,366 $10,106Second quarter ending capital $13,017 $12,809 $10,745 $10,020 $10,557Third quarter ending capital $13,617 $12,306 $11,336 $10,577 $10,118Year-end ending capital $13,878 $12,489 $11,663 $10,658 $ 9,304Five-quarter average capital $13,250 $12,311 $11,032 $ 9,985 $ 9,945
After-tax return on capital 13.9% 14.8% 14.5% 13.9% 15.4%
(a) Tax benefit on interest expense is computed using the effective rate adjusted for non-recurring income tax benefits andcharges. The effective tax rates used for all periods were 28%.
Return on Praxair, Inc. Shareholders’ Equity (“ROE”)
Return on Praxair, Inc. shareholders’ equity is a measure used by investors, financial analysts and management to evaluateoperating performance from a Praxair shareholder perspective. ROE measures the net income attributable to Praxair, Inc. that thecompany was able to generate with the money shareholders have invested.
(Dollar amounts in millions)Year Ended December 31, 2012 2011 2010 2009 2008
Adjusted net income – Praxair, Inc. (see below) $1,681 $1,666 $1,476 $1,247 $1,336
Beginning Praxair, Inc. shareholders’ equity $5,488 $5,792 $5,315 $4,009 $5,142First quarter ending Praxair, Inc. shareholders’ equity $5,940 $6,165 $5,398 $4,073 $5,209Second quarter ending Praxair, Inc. shareholders’ equity $5,615 $6,400 $5,452 $4,638 $5,671Third quarter ending Praxair, Inc. shareholders’ equity $6,015 $5,753 $5,991 $5,085 $4,891Year-End ending Praxair, Inc. shareholders’ equity $6,064 $5,488 $5,792 $5,315 $4,009Five-quarter average Praxair, Inc. shareholders’ equity $5,824 $5,920 $5,590 $4,624 $4,984
Return on Praxair, Inc. Shareholders’ Equity 28.9% 28.1% 26.4% 27.0% 26.8%
Debt-to-Capital Ratio
The debt-to-capital ratio is a measure used by investors, financial analysts and management to provide a measure of financialleverage and insights into how the company is financing its operations.
41
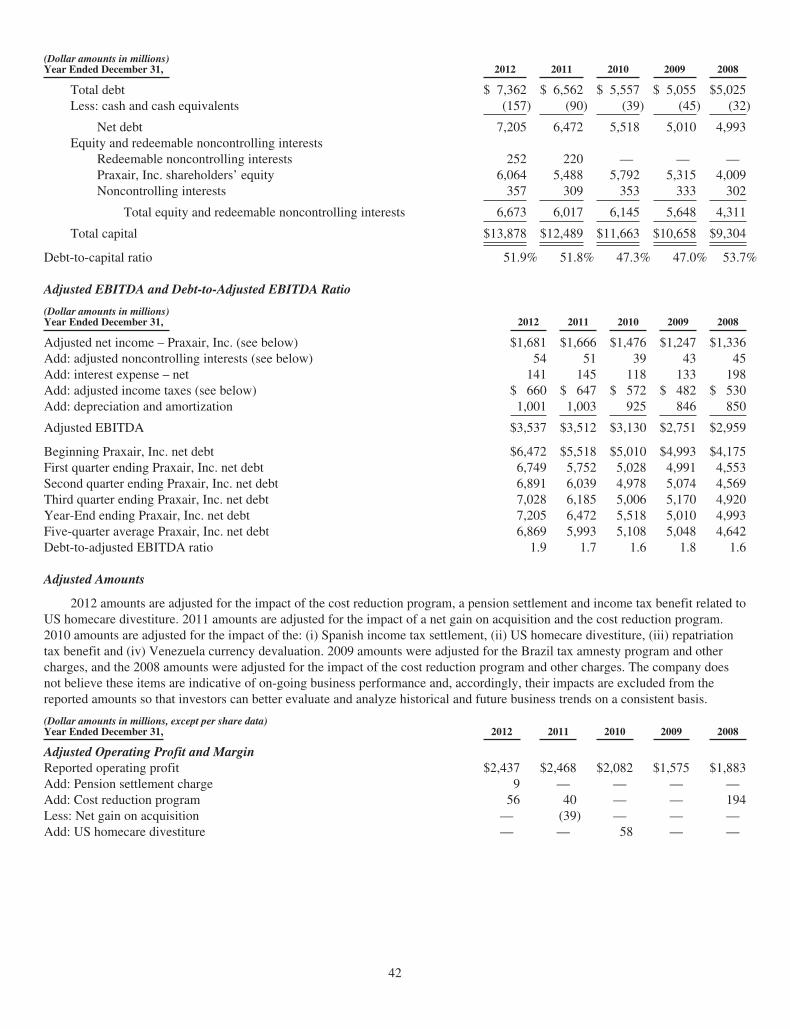
(Dollar amounts in millions)Year Ended December 31, 2012 2011 2010 2009 2008
Total debt $ 7,362 $ 6,562 $ 5,557 $ 5,055 $5,025Less: cash and cash equivalents (157) (90) (39) (45) (32)
Net debt 7,205 6,472 5,518 5,010 4,993Equity and redeemable noncontrolling interests
Redeemable noncontrolling interests 252 220 — — —Praxair, Inc. shareholders’ equity 6,064 5,488 5,792 5,315 4,009Noncontrolling interests 357 309 353 333 302
Total equity and redeemable noncontrolling interests 6,673 6,017 6,145 5,648 4,311
Total capital $13,878 $12,489 $11,663 $10,658 $9,304
Debt-to-capital ratio 51.9% 51.8% 47.3% 47.0% 53.7%
Adjusted EBITDA and Debt-to-Adjusted EBITDA Ratio
(Dollar amounts in millions)Year Ended December 31, 2012 2011 2010 2009 2008
Adjusted net income – Praxair, Inc. (see below) $1,681 $1,666 $1,476 $1,247 $1,336Add: adjusted noncontrolling interests (see below) 54 51 39 43 45Add: interest expense – net 141 145 118 133 198Add: adjusted income taxes (see below) $ 660 $ 647 $ 572 $ 482 $ 530Add: depreciation and amortization 1,001 1,003 925 846 850
Adjusted EBITDA $3,537 $3,512 $3,130 $2,751 $2,959
Beginning Praxair, Inc. net debt $6,472 $5,518 $5,010 $4,993 $4,175First quarter ending Praxair, Inc. net debt 6,749 5,752 5,028 4,991 4,553Second quarter ending Praxair, Inc. net debt 6,891 6,039 4,978 5,074 4,569Third quarter ending Praxair, Inc. net debt 7,028 6,185 5,006 5,170 4,920Year-End ending Praxair, Inc. net debt 7,205 6,472 5,518 5,010 4,993Five-quarter average Praxair, Inc. net debt 6,869 5,993 5,108 5,048 4,642Debt-to-adjusted EBITDA ratio 1.9 1.7 1.6 1.8 1.6
Adjusted Amounts
2012 amounts are adjusted for the impact of the cost reduction program, a pension settlement and income tax benefit related toUS homecare divestiture. 2011 amounts are adjusted for the impact of a net gain on acquisition and the cost reduction program.2010 amounts are adjusted for the impact of the: (i) Spanish income tax settlement, (ii) US homecare divestiture, (iii) repatriationtax benefit and (iv) Venezuela currency devaluation. 2009 amounts were adjusted for the Brazil tax amnesty program and othercharges, and the 2008 amounts were adjusted for the impact of the cost reduction program and other charges. The company doesnot believe these items are indicative of on-going business performance and, accordingly, their impacts are excluded from thereported amounts so that investors can better evaluate and analyze historical and future business trends on a consistent basis.
(Dollar amounts in millions, except per share data)Year Ended December 31, 2012 2011 2010 2009 2008
Adjusted Operating Profit and MarginReported operating profit $2,437 $2,468 $2,082 $1,575 $1,883Add: Pension settlement charge 9 — — — —Add: Cost reduction program 56 40 — — 194Less: Net gain on acquisition — (39) — — —Add: US homecare divestiture — — 58 — —
42
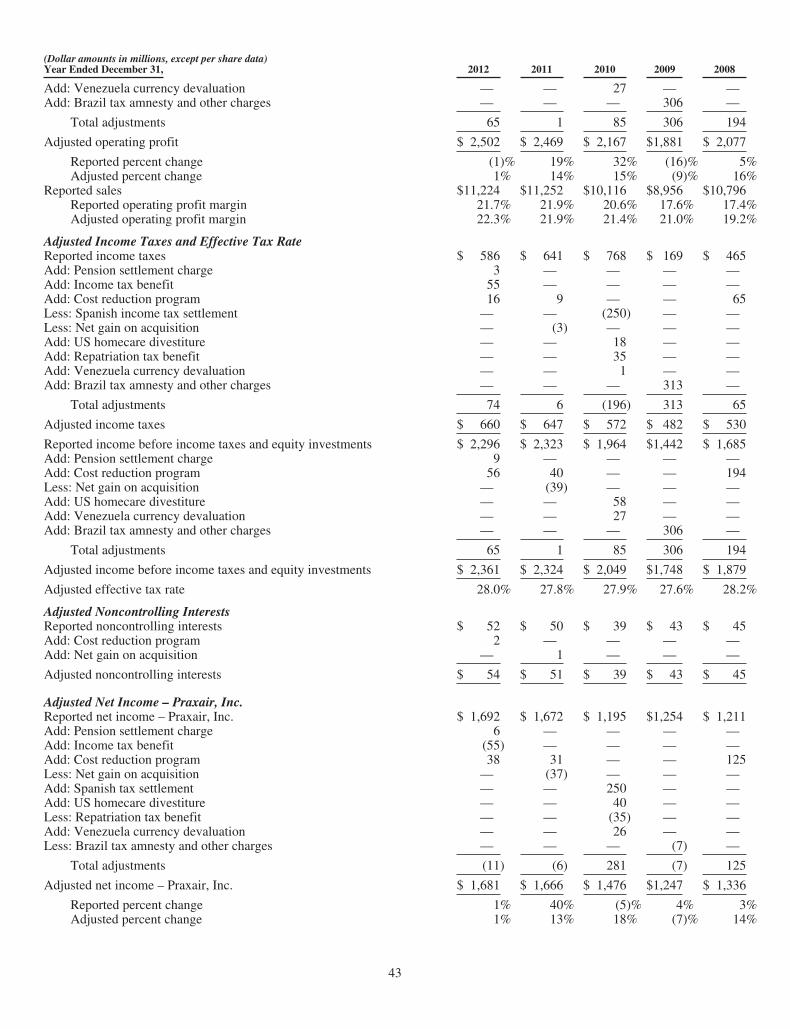
(Dollar amounts in millions, except per share data)Year Ended December 31, 2012 2011 2010 2009 2008
Add: Venezuela currency devaluation — — 27 — —Add: Brazil tax amnesty and other charges — — — 306 —
Total adjustments 65 1 85 306 194
Adjusted operating profit $ 2,502 $ 2,469 $ 2,167 $1,881 $ 2,077
Reported percent change (1)% 19% 32% (16)% 5%Adjusted percent change 1% 14% 15% (9)% 16%
Reported sales $11,224 $11,252 $10,116 $8,956 $10,796Reported operating profit margin 21.7% 21.9% 20.6% 17.6% 17.4%Adjusted operating profit margin 22.3% 21.9% 21.4% 21.0% 19.2%
Adjusted Income Taxes and Effective Tax RateReported income taxes $ 586 $ 641 $ 768 $ 169 $ 465Add: Pension settlement charge 3 — — — —Add: Income tax benefit 55 — — — —Add: Cost reduction program 16 9 — — 65Less: Spanish income tax settlement — — (250) — —Less: Net gain on acquisition — (3) — — —Add: US homecare divestiture — — 18 — —Add: Repatriation tax benefit — — 35 — —Add: Venezuela currency devaluation — — 1 — —Add: Brazil tax amnesty and other charges — — — 313 —
Total adjustments 74 6 (196) 313 65
Adjusted income taxes $ 660 $ 647 $ 572 $ 482 $ 530
Reported income before income taxes and equity investments $ 2,296 $ 2,323 $ 1,964 $1,442 $ 1,685Add: Pension settlement charge 9 — — — —Add: Cost reduction program 56 40 — — 194Less: Net gain on acquisition — (39) — — —Add: US homecare divestiture — — 58 — —Add: Venezuela currency devaluation — — 27 — —Add: Brazil tax amnesty and other charges — — — 306 —
Total adjustments 65 1 85 306 194
Adjusted income before income taxes and equity investments $ 2,361 $ 2,324 $ 2,049 $1,748 $ 1,879
Adjusted effective tax rate 28.0% 27.8% 27.9% 27.6% 28.2%
Adjusted Noncontrolling InterestsReported noncontrolling interests $ 52 $ 50 $ 39 $ 43 $ 45Add: Cost reduction program 2 — — — —Add: Net gain on acquisition — 1 — — —
Adjusted noncontrolling interests $ 54 $ 51 $ 39 $ 43 $ 45
Adjusted Net Income – Praxair, Inc.Reported net income – Praxair, Inc. $ 1,692 $ 1,672 $ 1,195 $1,254 $ 1,211Add: Pension settlement charge 6 — — — —Add: Income tax benefit (55) — — — —Add: Cost reduction program 38 31 — — 125Less: Net gain on acquisition — (37) — — —Add: Spanish tax settlement — — 250 — —Add: US homecare divestiture — — 40 — —Less: Repatriation tax benefit — — (35) — —Add: Venezuela currency devaluation — — 26 — —Less: Brazil tax amnesty and other charges — — — (7) —
Total adjustments (11) (6) 281 (7) 125
Adjusted net income – Praxair, Inc. $ 1,681 $ 1,666 $ 1,476 $1,247 $ 1,336
Reported percent change 1% 40% (5)% 4% 3%Adjusted percent change 1% 13% 18% (7)% 14%
43

(Dollar amounts in millions, except per share data)2012 2011 2010 2009 2008Year Ended December 31,
Adjusted Diluted Earnings Per ShareReported diluted earnings per share $ 5.61 $ 5.45 $ 3.84 $ 4.01 $3.80Add: Pension settlement charge 0.02 — — — —Add: Income tax benefit (0.18) — — — —Add: Cost reduction program 0.12 0.10 — — 0.40Less: Net gain on acquisition — (0.12) — — —Add: Spanish income tax settlement — — 0.80 — —Add: US homecare divestiture — — 0.13 — —Less: Repatriation tax benefit — — (0.11) — —Add: Venezuela currency devaluation — — 0.08 — —Less: Brazil tax amnesty program and other charges — — — (0.02) —
Total adjustments (0.04) (0.02) 0.90 (0.02) 0.40
Adjusted diluted earnings per share $ 5.57 $ 5.43 $ 4.74 $ 3.99 $4.20
Reported percent change 3% 42% (4)% 6%Adjusted percent change 3% 15% 19% (5)%
2013 Diluted Earnings Per Share OutlookLowEnd
HighEnd
2013 diluted EPS outlook $ 5.77 $ 6.02Add: Venezuela currency devaluation charge $ 0.08 $ 0.08
Adjusted 2013 diluted earnings per share outlook $ 5.85 $ 6.102012 adjusted diluted EPS (see above) $ 5.57 $ 5.57Percentage change from 2012 5% 10%
FORWARD-LOOKING STATEMENTS
This document contains “forward-looking statements” within the meaning of the Private Securities Litigation Reform Act of1995. These statements are based on management’s reasonable expectations and assumptions as of the date the statements aremade but involve risks and uncertainties. These risks and uncertainties include, without limitation: the performance of stockmarkets generally; developments in worldwide and national economies and other international events and circumstances; changesin foreign currencies and in interest rates; the cost and availability of electric power, natural gas and other raw materials; the abilityto achieve price increases to offset cost increases; catastrophic events including natural disasters, epidemics and acts of war andterrorism; the ability to attract, hire, and retain qualified personnel; the impact of changes in financial accounting standards; theimpact of changes in pension plan liabilities; the impact of tax, environmental, healthcare and other legislation and governmentregulation in jurisdictions in which the company operates; the cost and outcomes of investigations, litigation and regulatoryproceedings; continued timely development and market acceptance of new products and applications; the impact of competitiveproducts and pricing; future financial and operating performance of major customers and industries served; the impact ofinformation technology system failures, network disruptions and breaches in data security; and the effectiveness and speed ofintegrating new acquisitions into the business. These risks and uncertainties may cause actual future results or circumstances todiffer materially from the projections or estimates contained in the forward-looking statements. Additionally, financial projectionsor estimates exclude the impact of special items which the company believes are not indicative of ongoing business performance.The company assumes no obligation to update or provide revisions to any forward-looking statement in response to changingcircumstances. The above listed risks and uncertainties are further described in Item 1A (Risk Factors) in this report which shouldbe reviewed carefully. Please consider the company’s forward-looking statements in light of those risks.
44
ITEM 7A. QUANTITATIVE AND QUALITATIVE DISCLOSURES ABOUT MARKET RISK
Praxair is exposed to market risks relating to fluctuations in interest rates and currency exchange rates. The objective offinancial risk management at Praxair is to minimize the negative impact of interest rate and foreign exchange rate fluctuations onthe company’s earnings, cash flows and equity.
To manage these risks, Praxair uses various derivative financial instruments, including interest-rate swaps, currency swaps,forward contracts, currency options and commodity contracts. Praxair only uses commonly traded and non-leveraged instruments.These contracts are entered into primarily with major banking institutions thereby minimizing the risk of credit loss. Also, seeNotes 1 and 12 to the consolidated financial statements for a more complete description of Praxair’s accounting policies and use ofsuch instruments.
The following discussion presents the sensitivity of the market value, earnings and cash flows of Praxair’s financialinstruments to hypothetical changes in interest and exchange rates assuming these changes occurred at December 31, 2012. Therange of changes chosen for these discussions reflects Praxair’s view of changes which are reasonably possible over a one-yearperiod. Market values represent the present values of projected future cash flows based on interest rate and exchange rateassumptions.
Interest Rate and Debt Sensitivity Analysis
At December 31, 2012, Praxair had debt totaling $7,362 million ($6,562 million at December 31, 2011). At December 31,2012 and 2011, there was one interest-rate swap agreement outstanding with a notional amount totaling $400 million that convertsfixed-rate interest to variable-rate interest on the $400 million 3.25% notes that mature in 2015. When considered necessary,interest-rate swaps are entered into as hedges of underlying financial instruments to effectively change the characteristics of theinterest rate without actually changing the underlying financial instrument.
For fixed-rate instruments, interest-rate changes affect the fair market value but do not impact earnings or cash flows.Conversely, for floating-rate instruments, interest-rate changes generally do not affect the fair market value but impact futureearnings and cash flows, assuming other factors are held constant.
At December 31, 2012, Praxair had fixed-rate debt of $6,239 million and floating-rate debt of $1,123 million, representing85% and 15%, respectively, of total debt. At December 31, 2011, Praxair had fixed-rate debt of $5,366 million and floating-ratedebt of $1,196 million, representing 82% and 18%, respectively, of total debt. Praxair increased its percentage of fixed rate debtinstruments, as a percentage of total debt in 2012, to take advantage of historically low fixed interest rates. Holding other variablesconstant (such as foreign exchange rates, swaps and debt levels), a one-percentage-point decrease in interest rates would increasethe unrealized fair market value of the fixed-rate debt by approximately $368 million ($244 million in 2011). At December 31,2012 and 2011, the after-tax earnings and cash flows impact for the subsequent year resulting from a one-percentage-point increasein interest rates would be approximately $7 million and $8 million, respectively, holding other variables constant.
Exchange Rate Sensitivity Analysis
Praxair’s exchange-rate exposures result primarily from its investments and ongoing operations in South America (primarilyBrazil, Argentina, Colombia and Venezuela), Europe (primarily Germany, Italy, Scandinavia and Spain), Canada, Mexico, Asia(primarily China, India, Korea and Thailand) and other business transactions such as the procurement of equipment from foreignsources. From time to time, Praxair utilizes foreign exchange forward contracts to hedge these exposures. At December 31, 2012,Praxair had $2,515 million notional amount ($1,541 million at December 31, 2011) of foreign exchange contracts all of which wereto hedge recorded balance sheet exposures. See Note 12 to the consolidated financial statements.
Holding other variables constant, if there were a 10% adverse change in foreign-currency exchange rates for the portfolio, thefair market value of foreign-currency contracts outstanding at December 31, 2012 and 2011 would decrease by approximately $32million and $22 million, respectively, which would be largely offset by an offsetting gain or loss on the foreign-currencyfluctuation of the underlying exposure being hedged.
On February 8, 2013, Venezuela announced a devaluation of the Venezuelan bolivar from an exchange rate of 4.30 to 6.30(implying a 32% devaluation) effective February 13, 2013. This devaluation will result in an estimated charge to earnings of $0.08per diluted share in the first quarter of 2013 due primarily to the remeasurement of the local Venezuelan balance sheet to reflect thenew official 6.30 exchange rate. The company does not expect the impact on results of operations for 2013 to be significant.
45
ITEM 8. FINANCIAL STATEMENTS AND SUPPLEMENTARY DATA
INDEX TO CONSOLIDATED FINANCIAL STATEMENTS
Page
Management’s Statement of Responsibility for Financial Statements 47Management’s Report on Internal Control Over Financial Reporting 47Report of Independent Registered Public Accounting Firm 48
Audited Consolidated Financial StatementsConsolidated Statements of Income for the Years Ended December 31, 2012, 2011 and 2010 49Consolidated Statements of Comprehensive Income (Loss) for the Years Ended December 31, 2012, 2011 and 2010 50Consolidated Balance Sheets as of December 31, 2012 and 2011 51Consolidated Statements of Cash Flows for the Years Ended December 31, 2012, 2011 and 2010 52Consolidated Statements of Equity for the Years Ended December 31, 2012, 2011 and 2010 53
Notes to Consolidated Financial StatementsNote 1. Summary of Significant Accounting Policies 55Note 2. Cost Reduction Program and Other Charges – Net 58Note 3. Acquisitions 61Note 4. Leases 62Note 5. Income Taxes 62Note 6. Earnings Per Share – Praxair, Inc. Shareholders 66Note 7. Supplemental Information 67Note 8. Property, Plant and Equipment – Net 70Note 9. Goodwill 70Note 10. Other Intangible Assets 71Note 11. Debt 73Note 12. Financial Instruments 75Note 13. Fair Value Disclosures 79Note 14. Equity and Redeemable Noncontrolling Interests 79Note 15. Share-Based Compensation 80Note 16. Retirement Programs 82Note 17. Commitments and Contingencies 89Note 18. Segment Information 91Note 19. Quarterly Data (Unaudited) 94Note 20. Subsequent Events 95
46
MANAGEMENT’S STATEMENT OF RESPONSIBILITY FOR FINANCIAL STATEMENTS
Praxair’s consolidated financial statements are prepared by management, which is responsible for their fairness, integrity andobjectivity. The accompanying financial statements have been prepared in conformity with accounting principles generallyaccepted in the United States of America applied on a consistent basis, except for accounting changes as disclosed, and includeamounts that are estimates and judgments. All historical financial information in this annual report is consistent with theaccompanying financial statements.
Praxair maintains accounting systems, including internal accounting controls, monitored by a staff of internal auditors, that aredesigned to provide reasonable assurance of the reliability of financial records and the protection of assets. The concept of reasonableassurance is based on recognition that the cost of a system should not exceed the related benefits. The effectiveness of those systemsdepends primarily upon the careful selection of financial and other managers, clear delegation of authority and assignment ofaccountability, inculcation of high business ethics and conflict-of-interest standards, policies and procedures for coordinating themanagement of corporate resources, and the leadership and commitment of top management. In compliance with Section 404 of theSarbanes-Oxley Act of 2002, Praxair assessed its internal control over financial reporting and issued a report (see below).
PricewaterhouseCoopers LLP, an independent registered public accounting firm, has completed an integrated audit ofPraxair’s 2012, 2011 and 2010 consolidated financial statements and of its internal control over financial reporting as ofDecember 31, 2012 in accordance with the standards of the Public Company Accounting Oversight Board (United States) as statedin their report.
The Audit Committee of the Board of Directors, which consists solely of non-employee directors, is responsible foroverseeing the functioning of the accounting system and related controls and the preparation of annual financial statements. TheAudit Committee periodically meets with management, internal auditors and the independent accountants to review and evaluatetheir accounting, auditing and financial reporting activities and responsibilities, including management’s assessment of internalcontrol over financial reporting. The independent registered public accounting firm and internal auditors have full and free accessto the Audit Committee and meet with the committee, with and without management present.
MANAGEMENT’S REPORT ON INTERNAL CONTROL OVER FINANCIAL REPORTING
Praxair’s management is responsible for establishing and maintaining adequate internal control over financial reporting, assuch term is defined in Exchange Act Rule 13a-15(f). Under the supervision and with the participation of management, includingthe company’s principal executive officer and principal financial officer, the company conducted an evaluation of the effectivenessof its internal control over financial reporting based on the framework in Internal Control – Integrated Framework issued by theCommittee of Sponsoring Organizations of the Treadway Commission (often referred to as COSO). Based on this evaluation,management concluded that the company’s internal control over financial reporting was effective as of December 31, 2012.
Praxair’s evaluation of internal control over financial reporting as of December 31, 2012 did not include the internal controlover financial reporting related to Acetylene Oxygen Company and Portagas Inc. because they were acquired by Praxair inpurchase business combinations consummated during 2012. Total assets and sales for these acquisitions represent 0.8% and 0.1%,respectively, of the related consolidated financial statement amounts as of and for the year ended December 31, 2012 (See Note 3).
PricewaterhouseCoopers LLP, an independent registered public accounting firm, has issued their opinion on the company’sinternal control over financial reporting as of December 31, 2012 as stated in their report.
/s/ STEPHEN F. ANGEL
Stephen F. AngelChairman, President andChief Executive Officer
/s/ ELIZABETH T. HIRSCH
Elizabeth T. HirschVice President and Controller
/s/ JAMES S. SAWYER
James S. SawyerExecutive Vice President and
Chief Financial Officer
Danbury, ConnecticutFebruary 27, 2013
47
REPORT OF INDEPENDENT REGISTERED PUBLIC ACCOUNTING FIRM
To The Board of Directors and Shareholders of Praxair, Inc:
In our opinion, the accompanying consolidated balance sheets and the related consolidated statements of income, comprehensiveincome (loss), equity and cash flows present fairly, in all material respects, the financial position of Praxair, Inc. and its subsidiaries atDecember 31, 2012 and 2011, and the results of their operations and their cash flows for each of the three years in the period endedDecember 31, 2012 in conformity with accounting principles generally accepted in the United States of America. Also in our opinion,the company maintained, in all material respects, effective internal control over financial reporting as of December 31, 2012 based oncriteria established in Internal Control – Integrated Framework issued by the Committee of Sponsoring Organizations of theTreadway Commission (“COSO”). The company’s management is responsible for these financial statements, for maintaining effectiveinternal control over financial reporting and for its assessment of the effectiveness of internal control over financial reporting, includedin the accompanying Management’s Report on Internal Control over Financial Reporting. Our responsibility is to express opinions onthese financial statements, and on the company’s internal control over financial reporting based on our integrated audits. Weconducted our audits in accordance with the standards of the Public Company Accounting Oversight Board (United States). Thosestandards require that we plan and perform the audits to obtain reasonable assurance about whether the financial statements are free ofmaterial misstatement and whether effective internal control over financial reporting was maintained in all material respects. Ouraudits of the financial statements included examining, on a test basis, evidence supporting the amounts and disclosures in the financialstatements, assessing the accounting principles used and significant estimates made by management, and evaluating the overallfinancial statement presentation. Our audit of internal control over financial reporting included obtaining an understanding of internalcontrol over financial reporting, assessing the risk that a material weakness exists, and testing and evaluating the design and operatingeffectiveness of internal control based on the assessed risk. Our audits also included performing such other procedures as weconsidered necessary in the circumstances. We believe that our audits provide a reasonable basis for our opinions.
A company’s internal control over financial reporting is a process designed to provide reasonable assurance regarding thereliability of financial reporting and the preparation of financial statements for external purposes in accordance with generallyaccepted accounting principles. A company’s internal control over financial reporting includes those policies and procedures that(i) pertain to the maintenance of records that, in reasonable detail, accurately and fairly reflect the transactions and dispositions of theassets of the company; (ii) provide reasonable assurance that transactions are recorded as necessary to permit preparation of financialstatements in accordance with generally accepted accounting principles, and that receipts and expenditures of the company are beingmade only in accordance with authorizations of management and directors of the company; and (iii) provide reasonable assuranceregarding prevention or timely detection of unauthorized acquisition, use, or disposition of the company’s assets that could have amaterial effect on the financial statements.
Because of its inherent limitations, internal control over financial reporting may not prevent or detect misstatements. Also,projections of any evaluation of effectiveness to future periods are subject to the risk that controls may become inadequate becauseof changes in conditions, or that the degree of compliance with the policies or procedures may deteriorate.
As described in Management’s Report on Internal Control Over Financial Reporting, management has excluded AcetyleneOxygen Company and Portagas Inc. from its assessment of internal control over financial reporting as of December 31, 2012because these businesses were acquired by the Company in purchase business combinations during 2012. We have also excludedAcetylene Oxygen Company and Portagas Inc. from our audit of internal control over financial reporting. Acetylene OxygenCompany and Portagas Inc. are wholly owned subsidiaries of the Company. The aggregate total assets and total sales of these 2entities represent 0.8% and 0.1%, respectively, of the related consolidated financial statement amounts as of and for the year endedDecember 31, 2012.
/s/ PricewaterhouseCoopers LLPPricewaterhouseCoopersStamford, ConnecticutFebruary 27, 2013
48
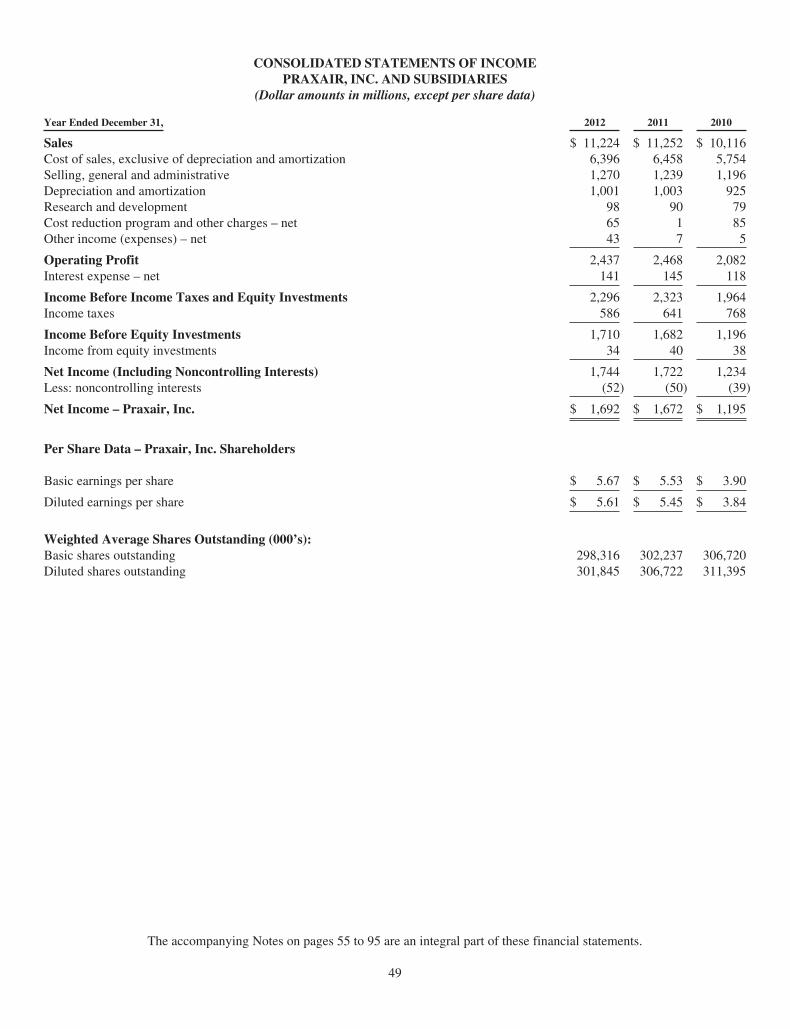
CONSOLIDATED STATEMENTS OF INCOMEPRAXAIR, INC. AND SUBSIDIARIES
(Dollar amounts in millions, except per share data)
Year Ended December 31, 2012 2011 2010
Sales $ 11,224 $ 11,252 $ 10,116Cost of sales, exclusive of depreciation and amortization 6,396 6,458 5,754Selling, general and administrative 1,270 1,239 1,196Depreciation and amortization 1,001 1,003 925Research and development 98 90 79Cost reduction program and other charges – net 65 1 85Other income (expenses) – net 43 7 5
Operating Profit 2,437 2,468 2,082Interest expense – net 141 145 118
Income Before Income Taxes and Equity Investments 2,296 2,323 1,964Income taxes 586 641 768
Income Before Equity Investments 1,710 1,682 1,196Income from equity investments 34 40 38
Net Income (Including Noncontrolling Interests) 1,744 1,722 1,234Less: noncontrolling interests (52) (50) (39)
Net Income – Praxair, Inc. $ 1,692 $ 1,672 $ 1,195
Per Share Data – Praxair, Inc. Shareholders
Basic earnings per share $ 5.67 $ 5.53 $ 3.90
Diluted earnings per share $ 5.61 $ 5.45 $ 3.84
Weighted Average Shares Outstanding (000’s):Basic shares outstanding 298,316 302,237 306,720Diluted shares outstanding 301,845 306,722 311,395
The accompanying Notes on pages 55 to 95 are an integral part of these financial statements.
49
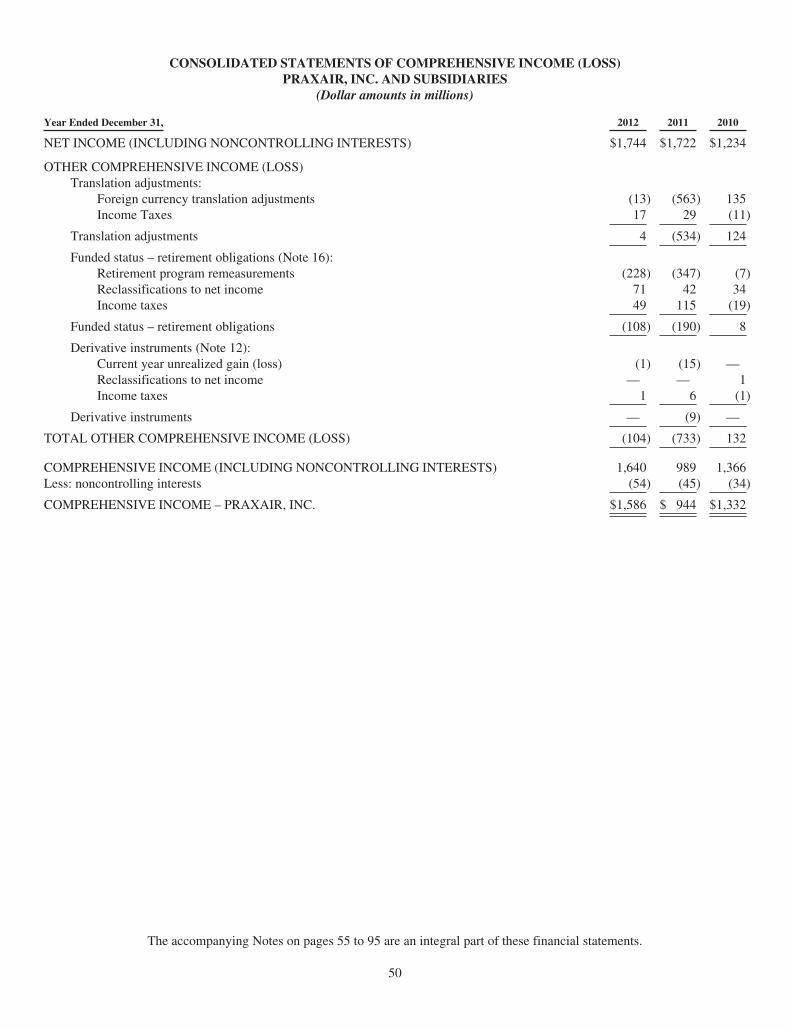
CONSOLIDATED STATEMENTS OF COMPREHENSIVE INCOME (LOSS)PRAXAIR, INC. AND SUBSIDIARIES
(Dollar amounts in millions)
Year Ended December 31, 2012 2011 2010
NET INCOME (INCLUDING NONCONTROLLING INTERESTS) $1,744 $1,722 $1,234
OTHER COMPREHENSIVE INCOME (LOSS)Translation adjustments:
Foreign currency translation adjustments (13) (563) 135Income Taxes 17 29 (11)
Translation adjustments 4 (534) 124
Funded status – retirement obligations (Note 16):Retirement program remeasurements (228) (347) (7)Reclassifications to net income 71 42 34Income taxes 49 115 (19)
Funded status – retirement obligations (108) (190) 8
Derivative instruments (Note 12):Current year unrealized gain (loss) (1) (15) —Reclassifications to net income — — 1Income taxes 1 6 (1)
Derivative instruments — (9) —
TOTAL OTHER COMPREHENSIVE INCOME (LOSS) (104) (733) 132
COMPREHENSIVE INCOME (INCLUDING NONCONTROLLING INTERESTS) 1,640 989 1,366Less: noncontrolling interests (54) (45) (34)
COMPREHENSIVE INCOME – PRAXAIR, INC. $1,586 $ 944 $1,332
The accompanying Notes on pages 55 to 95 are an integral part of these financial statements.
50
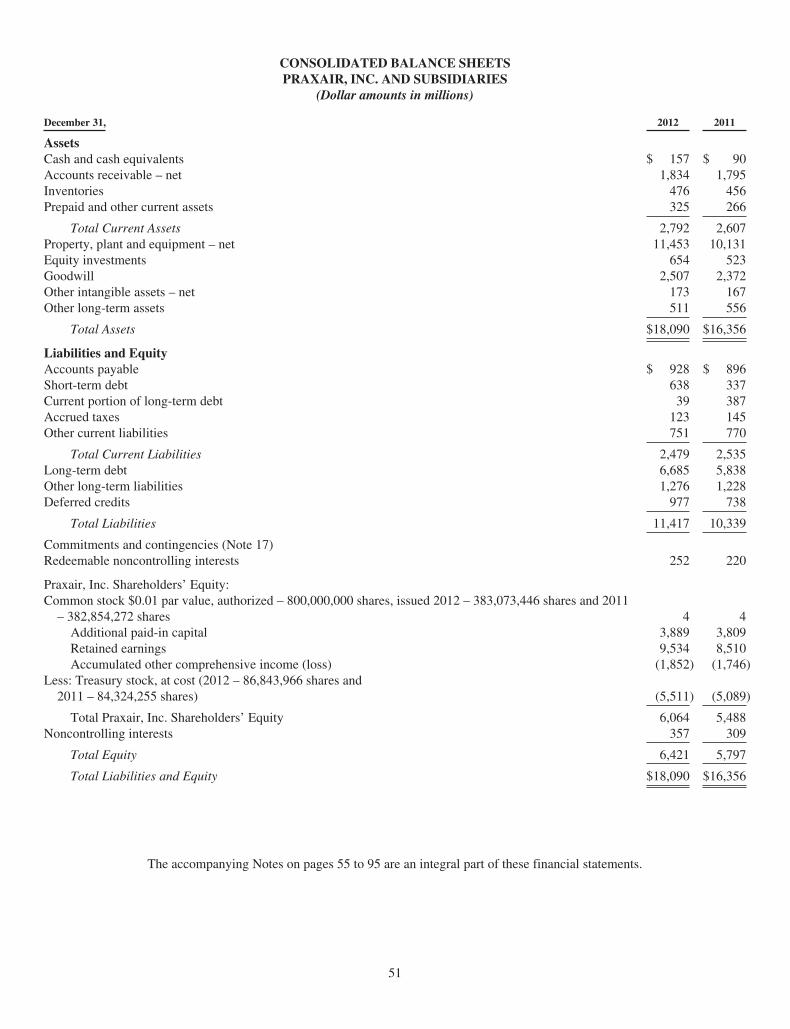
CONSOLIDATED BALANCE SHEETSPRAXAIR, INC. AND SUBSIDIARIES
(Dollar amounts in millions)
December 31, 2012 2011
AssetsCash and cash equivalents $ 157 $ 90Accounts receivable – net 1,834 1,795Inventories 476 456Prepaid and other current assets 325 266
Total Current Assets 2,792 2,607Property, plant and equipment – net 11,453 10,131Equity investments 654 523Goodwill 2,507 2,372Other intangible assets – net 173 167Other long-term assets 511 556
Total Assets $18,090 $16,356
Liabilities and EquityAccounts payable $ 928 $ 896Short-term debt 638 337Current portion of long-term debt 39 387Accrued taxes 123 145Other current liabilities 751 770
Total Current Liabilities 2,479 2,535Long-term debt 6,685 5,838Other long-term liabilities 1,276 1,228Deferred credits 977 738
Total Liabilities 11,417 10,339
Commitments and contingencies (Note 17)Redeemable noncontrolling interests 252 220
Praxair, Inc. Shareholders’ Equity:Common stock $0.01 par value, authorized – 800,000,000 shares, issued 2012 – 383,073,446 shares and 2011
– 382,854,272 shares 4 4Additional paid-in capital 3,889 3,809Retained earnings 9,534 8,510Accumulated other comprehensive income (loss) (1,852) (1,746)
Less: Treasury stock, at cost (2012 – 86,843,966 shares and2011 – 84,324,255 shares) (5,511) (5,089)
Total Praxair, Inc. Shareholders’ Equity 6,064 5,488Noncontrolling interests 357 309
Total Equity 6,421 5,797
Total Liabilities and Equity $18,090 $16,356
The accompanying Notes on pages 55 to 95 are an integral part of these financial statements.
51
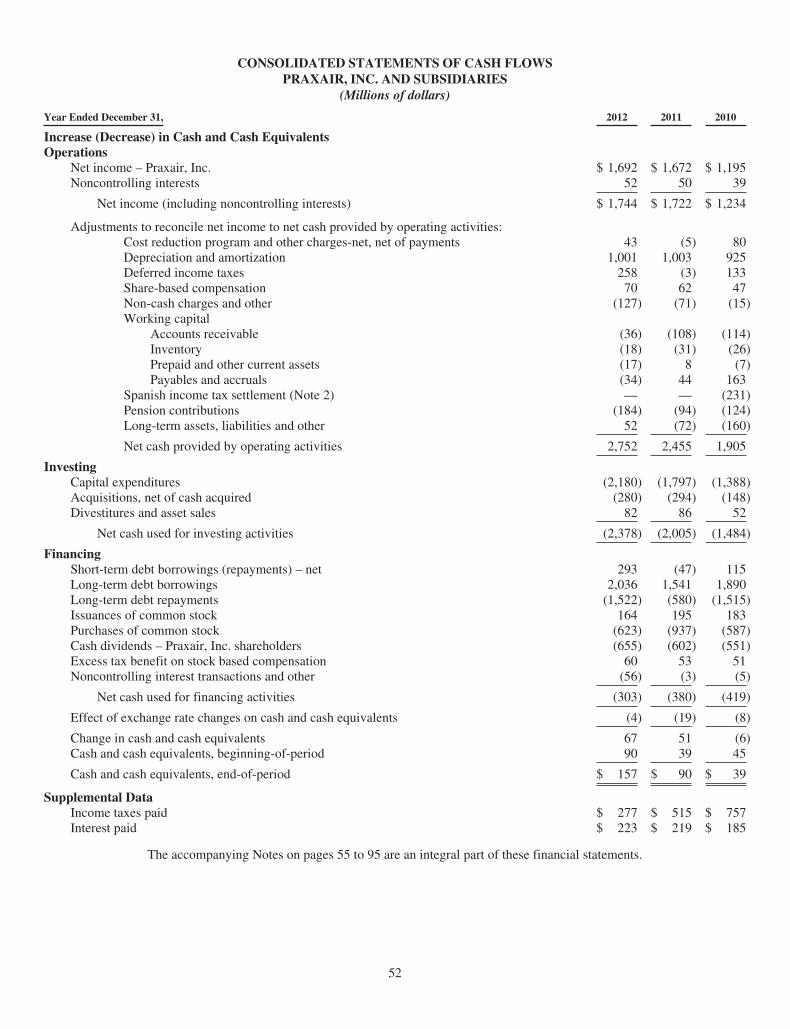
CONSOLIDATED STATEMENTS OF CASH FLOWSPRAXAIR, INC. AND SUBSIDIARIES
(Millions of dollars)
Year Ended December 31, 2012 2011 2010
Increase (Decrease) in Cash and Cash EquivalentsOperations
Net income – Praxair, Inc. $ 1,692 $ 1,672 $ 1,195Noncontrolling interests 52 50 39
Net income (including noncontrolling interests) $ 1,744 $ 1,722 $ 1,234
Adjustments to reconcile net income to net cash provided by operating activities:Cost reduction program and other charges-net, net of payments 43 (5) 80Depreciation and amortization 1,001 1,003 925Deferred income taxes 258 (3) 133Share-based compensation 70 62 47Non-cash charges and other (127) (71) (15)Working capital
Accounts receivable (36) (108) (114)Inventory (18) (31) (26)Prepaid and other current assets (17) 8 (7)Payables and accruals (34) 44 163
Spanish income tax settlement (Note 2) — — (231)Pension contributions (184) (94) (124)Long-term assets, liabilities and other 52 (72) (160)
Net cash provided by operating activities 2,752 2,455 1,905
InvestingCapital expenditures (2,180) (1,797) (1,388)Acquisitions, net of cash acquired (280) (294) (148)Divestitures and asset sales 82 86 52
Net cash used for investing activities (2,378) (2,005) (1,484)
FinancingShort-term debt borrowings (repayments) – net 293 (47) 115Long-term debt borrowings 2,036 1,541 1,890Long-term debt repayments (1,522) (580) (1,515)Issuances of common stock 164 195 183Purchases of common stock (623) (937) (587)Cash dividends – Praxair, Inc. shareholders (655) (602) (551)Excess tax benefit on stock based compensation 60 53 51Noncontrolling interest transactions and other (56) (3) (5)
Net cash used for financing activities (303) (380) (419)
Effect of exchange rate changes on cash and cash equivalents (4) (19) (8)
Change in cash and cash equivalents 67 51 (6)Cash and cash equivalents, beginning-of-period 90 39 45
Cash and cash equivalents, end-of-period $ 157 $ 90 $ 39
Supplemental DataIncome taxes paid $ 277 $ 515 $ 757Interest paid $ 223 $ 219 $ 185
The accompanying Notes on pages 55 to 95 are an integral part of these financial statements.
52
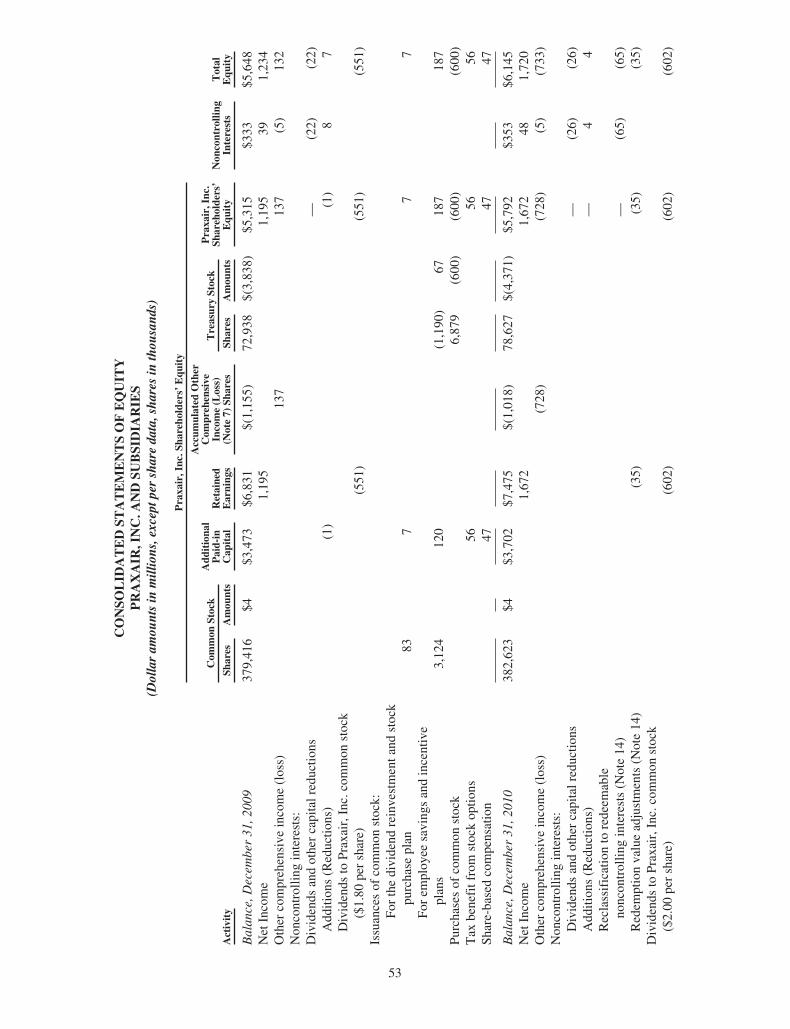
CO
NSO
LID
AT
ED
STA
TE
ME
NT
SO
FE
QU
ITY
PR
AX
AIR
,IN
C.A
ND
SUB
SID
IAR
IES
(Dol
lar
amou
nts
inm
illio
ns,e
xcep
tper
shar
eda
ta,s
hare
sin
thou
sand
s)
Pra
xair
,Inc
.Sha
reho
lder
s’E
quit
y
Com
mon
Stoc
kA
ddit
iona
lP
aid-
inC
apit
alR
etai
ned
Ear
ning
s
Acc
umul
ated
Oth
erC
ompr
ehen
sive
Inco
me
(Los
s)(N
ote
7)Sh
ares
Tre
asur
ySt
ock
Pra
xair
,Inc
.Sh
areh
olde
rs’
Equ
ity
Non
cont
rolli
ngIn
tere
sts
Tot
alE
quit
yA
ctiv
ity
Shar
esA
mou
nts
Shar
esA
mou
nts
Bal
ance
,Dec
embe
r31
,200
937
9,41
6$4
$3,4
73$6
,831
$(1,
155)
72,9
38$(
3,83
8)$5
,315
$333
$5,6
48N
etIn
com
e1,
195
1,19
539
1,23
4O
ther
com
preh
ensi
vein
com
e(l
oss)
137
137
(5)
132
Non
cont
rolli
ngin
tere
sts:
Div
iden
dsan
dot
her
capi
talr
educ
tions
—(2
2)(2
2)A
dditi
ons
(Red
uctio
ns)
(1)
(1)
87
Div
iden
dsto
Prax
air,
Inc.
com
mon
stoc
k($
1.80
per
shar
e)(5
51)
(551
)(5
51)
Issu
ance
sof
com
mon
stoc
k:Fo
rth
edi
vide
ndre
inve
stm
enta
ndst
ock
purc
hase
plan
837
77
For
empl
oyee
savi
ngs
and
ince
ntiv
epl
ans
3,12
412
0(1
,190
)67
187
187
Purc
hase
sof
com
mon
stoc
k6,
879
(600
)(6
00)
(600
)T
axbe
nefi
tfro
mst
ock
optio
ns56
5656
Shar
e-ba
sed
com
pens
atio
n47
4747
Bal
ance
,Dec
embe
r31
,201
038
2,62
3$4
$3,7
02$7
,475
$(1,
018)
78,6
27$(
4,37
1)$5
,792
$353
$6,1
45N
etIn
com
e1,
672
1,67
248
1,72
0O
ther
com
preh
ensi
vein
com
e(l
oss)
(728
)(7
28)
(5)
(733
)N
onco
ntro
lling
inte
rest
s:D
ivid
ends
and
othe
rca
pita
lred
uctio
ns—
(26)
(26)
Add
ition
s(R
educ
tions
)—
44
Rec
lass
ific
atio
nto
rede
emab
leno
ncon
trol
ling
inte
rest
s(N
ote
14)
—(6
5)(6
5)R
edem
ptio
nva
lue
adju
stm
ents
(Not
e14
)(3
5)(3
5)(3
5)D
ivid
ends
toPr
axai
r,In
c.co
mm
onst
ock
($2.
00pe
rsh
are)
(602
)(6
02)
(602
)
53
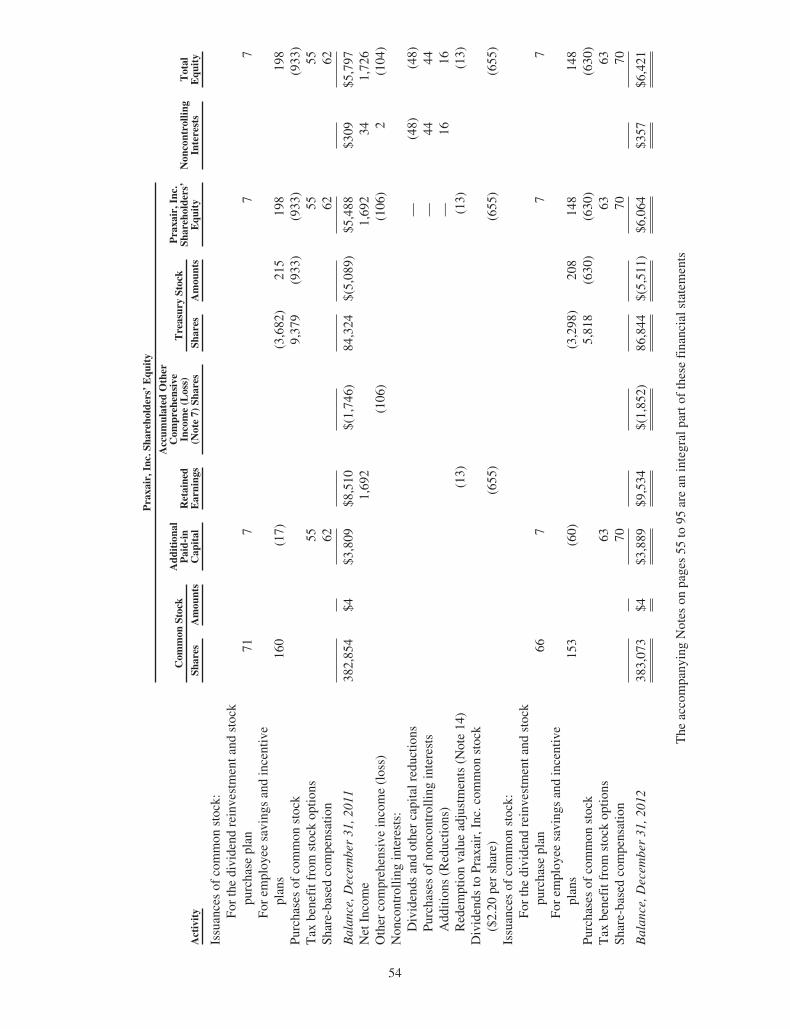
Pra
xair
,Inc
.Sha
reho
lder
s’E
quit
y
Com
mon
Stoc
kA
ddit
iona
lP
aid-
inC
apit
alR
etai
ned
Ear
ning
s
Acc
umul
ated
Oth
erC
ompr
ehen
sive
Inco
me
(Los
s)(N
ote
7)Sh
ares
Tre
asur
ySt
ock
Pra
xair
,Inc
.Sh
areh
olde
rs’
Equ
ity
Non
cont
rolli
ngIn
tere
sts
Tot
alE
quit
yA
ctiv
ity
Shar
esA
mou
nts
Shar
esA
mou
nts
Issu
ance
sof
com
mon
stoc
k:Fo
rth
edi
vide
ndre
inve
stm
enta
ndst
ock
purc
hase
plan
717
77
For
empl
oyee
savi
ngs
and
ince
ntiv
epl
ans
160
(17)
(3,6
82)
215
198
198
Purc
hase
sof
com
mon
stoc
k9,
379
(933
)(9
33)
(933
)T
axbe
nefi
tfro
mst
ock
optio
ns55
5555
Shar
e-ba
sed
com
pens
atio
n62
6262
Bal
ance
,Dec
embe
r31
,201
138
2,85
4$4
$3,8
09$8
,510
$(1,
746)
84,3
24$(
5,08
9)$5
,488
$309
$5,7
97N
etIn
com
e1,
692
1,69
234
1,72
6O
ther
com
preh
ensi
vein
com
e(l
oss)
(106
)(1
06)
2(1
04)
Non
cont
rolli
ngin
tere
sts:
Div
iden
dsan
dot
her
capi
talr
educ
tions
—(4
8)(4
8)Pu
rcha
ses
ofno
ncon
trol
ling
inte
rest
s—
4444
Add
ition
s(R
educ
tions
)—
1616
Red
empt
ion
valu
ead
just
men
ts(N
ote
14)
(13)
(13)
(13)
Div
iden
dsto
Prax
air,
Inc.
com
mon
stoc
k($
2.20
per
shar
e)(6
55)
(655
)(6
55)
Issu
ance
sof
com
mon
stoc
k:Fo
rth
edi
vide
ndre
inve
stm
enta
ndst
ock
purc
hase
plan
667
77
For
empl
oyee
savi
ngs
and
ince
ntiv
epl
ans
153
(60)
(3,2
98)
208
148
148
Purc
hase
sof
com
mon
stoc
k5,
818
(630
)(6
30)
(630
)T
axbe
nefi
tfro
mst
ock
optio
ns63
6363
Shar
e-ba
sed
com
pens
atio
n70
7070
Bal
ance
,Dec
embe
r31
,201
238
3,07
3$4
$3,8
89$9
,534
$(1,
852)
86,8
44$(
5,51
1)$6
,064
$357
$6,4
21
The
acco
mpa
nyin
gN
otes
onpa
ges
55to
95ar
ean
inte
gral
part
ofth
ese
fina
ncia
lsta
tem
ents
54
NOTES TO CONSOLIDATED FINANCIAL STATEMENTSPRAXAIR, INC. AND SUBSIDIARIES
NOTE 1. SUMMARY OF SIGNIFICANT ACCOUNTING POLICIES
Operations – Praxair, Inc. and its subsidiaries (“Praxair” or “the company”) comprise one of the largest industrial gasescompanies worldwide, and the largest in North and South America. Praxair produces, sells and distributes atmospheric, process andspecialty gases, and high-performance surface coatings to a diverse group of industries including aerospace, chemicals, electronics,energy, food and beverage, healthcare, manufacturing and metals.
Principles of Consolidation – The consolidated financial statements include the accounts of all significant subsidiaries wherecontrol exists and, in limited situations, variable-interest entities where the company is the primary beneficiary. Intercompanytransactions and balances are eliminated in consolidation and any significant related-party transactions have been disclosed.
Equity investments generally consist of 20% to 50% owned operations where the company exercises significant influence, butdoes not have control. Equity income from equity investments in corporations is reported on an after-tax basis. Pre-tax incomefrom equity investments that are partnerships or limited-liability corporations (“LLC”) is included in other income (expenses) – netwith related taxes included in Income taxes. Equity investments are reviewed for impairment whenever events or circumstancesreflect that an impairment loss may have incurred. Operations less than 20% owned, where the company does not exercisesignificant influence, are generally carried at cost.
Changes in ownership interest that result either in consolidation or deconsolidation of an investment are recorded at fair valuethrough earnings, including the retained ownership interest, while changes that do not result in either consolidation ordeconsolidation of a subsidiary are treated as equity transactions.
Use of Estimates – The preparation of financial statements in conformity with U.S. GAAP requires management to makeestimates and assumptions that affect the reported amounts of assets and liabilities and the disclosure of contingent assets andliabilities at the date of the financial statements and the reported amounts of revenues and expenses during the reporting period.While actual results could differ, management believes such estimates to be reasonable.
Revenue Recognition – Revenue is recognized when: a firm sales agreement exists; product is shipped or services areprovided to customers; and collectability of a fixed or determinable sales price is reasonably assured. Sales returns and allowancesare not a normal practice in the industry and are not significant.
A small portion of the company’s revenues relate to long-term construction contracts and are generally recognized using thepercentage-of-completion method. Under this method, revenues from sales of major equipment, such as large air-separationfacilities, are recognized based primarily on cost incurred to date compared with total estimated cost. Changes to total estimatedcost and anticipated losses, if any, are recognized in the period determined.
For contracts that contain multiple products and/or services, amounts assigned to each component are based on its objectivelydetermined fair value, such as the sales price for the component when it is sold separately or competitor prices for similarcomponents.
Certain of the company’s facilities that are built to provide product to a specific customer are required to be accounted for asleases. The associated revenue streams are classified as rental revenue and are not significant.
Amounts billed for shipping and handling fees are recorded as sales, generally on FOB destination terms, and costs incurredfor shipping and handling are recorded as cost of sales.
Amounts billed for sales and use taxes, value-added taxes, and certain excise and other specific transactional taxes imposed onrevenue producing transactions are presented on a net basis and are not included in sales in the consolidated statement of income.
Cash Equivalents – Cash equivalents are considered to be highly liquid securities with original maturities of three months orless.
Inventories – Inventories are stated at the lower of cost or market. Cost is determined using the last-in, first-out (“LIFO”)method for certain U.S. operations and the average-cost method for most other operations (see Note 7).
Property, Plant and Equipment – Net – Property, plant and equipment are carried at cost, net of accumulated depreciation.The company capitalizes interest as part of the cost of constructing major facilities (see Note 7). Depreciation is calculated on thestraight-line method based on the estimated useful lives of the assets, which range from 3 years to 40 years (see Note 8). Praxairuses accelerated depreciation methods for tax purposes where appropriate. Maintenance of property, plant and equipment isgenerally expensed as incurred.
55
The company performs a test for impairment whenever events or changes in circumstances indicate that the carrying amountof an individual asset or asset group may not be recoverable. Should projected undiscounted future cash flows be less than thecarrying amount of the asset or asset group, an impairment charge reducing the carrying amount to fair value is required. Fair valueis determined based on the most appropriate valuation technique, including discounted cash flows.
Asset-Retirement Obligations – An asset-retirement obligation is recognized in the period in which sufficient informationexists to determine the fair value of the liability with a corresponding increase to the carrying amount of the related property, plantand equipment which is then depreciated over its useful life. The liability is initially measured at discounted fair value and thenaccretion expense is recorded in each subsequent period. The company’s asset-retirement obligations are primarily associated withits on-site long-term supply arrangements where the company has built a facility on land leased from the customer and is obligatedto remove the facility at the end of the contract term. The company’s asset-retirement obligations are not material to its financialstatements.
Foreign Currency Translation – For most foreign operations, the local currency is the functional currency and translationgains and losses are reported as part of the accumulated other comprehensive income (loss) component of equity as a cumulativetranslation adjustment (see Note 7). For other foreign operations, the U.S. dollar is the functional currency and translation gainsand losses are included in other income (expenses) – net.
Financial Instruments – Praxair enters into various derivative financial instruments to manage its exposure to fluctuatinginterest and currency exchange rates and energy costs. Such instruments primarily include interest-rate swap and treasury lockagreements; currency-swap agreements; forward contracts; currency options; and commodity-swap agreements. These instrumentsare not entered into for trading purposes. Praxair only uses commonly traded and non-leveraged instruments.
There are two types of derivatives the company enters into: hedges of fair-value exposures and hedges of cash-flowexposures. Fair-value exposures relate to recognized assets or liabilities, and firm commitments; while cash-flow exposures relateto the variability of future cash flows associated with recognized assets or liabilities, or forecasted transactions. When a derivativeis executed and hedge accounting is appropriate, it is designated as either a fair-value hedge or a cash-flow hedge. Currently,Praxair designates all interest-rate and commodity-swap agreements as hedges; however, currency contracts are generally notdesignated as hedges for accounting purposes. All derivatives are linked to an appropriate underlying exposure. On an ongoingbasis, the company assesses the hedge effectiveness of all derivatives designated as hedges to determine if they continue to behighly effective in offsetting changes in fair values or cash flows of the underlying hedged items. If it is determined that the hedgeis not highly effective, then hedge accounting will be discontinued prospectively and changes in fair value are recorded in theconsolidated statements of income.
Changes in the fair value of derivatives designated as fair-value hedges are recognized in earnings as an offset to the change inthe fair values of the underlying exposures being hedged. The changes in fair value of derivatives that are designated as cash-flowhedges are deferred in accumulated other comprehensive income (loss) and are reclassified to earnings as the underlying hedgedtransaction affects earnings. Any ineffectiveness is recognized in earnings immediately. Hedges of net investments in foreignsubsidiaries are recognized in the cumulative translation adjustment component of accumulated other comprehensive income (loss)on the consolidated balance sheets to offset translation gains and losses associated with the hedged net investment. Derivatives thatare entered into for risk-management purposes and are not designated as hedges (primarily related to anticipated net income andcurrency derivatives other than for firm commitments) are recorded at their fair market values and recognized in current earnings.
See Note 12 for additional information relating to financial instruments.
Goodwill – Acquisitions are accounted for using the acquisition method which requires allocation of the purchase price toassets acquired and liabilities assumed based on estimated fair values. Any excess of the purchase price over the fair value of theassets and liabilities acquired is recorded as goodwill. Allocations of the purchase price are based on preliminary estimates andassumptions at the date of acquisition and are subject to revision based on final information received, including appraisals andother analyses which support underlying estimates.
The company performs a goodwill impairment test annually in the second quarter or more frequently if events orcircumstances indicate that an impairment loss may have been incurred. The impairment test allows an entity to first assessqualitative factors to determine if it is more likely than not that the fair value of a reporting unit is less than carrying value. If it isdetermined, that it is more likely than not that the fair value of a reporting unit is less than carrying value then the company willestimate and compare the fair value of its reporting units to their carrying value, including goodwill. Reporting units aredetermined based on one level below the operating segment level. As applicable, fair value is determined through the use ofprojected future cash flows, multiples of earnings and sales and other factors. Such analysis requires the use of certain marketassumptions and discount factors, which are subjective in nature.
See Note 9 for additional information relating to goodwill.
56
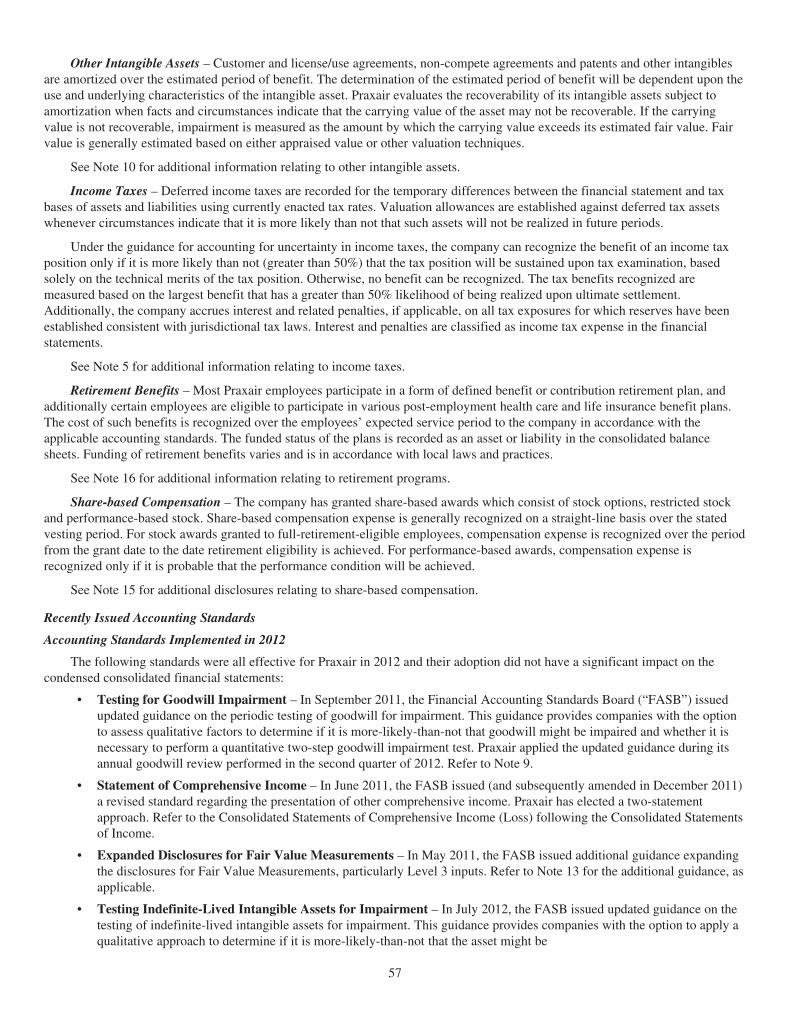
Other Intangible Assets – Customer and license/use agreements, non-compete agreements and patents and other intangiblesare amortized over the estimated period of benefit. The determination of the estimated period of benefit will be dependent upon theuse and underlying characteristics of the intangible asset. Praxair evaluates the recoverability of its intangible assets subject toamortization when facts and circumstances indicate that the carrying value of the asset may not be recoverable. If the carryingvalue is not recoverable, impairment is measured as the amount by which the carrying value exceeds its estimated fair value. Fairvalue is generally estimated based on either appraised value or other valuation techniques.
See Note 10 for additional information relating to other intangible assets.
Income Taxes – Deferred income taxes are recorded for the temporary differences between the financial statement and taxbases of assets and liabilities using currently enacted tax rates. Valuation allowances are established against deferred tax assetswhenever circumstances indicate that it is more likely than not that such assets will not be realized in future periods.
Under the guidance for accounting for uncertainty in income taxes, the company can recognize the benefit of an income taxposition only if it is more likely than not (greater than 50%) that the tax position will be sustained upon tax examination, basedsolely on the technical merits of the tax position. Otherwise, no benefit can be recognized. The tax benefits recognized aremeasured based on the largest benefit that has a greater than 50% likelihood of being realized upon ultimate settlement.Additionally, the company accrues interest and related penalties, if applicable, on all tax exposures for which reserves have beenestablished consistent with jurisdictional tax laws. Interest and penalties are classified as income tax expense in the financialstatements.
See Note 5 for additional information relating to income taxes.
Retirement Benefits – Most Praxair employees participate in a form of defined benefit or contribution retirement plan, andadditionally certain employees are eligible to participate in various post-employment health care and life insurance benefit plans.The cost of such benefits is recognized over the employees’ expected service period to the company in accordance with theapplicable accounting standards. The funded status of the plans is recorded as an asset or liability in the consolidated balancesheets. Funding of retirement benefits varies and is in accordance with local laws and practices.
See Note 16 for additional information relating to retirement programs.
Share-based Compensation – The company has granted share-based awards which consist of stock options, restricted stockand performance-based stock. Share-based compensation expense is generally recognized on a straight-line basis over the statedvesting period. For stock awards granted to full-retirement-eligible employees, compensation expense is recognized over the periodfrom the grant date to the date retirement eligibility is achieved. For performance-based awards, compensation expense isrecognized only if it is probable that the performance condition will be achieved.
See Note 15 for additional disclosures relating to share-based compensation.
Recently Issued Accounting Standards
Accounting Standards Implemented in 2012
The following standards were all effective for Praxair in 2012 and their adoption did not have a significant impact on thecondensed consolidated financial statements:
• Testing for Goodwill Impairment – In September 2011, the Financial Accounting Standards Board (“FASB”) issuedupdated guidance on the periodic testing of goodwill for impairment. This guidance provides companies with the optionto assess qualitative factors to determine if it is more-likely-than-not that goodwill might be impaired and whether it isnecessary to perform a quantitative two-step goodwill impairment test. Praxair applied the updated guidance during itsannual goodwill review performed in the second quarter of 2012. Refer to Note 9.
• Statement of Comprehensive Income – In June 2011, the FASB issued (and subsequently amended in December 2011)a revised standard regarding the presentation of other comprehensive income. Praxair has elected a two-statementapproach. Refer to the Consolidated Statements of Comprehensive Income (Loss) following the Consolidated Statementsof Income.
• Expanded Disclosures for Fair Value Measurements – In May 2011, the FASB issued additional guidance expandingthe disclosures for Fair Value Measurements, particularly Level 3 inputs. Refer to Note 13 for the additional guidance, asapplicable.
• Testing Indefinite-Lived Intangible Assets for Impairment – In July 2012, the FASB issued updated guidance on thetesting of indefinite-lived intangible assets for impairment. This guidance provides companies with the option to apply aqualitative approach to determine if it is more-likely-than-not that the asset might be
57
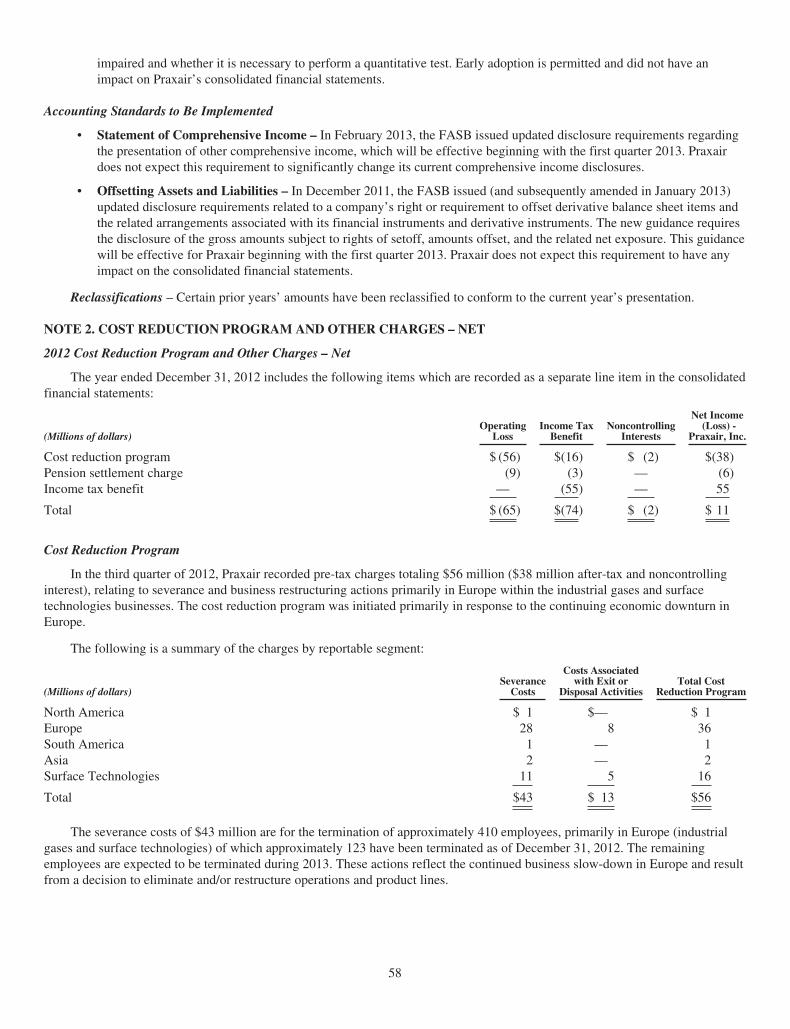
impaired and whether it is necessary to perform a quantitative test. Early adoption is permitted and did not have animpact on Praxair’s consolidated financial statements.
Accounting Standards to Be Implemented
• Statement of Comprehensive Income – In February 2013, the FASB issued updated disclosure requirements regardingthe presentation of other comprehensive income, which will be effective beginning with the first quarter 2013. Praxairdoes not expect this requirement to significantly change its current comprehensive income disclosures.
• Offsetting Assets and Liabilities – In December 2011, the FASB issued (and subsequently amended in January 2013)updated disclosure requirements related to a company’s right or requirement to offset derivative balance sheet items andthe related arrangements associated with its financial instruments and derivative instruments. The new guidance requiresthe disclosure of the gross amounts subject to rights of setoff, amounts offset, and the related net exposure. This guidancewill be effective for Praxair beginning with the first quarter 2013. Praxair does not expect this requirement to have anyimpact on the consolidated financial statements.
Reclassifications – Certain prior years’ amounts have been reclassified to conform to the current year’s presentation.
NOTE 2. COST REDUCTION PROGRAM AND OTHER CHARGES – NET
2012 Cost Reduction Program and Other Charges – Net
The year ended December 31, 2012 includes the following items which are recorded as a separate line item in the consolidatedfinancial statements:
(Millions of dollars)Operating
LossIncome Tax
BenefitNoncontrolling
Interests
Net Income(Loss) -
Praxair, Inc.
Cost reduction program $ (56) $(16) $ (2) $(38)Pension settlement charge (9) (3) — (6)Income tax benefit — (55) — 55
Total $ (65) $(74) $ (2) $ 11
Cost Reduction Program
In the third quarter of 2012, Praxair recorded pre-tax charges totaling $56 million ($38 million after-tax and noncontrollinginterest), relating to severance and business restructuring actions primarily in Europe within the industrial gases and surfacetechnologies businesses. The cost reduction program was initiated primarily in response to the continuing economic downturn inEurope.
The following is a summary of the charges by reportable segment:
(Millions of dollars)Severance
Costs
Costs Associatedwith Exit or
Disposal ActivitiesTotal Cost
Reduction Program
North America $ 1 $— $ 1Europe 28 8 36South America 1 — 1Asia 2 — 2Surface Technologies 11 5 16
Total $43 $ 13 $56
The severance costs of $43 million are for the termination of approximately 410 employees, primarily in Europe (industrialgases and surface technologies) of which approximately 123 have been terminated as of December 31, 2012. The remainingemployees are expected to be terminated during 2013. These actions reflect the continued business slow-down in Europe and resultfrom a decision to eliminate and/or restructure operations and product lines.
58
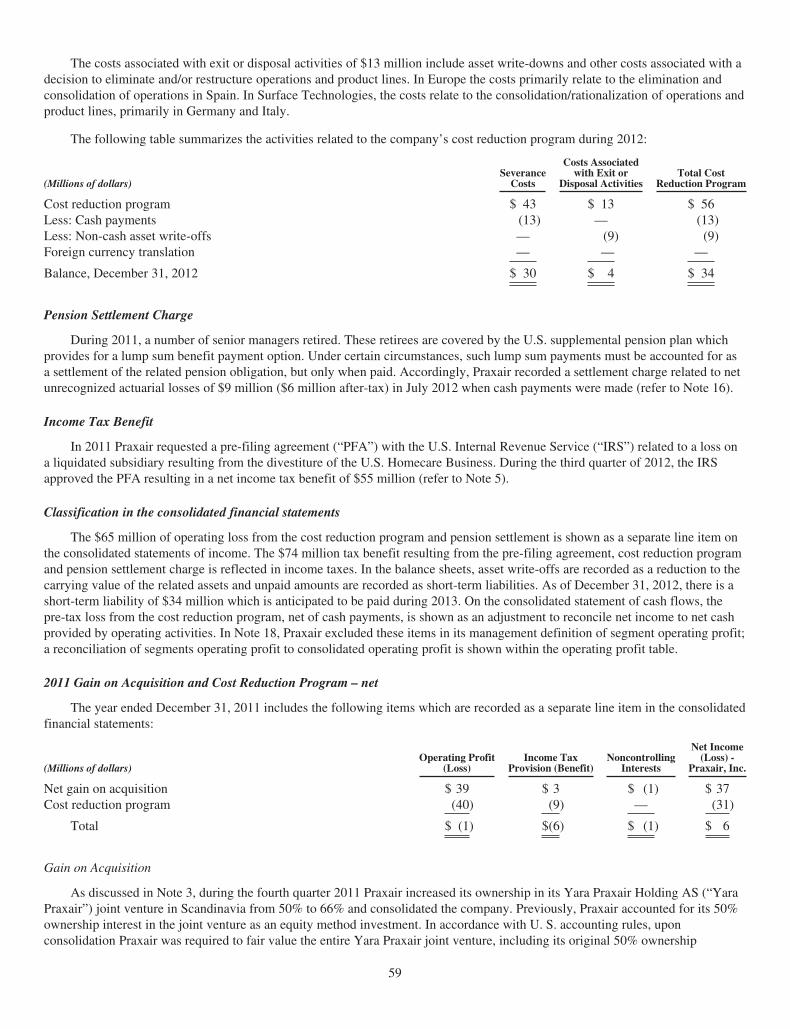
The costs associated with exit or disposal activities of $13 million include asset write-downs and other costs associated with adecision to eliminate and/or restructure operations and product lines. In Europe the costs primarily relate to the elimination andconsolidation of operations in Spain. In Surface Technologies, the costs relate to the consolidation/rationalization of operations andproduct lines, primarily in Germany and Italy.
The following table summarizes the activities related to the company’s cost reduction program during 2012:
(Millions of dollars)Severance
Costs
Costs Associatedwith Exit or
Disposal ActivitiesTotal Cost
Reduction Program
Cost reduction program $ 43 $ 13 $ 56Less: Cash payments (13) — (13)Less: Non-cash asset write-offs — (9) (9)Foreign currency translation — — —
Balance, December 31, 2012 $ 30 $ 4 $ 34
Pension Settlement Charge
During 2011, a number of senior managers retired. These retirees are covered by the U.S. supplemental pension plan whichprovides for a lump sum benefit payment option. Under certain circumstances, such lump sum payments must be accounted for asa settlement of the related pension obligation, but only when paid. Accordingly, Praxair recorded a settlement charge related to netunrecognized actuarial losses of $9 million ($6 million after-tax) in July 2012 when cash payments were made (refer to Note 16).
Income Tax Benefit
In 2011 Praxair requested a pre-filing agreement (“PFA”) with the U.S. Internal Revenue Service (“IRS”) related to a loss ona liquidated subsidiary resulting from the divestiture of the U.S. Homecare Business. During the third quarter of 2012, the IRSapproved the PFA resulting in a net income tax benefit of $55 million (refer to Note 5).
Classification in the consolidated financial statements
The $65 million of operating loss from the cost reduction program and pension settlement is shown as a separate line item onthe consolidated statements of income. The $74 million tax benefit resulting from the pre-filing agreement, cost reduction programand pension settlement charge is reflected in income taxes. In the balance sheets, asset write-offs are recorded as a reduction to thecarrying value of the related assets and unpaid amounts are recorded as short-term liabilities. As of December 31, 2012, there is ashort-term liability of $34 million which is anticipated to be paid during 2013. On the consolidated statement of cash flows, thepre-tax loss from the cost reduction program, net of cash payments, is shown as an adjustment to reconcile net income to net cashprovided by operating activities. In Note 18, Praxair excluded these items in its management definition of segment operating profit;a reconciliation of segments operating profit to consolidated operating profit is shown within the operating profit table.
2011 Gain on Acquisition and Cost Reduction Program – net
The year ended December 31, 2011 includes the following items which are recorded as a separate line item in the consolidatedfinancial statements:
(Millions of dollars)Operating Profit
(Loss)Income Tax
Provision (Benefit)Noncontrolling
Interests
Net Income(Loss) -
Praxair, Inc.
Net gain on acquisition $ 39 $ 3 $ (1) $ 37Cost reduction program (40) (9) — (31)
Total $ (1) $(6) $ (1) $ 6
Gain on Acquisition
As discussed in Note 3, during the fourth quarter 2011 Praxair increased its ownership in its Yara Praxair Holding AS (“YaraPraxair”) joint venture in Scandinavia from 50% to 66% and consolidated the company. Previously, Praxair accounted for its 50%ownership interest in the joint venture as an equity method investment. In accordance with U. S. accounting rules, uponconsolidation Praxair was required to fair value the entire Yara Praxair joint venture, including its original 50% ownership
59
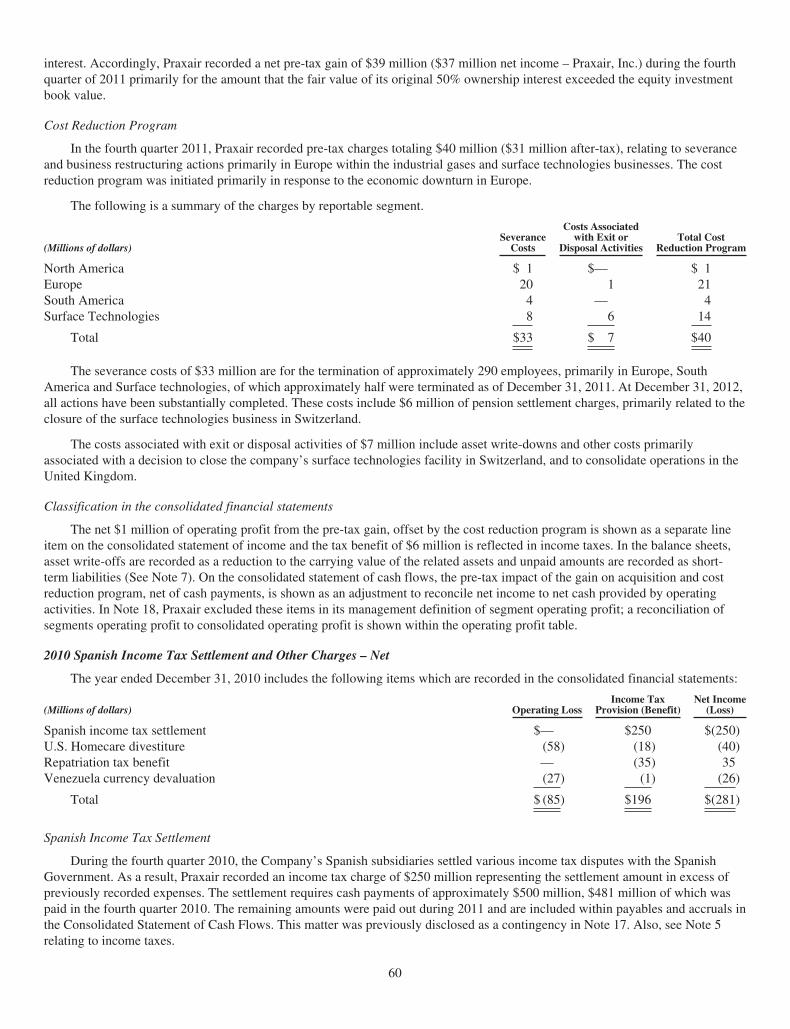
interest. Accordingly, Praxair recorded a net pre-tax gain of $39 million ($37 million net income – Praxair, Inc.) during the fourthquarter of 2011 primarily for the amount that the fair value of its original 50% ownership interest exceeded the equity investmentbook value.
Cost Reduction Program
In the fourth quarter 2011, Praxair recorded pre-tax charges totaling $40 million ($31 million after-tax), relating to severanceand business restructuring actions primarily in Europe within the industrial gases and surface technologies businesses. The costreduction program was initiated primarily in response to the economic downturn in Europe.
The following is a summary of the charges by reportable segment.
(Millions of dollars)Severance
Costs
Costs Associatedwith Exit or
Disposal ActivitiesTotal Cost
Reduction Program
North America $ 1 $— $ 1Europe 20 1 21South America 4 — 4Surface Technologies 8 6 14
Total $33 $ 7 $40
The severance costs of $33 million are for the termination of approximately 290 employees, primarily in Europe, SouthAmerica and Surface technologies, of which approximately half were terminated as of December 31, 2011. At December 31, 2012,all actions have been substantially completed. These costs include $6 million of pension settlement charges, primarily related to theclosure of the surface technologies business in Switzerland.
The costs associated with exit or disposal activities of $7 million include asset write-downs and other costs primarilyassociated with a decision to close the company’s surface technologies facility in Switzerland, and to consolidate operations in theUnited Kingdom.
Classification in the consolidated financial statements
The net $1 million of operating profit from the pre-tax gain, offset by the cost reduction program is shown as a separate lineitem on the consolidated statement of income and the tax benefit of $6 million is reflected in income taxes. In the balance sheets,asset write-offs are recorded as a reduction to the carrying value of the related assets and unpaid amounts are recorded as short-term liabilities (See Note 7). On the consolidated statement of cash flows, the pre-tax impact of the gain on acquisition and costreduction program, net of cash payments, is shown as an adjustment to reconcile net income to net cash provided by operatingactivities. In Note 18, Praxair excluded these items in its management definition of segment operating profit; a reconciliation ofsegments operating profit to consolidated operating profit is shown within the operating profit table.
2010 Spanish Income Tax Settlement and Other Charges – Net
The year ended December 31, 2010 includes the following items which are recorded in the consolidated financial statements:
(Millions of dollars) Operating LossIncome Tax
Provision (Benefit)Net Income
(Loss)
Spanish income tax settlement $— $250 $(250)U.S. Homecare divestiture (58) (18) (40)Repatriation tax benefit — (35) 35Venezuela currency devaluation (27) (1) (26)
Total $ (85) $196 $(281)
Spanish Income Tax Settlement
During the fourth quarter 2010, the Company’s Spanish subsidiaries settled various income tax disputes with the SpanishGovernment. As a result, Praxair recorded an income tax charge of $250 million representing the settlement amount in excess ofpreviously recorded expenses. The settlement requires cash payments of approximately $500 million, $481 million of which waspaid in the fourth quarter 2010. The remaining amounts were paid out during 2011 and are included within payables and accruals inthe Consolidated Statement of Cash Flows. This matter was previously disclosed as a contingency in Note 17. Also, see Note 5relating to income taxes.
60
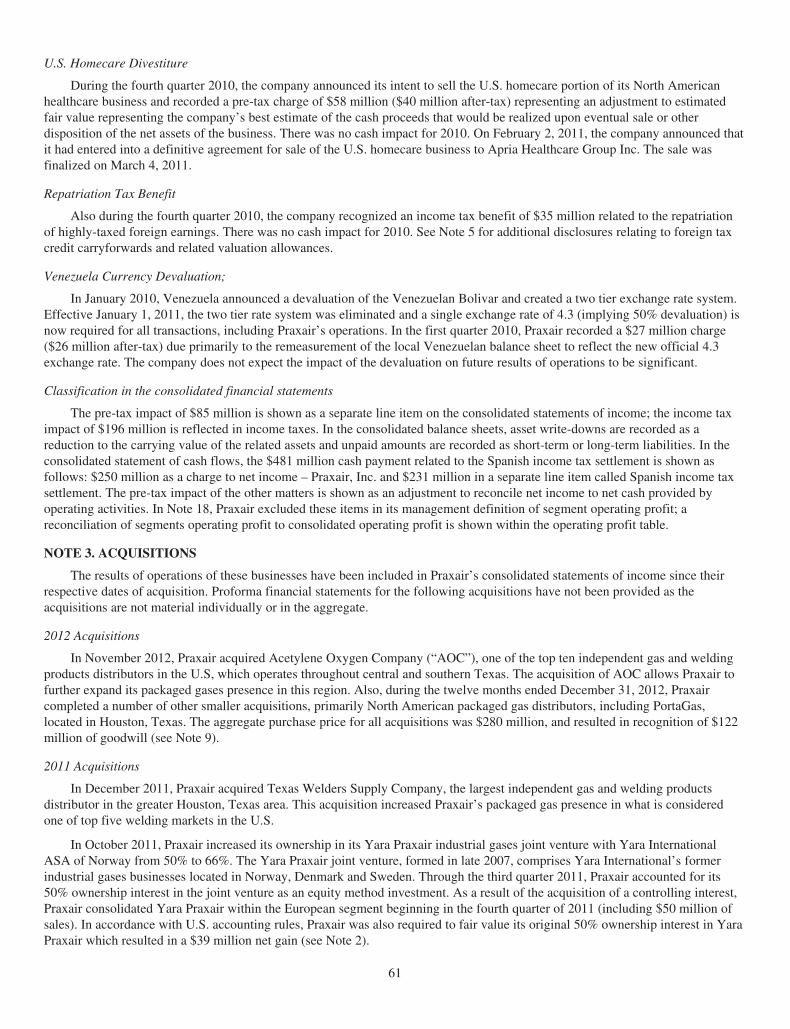
U.S. Homecare Divestiture
During the fourth quarter 2010, the company announced its intent to sell the U.S. homecare portion of its North Americanhealthcare business and recorded a pre-tax charge of $58 million ($40 million after-tax) representing an adjustment to estimatedfair value representing the company’s best estimate of the cash proceeds that would be realized upon eventual sale or otherdisposition of the net assets of the business. There was no cash impact for 2010. On February 2, 2011, the company announced thatit had entered into a definitive agreement for sale of the U.S. homecare business to Apria Healthcare Group Inc. The sale wasfinalized on March 4, 2011.
Repatriation Tax Benefit
Also during the fourth quarter 2010, the company recognized an income tax benefit of $35 million related to the repatriationof highly-taxed foreign earnings. There was no cash impact for 2010. See Note 5 for additional disclosures relating to foreign taxcredit carryforwards and related valuation allowances.
Venezuela Currency Devaluation;
In January 2010, Venezuela announced a devaluation of the Venezuelan Bolivar and created a two tier exchange rate system.Effective January 1, 2011, the two tier rate system was eliminated and a single exchange rate of 4.3 (implying 50% devaluation) isnow required for all transactions, including Praxair’s operations. In the first quarter 2010, Praxair recorded a $27 million charge($26 million after-tax) due primarily to the remeasurement of the local Venezuelan balance sheet to reflect the new official 4.3exchange rate. The company does not expect the impact of the devaluation on future results of operations to be significant.
Classification in the consolidated financial statements
The pre-tax impact of $85 million is shown as a separate line item on the consolidated statements of income; the income taximpact of $196 million is reflected in income taxes. In the consolidated balance sheets, asset write-downs are recorded as areduction to the carrying value of the related assets and unpaid amounts are recorded as short-term or long-term liabilities. In theconsolidated statement of cash flows, the $481 million cash payment related to the Spanish income tax settlement is shown asfollows: $250 million as a charge to net income – Praxair, Inc. and $231 million in a separate line item called Spanish income taxsettlement. The pre-tax impact of the other matters is shown as an adjustment to reconcile net income to net cash provided byoperating activities. In Note 18, Praxair excluded these items in its management definition of segment operating profit; areconciliation of segments operating profit to consolidated operating profit is shown within the operating profit table.
NOTE 3. ACQUISITIONS
The results of operations of these businesses have been included in Praxair’s consolidated statements of income since theirrespective dates of acquisition. Proforma financial statements for the following acquisitions have not been provided as theacquisitions are not material individually or in the aggregate.
2012 Acquisitions
In November 2012, Praxair acquired Acetylene Oxygen Company (“AOC”), one of the top ten independent gas and weldingproducts distributors in the U.S, which operates throughout central and southern Texas. The acquisition of AOC allows Praxair tofurther expand its packaged gases presence in this region. Also, during the twelve months ended December 31, 2012, Praxaircompleted a number of other smaller acquisitions, primarily North American packaged gas distributors, including PortaGas,located in Houston, Texas. The aggregate purchase price for all acquisitions was $280 million, and resulted in recognition of $122million of goodwill (see Note 9).
2011 Acquisitions
In December 2011, Praxair acquired Texas Welders Supply Company, the largest independent gas and welding productsdistributor in the greater Houston, Texas area. This acquisition increased Praxair’s packaged gas presence in what is consideredone of top five welding markets in the U.S.
In October 2011, Praxair increased its ownership in its Yara Praxair industrial gases joint venture with Yara InternationalASA of Norway from 50% to 66%. The Yara Praxair joint venture, formed in late 2007, comprises Yara International’s formerindustrial gases businesses located in Norway, Denmark and Sweden. Through the third quarter 2011, Praxair accounted for its50% ownership interest in the joint venture as an equity method investment. As a result of the acquisition of a controlling interest,Praxair consolidated Yara Praxair within the European segment beginning in the fourth quarter of 2011 (including $50 million ofsales). In accordance with U.S. accounting rules, Praxair was also required to fair value its original 50% ownership interest in YaraPraxair which resulted in a $39 million net gain (see Note 2).
61
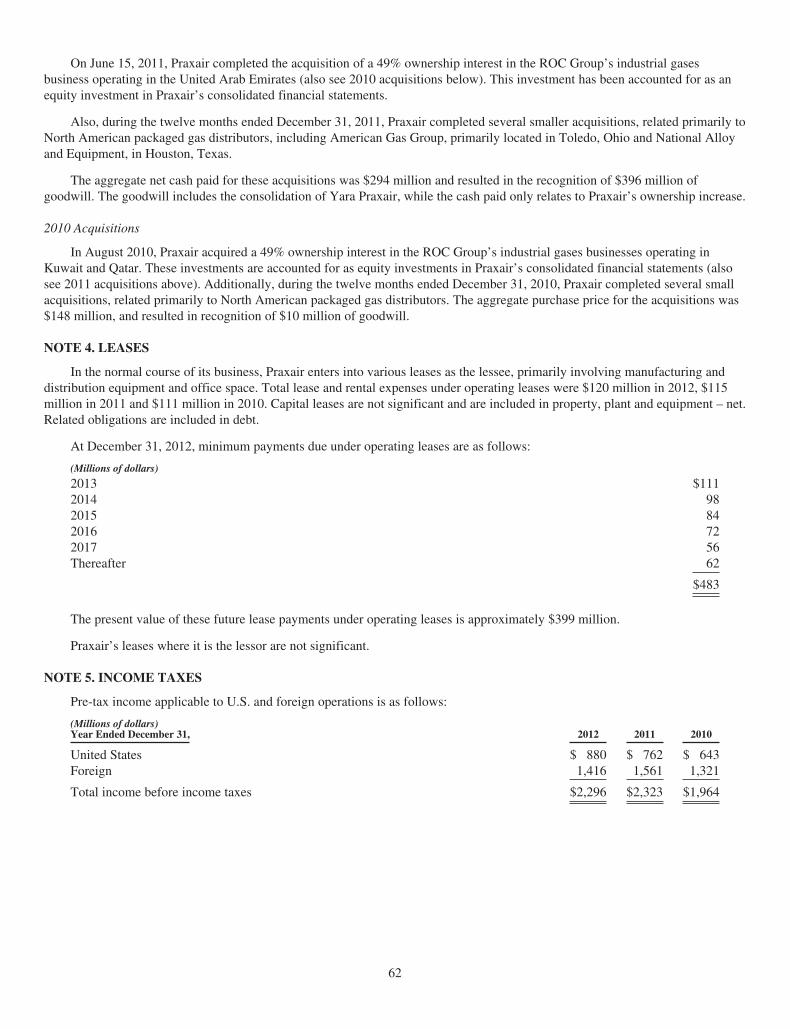
On June 15, 2011, Praxair completed the acquisition of a 49% ownership interest in the ROC Group’s industrial gasesbusiness operating in the United Arab Emirates (also see 2010 acquisitions below). This investment has been accounted for as anequity investment in Praxair’s consolidated financial statements.
Also, during the twelve months ended December 31, 2011, Praxair completed several smaller acquisitions, related primarily toNorth American packaged gas distributors, including American Gas Group, primarily located in Toledo, Ohio and National Alloyand Equipment, in Houston, Texas.
The aggregate net cash paid for these acquisitions was $294 million and resulted in the recognition of $396 million ofgoodwill. The goodwill includes the consolidation of Yara Praxair, while the cash paid only relates to Praxair’s ownership increase.
2010 Acquisitions
In August 2010, Praxair acquired a 49% ownership interest in the ROC Group’s industrial gases businesses operating inKuwait and Qatar. These investments are accounted for as equity investments in Praxair’s consolidated financial statements (alsosee 2011 acquisitions above). Additionally, during the twelve months ended December 31, 2010, Praxair completed several smallacquisitions, related primarily to North American packaged gas distributors. The aggregate purchase price for the acquisitions was$148 million, and resulted in recognition of $10 million of goodwill.
NOTE 4. LEASES
In the normal course of its business, Praxair enters into various leases as the lessee, primarily involving manufacturing anddistribution equipment and office space. Total lease and rental expenses under operating leases were $120 million in 2012, $115million in 2011 and $111 million in 2010. Capital leases are not significant and are included in property, plant and equipment – net.Related obligations are included in debt.
At December 31, 2012, minimum payments due under operating leases are as follows:
(Millions of dollars)
2013 $1112014 982015 842016 722017 56Thereafter 62
$483
The present value of these future lease payments under operating leases is approximately $399 million.
Praxair’s leases where it is the lessor are not significant.
NOTE 5. INCOME TAXES
Pre-tax income applicable to U.S. and foreign operations is as follows:
(Millions of dollars)Year Ended December 31, 2012 2011 2010
United States $ 880 $ 762 $ 643Foreign 1,416 1,561 1,321
Total income before income taxes $2,296 $2,323 $1,964
62
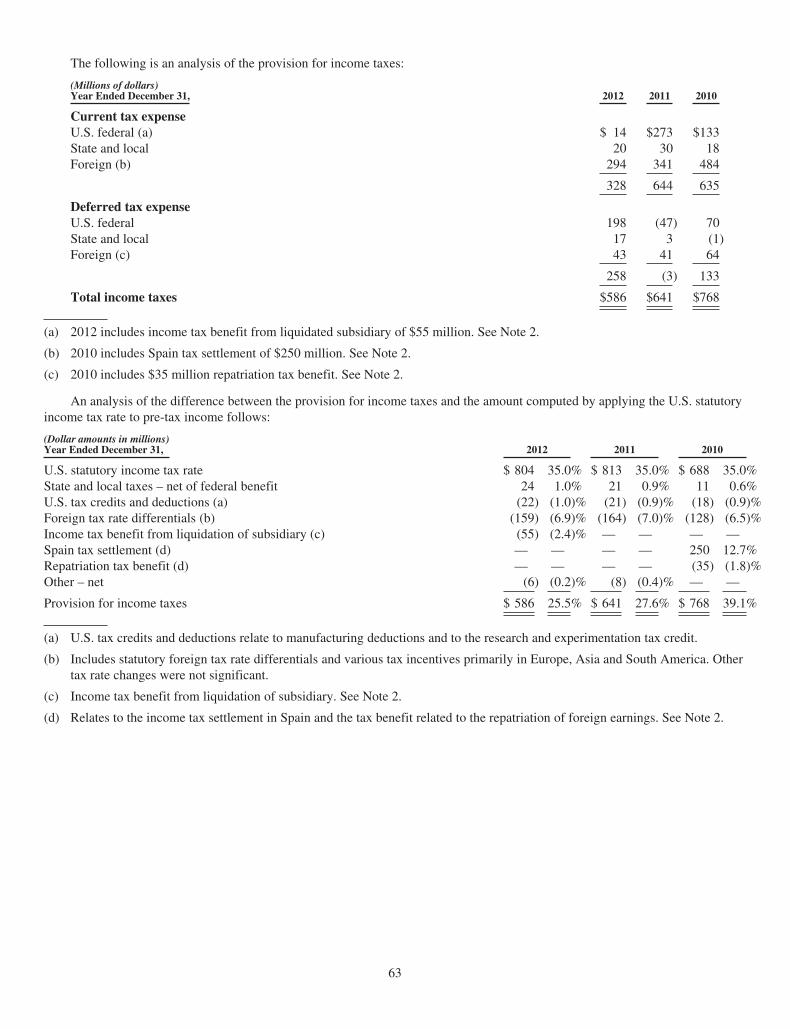
The following is an analysis of the provision for income taxes:
(Millions of dollars)Year Ended December 31, 2012 2011 2010
Current tax expenseU.S. federal (a) $ 14 $273 $133State and local 20 30 18Foreign (b) 294 341 484
328 644 635
Deferred tax expenseU.S. federal 198 (47) 70State and local 17 3 (1)Foreign (c) 43 41 64
258 (3) 133
Total income taxes $586 $641 $768
(a) 2012 includes income tax benefit from liquidated subsidiary of $55 million. See Note 2.
(b) 2010 includes Spain tax settlement of $250 million. See Note 2.
(c) 2010 includes $35 million repatriation tax benefit. See Note 2.
An analysis of the difference between the provision for income taxes and the amount computed by applying the U.S. statutoryincome tax rate to pre-tax income follows:
(Dollar amounts in millions)Year Ended December 31, 2012 2011 2010
U.S. statutory income tax rate $ 804 35.0% $ 813 35.0% $ 688 35.0%State and local taxes – net of federal benefit 24 1.0% 21 0.9% 11 0.6%U.S. tax credits and deductions (a) (22) (1.0)% (21) (0.9)% (18) (0.9)%Foreign tax rate differentials (b) (159) (6.9)% (164) (7.0)% (128) (6.5)%Income tax benefit from liquidation of subsidiary (c) (55) (2.4)% — — — —Spain tax settlement (d) — — — — 250 12.7%Repatriation tax benefit (d) — — — — (35) (1.8)%Other – net (6) (0.2)% (8) (0.4)% — —
Provision for income taxes $ 586 25.5% $ 641 27.6% $ 768 39.1%
(a) U.S. tax credits and deductions relate to manufacturing deductions and to the research and experimentation tax credit.
(b) Includes statutory foreign tax rate differentials and various tax incentives primarily in Europe, Asia and South America. Othertax rate changes were not significant.
(c) Income tax benefit from liquidation of subsidiary. See Note 2.
(d) Relates to the income tax settlement in Spain and the tax benefit related to the repatriation of foreign earnings. See Note 2.
63
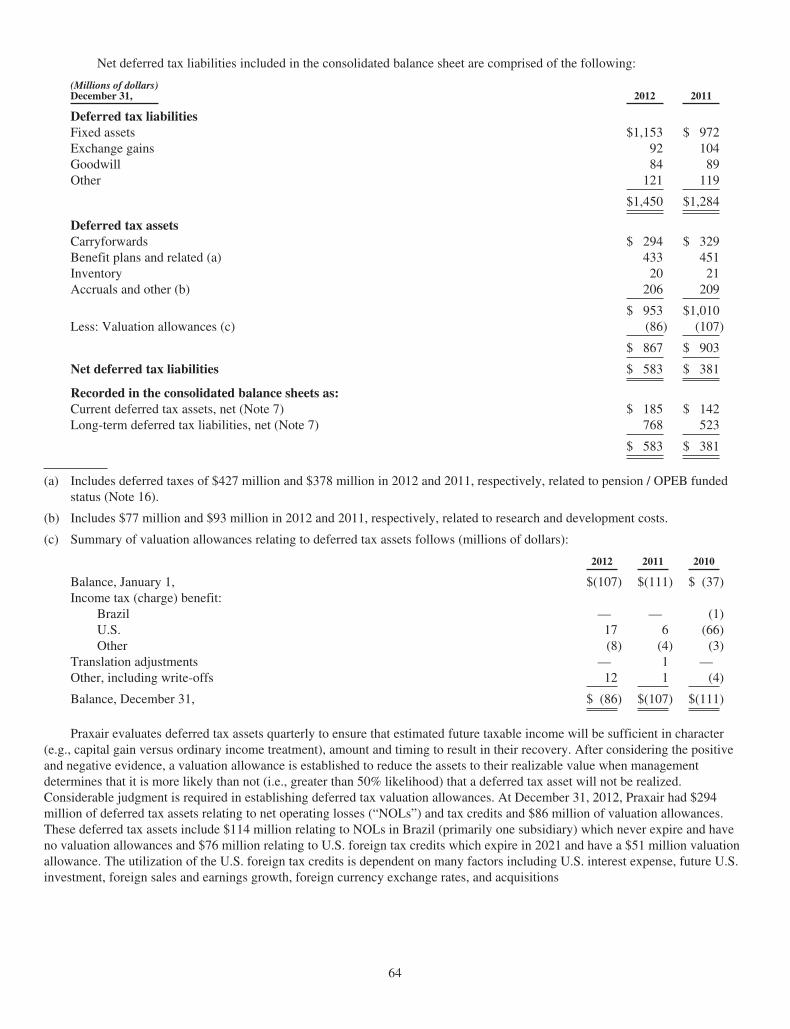
Net deferred tax liabilities included in the consolidated balance sheet are comprised of the following:
(Millions of dollars)December 31, 2012 2011
Deferred tax liabilitiesFixed assets $1,153 $ 972Exchange gains 92 104Goodwill 84 89Other 121 119
$1,450 $1,284
Deferred tax assetsCarryforwards $ 294 $ 329Benefit plans and related (a) 433 451Inventory 20 21Accruals and other (b) 206 209
$ 953 $1,010Less: Valuation allowances (c) (86) (107)
$ 867 $ 903
Net deferred tax liabilities $ 583 $ 381
Recorded in the consolidated balance sheets as:Current deferred tax assets, net (Note 7) $ 185 $ 142Long-term deferred tax liabilities, net (Note 7) 768 523
$ 583 $ 381
(a) Includes deferred taxes of $427 million and $378 million in 2012 and 2011, respectively, related to pension / OPEB fundedstatus (Note 16).
(b) Includes $77 million and $93 million in 2012 and 2011, respectively, related to research and development costs.
(c) Summary of valuation allowances relating to deferred tax assets follows (millions of dollars):
2012 2011 2010
Balance, January 1, $(107) $(111) $ (37)Income tax (charge) benefit:
Brazil — — (1)U.S. 17 6 (66)Other (8) (4) (3)
Translation adjustments — 1 —Other, including write-offs 12 1 (4)
Balance, December 31, $ (86) $(107) $(111)
Praxair evaluates deferred tax assets quarterly to ensure that estimated future taxable income will be sufficient in character(e.g., capital gain versus ordinary income treatment), amount and timing to result in their recovery. After considering the positiveand negative evidence, a valuation allowance is established to reduce the assets to their realizable value when managementdetermines that it is more likely than not (i.e., greater than 50% likelihood) that a deferred tax asset will not be realized.Considerable judgment is required in establishing deferred tax valuation allowances. At December 31, 2012, Praxair had $294million of deferred tax assets relating to net operating losses (“NOLs”) and tax credits and $86 million of valuation allowances.These deferred tax assets include $114 million relating to NOLs in Brazil (primarily one subsidiary) which never expire and haveno valuation allowances and $76 million relating to U.S. foreign tax credits which expire in 2021 and have a $51 million valuationallowance. The utilization of the U.S. foreign tax credits is dependent on many factors including U.S. interest expense, future U.S.investment, foreign sales and earnings growth, foreign currency exchange rates, and acquisitions
64
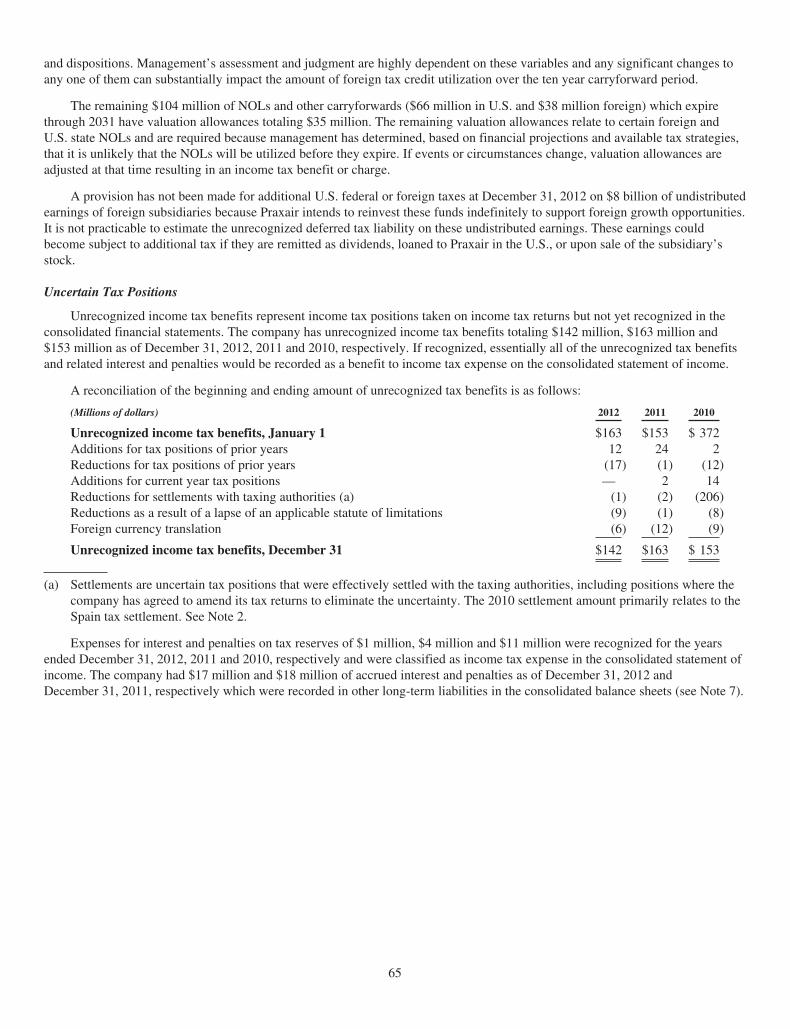
and dispositions. Management’s assessment and judgment are highly dependent on these variables and any significant changes toany one of them can substantially impact the amount of foreign tax credit utilization over the ten year carryforward period.
The remaining $104 million of NOLs and other carryforwards ($66 million in U.S. and $38 million foreign) which expirethrough 2031 have valuation allowances totaling $35 million. The remaining valuation allowances relate to certain foreign andU.S. state NOLs and are required because management has determined, based on financial projections and available tax strategies,that it is unlikely that the NOLs will be utilized before they expire. If events or circumstances change, valuation allowances areadjusted at that time resulting in an income tax benefit or charge.
A provision has not been made for additional U.S. federal or foreign taxes at December 31, 2012 on $8 billion of undistributedearnings of foreign subsidiaries because Praxair intends to reinvest these funds indefinitely to support foreign growth opportunities.It is not practicable to estimate the unrecognized deferred tax liability on these undistributed earnings. These earnings couldbecome subject to additional tax if they are remitted as dividends, loaned to Praxair in the U.S., or upon sale of the subsidiary’sstock.
Uncertain Tax Positions
Unrecognized income tax benefits represent income tax positions taken on income tax returns but not yet recognized in theconsolidated financial statements. The company has unrecognized income tax benefits totaling $142 million, $163 million and$153 million as of December 31, 2012, 2011 and 2010, respectively. If recognized, essentially all of the unrecognized tax benefitsand related interest and penalties would be recorded as a benefit to income tax expense on the consolidated statement of income.
A reconciliation of the beginning and ending amount of unrecognized tax benefits is as follows:
(Millions of dollars) 2012 2011 2010
Unrecognized income tax benefits, January 1 $163 $153 $ 372Additions for tax positions of prior years 12 24 2Reductions for tax positions of prior years (17) (1) (12)Additions for current year tax positions — 2 14Reductions for settlements with taxing authorities (a) (1) (2) (206)Reductions as a result of a lapse of an applicable statute of limitations (9) (1) (8)Foreign currency translation (6) (12) (9)
Unrecognized income tax benefits, December 31 $142 $163 $ 153
(a) Settlements are uncertain tax positions that were effectively settled with the taxing authorities, including positions where thecompany has agreed to amend its tax returns to eliminate the uncertainty. The 2010 settlement amount primarily relates to theSpain tax settlement. See Note 2.
Expenses for interest and penalties on tax reserves of $1 million, $4 million and $11 million were recognized for the yearsended December 31, 2012, 2011 and 2010, respectively and were classified as income tax expense in the consolidated statement ofincome. The company had $17 million and $18 million of accrued interest and penalties as of December 31, 2012 andDecember 31, 2011, respectively which were recorded in other long-term liabilities in the consolidated balance sheets (see Note 7).
65
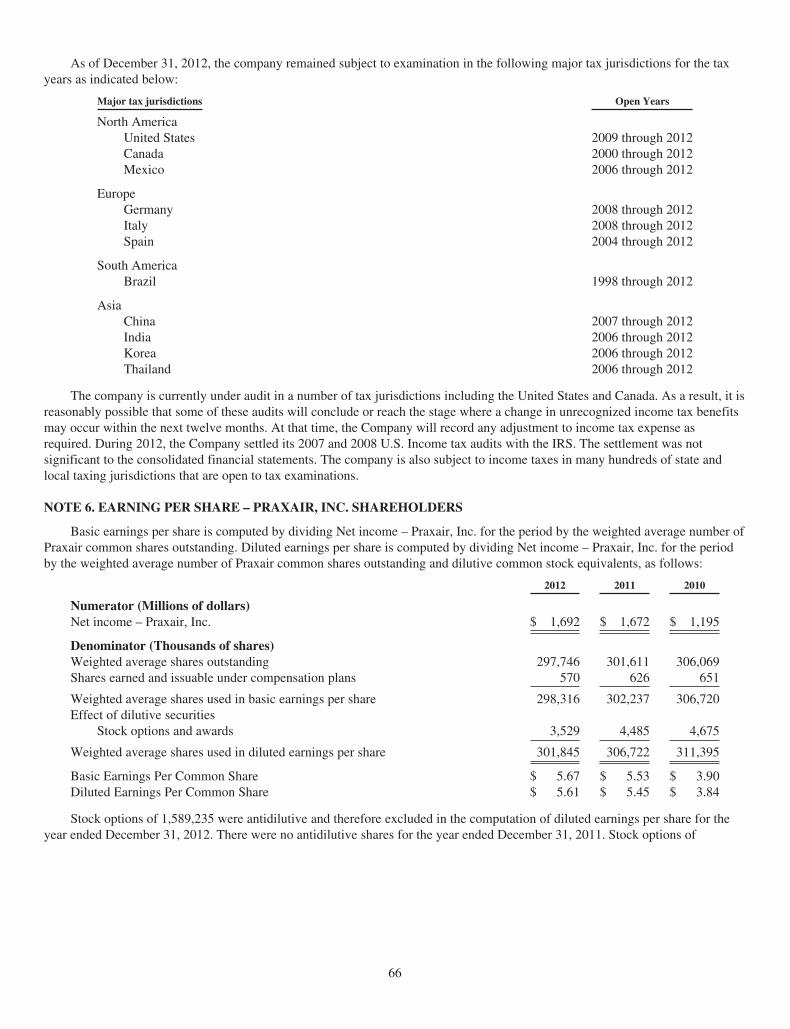
As of December 31, 2012, the company remained subject to examination in the following major tax jurisdictions for the taxyears as indicated below:
Major tax jurisdictions Open Years
North AmericaUnited States 2009 through 2012Canada 2000 through 2012Mexico 2006 through 2012
EuropeGermany 2008 through 2012Italy 2008 through 2012Spain 2004 through 2012
South AmericaBrazil 1998 through 2012
AsiaChina 2007 through 2012India 2006 through 2012Korea 2006 through 2012Thailand 2006 through 2012
The company is currently under audit in a number of tax jurisdictions including the United States and Canada. As a result, it isreasonably possible that some of these audits will conclude or reach the stage where a change in unrecognized income tax benefitsmay occur within the next twelve months. At that time, the Company will record any adjustment to income tax expense asrequired. During 2012, the Company settled its 2007 and 2008 U.S. Income tax audits with the IRS. The settlement was notsignificant to the consolidated financial statements. The company is also subject to income taxes in many hundreds of state andlocal taxing jurisdictions that are open to tax examinations.
NOTE 6. EARNING PER SHARE – PRAXAIR, INC. SHAREHOLDERS
Basic earnings per share is computed by dividing Net income – Praxair, Inc. for the period by the weighted average number ofPraxair common shares outstanding. Diluted earnings per share is computed by dividing Net income – Praxair, Inc. for the periodby the weighted average number of Praxair common shares outstanding and dilutive common stock equivalents, as follows:
2012 2011 2010
Numerator (Millions of dollars)Net income – Praxair, Inc. $ 1,692 $ 1,672 $ 1,195
Denominator (Thousands of shares)Weighted average shares outstanding 297,746 301,611 306,069Shares earned and issuable under compensation plans 570 626 651
Weighted average shares used in basic earnings per share 298,316 302,237 306,720Effect of dilutive securities
Stock options and awards 3,529 4,485 4,675
Weighted average shares used in diluted earnings per share 301,845 306,722 311,395
Basic Earnings Per Common Share $ 5.67 $ 5.53 $ 3.90Diluted Earnings Per Common Share $ 5.61 $ 5.45 $ 3.84
Stock options of 1,589,235 were antidilutive and therefore excluded in the computation of diluted earnings per share for theyear ended December 31, 2012. There were no antidilutive shares for the year ended December 31, 2011. Stock options of
66
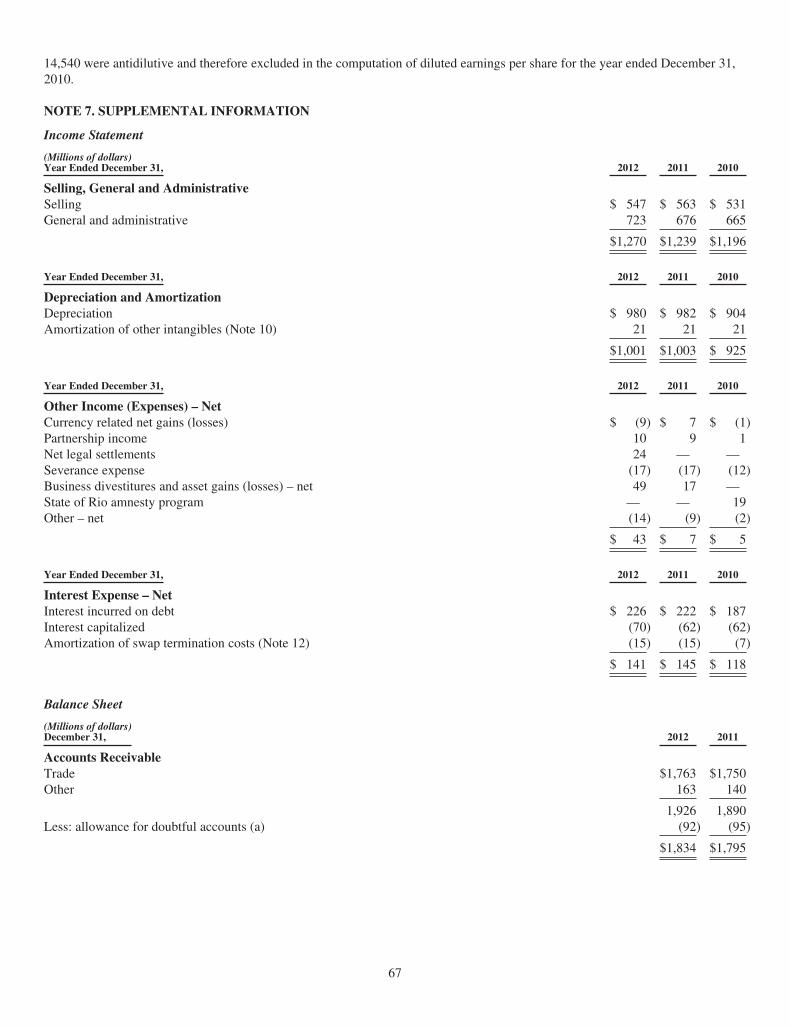
14,540 were antidilutive and therefore excluded in the computation of diluted earnings per share for the year ended December 31,2010.
NOTE 7. SUPPLEMENTAL INFORMATION
Income Statement
(Millions of dollars)Year Ended December 31, 2012 2011 2010
Selling, General and AdministrativeSelling $ 547 $ 563 $ 531General and administrative 723 676 665
$1,270 $1,239 $1,196
Year Ended December 31, 2012 2011 2010
Depreciation and AmortizationDepreciation $ 980 $ 982 $ 904Amortization of other intangibles (Note 10) 21 21 21
$1,001 $1,003 $ 925
Year Ended December 31, 2012 2011 2010
Other Income (Expenses) – NetCurrency related net gains (losses) $ (9) $ 7 $ (1)Partnership income 10 9 1Net legal settlements 24 — —Severance expense (17) (17) (12)Business divestitures and asset gains (losses) – net 49 17 —State of Rio amnesty program — — 19Other – net (14) (9) (2)
$ 43 $ 7 $ 5
Year Ended December 31, 2012 2011 2010
Interest Expense – NetInterest incurred on debt $ 226 $ 222 $ 187Interest capitalized (70) (62) (62)Amortization of swap termination costs (Note 12) (15) (15) (7)
$ 141 $ 145 $ 118
Balance Sheet
(Millions of dollars)December 31, 2012 2011
Accounts ReceivableTrade $1,763 $1,750Other 163 140
1,926 1,890Less: allowance for doubtful accounts (a) (92) (95)
$1,834 $1,795
67
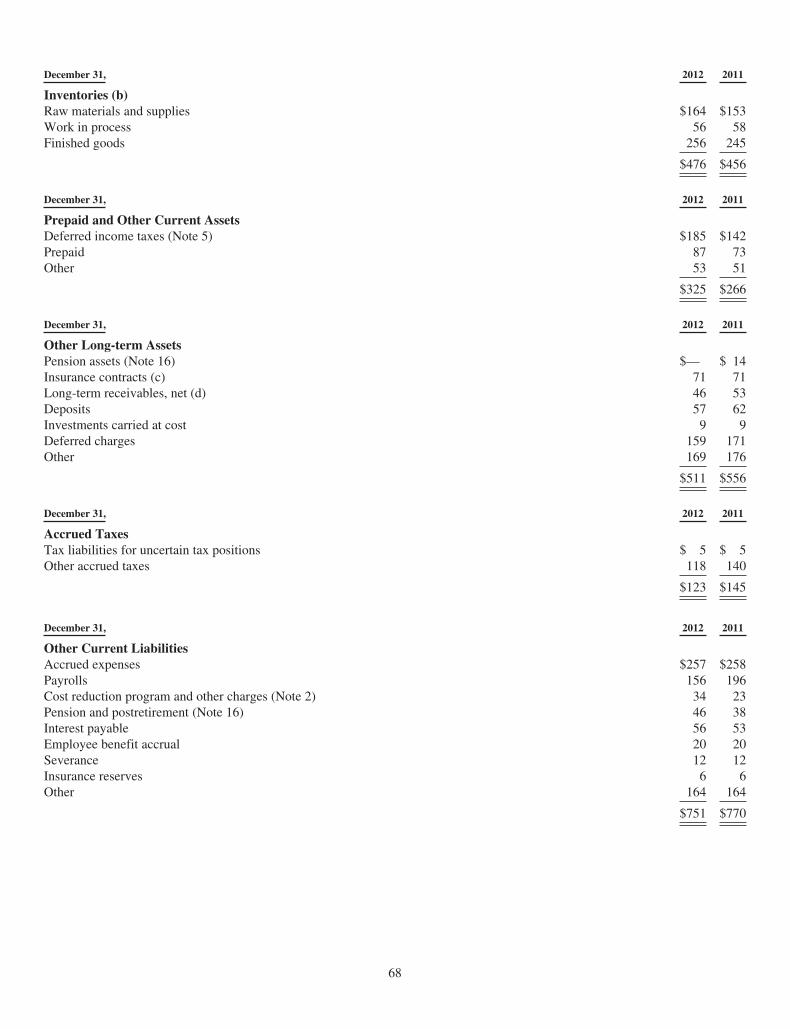
December 31, 2012 2011
Inventories (b)Raw materials and supplies $164 $153Work in process 56 58Finished goods 256 245
$476 $456
December 31, 2012 2011
Prepaid and Other Current AssetsDeferred income taxes (Note 5) $185 $142Prepaid 87 73Other 53 51
$325 $266
December 31, 2012 2011
Other Long-term AssetsPension assets (Note 16) $— $ 14Insurance contracts (c) 71 71Long-term receivables, net (d) 46 53Deposits 57 62Investments carried at cost 9 9Deferred charges 159 171Other 169 176
$511 $556
December 31, 2012 2011
Accrued TaxesTax liabilities for uncertain tax positions $ 5 $ 5Other accrued taxes 118 140
$123 $145
December 31, 2012 2011
Other Current LiabilitiesAccrued expenses $257 $258Payrolls 156 196Cost reduction program and other charges (Note 2) 34 23Pension and postretirement (Note 16) 46 38Interest payable 56 53Employee benefit accrual 20 20Severance 12 12Insurance reserves 6 6Other 164 164
$751 $770
68
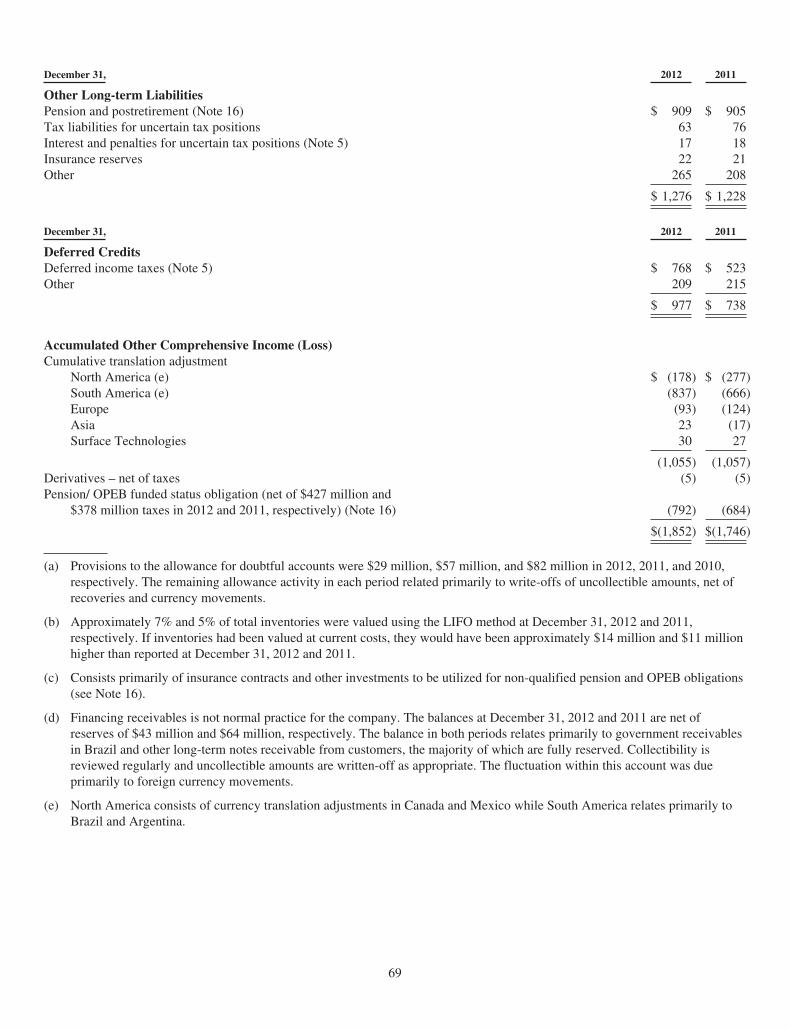
December 31, 2012 2011
Other Long-term LiabilitiesPension and postretirement (Note 16) $ 909 $ 905Tax liabilities for uncertain tax positions 63 76Interest and penalties for uncertain tax positions (Note 5) 17 18Insurance reserves 22 21Other 265 208
$ 1,276 $ 1,228
December 31, 2012 2011
Deferred CreditsDeferred income taxes (Note 5) $ 768 $ 523Other 209 215
$ 977 $ 738
Accumulated Other Comprehensive Income (Loss)Cumulative translation adjustment
North America (e) $ (178) $ (277)South America (e) (837) (666)Europe (93) (124)Asia 23 (17)Surface Technologies 30 27
(1,055) (1,057)Derivatives – net of taxes (5) (5)Pension/ OPEB funded status obligation (net of $427 million and
$378 million taxes in 2012 and 2011, respectively) (Note 16) (792) (684)
$(1,852) $(1,746)
(a) Provisions to the allowance for doubtful accounts were $29 million, $57 million, and $82 million in 2012, 2011, and 2010,respectively. The remaining allowance activity in each period related primarily to write-offs of uncollectible amounts, net ofrecoveries and currency movements.
(b) Approximately 7% and 5% of total inventories were valued using the LIFO method at December 31, 2012 and 2011,respectively. If inventories had been valued at current costs, they would have been approximately $14 million and $11 millionhigher than reported at December 31, 2012 and 2011.
(c) Consists primarily of insurance contracts and other investments to be utilized for non-qualified pension and OPEB obligations(see Note 16).
(d) Financing receivables is not normal practice for the company. The balances at December 31, 2012 and 2011 are net ofreserves of $43 million and $64 million, respectively. The balance in both periods relates primarily to government receivablesin Brazil and other long-term notes receivable from customers, the majority of which are fully reserved. Collectibility isreviewed regularly and uncollectible amounts are written-off as appropriate. The fluctuation within this account was dueprimarily to foreign currency movements.
(e) North America consists of currency translation adjustments in Canada and Mexico while South America relates primarily toBrazil and Argentina.
69
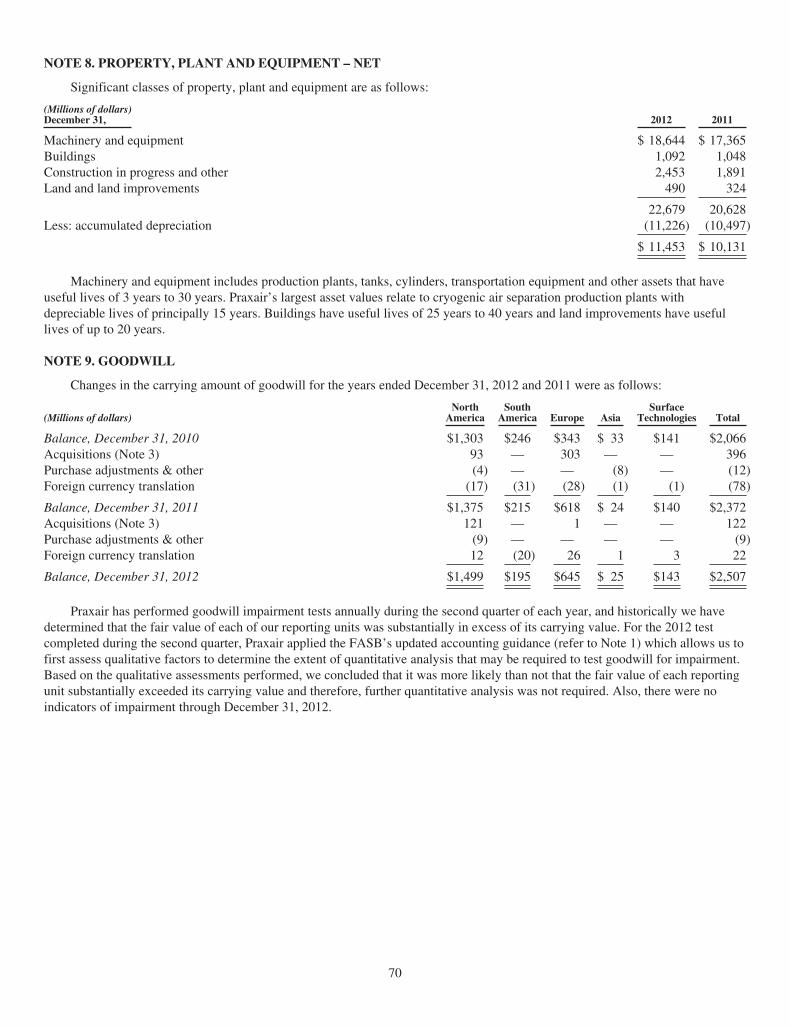
NOTE 8. PROPERTY, PLANT AND EQUIPMENT – NET
Significant classes of property, plant and equipment are as follows:
(Millions of dollars)December 31, 2012 2011
Machinery and equipment $ 18,644 $ 17,365Buildings 1,092 1,048Construction in progress and other 2,453 1,891Land and land improvements 490 324
22,679 20,628Less: accumulated depreciation (11,226) (10,497)
$ 11,453 $ 10,131
Machinery and equipment includes production plants, tanks, cylinders, transportation equipment and other assets that haveuseful lives of 3 years to 30 years. Praxair’s largest asset values relate to cryogenic air separation production plants withdepreciable lives of principally 15 years. Buildings have useful lives of 25 years to 40 years and land improvements have usefullives of up to 20 years.
NOTE 9. GOODWILL
Changes in the carrying amount of goodwill for the years ended December 31, 2012 and 2011 were as follows:
(Millions of dollars)North
AmericaSouth
America Europe AsiaSurface
Technologies Total
Balance, December 31, 2010 $1,303 $246 $343 $ 33 $141 $2,066Acquisitions (Note 3) 93 — 303 — — 396Purchase adjustments & other (4) — — (8) — (12)Foreign currency translation (17) (31) (28) (1) (1) (78)
Balance, December 31, 2011 $1,375 $215 $618 $ 24 $140 $2,372Acquisitions (Note 3) 121 — 1 — — 122Purchase adjustments & other (9) — — — — (9)Foreign currency translation 12 (20) 26 1 3 22
Balance, December 31, 2012 $1,499 $195 $645 $ 25 $143 $2,507
Praxair has performed goodwill impairment tests annually during the second quarter of each year, and historically we havedetermined that the fair value of each of our reporting units was substantially in excess of its carrying value. For the 2012 testcompleted during the second quarter, Praxair applied the FASB’s updated accounting guidance (refer to Note 1) which allows us tofirst assess qualitative factors to determine the extent of quantitative analysis that may be required to test goodwill for impairment.Based on the qualitative assessments performed, we concluded that it was more likely than not that the fair value of each reportingunit substantially exceeded its carrying value and therefore, further quantitative analysis was not required. Also, there were noindicators of impairment through December 31, 2012.
70
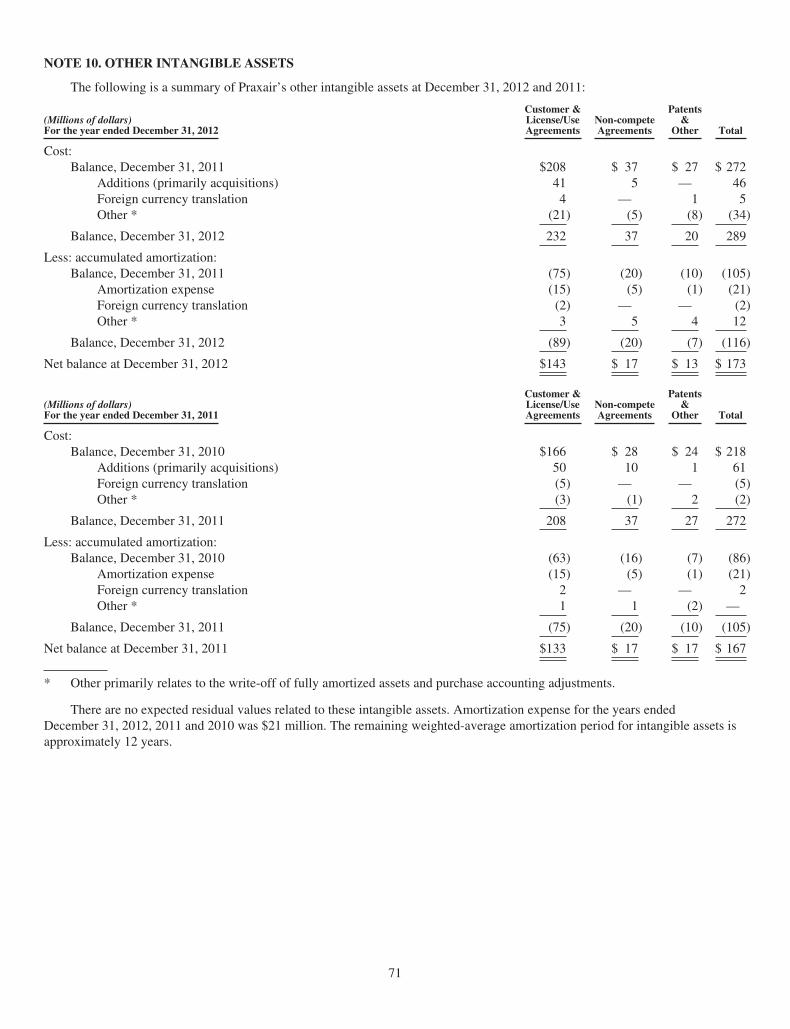
NOTE 10. OTHER INTANGIBLE ASSETS
The following is a summary of Praxair’s other intangible assets at December 31, 2012 and 2011:
(Millions of dollars)For the year ended December 31, 2012
Customer &License/UseAgreements
Non-competeAgreements
Patents&
Other Total
Cost:Balance, December 31, 2011 $208 $ 37 $ 27 $ 272
Additions (primarily acquisitions) 41 5 — 46Foreign currency translation 4 — 1 5Other * (21) (5) (8) (34)
Balance, December 31, 2012 232 37 20 289
Less: accumulated amortization:Balance, December 31, 2011 (75) (20) (10) (105)
Amortization expense (15) (5) (1) (21)Foreign currency translation (2) — — (2)Other * 3 5 4 12
Balance, December 31, 2012 (89) (20) (7) (116)
Net balance at December 31, 2012 $143 $ 17 $ 13 $ 173
(Millions of dollars)For the year ended December 31, 2011
Customer &License/UseAgreements
Non-competeAgreements
Patents&
Other Total
Cost:Balance, December 31, 2010 $166 $ 28 $ 24 $ 218
Additions (primarily acquisitions) 50 10 1 61Foreign currency translation (5) — — (5)Other * (3) (1) 2 (2)
Balance, December 31, 2011 208 37 27 272
Less: accumulated amortization:Balance, December 31, 2010 (63) (16) (7) (86)
Amortization expense (15) (5) (1) (21)Foreign currency translation 2 — — 2Other * 1 1 (2) —
Balance, December 31, 2011 (75) (20) (10) (105)
Net balance at December 31, 2011 $133 $ 17 $ 17 $ 167
* Other primarily relates to the write-off of fully amortized assets and purchase accounting adjustments.
There are no expected residual values related to these intangible assets. Amortization expense for the years endedDecember 31, 2012, 2011 and 2010 was $21 million. The remaining weighted-average amortization period for intangible assets isapproximately 12 years.
71
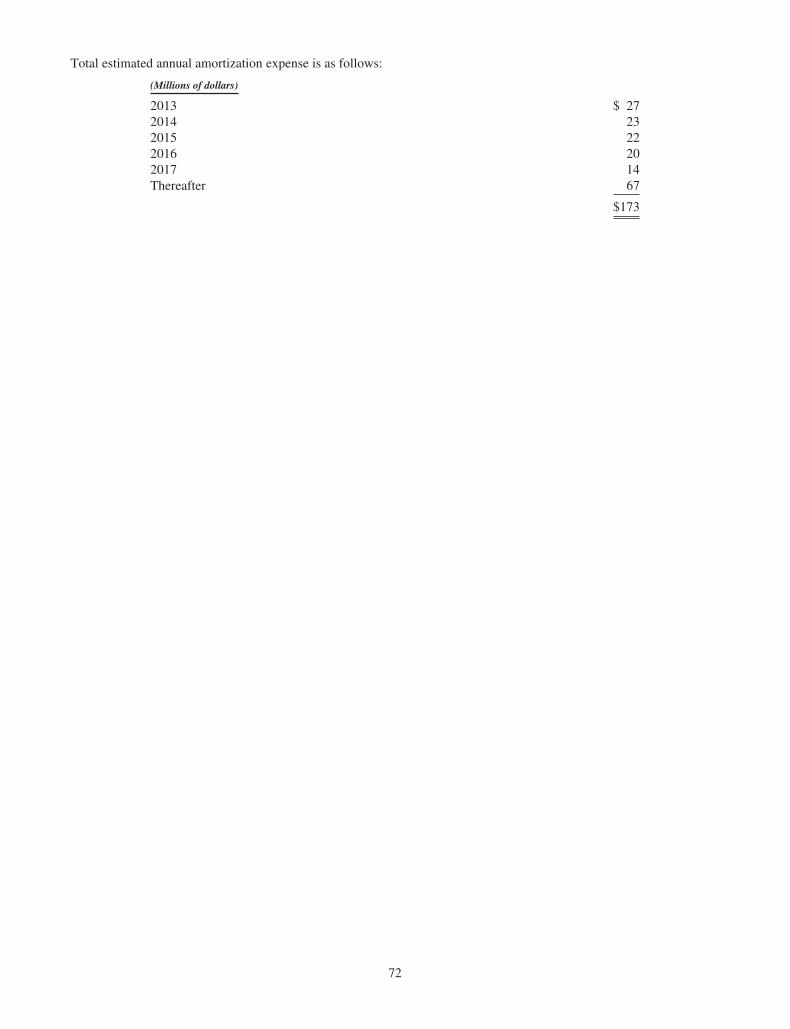
Total estimated annual amortization expense is as follows:
(Millions of dollars)
2013 $ 272014 232015 222016 202017 14Thereafter 67
$173
72
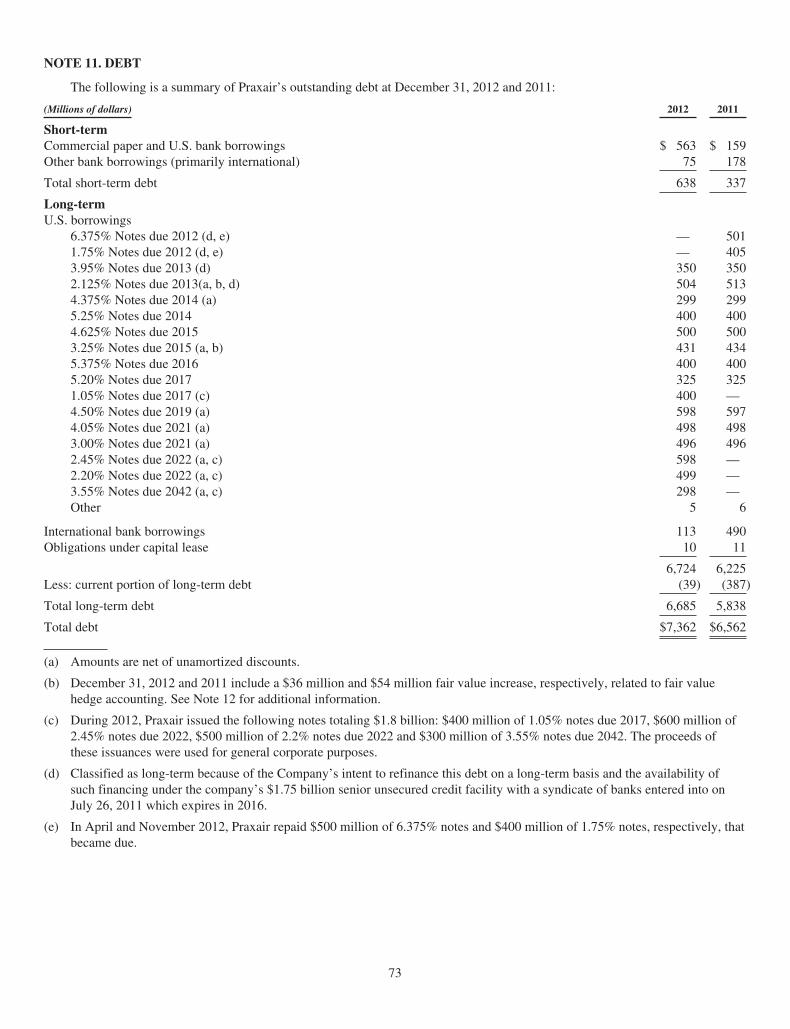
NOTE 11. DEBT
The following is a summary of Praxair’s outstanding debt at December 31, 2012 and 2011:
(Millions of dollars) 2012 2011
Short-termCommercial paper and U.S. bank borrowings $ 563 $ 159Other bank borrowings (primarily international) 75 178
Total short-term debt 638 337
Long-termU.S. borrowings
6.375% Notes due 2012 (d, e) — 5011.75% Notes due 2012 (d, e) — 4053.95% Notes due 2013 (d) 350 3502.125% Notes due 2013(a, b, d) 504 5134.375% Notes due 2014 (a) 299 2995.25% Notes due 2014 400 4004.625% Notes due 2015 500 5003.25% Notes due 2015 (a, b) 431 4345.375% Notes due 2016 400 4005.20% Notes due 2017 325 3251.05% Notes due 2017 (c) 400 —4.50% Notes due 2019 (a) 598 5974.05% Notes due 2021 (a) 498 4983.00% Notes due 2021 (a) 496 4962.45% Notes due 2022 (a, c) 598 —2.20% Notes due 2022 (a, c) 499 —3.55% Notes due 2042 (a, c) 298 —Other 5 6
International bank borrowings 113 490Obligations under capital lease 10 11
6,724 6,225Less: current portion of long-term debt (39) (387)
Total long-term debt 6,685 5,838
Total debt $7,362 $6,562
(a) Amounts are net of unamortized discounts.
(b) December 31, 2012 and 2011 include a $36 million and $54 million fair value increase, respectively, related to fair valuehedge accounting. See Note 12 for additional information.
(c) During 2012, Praxair issued the following notes totaling $1.8 billion: $400 million of 1.05% notes due 2017, $600 million of2.45% notes due 2022, $500 million of 2.2% notes due 2022 and $300 million of 3.55% notes due 2042. The proceeds ofthese issuances were used for general corporate purposes.
(d) Classified as long-term because of the Company’s intent to refinance this debt on a long-term basis and the availability ofsuch financing under the company’s $1.75 billion senior unsecured credit facility with a syndicate of banks entered into onJuly 26, 2011 which expires in 2016.
(e) In April and November 2012, Praxair repaid $500 million of 6.375% notes and $400 million of 1.75% notes, respectively, thatbecame due.
73
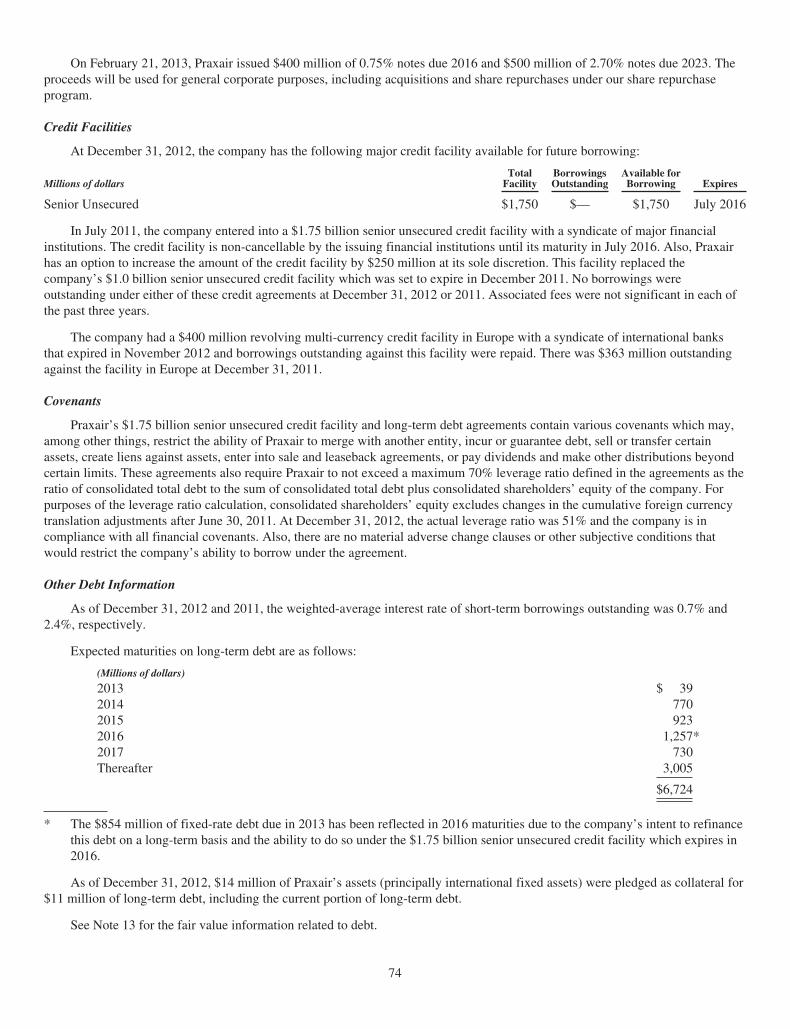
On February 21, 2013, Praxair issued $400 million of 0.75% notes due 2016 and $500 million of 2.70% notes due 2023. Theproceeds will be used for general corporate purposes, including acquisitions and share repurchases under our share repurchaseprogram.
Credit Facilities
At December 31, 2012, the company has the following major credit facility available for future borrowing:
Millions of dollarsTotal
FacilityBorrowingsOutstanding
Available forBorrowing Expires
Senior Unsecured $1,750 $— $1,750 July 2016
In July 2011, the company entered into a $1.75 billion senior unsecured credit facility with a syndicate of major financialinstitutions. The credit facility is non-cancellable by the issuing financial institutions until its maturity in July 2016. Also, Praxairhas an option to increase the amount of the credit facility by $250 million at its sole discretion. This facility replaced thecompany’s $1.0 billion senior unsecured credit facility which was set to expire in December 2011. No borrowings wereoutstanding under either of these credit agreements at December 31, 2012 or 2011. Associated fees were not significant in each ofthe past three years.
The company had a $400 million revolving multi-currency credit facility in Europe with a syndicate of international banksthat expired in November 2012 and borrowings outstanding against this facility were repaid. There was $363 million outstandingagainst the facility in Europe at December 31, 2011.
Covenants
Praxair’s $1.75 billion senior unsecured credit facility and long-term debt agreements contain various covenants which may,among other things, restrict the ability of Praxair to merge with another entity, incur or guarantee debt, sell or transfer certainassets, create liens against assets, enter into sale and leaseback agreements, or pay dividends and make other distributions beyondcertain limits. These agreements also require Praxair to not exceed a maximum 70% leverage ratio defined in the agreements as theratio of consolidated total debt to the sum of consolidated total debt plus consolidated shareholders’ equity of the company. Forpurposes of the leverage ratio calculation, consolidated shareholders’ equity excludes changes in the cumulative foreign currencytranslation adjustments after June 30, 2011. At December 31, 2012, the actual leverage ratio was 51% and the company is incompliance with all financial covenants. Also, there are no material adverse change clauses or other subjective conditions thatwould restrict the company’s ability to borrow under the agreement.
Other Debt Information
As of December 31, 2012 and 2011, the weighted-average interest rate of short-term borrowings outstanding was 0.7% and2.4%, respectively.
Expected maturities on long-term debt are as follows:
(Millions of dollars)
2013 $ 392014 7702015 9232016 1,257*2017 730Thereafter 3,005
$6,724
* The $854 million of fixed-rate debt due in 2013 has been reflected in 2016 maturities due to the company’s intent to refinancethis debt on a long-term basis and the ability to do so under the $1.75 billion senior unsecured credit facility which expires in2016.
As of December 31, 2012, $14 million of Praxair’s assets (principally international fixed assets) were pledged as collateral for$11 million of long-term debt, including the current portion of long-term debt.
See Note 13 for the fair value information related to debt.
74
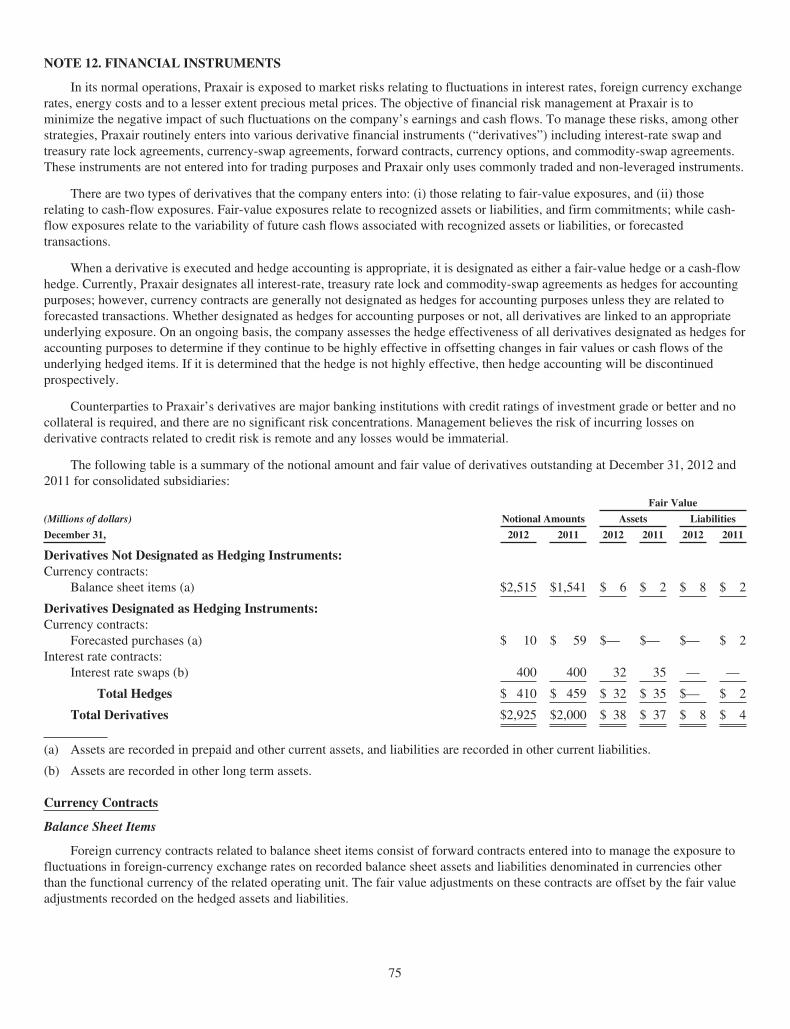
NOTE 12. FINANCIAL INSTRUMENTS
In its normal operations, Praxair is exposed to market risks relating to fluctuations in interest rates, foreign currency exchangerates, energy costs and to a lesser extent precious metal prices. The objective of financial risk management at Praxair is tominimize the negative impact of such fluctuations on the company’s earnings and cash flows. To manage these risks, among otherstrategies, Praxair routinely enters into various derivative financial instruments (“derivatives”) including interest-rate swap andtreasury rate lock agreements, currency-swap agreements, forward contracts, currency options, and commodity-swap agreements.These instruments are not entered into for trading purposes and Praxair only uses commonly traded and non-leveraged instruments.
There are two types of derivatives that the company enters into: (i) those relating to fair-value exposures, and (ii) thoserelating to cash-flow exposures. Fair-value exposures relate to recognized assets or liabilities, and firm commitments; while cash-flow exposures relate to the variability of future cash flows associated with recognized assets or liabilities, or forecastedtransactions.
When a derivative is executed and hedge accounting is appropriate, it is designated as either a fair-value hedge or a cash-flowhedge. Currently, Praxair designates all interest-rate, treasury rate lock and commodity-swap agreements as hedges for accountingpurposes; however, currency contracts are generally not designated as hedges for accounting purposes unless they are related toforecasted transactions. Whether designated as hedges for accounting purposes or not, all derivatives are linked to an appropriateunderlying exposure. On an ongoing basis, the company assesses the hedge effectiveness of all derivatives designated as hedges foraccounting purposes to determine if they continue to be highly effective in offsetting changes in fair values or cash flows of theunderlying hedged items. If it is determined that the hedge is not highly effective, then hedge accounting will be discontinuedprospectively.
Counterparties to Praxair’s derivatives are major banking institutions with credit ratings of investment grade or better and nocollateral is required, and there are no significant risk concentrations. Management believes the risk of incurring losses onderivative contracts related to credit risk is remote and any losses would be immaterial.
The following table is a summary of the notional amount and fair value of derivatives outstanding at December 31, 2012 and2011 for consolidated subsidiaries:
Fair Value
(Millions of dollars) Notional Amounts Assets Liabilities
December 31, 2012 2011 2012 2011 2012 2011
Derivatives Not Designated as Hedging Instruments:Currency contracts:
Balance sheet items (a) $2,515 $1,541 $ 6 $ 2 $ 8 $ 2
Derivatives Designated as Hedging Instruments:Currency contracts:
Forecasted purchases (a) $ 10 $ 59 $— $— $— $ 2Interest rate contracts:
Interest rate swaps (b) 400 400 32 35 — —
Total Hedges $ 410 $ 459 $ 32 $ 35 $— $ 2
Total Derivatives $2,925 $2,000 $ 38 $ 37 $ 8 $ 4
(a) Assets are recorded in prepaid and other current assets, and liabilities are recorded in other current liabilities.
(b) Assets are recorded in other long term assets.
Currency Contracts
Balance Sheet Items
Foreign currency contracts related to balance sheet items consist of forward contracts entered into to manage the exposure tofluctuations in foreign-currency exchange rates on recorded balance sheet assets and liabilities denominated in currencies otherthan the functional currency of the related operating unit. The fair value adjustments on these contracts are offset by the fair valueadjustments recorded on the hedged assets and liabilities.
75
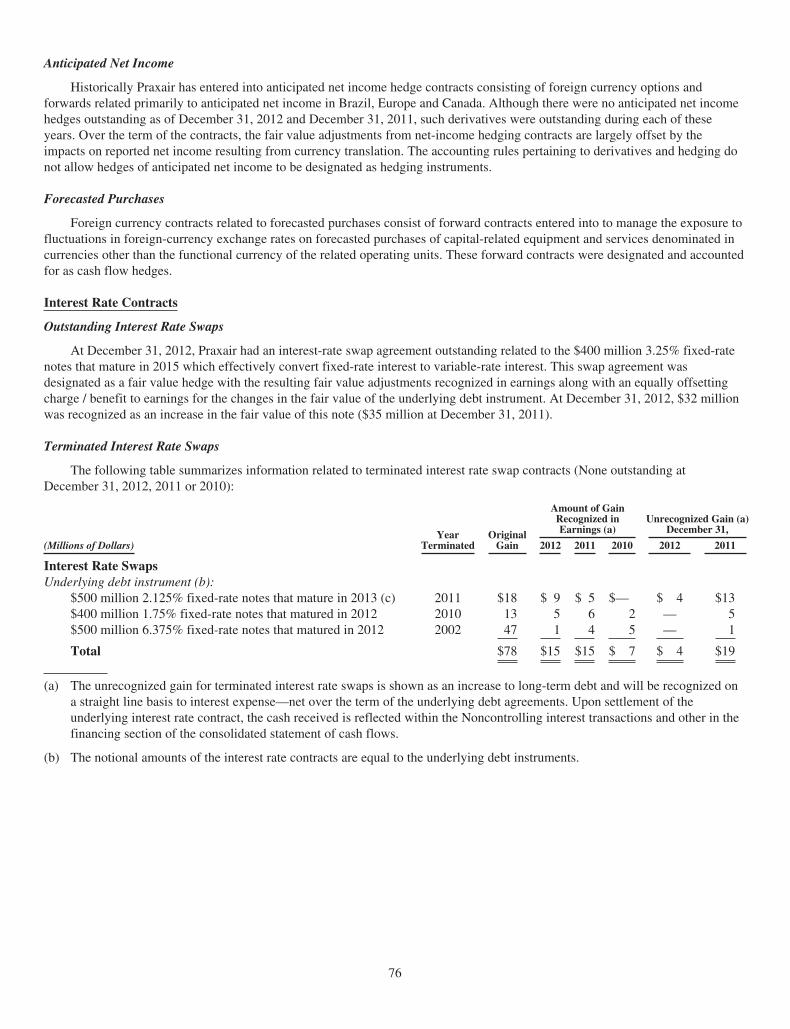
Anticipated Net Income
Historically Praxair has entered into anticipated net income hedge contracts consisting of foreign currency options andforwards related primarily to anticipated net income in Brazil, Europe and Canada. Although there were no anticipated net incomehedges outstanding as of December 31, 2012 and December 31, 2011, such derivatives were outstanding during each of theseyears. Over the term of the contracts, the fair value adjustments from net-income hedging contracts are largely offset by theimpacts on reported net income resulting from currency translation. The accounting rules pertaining to derivatives and hedging donot allow hedges of anticipated net income to be designated as hedging instruments.
Forecasted Purchases
Foreign currency contracts related to forecasted purchases consist of forward contracts entered into to manage the exposure tofluctuations in foreign-currency exchange rates on forecasted purchases of capital-related equipment and services denominated incurrencies other than the functional currency of the related operating units. These forward contracts were designated and accountedfor as cash flow hedges.
Interest Rate Contracts
Outstanding Interest Rate Swaps
At December 31, 2012, Praxair had an interest-rate swap agreement outstanding related to the $400 million 3.25% fixed-ratenotes that mature in 2015 which effectively convert fixed-rate interest to variable-rate interest. This swap agreement wasdesignated as a fair value hedge with the resulting fair value adjustments recognized in earnings along with an equally offsettingcharge / benefit to earnings for the changes in the fair value of the underlying debt instrument. At December 31, 2012, $32 millionwas recognized as an increase in the fair value of this note ($35 million at December 31, 2011).
Terminated Interest Rate Swaps
The following table summarizes information related to terminated interest rate swap contracts (None outstanding atDecember 31, 2012, 2011 or 2010):
YearTerminated
OriginalGain
Amount of GainRecognized inEarnings (a)
Unrecognized Gain (a)December 31,
(Millions of Dollars) 2012 2011 2010 2012 2011
Interest Rate SwapsUnderlying debt instrument (b):
$500 million 2.125% fixed-rate notes that mature in 2013 (c) 2011 $18 $ 9 $ 5 $— $ 4 $13$400 million 1.75% fixed-rate notes that matured in 2012 2010 13 5 6 2 — 5$500 million 6.375% fixed-rate notes that matured in 2012 2002 47 1 4 5 — 1
Total $78 $15 $15 $ 7 $ 4 $19
(a) The unrecognized gain for terminated interest rate swaps is shown as an increase to long-term debt and will be recognized ona straight line basis to interest expense—net over the term of the underlying debt agreements. Upon settlement of theunderlying interest rate contract, the cash received is reflected within the Noncontrolling interest transactions and other in thefinancing section of the consolidated statement of cash flows.
(b) The notional amounts of the interest rate contracts are equal to the underlying debt instruments.
76
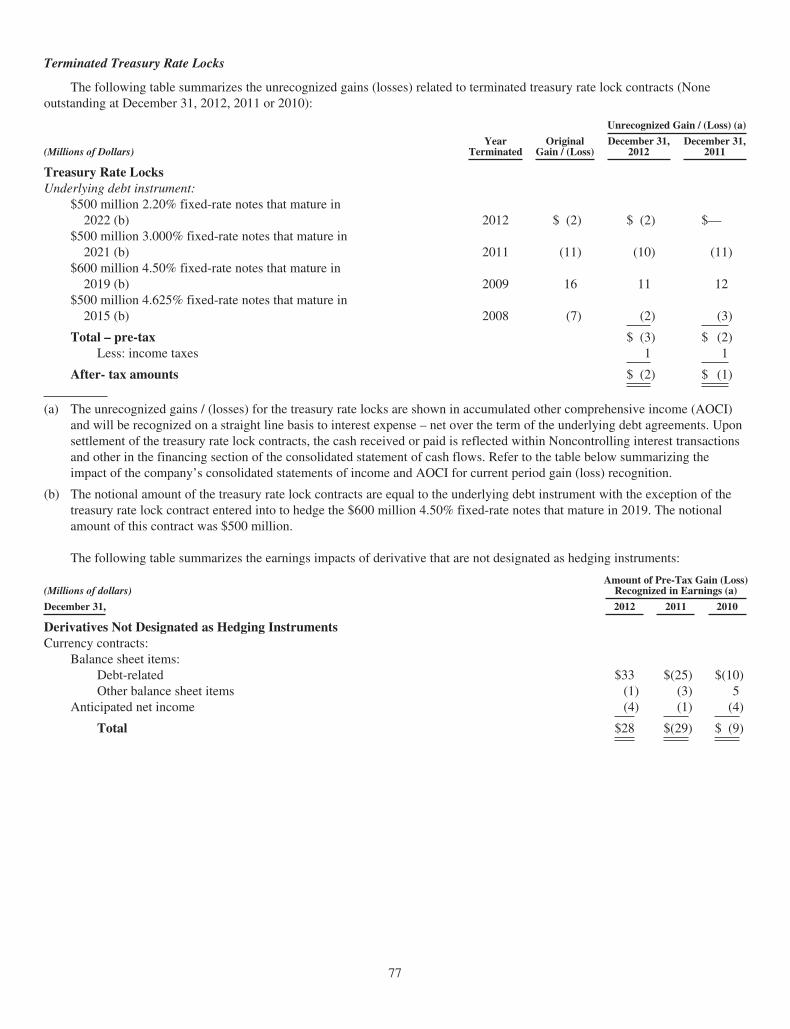
Terminated Treasury Rate Locks
The following table summarizes the unrecognized gains (losses) related to terminated treasury rate lock contracts (Noneoutstanding at December 31, 2012, 2011 or 2010):
YearTerminated
OriginalGain / (Loss)
Unrecognized Gain / (Loss) (a)
(Millions of Dollars)December 31,
2012December 31,
2011
Treasury Rate LocksUnderlying debt instrument:
$500 million 2.20% fixed-rate notes that mature in2022 (b) 2012 $ (2) $ (2) $—
$500 million 3.000% fixed-rate notes that mature in2021 (b) 2011 (11) (10) (11)
$600 million 4.50% fixed-rate notes that mature in2019 (b) 2009 16 11 12
$500 million 4.625% fixed-rate notes that mature in2015 (b) 2008 (7) (2) (3)
Total – pre-tax $ (3) $ (2)Less: income taxes 1 1
After- tax amounts $ (2) $ (1)
(a) The unrecognized gains / (losses) for the treasury rate locks are shown in accumulated other comprehensive income (AOCI)and will be recognized on a straight line basis to interest expense – net over the term of the underlying debt agreements. Uponsettlement of the treasury rate lock contracts, the cash received or paid is reflected within Noncontrolling interest transactionsand other in the financing section of the consolidated statement of cash flows. Refer to the table below summarizing theimpact of the company’s consolidated statements of income and AOCI for current period gain (loss) recognition.
(b) The notional amount of the treasury rate lock contracts are equal to the underlying debt instrument with the exception of thetreasury rate lock contract entered into to hedge the $600 million 4.50% fixed-rate notes that mature in 2019. The notionalamount of this contract was $500 million.
The following table summarizes the earnings impacts of derivative that are not designated as hedging instruments:
(Millions of dollars)Amount of Pre-Tax Gain (Loss)
Recognized in Earnings (a)
December 31, 2012 2011 2010
Derivatives Not Designated as Hedging InstrumentsCurrency contracts:
Balance sheet items:Debt-related $33 $(25) $(10)Other balance sheet items (1) (3) 5
Anticipated net income (4) (1) (4)
Total $28 $(29) $ (9)
77
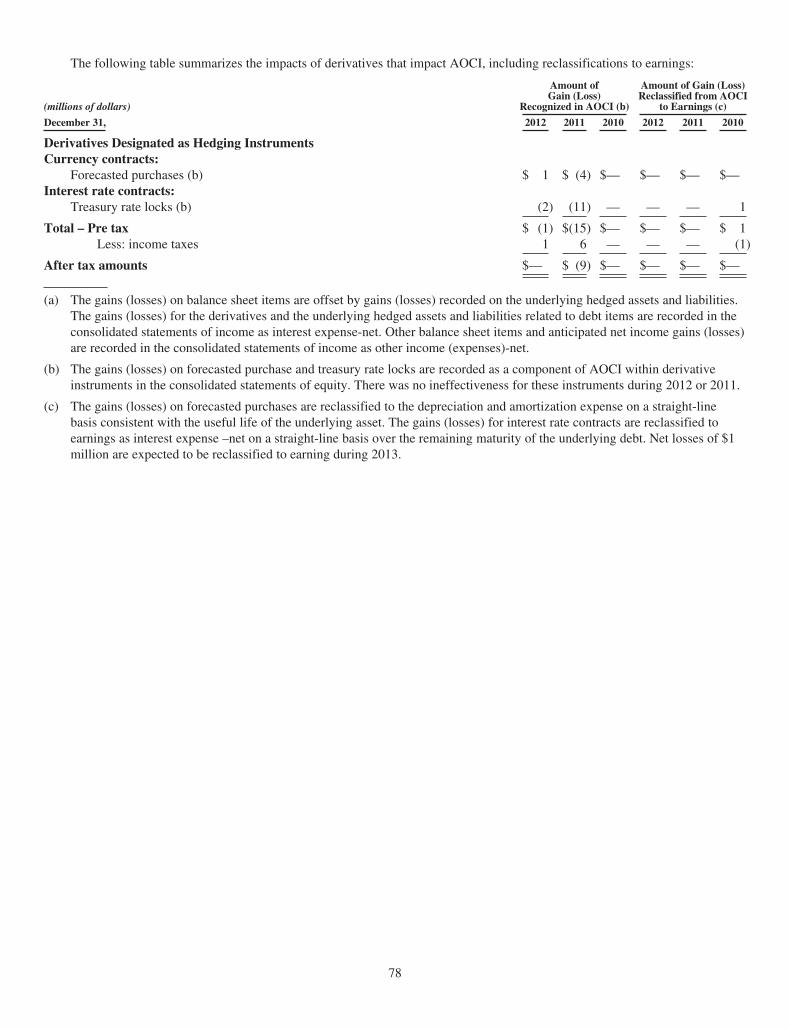
The following table summarizes the impacts of derivatives that impact AOCI, including reclassifications to earnings:
(millions of dollars)
Amount ofGain (Loss)
Recognized in AOCI (b)
Amount of Gain (Loss)Reclassified from AOCI
to Earnings (c)
December 31, 2012 2011 2010 2012 2011 2010
Derivatives Designated as Hedging InstrumentsCurrency contracts:
Forecasted purchases (b) $ 1 $ (4) $— $— $— $—Interest rate contracts:
Treasury rate locks (b) (2) (11) — — — 1
Total – Pre tax $ (1) $(15) $— $— $— $ 1Less: income taxes 1 6 — — — (1)
After tax amounts $— $ (9) $— $— $— $—
(a) The gains (losses) on balance sheet items are offset by gains (losses) recorded on the underlying hedged assets and liabilities.The gains (losses) for the derivatives and the underlying hedged assets and liabilities related to debt items are recorded in theconsolidated statements of income as interest expense-net. Other balance sheet items and anticipated net income gains (losses)are recorded in the consolidated statements of income as other income (expenses)-net.
(b) The gains (losses) on forecasted purchase and treasury rate locks are recorded as a component of AOCI within derivativeinstruments in the consolidated statements of equity. There was no ineffectiveness for these instruments during 2012 or 2011.
(c) The gains (losses) on forecasted purchases are reclassified to the depreciation and amortization expense on a straight-linebasis consistent with the useful life of the underlying asset. The gains (losses) for interest rate contracts are reclassified toearnings as interest expense –net on a straight-line basis over the remaining maturity of the underlying debt. Net losses of $1million are expected to be reclassified to earning during 2013.
78
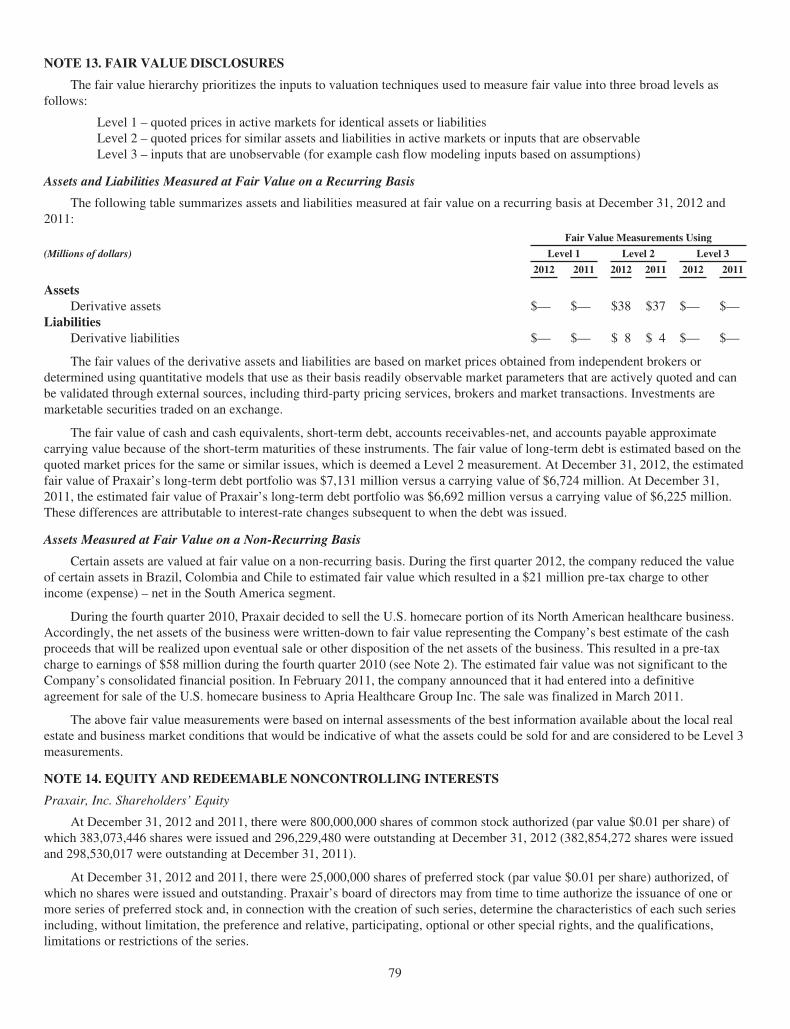
NOTE 13. FAIR VALUE DISCLOSURES
The fair value hierarchy prioritizes the inputs to valuation techniques used to measure fair value into three broad levels asfollows:
Level 1 – quoted prices in active markets for identical assets or liabilitiesLevel 2 – quoted prices for similar assets and liabilities in active markets or inputs that are observableLevel 3 – inputs that are unobservable (for example cash flow modeling inputs based on assumptions)
Assets and Liabilities Measured at Fair Value on a Recurring Basis
The following table summarizes assets and liabilities measured at fair value on a recurring basis at December 31, 2012 and2011:
Fair Value Measurements Using
(Millions of dollars) Level 1 Level 2 Level 3
2012 2011 2012 2011 2012 2011
AssetsDerivative assets $— $— $38 $37 $— $—
LiabilitiesDerivative liabilities $— $— $ 8 $ 4 $— $—
The fair values of the derivative assets and liabilities are based on market prices obtained from independent brokers ordetermined using quantitative models that use as their basis readily observable market parameters that are actively quoted and canbe validated through external sources, including third-party pricing services, brokers and market transactions. Investments aremarketable securities traded on an exchange.
The fair value of cash and cash equivalents, short-term debt, accounts receivables-net, and accounts payable approximatecarrying value because of the short-term maturities of these instruments. The fair value of long-term debt is estimated based on thequoted market prices for the same or similar issues, which is deemed a Level 2 measurement. At December 31, 2012, the estimatedfair value of Praxair’s long-term debt portfolio was $7,131 million versus a carrying value of $6,724 million. At December 31,2011, the estimated fair value of Praxair’s long-term debt portfolio was $6,692 million versus a carrying value of $6,225 million.These differences are attributable to interest-rate changes subsequent to when the debt was issued.
Assets Measured at Fair Value on a Non-Recurring Basis
Certain assets are valued at fair value on a non-recurring basis. During the first quarter 2012, the company reduced the valueof certain assets in Brazil, Colombia and Chile to estimated fair value which resulted in a $21 million pre-tax charge to otherincome (expense) – net in the South America segment.
During the fourth quarter 2010, Praxair decided to sell the U.S. homecare portion of its North American healthcare business.Accordingly, the net assets of the business were written-down to fair value representing the Company’s best estimate of the cashproceeds that will be realized upon eventual sale or other disposition of the net assets of the business. This resulted in a pre-taxcharge to earnings of $58 million during the fourth quarter 2010 (see Note 2). The estimated fair value was not significant to theCompany’s consolidated financial position. In February 2011, the company announced that it had entered into a definitiveagreement for sale of the U.S. homecare business to Apria Healthcare Group Inc. The sale was finalized in March 2011.
The above fair value measurements were based on internal assessments of the best information available about the local realestate and business market conditions that would be indicative of what the assets could be sold for and are considered to be Level 3measurements.
NOTE 14. EQUITY AND REDEEMABLE NONCONTROLLING INTERESTS
Praxair, Inc. Shareholders’ Equity
At December 31, 2012 and 2011, there were 800,000,000 shares of common stock authorized (par value $0.01 per share) ofwhich 383,073,446 shares were issued and 296,229,480 were outstanding at December 31, 2012 (382,854,272 shares were issuedand 298,530,017 were outstanding at December 31, 2011).
At December 31, 2012 and 2011, there were 25,000,000 shares of preferred stock (par value $0.01 per share) authorized, ofwhich no shares were issued and outstanding. Praxair’s board of directors may from time to time authorize the issuance of one ormore series of preferred stock and, in connection with the creation of such series, determine the characteristics of each such seriesincluding, without limitation, the preference and relative, participating, optional or other special rights, and the qualifications,limitations or restrictions of the series.
79
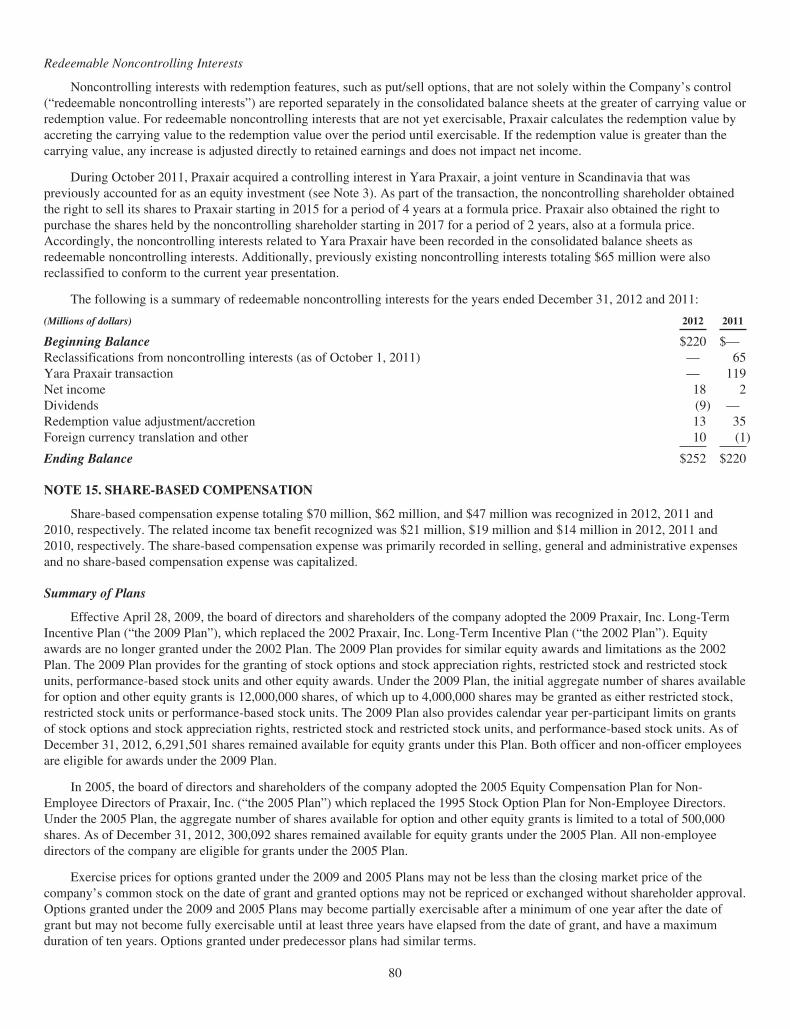
Redeemable Noncontrolling Interests
Noncontrolling interests with redemption features, such as put/sell options, that are not solely within the Company’s control(“redeemable noncontrolling interests”) are reported separately in the consolidated balance sheets at the greater of carrying value orredemption value. For redeemable noncontrolling interests that are not yet exercisable, Praxair calculates the redemption value byaccreting the carrying value to the redemption value over the period until exercisable. If the redemption value is greater than thecarrying value, any increase is adjusted directly to retained earnings and does not impact net income.
During October 2011, Praxair acquired a controlling interest in Yara Praxair, a joint venture in Scandinavia that waspreviously accounted for as an equity investment (see Note 3). As part of the transaction, the noncontrolling shareholder obtainedthe right to sell its shares to Praxair starting in 2015 for a period of 4 years at a formula price. Praxair also obtained the right topurchase the shares held by the noncontrolling shareholder starting in 2017 for a period of 2 years, also at a formula price.Accordingly, the noncontrolling interests related to Yara Praxair have been recorded in the consolidated balance sheets asredeemable noncontrolling interests. Additionally, previously existing noncontrolling interests totaling $65 million were alsoreclassified to conform to the current year presentation.
The following is a summary of redeemable noncontrolling interests for the years ended December 31, 2012 and 2011:
(Millions of dollars) 2012 2011
Beginning Balance $220 $—Reclassifications from noncontrolling interests (as of October 1, 2011) — 65Yara Praxair transaction — 119Net income 18 2Dividends (9) —Redemption value adjustment/accretion 13 35Foreign currency translation and other 10 (1)
Ending Balance $252 $220
NOTE 15. SHARE-BASED COMPENSATION
Share-based compensation expense totaling $70 million, $62 million, and $47 million was recognized in 2012, 2011 and2010, respectively. The related income tax benefit recognized was $21 million, $19 million and $14 million in 2012, 2011 and2010, respectively. The share-based compensation expense was primarily recorded in selling, general and administrative expensesand no share-based compensation expense was capitalized.
Summary of Plans
Effective April 28, 2009, the board of directors and shareholders of the company adopted the 2009 Praxair, Inc. Long-TermIncentive Plan (“the 2009 Plan”), which replaced the 2002 Praxair, Inc. Long-Term Incentive Plan (“the 2002 Plan”). Equityawards are no longer granted under the 2002 Plan. The 2009 Plan provides for similar equity awards and limitations as the 2002Plan. The 2009 Plan provides for the granting of stock options and stock appreciation rights, restricted stock and restricted stockunits, performance-based stock units and other equity awards. Under the 2009 Plan, the initial aggregate number of shares availablefor option and other equity grants is 12,000,000 shares, of which up to 4,000,000 shares may be granted as either restricted stock,restricted stock units or performance-based stock units. The 2009 Plan also provides calendar year per-participant limits on grantsof stock options and stock appreciation rights, restricted stock and restricted stock units, and performance-based stock units. As ofDecember 31, 2012, 6,291,501 shares remained available for equity grants under this Plan. Both officer and non-officer employeesare eligible for awards under the 2009 Plan.
In 2005, the board of directors and shareholders of the company adopted the 2005 Equity Compensation Plan for Non-Employee Directors of Praxair, Inc. (“the 2005 Plan”) which replaced the 1995 Stock Option Plan for Non-Employee Directors.Under the 2005 Plan, the aggregate number of shares available for option and other equity grants is limited to a total of 500,000shares. As of December 31, 2012, 300,092 shares remained available for equity grants under the 2005 Plan. All non-employeedirectors of the company are eligible for grants under the 2005 Plan.
Exercise prices for options granted under the 2009 and 2005 Plans may not be less than the closing market price of thecompany’s common stock on the date of grant and granted options may not be repriced or exchanged without shareholder approval.Options granted under the 2009 and 2005 Plans may become partially exercisable after a minimum of one year after the date ofgrant but may not become fully exercisable until at least three years have elapsed from the date of grant, and have a maximumduration of ten years. Options granted under predecessor plans had similar terms.
80
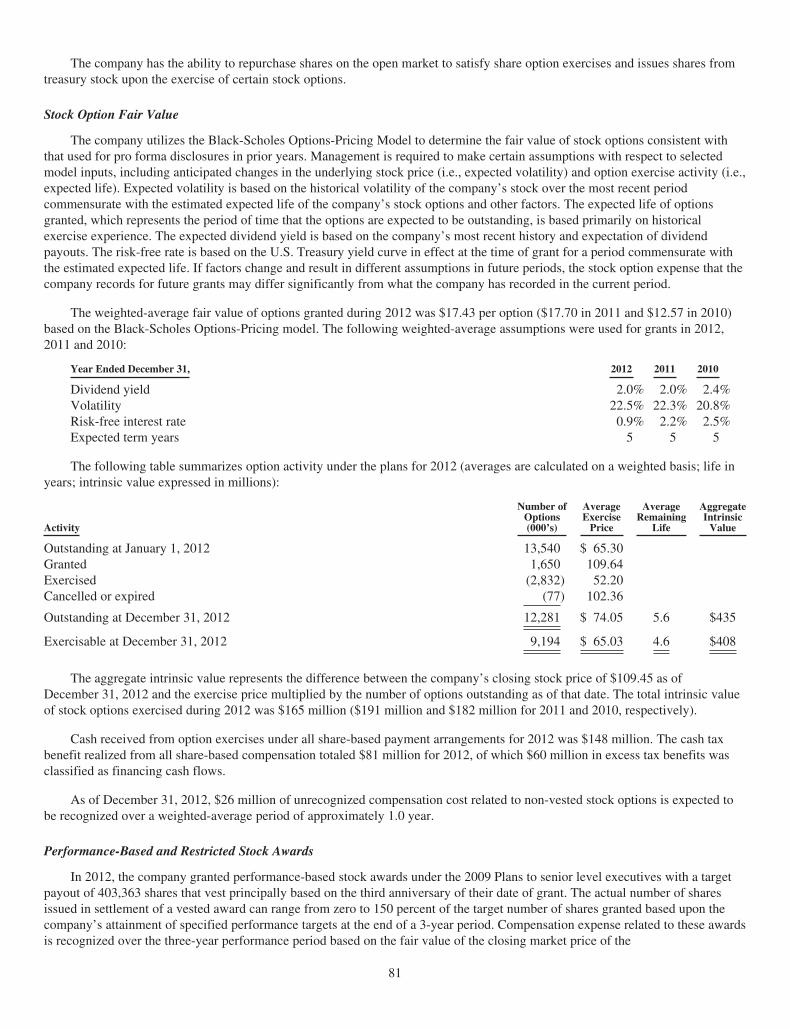
The company has the ability to repurchase shares on the open market to satisfy share option exercises and issues shares fromtreasury stock upon the exercise of certain stock options.
Stock Option Fair Value
The company utilizes the Black-Scholes Options-Pricing Model to determine the fair value of stock options consistent withthat used for pro forma disclosures in prior years. Management is required to make certain assumptions with respect to selectedmodel inputs, including anticipated changes in the underlying stock price (i.e., expected volatility) and option exercise activity (i.e.,expected life). Expected volatility is based on the historical volatility of the company’s stock over the most recent periodcommensurate with the estimated expected life of the company’s stock options and other factors. The expected life of optionsgranted, which represents the period of time that the options are expected to be outstanding, is based primarily on historicalexercise experience. The expected dividend yield is based on the company’s most recent history and expectation of dividendpayouts. The risk-free rate is based on the U.S. Treasury yield curve in effect at the time of grant for a period commensurate withthe estimated expected life. If factors change and result in different assumptions in future periods, the stock option expense that thecompany records for future grants may differ significantly from what the company has recorded in the current period.
The weighted-average fair value of options granted during 2012 was $17.43 per option ($17.70 in 2011 and $12.57 in 2010)based on the Black-Scholes Options-Pricing model. The following weighted-average assumptions were used for grants in 2012,2011 and 2010:
Year Ended December 31, 2012 2011 2010
Dividend yield 2.0% 2.0% 2.4%Volatility 22.5% 22.3% 20.8%Risk-free interest rate 0.9% 2.2% 2.5%Expected term years 5 5 5
The following table summarizes option activity under the plans for 2012 (averages are calculated on a weighted basis; life inyears; intrinsic value expressed in millions):
Activity
Number ofOptions(000’s)
AverageExercise
Price
AverageRemaining
Life
AggregateIntrinsic
Value
Outstanding at January 1, 2012 13,540 $ 65.30Granted 1,650 109.64Exercised (2,832) 52.20Cancelled or expired (77) 102.36
Outstanding at December 31, 2012 12,281 $ 74.05 5.6 $435
Exercisable at December 31, 2012 9,194 $ 65.03 4.6 $408
The aggregate intrinsic value represents the difference between the company’s closing stock price of $109.45 as ofDecember 31, 2012 and the exercise price multiplied by the number of options outstanding as of that date. The total intrinsic valueof stock options exercised during 2012 was $165 million ($191 million and $182 million for 2011 and 2010, respectively).
Cash received from option exercises under all share-based payment arrangements for 2012 was $148 million. The cash taxbenefit realized from all share-based compensation totaled $81 million for 2012, of which $60 million in excess tax benefits wasclassified as financing cash flows.
As of December 31, 2012, $26 million of unrecognized compensation cost related to non-vested stock options is expected tobe recognized over a weighted-average period of approximately 1.0 year.
Performance-Based and Restricted Stock Awards
In 2012, the company granted performance-based stock awards under the 2009 Plans to senior level executives with a targetpayout of 403,363 shares that vest principally based on the third anniversary of their date of grant. The actual number of sharesissued in settlement of a vested award can range from zero to 150 percent of the target number of shares granted based upon thecompany’s attainment of specified performance targets at the end of a 3-year period. Compensation expense related to these awardsis recognized over the three-year performance period based on the fair value of the closing market price of the
81
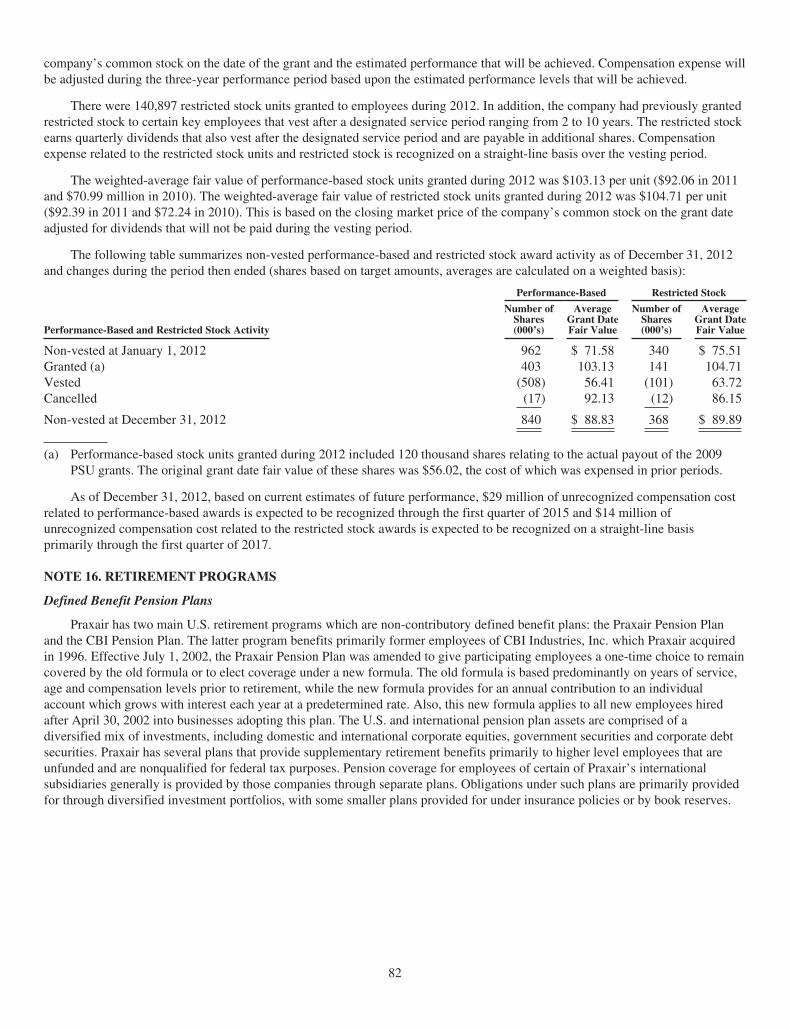
company’s common stock on the date of the grant and the estimated performance that will be achieved. Compensation expense willbe adjusted during the three-year performance period based upon the estimated performance levels that will be achieved.
There were 140,897 restricted stock units granted to employees during 2012. In addition, the company had previously grantedrestricted stock to certain key employees that vest after a designated service period ranging from 2 to 10 years. The restricted stockearns quarterly dividends that also vest after the designated service period and are payable in additional shares. Compensationexpense related to the restricted stock units and restricted stock is recognized on a straight-line basis over the vesting period.
The weighted-average fair value of performance-based stock units granted during 2012 was $103.13 per unit ($92.06 in 2011and $70.99 million in 2010). The weighted-average fair value of restricted stock units granted during 2012 was $104.71 per unit($92.39 in 2011 and $72.24 in 2010). This is based on the closing market price of the company’s common stock on the grant dateadjusted for dividends that will not be paid during the vesting period.
The following table summarizes non-vested performance-based and restricted stock award activity as of December 31, 2012and changes during the period then ended (shares based on target amounts, averages are calculated on a weighted basis):
Performance-Based Restricted Stock
Performance-Based and Restricted Stock Activity
Number ofShares(000’s)
AverageGrant DateFair Value
Number ofShares(000’s)
AverageGrant DateFair Value
Non-vested at January 1, 2012 962 $ 71.58 340 $ 75.51Granted (a) 403 103.13 141 104.71Vested (508) 56.41 (101) 63.72Cancelled (17) 92.13 (12) 86.15
Non-vested at December 31, 2012 840 $ 88.83 368 $ 89.89
(a) Performance-based stock units granted during 2012 included 120 thousand shares relating to the actual payout of the 2009PSU grants. The original grant date fair value of these shares was $56.02, the cost of which was expensed in prior periods.
As of December 31, 2012, based on current estimates of future performance, $29 million of unrecognized compensation costrelated to performance-based awards is expected to be recognized through the first quarter of 2015 and $14 million ofunrecognized compensation cost related to the restricted stock awards is expected to be recognized on a straight-line basisprimarily through the first quarter of 2017.
NOTE 16. RETIREMENT PROGRAMS
Defined Benefit Pension Plans
Praxair has two main U.S. retirement programs which are non-contributory defined benefit plans: the Praxair Pension Planand the CBI Pension Plan. The latter program benefits primarily former employees of CBI Industries, Inc. which Praxair acquiredin 1996. Effective July 1, 2002, the Praxair Pension Plan was amended to give participating employees a one-time choice to remaincovered by the old formula or to elect coverage under a new formula. The old formula is based predominantly on years of service,age and compensation levels prior to retirement, while the new formula provides for an annual contribution to an individualaccount which grows with interest each year at a predetermined rate. Also, this new formula applies to all new employees hiredafter April 30, 2002 into businesses adopting this plan. The U.S. and international pension plan assets are comprised of adiversified mix of investments, including domestic and international corporate equities, government securities and corporate debtsecurities. Praxair has several plans that provide supplementary retirement benefits primarily to higher level employees that areunfunded and are nonqualified for federal tax purposes. Pension coverage for employees of certain of Praxair’s internationalsubsidiaries generally is provided by those companies through separate plans. Obligations under such plans are primarily providedfor through diversified investment portfolios, with some smaller plans provided for under insurance policies or by book reserves.
82
Multi-employer Pension Plans
In the United States Praxair participates in seven multi-employer defined benefit pension plans (“MEP”) pursuant to the termsof collective bargaining agreements covering approximately 200 union-represented employees. The collective bargainingagreements expire on different dates through 2015. In connection with such agreements, the Company is required to make periodiccontributions to the MEPs in accordance with the terms of the respective collective bargaining agreements. Praxair’s participationin these plans is not significant either at the plan level or in the aggregate. Praxair’s contributions to these plans were $1 million in2012, 2011 and 2010 (the cost is not included in the tables that follow). For all MEPs Praxair’s contributions were significantly lessthan 1% of the total contributions to each plan for 2011 and 2010. Total 2012 contributions were not yet available from the MEPs.
Praxair has obtained the most recently available Pension Protection Act (“PPA”) zone status letters from the Trustees of theMEPs. The PPA classifies MEPs as either Red, Yellow or Green zone plans. Among other factors, plans in the Red zone aregenerally less than 65 percent funded; plans in the Yellow zone are generally 65 to 80 percent funded; and plans in the Green zoneare generally at least 80 percent funded. According to the most current data available, three of the MEPs that the Companyparticipates are in a Red zone status; two are in a Yellow zone status; and two are in a Green zone status. As of December 31,2012, the five Red and Yellow Zone plans have pending or have implemented financial improvement or rehabilitation plans.Praxair does not currently anticipate significant future obligations due to the funding status of these plans. If Praxair determined itwas probable that it would withdraw from an MEP, the Company would record a liability for its portion of the MEP’s unfundedpension obligations, as calculated at that time. Historically, such withdrawal payments have not been significant.
Defined Contribution Plans
Praxair’s U.S. business employees are eligible to participate in the Praxair defined contribution savings plan. Employees maycontribute up to 40% of their compensation, subject to the maximum allowable by IRS regulations. For the US packaged gasesbusiness, company contributions to this plan are calculated as a percentage of salary based on age plus service. U.S. employeesother than those in the packaged gases business have company contributions to this plan calculated on a graduated scale based onemployee contributions to the plan. The cost for these defined contribution plans was $24 million in 2012, and $22 million in 2011and 2010 (the cost is not included in the tables that follow).
The defined contribution plans includes a non-leveraged employee stock ownership plan (“ESOP”) which covers allemployees participating in this plan. The collective number of shares of Praxair common stock in the two ESOPs totaled 3,619,069at December 31, 2012.
Certain international subsidiaries of the company also sponsor defined contribution plans where contributions are determinedunder various formulas. The cost for these plans was $12 million in 2012 and 2011, and $10 million in 2010 (the cost is notincluded in the tables that follow).
Postretirement Benefits Other Than Pensions (OPEB)
Praxair provides health care and life insurance benefits to certain eligible retired employees. These benefits are providedthrough various insurance companies and healthcare providers. Praxair is also obligated to make payments for a portion ofpostretirement benefits related to retirees of Praxair’s former parent. Additionally, as part of the CBI acquisition in 1996, Praxairassumed responsibility for healthcare and life insurance benefit obligations for CBI’s retired employees. All postretirementhealthcare programs have cost caps that limit the company’s exposure to future cost increases. In addition, as part of the retirementelections made for July 1, 2002, eligible employees were given the choice of maintaining coverage in the current retiree medicaldesign (as may be amended from time to time), or to move to a design whereby coverage would be provided, but with no Praxairsubsidy whatsoever. Also, all new employees hired after April 30, 2002 into a business adopting these plans will not receive acompany subsidy. Praxair does not currently fund its postretirement benefits obligations. Praxair’s retiree plans may be changed orterminated by Praxair at any time for any reason with no liability to current or future retirees.
Praxair uses a measurement date of December 31 for its pension and other post-retirement benefit plans.
83
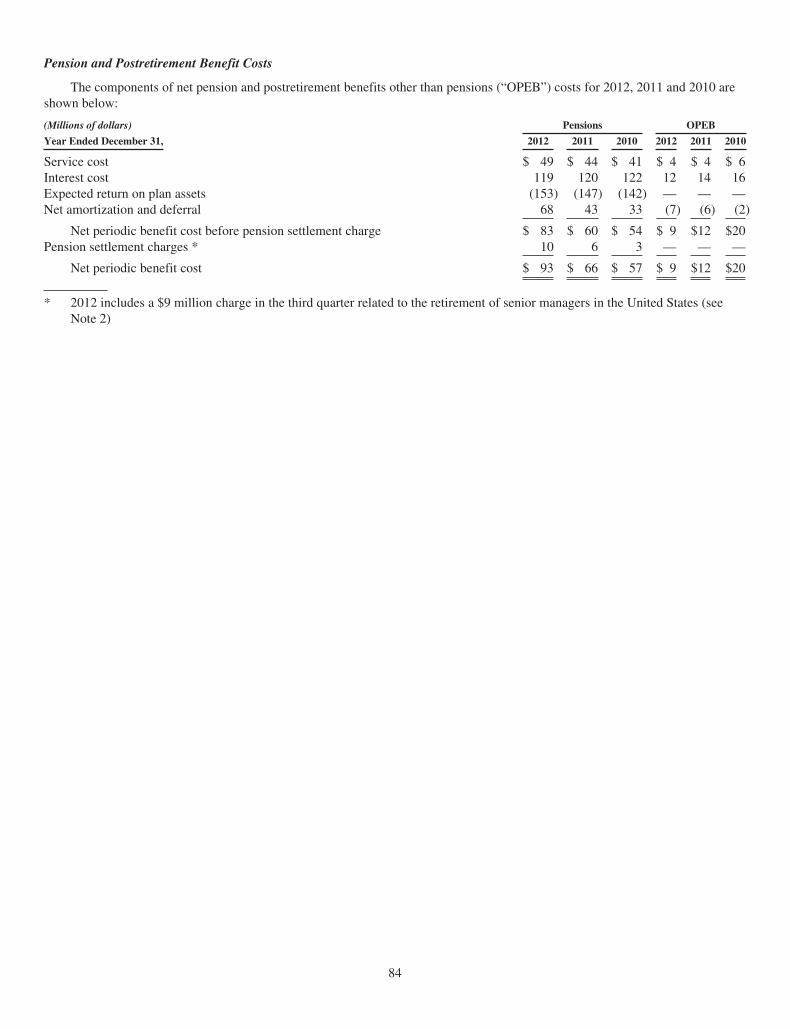
Pension and Postretirement Benefit Costs
The components of net pension and postretirement benefits other than pensions (“OPEB”) costs for 2012, 2011 and 2010 areshown below:
(Millions of dollars) Pensions OPEB
Year Ended December 31, 2012 2011 2010 2012 2011 2010
Service cost $ 49 $ 44 $ 41 $ 4 $ 4 $ 6Interest cost 119 120 122 12 14 16Expected return on plan assets (153) (147) (142) — — —Net amortization and deferral 68 43 33 (7) (6) (2)
Net periodic benefit cost before pension settlement charge $ 83 $ 60 $ 54 $ 9 $12 $20Pension settlement charges * 10 6 3 — — —
Net periodic benefit cost $ 93 $ 66 $ 57 $ 9 $12 $20
* 2012 includes a $9 million charge in the third quarter related to the retirement of senior managers in the United States (seeNote 2)
84
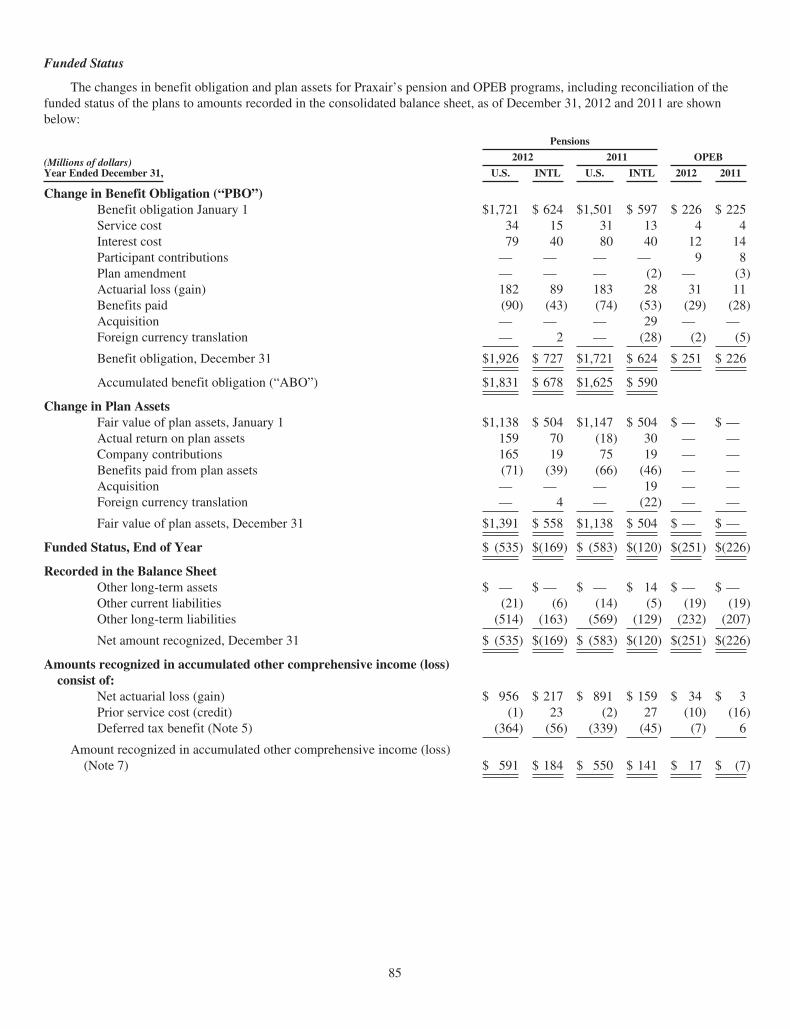
Funded Status
The changes in benefit obligation and plan assets for Praxair’s pension and OPEB programs, including reconciliation of thefunded status of the plans to amounts recorded in the consolidated balance sheet, as of December 31, 2012 and 2011 are shownbelow:
(Millions of dollars)Year Ended December 31,
Pensions
2012 2011 OPEB
U.S. INTL U.S. INTL 2012 2011
Change in Benefit Obligation (“PBO”)Benefit obligation January 1 $1,721 $ 624 $1,501 $ 597 $ 226 $ 225Service cost 34 15 31 13 4 4Interest cost 79 40 80 40 12 14Participant contributions — — — — 9 8Plan amendment — — — (2) — (3)Actuarial loss (gain) 182 89 183 28 31 11Benefits paid (90) (43) (74) (53) (29) (28)Acquisition — — — 29 — —Foreign currency translation — 2 — (28) (2) (5)
Benefit obligation, December 31 $1,926 $ 727 $1,721 $ 624 $ 251 $ 226
Accumulated benefit obligation (“ABO”) $1,831 $ 678 $1,625 $ 590
Change in Plan AssetsFair value of plan assets, January 1 $1,138 $ 504 $1,147 $ 504 $ — $ —Actual return on plan assets 159 70 (18) 30 — —Company contributions 165 19 75 19 — —Benefits paid from plan assets (71) (39) (66) (46) — —Acquisition — — — 19 — —Foreign currency translation — 4 — (22) — —
Fair value of plan assets, December 31 $1,391 $ 558 $1,138 $ 504 $ — $ —
Funded Status, End of Year $ (535) $(169) $ (583) $(120) $(251) $(226)
Recorded in the Balance SheetOther long-term assets $ — $ — $ — $ 14 $ — $ —Other current liabilities (21) (6) (14) (5) (19) (19)Other long-term liabilities (514) (163) (569) (129) (232) (207)
Net amount recognized, December 31 $ (535) $(169) $ (583) $(120) $(251) $(226)
Amounts recognized in accumulated other comprehensive income (loss)consist of:
Net actuarial loss (gain) $ 956 $ 217 $ 891 $ 159 $ 34 $ 3Prior service cost (credit) (1) 23 (2) 27 (10) (16)Deferred tax benefit (Note 5) (364) (56) (339) (45) (7) 6
Amount recognized in accumulated other comprehensive income (loss)(Note 7) $ 591 $ 184 $ 550 $ 141 $ 17 $ (7)
85
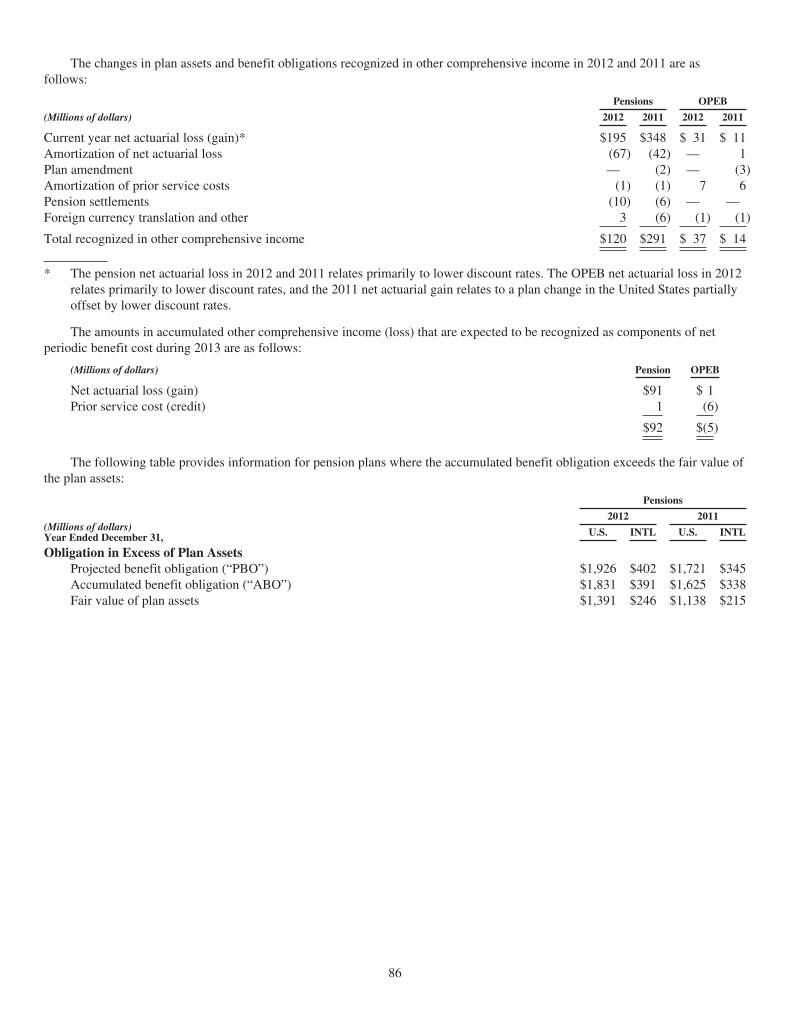
The changes in plan assets and benefit obligations recognized in other comprehensive income in 2012 and 2011 are asfollows:
Pensions OPEB
(Millions of dollars) 2012 2011 2012 2011
Current year net actuarial loss (gain)* $195 $348 $ 31 $ 11Amortization of net actuarial loss (67) (42) — 1Plan amendment — (2) — (3)Amortization of prior service costs (1) (1) 7 6Pension settlements (10) (6) — —Foreign currency translation and other 3 (6) (1) (1)
Total recognized in other comprehensive income $120 $291 $ 37 $ 14
* The pension net actuarial loss in 2012 and 2011 relates primarily to lower discount rates. The OPEB net actuarial loss in 2012relates primarily to lower discount rates, and the 2011 net actuarial gain relates to a plan change in the United States partiallyoffset by lower discount rates.
The amounts in accumulated other comprehensive income (loss) that are expected to be recognized as components of netperiodic benefit cost during 2013 are as follows:
(Millions of dollars) Pension OPEB
Net actuarial loss (gain) $91 $ 1Prior service cost (credit) 1 (6)
$92 $(5)
The following table provides information for pension plans where the accumulated benefit obligation exceeds the fair value ofthe plan assets:
(Millions of dollars)Year Ended December 31,
Pensions
2012 2011
U.S. INTL U.S. INTL
Obligation in Excess of Plan AssetsProjected benefit obligation (“PBO”) $1,926 $402 $1,721 $345Accumulated benefit obligation (“ABO”) $1,831 $391 $1,625 $338Fair value of plan assets $1,391 $246 $1,138 $215
86
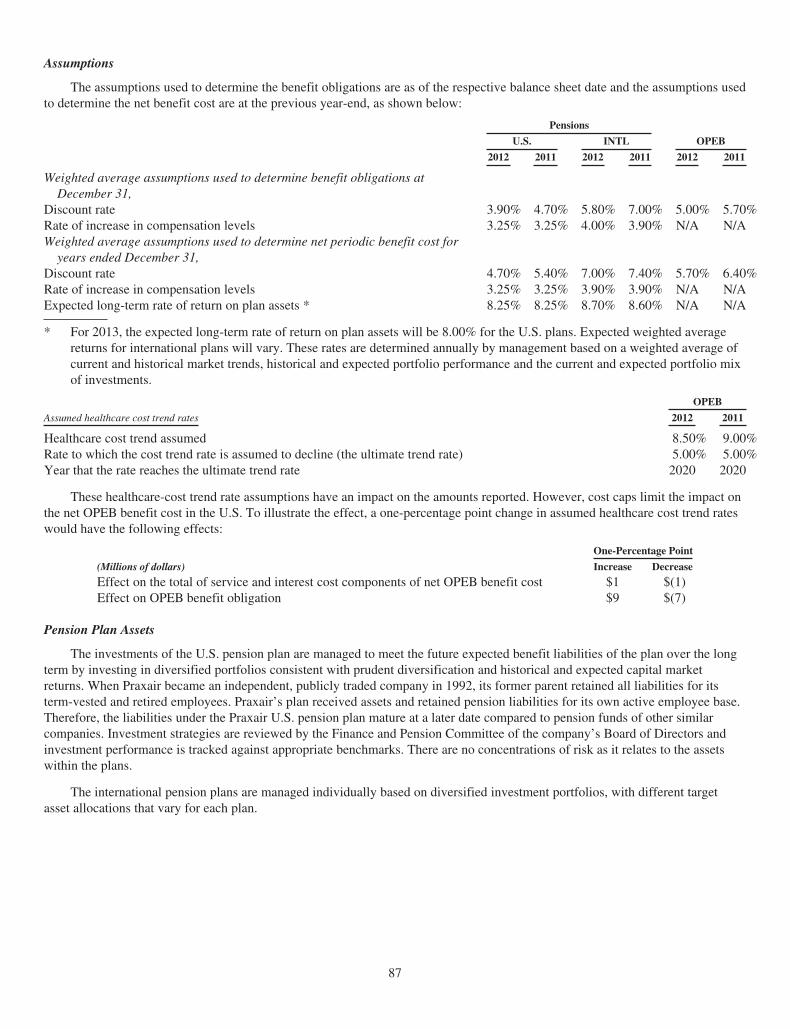
Assumptions
The assumptions used to determine the benefit obligations are as of the respective balance sheet date and the assumptions usedto determine the net benefit cost are at the previous year-end, as shown below:
Pensions
U.S. INTL OPEB
2012 2011 2012 2011 2012 2011
Weighted average assumptions used to determine benefit obligations atDecember 31,
Discount rate 3.90% 4.70% 5.80% 7.00% 5.00% 5.70%Rate of increase in compensation levels 3.25% 3.25% 4.00% 3.90% N/A N/AWeighted average assumptions used to determine net periodic benefit cost for
years ended December 31,Discount rate 4.70% 5.40% 7.00% 7.40% 5.70% 6.40%Rate of increase in compensation levels 3.25% 3.25% 3.90% 3.90% N/A N/AExpected long-term rate of return on plan assets * 8.25% 8.25% 8.70% 8.60% N/A N/A
* For 2013, the expected long-term rate of return on plan assets will be 8.00% for the U.S. plans. Expected weighted averagereturns for international plans will vary. These rates are determined annually by management based on a weighted average ofcurrent and historical market trends, historical and expected portfolio performance and the current and expected portfolio mixof investments.
OPEB
Assumed healthcare cost trend rates 2012 2011
Healthcare cost trend assumed 8.50% 9.00%Rate to which the cost trend rate is assumed to decline (the ultimate trend rate) 5.00% 5.00%Year that the rate reaches the ultimate trend rate 2020 2020
These healthcare-cost trend rate assumptions have an impact on the amounts reported. However, cost caps limit the impact onthe net OPEB benefit cost in the U.S. To illustrate the effect, a one-percentage point change in assumed healthcare cost trend rateswould have the following effects:
One-Percentage Point
(Millions of dollars) Increase Decrease
Effect on the total of service and interest cost components of net OPEB benefit cost $1 $(1)Effect on OPEB benefit obligation $9 $(7)
Pension Plan Assets
The investments of the U.S. pension plan are managed to meet the future expected benefit liabilities of the plan over the longterm by investing in diversified portfolios consistent with prudent diversification and historical and expected capital marketreturns. When Praxair became an independent, publicly traded company in 1992, its former parent retained all liabilities for itsterm-vested and retired employees. Praxair’s plan received assets and retained pension liabilities for its own active employee base.Therefore, the liabilities under the Praxair U.S. pension plan mature at a later date compared to pension funds of other similarcompanies. Investment strategies are reviewed by the Finance and Pension Committee of the company’s Board of Directors andinvestment performance is tracked against appropriate benchmarks. There are no concentrations of risk as it relates to the assetswithin the plans.
The international pension plans are managed individually based on diversified investment portfolios, with different targetasset allocations that vary for each plan.
87
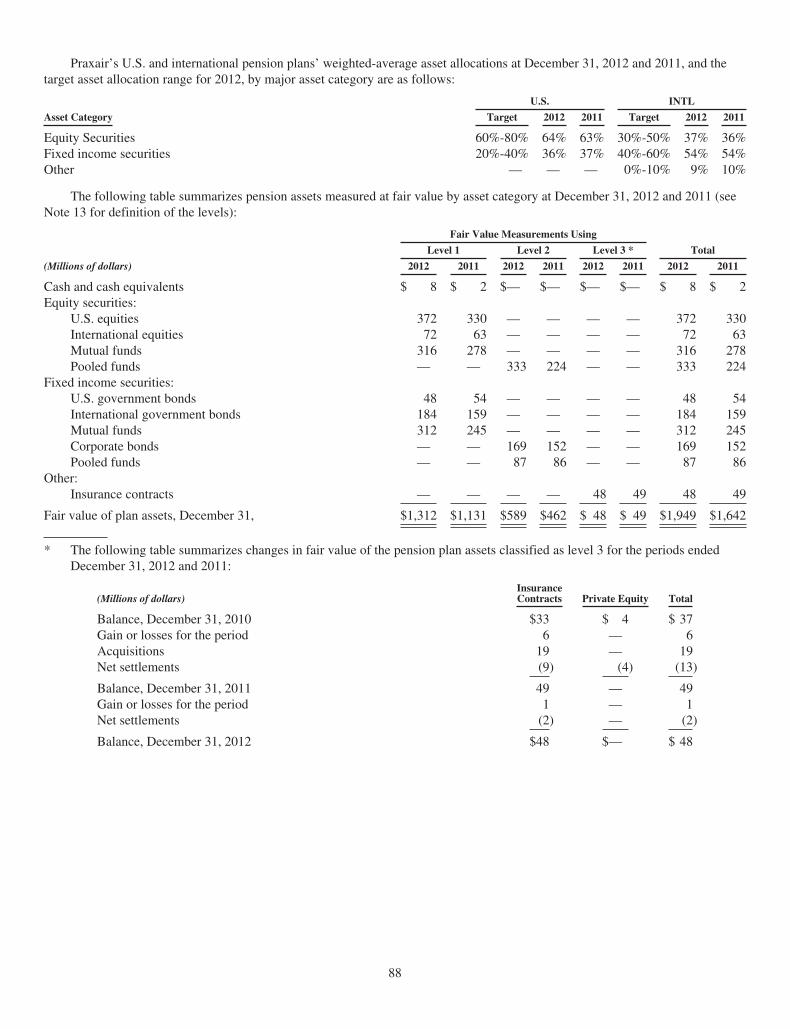
Praxair’s U.S. and international pension plans’ weighted-average asset allocations at December 31, 2012 and 2011, and thetarget asset allocation range for 2012, by major asset category are as follows:
U.S. INTL
Asset Category Target 2012 2011 Target 2012 2011
Equity Securities 60%-80% 64% 63% 30%-50% 37% 36%Fixed income securities 20%-40% 36% 37% 40%-60% 54% 54%Other — — — 0%-10% 9% 10%
The following table summarizes pension assets measured at fair value by asset category at December 31, 2012 and 2011 (seeNote 13 for definition of the levels):
Fair Value Measurements Using
Level 1 Level 2 Level 3 * Total
(Millions of dollars) 2012 2011 2012 2011 2012 2011 2012 2011
Cash and cash equivalents $ 8 $ 2 $— $— $— $— $ 8 $ 2Equity securities:
U.S. equities 372 330 — — — — 372 330International equities 72 63 — — — — 72 63Mutual funds 316 278 — — — — 316 278Pooled funds — — 333 224 — — 333 224
Fixed income securities:U.S. government bonds 48 54 — — — — 48 54International government bonds 184 159 — — — — 184 159Mutual funds 312 245 — — — — 312 245Corporate bonds — — 169 152 — — 169 152Pooled funds — — 87 86 — — 87 86
Other:Insurance contracts — — — — 48 49 48 49
Fair value of plan assets, December 31, $1,312 $1,131 $589 $462 $ 48 $ 49 $1,949 $1,642
* The following table summarizes changes in fair value of the pension plan assets classified as level 3 for the periods endedDecember 31, 2012 and 2011:
(Millions of dollars)InsuranceContracts Private Equity Total
Balance, December 31, 2010 $33 $ 4 $ 37Gain or losses for the period 6 — 6Acquisitions 19 — 19Net settlements (9) (4) (13)
Balance, December 31, 2011 49 — 49Gain or losses for the period 1 — 1Net settlements (2) — (2)
Balance, December 31, 2012 $48 $— $ 48
88
The descriptions and fair value methodologies for the U.S. and International pension plan assets are as follows:
Cash and Cash Equivalents – This category includes cash and short-term interest bearing investments with maturities of threemonths or less. Investments are valued at cost plus accrued interest. Cash and cash equivalents are classified within level 1 of thevaluation hierarchy.
Equity Securities – This category is comprised of shares of common stock in U.S. and international companies from a diverseset of industries and size. Common stock is valued at the closing market price reported on a U.S. or international exchange wherethe security is actively traded. Equity securities are classified within level 1 of the valuation hierarchy.
Mutual Funds and Pooled Funds – This category consists of publicly and privately managed funds that invest primarily inmarketable equity and fixed income securities. The fair value of these investments is determined by reference to the net asset valueof the underlying securities of the fund. Shares of publicly traded mutual funds are valued at the net asset value quoted on theexchange where the fund is traded and are classified as level 1 within the valuation hierarchy. Units of pooled funds are valued atthe per unit net asset value determined by the fund manager and are classified as level 2 within the valuation hierarchy.
U.S. and International Government Bonds – This category includes U.S. treasuries, U.S. federal agency obligations andinternational government debt. The majority of these investments are valued at the closing market prices reported on the exchangewhere the security is traded and are classified as level 1 within the valuation hierarchy. If quoted market prices are not available fora specific government security, the fair value is determined using quoted prices of similar securities in active markets and isclassified as level 2 within the valuation hierarchy.
Corporate Bonds – This category is comprised of corporate bonds of U.S. and international companies from a diverse set ofindustries and size. The fair values for U.S. and international corporate bonds are determined using quoted prices of similarsecurities in active markets and observable data or broker or dealer quotations. The fair values for these investments are classifiedas level 2 within the valuation hierarchy.
Insurance Contracts – The fair value of insurance contracts is determined based on the cash surrender value of the insurancecontract, which is determined based on such factors as the fair value of the underlying assets and discounted cash flow. Thesecontracts are with highly rated insurance companies. Insurance contracts are classified within level 3 of the valuation hierarchy.
Contributions
Pension contributions were $184 million in 2012, $94 million in 2011 and $124 million in 2010. Estimates of 2013contributions are in the range of $50 million.
Estimated Future Benefit Payments
The following table presents estimated future benefit payments, net of participants contributions:
(Millions of dollars) Pensions
Year Ended December 31, U.S. INTL OPEB
2013 $99 $38 $192014 98 38 202015 98 38 202016 101 40 192017 107 41 182018 – 2022 594 217 79
NOTE 17. COMMITMENTS AND CONTINGENCIES
The company accrues non income-tax liabilities for contingencies when management believes that a loss is probable and theamounts can be reasonably estimated, while contingent gains are recognized only when realized. In the event any losses aresustained in excess of accruals, they will be charged against income at that time. Attorney fees are recorded as incurred.Commitments represent obligations, such as those for future purchases of goods or services, that are not yet recorded on thecompany’s balance sheet as liabilities. The company records liabilities for commitments when incurred (i.e., when the goods orservices are received).
89
Contingent Liabilities
Praxair is subject to various lawsuits and government investigations that arise from time to time in the ordinary course ofbusiness. These actions are based upon alleged environmental, tax, antitrust and personal injury claims, among others. Praxair hasstrong defenses in these cases and intends to defend itself vigorously. However, it is possible that the company may incur losses inconnection with some of these actions in excess of accrued liabilities. Management does not anticipate that in the aggregate suchlosses would have a material adverse effect on the company’s consolidated financial position or liquidity; however, it is possiblethat the final outcomes could have a significant impact on the company’s reported results of operations in any given period.
Among such matters are:
• Claims by the Brazilian taxing authorities against several of the company’s Brazilian subsidiaries relating to non-incomeand income tax matters.
During May 2009, the Brazilian government published Law 11941/2009 instituting a new voluntary amnesty program(“Refis Program”) which allowed Brazilian companies to settle certain federal tax disputes at reduced amounts. Duringthe 2009 third quarter, Praxair decided that it was economically beneficial to settle many of its outstanding federal taxdisputes and these disputes were enrolled in the Refis Program and settled. The final settlement related to the RefisProgram is subject to final calculation and review by the Brazilian federal government and, although the timing is verydifficult to estimate, the company currently anticipates this review will conclude during the next year. Any differencesfrom amounts recorded will be adjusted to income at that time.
After enrollment in the amnesty programs, at December 31, 2012 the most significant remaining claims relate to stateVAT tax matters associated with procedural issues and a federal income tax matter where the taxing authorities arechallenging the tax rate that should be applied to income generated by a subsidiary company. The total estimatedexposure relating to such claims, including interest and penalties, as appropriate, is approximately $196 million. Praxairhas not recorded any liabilities related to such claims based on management judgments, after considering judgments andopinions of outside counsel. Because litigation in Brazil historically takes many years to resolve, it is very difficult toestimate the timing of resolution of these matters; however, it is possible that certain of these matters may be resolvedwithin the near term. The company is vigorously defending against the proceedings.
• On September 1, 2010, CADE (“Brazilian Administrative Council for Economic Defense”) announced allegedanticompetitive activity on the part of five industrial gas companies in Brazil and imposed fines on all five companies.Originally, CADE imposed a civil fine of R$2.2 billion Brazilian reais (US$1.1 billion) against White Martins, theBrazil-based subsidiary of Praxair, Inc. In response to a motion for clarification, the fine was reduced to R$1.7 billionBrazilian reais (US$830 million) due to a calculation error made by CADE. On September 2, 2010, Praxair issued a pressrelease and filed a report on Form 8-K rejecting all claims and stating that the fine represents a gross and arbitrarydisregard of Brazilian law.
On October 19, 2010, White Martins filed an annulment petition (“appeal”) with the Federal Court in Brasilia seeking tohave the fine against White Martins overturned. In order to suspend payment of the fine pending the completion of theappeal process, Brazilian law required that the company tender a form of guarantee in the amount of the fine as security.Currently, 50% of the guarantee is satisfied by letters of credit with a financial institution and 50% of the guarantee issatisfied by equity of a Brazilian subsidiary.
Praxair strongly believes that the allegations are without merit and that the fine will be entirely overturned during theappeal process. The company further believes that it has strong defenses and will vigorously defend against theallegations and related fine up to such levels of the Federal Courts in Brazil as may be necessary. Because appeals inBrazil historically take many years to resolve, it is very difficult to estimate when the appeal will be finally decided.Based on management judgments, after considering judgments and opinions of outside counsel, no reserve has beenrecorded for this proceeding as management does not believe that a loss is probable.
Contingent Asset – Resolution
Praxair’s Brazilian-based subsidiary, White Martins, had a long-standing claim against a Brazilian power company,Bandeirante Energia SA, which had been successfully litigated, and in 2011 the courts released a cash deposit to White Martins,subject to completion of an appeal process. During the first quarter of 2012, White Martins was notified that the appeal process wasfavorably concluded, and accordingly, recognized a $24 million gain to other income (expense), net of legal fees and anotherlitigation matter.
90
Commitments and Contractual Obligations
The following table sets forth Praxair’s material commitments and contractual obligations as of December 31, 2012,excluding leases, tax liabilities for uncertain tax positions, long-term debt, other post retirement and pension obligations which aresummarized elsewhere in the financial statements (see Notes 4, 7, 11, and 16):
(Millions of dollars)Expiring through December 31,
UnconditionalPurchase
ObligationsConstructionCommitments
Guaranteesand Other
2013 $ 576 $1,161 $ 562014 491 528 —2015 404 — 92016 391 — —2017 385 — —Thereafter 834 — 12
$3,081 $1,689 $ 77
Unconditional purchase obligations of $3,081 million represent contractual commitments under various long and short-termtake-or-pay arrangements with suppliers and are not included on Praxair’s balance sheet. These obligations are primarilyminimum-purchase commitments for helium, electricity, natural gas and feedstock used to produce atmospheric and process gasesincluding a multi-year contract for the purchase of silane. During 2012, payments related to Praxair’s unconditional purchaseobligations totaled $1,093 million, including $679 million for electricity and $207 million for natural gas. A significant portion ofthese obligations is passed on to customers through similar take-or-pay or other contractual arrangements. Purchase obligations thatare not passed along to customers through such contractual arrangements are subject to market conditions, but do not represent amaterial risk to Praxair. At December 31, 2012 the total purchase obligation for the silane contract is $166 million. Since thecontract was signed, the market for silane has not developed as expected and prices have decreased due to lower demand from thephotovoltaics markets, primarily in Asia. At December 31, 2012, Praxair’s current selling prices and estimated future demand forsilane are in excess of its contractual purchase obligations under the contract. The company is continually monitoring marketdevelopments.
Construction commitments of $1,689 million represent outstanding commitments to complete authorized construction projectsas of December 31, 2012. A significant portion of Praxair’s capital spending is related to the construction of new productionfacilities to satisfy customer commitments which may take a year or more to complete.
Guarantees and other of $77 million include $74 million related to Praxair’s contingent obligations under guarantees of certaindebt of unconsolidated affiliates and $3 million of various guarantees relating to outstanding receivables and repurchaseagreements. Unconsolidated equity investees had total debt of approximately $395 million at December 31, 2012, which was non-recourse to Praxair with the exception of the guaranteed portions described above. Praxair has no significant financingarrangements with closely-held related parties.
At December 31, 2012, Praxair had undrawn outstanding letters of credit, bank guarantees and surety bonds valued atapproximately $1,480 million from financial institutions, including $557 million relating to the CADE anti-trust litigation inBrazil. These related primarily to customer contract performance guarantees (including plant construction in connection withcertain on-site contracts), self-insurance claims and other commercial and governmental requirements, including foreign litigationmatters.
NOTE 18. SEGMENT INFORMATION
The company’s operations are organized into five reportable segments, four of which have been determined on a geographicbasis of segmentation: North America, Europe, South America and Asia. In addition, Praxair operates its worldwide surfacetechnologies business through its wholly-owned subsidiary, Praxair Surface Technologies, Inc., which represents the fifthreportable segment.
Praxair’s operations consist of two major product lines: industrial gases and surface technologies. The industrial gases productline centers on the manufacturing and distribution of atmospheric gases (oxygen, nitrogen, argon, rare gases) and process gases(carbon dioxide, helium, hydrogen, electronic gases, specialty gases, acetylene). Many of these products are co-products of thesame manufacturing process. Praxair manufactures and distributes nearly all of its products and manages its customer relationshipson a regional basis. Praxair’s industrial gases are distributed to various end markets within a regional segment through one of threebasic distribution methods: on-site or tonnage; merchant; and packaged or cylinder gases. The distribution methods are generallyintegrated in order to best meet the customer’s needs and very few of its products can be
91
economically transported outside of a region. Therefore, the distribution economics are specific to the various geographies inwhich the company operates and are consistent with how management assesses performance.
Praxair evaluates the performance of its reportable segments based primarily on operating profit, excluding inter-companyroyalties and special items. Accordingly, for 2012, segment operating profit excludes a $65 million loss associated with the costreduction program and pension settlement charge; 2011 excludes $1 million net loss associated with the acquisition and costreduction program; 2010 excludes the impact of the U.S. Homecare divestiture and Venezuela currency devaluation totaling $85million (see Note 2). During the 2012 first quarter, Praxair changed the measurement of its segment sales and operating profit to bebased on the country in which the customer is domiciled instead of where the company’s selling subsidiary is domiciled. Thecompany believes these changes better represent the sales and profitability by geographic segment. These changes primarily relateto helium and specialty gas sales and result in slightly higher sales and operating profit in Europe and Asia segments withoffsetting declines in the North America segment. Prior amounts have been reclassified to conform to the current year presentation.Corporate and globally managed expenses, and research and development costs relating to Praxair’s global industrial gasesbusiness, are allocated to operating segments based on sales.
The table below presents information about reportable segments for the years ended December 31, 2012, 2011 and 2010.
(Millions of dollars) 2012 2011 2010
Sales (a)North America $ 5,598 $ 5,490 $ 5,079Europe 1,474 1,458 1,341South America 2,082 2,308 1,970Asia 1,414 1,348 1,158Surface Technologies 656 648 568
$11,224 $11,252 $10,116
Operating ProfitNorth America $ 1,465 $ 1,331 $ 1,158Europe 256 272 278South America 429 530 454Asia 246 234 193Surface Technologies 106 102 84
Segment operating profit 2,502 2,469 2,167Cost reduction program and other charges (Note 2) (65) (1) (85)
Total operating profit $ 2,437 $ 2,468 $ 2,082
Total Assets (b)North America $ 8,491 $ 7,402 $ 7,154Europe 2,957 2,728 2,262South America 3,205 3,194 3,234Asia 2,757 2,366 1,965Surface Technologies 680 666 659
$18,090 $16,356 $15,274
92
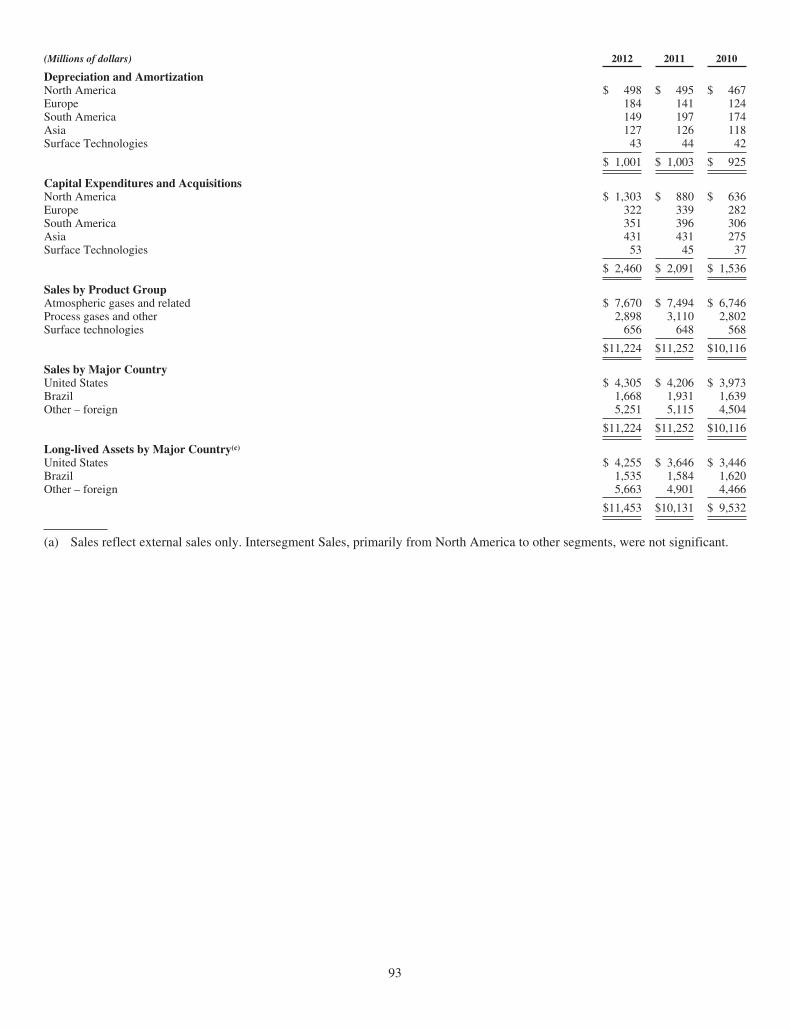
(Millions of dollars) 2012 2011 2010
Depreciation and AmortizationNorth America $ 498 $ 495 $ 467Europe 184 141 124South America 149 197 174Asia 127 126 118Surface Technologies 43 44 42
$ 1,001 $ 1,003 $ 925
Capital Expenditures and AcquisitionsNorth America $ 1,303 $ 880 $ 636Europe 322 339 282South America 351 396 306Asia 431 431 275Surface Technologies 53 45 37
$ 2,460 $ 2,091 $ 1,536
Sales by Product GroupAtmospheric gases and related $ 7,670 $ 7,494 $ 6,746Process gases and other 2,898 3,110 2,802Surface technologies 656 648 568
$11,224 $11,252 $10,116
Sales by Major CountryUnited States $ 4,305 $ 4,206 $ 3,973Brazil 1,668 1,931 1,639Other – foreign 5,251 5,115 4,504
$11,224 $11,252 $10,116
Long-lived Assets by Major Country(c)
United States $ 4,255 $ 3,646 $ 3,446Brazil 1,535 1,584 1,620Other – foreign 5,663 4,901 4,466
$11,453 $10,131 $ 9,532
(a) Sales reflect external sales only. Intersegment Sales, primarily from North America to other segments, were not significant.
93
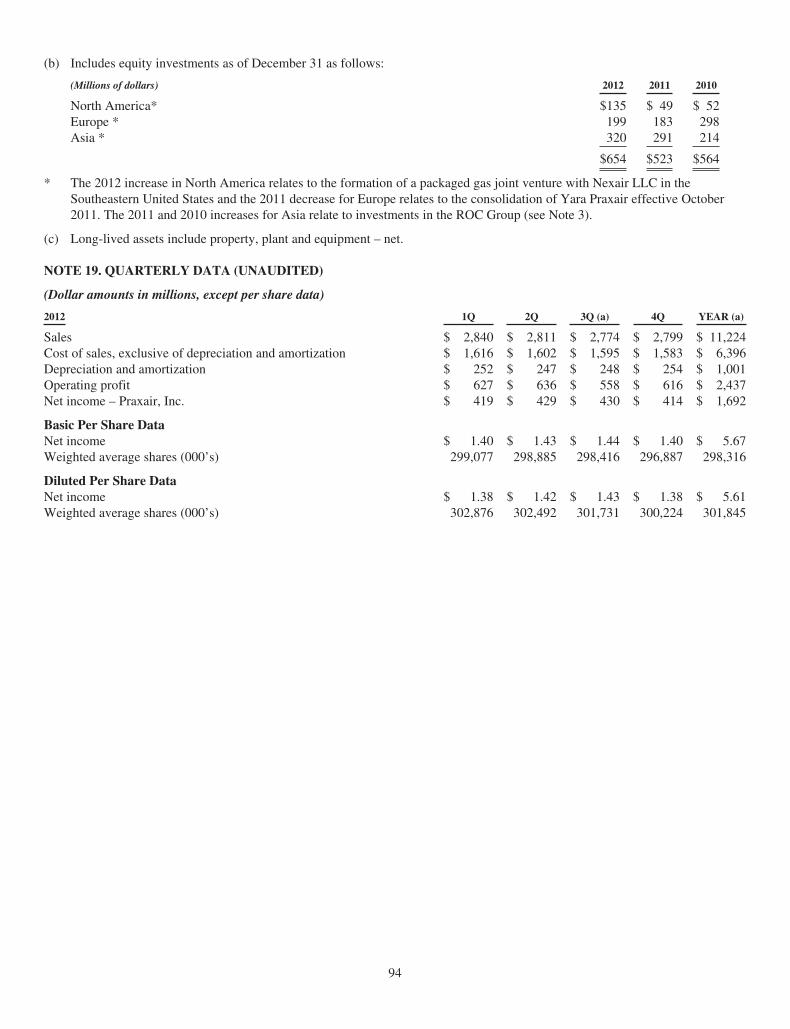
(b) Includes equity investments as of December 31 as follows:
(Millions of dollars) 2012 2011 2010
North America* $135 $ 49 $ 52Europe * 199 183 298Asia * 320 291 214
$654 $523 $564
* The 2012 increase in North America relates to the formation of a packaged gas joint venture with Nexair LLC in theSoutheastern United States and the 2011 decrease for Europe relates to the consolidation of Yara Praxair effective October2011. The 2011 and 2010 increases for Asia relate to investments in the ROC Group (see Note 3).
(c) Long-lived assets include property, plant and equipment – net.
NOTE 19. QUARTERLY DATA (UNAUDITED)
(Dollar amounts in millions, except per share data)
2012 1Q 2Q 3Q (a) 4Q YEAR (a)
Sales $ 2,840 $ 2,811 $ 2,774 $ 2,799 $ 11,224Cost of sales, exclusive of depreciation and amortization $ 1,616 $ 1,602 $ 1,595 $ 1,583 $ 6,396Depreciation and amortization $ 252 $ 247 $ 248 $ 254 $ 1,001Operating profit $ 627 $ 636 $ 558 $ 616 $ 2,437Net income – Praxair, Inc. $ 419 $ 429 $ 430 $ 414 $ 1,692
Basic Per Share DataNet income $ 1.40 $ 1.43 $ 1.44 $ 1.40 $ 5.67Weighted average shares (000’s) 299,077 298,885 298,416 296,887 298,316
Diluted Per Share DataNet income $ 1.38 $ 1.42 $ 1.43 $ 1.38 $ 5.61Weighted average shares (000’s) 302,876 302,492 301,731 300,224 301,845
94
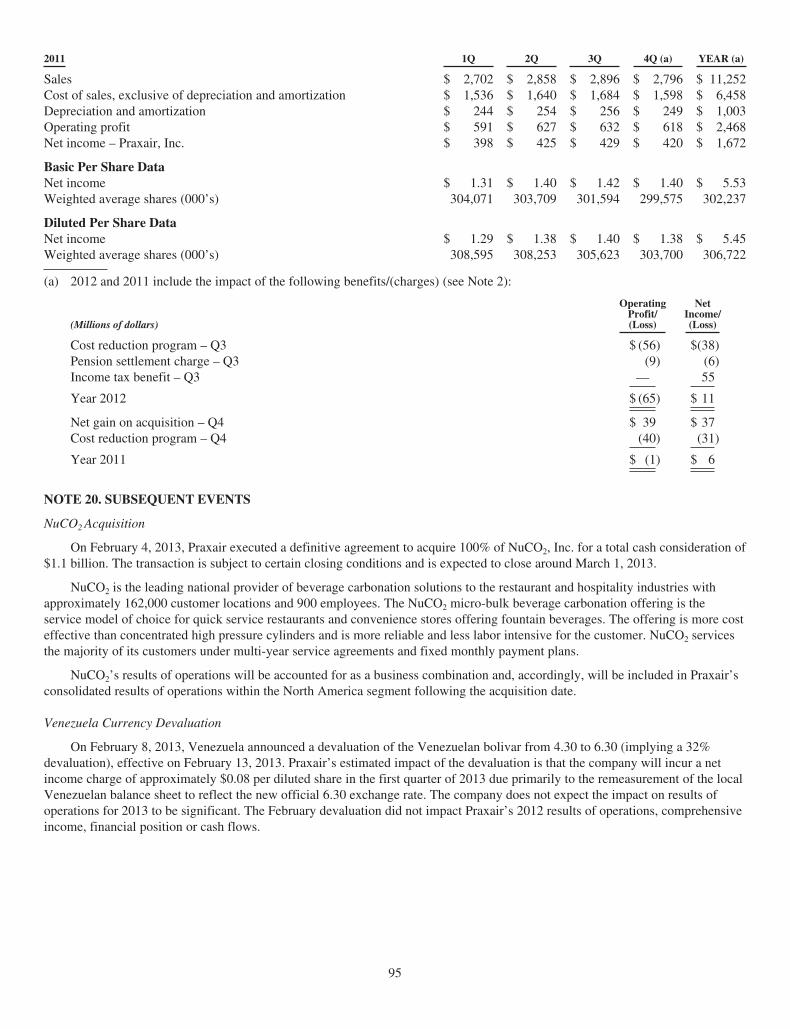
2011 1Q 2Q 3Q 4Q (a) YEAR (a)
Sales $ 2,702 $ 2,858 $ 2,896 $ 2,796 $ 11,252Cost of sales, exclusive of depreciation and amortization $ 1,536 $ 1,640 $ 1,684 $ 1,598 $ 6,458Depreciation and amortization $ 244 $ 254 $ 256 $ 249 $ 1,003Operating profit $ 591 $ 627 $ 632 $ 618 $ 2,468Net income – Praxair, Inc. $ 398 $ 425 $ 429 $ 420 $ 1,672
Basic Per Share DataNet income $ 1.31 $ 1.40 $ 1.42 $ 1.40 $ 5.53Weighted average shares (000’s) 304,071 303,709 301,594 299,575 302,237
Diluted Per Share DataNet income $ 1.29 $ 1.38 $ 1.40 $ 1.38 $ 5.45Weighted average shares (000’s) 308,595 308,253 305,623 303,700 306,722
(a) 2012 and 2011 include the impact of the following benefits/(charges) (see Note 2):
(Millions of dollars)
OperatingProfit/(Loss)
NetIncome/(Loss)
Cost reduction program – Q3 $ (56) $(38)Pension settlement charge – Q3 (9) (6)Income tax benefit – Q3 — 55
Year 2012 $ (65) $ 11
Net gain on acquisition – Q4 $ 39 $ 37Cost reduction program – Q4 (40) (31)
Year 2011 $ (1) $ 6
NOTE 20. SUBSEQUENT EVENTS
NuCO2 Acquisition
On February 4, 2013, Praxair executed a definitive agreement to acquire 100% of NuCO2, Inc. for a total cash consideration of$1.1 billion. The transaction is subject to certain closing conditions and is expected to close around March 1, 2013.
NuCO2 is the leading national provider of beverage carbonation solutions to the restaurant and hospitality industries withapproximately 162,000 customer locations and 900 employees. The NuCO2 micro-bulk beverage carbonation offering is theservice model of choice for quick service restaurants and convenience stores offering fountain beverages. The offering is more costeffective than concentrated high pressure cylinders and is more reliable and less labor intensive for the customer. NuCO2 servicesthe majority of its customers under multi-year service agreements and fixed monthly payment plans.
NuCO2’s results of operations will be accounted for as a business combination and, accordingly, will be included in Praxair’sconsolidated results of operations within the North America segment following the acquisition date.
Venezuela Currency Devaluation
On February 8, 2013, Venezuela announced a devaluation of the Venezuelan bolivar from 4.30 to 6.30 (implying a 32%devaluation), effective on February 13, 2013. Praxair’s estimated impact of the devaluation is that the company will incur a netincome charge of approximately $0.08 per diluted share in the first quarter of 2013 due primarily to the remeasurement of the localVenezuelan balance sheet to reflect the new official 6.30 exchange rate. The company does not expect the impact on results ofoperations for 2013 to be significant. The February devaluation did not impact Praxair’s 2012 results of operations, comprehensiveincome, financial position or cash flows.
95
ITEM 9. CHANGES IN AND DISAGREEMENTS WITH ACCOUNTANTS ON ACCOUNTING AND FINANCIALDISCLOSURE
None.
ITEM 9A. CONTROLS AND PROCEDURES
Conclusion Regarding the Effectiveness of Disclosure Controls and Procedures
Based on an evaluation of the effectiveness of Praxair’s disclosure controls and procedures, which was made under thesupervision and with the participation of management, including Praxair’s principal executive officer and principal financialofficer, the principal executive officer and principal financial officer have each concluded that, as of the end of the annual periodcovered by this report, such disclosure controls and procedures are effective in ensuring that information required to be disclosedby Praxair in reports that it files under the Exchange Act of 1934 is recorded, processed, summarized and reported within the timeperiods specified in the Securities and Exchange Commission’s rules and forms, and accumulated and communicated tomanagement including Praxair’s principal executive officer and principal financial officer, to allow timely decisions regardingrequired disclosure.
Management’s Report on Internal Control Over Financial Reporting
Praxair’s management is responsible for establishing and maintaining adequate internal control over financial reporting, assuch term is defined in Exchange Act Rule 13a-15(f). Under the supervision and with the participation of management, includingthe company’s principal executive officer and principal financial officer, Praxair conducted an evaluation of the effectiveness of itsinternal control over financial reporting based on the framework in Internal Control – Integrated Framework issued by theCommittee of Sponsoring Organizations of the Treadway Commission (often referred to as COSO). Based on this evaluation,management concluded that the company’s internal control over financial reporting was effective as of December 31, 2012.
Praxair’s evaluation of internal control over financial reporting as of December 31, 2012 did not include the internal controlover financial reporting related to Acetylene Oxygen Company and Portagas Inc. because they were acquired by Praxair inbusiness purchase combinations consummated during 2012. Total assets and sales for these acquisitions represent 0.8% and 0.1%,respectively, of the related consolidated financial statement amounts as of and for the year ended December 31, 2012 (See Note 3to the consolidated financial statements in Item 8).
PricewaterhouseCoopers LLP, an independent registered public accounting firm, has issued their opinion on the company’sinternal control over financial reporting as of December 31, 2012 as stated in their report in Item 8.
Changes in Internal Control over Financial Reporting
There were no changes in Praxair’s internal control over financial reporting that occurred during the fourth quarter of 2012that have materially affected, or are reasonably likely to materially affect, Praxair’s internal control over financial reporting.
ITEM 9B. OTHER INFORMATION
None.
96
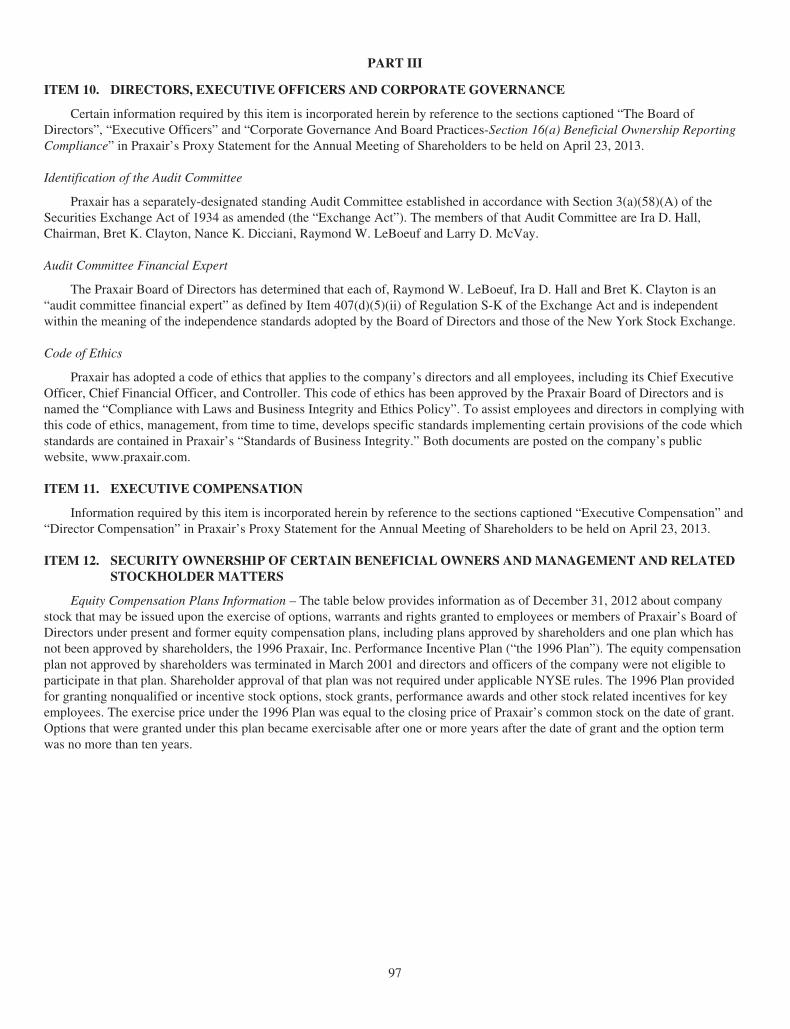
PART III
ITEM 10. DIRECTORS, EXECUTIVE OFFICERS AND CORPORATE GOVERNANCE
Certain information required by this item is incorporated herein by reference to the sections captioned “The Board ofDirectors”, “Executive Officers” and “Corporate Governance And Board Practices-Section 16(a) Beneficial Ownership ReportingCompliance” in Praxair’s Proxy Statement for the Annual Meeting of Shareholders to be held on April 23, 2013.
Identification of the Audit Committee
Praxair has a separately-designated standing Audit Committee established in accordance with Section 3(a)(58)(A) of theSecurities Exchange Act of 1934 as amended (the “Exchange Act”). The members of that Audit Committee are Ira D. Hall,Chairman, Bret K. Clayton, Nance K. Dicciani, Raymond W. LeBoeuf and Larry D. McVay.
Audit Committee Financial Expert
The Praxair Board of Directors has determined that each of, Raymond W. LeBoeuf, Ira D. Hall and Bret K. Clayton is an“audit committee financial expert” as defined by Item 407(d)(5)(ii) of Regulation S-K of the Exchange Act and is independentwithin the meaning of the independence standards adopted by the Board of Directors and those of the New York Stock Exchange.
Code of Ethics
Praxair has adopted a code of ethics that applies to the company’s directors and all employees, including its Chief ExecutiveOfficer, Chief Financial Officer, and Controller. This code of ethics has been approved by the Praxair Board of Directors and isnamed the “Compliance with Laws and Business Integrity and Ethics Policy”. To assist employees and directors in complying withthis code of ethics, management, from time to time, develops specific standards implementing certain provisions of the code whichstandards are contained in Praxair’s “Standards of Business Integrity.” Both documents are posted on the company’s publicwebsite, www.praxair.com.
ITEM 11. EXECUTIVE COMPENSATION
Information required by this item is incorporated herein by reference to the sections captioned “Executive Compensation” and“Director Compensation” in Praxair’s Proxy Statement for the Annual Meeting of Shareholders to be held on April 23, 2013.
ITEM 12. SECURITY OWNERSHIP OF CERTAIN BENEFICIAL OWNERS AND MANAGEMENT AND RELATEDSTOCKHOLDER MATTERS
Equity Compensation Plans Information – The table below provides information as of December 31, 2012 about companystock that may be issued upon the exercise of options, warrants and rights granted to employees or members of Praxair’s Board ofDirectors under present and former equity compensation plans, including plans approved by shareholders and one plan which hasnot been approved by shareholders, the 1996 Praxair, Inc. Performance Incentive Plan (“the 1996 Plan”). The equity compensationplan not approved by shareholders was terminated in March 2001 and directors and officers of the company were not eligible toparticipate in that plan. Shareholder approval of that plan was not required under applicable NYSE rules. The 1996 Plan providedfor granting nonqualified or incentive stock options, stock grants, performance awards and other stock related incentives for keyemployees. The exercise price under the 1996 Plan was equal to the closing price of Praxair’s common stock on the date of grant.Options that were granted under this plan became exercisable after one or more years after the date of grant and the option termwas no more than ten years.
97
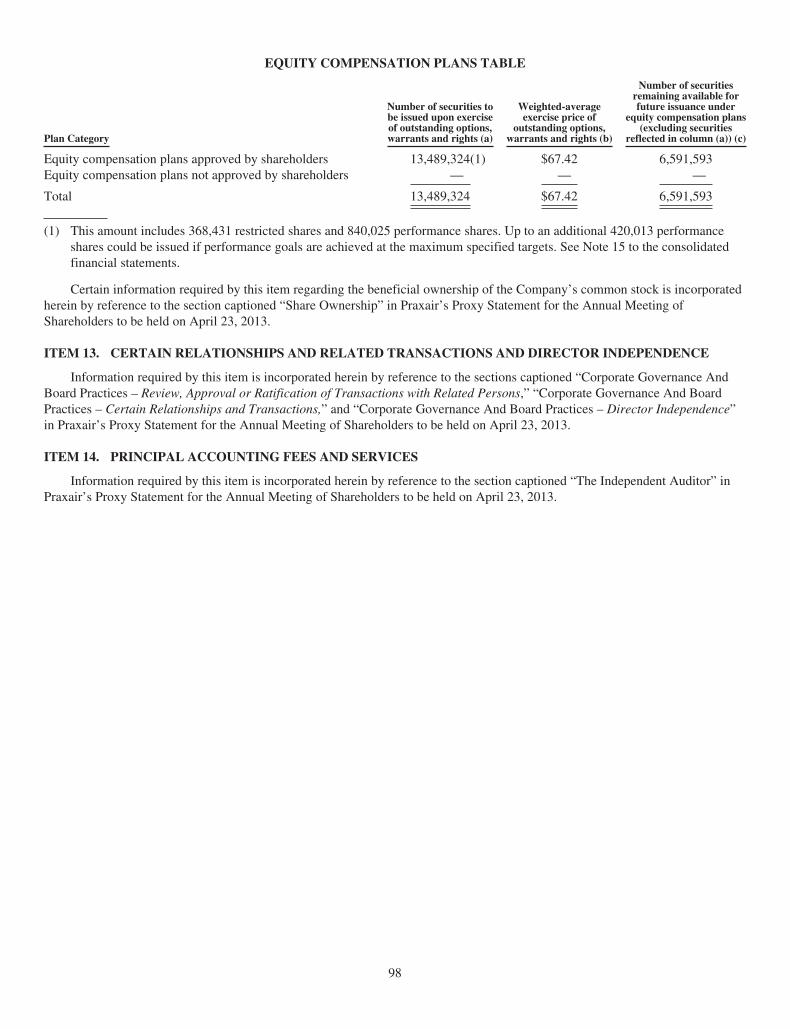
EQUITY COMPENSATION PLANS TABLE
Plan Category
Number of securities tobe issued upon exerciseof outstanding options,warrants and rights (a)
Weighted-averageexercise price of
outstanding options,warrants and rights (b)
Number of securitiesremaining available forfuture issuance under
equity compensation plans(excluding securities
reflected in column (a)) (c)
Equity compensation plans approved by shareholders 13,489,324(1) $67.42 6,591,593Equity compensation plans not approved by shareholders — — —
Total 13,489,324 $67.42 6,591,593
(1) This amount includes 368,431 restricted shares and 840,025 performance shares. Up to an additional 420,013 performanceshares could be issued if performance goals are achieved at the maximum specified targets. See Note 15 to the consolidatedfinancial statements.
Certain information required by this item regarding the beneficial ownership of the Company’s common stock is incorporatedherein by reference to the section captioned “Share Ownership” in Praxair’s Proxy Statement for the Annual Meeting ofShareholders to be held on April 23, 2013.
ITEM 13. CERTAIN RELATIONSHIPS AND RELATED TRANSACTIONS AND DIRECTOR INDEPENDENCE
Information required by this item is incorporated herein by reference to the sections captioned “Corporate Governance AndBoard Practices – Review, Approval or Ratification of Transactions with Related Persons,” “Corporate Governance And BoardPractices – Certain Relationships and Transactions,” and “Corporate Governance And Board Practices – Director Independence”in Praxair’s Proxy Statement for the Annual Meeting of Shareholders to be held on April 23, 2013.
ITEM 14. PRINCIPAL ACCOUNTING FEES AND SERVICES
Information required by this item is incorporated herein by reference to the section captioned “The Independent Auditor” inPraxair’s Proxy Statement for the Annual Meeting of Shareholders to be held on April 23, 2013.
98

PART IV
ITEM 15. EXHIBITS, FINANCIAL STATEMENT SCHEDULES
(a) The following documents are filed as part of this report:
(1) The company’s 2012 Consolidated Financial Statements and the Report of the Independent Registered PublicAccounting Firm are included in Part II, Item 8. Financial Statements and Supplementary Data.
(2) Financial Statement Schedules – All financial statement schedules have been omitted because they are notapplicable or the required information is shown in the financial statements or notes thereto.
(3) Exhibits – The exhibits filed as part of this Annual Report on Form 10-K are listed in the accompanying index.
99
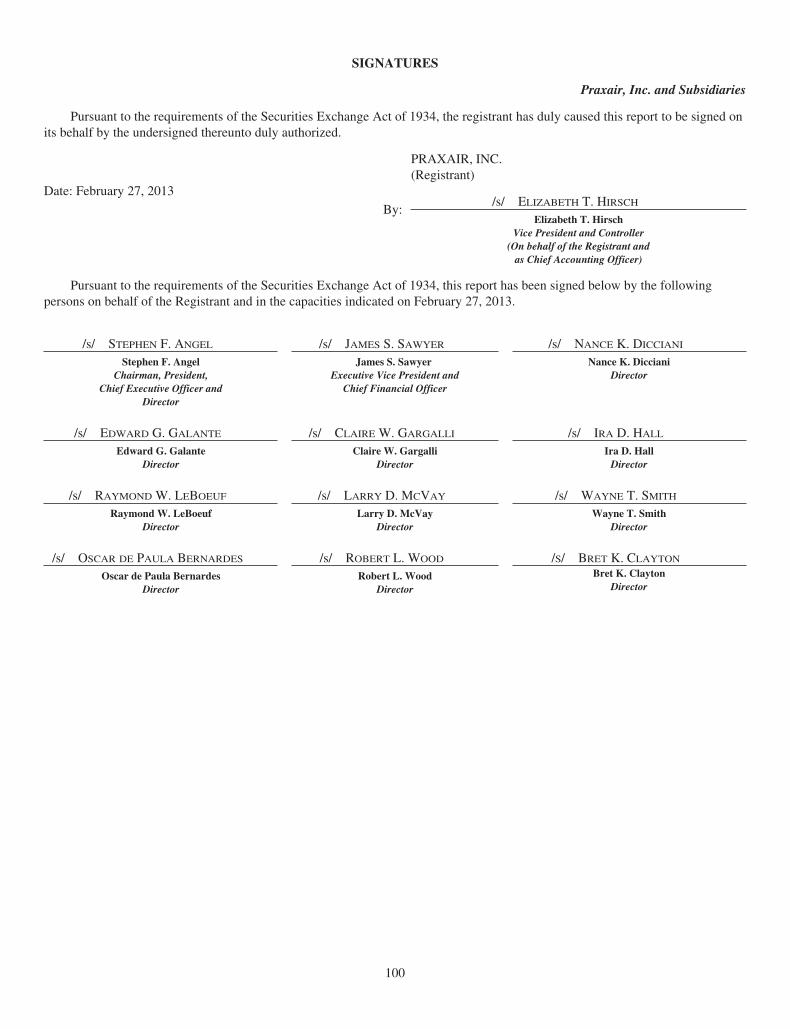
SIGNATURES
Praxair, Inc. and Subsidiaries
Pursuant to the requirements of the Securities Exchange Act of 1934, the registrant has duly caused this report to be signed onits behalf by the undersigned thereunto duly authorized.
PRAXAIR, INC.(Registrant)
Date: February 27, 2013
By:/s/ ELIZABETH T. HIRSCH
Elizabeth T. HirschVice President and Controller
(On behalf of the Registrant andas Chief Accounting Officer)
Pursuant to the requirements of the Securities Exchange Act of 1934, this report has been signed below by the followingpersons on behalf of the Registrant and in the capacities indicated on February 27, 2013.
/s/ STEPHEN F. ANGEL /s/ JAMES S. SAWYER /s/ NANCE K. DICCIANI
Stephen F. AngelChairman, President,
Chief Executive Officer andDirector
James S. SawyerExecutive Vice President and
Chief Financial Officer
Nance K. DiccianiDirector
/s/ EDWARD G. GALANTE
Edward G. GalanteDirector
/s/ CLAIRE W. GARGALLI
Claire W. GargalliDirector
/s/ IRA D. HALL
Ira D. HallDirector
/s/ RAYMOND W. LEBOEUF
Raymond W. LeBoeufDirector
/s/ LARRY D. MCVAY
Larry D. McVayDirector
/s/ WAYNE T. SMITH
Wayne T. SmithDirector
/s/ OSCAR DE PAULA BERNARDES
Oscar de Paula BernardesDirector
/s/ ROBERT L. WOOD
Robert L. WoodDirector
/S/ BRET K. CLAYTON
Bret K. ClaytonDirector
100
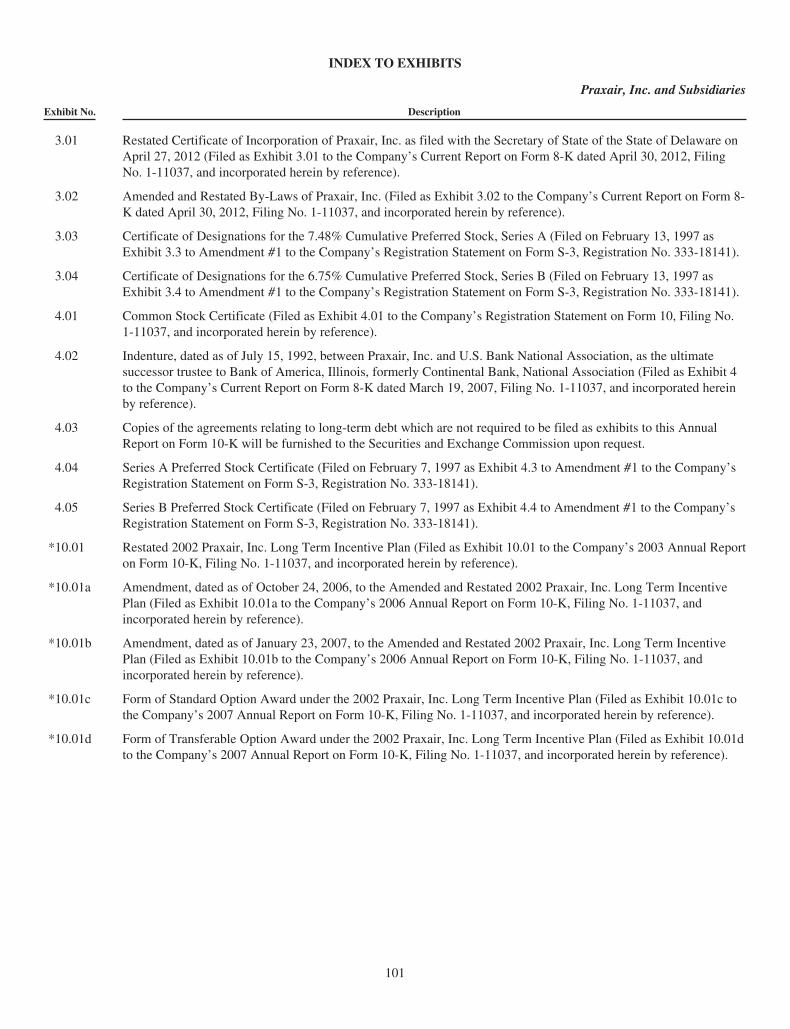
INDEX TO EXHIBITS
Praxair, Inc. and Subsidiaries
Exhibit No. Description
3.01 Restated Certificate of Incorporation of Praxair, Inc. as filed with the Secretary of State of the State of Delaware onApril 27, 2012 (Filed as Exhibit 3.01 to the Company’s Current Report on Form 8-K dated April 30, 2012, FilingNo. 1-11037, and incorporated herein by reference).
3.02 Amended and Restated By-Laws of Praxair, Inc. (Filed as Exhibit 3.02 to the Company’s Current Report on Form 8-K dated April 30, 2012, Filing No. 1-11037, and incorporated herein by reference).
3.03 Certificate of Designations for the 7.48% Cumulative Preferred Stock, Series A (Filed on February 13, 1997 asExhibit 3.3 to Amendment #1 to the Company’s Registration Statement on Form S-3, Registration No. 333-18141).
3.04 Certificate of Designations for the 6.75% Cumulative Preferred Stock, Series B (Filed on February 13, 1997 asExhibit 3.4 to Amendment #1 to the Company’s Registration Statement on Form S-3, Registration No. 333-18141).
4.01 Common Stock Certificate (Filed as Exhibit 4.01 to the Company’s Registration Statement on Form 10, Filing No.1-11037, and incorporated herein by reference).
4.02 Indenture, dated as of July 15, 1992, between Praxair, Inc. and U.S. Bank National Association, as the ultimatesuccessor trustee to Bank of America, Illinois, formerly Continental Bank, National Association (Filed as Exhibit 4to the Company’s Current Report on Form 8-K dated March 19, 2007, Filing No. 1-11037, and incorporated hereinby reference).
4.03 Copies of the agreements relating to long-term debt which are not required to be filed as exhibits to this AnnualReport on Form 10-K will be furnished to the Securities and Exchange Commission upon request.
4.04 Series A Preferred Stock Certificate (Filed on February 7, 1997 as Exhibit 4.3 to Amendment #1 to the Company’sRegistration Statement on Form S-3, Registration No. 333-18141).
4.05 Series B Preferred Stock Certificate (Filed on February 7, 1997 as Exhibit 4.4 to Amendment #1 to the Company’sRegistration Statement on Form S-3, Registration No. 333-18141).
*10.01 Restated 2002 Praxair, Inc. Long Term Incentive Plan (Filed as Exhibit 10.01 to the Company’s 2003 Annual Reporton Form 10-K, Filing No. 1-11037, and incorporated herein by reference).
*10.01a Amendment, dated as of October 24, 2006, to the Amended and Restated 2002 Praxair, Inc. Long Term IncentivePlan (Filed as Exhibit 10.01a to the Company’s 2006 Annual Report on Form 10-K, Filing No. 1-11037, andincorporated herein by reference).
*10.01b Amendment, dated as of January 23, 2007, to the Amended and Restated 2002 Praxair, Inc. Long Term IncentivePlan (Filed as Exhibit 10.01b to the Company’s 2006 Annual Report on Form 10-K, Filing No. 1-11037, andincorporated herein by reference).
*10.01c Form of Standard Option Award under the 2002 Praxair, Inc. Long Term Incentive Plan (Filed as Exhibit 10.01c tothe Company’s 2007 Annual Report on Form 10-K, Filing No. 1-11037, and incorporated herein by reference).
*10.01d Form of Transferable Option Award under the 2002 Praxair, Inc. Long Term Incentive Plan (Filed as Exhibit 10.01dto the Company’s 2007 Annual Report on Form 10-K, Filing No. 1-11037, and incorporated herein by reference).
101
Exhibit No. Description
*10.02 Form of Executive Severance Compensation Agreement effective January 1, 2009 (Filed as Exhibit 10.02 to theCompany’s 2008 Annual Report on Form 10-K, Filing No. 1-11037, and incorporated herein by reference).
*10.02a Form of Amendment, effective December 31, 2012, to Executive Severance Compensation Agreements that wereeffective January 1, 2009 (Filed as Exhibit 10.1 to the Company’s Current Report on Form 8-K dated December 14,2012, Filing No. 1-11037, and incorporated herein by reference.
*10.02b Form of Executive Severance Compensation Agreement effective January 1, 2010 (Filed as Exhibit 10.02 to theCompany’s Quarterly Report on Form 10-Q for the quarter ended June 30, 2010, Filing No. 1-11037, andincorporated herein by reference).
*10.02c Form of Amendment, effective December 31, 2012, to Executive Severance Compensation Agreements that wereeffective January 1, 2010 is filed herewith.
*10.02d Form of Executive Severance Compensation Agreement effective January 1, 2013 is filed herewith.
*10.03 Praxair, Inc. Variable Compensation Plan amended and restated effective April 24, 2012 (Filed as Exhibit 10.01 tothe Company’s Quarterly Report on Form 10-Q for the quarter ended March 31, 2012, Filing No. 1-11037, andincorporated herein by reference).
*10.04 Amended and Restated 1995 Stock Option Plan for Non-Employee Directors (Filed as Exhibit 10.04 to theCompany’s 2003 Annual Report on Form 10-K, Filing No. 1-11037, and incorporated herein by reference).
*10.04a First Amendment, dated as of October 24, 2006, to the Amended and Restated 1995 Stock Option Plan for Non-Employee Directors (Filed as Exhibit 10.04a to the Company’s 2006 Annual Report on Form 10-K, Filing No. 1-11037, and incorporated herein by reference).
*10.04b 2005 Equity Compensation Plan for Non-Employee Directors of Praxair, Inc. amended and restated effectiveJanuary 26, 2010 (Filed as Exhibit 10.04b to the Company’s 2009 Annual Report on Form 10-K, Filing No. 1-11037, and incorporated herein by reference).
*10.04c Form of Option Award under the 2005 Equity Compensation Plan for Non-Employee Directors of Praxair, Inc(Filed as Exhibit 10.04a to the Company’s Quarterly Report on Form 10-Q for the quarter ended June 30, 2005,Filing No. 1-11037, and incorporated herein by reference).
*10.05a Praxair, Inc. Supplemental Retirement Income Plan A effective January 1, 2008 (Filed as Exhibit 10.05a to theCompany’s 2008 Annual Report on Form 10-K, Filing No. 1-11037, and incorporated herein by reference).
*10.05b First amendment to the Praxair, Inc. Supplemental Retirement Income Plan A effective January 1, 2010 (Filed asExhibit 10.05b to the Company’s 2009 Annual Report on Form 10-K, Filing No. 1-11037, and incorporated hereinby reference).
*10.05c Praxair, Inc. Supplemental Retirement Income Plan B amended and restated effective December 31, 2007 (Filed asExhibit 10.05b to the Company’s 2008 Annual Report on Form 10-K, Filing No. 1-11037, and incorporated hereinby reference).
*10.05d First amendment to the Praxair, Inc. Supplemental Retirement Income Plan B effective January 1, 2010 (Filed asExhibit 10.05d to the Company’s 2009 Annual Report on Form 10-K, Filing No. 1-11037, and incorporated hereinby reference).
*10.05e Second amendment to Praxair, Inc. Supplemental Retirement Income Plan B effective July 1, 2012 is filed herewith.
*10.05f Praxair, Inc. Equalization Benefit Plan amended and restated effective December 31, 2007 (Filed as Exhibit 10.05cto the Company’s 2008 Annual Report on Form 10-K, Filing No. 1-11037, and incorporated herein by reference).
*10.05g First amendment to the Praxair, Inc. Equalization Benefit Plan amended and restated effective January 1, 2010(Filed as Exhibit 10.05f to the Company’s 2009 Annual Report on Form 10-K, Filing No. 1-11037, and incorporatedherein by reference).
102
Exhibit No. Description
*10.06 Praxair, Inc. Director’s Fees Deferral Plan amended and restated effective January 26, 2010 (Filed as Exhibit 10.06to the Company’s 2009 Annual Report on Form 10-K, Filing No. 1-11037, and incorporated herein by reference).
*10.07 Praxair Compensation Deferral Program amended and restated as of January 1, 2005 (Filed as Exhibit 10.07 to theCompany’s 2008 Annual Report on Form 10-K, Filing No. 1-11037, and incorporated herein by reference).
10.08 Transfer Agreement dated January 1, 1989, between Union Carbide Corporation and the registrant (Filed as Exhibit10.06 to the Company’s Registration Statement on Form 10, Filing No. 1-11037, and incorporated herein byreference).
10.08a Amendment No. 1 dated as of December 31, 1989, to the Transfer Agreement (Filed as Exhibit 10.07 to theCompany’s Registration Statement on Form 10, Filing No. 1-11037, and incorporated herein by reference).
10.08b Amendment No. 2 dated as of July 2, 1990, to the Transfer Agreement (Filed as Exhibit 10.08 to the Company’sRegistration Statement on Form 10, Filing No. 1-11037, and incorporated herein by reference).
10.08c Amendment No. 3 dated as of January 2, 1991, to the Transfer Agreement (Filed as Exhibit 10.09 to the Company’sRegistration Statement on Form 10, Filing No. 1-11037, and incorporated herein by reference).
10.09 Transfer Agreement dated January 1, 1989, between Union Carbide Corporation and Union Carbide CoatingsService Corporation (Filed as Exhibit 10.14 to the Company’s Registration Statement on Form 10, Filing No. 1-11037, and incorporated herein by reference).
10.09a Amendment No. 1 dated as of December 31, 1989, to the Transfer Agreement (Filed as Exhibit 10.15 to theCompany’s Registration Statement on Form 10, Filing No. 1-11037, and incorporated herein by reference).
10.09b Amendment No. 2 dated as of July 2, 1990, to the Transfer Agreement (Filed as Exhibit 10.16 to the Company’sRegistration Statement on Form 10, Filing No. 1-11037, and incorporated herein by reference).
10.10 Additional Provisions Agreement dated as of June 4, 1992 (Filed as Exhibit 10.21 to the Company’s RegistrationStatement on Form 10, Filing No. 1-11037, and incorporated herein by reference).
10.11 Amended and Restated Realignment Indemnification Agreement dated as of June 4, 1992 (Filed as Exhibit 10.23 tothe Company’s Registration Statement on Form 10, Filing No. 1-11037, and incorporated herein by reference).
10.12 Environmental Management, Services and Liabilities Allocation Agreement dated as of January 1, 1990 (Filed asExhibit 10.13 to the Company’s Registration Statement on Form 10, Filing No. 1-11037, and incorporated herein byreference).
10.12a Amendment No. 1 to the Environmental Management, Services and Liabilities Allocation Agreement dated as ofJune 4, 1992 (Filed as Exhibit 10.22 to the Company’s Registration Statement on Form 10, Filing No. 1-11037, andincorporated herein by reference).
10.13 Danbury Lease-Related Services Agreement dated as of June 4, 1992 (Filed as Exhibit 10.24 to the Company’sRegistration Statement on Form 10, Filing No. 1-11037, and incorporated herein by reference).
10.13a First Amendment to Danbury Lease-Related Services Agreement (Filed as Exhibit 10.13a to the Company’s 1994Annual Report on Form 10-K, Filing No. 1-11037, and incorporated herein by reference).
103
Exhibit No. Description
10.14 Danbury Lease Agreements, as amended (Filed as Exhibit 10.26 to the Company’s Registration Statement on Form10, Filing No. 1-11037, and incorporated herein by reference).
10.14a Second Amendment to Linde Data Center Lease (Danbury) (Filed as Exhibit 10.14a to the Company’s 1993 AnnualReport on Form 10-K, Filing No. 1-11037, and incorporated herein by reference).
10.14b Fourth Amendment to Carbide Center Lease (Filed as Exhibit 10.14b to the Company’s 1993 Annual Report onForm 10-K, Filing No. 1-11037, and incorporated herein by reference).
10.14c Third Amendment to Linde Data Center Lease (Filed as Exhibit 10.14c to the Company’s 1994 Annual Report onForm 10-K, Filing No. 1-11037, and incorporated herein by reference).
10.14d Fifth Amendment to Carbide Center Lease (Filed as Exhibit 10.14d to the Company’s 1994 Annual Report on Form10-K, Filing No. 1-11037, and incorporated herein by reference).
10.14e Sixth Amendment to Carbide Center Lease (Filed as Exhibit 10.14e to the Company’s 2004 Annual Report on Form10-K, Filing No. 1-11037, and incorporated herein by reference).
10.15 Employee Benefits Agreement dated as of June 4, 1992 (Filed as Exhibit 10.25 to the Company’s RegistrationStatement on Form 10, Filing No. 1-11037, and incorporated herein by reference).
10.15a First Amendatory Agreement to the Employee Benefits Agreement (Filed as Exhibit 10.15a to the Company’s 1994Annual Report on Form 10-K, Filing No. 1-11037, and incorporated herein by reference).
10.16 Tax Disaffiliation Agreement dated as of June 4, 1992 (Filed as Exhibit 10.20 to the Company’s RegistrationStatement on Form 10, Filing No. 1-11037, and incorporated herein by reference).
10.17 $1.75 Billion Credit Agreement dated as of July 26, 2011 among Praxair, Inc. and the Eligible Subsidiaries Referredto therein, the Lenders Listed therein, and Bank of America, N.A., as Administrative Agent, Citibank, N.A. andHSBC Bank USA, N.A., as Syndication Agents, (Filed as Exhibit 10.01 to the Company’s Quarterly Report on Form10-Q for the quarter ended June 30, 2011, Filing No. 1-11037, and incorporated herein by reference).
*10.18 Praxair, Inc. Plan for Determining Performance-Based Awards Under Section 162(m) (included as Appendix 3 tothe Company’s definitive proxy statement for its 2011 annual meeting of shareholders filed on March 16, 2011 andincorporated herein by reference).
*10.19 Service Credit Arrangement for Stephen F. Angel dated May 23, 2007 was filed as Exhibit 10.20 to the Company’sForm 8-K filed on May 24, 2007 and is incorporated herein by reference.
*10.20 2009 Praxair, Inc. Long Term Incentive Plan as amended on April 27, 2010, January 25, 2011 and October 23, 2012was filed as Exhibit 10.2 to the Company’s Current Report on Form 8-K dated December 14, 2012 Filing No. 1-11037, and incorporated herein by reference.
*10.21 Form of Standard Option Award under the 2009 Praxair, Inc. Long Term Incentive Plan (Filed as Exhibit 10.22 tothe Company’s 2009 Annual Report on Form 10-K, Filing No. 1-11037, and incorporated herein by reference).
104
Exhibit No. Description
*10.22 Form of Transferable Option Award under the 2009 Praxair, Inc. Long Term Incentive Plan (Filed as Exhibit 10.23to the Company’s 2009 Annual Report on Form 10-K, Filing No. 1-11037, and incorporated herein by reference).
*10.23 Form of Restricted Stock Unit Award under the 2009 Praxair, Inc. Long Term Incentive Plan (Filed as Exhibit 10.24to the Company’s 2009 Annual Report on Form 10-K, Filing No. 1-11037, and incorporated herein by reference).
*10.24a Form of Performance Share Unit Award under the 2009 Praxair, Inc. Long Term Incentive Plan for grants madefrom 2010-2013 (Filed as Exhibit 10.25 to the Company’s 2009 Annual Report on Form 10-K, Filing No. 1-11037,and incorporated herein by reference).
*10.24b Form of Performance Share Unit Award under the 2009 Praxair, Inc. Long Term Incentive Plan for grants made in2013 and thereafter with Earnings Per Share performance metrics is filed herewith.
*10.24c Form of Performance Share Unit Award under the 2009 Praxair, Inc. Long Term Incentive Plan for grants made in2013 and thereafter with Return on Capital performance metrics is filed herewith.
10.25 Letter of Clarification of Certain Pension Benefits dated October 26, 2010 between the Company and James T.Breedlove (Filed as Exhibit 10.1 to the Company’s Quarterly Report on Form 10-Q for the quarter ended September30, 2010, Filing No. 1-11037, and incorporated herein by reference).
10.26 Form of Standard Underwriting Agreement Provisions was filed as Exhibit 1.1 to the Company’s Form S-3 filed onAugust 8, 2012, and is incorporated herein by reference.
10.27 Terms Agreement dated March 1, 2011 among the Company, Citigroup Global Markets Inc., Merrill Lynch, Pierce,Fenner & Smith Incorporated, Deutsche Bank Securities Inc. and HSBC Securities (USA) Inc. as representatives ofthe underwriters named therein for the issuance and sale of $500,000,000 4.05% Notes due 2021, was filed asExhibit 1 to the Company’s Current Report on Form 8-K, dated March 4, 2011, Filing No. 1-11037, andincorporated herein by reference.
10.28 Terms Agreement dated August 31, 2011 among Credit Suisse Securities (USA) LLC, RBS Securities Inc.,Mitsubishi UFJ Securities (USA), Inc. and Wells Fargo Securities, LLC as representatives of the underwritersnamed therein for the issuance and sale of $500,000,000 3.000% Notes due 2021, was filed as Exhibit 1 to theCompany’s Current Report on Form 8-K, dated September 6, 2011, Filing No. 1-11037, and incorporated herein byreference.
10.29 Terms Agreement dated February 1, 2012 among the Company, Citigroup Global Markets Inc., HSBC Securities(USA) Inc. and Merrill Lynch, Pierce, Fenner & Smith Incorporated, as representatives of the underwriters namedtherein for the issuance and sale of $600,000,000 2.450% Notes due 2022, was filed as Exhibit 1 to the Company’sCurrent Report on Form 8-K, dated February 6, 2012, Filing No. 1-11037, and incorporated herein by reference.
10.30 Terms Agreement dated July 30, 2012 among the Company, Credit Suisse Securities (USA) LLC, J.P. MorganSecurities LLC and Wells Fargo Securities, LLC, as representatives of the underwriters named therein for theissuance and sale of $500,000,000 2.20% Notes due August 15, 2022, was filed as Exhibit 1 to the Company’sCurrent Report on Form 8-K, dated August 2, 2012, Filing No. 1-11037, and incorporated herein by reference.
10.31 Terms Agreement dated November 2, 2012 among the Company, Citigroup Global Markets Inc., Deutsche BankSecurities Inc. and RBS Securities Inc., as representatives of the underwriters named therein for the issuance andsale of $400,000,000 1.05% Notes due 2017, and $300,000,000 3.55% Notes due 2042, was filed as Exhibit 1 to theCompany’s Current Report on Form 8-K, dated November 7, 2012, Filing No. 1-11037, and incorporated herein byreference.
10.32 Terms Agreement dated February 13, 2013 among the Company, HSBC Securities (USA) Inc., Merrill Lynch,Pierce, Fenner & Smith Incorporated and Mitsubishi UFJ Securities (USA), Inc., as representatives of theunderwriters named therein for the issuance and sale of $400,000,000 0.75% Notes due 2016, and $500,000,000aggregate principal amount of its 2.70 % Notes due 2023, was filed as Exhibit 1 to the Company’s Current Reporton Form 8-K, dated February 19, 2013, Filing No. 1-11037, and incorporated herein by reference.
105
Exhibit No. Description
12.01 Computation of Ratio of Earnings to Fixed Charges.
21.01 Subsidiaries of Praxair, Inc.
23.01 Consent of Independent Registered Public Accounting Firm.
31.01 Rule 13a-14(a) Certification
31.02 Rule 13a-14(a) Certification
32.01 Section 1350 Certification (such certifications are furnished for the information of the Commission and shall not bedeemed incorporated by reference into any filing under the Securities Act or the Exchange Act).
32.02 Section 1350 Certification (such certifications are furnished for the information of the Commission and shall not bedeemed incorporated by reference into any filing under the Securities Act or the Exchange Act).
101.INS XBRL Instance Document
101.SCH XBRL Taxonomy Extension Schema
101.CAL XBRL Taxonomy Extension Calculation Linkbase
101.LAB XBRL Taxonomy Extension Label Linkbase
101.PRE XBRL Taxonomy Extension Presentation Linkbase
101.DEF XBRL Taxonomy Extension Definition Linkbase
Copies of exhibits incorporated by reference can be obtained from the SEC and are located in SEC File No. 1-11037.
* Indicates a management contract or compensatory plan or arrangement.
106
Investor Information
Kelcey E. Hoyt, Director, Investor Relations
Praxair, Inc.
39 Old Ridgebury Road Danbury, Connecticut 06810-5113
e-mail: [email protected]
(203) 837-2210
Information at www.praxair.com/investors:
• Annualreports
• Calendar
• Earnings,news&financialinformation
– Earnings guidance
– Quarterly earnings
– Five-yearfinancialsummary
– News
• Stockinformation
• Presentations
• SECfilings
• Sustainabledevelopment
• Disclosurepractices
• Emailalerts
Common Stock Listing (Symbol: PX)
NewYorkStockExchange
Number of Shareholders
Therewere14,683registeredshareholdersofrecordasofDecember 31, 2012.
Dividend Policy
Dividends on Praxair’s common stockareusuallydeclaredandpaidquarterly. Praxair’s objective is to continue quarterly dividends and consider annual dividend increases in conjunctionwithcontinuedgrowthinearningspershare.However,thedeclaration of dividends is a decision madebythePraxairBoardofDirectors based on Praxair’s earnings, financialconditionandotherfactorstheboardconsidersrelevant.
Stock Transfer Agent and Stock Record Keeping
Registrar and Transfer Company is Praxair’sstocktransferagentandregistrar,andmaintainsshareholderrecords. For information about accountrecords,stockcertificates,changeofaddressanddividendpayments, contact:
websiteaddress: http://www.rtco.com
Bymail,addressshareholder inquiries to:
ShareholderRelationsDepartment Registrar and Transfer Company 10 Commerce Drive Cranford, NJ 07016
Dividend Reinvestment Plan
Praxair provides investors a convenient,low-costprogramthatallowsdividendstobeautomaticallyreinvestedintoadditionalsharesofPraxaircommonstockandallowspurchasesofadditionalsharesofPraxaircommonstockwithoutcommissions.ContactShareholderRelations at Registrar and Transfer Company for full details.
Annual Shareholders Meeting
The2013annualmeetingofshareholdersofPraxair,Inc.willbeheldat11:00a.m.onTuesday,April23,2013attheRitz-CarltonWestchesterHotel,ThreeRenaissanceSquare,WhitePlains,NewYork.
Printed on recycled paper
Praxair, the flowing airstream design and Making our planet more productive are trademarks or registered trademarks of
Praxair Technology, Inc. in the United States and/or other countries.
© 2013 Praxair Technology, Inc. All rights reserved.