Embed Size (px)
Citation preview

Making Monitoring Manageable:
A Framework for Learning Based on
Risk and Uncertainty

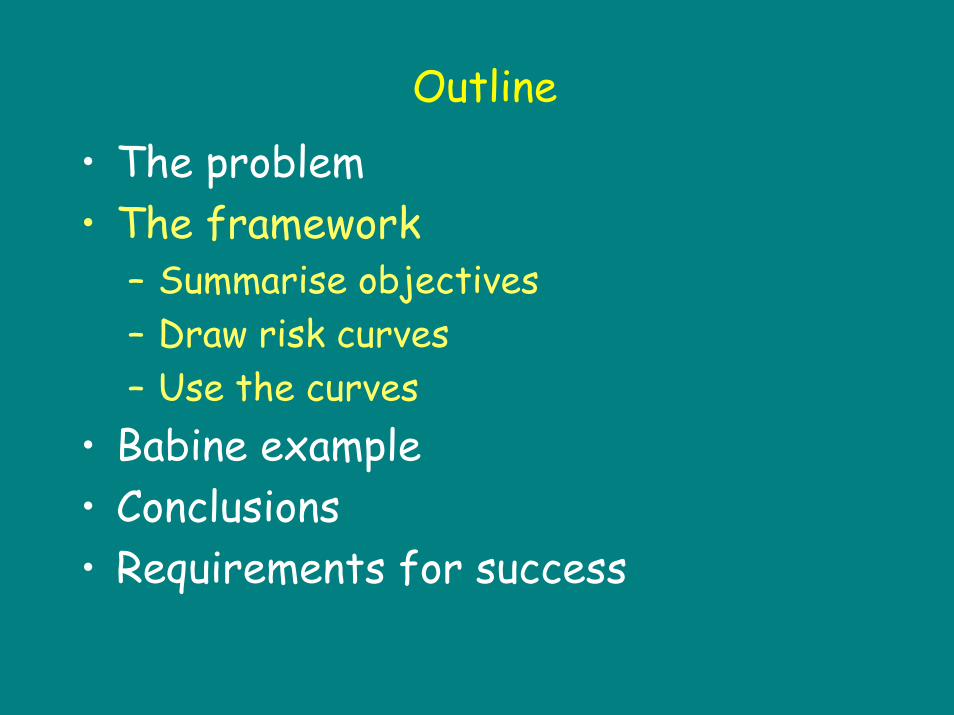
Outline
• The problem• The framework
– Summarise objectives– Draw risk curves– Use the risk curves
• Babine example• Conclusions• Requirements for success

Definitions
• Objectives (Y)– Desired end– E.g. Maintain fish habitat; minimise human/bear
interaction
• Indicators (x)– Variables influenced by management and related to
objective– Assume that Y = f(x)– E.g. amount of structure; road density
• Strategies (xt)– Target level of an indicator– E.g. leave 70% structure around fish streams; limit road
density to 0.6 km/km2
Y
x

The Problem
• We monitor to learn about the effects of our activities—to improve management (influence decision making)
• Lots of effort spent on monitoring
• Very little improvement to management

Why haven’t we improved?1. Monitoring decoupled from
feedback loop• Considered the END not MEANS
“learning to monitor instead of monitoring to learn”
• Indicators selected for monitoring bear little resemblance to land-use objectives

• LRMP brings in science: Y = f(x)• Negotiation
– objective Y, guidance on x• Detailed plans
– focus on bits of objective Y that apply– may lose Y = f(x)– e.g. choose strategy j that influences Y
• Monitoring plan– indicator from detailed plan (j) OR choose from long
list of indicators (h)• Monitor
– Write report on h
Changing indicators

Do not go back to startDo not collect knowledgeDo not improve management
LRMP
END
Science Negotiate
LUP
SRMP
SFMP
MDSMonitoring
plan
Write report
Monitor
Monitoropoly
$$
$$ $$
$$

Why haven’t we improved?1. Monitoring decoupled from
feedback loop2. Knowledge not represented in a way
that facilitates learning• Myriad reports (~200 for the Babine)• Different jargon, analysis• Many based on implicit models• Hard to synthesise, hard to
communicate, hard to update

Why haven’t we improved?1. Monitoring decoupled from
feedback loop2. Knowledge not represented in a way
that facilitates learning3. Linear model of monitoring

Types of monitoringThree tiers• Implementation monitoring
– Measures state of indicator (x)
• Effectiveness monitoring– Detects consequences to objective (Y)
• Validation monitoring = “monitoring to learn”
– Decreases uncertainty about the relationship between indicator and objective (Y = f(x))
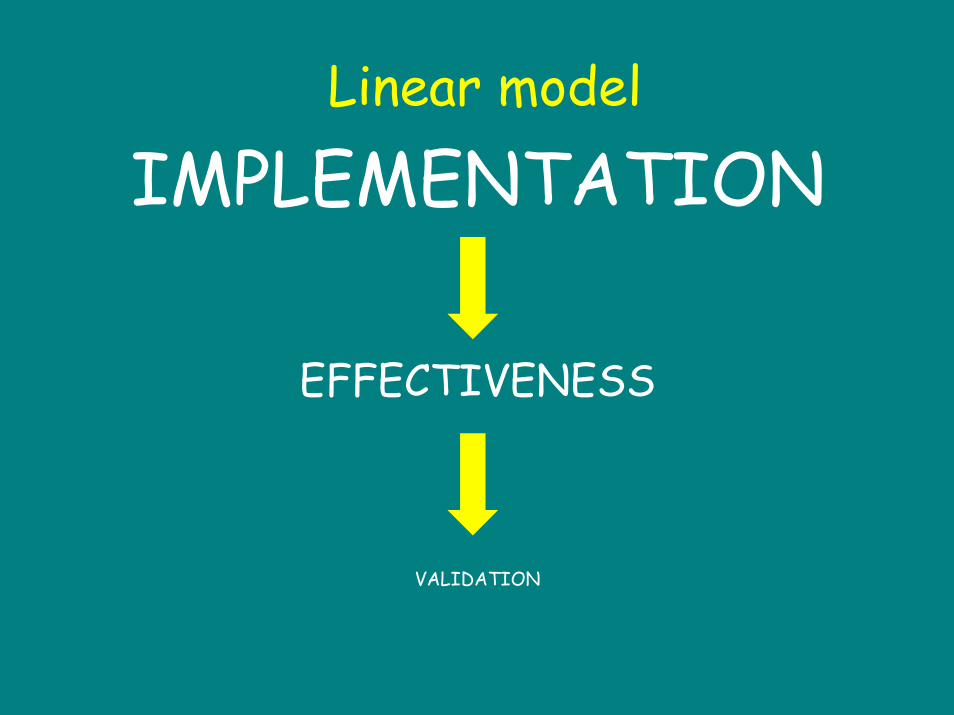
Linear model
IMPLEMENTATION
EFFECTIVENESS
VALIDATION

Did we do what we said
No consideration of whether it will achieve objective Y
Implementation

Implementation monitoring
• Necessary, but not sufficient
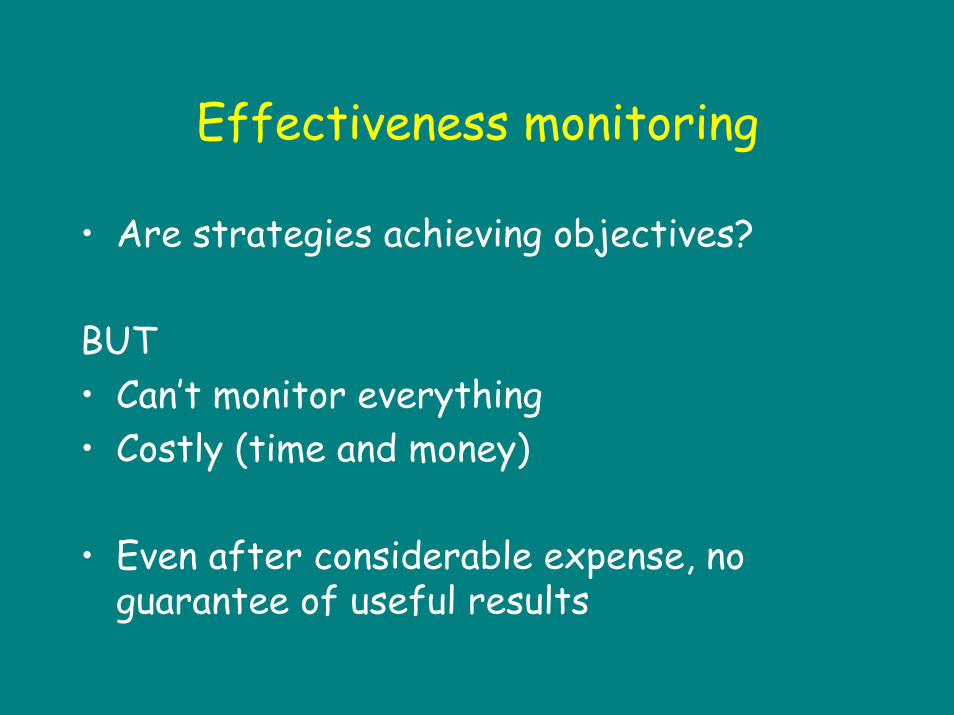
Effectiveness monitoring
• Are strategies achieving objectives?
BUT• Can’t monitor everything• Costly (time and money)
• Even after considerable expense, no guarantee of useful results

1. Hard to detect consequences

2. Cause remains a mystery
Excessive harvest
Poor road location
Road use at sensitive times
Heavy rainfall
⇓ Water quality at mouth
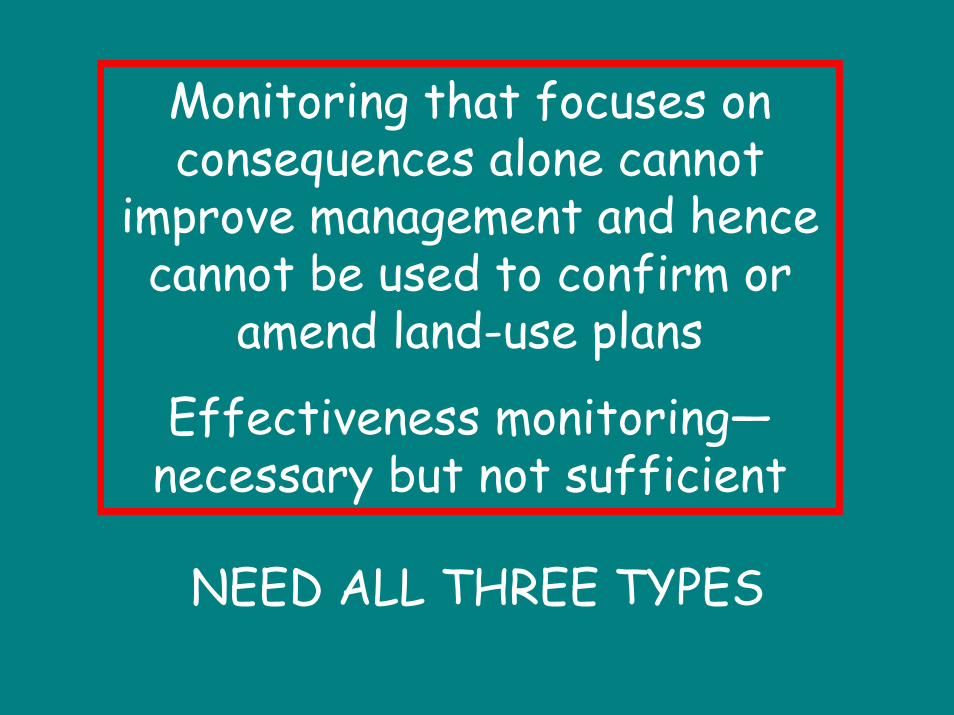
Monitoring that focuses on consequences alone cannot
improve management and hence cannot be used to confirm or
amend land-use plans
Effectiveness monitoring—necessary but not sufficient
NEED ALL THREE TYPES

Why haven’t we improved?1. Monitoring decoupled from
feedback loop2. Knowledge not represented in a way
that facilitates learning3. Linear model of monitoring4. Monitoring priorities driven
subjectively• Values drive monitoring• Effectiveness monitoring—
predominantly vertebrate censuses
Outline
• The problem• The framework
– Summarise objectives– Draw risk curves– Use the curves
• Babine example• Conclusions• Requirements for success

Monitoring Framework
1. Summarise objectives2. Draw risk curves3. Use risk curves
• to analyse risk• provide decision support• prioritise monitoring
4. Update risk curves
1. Summarise objectives
• Compile complete list of land-use objectives applying to an area
– 6 plans for the Babine• Integrate direction into one
document– Consolidate wording– Review by stakeholders to ensure
intent captured

2. Draw risk curves
• Explicit hypotheses about relationship between risk to an objective and an indicator
– risk = probability that the objective will not be achieved
– failure to achieve objective = severe consequence (or “harm that matters”)

Risk
to
obje
ctiv
e
Indicator
H
M
L
2. Draw risk curves: estimated risk
Risk curve = explicit hypothesis

Risk
to
obje
ctiv
e
Indicator
H
M
L
2. Draw risk curves: estimated risk

Risk
to
biod
iver
sity
Old seral (% of natural)
H
M
L30 70
2. Draw risk curves: biodiversity

2. Draw risk curves: uncertaintyRi
sk
Indicator
H
M
L

Actual risk level could lie anywhere in the probability hill, but is more likely near the peak.
2. Draw risk curves: uncertainty

2. Draw risk curves: uncertainty
L M H
Estimated risk
Prob
abili
ty
0
1

H
M
L30 70
2. Draw risk curves: biodiversityRi
sk t
o bi
odiv
ersi
ty
Old seral (% of natural)
3. Draw risk curves: sophistication???
• Sources vary from interviews with local experts to peer-reviewed meta-analyses of published literature
– Uncertainty varies accordingly
• Can summarise multivariate, multi-stage models if knowledge is sufficient
• Sophisticated models of uncertain data do not make better decisions

3. Using risk curves: risk analysis
• Estimate current and future risk and uncertainty
– Implementation monitoring provides current indicator values
– Targets estimate future indicator values

H
M
L30 70
3. Risk analysis: biodiversityRi
sk t
o bi
odiv
ersi
ty
Old seral (% of natural)

3. Using risk curves: provide decision support
• If risk is high and uncertainty is low, the strategy is very unlikely to achieve the objective
– Strategy and objective inconsistent
• Provides information about whether strategies are likely to be effective before spending $ on monitoring

3. Using risk curves: prioritise monitoring

3. Using risk curves: prioritise monitoring
Risk analysis Type of monitoring
Insufficient information to analyse risk
Implementation
High risk with low uncertainty
Effectiveness
High uncertainty Validation
Interpretative tables and procedures

Influence of objective on goal

Recovery period

3. Using risk curves: prioritise monitoring
• Lists of priorities for implementation, effectiveness and validation monitoring ranked– by risk and uncertainty– by other factors– with associated estimates of ease

4. Update risk curves
Objectives
Current State
Risk Analysis
Monitoring Priorities
Future State
Management Strategies
Risk Curves(relating objectives to indicators and including
uncertainty)
Implementation Monitoring
Effectiveness and validation
monitoring, research, adaptive
management

Outline
• The problem• The framework
– Summarise objectives– Build risk hypotheses– Use the curves
• Babine example• Conclusions• Requirements for success

Babine example
• 106 objective/indicator curves • About 50 had sufficient information to
complete risk analysis:– remainder need implementation monitoring– 27 priority for validation monitoring – 22 priority for effectiveness monitoring
Babine example
• From priority lists, the BWMT decided on their top priority projects in one meeting
– Water quality– Fish habitat– Riparian ecosystems– Stand structure– Wilderness experience– Bear/human interactions

No need to monitor: core ecosystems
• Low risk, low uncertainty
• No need to monitor

Implementation monitoring: fish habitat
• Low risk, low uncertainty within Riparian Corridors
• Insufficient information outside corridors
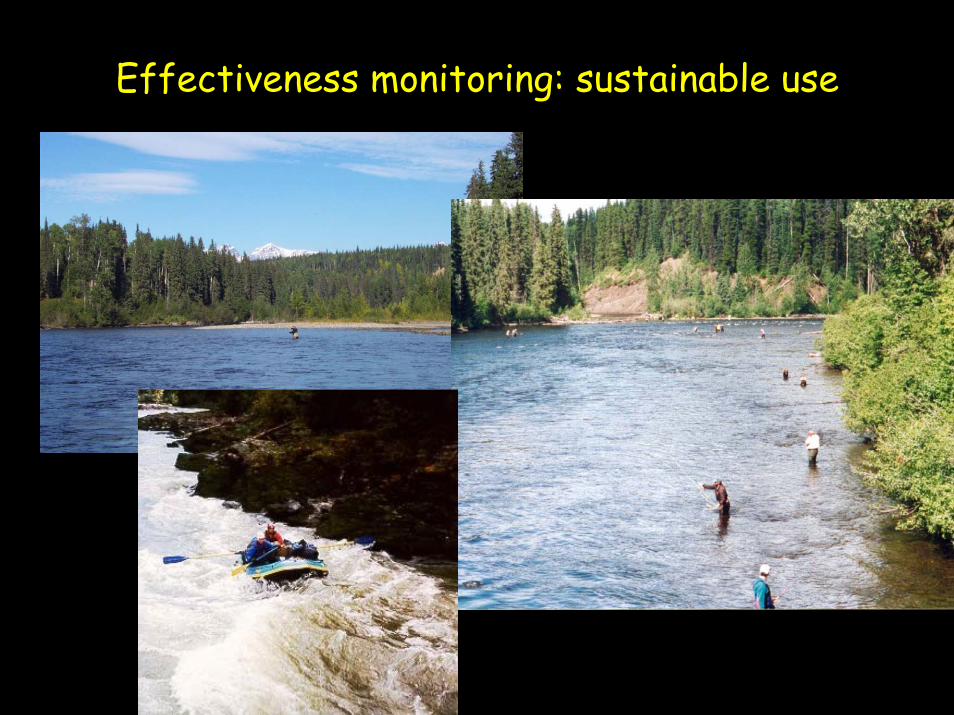
Effectiveness monitoring: sustainable use

Validation monitoring: riparian ecosystems
• Reducing uncertainty about windthrow in riparian ecosystems

Benefits of using risk curves
1. Link indicators to existing objectives—facilitating feedback to management decisions
2. Summarise current knowledge as explicit, updatable hypotheses about risk
– Avoid hidden, implicit curves that confound values and knowledge
– Force consideration of uncertainty– Facilitate discussion amongst stakeholders– Can update hypotheses and improve precision as data
improve3. Prioritise all types of monitoring objectively and
simultaneously – What not to worry about– Where to focus effort

The alternative?
• Assume knowledge is insufficient to draw curves representing hypotheses
Risk
Indicator
• Not true
• Leads to ad-hoc monitoring
$$

Requirements for success
• Experts willing to take the time to draw curves
• Group responsible for updating objectives (CRB)
• Group keeping track of knowledge base and monitoring (BWMT)
• Credible science (BV Centre)
• Government support for the process
• $ for projects

A framework to aid thinking, not a substitute for thinking