Embed Size (px)
Citation preview

Copyright © 2012 Quintiles
Making informed decisions: Assessing the strengths and weakness of study design and analytic methods for Comparative Effectiveness Research (CER)
Christopher Rowan PhD Senior Epidemiologist Quintiles | Outcome Real-World and Late Phase Research

2
What is CER?
“The conduct and synthesis of research comparing the benefits and harms of different interventions and strategies to prevent, diagnose, treat and monitor health conditions in ‘real world’ settings.”
Federal Coordinating Council for Comparative Effectiveness Research. Report to the President and the Congress. US Department of Health and Human Services. June 30, 2009

3
Why is CER important?
• To make informed healthcare decisions
However…
• Information on comparative effectiveness is often not available > Lack of funding
> Clinical research often focuses on demonstrating efficacy
• IOM estimates less than half of medical care decision making is supported by adequate effectiveness evidence

4
What’s the difference? Efficacy vs. Effectiveness
• Efficacy - “can it work?” > Measures how well interventions or services work under ideal
circumstances
• Effectiveness - “does it work?” > Examines how well interventions or services work in ‘real world’
conditions - where patients may have more complex conditions
5
What is the goal of CER?
• To improve patient outcomes by providing decision-makers…with information on which interventions are most effective and safe for specific types of patients > Decision-makers: patients, providers, policy-makers, payers
• To close the efficacy vs. effectiveness evidence gap by producing information that decision-makers can use to make informed treatment and coverage decisions

6
How can CER meet the needs of decision-makers?
• Unique considerations of each study question leads to inquiries about which study designs and methods are appropriate
• CER must be designed to meet the real-world needs
• CER must consider tradeoffs in the context of the specific decision-makers and decisions: > validity, relevance, feasibility, and timeliness

7
Purpose of presentation
• To provide brief descriptions of experimental and non-experimental study designs and methods that may be used to address CER study questions
• To highlight the strengths and limitations associated with each approach
8
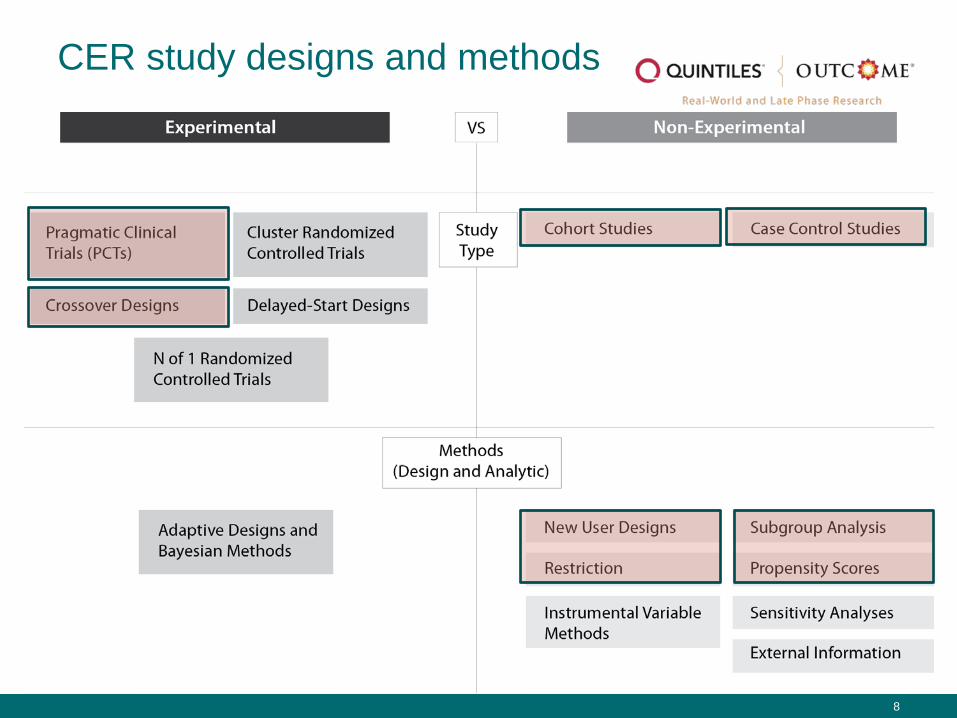
CER study designs and methods

9
Experimental methods

10
Pragmatic trials

11
Experimental studies – pragmatic clinical trials (PCT)
• Pragmatic defined: - Merriam-Webster – “…practical as opposed to idealistic”
- Wikipedia – “Pragmatism…describes a process where theory is extracted from practice, and applied back to practice to form what is called intelligent practice”
• What is a pragmatic trial? > A RCT that is designed to determine risks, benefits, and costs of an
intervention as they would occur in routine clinical practice
- …where the results my then be applied back to inform “real world” decision making

12
Explanatory trial vs. pragmatic trials
How are they different/similar?
• Explanatory trials > Measure efficacy under ideal conditions, often using carefully
defined subjects and optimal research conditions
• Pragmatic trials > Measure effectiveness (or relative effectiveness) in routine clinical
practice
> Usually including a broader range of patients (including subgroups) and outcomes that are aligned with the evidence needs of decision-makers
13
Pragmatic trials
• Pragmatic and explanatory trials are not distinct concepts > A trial may incorporate differing degrees of pragmatic and
explanatory components
• For example, a trial may have strict eligibility criteria, including only high-risk, compliant, and responsive patients (explanatory side of the spectrum), but minimal to no monitoring of practitioner adherence to the study protocol and no formal follow-up visits (pragmatic side of the spectrum)

14
Pragmatic trials
• PCTs are well-suited for understanding effectiveness, or if a clinical intervention works in the “real world”
• It is possible to incorporate pragmatic features into efficacy trials in order to provide evidence that addresses real-world use
• This may be accomplished by: > Enrolling patients likely to receive the treatment post-approval…
including high-risk subgroups
> Evaluating a broader range of outcomes, with greater emphasis on functional status, quality of life, and longer‐term impacts

15
Pragmatic trial example

16
National emphysema treatment trial (NETT)
Research objective…
• To evaluate a controversial and costly surgical procedure for the purpose of making an evidence-based national coverage decision
• One of the early stated goals of the NETT was to refine the eligibility criteria for LVRS…That is, to determine whether it was possible to identify subpopulations with differential benefit
• Due to variability in practitioner expertise and variability in standard of care, a more pragmatic design was used

17
National emphysema treatment trial (NETT)
Background…
• Use of LVRS increased in the mid-1990s as palliative therapy for severe emphysema
• However, little evidence supported its safety and effectiveness
• CMS suspended payments and cosponsored a nationwide clinical trial to evaluate the procedure…a pragmatic trial
18
National emphysema treatment trial (NETT)
Methods…
• The trial had minimal exclusion criteria
• Included 17 different clinical sites
• Included outcome measures that were relevant to patients, providers, payers > Mortality, maximum exercise capacity, and respiratory-specific
quality of life

19
NETT – findings (summarized)
Results…
• Overall, LVRS offered no survival benefit over continued medical therapy
• Subgroup analyses showed: > Survival and functional benefits among certain subgroups:
- Predominantly upper-lobe emphysema and a low baseline exercise capacity
20
NETT – author’s comments
Discussion…
• “…Our study provides reliable estimates of risk and benefit from lung-volume–reduction surgery because of the size of the sample, the use of randomization, the participation of multiple institutions, the use of well-defined measurements, the long-term follow-up, and the low crossover rates…”
• “…Because of the broad criteria for inclusion in our study, analysis of prognostic factors allowed us to identify subgroups of patients for whom decisions about lung-volume–reduction surgery are fairly clear-cut…”

21
NETT – commentary

22
Pragmatic trial: strengths and limitations
• Strengths > A positive result in a PCT can inform practice because it provides
evidence that a treatment/intervention is effective in usual “real-world” practice
• Limitations > A negative result in a PCT cannot provide information on whether the
treatment/intervention is effective under optimal conditions
> By broadening the eligibility criteria there may be more heterogeneity (lack of uniformity) of treatment effect in PCTs compared to explanatory trials
> More design and analytic challenges compared to RCTs due to potential heterogeneity of treatment effect

23
Crossover trials

24
Crossover designs in CER
• What is a crossover design? > A study design which allows patients to act as their own controls,
enabling comparisons between and within groups
A B
Subject pool
B A
Period 1 Period 2
RandomizeWashout
period

25
Considerations of crossover designs
When should Crossover designs be considered?
• Studying treatments for stable and chronic diseases
• Effects of treatments are brief and reversible
• Small detectable differences exist or are anticipated between two treatments, and the effects may be very similar
26
Considerations of crossover designs
What are the major benefits of the crossover design?
• Because patients act as their own controls… > Smaller sample sizes are needed compared to a parallel designs
> Reduces and perhaps eliminates between subject bias and known and unknown confounding
• Provide the least-biased estimates for the difference between treatments - assuming a subject’s response to treatment is consistent
27
Considerations of crossover designs
Important design considerations:
• Carryover effect: The effect of a treatment during one period “carries over” into the next period
• Period effect: Disease may naturally progress, regress, or fluctuate in severity during the study period
• Unless both effects are negligible, a crossover design loses its advantages

28
Considerations of crossover designs
• Random treatment sequencing (A/B vs. B/A) > Prevents conscious and unconscious bias
> If successful, ensures no systematic differences between patients receiving A/B versus B/A
• Crossover rules and timing of measurements > Time dependent
- Pre-specified time point (e.g., six weeks)
> Disease state dependent
- Achievement of a clinical characteristic (e.g., BP <140/90)

29
Considerations of crossover designs
• Dropout rates, statistical analysis and sample size > Dropout rates tend to be higher in crossover designs than in
parallel ones
- Patients must receive at least two treatments to provide a complete data point
- Sample size should be sufficiently large to compensate for projected dropout
> Analysis based on paired data (from the same patient)
- The patient is the basic unit for statistical analysis, and not an individual measurement
> Sample size calculations should consider within-patient variability of the effect

30
Considerations of crossover designs
A note on within-patient variability and correlated responses: • There is usually less variability within a subject than between
subjects > Resulting in a correlation of the effect between treatment sequences
(A to B or B to A) • Positive correlations often exist when comparing similar molecular
entities (i.e., drugs) with similar physiochemical properties and mechanisms of action > For example, the observed effect to treatment B is high when the
observed effect to treatment A is high (positive correlation) • When a positive correlation exists there is increased precision of
the treatment effect…therefore, > Fewer subjects are required to detect a treatment difference > Resulting in increased efficiency

31
Considerations of crossover designs
• As a positive correlation increases, the required sample size decreases
1000
500
375
250
125
25 0
100
200
300
400
500
600
700
800
900
1000
Parallel (r=n/a) Crossover (r=0.00) Crossover (r=0.25) Crossover (r=0.50) Crossover (r=0.75) Crossover (r=0.95)
Sample size comparison: parallel vs. crossover study designs at different correlation coefficients (r)
32
Lead investigator Ian Gilron, MD, from Queen's University in Kingston, Ontario, Canada, said during an interview:
• The purpose was to evaluate “…if adding an antidepressant to an anticonvulsant used for pain relief may ease difficult-to-treat neuropathic pain.”
• “Given the challenges of neuropathic pain, polypharmacy is frequently used.” But many combinations are not beneficial. “We wanted to study this combination in a rational and evidence-based way.“
33
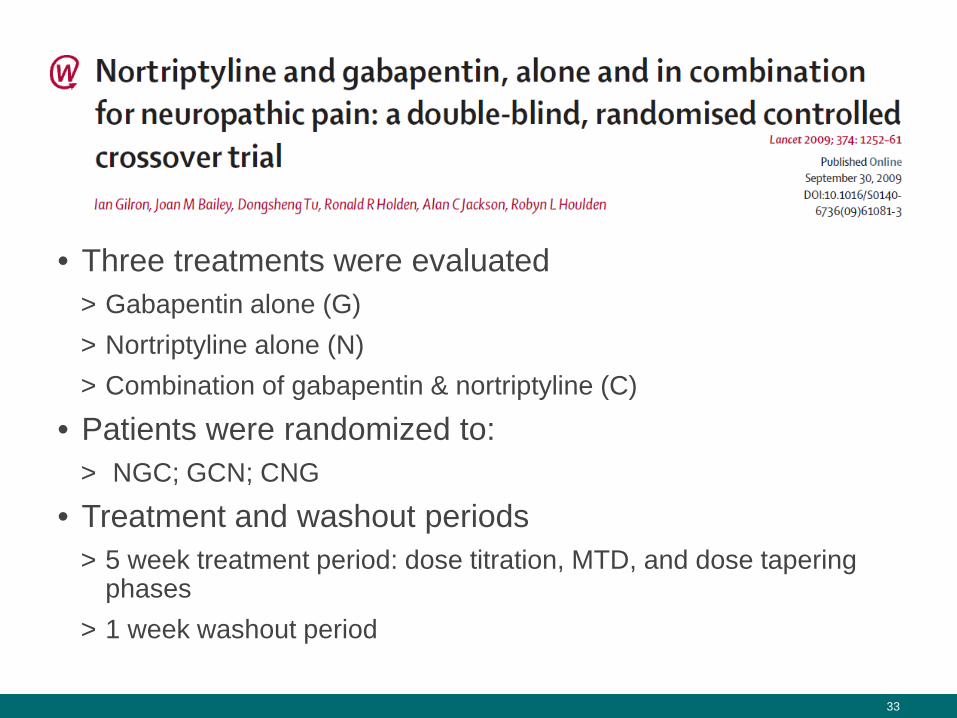
• Three treatments were evaluated > Gabapentin alone (G) > Nortriptyline alone (N) > Combination of gabapentin & nortriptyline (C)
• Patients were randomized to: > NGC; GCN; CNG
• Treatment and washout periods > 5 week treatment period: dose titration, MTD, and dose tapering
phases > 1 week washout period

34
• Used a fixed-time method to determine MTD, whereby doses were titrated towards the maximum limit of tolerability (days 0-24)
• Time-dependent switching method, where patients received the next randomly assigned treatment at the beginning of the 7th week

35
Gilron, et al. Nortriptyline and gabapentin alone and in combination for neuropathic pain…
• Main analysis included patients completing at least two study treatment periods > Providing at least one pairwise comparison; ITT
• Sample size calculation: > Was inflated to account for a 10% drop out rate found in other
studies
36
• A linear mixed model was used to evaluate: > Pain intensity, functional status, mood, QOL, and AEs
• As fixed effects the authors analyzed: > Treatment sequence
> Treatment period
> Carryover effect

37
• Briefly on the results… > The authors found combination therapy:
- Was superior to monotherapy for the treatment of neuropathic pain
- Resulted in significant improvements in sleep interference
> Adverse events was similar across all treatment groups
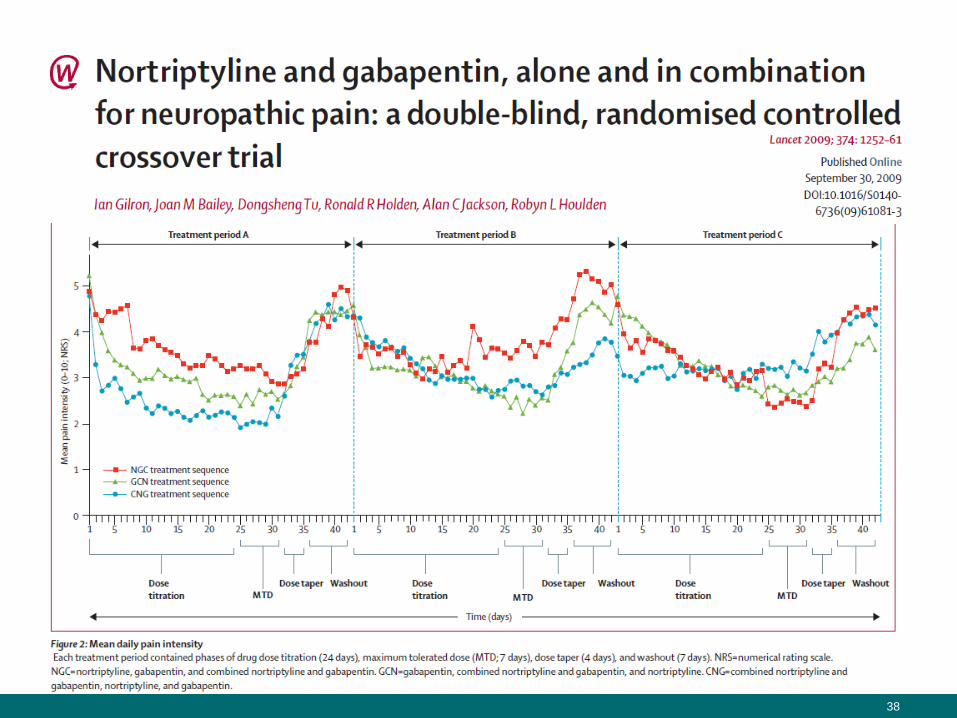
38

39
Interesting finding…
• Using the fixed-time method to determine MTD, the authors found the MTDs of nortriptyline and gabapentin were significantly lower as combination treatment than as monotherapy
• Superior efficacy was achieved with combination treatment at reduced doses without increased frequency of adverse events, suggesting that additivity for analgesia was higher than for adverse events

40
Crossover designs in CER
• Strengths of the crossover design: > Design removes between-patient variation
> Requires fewer patients than a parallel study
> Patients can indicate preferences for one treatment versus another, since patients receive multiple treatments in a single crossover study

41
Crossover designs in CER
• Limitations > No a priori guarantee that washout periods will completely control for
the carryover effects
> Washout periods:
- Long washout periods might unavoidably increase the duration of the experiment
- Incomplete knowledge may sometimes lead to inadequate washout periods…what washout period length is sufficient?
- Ethical concerns - how long can a patient be refused treatment during a washout period?
> Correlated effect - may cause complexities in both the design as well as analysis (e.g., if the correlation is unknown or negative)

42
Non-experimental methods

43
Non-experimental studies
• Studies in which patients are not randomized to receive a treatment or intervention
• Studies where “real-world” treatment decisions, patterns of care, and outcomes are observed
• Useful for studying comparative effectiveness and comparative safety

44
Non-experimental studies
• Prospective studies: > Strengths: define and collect specific data elements to answer specific
study questions
> Limitations: require time for data collection and may be more expensive and take time to conduct
• Retrospective studies: > Strengths: relatively quick and cost effective
> Limitations: limited by the availability of the existing data
- Important data elements may not be available: exposure, outcome, potential confounders
- Potentially lacking details of how data elements were defined and classified

45
Non-experimental studies
When should a researcher consider using a non-experimental study design?
• They are particularly useful in situations where: > Randomization is not possible
- Due to ethical or logistical issues
> An experimental study is impractical
- Large sample size needed or long-term follow-up
• Non-experimental studies typically have broader inclusion criteria than randomized trials > To conduct subgroup analyses to evaluate effect modification

46
Non-experimental studies
The primary limitation…confounding
• Confounding: a distortion of the exposure/outcome association as a result of another factor…uncontrolled confounding leads to bias
• Confounder: a risk factor for disease in the source population (including the unexposed), that is associated with, but not affected by the exposure or disease
• Confounding by indication: a patient characteristic that is related to the outcome of interest and which influences treatment choice (exposure)

47
Non-experimental studies
• Confounding by indication or channeling bias
Simvastatin vs. pravastatin
Muscle toxicity
Statin potency/dose
Source population: Patients exposed to simva or prava

48
Non-experimental studies
• Methods to account for confounding: > Design
- Randomization
- Matching
- Restriction
> Analysis - Stratification
- Multivariable adjustment » Traditional multivariable adjustment
» Propensity score adjustment (stratification, matching, adjustment)
» Inverse probability of treatment weighting

49
Case-control and cohort studies & methods
50
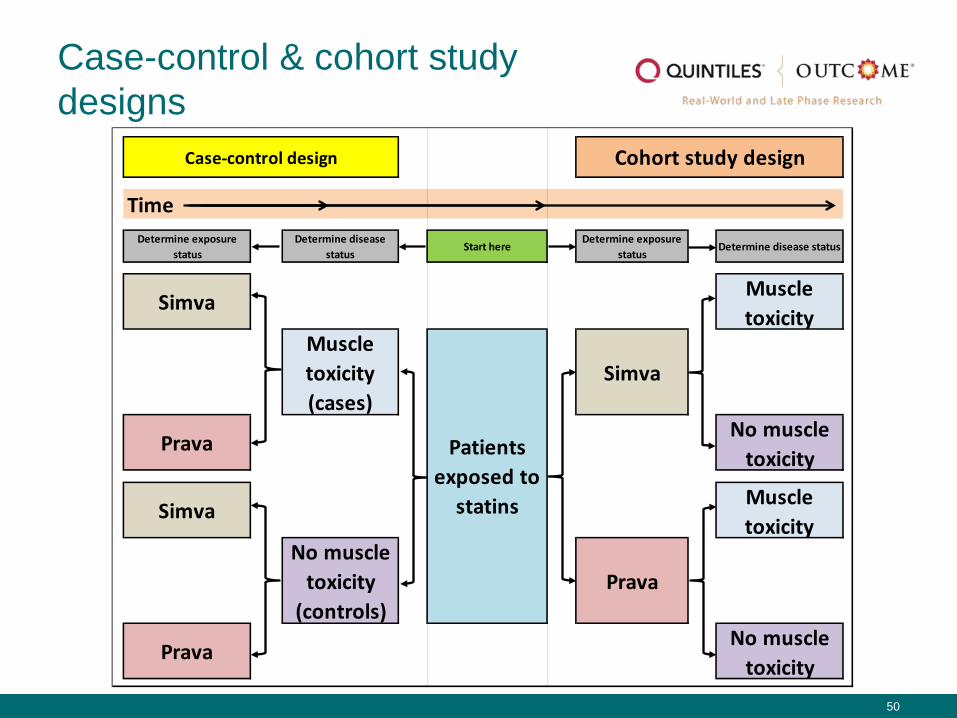
Case-control & cohort study designs
TimeDetermine exposure
statusDetermine disease
statusStart here
Determine exposure status
Determine disease status
Simva Muscle toxicity
Muscle toxicity (cases)
Simva
Prava No muscle toxicity
Simva Muscle toxicity
No muscle toxicity
(controls)Prava
Prava No muscle toxicity
Cohort study designCase-control design
Patients exposed to
statins

51
Case-control studies
• Case-control studies are particularly useful for studying rare outcomes
• Muscle toxicity associated with statins is relatively rare (e.g., rhabdomyolysis)
• Efficient study designs that may be conducted rapidly and evaluate multiple risk factors
TimeDetermine exposure
statusDetermine disease
statusStart here
Simva
Muscle toxicity (cases)
Prava
Simva
No muscle toxicity
(controls)
Prava
Case-control design
Patients exposed to
statins

52
Case-control studies
• Strengths of case-control studies: > Valuable for studying etiology of rare diseases
> Important in understanding new diseases and exposure outcome associations
> Relatively inexpensive and efficient to conduct
> Straightforward analysis
- If matching (e.g., on statin potency) conditional logistic regression may be used with covariate adjustment
- If the disease is rare, the OR estimates the RR
- If incidence density sampling is use, the odds ratio is equivalent to the incidence rate ratio

53
Case-control studies
Limitations: • Susceptible to bias if not carefully designed (e.g., recall and selection bias,
unmeasured confounding, protopathic bias)
• May be challenging to identify the source population (for the control group) from which the cases were identified
• Restricted to evaluating a single outcome
• If matching, cannot assess effects of matching variables
• Incidence rates not usually calculable (unless using a nested case-control design with incidence density sampling)
• If the source population arises from a fully enumerated population (e.g., a claims or EMR data base), a cohort study provides a more analytic options (e.g., time to event and person-time analyses using Cox PH regression or Poisson regression)

54
Cohort studies
• May be prospective or retrospective
• Can assess several outcomes (e.g., myalgia, myositis, rhabdomyolysis)
• Useful to reveal etiologic relationships
Time
Start hereDetermine exposure
statusDetermine disease status
Muscle toxicity
Simva
No muscle toxicity
Muscle toxicity
Prava
No muscle toxicity
Cohort study design
Patients exposed to
statins

55
Cohort studies
Strengths of cohort studies:
• Temporality of exposure/outcome relationship is easier to establish > Prospective design
> Retrospective methods: new user designs, excluding patients with prior/prevalent outcomes
• Time-to-event analysis is possible

56
Cohort studies
Strengths of cohort studies (continued): • A variety of analytic methods may be used:
> Logistic regression > Poisson regression and Cox proportional hazards regression (using person-time of exposure)
• Measures of effect: > Risk, risk difference, relative risk (a.k.a. risk ratio)
- Relative risk is the quotient of the risk of disease among the exposed and the risk of disease among the unexposed
> Odds ratio > Incidence rates and Incidence rate ratios
- Incidence rate is the quotient of the number of new outcome occurrences and person-years of observation or exposure (using person-time)
> Hazard ratio - Represents the hazard or chance of an event occurring in the exposed group relative to the
hazard of the event in the unexposed group, for those not yet experiencing the event

57
Cohort studies
Limitation of cohort studies:
• May require large sample size (e.g., rare diseases)
• May require long follow-up time (e.g., diseases with long-latency) > Problematic if:
- Temporal changes in exposure status, diagnostic criteria, or treatment patterns occur over time
- Loss to follow-up occurs and is associated with exposure and/or outcome
• May be expensive (e.g., prospective studies)

58
Methods to improve validity of non-experimental methods

59
Comparative safety example
• New user designs
• Restriction
• Propensity score methods
60
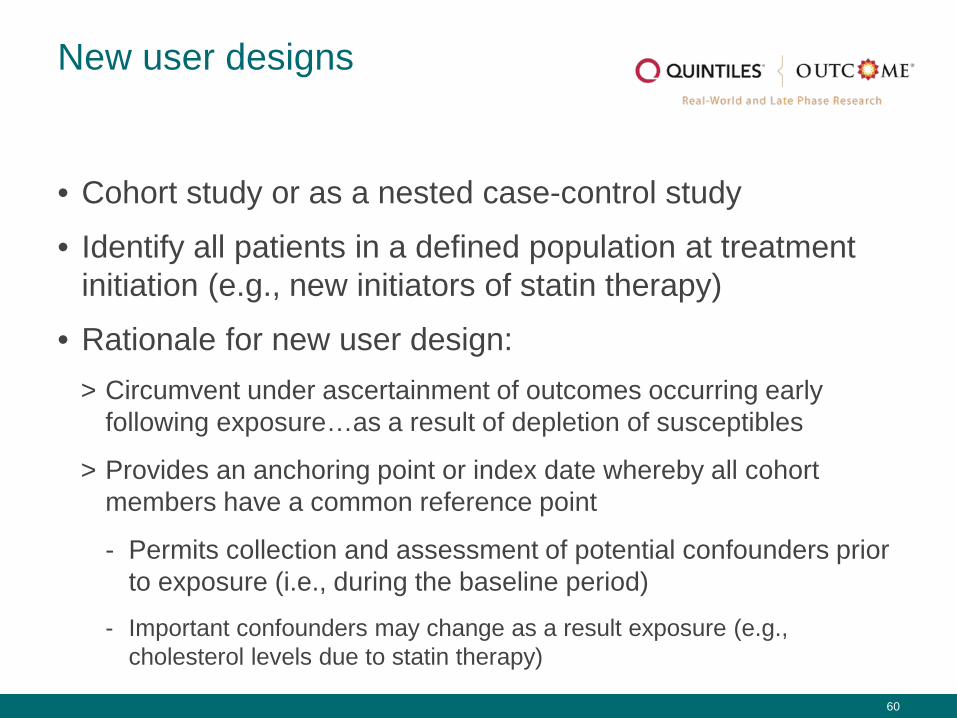
New user designs
• Cohort study or as a nested case-control study
• Identify all patients in a defined population at treatment initiation (e.g., new initiators of statin therapy)
• Rationale for new user design: > Circumvent under ascertainment of outcomes occurring early
following exposure…as a result of depletion of susceptibles
> Provides an anchoring point or index date whereby all cohort members have a common reference point
- Permits collection and assessment of potential confounders prior to exposure (i.e., during the baseline period)
- Important confounders may change as a result exposure (e.g., cholesterol levels due to statin therapy)
61
New user designs
Limitations:
• Challenging to identify new users > Prospective studies – may have to rely on patient recall
> Retrospective studies – limited to data available in the database
- Require a 6 or 12 month baseline period
• Reduce sample size by eliminating prevalent users…reduced power

62
Restriction
• Restriction is a method employed to reduce bias by making comparison groups as similar as possible
• Attempt to balance predictors of the study outcome • Examples of restriction:
> New user design – a form of restriction (e.g., new statin initiators) - Important if prior exposure (simva vs. prava) associated with probability of
experiencing the outcome (muscle toxicity)
> Exclude patients with prior evidence of the outcome (e.g., muscle toxicity) - Important if prior outcome associated with future exposure (simva vs. prava)
and/or a subsequent outcome occurrence
> Comorbidities (e.g., prior MI, diabetes, hypertension, organ transplant)
> Equipotent statin doses

63
Restriction
• Unknown or unaccounted for bias threatens the validity of all observational studies
• Secondary analyses restricted to subgroups or time periods are sensitivity analyses that attempt to remove/expose bias and/or expose the presence of effect modification
• In pharmacoepidemiology some of these include: > Dose response analyses (e.g., equipotent doses) > Duration of response analyses (e.g., 0-3, 4-6, 7-12, >12 months) > Stratification by subgroup (e.g., specific statin, comorbidity) > Outcome validation studies (restricted to confirmed outcomes)
- To evaluate information bias via outcome misclassification > Stratification by time period to evaluate secular trend of effect
(e.g., 1990-1995, 1995-2000, 2000-2005, >2005)
64
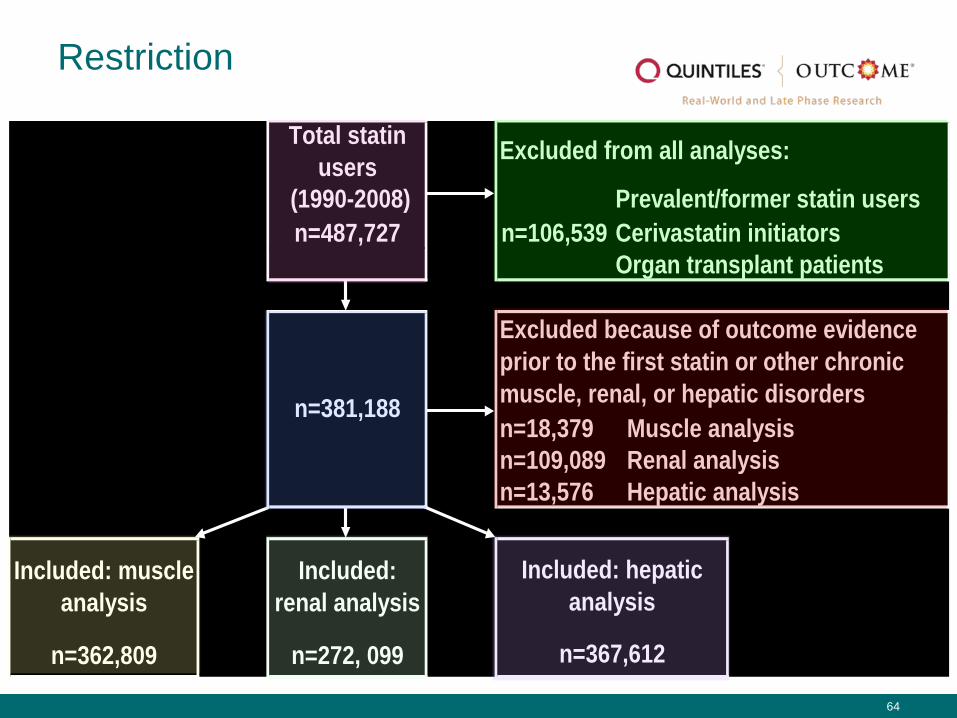
Total statin users
(1990-2008) Prevalent/former statin usersn=487,727 n=106,539 Cerivastatin initiators
Organ transplant patients
n=18,379 Muscle analysisn=109,089 Renal analysisn=13,576 Hepatic analysis
Included: muscle analysis
Included: renal analysis
n=362,809 n=272, 099
Included: hepatic analysis
n=367,612
Excluded from all analyses:
n=381,188
Excluded because of outcome evidence prior to the first statin or other chronic muscle, renal, or hepatic disorders
Restriction

65
Restriction
• The effect changes as statin potency increases (in this case not significantly…)
66
Restriction
Limitations of restriction:
• If a characteristic is used as a restriction variable it cannot act as a confounder
• Limits generalizability of findings to included population > Therefore, the population to which HCPs may apply the results is
limited

67
Propensity score methods
• Methods to adjust for confounding: > Design
- Randomization - Matching - Restriction
> Analysis - Stratification - Multivariable adjustment
» Traditional multivariable adjustment
»Propensity score adjustment (stratification, matching, adjustment)
» Inverse probability of treatment weighting

68
Propensity score methods
• Propensity score (PS) used to address confounding in non-experimental studies
• PS is the predicted probability of exposure conditional on baseline factors (e.g., age, sex, race, smoking status, prior MI, diabetes, CKD, etc.)
• PS translates multi-dimensional covariate matrix to a single dimension covariate
• PS is used to balance covariates between treatment groups… > Conditional on the PS, treatment assignment is independent of
observed covariates

69
Propensity score methods
• PS is particularly advantageous when a large number of variables must be accounted for, relative to the number of outcomes in a study (Cepeda, et al.)
• Which variables to include in PS? > Brookhart, et al. AJE 2006: Variable selection for the propensity
score
> Showed increased precision by including variables associated with the outcome (regardless of assoc. with exposure)
• Analytic applications: > Matching, stratification, modeling, or weighting

70
Propensity score methods
• PS does not address unmeasured or unknown variables
• PS matching includes only patients who can be matched (i.e., with overlapping PS)… > Reduced sample size
> May omit important patients in the PS tails…who were unlikely to receive the their given treatment…effect may be different
• More complex PS use (e.g., weighting) makes it difficult to visually compare groups

71
02
46
8D
ensi
ty
0 .2 .4 .6 .8 1Pr(e_stat3a4)
Kernel density estimatekdensity ps_3
kernel = epanechnikov, bandwidth = 0.0119
Kernel density estimate
0.2
.4.6
.81
Pr(e
_sta
t3a4
)
0 1
0.2
.4.6
.81
Pr(
e_st
at3a
4)
0 11 2 3 4 5 1 2 3 4 5
Box and whisker plot by PS quintiles
PS density graph by exposure
PS box and whisker plot

72
CER study designs and methods

73
http://www.npcnow.org/Public/Research___Publications/Publications/pub_cer/cer_study_designs2012.aspx

74
Thank you! Post-Approval Summit
Key notes: Michael Rosenblatt & Joe Selby May 1-2, 2012
Harvard Medical School, Boston www.postapproval.org
Questions?

75
Back up slides
75

76
Equivalence Study
0 +10 -10 A worse than B
A better than B
Failed superiority and equivalence test
Superiority proven
Failed equivalence test
Equivalence proven
Non-inferiority proven
Adapted from Gastroenterology 2004;126:1700-10

77
Stetting the stage
• Comparative effectiveness research (CER) > Research that occurs over entire lifecycle of a produce rather than
for a one time “at-launch” review
> Early and/or provisional access where studies of effectiveness and safety are conducted post-launch
> “Coverage with evidence development”

78
What’s the difference? Efficacy vs. Effectiveness
• Efficacy - “can it work?” > Measures how well interventions or services work under ideal
circumstances
- Key features: selected patient population, randomization, assessed under ideal conditions
• Effectiveness - “does it work?” > Examines how well interventions or services work in ‘real world’
conditions - where patients may have more complex conditions
- Key features: heterogeneous patient population, randomized and non-randomized, assessed under usual circumstances of health-care practice
79
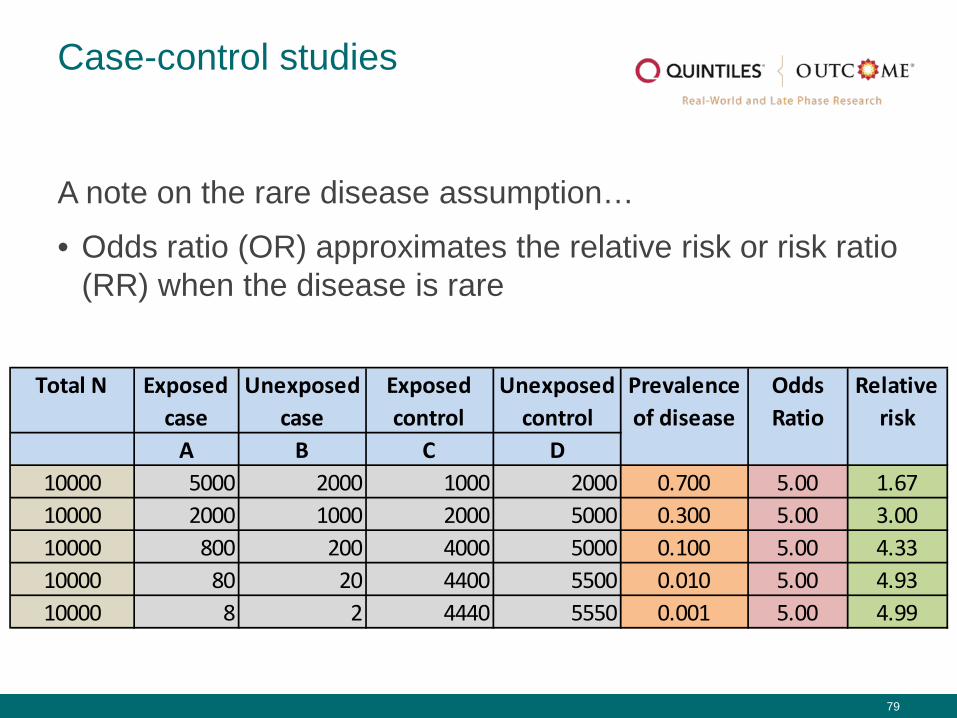
Case-control studies
A note on the rare disease assumption…
• Odds ratio (OR) approximates the relative risk or risk ratio (RR) when the disease is rare
Total N Exposed case
Unexposed case
Exposed control
Unexposed control
A B C D10000 5000 2000 1000 2000 0.700 5.00 1.6710000 2000 1000 2000 5000 0.300 5.00 3.0010000 800 200 4000 5000 0.100 5.00 4.3310000 80 20 4400 5500 0.010 5.00 4.9310000 8 2 4440 5550 0.001 5.00 4.99
Prevalence of disease
Odds Ratio
Relative risk