Embed Size (px)
Citation preview

Making Fiscal
Policy ‘Work’ CAN FISCAL POLICY DO MORE TO ADDRESS POVERTY, INEQUALITY,
GROWTH & JOBS IN AUSTERE TIMES?
MACROECONOMIC & FISCAL MANAGEMENT
Triple Challenges Are Center Stage
Poverty Every night 12 million South Africans go to bed without food
Inequality 1 in every 17 individuals in Sandhurst have wealth in excess of US$30 million (R400 million)
Alexandra’s average household income is < R2 700 a month
Unemployment
There are more people unemployed (expanded definition) in South Africa than the combined population of
Botswana, Namibia, and Lesotho
MACROECONOMIC & FISCAL MANAGEMENT

Challenge 1: Poverty
High For A Middle Income Country
South Africa
35%
17%
Poverty Headcount Ratio at $3.10 a day (2011 PPP) (% of Population)
Poverty Headcount Ratio at $1.90 a day (2011 PPP) (% of Population)
Upper Middle
Income
5%
1%
MACROECONOMIC & FISCAL MANAGEMENT

Challenge 2: Inequality
World’s Most Unequal Country
0.69
0.43
South Africa
Upper middle
income country
average
UMIC
comparison:
MACROECONOMIC & FISCAL MANAGEMENT
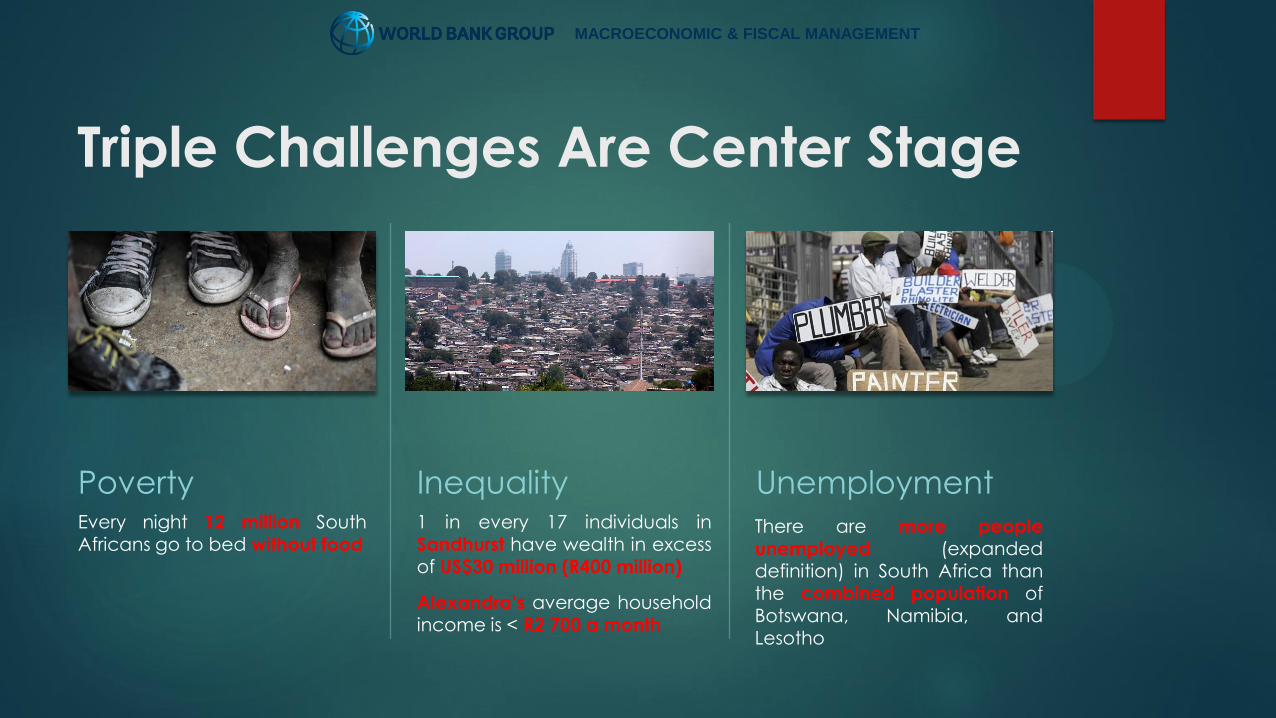
Challenge 3: Unemployment
Is High By Global Standards
Youth Unemployment Rate Unemployment Rate in 2019
MACROECONOMIC & FISCAL MANAGEMENT

Demographic Change
Implies Jobs Challenge Will Grow
The working age
population is 65% of the total population
MACROECONOMIC & FISCAL MANAGEMENT
Source: South African Economic Update 7
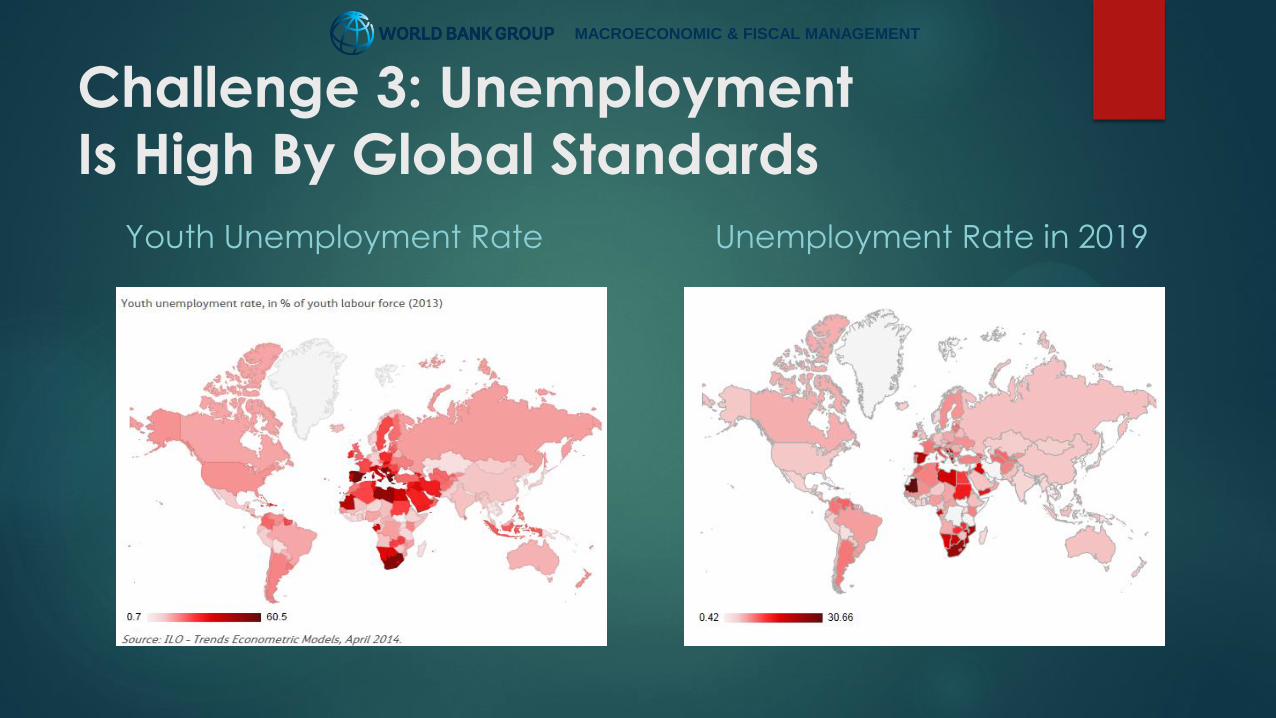
As South Africa Currently Fails to
Generate Enough Jobs
Source: Statistics South Africa, Labor Force Surveys
Since 2000
Only 2.8 million out of the
8.3 million extra working age
population found jobs
Today
Only 40% of the
working age
population work
Manufacturing
Agriculture
Mining
MACROECONOMIC & FISCAL MANAGEMENT

Job Creation Has Become More
Skilled
Source: Statistics South Africa, Labor Force Surveys Source: Statistics South Africa, Labor Force Surveys
MACROECONOMIC & FISCAL MANAGEMENT

Leaving Many Unskilled Youth Facing
The Prospect Of Unemployment
Source: Statistics South Africa, Labor Force Surveys
South Africa Unemployment Rate 25.5%
Upper Middle Income Countries Average 11%
MACROECONOMIC & FISCAL MANAGEMENT
Source: Statistics South Africa, Labor Force Surveys

Absent Job Creation
Growth Dividend Missed
Inequality & Poverty Remain By 2030:
MACROECONOMIC & FISCAL MANAGEMENT
Source: South African Economic Update 7

How Can Fiscal Policy Address The
Triple Challenges In Austere Times?
MACROECONOMIC & FISCAL MANAGEMENT
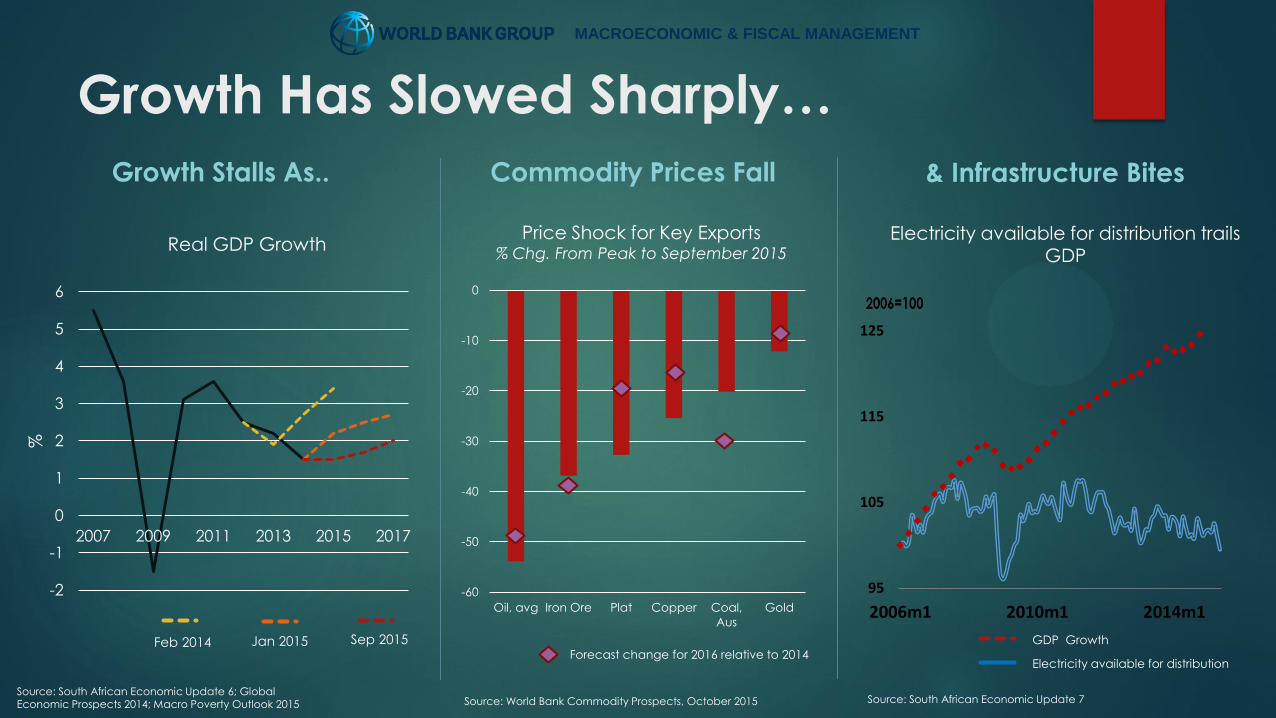
Growth Has Slowed Sharply…
& Infrastructure Bites
95
105
115
125
2006m1 2010m1 2014m1
Commodity Prices Fall
-60
-50
-40
-30
-20
-10
0
Oil, avg Iron Ore Plat Copper Coal,
Aus
Gold
Growth Stalls As..
-2
-1
0
1
2
3
4
5
6
2007 2009 2011 2013 2015 2017
%
Feb 2014 Jan 2015 Sep 2015
Source: South African Economic Update 6; Global Economic Prospects 2014; Macro Poverty Outlook 2015
Real GDP Growth
Price Shock for Key Exports % Chg. From Peak to September 2015
Electricity available for distribution trails GDP
Source: World Bank Commodity Prospects, October 2015 Source: South African Economic Update 7
Forecast change for 2016 relative to 2014
GDP Growth
Electricity available for distribution
MACROECONOMIC & FISCAL MANAGEMENT

….Exhausting Fiscal Space
Adjustment Will Imply Hard Choices
25
30
35
40
45
50
FY08/09 FY09/10 FY10/11 FY11/12 FY12/13 FY13/14 FY14/15 FY15/16 FY16/17 FY17/18
Gross Debt/GDP
2009 Budget 2010 Budget 2011 Budget 2012 Budget
2013 Budget 2014 Budget 2015 MTBPS
Source: South African National Treasury Budget Review 2009-2015
MACROECONOMIC & FISCAL MANAGEMENT
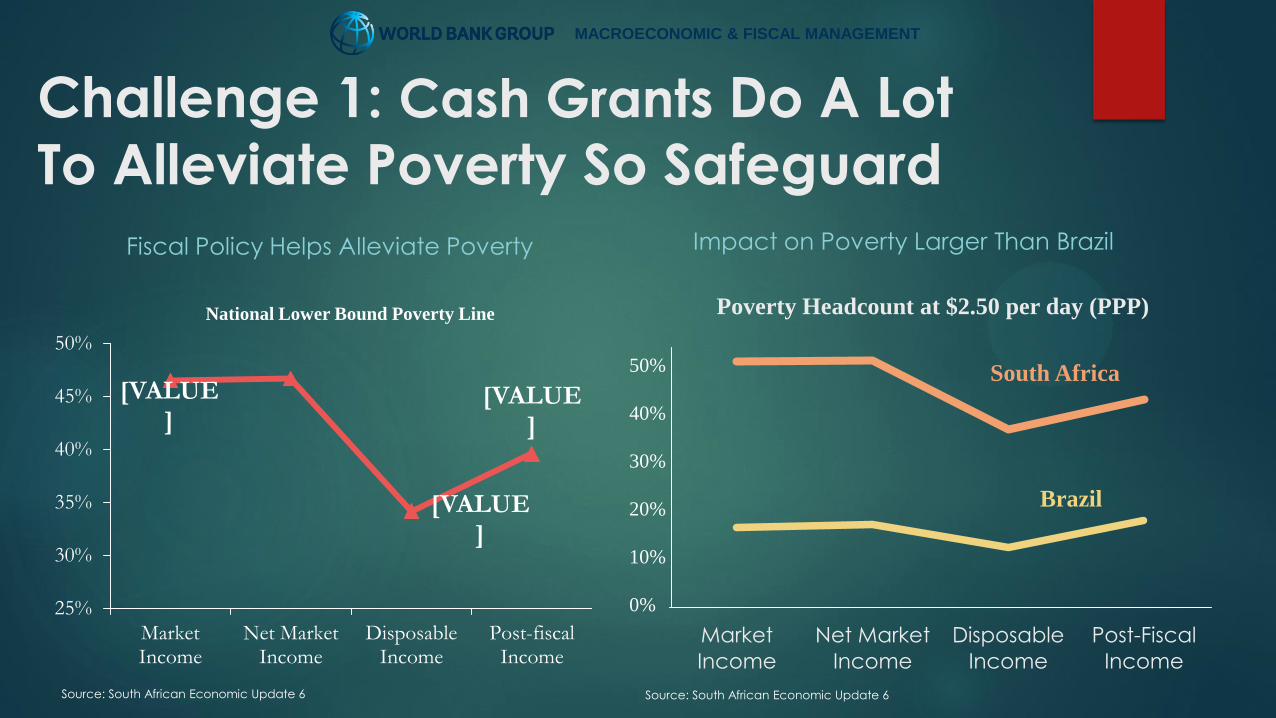
Challenge 1: Cash Grants Do A Lot
To Alleviate Poverty So Safeguard
Fiscal Policy Helps Alleviate Poverty Impact on Poverty Larger Than Brazil
[VALUE]
[VALUE]
[VALUE]
25%
30%
35%
40%
45%
50%
MarketIncome
Net MarketIncome
DisposableIncome
Post-fiscalIncome
Market
Income
Net Market
Income
Disposable
Income
Post-Fiscal
Income
Poverty Headcount at $2.50 per day (PPP)
Brazil
South Africa 50%
40%
30%
20%
10%
0%
National Lower Bound Poverty Line
Source: South African Economic Update 6 Source: South African Economic Update 6
MACROECONOMIC & FISCAL MANAGEMENT

Challenge 2: Taxes & Cash Grants Narrow Income Gap But 0.77 Gini Requires Jobs
Taxes & Spending Lower Gini Reduction Large But Gini Is Still Higher
Than Elsewhere
0.771 0.75
0.694 0.695
0.25
0.35
0.45
0.55
0.65
0.75
Market
Income
Net
Market
Income
Disposable
Income
Post-Fiscal
Income
Final
Income
Gini Coefficient
0.579
0.771
0.694
0.25
0.35
0.45
0.55
0.65
0.75
Market
Income
Net Market
Income
Disposable
Income
Post-Fiscal
Income
Final Income
Gini Coefficient
0.4
South Africa (2010)
Brazil (2009)
Mexico (2010)
Indonesia (2012)
MACROECONOMIC & FISCAL MANAGEMENT

Challenge 3: How Does Fiscal
Policy Support Growth and Jobs?
ASSESSING GROWTH & JOB IMPACT OF FISCAL INTERVENTIONS
MACROECONOMIC & FISCAL MANAGEMENT

Fiscal Instruments & Private Sector
Taxes
•Corporate
•Labor
• Indirect
Infrastructure
•Raises Demand
•A Public Good
•Expands Productive Capacity Private
Social Benefits
•Social Benefits (Health and Education)
•Pensions
•ALMP
•Education
•Health
MACROECONOMIC & FISCAL MANAGEMENT

Just One Example:
How The Corporate Tax System Works IS THE CORPORATE TAX SYSTEM SUPPORTING INVESTMENT AND JOB
CREATION?
MACROECONOMIC & FISCAL MANAGEMENT

What Is A Marginal Effective Tax Rate?
A Tool That Measures Burden of Tax On The Marginal Investment
With Taxes Rate Of Return Has To Rise So After Tax Investor Can Still Pay Cost of
Finance + Depreciation
METR: Return On Marginal Investment Equal Return on Risk Free Investment
METR=0 But Revenue Collections Are Positive: Tax Is Collected On All
Investments Earning Above Normal Returns
METR Can Be Negative Implying Marginal Investment is Subsidized

Finding 1: Effective Corporate Tax
On Manufacturing Is Competitive
MACROECONOMIC & FISCAL MANAGEMENT
Effective Corporate Tax Rates By Country, 2014
South Africa
-20
-10
0
10
20
30
40
50
60
Arg
en
tin
aC
ha
dU
zbe
kis
tan
Co
lom
bia
Fra
nc
eU
rug
ua
yB
razi
lC
ost
a R
ica
U.S
.R
uss
iaS.
Ko
rea
Ve
ne
zue
laP
eru
Ind
iaJa
pa
nG
uya
na
Pa
kis
tan
Eth
iop
iaB
oliv
iaA
ust
ralia
Ita
lyD
om
inic
an
R.
Ge
rma
ny
Au
stria
Rw
an
da
Ka
zakh
sta
nSp
ain
Ph
ilip
pin
es
Ira
nEc
ua
do
rZa
mb
iaIn
do
ne
sia
U.K
.N
ew
Ze
ala
nd
No
rwa
yC
hin
aP
an
am
aG
eo
rgia
Po
rtu
ga
lD
en
ma
rkTu
nis
iaN
ige
ria
Slo
va
k R
ep
ub
licM
exic
oLu
xe
mb
ou
rgM
ala
ysi
aSa
ud
i Ara
bia
Be
lgiu
m Fiji
Hu
ng
ary
Est
on
iaV
ietn
am
Mo
roc
co
Sw
itze
rla
nd
Ma
da
ga
sca
rN
eth
erla
nd
sFin
lan
dSo
uth
Afr
ica
Sw
ed
en
Gh
an
aIs
rae
lP
ola
nd
Eg
yp
tTa
nza
nia
Gre
ec
eC
zec
h R
ep
ub
licTa
iwa
nB
an
gla
de
shLe
soth
oTh
aila
nd
Ukra
ine
Ice
lan
dC
roa
tia
Sie
rra
Le
on
eR
om
an
iaJo
rda
nP
ara
gu
ay
Ja
ma
ica
Slo
ve
nia
Ku
wa
itIre
lan
dB
ots
wa
na
Ma
uritiu
sC
hile
Ug
an
da
Ca
na
da
Latv
iaSin
ga
po
reQ
ata
rTr
inid
ad
Bu
lga
ria
Turk
ey
Ho
ng
Ko
ng
Se
rbia
Ke
nya
Source: Chin and Mintz, 2014
Finding 1. Effective Tax Burden On
Services Compares Well
MACROECONOMIC & FISCAL MANAGEMENT
0%
10%
20%
30%
40%
World Wide Manufacturing and Service METRs
METR for manufacturing METR for services
Low METR AFR
Asia Latin America

Finding 2. Depreciation Allowances
Work To Reduce Effective Tax Burden
-5.0%
0.0%
5.0%
10.0%
15.0%
20.0%
25.0%
30.0%
Statutory 28% CIT Rate
Marginal Effective Tax Rate on Capital By Sector
MACROECONOMIC & FISCAL MANAGEMENT

Finding 3. Interest Deductibility
Reduces Effective Burden Further
0
0.1
0.2
0.3
0.4
0.5
0.6
0.7
0.8
0.9
-30%
-25%
-20%
-15%
-10%
-5%
0%
5%
10%
15%
De
bt-
to-A
sse
t R
atio
Ma
rgin
al Eff
ec
tiv
e T
ax R
ate
Marginal Effective Tax Rate Using Actual Debt-Asset Ratio of Each Sector
MACROECONOMIC & FISCAL MANAGEMENT
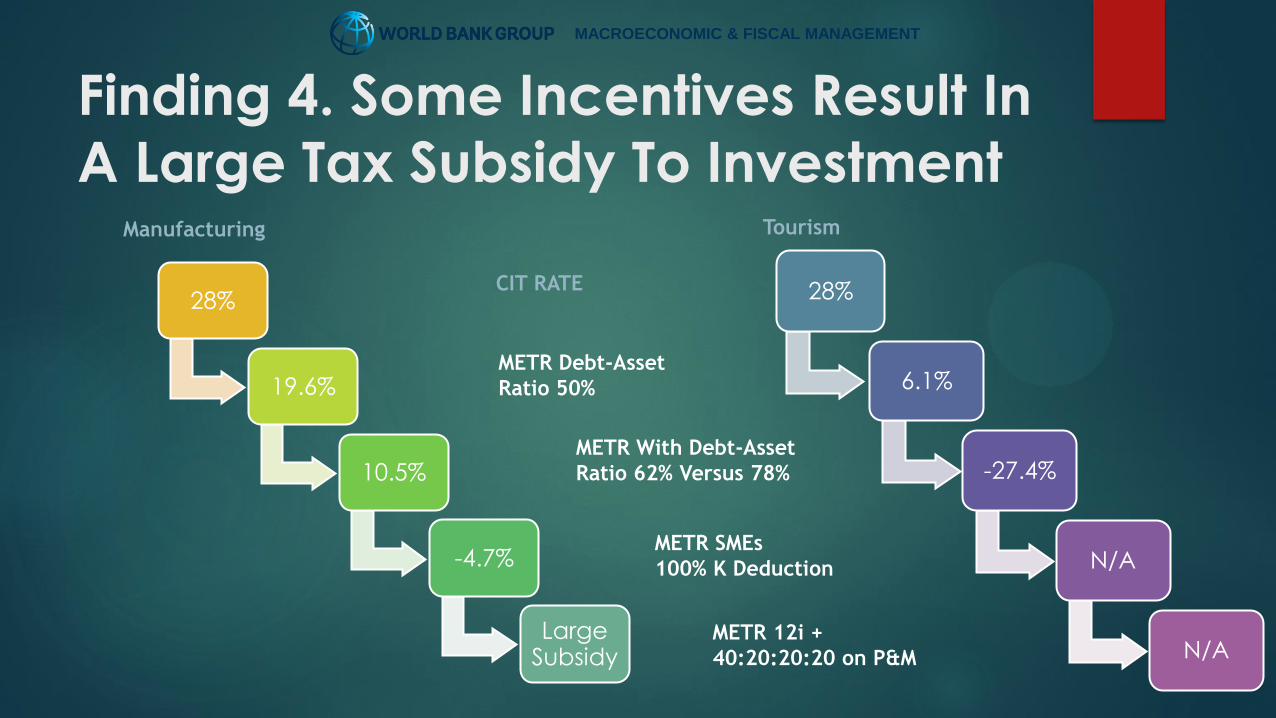
Finding 4. Some Incentives Result In
A Large Tax Subsidy To Investment
28%
19.6%
10.5%
-4.7%
Large Subsidy
CIT RATE
METR Debt-Asset
Ratio 50%
METR With Debt-Asset
Ratio 62% Versus 78%
METR SMEs
100% K Deduction
28%
6.1%
-27.4%
N/A
N/A
Manufacturing Tourism
METR 12i +
40:20:20:20 on P&M
MACROECONOMIC & FISCAL MANAGEMENT

But Does It Work? HAVE FIRMS THAT BENEFITTED FROM ACCELERATED DEPRECATION
ALLOWANCES & OTHER TAX BENEFITS INVESTED MORE?
MACROECONOMIC & FISCAL MANAGEMENT

Is Corporate Tax System
Encouraging Investment? 344,000 Firms With 2 Million Observations From 2009 to 2012
Reduced To A Sample Of 201,687 Observations Covering 74,515 Firms
MACROECONOMIC & FISCAL MANAGEMENT

3 Sectors Received 73% Of Tax
Forgone From R72 bn in Deductions
MACROECONOMIC & FISCAL MANAGEMENT
- 2.0 4.0 6.0 8.0 10.0 12.0
PUBLICHOUSE
EXTSPORT
ART-RECEDUC
RESCHHEALTHTRADE
HOTL-RESTSERV
FINREALPROF
TRANSCONST
AGRIICT
MININGUTIL
MANF
Foregone Tax From Incentives Claimed 2009-12
In Rand Billion
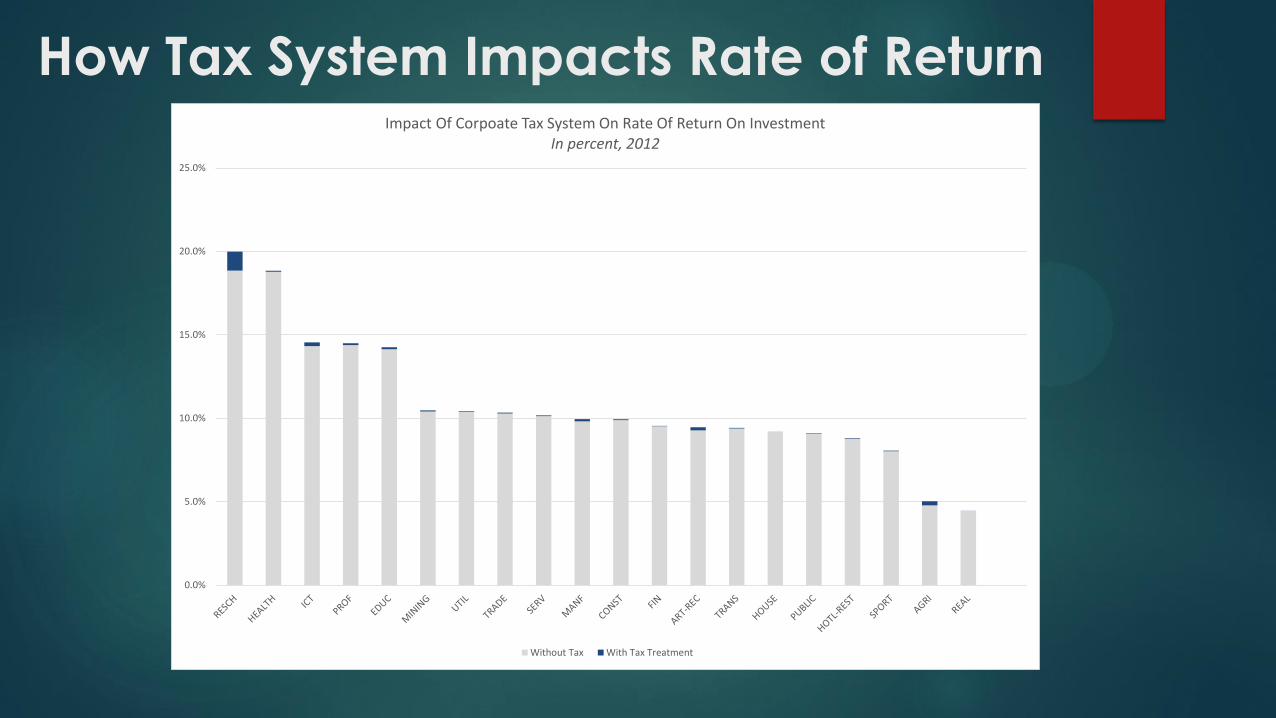
How Tax System Impacts Rate of Return
0.0%
5.0%
10.0%
15.0%
20.0%
25.0%
Impact Of Corpoate Tax System On Rate Of Return On Investment In percent, 2012
Without Tax With Tax Treatment

Tax Factors That Impact Firm’s Cost Of Capital
Asset Structure
• Buildings (64.5% of Total Assets)
• Plant & Machinery (24.5% of Total Assets)
• Other Assets (11.0% of Total Assets)
Standard Allowances
• Building: 5% depreciation over 20 years
• Plant and Machinery: Straight Line Depreciation Over 5 years
• Wear & Tear Allowance On Plant & Machinery
Additional Incentives
• Manufacturing Accelerated Depreciation Allowance (12 bc) (40:20: 20:20)
• SME Accelerated Depreciation 12e (100% Year 1)
• Machinery, Ship, Aircraft Allowance
• Urban Development Zone Deduction
Leverage
• Actual Debt-Asset Ratio Reported in Tax Return

…Causes User Cost Of Capital To Vary
Example: Metals, Machinery, Equipment
User Cost of Capital Ranges From A Low Of 6% To A High of 20%
No allowance
SMEs
Wear and tear
Machinery, ship or
aircraft
Depreciable asset
Urban development
zones

“ ”
Investment Rises by 2.8%
For Every 1 PP Drop In
Firm’s Cost Of Capital EVIDENCE FROM FIXED EFFECTS REGRESSION BASED ON 201,687 OBSERVATIONS COVERING 74,515 FIRMS.

Investment Response By Sector To Tax
Induced Changes in Cost of Capital
•Agriculture
•Manufacturing
•Services (Private & Public)
High Response
(Coefficient > 1.5%)
•Construction
•Utilities
Medium Response
(Coefficient < 1.5%)
•Mining No Significant
Response
(At 5% level)
Is The Corporate Tax System
Helping Job Creation? Supplement Cost of Capital by Firm From CIT Tax Returns
With Formal Sector Jobs Impact From PIT Tax Returns
MACROECONOMIC & FISCAL MANAGEMENT

How Are Tax Benefits Targeted?
Investment Returns + Jobs Potential
MACROECONOMIC & FISCAL MANAGEMENT
There are a few job
intensive sectors where
incentives could help raise
returns on investment
Clear Case? Agriculture
On Boundary?
Transport
Construction
Hotels
Low Jobs
Low Return
Low Jobs
High Return

We Just Assessed The Corporate
Tax System
Fiscal Spent R4.2 bn in 2011/12
MACROECONOMIC & FISCAL MANAGEMENT
Customs Incentives For The Motor Vehicles Sector
Fiscal Spent R16.3 bn in 2011/12

Evidence Suggests
Tax System Lowers Marginal Effective Tax Burden On Investment
Impact Of Tax System On Rate of Return Is Minimal: Other Economic Factors Matter
More
Investment Does Respond Strongly To Tax Induced Changes in Cost of Capital
But Benefits In The Corporate Tax System Not Necessarily Going To Most Labor
Intensive Sectors

Conclusion
In Times Of Austerity Evidence Based Analysis Can:
Help Evaluate If Policies Have Intended Impacts
Can Help Shed Light On Potential Trade-Offs Between Policies That Aim To
Address Poverty, Inequality and Unemployment

Thank You
We Would Like Thank You All Who Contributed and Supported This Effort
SARs
DTC
National Treasury