Embed Size (px)
Citation preview
MAKERERE UNIVERSITY
MAKERERE UNIVERSITY BUSINESS SCHOOL
OPERATIONAL COSTS, LENDING POLICIES AND OUTREACH OF URWEGO
OPPORTUNITY MICROFINANCE BANK LTD, RWANDA
By
Ndyamuba Straton
2007/HD10/11270U
A Research Report Submitted to Graduate Research Centre in Partial Fulfillment
of the Requirements for the Award of Degree of Master of Science in
Accounting and Finance of Makerere University
August 2010

2
DECLARATION
I Ndyamuba Straton hereby do declare that, this dissertation is my original work and has never
been submitted or published for any award in any other University.
Signature: _________________
Ndyamuba Straton
2007/HD10/11270U
Date: _________________
APPROVAL

3
This Research Report has been under our supervision as University Supervisors. We approve its
submission for examination to Makerere University as partial fulfillment for the requirements of
the award of Master of Science in Accounting and Finance degree of Makerere University.
SUPERVISORS:
Signed: ___________________
Dr. Nkote Nabeta
Date: ___________________
Signed: ___________________
Mr. Nixon A. Kamukama
Date: ___________________
DEDICATION
To Annette, Aaron, Everest, Joseph and Stephen.

4
5
ACKNOWLEDGEMENT
I wish to express my sincere gratitude to my supervisors Dr. Isaac Nkote Nabeta and Nixon.
A. Kamukama for their guidance. This study would not have been successfully carried out
with out their support and encouragement.
I also thank my classmates; Edmund, Apollo, Annette, Tito and Range for their morale,
inspiration and knowledge sharing spirit.
In a special way, I would like to recognize the invaluable support from Mr. Okello George
Candiya Bongomin who helped proof read this piece of work.
In the same way, I would like to recognize the support from Dr. Benjamin Akinyemi the
Rector of Kigali Institute of Management for his constant push for the completion of this
study. I equally appreciate the support from Head of Department Accoumting & Finance,
Director of Administration & Human Resources and the entire Academic staff of the same
Institute.
Last but not the least, big thank you to Orane, Emmanuel, Orene, Faustin and to the entire
staff and clients of URWEGO Opportunity Bank who furnished me with the necessary data
for this study. God bless you richly!

6
ABSTRACT
This study was carried out to investigate the declining outreach levels as a result of lending
policies and high operational costs of URWEGO Microfinance Bank. The objectives of the study
were to examine the relationships between operational costs, lending policies, repayment rates
and outreach of URWEGO microfinance bank. A sample of 50 staff and 171 clients of
URWEGO microfinance bank were used in the study. It was observed that there was a
significant negative relationship between operational costs and outreach. The study also revealed
that there was a significant negative relationship between operational costs and repayment rate.
The study findings also showed that there was a significant positive relationship between lending
policies and repayment rate. Further analysis of the results indicates that operational costs and
lending policies predict 59% of the variance in the outreach. Therefore URWEGO microfinance
bank of Rwanda should adopt technological innovations, product refinements, and strengthen
capacity that is needed to reduce costs, increase outreach, and boost overall profitability. There is
need by the microfinance to minimize the effective interest rates charged on borrowers which
may affect the depth of outreach.

7
TABLE OF CONTENTS
Page
Declaration i
Approval ii
Dedication iii
Acknowledgements iv
Abstract v
List of acronyms and abbreviations ix
List of tables x
CHAPTER ONE Introduction ………………………………………………………….. 1 1.1 Background to the Study ...................................................................................... 1
1.2 Statement of the Problem ..................................................................................... 3
1.3 Purpose of the Study ............................................................................................ 3
1.4 Objectives of the Study ........................................................................................ 4
1.5 Research Questions ............................................................................................. 4
1.6 Scope of the Study ............................................................................................... 4
1.6.1 Subject Scope…………………………………………………………………….. 5 1.6.2 Geographical Scope………………………………………………………………. 5 1.7 Significance of the Study ..................................................................................... 5
1.8 Conceptual Frame Work ...................................................................................... 7
CHAPTER TWO Literature Review………………………………………………… 8 2.0 Introduction ......................................................................................................... 8
2.1 Operational Costs and Outreach ........................................................................... 8
2.2 Operational Costs and Repayment Rate ............................................................. 14
2.3 Lending Policies and Outreach .......................................................................... 17
2.4 Lending Policies and Repayment Rate ………………………………………….21
8
CHAPTER THREE Methodology …………………………………………………… 26 3.0 Introduction ....................................................................................................... 26
3.1 Research Design ................................................................................................ 26
3.2 Study Population ............................................................................................... 26
3.3 Sample Design and Size .................................................................................... 26
3.4 Data Sources...................................................................................................... 27
3.5 Data Collection Instruments............................................................................... 27
3.6 Reliability and Validity of Research Instruments ............................................... 28
3.7 Measurement of Study Variables ………………………………………………..29 3.8 Data Analysis .................................................................................................... 29
3.9 Limitations to the study ..................................................................................... 30
CHAPTER FOUR Presentation, Analysis and Interpretation of Findings.…………….32 4.1 Introduction ……………………………………………………………………...32 4.2 DEMOGRAPHIC CHARACTERISTICS OF THE RESPONDENTS …………32 4.2.1 Frequency table Gender of Employees ……………………...……….……. …...31 4.2.2 Frequency table for Level of Education of Employees….………………….….. 32 4.2.3 Frequency table for Job Position of Employees ……..……………………….…33 4.2.4 Frequency table for Work Tenure of Employees …………………………….....34 4.2.5 Frequency table for Period of years Spent as URWEGO's Client.….……..……35 4.2.6 Frequency tables for Types of Business Venture of the Clients ………………..36
4.2.7 Findings on Lending Policies from URWEGO's Clients ……………………….37 4.3 INFERENTIAL STATISTICS ………………………………………….………39 4.3.1 Factor Analysis ………………………………………………………….………39 4.3.1.1 Operational Costs…......................................................................................................... 40 4.3.1.2 Lending Policies………………………………………………………………..……… .40
4.3.1.3 Repayment Rate………………………………………………………………………………...…42 4.3.1.4 Outreach………………………………………………………………………………………...…44 4.4 RELATIONSHIP BETWEEN THE STUDY VARIABLES …………….……..45 4.4.1 Relationship between Operational Costs and Outreach …………………….…...46 4.4.2 Relationship between Operational Costs and Repayment Rate…………….…...46 4.4.3 Relationship between Lending Policies and Outreach …………………………46

9
4.4.4 Relationship between Lending Policies and Repayment Rate …………………46 4.5 Regression Analysis ……………………………………………...……… …..47
CHAPTER FIVE Discussion, Conclusion and Recommendation ………………...48 5.1 Introduction …………………………………………………………………….48 5.2.1 Relationship between Operational Costs and Outreach ………………………..48 5.2.2 Relationship between Operational Costs and Repayment Rate………………..49 5.2.3 Relationship between Lending Policies and Outreach ………………………...50 5.2.4 Relationship between Lending Policies and Repayment Rate ………………...51 5.3 CONCLUSION ………………………………………………………………..52 5.4 RECOMMENDATION ………………………………………………………..53 5.5 Areas for Further Studies ……………………………………………………....53 Reference …………………………………………………….………………………...55
Appendices …………………………………………………………………………….56

10
LIST OF ACRONYMS
AMFIU Association of Microfinance Institutions in Uganda
CGAP Consultative Group to Assist the Poor
MFI Microfinance Institutions
MIX Microfinance Information Exchanges
NGO Non Governmental Organizations
NIOSR National Institute of Statistics of Rwanda
SPSS Statistical Package for Social Scientists
UOB URWEGO Opportunity Bank

11
LIST OF TABLES
Table 3.1 Response Rate …………………………………………………….……..28
Table 3.2 Cronbach‘s Alpha coefficients for variables under study ………….…....28
Table 4.1 Frequency table for Gender of Employees ……………………………...31
Table 4.2 Frequency table for Level of Education of Employees Clients ………...32
Table 4.3 Frequency table for Job Position of the Employees ……………………33
Table 4.4 Frequency table for Work Tenure of the Employees ………………..…34
Table 4.5 Frequency table for Period of Years spent as URWEGO‘s Client……..35
Table 4.6 Frequency table for Types of Business Venture of the Clients ………..36
Table 4.7 Findings on Lending Policies from Clients ……………………………37
Table 4.8 Rotated Component Matrix for Operational Costs…………………….40
Table 4.9 Rotated Component Matrix for Lending Policies………………………41
Table 4.10 Rotated Component Matrix for Repayment Rate………………………43
Table 4.11 Rotated Component Matrix for Outreach………………………………44
Table 4.12 Spearman‘s Correlation Matrix for Study Variables ……………..……45
Table 4.13 Regression Analysis of the Study Variables ……………………..…….47
LIST OF FIGURES
Fig. 1 Conceptual framework …………………………………………………7
1
CHAPTER ONE:
INTRODUCTION
1.1 Background to the Study
Micro Finance means providing very poor family with very small loans to help them engage in
productive activities and grow their tiny businesses over the time (Gonzalez, 2008). Today, MFIs
have spread around the world, not only in developing countries but also in many richer western
countries. Microfinance practitioners estimate that 500 million poor people worldwide demand
financial services, while MFIs reach only 15 to 70 million of them (CGAP, 2001).
Expanding the number of clients being served is an ultimate goal of almost all microfinance
interventions. Outreach is manifested by the number of borrowers, average loan size, client and
portfolio growth which enables the MFI to become self sustainable. Navajas Conning, and Gonzalez
– Vega, (2000) state that microfinance outreach includes the breadth of outreach, depth of outreach,
quality of outreach, length of outreach, and variety of outreach. Quality of outreach refers to worth,
to how valuable microfinance products are for particular clients. Depth of outreach tells us how
valuable it is to extend the supply of microfinance products to particular target groups, not from the
point of view of a given client, but from the point of view of society (Conning, 1998). Breadth of
outreach counts the number of clients of a given depth who are supplied with a microfinance product
of a given quality (worth) and a given cost. Only a small proportion of the target group have access
to formal and semi – formal financial services, but the more numerous the clients reached, the better
(Adams, 1998).

2
Montgomery and Weiss (2004), state that providing loan or any other financial services to the people
is quite expensive for MFI, it involves the operational costs. According to this argument, the cost of
providing microfinance to the poorest is so high that MFIs may not be able to sustain the service
without cost recovery while the poorest would not be able to afford such a high cost (World Bank,
2001). For the same reasons it‘s difficult to manage performance for each transaction, hence high
administrative costs (Slangen, 2005). According to Crabb (2006), microfinance programs with high
operating costs are less viable.
Microfinance lending policy and methodology has proved stringent to the poor because some
systems only focus on the largest loans and therefore ignoring small loans altogether (Micro Rate,
2001). Otero (2001) assert that before microfinance lends to borrowers, there should be information
about the character, capacity, collateral, capital and condition of the borrower. Stringent lending
policy is when MFIs tighten their credit requirements to the borrowers to respond to changes in the
economy, leaving out the poor. Applying stringent lending criteria to low-income borrowers may, in
effect, lead to their exclusion from the financial system (Cheron et al., 1999). Lenient policy is when
MFIs loosen their credit requirements to the borrowers to respond to changes in the economy.
Chimombo and Mataya (2000) conclude that a good microfinance institution should always be
willing to adopt an appropriate loan delivery mechanism so that its services are attractive and
accessible to the relevant target groups, cover the different situations of their client-base and should
be appropriately priced, so as to avoid subsidy elements from one side and be competitively
attractive to minimize the transaction costs.
3
Being named the best MFI in Rwanda in 2004 by United Nations, the government of Rwanda and
Harvard University, URWEGO Opportunity Bank ltd (URWEGO then) offered its first loans in July
1997 to Rwanda's economically active poor. After 11years of rapid growth, its client base grew to
39,140 active clients through access to credit and savings facilities as well as training (Nubian,
2008). Despite its rapid growth, there has been a reduction in the number of its active borrowers
from 17,956 to 16,922; and the numbers of the solidarity groups declined from 54 to 41 during the
period between 2007 to 2008 (URWEGO annual report, 2007/08).
1.2 Statement of the Problem
Although URWEGO Opportunity Bank of Rwanda Ltd (UOB) strives to expand the number of
clients being served, the coverage in terms of outreach is still inadequate. The number of active
clients reduced from 51% to 48% and operational costs increased from 118,600,750 Rwandan
Francs to 175,464,037 Rwandan Francs (URWEGO annual report, 2007/08). This research is
therefore intended to find out whether the declining outreach levels could be attributable to UOB‘s
stringent lending policies and high operational costs.
1.3 Purpose of the Study
The study aimed at examining the relationship between operational costs, lending policies and
outreach of URWEGO Opportunity Microfinance Bank limited.

4
1.4 Objectives of the Study
i) To examine the relationship between operational costs and outreach of URWEGO
Opportunity Microfinance Bank limited.
ii) To examine the relationship between operational costs and repayment rate of URWEGO
Opportunity Microfinance Bank limited.
iii) To examine the relationship between lending policies and outreach of URWEGO
Opportunity Microfinance Bank limited.
iv) To establish the relationship between lending policies and repayment rate of URWEGO
Opportunity Microfinance Bank limited.
1.5 Research Questions
i) What is the relationship between operational costs and outreach of URWEGO Opportunity
Microfinance Bank limited?
ii) What is the relationship between operational costs and repayment rate of URWEGO
Opportunity Microfinance Bank limited?
iii) What is the relationship between lending policies and outreach of URWEGO Opportunity
Microfinance Bank limited?
iv) What is the relationship between lending policies and repayment rate of URWEGO
Opportunity Microfinance Bank limited?

5
1.6 Scope of the Study
Subject Scope
The study aimed at establishing the relationship between the operational costs, lending policies,
repayment rates and outreach of URWEGO Opportunity Microfinance Bank limited.
.
Geographical Scope
The study was carried out in all the 3 districts that make up Kigali city in Rwanda.
1.7 Significance of the Study
The study is expected to add more knowledge to the already existing literature on operational costs,
lending policies and outreach of MFIs.
The study findings are expected to enhance further research in the MFI industry both in Rwanda and
internationally on microfinance outreach.
The study is expected to enable the identification of better lending policy strategies that are critical
for better outreach of MFIs.
MFI used in the study, will benefit from this research by improving on lending policies for better
operational costs management.
1.8 Conceptual Frame Work
MFIs cannot afford to subsidize loans, if the organization is to provide loans on an on-going basis, it
must charge interest rates that allow it to cover its costs. These costs tend to be high because
providing unsecured, small loans costs significantly more than loans in traditional banking (Lensink,
6
2006). Lafourcade et. al., (2005) state that operating and financial expenses of MFIs have remained
to be high, and on average, revenues have remained lower. Technological innovations, product
refinements, and ongoing efforts to strengthen the capacity of MFIs are needed to reduce costs,
increase outreach, and boost overall profitability. Wide agreement about the goal of microfinance to
improve the welfare of the poor has not led to wide agreement about how best to achieve that goal.
Schreiner (2002) asserts that the social benefits of microfinance in terms of outreach can be
measured in terms of six aspects: worth, cost, depth, breadth, length, and scope. Zeller and Meyer
(2002) show that relatively high repayment rates increases self –sustainability of MFIs. MFIs seek to
cover their operating expenses and achieve growth so as to further their outreach to the poor. It‘s
worth noting that high repayment rates generate good returns from the clients which can cover
administrative and other costs (Drake and Rhyne, 2002).
Chimombo and Mataya (2000) conclude that a good microfinance institution should always be
willing to adopt an appropriate loan delivery mechanism so that its services are attractive and
accessible to the relevant target groups, cover the different situations of their client-base and should
be appropriately priced, so as to avoid subsidy elements from one side and be competitively
attractive to minimize the transaction costs.
Otero (2001) assert that before microfinance lends to borrowers, there should be information about
the character, capacity, collateral, capital and condition of the borrower.
7
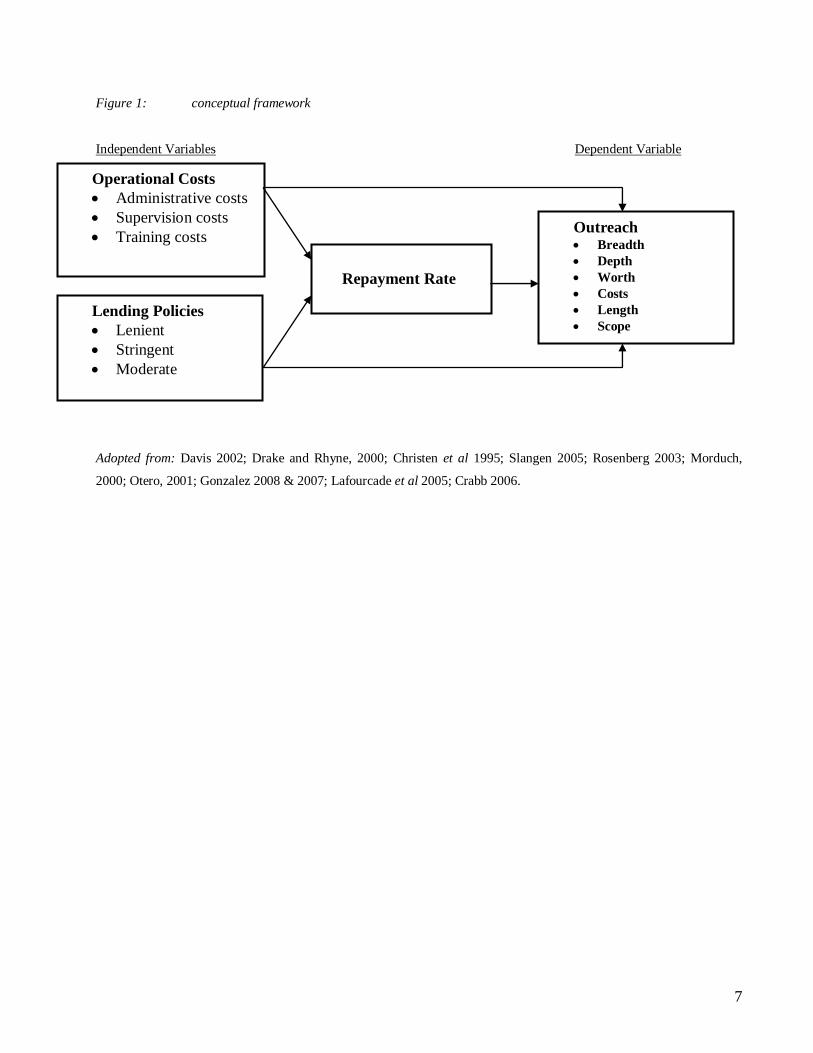
Figure 1: conceptual framework
Independent Variables Dependent Variable
Adopted from: Davis 2002; Drake and Rhyne, 2000; Christen et al 1995; Slangen 2005; Rosenberg 2003; Morduch,
2000; Otero, 2001; Gonzalez 2008 & 2007; Lafourcade et al 2005; Crabb 2006.
Operational Costs
Administrative costs
Supervision costs
Training costs
Lending Policies
Lenient
Stringent
Moderate
Repayment Rate
Outreach Breadth
Depth
Worth
Costs
Length
Scope

8
CHAPTER TWO
LITERATURE REVIEW
2.0 Introduction
Although there have been studies on operational costs, lending policies and outreach of microfinance
institutions in developing countries, the literature reviewed in this study is cited mainly from studies
carried out in developed countries. The related literature reviewed in line with study objectives.
2.1 Operational Costs and Outreach
Over their history, many MFIs have found ways to increase productivity and efficiency and lower
costs. These efficiency improvements have helped several MFIs to achieve operational and financial
self-sufficiency. MFIs cannot afford to subsidize loans. If the organization is to provide loans on an
on-going basis, it must charge interest rates that allow it to cover its costs. These costs tend to be
high because providing unsecured, small loans costs significantly more than loans in traditional
banking (Lensink, 2006).
MFIs may go at the cost of their outreach, however. Reaching the poor and providing them with
credit may be very costly. Making very small loans involves high transaction costs, in terms of
screening, monitoring and administration costs, per loan. Several authors therefore argue that the
unit transaction costs for small loans to the poor are high as compared to unit costs of larger loans
(Hulme and Mosley, 1996; Conning, 1999; Paxton and Cuevas, 2002; Lapenu and Zeller, 2002).
Thus, there may be a trade-off between efficiency and outreach, implying that the shifting focus
towards increasing sustainability and efficiency reduces the scope for the more traditional aim of
many MFIs, which is lending to the poor.

9
MFIs provide a wide range of services. The best-known activity of MFIs is providing credit to
poorer households and small enterprises, but many also take deposits. In addition, some MFIs offer
other financial services, such as insurance, or advice and training to their clients. This training is
often closely linked to the MFI‘s main activities; training in business management for example
might make a loan more valuable to the borrower and also enhance the chances of repayment.
Sometimes MFIs are used as a vehicle to provide other services and education, e.g. in the area of
health awareness (Daniel, Holden and Vassili, 2002).
The primary clientele of MFIs consists almost by definition those who face severe barriers to access
financial products from conventional financial institutions. These barriers comprise mainly high
operational costs, and risk factors. An MFI‘s clientele may for example be distributed in remote
locations, possess few negotiable assets, whether they be physical or financial, and live in an
environment where enforcement of formal property rights and other contracts is expensive and
uncertain (Vassili, 2002). Holden (2002) noted that the costs of carrying out microfinance business
are usually high relative to the value of loans and deposits involved. On one hand, financial
transactions often bear significant overhead and fixed costs, independent of the size of the
transaction. These costs include the administrative costs of making payments, keeping open offices
and cost of loan monitoring. Typically, the largest single expense is salaries, due to the very labor-
intensive nature of micro lending. The ratio of administrative expenses relative to assets in the
sample is much higher than would be typical for a commercial bank, and declines with portfolio size.

10
On the other hand, small scale projects or consumer lending to poor is often highly risky, in part
because: (1) the borrowers‘ income stream can be intrinsically risky and more exposed to exogenous
shocks (weather, macroeconomic fluctuations); (2) the borrowers are not well diversified; (3) the
borrowers cannot provide collateral; (4) loans are bound up with personal finances of poor (e.g. a
business might collapse if large medical bill must be met). This often results in high share of
impaired loans, which are sometimes bunched (e.g. after a harvest failure or natural disaster). Certain
MFIs are very successful in achieving high loan recovery rates, but the potential risk is almost
always present.
These high costs generally force MFIs to charge high interest rates on loans, even in real terms. Also
the spread between deposit and lending rates offered by MFIs is usually high. MFI borrowers are
presumably willing to pay these high rates because the alternative is either borrowing at even higher
rates, perhaps from an informal money-lender, or no borrowing at all. An MFI may have to operate
in an oligopolistic manner in its local market in order to cover its fixed costs, but its presence could
still be welfare improving. Nonetheless, many MFIs lose money.
However, there is also a substantial contingent of ―financially self-sufficient‖ MFIs that manage to at
least break even on a sustained basis. They are generally very much larger than other MFIs, both in
terms of their loan portfolio and the number of borrowers. Their loans also tend to be larger relative
to GDP per head. Their administrative costs tend to be lower relative to total assets, but their interest
margin is higher, presumably because they are much more successful in attracting low-cost deposits.
Savers at MFIs may be much more attracted by the security and transaction services connected with
having a deposit rather than with the interest yield. Financially self-sufficient MFIs also make more
11
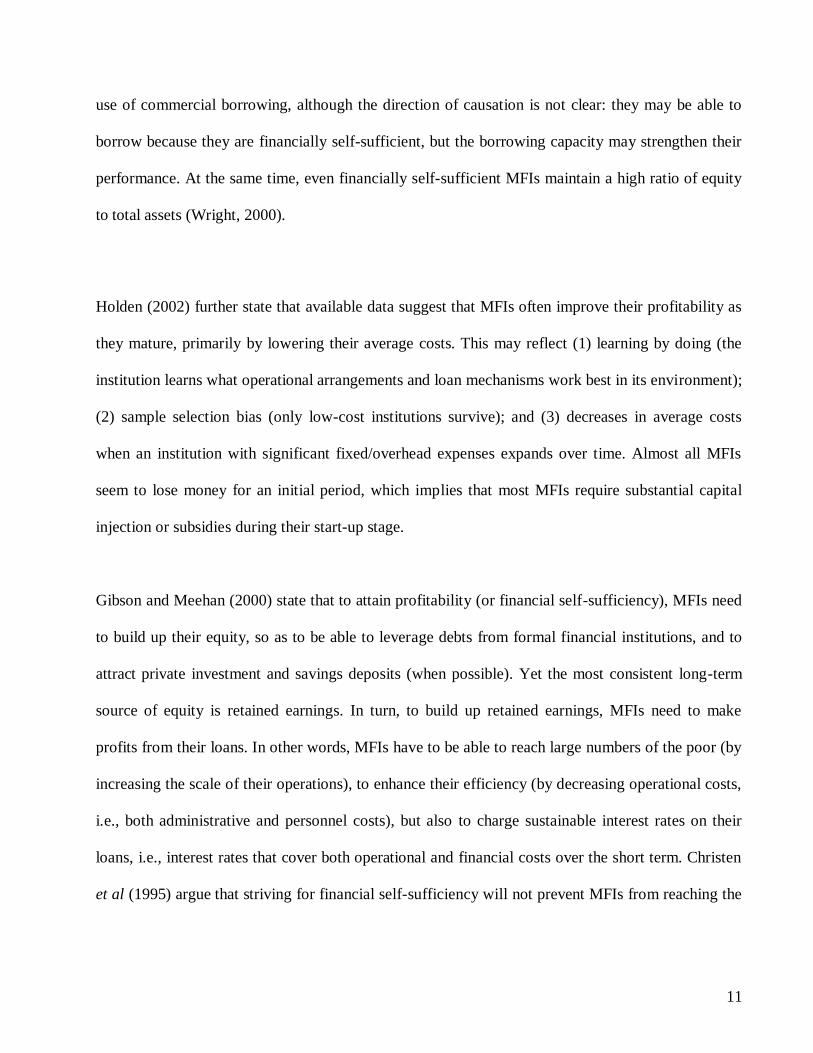
use of commercial borrowing, although the direction of causation is not clear: they may be able to
borrow because they are financially self-sufficient, but the borrowing capacity may strengthen their
performance. At the same time, even financially self-sufficient MFIs maintain a high ratio of equity
to total assets (Wright, 2000).
Holden (2002) further state that available data suggest that MFIs often improve their profitability as
they mature, primarily by lowering their average costs. This may reflect (1) learning by doing (the
institution learns what operational arrangements and loan mechanisms work best in its environment);
(2) sample selection bias (only low-cost institutions survive); and (3) decreases in average costs
when an institution with significant fixed/overhead expenses expands over time. Almost all MFIs
seem to lose money for an initial period, which implies that most MFIs require substantial capital
injection or subsidies during their start-up stage.
Gibson and Meehan (2000) state that to attain profitability (or financial self-sufficiency), MFIs need
to build up their equity, so as to be able to leverage debts from formal financial institutions, and to
attract private investment and savings deposits (when possible). Yet the most consistent long-term
source of equity is retained earnings. In turn, to build up retained earnings, MFIs need to make
profits from their loans. In other words, MFIs have to be able to reach large numbers of the poor (by
increasing the scale of their operations), to enhance their efficiency (by decreasing operational costs,
i.e., both administrative and personnel costs), but also to charge sustainable interest rates on their
loans, i.e., interest rates that cover both operational and financial costs over the short term. Christen
et al (1995) argue that striving for financial self-sufficiency will not prevent MFIs from reaching the
12
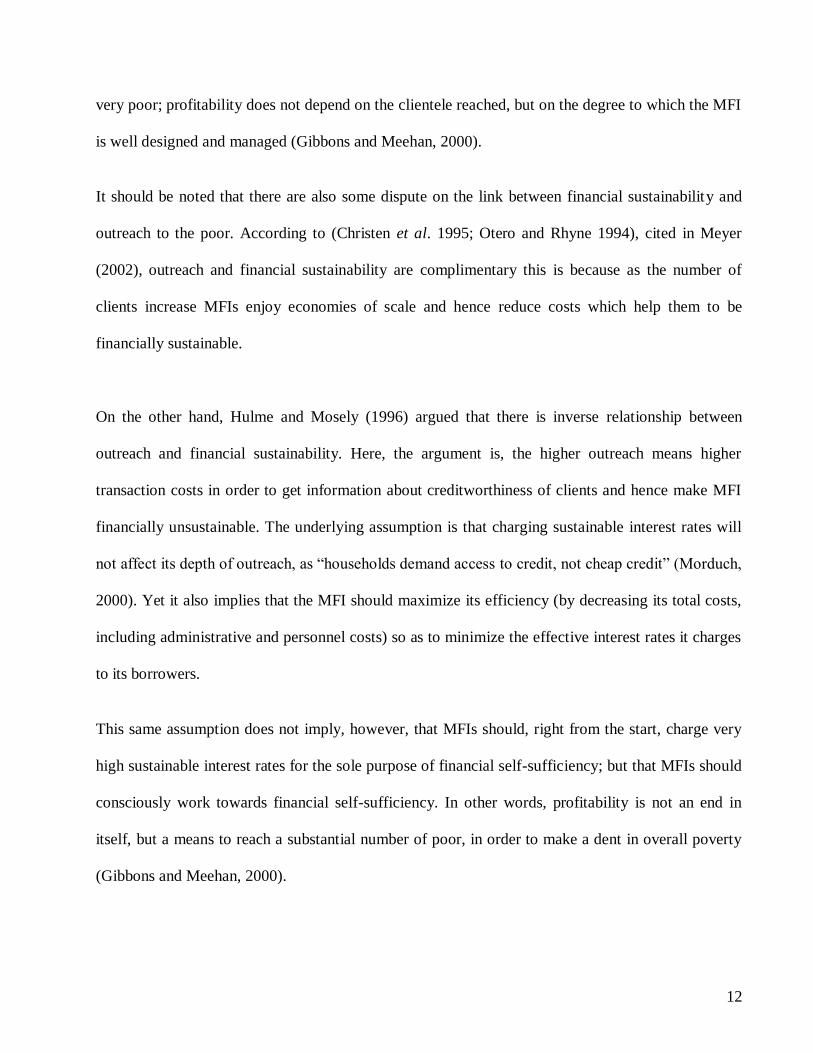
very poor; profitability does not depend on the clientele reached, but on the degree to which the MFI
is well designed and managed (Gibbons and Meehan, 2000).
It should be noted that there are also some dispute on the link between financial sustainability and
outreach to the poor. According to (Christen et al. 1995; Otero and Rhyne 1994), cited in Meyer
(2002), outreach and financial sustainability are complimentary this is because as the number of
clients increase MFIs enjoy economies of scale and hence reduce costs which help them to be
financially sustainable.
On the other hand, Hulme and Mosely (1996) argued that there is inverse relationship between
outreach and financial sustainability. Here, the argument is, the higher outreach means higher
transaction costs in order to get information about creditworthiness of clients and hence make MFI
financially unsustainable. The underlying assumption is that charging sustainable interest rates will
not affect its depth of outreach, as ―households demand access to credit, not cheap credit‖ (Morduch,
2000). Yet it also implies that the MFI should maximize its efficiency (by decreasing its total costs,
including administrative and personnel costs) so as to minimize the effective interest rates it charges
to its borrowers.
This same assumption does not imply, however, that MFIs should, right from the start, charge very
high sustainable interest rates for the sole purpose of financial self-sufficiency; but that MFIs should
consciously work towards financial self-sufficiency. In other words, profitability is not an end in
itself, but a means to reach a substantial number of poor, in order to make a dent in overall poverty
(Gibbons and Meehan, 2000).

13
Sanderatne (2002) concludes that MFIs should follow good banking practices, be operationally
efficient and disciplined. The ultimate target is to achieve profitability, so as to cover operational
costs of MFIs (Charitonenko and Afwan 2003). MFIs need four sequential stages to become a full-
fledged commercial entity. The first stage is the adoption of banking-like operations, such as
developing demand-driven financial products, and the implementation of market interest rates to
cover operational costs. The second stage is progression towards financial self-sufficiency through
increasing operational efficiency and profitability. Operational profitability is vital in providing a
basis for MFIs to attain the third stage of commercialization. In this stage MFIs should be capable of
mobilizing public savings, and become attractive for equity investments. In the fourth stage, as MFIs
become a profitable entity, their financial operations are subject to banking provision and
regulations. In practice the microfinance commercialization can be accomplished through a
transformation into commercial banks.
However, MFIs will need to lower operating costs further before the industry will be able to attract a
significant amount of commercial capital. To improve efficiency and customer satisfaction, many
MFIs are exploring the use of new technologies, such as Palm Pilots and smart cards to lower
transactions costs and increase outreach. Successful MFIs must keep their costs low through efficient
operations such as highly simplified and decentralized loan application, approval and collection
processes.
14
2.2 Operational Costs and Repayment Rate
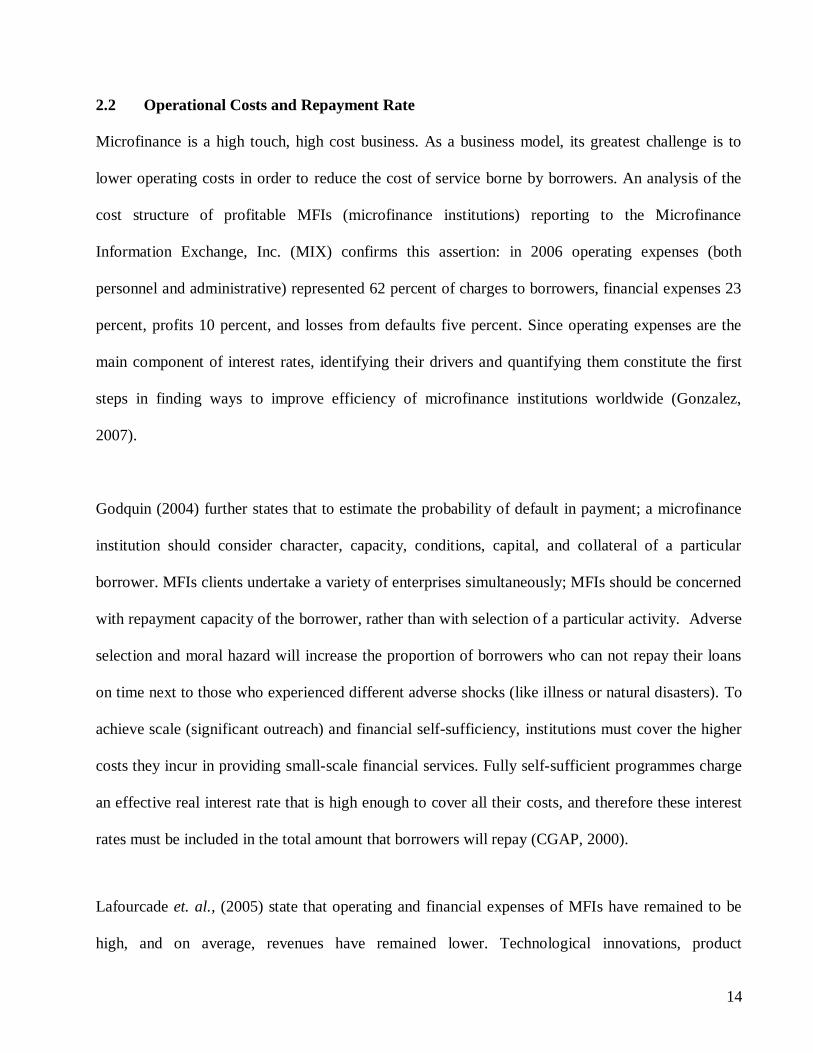
Microfinance is a high touch, high cost business. As a business model, its greatest challenge is to
lower operating costs in order to reduce the cost of service borne by borrowers. An analysis of the
cost structure of profitable MFIs (microfinance institutions) reporting to the Microfinance
Information Exchange, Inc. (MIX) confirms this assertion: in 2006 operating expenses (both
personnel and administrative) represented 62 percent of charges to borrowers, financial expenses 23
percent, profits 10 percent, and losses from defaults five percent. Since operating expenses are the
main component of interest rates, identifying their drivers and quantifying them constitute the first
steps in finding ways to improve efficiency of microfinance institutions worldwide (Gonzalez,
2007).
Godquin (2004) further states that to estimate the probability of default in payment; a microfinance
institution should consider character, capacity, conditions, capital, and collateral of a particular
borrower. MFIs clients undertake a variety of enterprises simultaneously; MFIs should be concerned
with repayment capacity of the borrower, rather than with selection of a particular activity. Adverse
selection and moral hazard will increase the proportion of borrowers who can not repay their loans
on time next to those who experienced different adverse shocks (like illness or natural disasters). To
achieve scale (significant outreach) and financial self-sufficiency, institutions must cover the higher
costs they incur in providing small-scale financial services. Fully self-sufficient programmes charge
an effective real interest rate that is high enough to cover all their costs, and therefore these interest
rates must be included in the total amount that borrowers will repay (CGAP, 2000).
Lafourcade et. al., (2005) state that operating and financial expenses of MFIs have remained to be
high, and on average, revenues have remained lower. Technological innovations, product

15
refinements, and ongoing efforts to strengthen the capacity of MFIs are needed to reduce costs,
increase outreach, and boost overall profitability.
Rhaman (1999) asserts that the first best level of repayment rate which can promote self –
sustainability is 100% on – time. If the maximum repayment rate the MFI can reach given its lending
methodology is lower than the targeted 100%, microfinance will take long to attain sustainable
operations. MFIs find it difficult to achieve high returns because portfolio yield have sunk so low
due to older delinquency of their loans (USAID, 2005). Adongo et., al (2005) also contends that
improving repayment rate might help reduce the dependence on subsidies of the MFIs which will
improve on its profitability hence self – sustainability.
MFIs have to be innovative to overcome these barriers. Incentives for loan repayment, for example,
can be created through a number of techniques (Morduch, 1999), such as the group lending model,
which was pioneered by Grameen Bank in Bangladesh in the mid-1970s. Under group lending, all
group members are held responsible for loan repayments even if the loans are made to individuals.
In some countries (for example, Indonesia), lending took the form of allocation of funds through
village-level management commissions led by village heads. In this case, the village heads are held
responsible for loan repayment, but they exploit appropriate enforcement mechanisms with regard to
individual borrowers. Perhaps most importantly, credit-granting MFIs often use dynamic incentives,
where a borrower initially receives a small sum, but as a satisfactory repayment history is
established, the borrower may obtain progressively larger loans. The threat to cut off any further
lending when loans are not repaid strengthens repayment incentives.

16
So far, only a few commercial banks have successfully entered the microfinance business. Where
formal commercial banks have enjoyed a certain success in doing microfinance business, key
elements were the ability to identify borrowers who would repay on time, and to monitor the loan
portfolio to ensure that delinquencies are kept under control. This required either technology that
could allow accurate credit scoring, or substantial local knowledge. The case of the Banco del
Trabajo in Peru is a typical example of the former, while the Unit Desa system in Indonesia is an
example of the latter. In addition, the creation of a separate, dedicated MFI unit within the
commercial bank has often proven to be advantageous.
About half of the MFIs are becoming more cost effective with time and about half are not. In order
to determine which MFI characteristics are associated with decreasing costs and which are not, we
estimate several auxiliary regressions. Cost reductions are found to be related to several factors.
Importantly, lower total subsidies and a lower subsidy per loan are associated with greater cost
reductions. MFIs offering deposits tended to improve over time, as did those located in Central Asia.
Those MFIs not in networks also tended to achieve cost reductions. Briefly, we find that the group
of MFIs that is becoming more cost effective over time is relying less on subsidies and more heavily
on deposits as a source of loanable funds. These MFIs are basically transforming themselves into
institutions similar to small banks. A second group of MFIs is not showing increased cost
effectiveness, and remains dependent on subsidies. Thus, there are good reasons to expect MFIs that
have been in operation longer to be able to reduce costs through learning by doing. However, there
are also possible reasons why costs may be flat or even increasing with time, including the following
factors: (i) screening and monitoring costs may rise as MFIs reach beyond their initial target group,
(ii) operating costs may increase if MFIs move into more isolated and rural markets,(iii) operating
costs could rise if MFIs begin competing in increasingly saturated markets, (iv) higher collection
17
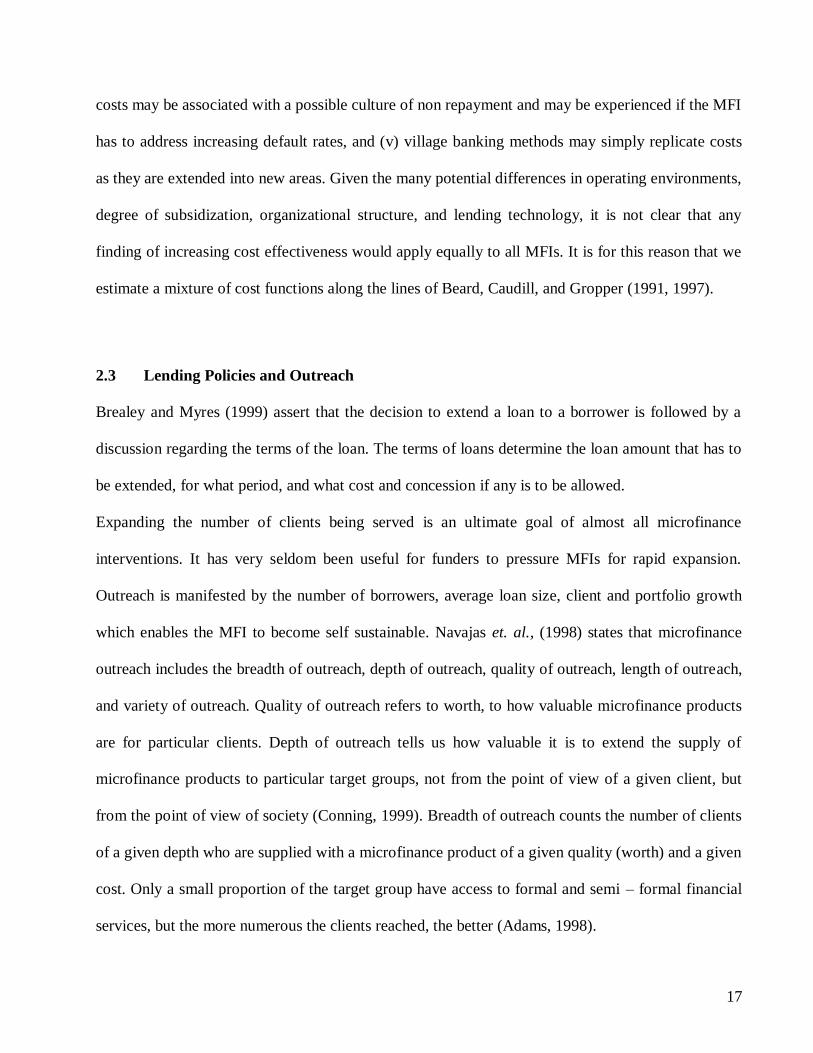
costs may be associated with a possible culture of non repayment and may be experienced if the MFI
has to address increasing default rates, and (v) village banking methods may simply replicate costs
as they are extended into new areas. Given the many potential differences in operating environments,
degree of subsidization, organizational structure, and lending technology, it is not clear that any
finding of increasing cost effectiveness would apply equally to all MFIs. It is for this reason that we
estimate a mixture of cost functions along the lines of Beard, Caudill, and Gropper (1991, 1997).
2.3 Lending Policies and Outreach
Brealey and Myres (1999) assert that the decision to extend a loan to a borrower is followed by a
discussion regarding the terms of the loan. The terms of loans determine the loan amount that has to
be extended, for what period, and what cost and concession if any is to be allowed.
Expanding the number of clients being served is an ultimate goal of almost all microfinance
interventions. It has very seldom been useful for funders to pressure MFIs for rapid expansion.
Outreach is manifested by the number of borrowers, average loan size, client and portfolio growth
which enables the MFI to become self sustainable. Navajas et. al., (1998) states that microfinance
outreach includes the breadth of outreach, depth of outreach, quality of outreach, length of outreach,
and variety of outreach. Quality of outreach refers to worth, to how valuable microfinance products
are for particular clients. Depth of outreach tells us how valuable it is to extend the supply of
microfinance products to particular target groups, not from the point of view of a given client, but
from the point of view of society (Conning, 1999). Breadth of outreach counts the number of clients
of a given depth who are supplied with a microfinance product of a given quality (worth) and a given
cost. Only a small proportion of the target group have access to formal and semi – formal financial
services, but the more numerous the clients reached, the better (Adams, 1998).

18
MFI concerned should inform clients of the conditions under which they may transact with the MFI.
It is incumbent upon an MFI to provide information in understandable and accessible form on such
matters as loan terms, deposit interest rates, and access to funds. Without such information the MFI
may find it difficult to attract new clients, while the existing clients may legitimately claim to have
been misled, which may in turn cause borrowers not to repay loans, prompt court actions, or
motivate depositors to demand compensation from government in case the institution fails. Such a
requirement may be considered as a condition applicable to all businesses, and not specific to
financial institutions, but exactly what information needs to be provided needs to be suited to the
financial services provided (CGAP, 2000).
Mutenda (2001) also noted that once an MFI is established, it might initially be restricted to a rather
narrow range of activities. The range can be expanded over time, but only as the MFI acquires the
necessary skills and structures to handle them, and demonstrates to the supervisory authority that it
can carry out the new activities in a sound manner and support the heavier regulatory requirements
that are entailed. Some MFIs develop from NGO-sponsored lending organizations. Others might
start as savings cooperatives, which are in effect ―narrow banks,‖ which just take deposits and invest
them in fairly safe liquid assets. Before such a narrow bank could start investing in a wider range of
instruments, it would need to show that it has a management system in place to determine and
maintain a portfolio with appropriate liquidity and risk levels. If it then wished to begin lending to
individuals or enterprises, it would need to have established a system for loan evaluation and
tracking, and for reporting on its lending activities to the supervisory authority. Throughout the
process of development, the supervisory authority will need to verify that the MFI has an internal
information system adequate for its own management purposes, and is capable of meeting reporting

19
requirements that match its stage of development. If an MFI is authorized to operate in a relatively
free environment, its operations should be subject to some pragmatic limits. These limits (on the
overall deposit base, loan portfolio, number of branches, number of staff) would make MFIs too
small to pose a threat to the overall stability of the financial sector. However, once an MFI becomes
too large to operate within the prescribed limits, it should be required to re-register with the Central
Bank or another regulator.
Christen and Rosenberg (2000) concludes that when an MFI begins borrowing significantly or
taking deposits from the public, the most important set of prudential regulations that must be met
concern the recognition of impaired loans and the making of provisions. In most financial systems,
and especially for an MFI, credit risk is the greatest threat to survival. Prompt and full recognition of
actual or potential loan losses is the most effective means to contain them, and even if an MFI is
forced to close due to loan losses, losses for depositors and other creditors are likely to be smaller if
loan losses have been identified early. Loan classification and provisioning criteria create incentives
for careful loan evaluation, and limit moral hazard when an institution is failing. If the MFI is to
reach sustainability and allocate its resources efficiently, its own management will have to pay close
attention to loan repayment rates, so the marginal cost of regulation in this area should be small.
However, provisioning requirements need to be carefully designed so as not to create artificial
barriers or opportunities for regulatory arbitrage.
Funders who want to reach very poor clients should usually look for MFIs that are already
committed to a low – end clientele, rather than trying to encourage higher – end MFIs to change
their market. However, it should be noted that low loan sizes do not guarantee a poor clientele.
Likewise, growth in average loan size does not necessarily mean that a MFI is suffering a mission

20
drift. As an MFI matures and growth slows, a lower percentage of its clients are first – time
borrowers and average loan size will rise even if there has been no shift in the market it is serving
(Rosenberg, 2003). The financial services and the delivery methods should be client targeted and
based on simple procedures. If the microfinance institution is spread over a wide geographical area,
the selection of the target beneficiaries as well as the delivery method of the services should be
decentralized.
The microfinance institution should have a wide outreach and lenient lending policies so that it could
accomplish its mission on a continuous basis. This would be ensured by attaining a significantly
larger scale of operation and building a wide client base, including the underserved (e.g. women,
minority ethnic groups). Schreiner and Yaron (2001) shows that rapid expansion sometimes proves
to be unsustainable, especially during an MFI‘s early years when it needs to design its products and
build its systems. Rapid growth will temporarily depress an MFI‘s profitability because such growth
requires new investments in staffs and facilities that take a period of time to become fully
productive.
Small business loans may be a prominent part of MFI activities, but lending and deposit taking to
smooth consumption by households may be more important for most MFIs and their clients.6
Providing savings facilities not only enables households to smooth consumption, but also is of value,
for example, in making and receiving payments, and establishing a financial record. One of the
lessons of the recent development of the MFI sector is that even very poor are eager and able to save.
MFIs are not equally dispersed worldwide. They appear to be especially well developed in certain
Asian and Latin American countries, such as Bangladesh, Bolivia, and Indonesia. There is some
evidence that a comparatively large number of MFIs in Africa take the form of savings cooperatives,

21
while lending operations are relatively more important elsewhere. Why microfinance is not more
evenly spread worldwide remains a subject for a further research Ledgerwood (1998) or Morduch
(1999).
A good microfinance institution should always be willing to adopt an appropriate loan delivery
mechanism so that its services are attractive and accessible to the relevant target groups, cover the
different situations of their client – base and should be appropriately priced so as to avoid subsidy
elements from one side and be competitively attractive to minimize the transaction costs, while
ensuring liquidity and rapid availability, on the other (Chimombo and Mataya, 2000). It should be
noted however, that if the institutions fail, their clientele too would fail. Such failures are too costly,
because it would cause the poor to lose their confidence in the very system which is supposed to help
them. Once the confidence is lost, regaining the same would not only be difficult but also would take
time. It would also drive the poor back to the dependency syndrome, one of the bottlenecks for
alleviating poverty in a sustainable manner (Brand and Gerschick, 2000).
2.4 Relationship between Lending Policies and Repayment Rate
Microfinance Institutions serve as important providers of credit to poorer borrowers and thus can
play a significant role in programs to alleviate poverty and promote economic opportunity in nations
around the world (Morduch 1999, Zohir and Matin 2004). These institutions make loans to
borrowers who seek relatively small amounts and who may be viewed as too risky by larger
conventional lenders. Quite often, MFIs operate with subsidies from charitable or governmental
agencies. There appears to be considerable heterogeneity in the microfinance industry in terms of
institution size, sustainability, and clientele served. Worldwide, the leading 10% of MFIs (about 150

22
institutions) serve approximately 75% of all microfinance clients, with the remainder served by
thousands of small and heterogeneous institutions with varying degrees of sustainability
(www.themix.org). Given their important role in providing credit to underserved individuals and the
use of subsidies from various sources to support them, MFI operations should be well understood.
One important question is whether MFIs are becoming more cost effective over time.
Gallardo (2001) assert that besides the costs incurred by the supervisor, complying with regulations
and satisfying on- and off-site supervision can be administratively burdensome and expensive for an
MFI. These costs are ultimately passed to the MFI‘s clients in the form of higher fees and interest
rate spreads, and slower growth in the provision of financial services to disadvantaged groups. It is
possible that the often poor clients of MFIs could bear significant costs of regulations to protect the
other groups in society.
Hardy et al., (2003) further state that regulation and supervision may restrict the ability of MFIs to
experiment with new forms of loan agreement and systems to attract deposits by discouraging or
prohibiting innovations that are not foreseen in the regulatory framework. MFIs often have to be
innovative to overcome the barriers to participation in the financial system faced by their clients and
to be financially viable, and these innovations may differ from institution to institution and from
country to country. Regulations may make it onerous to introduce such innovations, for example, by
requiring higher provisioning and capital against loans that are not backed by collateral, even where
some other mechanism provides security. Regulatory restrictions and the costs of complying with
regulations may also discourage MFIs from competing with each other or new MFIs from being
established, thus preserving local monopolies.

23
It should be noted that there has been weaknesses in the operational structure and the poor lending
policies and decisions of MFIs due to the high costs of allocating adequate information on new
clients and clients‘ business in loan appraisal, and as a result of inadequate loan supervision and
follow – up, lending to low income from the loan portfolio, hence retardation in sustainability
(Slangen, 2005). Due to the small loan amounts and the large number of individuals‘ loans, the
default rate of MFIs is normally high. For the same reasons it‘s difficult to manage performance for
each transaction hence high administrative costs.
To provide large numbers of very poor people with access to quality financial services, attention to
outreach is critical because there are millions of households and enterprises that lack access to
financial services. If these millions are to be reached, MFIs must have the capacity that allows for
significant expansion. The most successful examples of large-scale outreach have been
accomplished through specialized financial institutions. Successful microfinance schemes are
characterized by non-subsidized interest rates linked to competitive market rates. Interest rates
should allow sustaining the MFI operation. The administration of many small loans, including
processing and tracking services, is a costly operation. Consequently, MFIs need to charge higher
interest rates than what commercial banks charge, yet can continue operations at rates that remain
lower than the informal financial sector.
Interest rates must cover operational and financial costs and growth, to achieve the objectives of a
sustainable, healthy, growing microfinance industry reaching increased numbers of the poor,
especially in rural areas. Microfinance interest rates cannot be expected to fall below the minimum
costs necessary for MFIs to survive, so they will not be ―affordable‖ for some purposes, for which
24
alternative approaches are needed. Interest rates are ―too high‖ if they result from inefficiencies.
Increased competition and performance based capacity-building are appropriate strategies to
improve efficiency for lower costs and interest rates. Consumer education, disclosure of interest
rates and fees, and a code of conduct will help clients to make better choices and force MFIs to
compete transparently. These strategies would put downward pressure on interest rates without
retarding growth of the industry, as typically happens under interest rate ceilings (AMFIU, 2006).
In the first place, profitable credit administration requires screening out borrowers who are not likely
to repay, charging interest rates high enough to cover costs, and responding vigorously to late
payments—all of which run counter to the practical incentives. One of the most controversial issues
in microfinance has been the extent of the trade-off between financial sustainability and reaching
poorer clients. It would seem evident that there are some circumstances in which the two objectives
would conflict. In the first place, there are some potential borrowers who are extremely poor, have
no reliable source of income from which a loan could be repaid, and lack the opportunity (not just
the capital) to start a micro business. Clearly it cannot be profitable to lend to people who are
unlikely to repay. Secondly, some very poor people live in remote and sparsely populated areas
where administrative costs of lending are extremely high, and where interest rates would have to be
correspondingly high to cover those costs. The conventional wisdom has been that micro credit
clients are relatively insensitive to interest rates. But obviously there is some limit to the interest rate
that poor borrowers can pay without nullifying the benefits of the loan arrangement.
Zeller and Meyer (2002) shows that relatively high repayment rates increases self – sustainability of
MFIs. MFIs seek to cover their operating expenses and achieve growth so as to further their outreach
25
to the poor. Financial sustainability allows MFIs to expand their operations and increase the level of
their service distribution to the poor (Drake and Rhyne, 2002). It‘s worth noting that high repayment
rates generate good returns from the clients which can cover administrative and other costs.
Freimer & Gordon (1965) concludes that the borrower will default on his loan when the duration of
this loan is inferior to the minimum duration. An increase in the duration along with irregular
repayment schedules may also increase his probability of default. For a given borrower and duration
of the loan, it is argued that the repayment probability decreases with the size of the loan, where the
probability of default may be due to external factors such as illness or accidental destruction of the
borrower‘s productive assets.

26
CHAPTER THREE
METHODOLOGY
3.0 Introduction
This chapter presents a description of research methodology that was used to carry out this study. It
covers the research design, study population, sampling design and size, data sources, data collection
instruments, reliability and validity of research instruments, measurements of research variables,
data processing/analysis, and limitations to the study.
3.1 Research Design
For the purpose of this research, a cross – sectional research design was used combined with
descriptive methods. This is because the study was carried out as a snapshot as there was no time
and resources to carry out a longitudinal study.
3.2 Study Population
The study population of 400 people was used and it included 50 employees and 350 active clients of
URWEGO Opportunity Microfinance Bank Limited as of January 2010.
3.3 Sample Design and Size
A total of 221respondents represented the sample size. This was arrived at by taking a census of 50
employees while 171 clients were determined using Krejcie and Morgan (1970) table guide for
sample selection. Simple random sampling technique was used to choose these 171 clients from 350
Active clients.

27
3.4 Data Sources
Primary Sources
Primary data was collected using closed ended questionnaires from URWEGO Opportunity
Microfinance Bank Limited. The respondents included employees and active clients of URWEGO
Opportunity microfinance Bank Limited.
Secondary Sources
Secondary data on figures and percentages about operational costs, lending policies, repayment rate
and outreach was collected from Association of Microfinance Union of Rwanda Reports, Rwanda
Microfinance Support Centre, URWEGO Opportunity MFIs‘ Annual Reports, Microfinance
Institutions‘ Annual Report, Bank of Rwanda, NIOSR, and World Bank Reports. The reason for this
is to make comparison of secondary data with primary data that was collected in order to compare
operational costs, lending policies and outreach in order to come up with meaningful interpretations.
3.5 Data Collection Instruments
Self administered 5 point likert – type closed Questionnaires were used to collect data from the
employees and active clients of URWEGO Opportunity Microfinance Bank Limited.
Table 1 below shows the response rate obtained from the different categories of respondents used in
the study.

28
Table 3.1 Response Rate
Category of Respondents
Instruments
Distributed
Instruments
Received
Response Rate
URWEGO Employees
50 50 100%
URWEGO Clients
171 171 100%
Source: Primary data
3.6 Reliability and Validity of Research Instruments
Closed questionnaire was developed in harmony with the guidelines specified by Sekaran (2000).
First, an item analysis was done to see whether the items in the instrument belong there and a pre –
test was carried out to check validity and reliability so as to minimize on vagueness of the results to
be generated. Reliability (internal consistency and stability) of the instruments was tested using
Cronbach‘s Alpha Coefficient which was above 0.5 (50%) (Cronbach, 1946). The researcher tested
inter – item consistency reliability to ensure that there was consistency of respondents‘ answers to all
items in the measure. The findings of the reliability test showed that all the variables were above the
accepted alpha coefficient of 0.5. This is shown in table 3.2 below.
Table 3.2: Cronbach’s Alpha Coefficient for the Variables under Study
Study Variables
Anchor
Cronbach Alpha
Operational Costs 5 Point 0.6649
Lending Policies 5 Point 0.7256
Repayment Rate 5 Point 0.8463
Outreach 5 Point 0.7108
Source: Primary data

29
3.7 Measurements of Research Variables
Operational Costs were measured using the dimensions of administrative costs, supervision costs,
and training costs on loans given to borrowers, as stipulated by CGAP (2000) which states that
microfinance loans attracts high supervision costs of borrowers by loan officers who move out to the
field to supervise the clients.
Lending Policies were measured using the dimensions of lenient, moderate and stringent policies on
loans given to borrowers as stipulated by Chimombo and Mataya (2000) who states that
microfinance lending policies can be lenient, moderate or stringent depending on the current
situation of the individual borrowers.
Repayment Rate was measured using the dimensions of frequency and intervals of repayments of
outstanding loans by borrowers, as stipulated by Davis (2002) who states that some borrowers pay
on time while others delay to play; therefore there is always difference in the repayment frequency
of the microfinance loans by different individual borrowers.
Outreach was measured using the dimensions of breadth, depth, worth, costs, length and scope of
outreach as stipulated by Schreiner (2002) who states that the outreach levels of microfinance will be
based on the breadth, depth, worth, costs, length and scope depending on the coverage.
3.8 Data Processing and Analysis
Data collected from the primary source was compiled, sorted, edited for accuracy and clarity,
classified, coded into a coding sheet and analyzed using a computerized data analysis package/tool
known as SPSS 17.0. Regression analysis was used to predict the MFI‘s operational costs and

30
lending policies and Spearman‘s correlation analysis was run to determine the existence and
significance of the relationship between the independent variable and dependent variable
respectively, and later conclusions to the study was drawn.
3.9 Limitations to the study
The following problems were encountered in this study:
i) Respondents withholding information due to fear of being victimized as a result
of confidentiality of the organization‘s data but this was overcome by assuring the
respondents of utmost good faith by the researcher;
ii) Accuracy of the research tools and methodology, they might have not given 100% level
of accuracy of the results;
iii) Respondents having a view of not obtaining any direct benefit from the research results.

31
CHAPTER FOUR
PRESENTATION, ANALYSIS AND INTERPRETATION OF THE FINDINGS
4.1 Introduction
This chapter presents the results of data analysis and findings compiled from the field. It is divided
into three main sections. The first section deals with the general/demographic characteristics of the
respondents. The second section discusses the findings from the study. Section three analyses and
discusses the relationship between the variables in the study.
4.2 Demographic Characteristics of Respondents
The demographic characteristics of the respondents include the gender, level of education and
working status.
4.2.1 Gender of the Respondents
The finding in the table 4.1 below shows gender of the respondents.
Table 4.1 Gender Distribution of the Employees
Gender Frequency Percent Valid Percent
Valid
Male
39
78.0
78.0
Female
11
22.0
22.0
Total
50
100.0
100.0
Source: Primary data

32
The data summary in table 4.1 above reveals that majority (78%) of the employees of URWEGO
microfinance bank who responded were male while, only 22% were female. This implies that
majority of URWEGO employees who responded were male.
4.2.2 Level of Education of the Respondents
The finding in the table 4.2 below shows the level of education of the respondents.
Table 4.2 Level of Education of Employees
Source: Primary data
According to table 4.2 above, majority (50%) of the employees had attained University degree,
while 48% had diploma qualification. However, there were only 1 (2%) employees who had attained
advanced level certificate. This shows that majority of the employees who responded in the study
were degree holders, followed by diploma holders and advance level certificate holder.
Level of Education Frequency Percent Valid Percent
Valid A Level 1 2.0 2.0
Diploma 24 48.0 48.0
Degree 25 50.0 50.0
Total 50 100.0 100.0
33
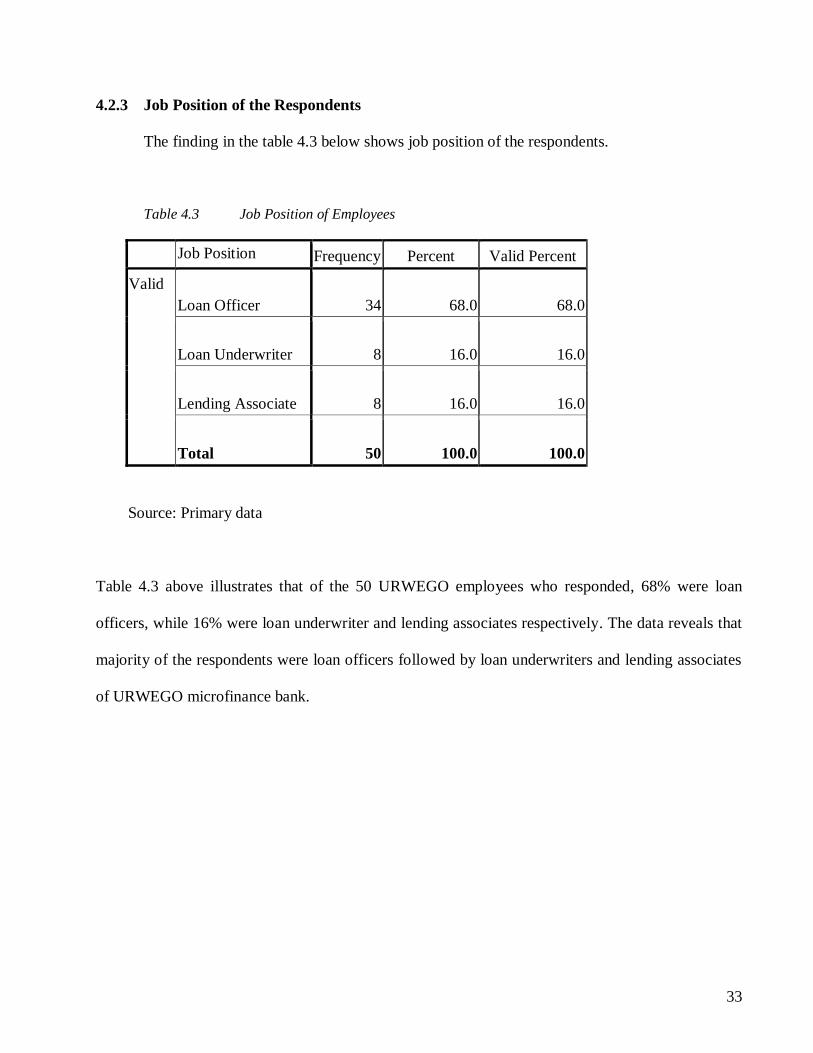
4.2.3 Job Position of the Respondents
The finding in the table 4.3 below shows job position of the respondents.
Table 4.3 Job Position of Employees
Job Position Frequency Percent Valid Percent
Valid
Loan Officer
34
68.0
68.0
Loan Underwriter
8
16.0
16.0
Lending Associate
8
16.0
16.0
Total
50
100.0
100.0
Source: Primary data
Table 4.3 above illustrates that of the 50 URWEGO employees who responded, 68% were loan
officers, while 16% were loan underwriter and lending associates respectively. The data reveals that
majority of the respondents were loan officers followed by loan underwriters and lending associates
of URWEGO microfinance bank.
34
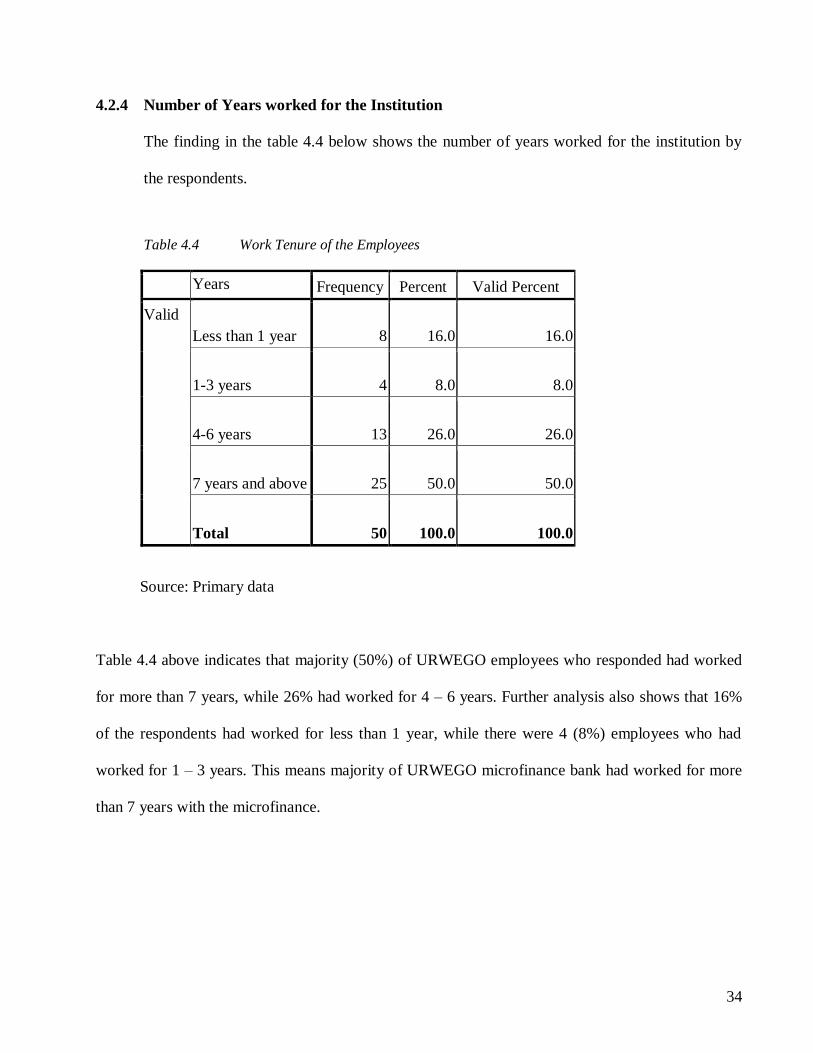
4.2.4 Number of Years worked for the Institution
The finding in the table 4.4 below shows the number of years worked for the institution by
the respondents.
Table 4.4 Work Tenure of the Employees
Years Frequency Percent Valid Percent
Valid
Less than 1 year
8
16.0
16.0
1-3 years
4
8.0
8.0
4-6 years
13
26.0
26.0
7 years and above
25
50.0
50.0
Total
50
100.0
100.0
Source: Primary data
Table 4.4 above indicates that majority (50%) of URWEGO employees who responded had worked
for more than 7 years, while 26% had worked for 4 – 6 years. Further analysis also shows that 16%
of the respondents had worked for less than 1 year, while there were 4 (8%) employees who had
worked for 1 – 3 years. This means majority of URWEGO microfinance bank had worked for more
than 7 years with the microfinance.

35
4.2.5 Period Spent with URWEGO of the Respondents
The finding in the table 4.5 below shows the number of years the clients have spent while
borrowing from the microfinance.
Table 4.5 Period of Years Spent as URWEGO’s Client
Years Frequency Percent Valid Percent
Valid
1-3 years
33
19.3
19.3
4-6 years
71
41.5
41.5
7 years and above
67
39.2
39.2
Total
171
100.0
100.0
Source: Primary data
From table 4.5 above, of the 171 clients, majority (42%) had spent 4 – 6 years dealing with
URWEGO microfinance bank, while 39% had borrowed for more than 7 years and above. There
were only 33 (19%) of the respondents who had borrowed for a period of 1 – 3 years. This implies
that majority of the clients had dealt with the microfinance for 4 – 6 years.

36
4.3.6 Types of Business Venture of the Respondents
The finding in the table 4.6 below shows types of business ventures of the respondents.
Table 4.6 Types of Business Venture of the Clients
Business Types Frequency Percent Valid Percent
Valid
Cloth Vending
34
19.9
19.9
Animal Husbandry
26
15.2
15.2
Electronics
29
17.0
17.0
Farming
38
22.2
22.2
Retail
44
25.7
25.7
Total
171
100.0
100.0
Source: Primary data
From table 4.6 above, majority (26%) of the clients were in retail business, while 22% were in the
farming business. The analysis further reveals that 19% of clients were in clothe vending while 17%
were in electronics business. There were only 15% of the clients in the animal husbandry business as
revealed by the table above. This shows that majority of the clients of URWEGO microfinance bank
were retail business owners.

37
4.2.7 Findings on Lending Policies of URWEGO
Table 4.7 below shows the Means and Standard Deviation of findings on the clients‘ perception
about the lending policies of URWEGO microfinance bank. The significance of table 4.7 is to show
how URWEGO‘s clients feel about the lending policies of the microfinance and how it impacts on
their businesses.
Table 4.7: Findings on Lending Policies Descriptive from URWEGO Clients
Lending Policies N Min Max Mean
Std.
Deviation
The loan staff always visit my business within 24 hours if I don't pay my loans 171 4.00 5.00 4.65 0.48
I can only get a new loan after completion of payment of my outstanding loans 171 4.00 5.00 4.65 0.48
Approval of my loan application is only determined by on-time repayment history of
my borrowings 171 4.00 5.00 4.65 0.48
I have always paid all my loans without any legal action being instituted on me by the
microfinance 171 1.00 5.00 3.84 1.04
My repayment behavior has always been key factor in securing loans from the
microfinance 171 4.00 5.00 4.70 0.46
I am always required to provide collateral and guarantor before i am given a loan 171 4.00 5.00 4.71 0.45
The microfinance always treat us equally when we apply for loans 171 2.00 5.00 3.51 1.27
I am always required by the microfinance to save prior to my loan approval 171 3.00 5.00 4.67 0.53
I can always get a new loan before paying all my existing old loans 171 1.00 5.00 1.77 1.20
The lending terms and conditions of the microfinance has always been favorable to
my business venture 171 1.00 5.00 2.38 1.16
My loan approval has always been determined by the group members where i belong 171 4.00 5.00 4.55 0.50
The loan officers frequently visit and closely supervise my business after loan
disbursement 171 4.00 5.00 4.26 0.44
I have never been denied loans as a result of defaulting over the past years 171 2.00 5.00 4.16 0.64
I am always given all the full amount of loans that i apply for from the microfinance 171 2.00 5.00 2.89 1.08
The numbers of my friends who have ever got loans from the microfinance has
rapidly increased over the past years 171 2.00 5.00 3.46 0.96
All my friends who have borrowings from the microfinance are loyal borrowers 171 2.00 4.00 3.13 0.99
All our loans do not exceed the borrowers' established borrowing days 171 2.00 5.00 2.28 0.79
I have always paid all my previous loans on-time in the past years 171 2.00 5.00 4.04 0.57
The loans officers have never complained about my repayment characters 171 1.00 5.00 3.98 0.67
My group members have always paid all their old loans previously disbursed to them
over the past years 171 3.00 5.00 4.21 0.44
Source: Primary data
38
From table 4.7 above, the results show that there was agreement among the clients that loan officers
visited their businesses within 24 hours upon failure to repay their pending loans (mean 4.65). The
clients also agreed that they were in position to get new loans only after payment of their outstanding
loans (mean 4.65). Further analysis also reveals that the clients were in agreement that approval of
their loan application was only determined by on-time repayment history of their past borrowings
(mean 4.65). Majority also agreed to paying all their loans without any legal action being instituted
on them by the microfinance (mean 3.84). There was also further agreement by clients that the
microfinance considered behaviors as a key factor in giving loans to them (mean 4.70), and also they
further agreed on provision of collateral and a guarantor before the microfinance give them loans
(mean 4.71). But they were uncertain on whether there was equal treatment of all loan applicants by
the microfinance (mean 3.51). However, there was strong agreement by clients on the requirement of
saving prior to loan approval by the microfinance (mean 4.67), while there was a very strong
disagreement on getting a new loan before paying all existing old loans (mean 1.77). They also
disagreed on lending terms and conditions that they were not favorable to their business ventures
(mean 2.38). The clients further strongly agreed that their loan approval was determined by the
group members where they belonged (mean 4.55). There was also agreement by all clients on close
supervision of their businesses by loan officers after loan disbursement (mean 4.26). They also
further agreed on being denied loans as a result of defaulting (mean 4.16), but they neither agreed
nor disagreed on being given all the full amount of loans that they apply for from the microfinance
(mean 2.89). Further analysis shows that clients were uncertain on whether the numbers of their
colleagues who had ever got loan from the microfinance had increased in the past years (mean 3.46),
and also neither agreed nor disagreed on loyalty of all their friends who had loans from the
microfinance (mean 3.13). They also disagreed on their loans exceeding their established borrowing

39
days (mean 2.28). There was also agreement that they paid all their previous loans on-time in the
past years (mean 4.04). Further analysis also revealed that the clients were neither in agreement nor
disagreement on loan officers complaining about their repayment character (mean 3.98). They also
agreed that all group members have always paid all their old loans previously disbursed to them
(mean 4.21).
4.3 INFERENTIAL STATISTICS
4.3.1 Factor Analysis
Factor analysis is the carrying out of analysis of factor components/constructs contributing to the
variables under study using varimax rotation methods to determine the maximum variance
explaining the contribution of the components/constructs. Factor analysis was used to extract the
most important factors that measured the study variables. These factors explained patterns of
correlation between the dependent and independent variables. The principal component analysis
extraction method and varimax rotation methods were used to extract and reduce on the many items
into few and relevant factors that can be worked on. Only factors with Eigen values greater than 1
(one) were extracted and correlation coefficients of +/- 0.3 were deleted from the rotated component
matrix table. The extracted factors were used to fit the regression models. The rotated component
matrix for each variable is outlined below;

40
4.3.1.1 Operational Costs
The principal component analysis was used to analyze the Eleven (11) dimensions of operational
costs to determine factor components/constructs contributing to the variable under study using
varimax rotation methods. This is shown in table 4.8 below;
Table 4.8 Rotated Component Matrix for Operational Costs
Operational Costs
Adm
inis
trat
ive
Co
sts
Super
vis
ion
Co
sts
Tra
inin
g C
ost
s
Our loan collection costs has greatly reduced over the past years .954
There has been increased costs of expanding our loan provision to rural markets in the recent past
.869
Our loan approval process has been decentralized over the past years .827
Our loan collection process has been handled by the different branches over the past years
.778
Our costs of doing business with our clients has greatly reduced over the past years .922
The scale of our operations to reach poor clients has greatly increased over the past years
.893
There has been low cost of supervision over the past years .893
We incur a lot costs in traveling to reach all clients .542
Our loan officers always make frequent visits to our clients‘ premises .773
We usually incur compliance costs in order to make our clients pay back their loans freely
.718
The budget for recruitment and training staffs has increased in the past years .661
Eigen Value 5.641 30.137 21.227
Variance % 4.567 25.373 56.710
Cumulative % 4.567 29.940 86.650
Source: Primary data
41
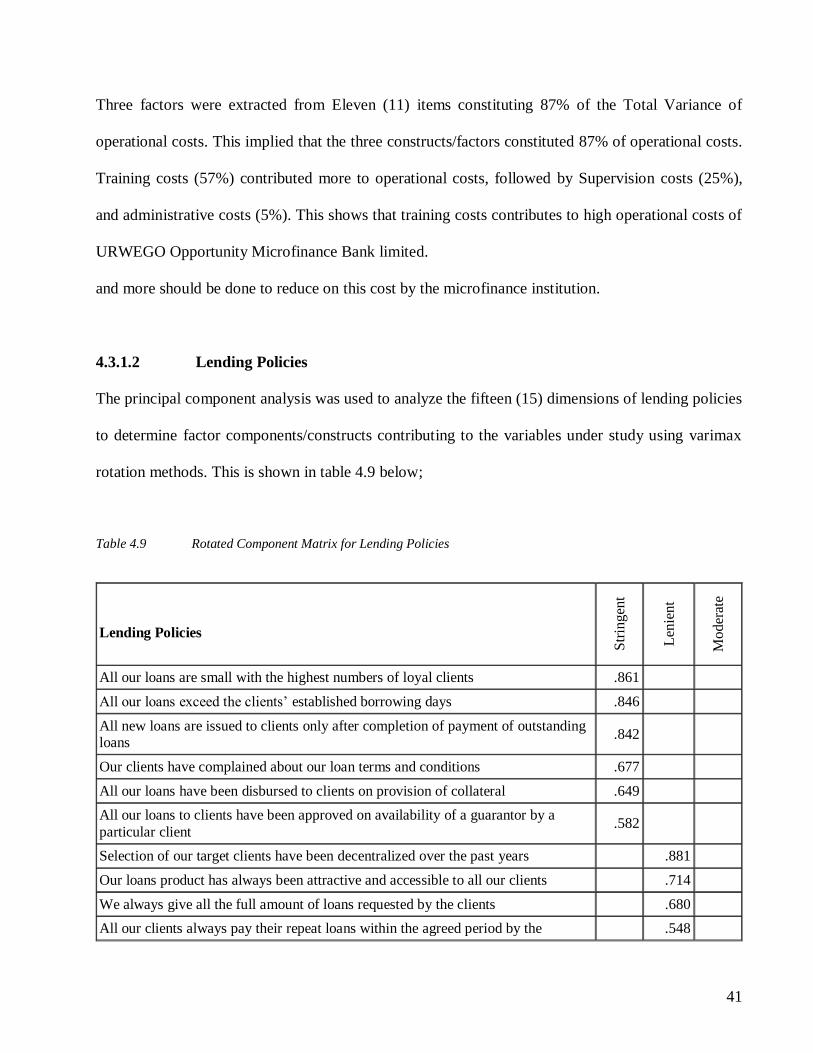
Three factors were extracted from Eleven (11) items constituting 87% of the Total Variance of
operational costs. This implied that the three constructs/factors constituted 87% of operational costs.
Training costs (57%) contributed more to operational costs, followed by Supervision costs (25%),
and administrative costs (5%). This shows that training costs contributes to high operational costs of
URWEGO Opportunity Microfinance Bank limited.
and more should be done to reduce on this cost by the microfinance institution.
4.3.1.2 Lending Policies
The principal component analysis was used to analyze the fifteen (15) dimensions of lending policies
to determine factor components/constructs contributing to the variables under study using varimax
rotation methods. This is shown in table 4.9 below;
Table 4.9 Rotated Component Matrix for Lending Policies
Lending Policies S
trin
gen
t
Len
ient
Moder
ate
All our loans are small with the highest numbers of loyal clients .861
All our loans exceed the clients‘ established borrowing days .846
All new loans are issued to clients only after completion of payment of outstanding loans
.842
Our clients have complained about our loan terms and conditions .677
All our loans have been disbursed to clients on provision of collateral .649
All our loans to clients have been approved on availability of a guarantor by a
particular client .582
Selection of our target clients have been decentralized over the past years .881
Our loans product has always been attractive and accessible to all our clients .714
We always give all the full amount of loans requested by the clients .680
All our clients always pay their repeat loans within the agreed period by the .548

42
Microfinance
Approval of all our loans to clients is only determined by on-time repayment
history of a particular client
.856
We always consider behavior of the loan applicant as a key factor before loan
approval
.736
Solidarity group members retain the approval and administration of our loans .666
Eigen Values 4.566 3.441 2.341
Variance % 35.097 23.742 18.086
Cumulative % 35.097 58.839 76.925
Source: Primary data
Three factors were extracted from Fifteen (15) items constituting 76% of the Total Variance of
lending policies. This implied that the three constructs/factors constituted 76% of lending policies.
Stringent lending terms (35%) contributed more to lending policies, followed by lenient lending
terms (24%) and moderate lending terms (18%). On further analysis of the three constructs/factors
identified, it was possible to discover that the strongest component of lending policies was moderate
lending terms and weakest component was stringent lending terms. This affirms the fact that what
matters most in lending policies microfinance institutions are moderate lending policies.
4.3.1.3 Repayment Rate
The principal component analysis was used to analyze the thirteen (13) dimensions of repayment
rate to determine factor components/constructs contributing to the variables under study using
varimax rotation methods. This is shown in table 4.10 below;

43
Table 4.10 Rotated Component Matrix for Repayment Rate
Repayment Rate
Cli
ent
Co
mm
itm
ent
Pa
ymen
t
Pa
tter
ns
All our clients have had the highest repayment culture in the past years .896
All our clients always pay their loan installments promptly and on regular basis
without a reminder by the Microfinance .877
The funds generated by our loan portfolio is always in excess to cover all loan
request by clients .868
All our clients pay their outstanding loans on-time before they are over due .851
All our existing clients have very high on-time repayment character .804
All our clients have well established capacity to repay leading to no default on given
loans .769
Repayment of late loans by our clients is always before the due date .901
All our clients have reliable sources of incomes which enable them repay their loans
in time .897
There has been reduced loan default rate among our loan clients .819
All our clients repay their outstanding loans before the loan due date .691
We have ever sued some clients because of delay in repayment of their pending loans .646
Eigen Values 6.286 1.895
Variance % 48.357 29.153
Cumulative % 48.357 77.510
Source: Primary data
Two factors were extracted from Thirteen (13) items constituting 78% of the Total Variance of
repayment rates. This implied that the two constructs/factors constituted 78% of repayment rates.
Clients‘ commitments (48%) contributed more to repayment rates, followed by payment patterns
(30%). The power of clients‘ commitment to repay their pending loans here is highlighted, what is
important to the microfinance institution in Rwanda is to centre more attention and find ways of
improve the payment patterns among its active clients.
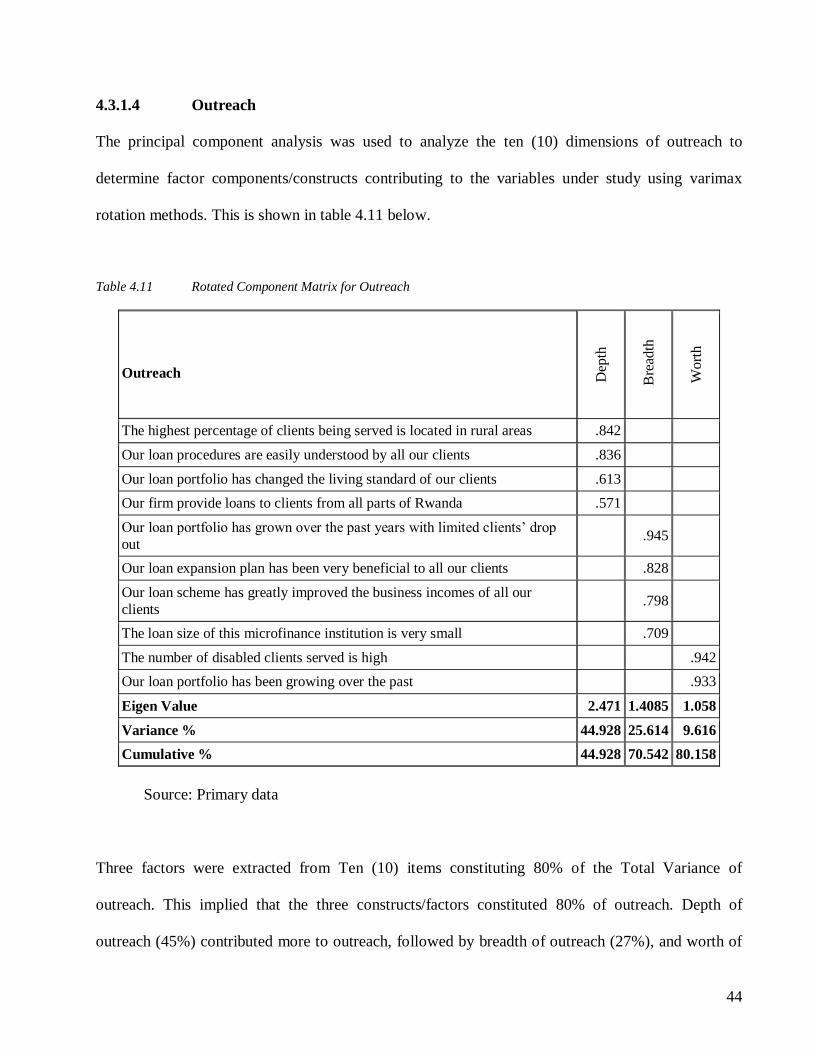
44
4.3.1.4 Outreach
The principal component analysis was used to analyze the ten (10) dimensions of outreach to
determine factor components/constructs contributing to the variables under study using varimax
rotation methods. This is shown in table 4.11 below.
Table 4.11 Rotated Component Matrix for Outreach
Outreach
Dep
th
Bre
adth
Wo
rth
The highest percentage of clients being served is located in rural areas .842
Our loan procedures are easily understood by all our clients .836
Our loan portfolio has changed the living standard of our clients .613
Our firm provide loans to clients from all parts of Rwanda .571
Our loan portfolio has grown over the past years with limited clients‘ drop
out .945
Our loan expansion plan has been very beneficial to all our clients .828
Our loan scheme has greatly improved the business incomes of all our
clients .798
The loan size of this microfinance institution is very small .709
The number of disabled clients served is high .942
Our loan portfolio has been growing over the past .933
Eigen Value 2.471 1.4085 1.058
Variance % 44.928 25.614 9.616
Cumulative % 44.928 70.542 80.158
Source: Primary data
Three factors were extracted from Ten (10) items constituting 80% of the Total Variance of
outreach. This implied that the three constructs/factors constituted 80% of outreach. Depth of
outreach (45%) contributed more to outreach, followed by breadth of outreach (27%), and worth of
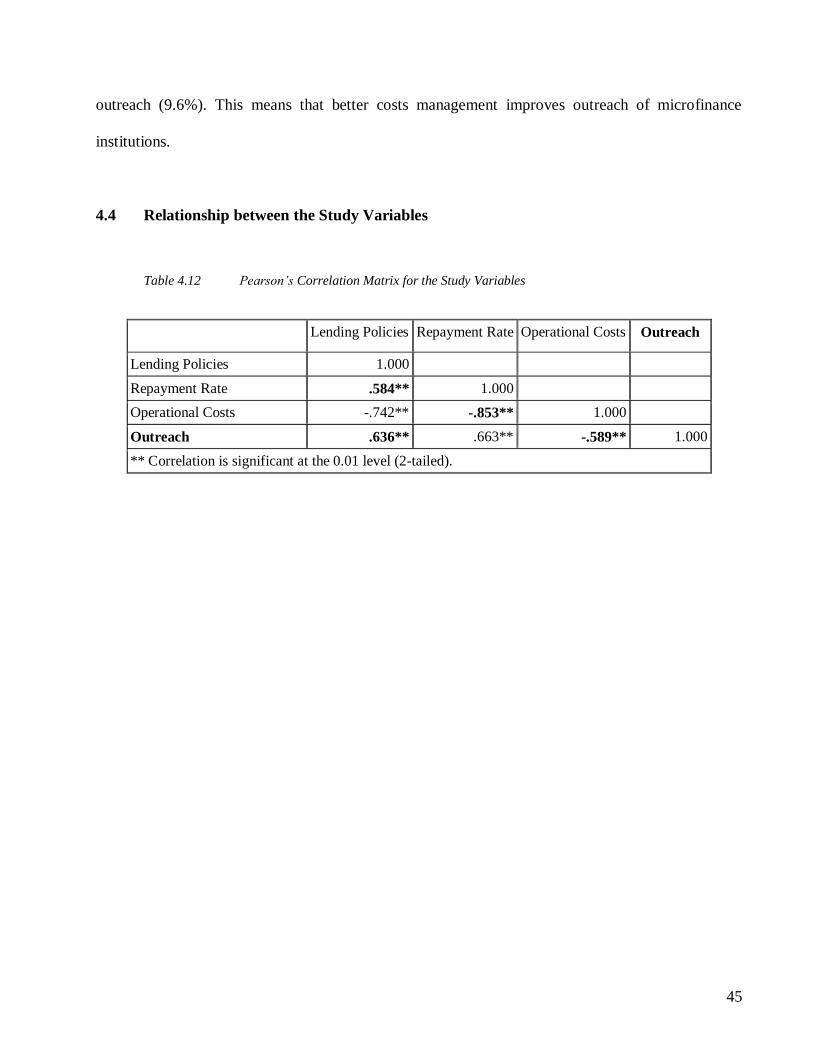
45
outreach (9.6%). This means that better costs management improves outreach of microfinance
institutions.
4.4 Relationship between the Study Variables
Table 4.12 Pearson’s Correlation Matrix for the Study Variables
Lending Policies Repayment Rate Operational Costs Outreach
Lending Policies 1.000
Repayment Rate .584** 1.000
Operational Costs -.742** -.853** 1.000
Outreach .636** .663** -.589** 1.000
** Correlation is significant at the 0.01 level (2-tailed).
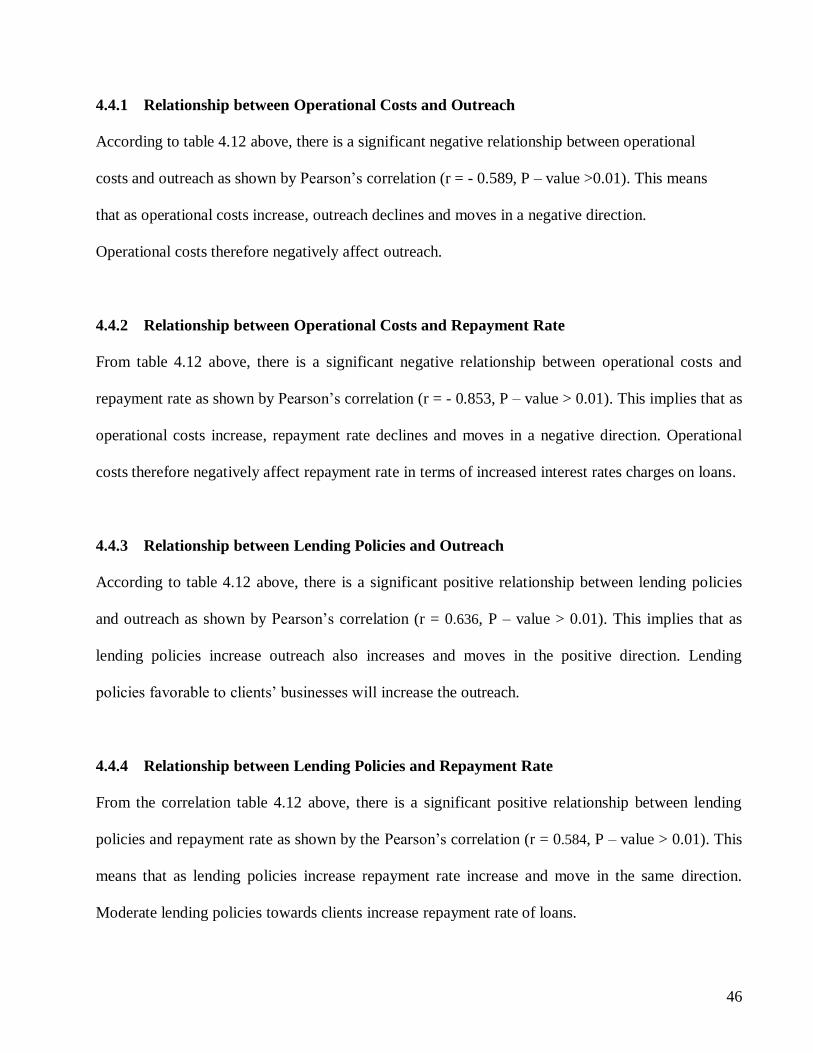
46
4.4.1 Relationship between Operational Costs and Outreach
According to table 4.12 above, there is a significant negative relationship between operational
costs and outreach as shown by Pearson‘s correlation (r = - 0.589, P – value >0.01). This means
that as operational costs increase, outreach declines and moves in a negative direction.
Operational costs therefore negatively affect outreach.
4.4.2 Relationship between Operational Costs and Repayment Rate
From table 4.12 above, there is a significant negative relationship between operational costs and
repayment rate as shown by Pearson‘s correlation (r = - 0.853, P – value > 0.01). This implies that as
operational costs increase, repayment rate declines and moves in a negative direction. Operational
costs therefore negatively affect repayment rate in terms of increased interest rates charges on loans.
4.4.3 Relationship between Lending Policies and Outreach
According to table 4.12 above, there is a significant positive relationship between lending policies
and outreach as shown by Pearson‘s correlation (r = 0.636, P – value > 0.01). This implies that as
lending policies increase outreach also increases and moves in the positive direction. Lending
policies favorable to clients‘ businesses will increase the outreach.
4.4.4 Relationship between Lending Policies and Repayment Rate
From the correlation table 4.12 above, there is a significant positive relationship between lending
policies and repayment rate as shown by the Pearson‘s correlation (r = 0.584, P – value > 0.01). This
means that as lending policies increase repayment rate increase and move in the same direction.
Moderate lending policies towards clients increase repayment rate of loans.
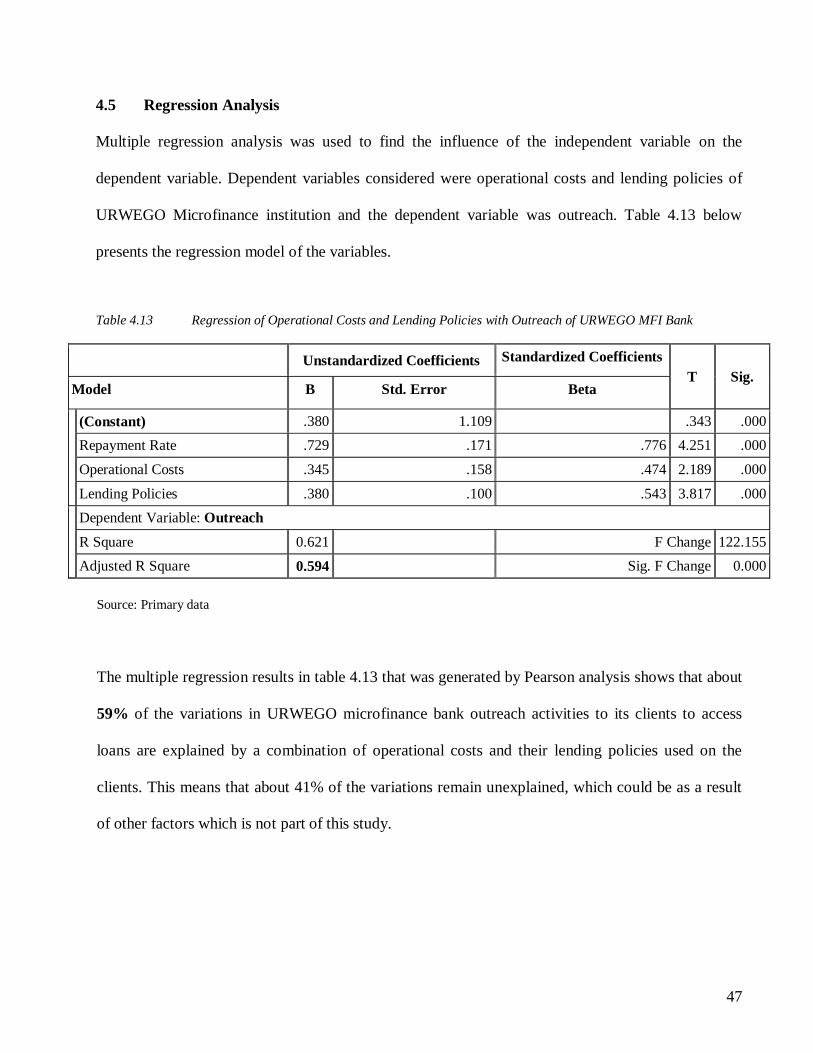
47
4.5 Regression Analysis
Multiple regression analysis was used to find the influence of the independent variable on the
dependent variable. Dependent variables considered were operational costs and lending policies of
URWEGO Microfinance institution and the dependent variable was outreach. Table 4.13 below
presents the regression model of the variables.
Table 4.13 Regression of Operational Costs and Lending Policies with Outreach of URWEGO MFI Bank
Unstandardized Coefficients Standardized Coefficients
T Sig. Model B Std. Error Beta
(Constant) .380 1.109 .343 .000
Repayment Rate .729 .171 .776 4.251 .000
Operational Costs .345 .158 .474 2.189 .000
Lending Policies .380 .100 .543 3.817 .000
Dependent Variable: Outreach
R Square 0.621 F Change 122.155
Adjusted R Square 0.594 Sig. F Change 0.000
Source: Primary data
The multiple regression results in table 4.13 that was generated by Pearson analysis shows that about
59% of the variations in URWEGO microfinance bank outreach activities to its clients to access
loans are explained by a combination of operational costs and their lending policies used on the
clients. This means that about 41% of the variations remain unexplained, which could be as a result
of other factors which is not part of this study.

48
CHAPTER FIVE
DISCUSSION OF FINDINGS, CONCLUSIONS, RECOMMENDATIONS
5.1 Introduction
The study was designed and carried out to examine operational costs, lending policies and outreach
of URWEGO Micro finance institution in Rwanda. This chapter presents a discussion and summary
of the findings based on the objectives and results from the study, and conclusions and
recommendations are drawn based on this study.
5.2.1 Relationship between Operational Costs and Outreach
The spearman‘s correlation coefficient shows that there is a significant negative relationship between
operational costs and outreach. This means that as operational costs increase, outreach decrease
because of the high costs incurred by the microfinance in its operations. This is in line with Lensink
(2006) who asserts that microfinance can not afford to subsidize loans. If the organization is to
provide loans on an on – going basis, it must charge interest rates that allow it to cover its costs.
These costs tend to be high because providing unsecured, small loans costs significantly more than
in traditional banking. However, Christen et al (2003) argue that profitability does not depend on the
clientele reached, but on the degree to which the MFI is well designed and managed (Gibbons and
Meehan, 2000). On the other hand also, Hulme and Mosely (2006) contradict the finding by arguing
that there is inverse relationship between outreach and operational costs. Here, the argument is, the
higher outreach means higher transaction costs in order to get information about creditworthiness of
clients. The underlying assumption is that charging sustainable interest rates will not affect its depth
of outreach, as ―households demand access to credit, not cheap credit‖ (Morduch, 2000). Yet it also

49
implies that the MFI should maximize its efficiency (by decreasing its total costs, including
administrative and personnel costs) so as to minimize the effective interest rates it charges to its
borrowers. This same assumption does not imply, however, that MFIs should, right from the start,
charge very high sustainable interest rates for the sole purpose of financial self-sufficiency; but that
MFIs should consciously work towards financial self-sufficiency. In other words, profitability is not
an end in itself, but a means to reach a substantial number of poor, in order to make a dent in overall
poverty (Gibbons and Meehan, 2000). The finding is supported by Lafourcade et. al., (2005) who
state that operating and financial expenses of MFIs have remained to be high, and on average,
revenues have remained lower. Technological innovations, product refinements, and ongoing efforts
to strengthen the capacity of MFIs are needed to reduce costs, increase outreach, and boost overall
profitability.
5.2.2 Relationship between Operational Costs and Repayment Rate
The spearman‘s correlation coefficient shows that there is a significant negative relationship between
operational costs and repayment rate. From the finding, operational costs increase because of the
high rate of default among the microfinance clients which call for increased supervision and
recovery costs incurred by the microfinance. The above finding is supported by (MIX, 2001) which
confirms that microfinance is a high touch, high cost business. As a business model, its greatest
challenge is to lower operating costs in order to reduce the cost of service borne by borrowers. Thus,
there are good reasons to expect MFIs that have been in operation longer to be able to reduce costs
through learning by doing. Given the many potential differences in operating environments, degree
of subsidization, organizational structure, and lending technology, it is not clear that any finding of
increasing cost effectiveness would apply equally to all MFIs (Beard, Caudill, and Gropper, 2001).

50
Godquin (2004) and Rosengard (2001) concludes that to estimate the probability of default in
payment; a microfinance institution should consider character, capacity, conditions, capital, and
collateral of a particular borrower before extending the loan in order to identify possible risks in
lending as well as establishing the borrower‘s ability to repay the loan. MFIs clients undertake a
variety of enterprises simultaneously; MFIs should be concerned with repayment capacity of the
borrower, rather than with selection of a particular activity. Adverse selection and moral hazard will
increase the proportion of borrowers who can not repay their loans on time next to those who
experienced different adverse shocks (like illness or natural disasters). This helps to reduce on the
interest rates costs on the borrowers.
5.2.3 Relationship between Lending Policies and Outreach
The spearman‘s correlation coefficient shows that there is a significant positive relationship between
lending policies and outreach. Good lending policy of the microfinance institution attracts more
clients and this increase the outreach of the microfinance loan. Therefore from the finding above,
Rosenberg (2003) points out that financial service and the delivery methods of microfinance
institutions should be client targeted and based on simple procedures. If the microfinance institution
is spread over a wide geographical area, the selection of the target beneficiaries as well as the
delivery method of the services should be decentralized. The microfinance institution should have a
wide outreach and lenient lending policies so that it could accomplish its mission on a continuous
basis. This would be ensured by attaining a significantly larger scale of operation and building a
wide client base, including the underserved. Chimombo and Mataya (2000) further state that a good
microfinance institution should always be willing to adopt an appropriate loan delivery mechanism
so that its services are attractive and accessible to the relevant target groups, cover the different
51
situations of their client – base and should be appropriately priced so as to avoid subsidy elements
from one side and be competitively attractive to minimize the transaction costs, while ensuring
liquidity and rapid availability, on the other. It should be noted however, that if the institutions fail,
their clientele too would fail. Such failures are too costly, because it would cause the poor to lose
their confidence in the very system which is supposed to help them. Once the confidence is lost,
regaining the same would not only be difficult but also would take time. It would also drive the poor
back to the dependency syndrome, one of the bottlenecks for alleviating poverty in a sustainable
manner (Brand and Gerschick, 2000).
5.2.4 Relationship between Lending Policies and Repayment Rate
The spearman‘s correlation coefficient also shows that there is a significant positive relationship
between lending policies and repayment rate. This means that lenient lending policies encourage
clients to repay their loan on time. Freimer & Gordon (2005) argues that the borrower will default on
his loan when the duration of this loan is inferior to the minimum duration. An increase in the
duration along with irregular repayment schedules may also increase the probability of default. For a
given borrower and duration of the loan, it is argued that the repayment probability decreases with
the size of the loan, where the probability of default may be due to external factors such as illness or
accidental destruction of the borrower‘s productive assets. However, the above findings is not
supported by Slangen (2005) who state that there has been weaknesses in the operational structure
and the poor lending policies and decisions of MFIs due to the high costs of allocating adequate
information on new clients and clients‘ business in loan appraisal, and as a result of inadequate loan
supervision and follow – up, lending to low income from the loan portfolio, hence retardation in
sustainability. Due to the small loan amounts and the large number of individuals‘ loans, the default
52
rate of MFIs is normally high. The administration of many small loans, including processing and
tracking services, is a costly operation. In the first place, profitable credit administration requires
screening out borrowers who are not likely to repay, charging interest rates high enough to cover
costs, and responding vigorously to late payments—all of which run counter to the practical
incentives.
5.3 Conclusion
It is observed from the study that there was a significant negative relationship between operational
costs and outreach. This confirms that that microfinance cannot afford to subsidize loans. If the
organization is to provide loans on an on – going basis, it must charge interest rates that allow it to
cover its costs.
The study also revealed that there was a significant negative relationship between operational costs
and repayment rate. Since operating expenses are the main components of interest rates, identifying
their drivers and quantifying them constitutes the first steps in finding ways to improve efficiency of
microfinance institutions worldwide because it lowers the costs passed onto the borrowers, and in
the long run the microfinance may experience customer drop-out.
The major cost which limits the operations of microfinance is always the initial costs of supervision
and identifying the loyal borrowers who can repay the microfinance loans on time without default.
From the study, it was further noted that there was a significant positive relationship between
lending policies and outreach. This confirms to the fact that financial service and the delivery
methods of microfinance institutions should be client targeted and based on simple procedures. This
is because if the lending policies are so harsh to the borrowers then automatically the microfinance
clients‘ base will never grow in the long run. The study finding also showed that there was a
significant positive relationship between lending policies and repayment rate. This shows the fact
that a borrower will default on his/her loan when the duration of this loan is inferior to the minimum
duration. An increase in the duration along with irregular repayment schedules may also increase his
probability of default. Lending policies that are perceived to be helpful by microfinance clients will
always attract many to borrow however, any further adjustment or change in these lending policies
will deter the clients from borrowing.

53
5.4 Recommendations
Since it was observed from the study that there was a significant negative relationship between
operational costs and outreach, URWEGO should adopt technological innovations, product
refinements, and strengthen capacity that is needed to reduce costs and increase outreach.
URWEGO clients should be made aware of the advantages of on-time repayment and the
disadvantages of default to the microfinance and to themselves and they should be encouraged to
repay their outstanding loans on time to avoid denial of their preceding loan requests.
URWEGO microfinance bank should ensure that its lending policies are perceived to be friendly by
its clients; and their financial services and the delivery methods should be client targeted and based
on simple procedures. The selection of the target beneficiaries as well as the delivery method of the
services should be decentralized. It should adopt appropriate loan delivery mechanism so that its
services are attractive and accessible to the relevant target groups, cover the different situations of
their client – base and their loans should be appropriately priced.
A good lending policy will always attract more borrowers; therefore the microfinance should ensure
that the loan duration is not inferior to the minimum set duration and should fight against irregular
repayment schedules so that borrowers can plan for their repayment of the pending loans.
5.5 Areas for Further Research
Why microfinance outreach remains very limited, and no significant programs are currently
operating on a sustainable basis;
How microfinance programs can enhance their performance in the critical areas of outreach to the
disadvantaged, viability and sustainability, resource mobilization, and policy and macro factors;
54
How donor agencies and governments can best provide assistance for institutional strengthening and
capacity building to see how microfinance institutions can better meet their objectives in terms of
outreach and sustainability;
How microfinance institutions can adopt better risk management techniques that can both favor the
borrowers and the microfinance itself.

55
References
Adams, D. W. (2000). The decline in debt directing: An unfinished agenda. Paper
Presented at the Second Annual Seminar on New Development Finance, Goethe University
of Frankfurt.
Adongo, J and Christoph, S (2005). Factors Influencing Sustainability of Selected Microfinance
Institutions in Namibia. NEPRU RESEARCH REPORT No. 39.
AMFIU, (2006). Association of Micro Finance Institutions of Uganda (AMFIU)
Information Note 1. What Are Appropriate Interest Lending Rates for Micro Finance
Institutions in Uganda?
Beard, S., Caudill, and Gropper (2001). Which Microfinance Institutions are becoming more Cost
effective with time? Evidence from a mixture model.
Brand, M.; Gerschick, J. (2000): ―Maximizing Efficiency: The Path to Enhanced
Outreach and Sustainability‖, ACCION International, Washington, D:C:
Brealey and Myres (2003), Raising Capital for Microfinance; Sources of Funding and
Opportunity.
CGAP, (2000). Eligibility Criteria for Accessing core Funding of this Multi Donor Microfinance
Facility.
CGAP, (2000), “Multi-Year Overview Report” (Washington). This is also available on the web at
http://www.cgap.org/html/ac_annual_report.html.
Charitonenko, Stephanie and Afwan, Ismah. (2003) Commercialization of
Microfinance:Indonesia, ADB, Manila.
Cheron, E.J., Boidin, H., Daghfous, N. (2001), "Basic financial services of low-income individuals:
A comparative study in Canada", International Journal of Bank Marketing, Vol. 17
No.2, pp.49-60.
Chimombo, W. Simtowe, F. and Mataya, C. (2000). Design and Sustainability Issues of Rural Credit
and Saving Programs for the Poor in Malawi: An Action –Oriented Research Project.
Washington D.C.: IFPRI.
Christen, Robert P., and Richard Rosenberg, (2000), ―The Rush to Regulate: Legal
Frameworks for Microfinance,‖ CGAP Occasional Paper 4 (Washington). This is also
available on the web at http://www.cgap.org/html/p_occasional_papers.html. Christen, R. P., E. Rhyne, R. C. Vogel, and C. McKean (2003). Maximizing the outreach of
microenterprise finance: An analysis of successful microfinance programs. Program and
Operations Assessment Report No. 10. Washington, D.C.: U.S. Agency for International
Development.
Conning, J., (2002) ―Outreach, sustainability and leverage in monitored and peer-monitored
lending‖, Journal of Development Economics, 60, 2002, pp. 51-77.
Crabb, R.P. and Keller, T. (2006). A Test of Portfolio Risk in Microfinance Institutions. School of
Business Northwest Nazarene University. September 2006.
Cronbach, L. J. (1951). Coefficient Alpha and the Internal Structure of Tests. Psychometrika, Vol
16, 297-334.
Daniel C. Hardy, Paul Holden, and Vassili Prokopenko (2002). IMF Working Paper. Monetary and
Exchange Affairs Department Microfinance Institutions and Public Policy, September
2002
Davis, L. (2002). Does Microfinance Help the Poorest? What Programme Design
Features Might Maximise Impact on the Poorest Clients?

56
Drake, Deborah and Rhyne, Elisabeth. (2002) The Commercialization of
Microfinance:Balancing Business and Development, Kumarin Press, Bloomfield CT.
Gibbons, D.S., and Meehan, J.W. (2000). The Microcredit Summit‘s Challenge: Working
Towards Institutional Financial Self-Sufficiency while Maintaining a Commitment to
Serving the Poorest Families. Micro-credit Summit.
Gallardo, Joselito, (2001), ―A Framework for Regulating Microfinance Institutions: The
Experience in Ghana and the Philippines‖ (Unpublished; Washington: Financial
Sector Development Department, World Bank).
Gonzalez,. A. (2007). Efficiency Drivers of Microfinance (MFIs): The case of Operating
Costs. MICROBANKING BULLETIN, ISSUE 15, AUTUMN 2007
Gonzalez,. A. (2008). International Comparisons of Loan Balances per Borrower.
MICROBANKING BULLETIN, ISSUE 16, SPRING 2008
Hardy, D., P. Holden and V. Prokopenko, (2003) ―Microfinance institutions and public policy‖,
Journal of Policy Reform, 6, 2003, pp. 147-158.
Holden, Paul, (2002), ―Establishing Rural Enterprise in the Philippines‖ (Unpublished;
Washington: World Bank).
Hulme, D. and P. Mosley, (2006) Finance against poverty, Volumes 1 and 2, London:
Routledge, 2006.
Krejcie R.V and Morgan D.W (1970). Determining Sample Size for Research Activities,
Educational and Psychological Measurement. Sage Publications.
Lafourcade, L, A., Jennifer Isern, Patricia Mwangi, and Matthew Brown. (2005).
Overview of the Outreach and Financial Performance of Microfinance Institutions in Africa.
Lapenu, C. and M. Zeller, (2002) ―Distribution, growth, and performance of the microfinance
institutions in Africa, Asia and Latin America: A recent inventory‖, Savings and
Development, 26, 2002, pp. 87 -111.
Ledgerwood, Joanna, (1998), Microfinance Handbook: An Institutional and Financial
Perspective (Washington: World Bank).
Lensink, R., Aljar Meesters and Niels Hermes. (2006). Outreach and Efficiency of
Microfinance Institutions: is there a trade-off?
Meyer, R. L. (2002), "Track Record of Financial Institutions in Assisting the Poor in
Asia" ADB Institute Research Paper, No 49, December 2002.
Micro-Rate, Inter-American Development Bank, USAID, CGAP (2001). Journal on Performance
Indicators for Microfinance Institutions, Washington D.C.
Morduch, Jonathan J. (2000) 'The Microfinance Schism', World Development, 28, 4, pp.
617-629.
Morduch, Jonathan, J. (2000). The role of subsidies in microfinance: Evidence from the
Grameen Bank. Journal of Development Economics, 60(1):229–248, October 1999.
Morduch, Jonathan, (1999), ―The Microfinance Promise,‖ Journal of Economic Literature,
Vol. 37 (December), pp. 1569–614.
Montgomery, H and Weiss, J. (2004). Modalities for Microfinance Delivery in Asia and
Latin America: Lessons for the People‘s Republic of China; Asian Development Bank
Institute.
Mutenda, Edna M., (2001), ―Regulation and Supervision of Microfinance Institutions in
Zambia: Issues, Challenges, and Achievements” (Unpublished; Washington:
World Bank).

57
Navajas, S., Conning, J., and Gonzalez – Vega, C. (2000). Lending Technologies, Competition and
Consolidation in the Market for Microfinance in Bolivia.
Nubian Cheetah (2008). Urwego Community Banking – Rwanda.
Otero, M. & Rhyne, E. (1994). The new world of micro-enterprise finance: Building
Healthy financial institutions for the poor. Connecticut: Kumarian
Otero, M. (2001). Bringing Development Back in Microfinance: ACCION Publication.
Paxton, J. and C. Cuevas, (2002) ―Outreach and sustainability of member-based rural financial
intermediaries‖, in: M. Zeller and R.L. Meyer (eds), The triangle of microfinance:
Financial sustainability, outreach, and impact, Baltimore and London: Johns Hopkins
University Press, 2002.
Rahman, A. (2005). Women and Micro Credit Rural Bangladesh: An Anthropological Study of
Grameen Bank Lending. Boulder, Co. West View Press.
Rosengard, J.K. (2003). The State of Microfinance – Outreach, Profitability, and
Poverty. Findings from a database of 2600 microfinance. Sanderatne, Nimal (2002), 'Provocative Issues in Commercialization of Microfinance',
The ADB Finance for the Poor, 3, 1, pp.1-4.
Schreiner and Yaron (2001). Development Finance Institutions: Washington D.C: World Bank,
2001.
Sekaran, U. (2000). Research Methods for Business (3rd
Ed), Hermitage Publishing Services, USA.
Slangen, (2005). Bank Lending to Small and Medium size enterprises in Rural Areas; An
Analysis of Supply and Demand.
USAID and CGAP (2005). Case Study on Profitability of Microfinance Institutions, Sri Lanka.
World Bank. (2001). World Bank Development Report 2000/2001: Attacking poverty.
New York, Oxford University Press.
Wright, Graham A. N., (2000), Microfinance Systems; Designing Quality Financial
Servicesfor the Poor (Dhaka, Bangladesh: University Press Limited).
Zeller and Meyer (2002). The Triangle of Microfinance. Financial Sustainability, Outreach and
Impact.
Zohir, S. and Matin, I. (2004). Wider Impacts of Microfinance Institutions: Issues and Concepts,
Journal of International Development. 16: 301-330.

58
MAKERERE UNIVERSITY
MAKERERE UNIVERSITY BUSINESS SCHOOL
GRADUATE AND RESEARCH CENTRE
Operational Costs, Lending Policies and Outreach of Urwego Opportunity Bank Ltd, Questionnaire for Employees
Dear Respondents,
You are kindly requested to complete this questionnaire appropriately and the information provided will be treated with
utmost confidentiality. In case you are interested in receiving a copy of the outcome of the study, please indicate your
contact address and at the end of this questionnaire.
Thank you for participating and making this study a success.
SECTION I
BACKGROUND INFORMATION
1. Gender (Please tick) Male Female ______
2. Highest level of Education
i) ‗‗O‘‘ Level and below _______ ii) ‗‗A‘‘ Level ______ iii) Diploma ______
iv) Degree _______ v) Postgraduate _______
3. What is your job position with URWEGO Microfinance Bank? _________________
4. For how long have you worked with URWEGO Microfinance Bank?
i) Less than 1 year ______ ii) 1 – 3 years ______ iii) 4 – 6 years ______
iv) 7 years and above _________
Please circle the most appropriate option on the right hand side of the questions;
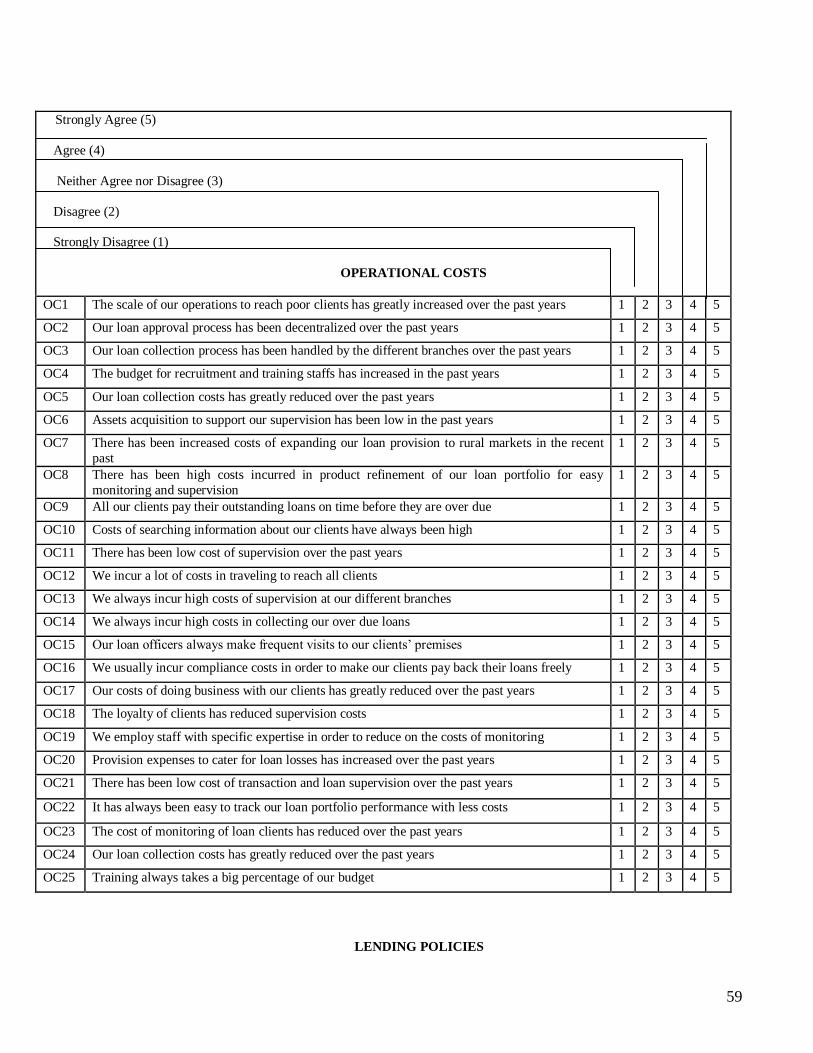
59
Strongly Agree (5)
Agree (4)
Neither Agree nor Disagree (3)
Disagree (2)
Strongly Disagree (1)
OPERATIONAL COSTS
OC1 The scale of our operations to reach poor clients has greatly increased over the past years 1 2 3 4 5
OC2 Our loan approval process has been decentralized over the past years 1 2 3 4 5
OC3 Our loan collection process has been handled by the different branches over the past years 1 2 3 4 5
OC4 The budget for recruitment and training staffs has increased in the past years 1 2 3 4 5
OC5 Our loan collection costs has greatly reduced over the past years 1 2 3 4 5
OC6 Assets acquisition to support our supervision has been low in the past years 1 2 3 4 5
OC7 There has been increased costs of expanding our loan provision to rural markets in the recent
past
1 2 3 4 5
OC8 There has been high costs incurred in product refinement of our loan portfolio for easy
monitoring and supervision
1 2 3 4 5
OC9 All our clients pay their outstanding loans on time before they are over due 1 2 3 4 5
OC10 Costs of searching information about our clients have always been high 1 2 3 4 5
OC11 There has been low cost of supervision over the past years 1 2 3 4 5
OC12 We incur a lot of costs in traveling to reach all clients 1 2 3 4 5
OC13 We always incur high costs of supervision at our different branches 1 2 3 4 5
OC14 We always incur high costs in collecting our over due loans 1 2 3 4 5
OC15 Our loan officers always make frequent visits to our clients‘ premises 1 2 3 4 5
OC16 We usually incur compliance costs in order to make our clients pay back their loans freely 1 2 3 4 5
OC17 Our costs of doing business with our clients has greatly reduced over the past years 1 2 3 4 5
OC18 The loyalty of clients has reduced supervision costs 1 2 3 4 5
OC19 We employ staff with specific expertise in order to reduce on the costs of monitoring 1 2 3 4 5
OC20 Provision expenses to cater for loan losses has increased over the past years 1 2 3 4 5
OC21 There has been low cost of transaction and loan supervision over the past years 1 2 3 4 5
OC22 It has always been easy to track our loan portfolio performance with less costs 1 2 3 4 5
OC23 The cost of monitoring of loan clients has reduced over the past years 1 2 3 4 5
OC24 Our loan collection costs has greatly reduced over the past years 1 2 3 4 5
OC25 Training always takes a big percentage of our budget 1 2 3 4 5
LENDING POLICIES
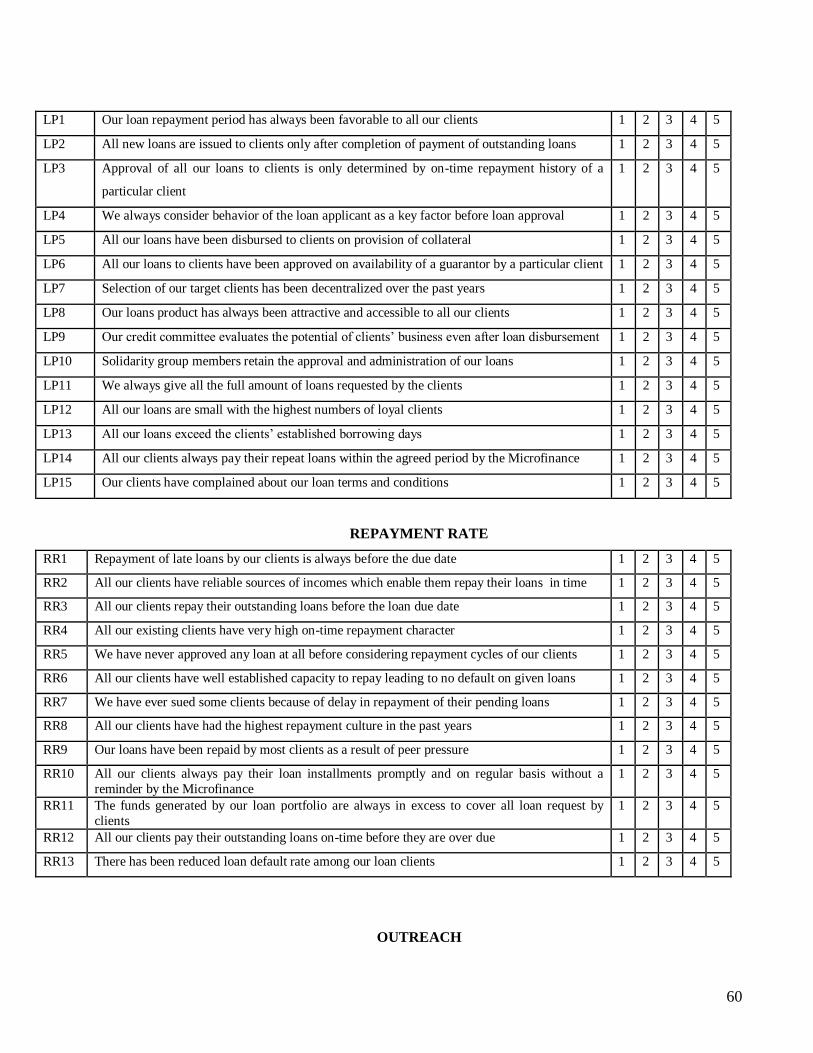
60
LP1 Our loan repayment period has always been favorable to all our clients 1 2 3 4 5
LP2 All new loans are issued to clients only after completion of payment of outstanding loans 1 2 3 4 5
LP3 Approval of all our loans to clients is only determined by on-time repayment history of a
particular client
1 2 3 4 5
LP4 We always consider behavior of the loan applicant as a key factor before loan approval 1 2 3 4 5
LP5 All our loans have been disbursed to clients on provision of collateral 1 2 3 4 5
LP6 All our loans to clients have been approved on availability of a guarantor by a particular client 1 2 3 4 5
LP7 Selection of our target clients has been decentralized over the past years 1 2 3 4 5
LP8 Our loans product has always been attractive and accessible to all our clients 1 2 3 4 5
LP9 Our credit committee evaluates the potential of clients‘ business even after loan disbursement 1 2 3 4 5
LP10 Solidarity group members retain the approval and administration of our loans 1 2 3 4 5
LP11 We always give all the full amount of loans requested by the clients 1 2 3 4 5
LP12 All our loans are small with the highest numbers of loyal clients 1 2 3 4 5
LP13 All our loans exceed the clients‘ established borrowing days 1 2 3 4 5
LP14 All our clients always pay their repeat loans within the agreed period by the Microfinance 1 2 3 4 5
LP15 Our clients have complained about our loan terms and conditions 1 2 3 4 5
REPAYMENT RATE
RR1 Repayment of late loans by our clients is always before the due date 1 2 3 4 5
RR2 All our clients have reliable sources of incomes which enable them repay their loans in time 1 2 3 4 5
RR3 All our clients repay their outstanding loans before the loan due date 1 2 3 4 5
RR4 All our existing clients have very high on-time repayment character 1 2 3 4 5
RR5 We have never approved any loan at all before considering repayment cycles of our clients 1 2 3 4 5
RR6 All our clients have well established capacity to repay leading to no default on given loans 1 2 3 4 5
RR7 We have ever sued some clients because of delay in repayment of their pending loans 1 2 3 4 5
RR8 All our clients have had the highest repayment culture in the past years 1 2 3 4 5
RR9 Our loans have been repaid by most clients as a result of peer pressure 1 2 3 4 5
RR10 All our clients always pay their loan installments promptly and on regular basis without a
reminder by the Microfinance
1 2 3 4 5
RR11 The funds generated by our loan portfolio are always in excess to cover all loan request by
clients
1 2 3 4 5
RR12 All our clients pay their outstanding loans on-time before they are over due 1 2 3 4 5
RR13 There has been reduced loan default rate among our loan clients 1 2 3 4 5
OUTREACH

61
OR1 There has been an increase in the number of our active clients over the past years 1 2 3 4 5
OR2 Our loan portfolio has been growing over the past years 1 2 3 4 5
OR3 There is a constant increasing rate of loan rotation amongst all our clients 1 2 3 4 5
OR4 Our loan products have been valuable to all our clients over the past years 1 2 3 4 5
OR5 We have opened up new branches in other location due to high returns from loan repayments 1 2 3 4 5
OR6 Our loan portfolio has grown over the past years with limited clients‘ drop out 1 2 3 4 5
OR7 We always receive large numbers of loan applicants on daily basis 1 2 3 4 5
OR8 Our loan expansion plan has been very beneficial to all our clients 1 2 3 4 5
OR9 Our loan scheme has greatly improved the business incomes of all our clients 1 2 3 4 5
OR10 Majority of our loan applicants are given the amount of loans they request for 1 2 3 4 5
OR11 The percentage of clients who are women to the total clients is high 1 2 3 4 5
OR12 The loan size of this microfinance institution is very small 1 2 3 4 5
OR13 Our firm provide loans to clients from all parts of Rwanda 1 2 3 4 5
OR14 The number of disabled clients served is high 1 2 3 4 5
OR15 The highest percentage of clients being served is located in rural areas 1 2 3 4 5
OR16 Our loan procedures are easily understood by all our clients 1 2 3 4 5
OR17 Our loan delivery methods are simple and client targeted 1 2 3 4 5
OR18 Our loan portfolio has changed the living standard of our clients 1 2 3 4 5
OR19 We take appropriate time in supplying our loan facilities to clients 1 2 3 4 5
OR20 There has been growth in our average loan size disbursed to clients in the previous years 1 2 3 4 5
END