Embed Size (px)
Citation preview
1
Maker-Taker Fee, Liquidity Competition, and High Frequency Trading*
Yiping Lina, Peter L. Swanb, and Frederick H. deB. Harrisc,†
This Draft: December 1, 2016
Abstract
This paper analyzes how a maker-taker fee reduction affects market competition,
liquidity, and high frequency trading. The purposes are threefold: 1) whether
reducing the exchange maker-taker fee attracts liquidity from off exchange venues;
2) holding the net exchange fee relatively constant, whether the components of
maker-taker fee change matter; and 3) how HFT responds to the rebate/fee change.
By using the Nasdaq maker-taker fee experiment and difference-in-differences
methodology, we find that the unilateral maker-taker fee reduction in one lit
exchange did not gain market share from off-exchange trading venues; instead, a
redistribution of market share among existing lit exchanges occurred. Overall,
market share shifted from Nasdaq to other lit exchanges with the highest rebate
payment. The experiment demonstrates that, in addition to the net fee, the
components of the maker-taker fee change matter in competitive fragmented
markets. The reduced maker rebate lowers quote quality and the percentage of
incoming orders routed to Nasdaq. However, in an offsetting manner, it improves
fill rate and speed of fill due to the reduced taker fee. Also, the market efficiency
declines. Thanks to the improved relative position of a market in routing tables,
adverse selection costs decline. This raises standard measures of market liquidity,
while liquidity supplier profits decrease. As the fee and rebate reduce, high
frequency traders tend to switch from adding to removing liquidity.
Keywords: High Frequency Trading; Liquidity; Maker-Taker Fee; Market Fragmentation;
Market Efficiency
JEL Classifications: G12, G14 * The views expressed herein are strictly those of the authors. Yiping Lin acknowledges the financial support from
the CMCRC and Wake Forest University for facilitating his work in the United States. We thank Nasdaq, Inc. for
providing data while Yiping Lin was visiting under an agreement between Nasdaq and the CMCRC. The views
herein are not intended to represent the views of Nasdaq, Inc., its employees, or directors. Any errors or omissions
are the responsibility of the authors alone. † a School of Banking and Finance, UNSW Business School, UNSW, Sydney NSW 2052 Australia; email:
[email protected]. b School of Banking and Finance, UNSW Business School, UNSW, Sydney NSW 2052
Australia; email: [email protected]. c School of Business, Wake Forest University, Winston-Salem, NC
27106, United States; email: [email protected].

2
I. Introduction
There is ongoing debate on the exchange fee structure employed in U.S. markets. Over the past decade,
hundreds of exchange-listed securities have traded more volume in off-exchange markets than on
exchange markets, and there has been speculation that the high exchange access fee has driven trading
away from public lit markets. To test the question, Nasdaq implemented an access fee pilot, which
reduced the maker rebate and taker fee. Nasdaq’s SEC (2014) filing stated that “in response to claims
that public markets are too expensive, Nasdaq will modify Nasdaq Rule 7018(a) to lower execution fees
for a select group of securities where access fees may be discouraging the use of public markets”3.
However, the importance of the components of maker-taker fee changes remains unclear. Previous
studies such as Angel, Harris, and Spatt (2011), Colliard and Foucault (2012), and Malinova and Park
(2015) state that only the net fee change matters and that the maker-taker fee breakdown is irrelevant
since the tax on market orders appears to offset the subsidy to limit orders. By contrast, Foucault,
Kadan, and Kandel (2013) show that trading volume may increase or decrease (depending on the model
parameters), even in the absence of a change in the net total fee, because a fixed tick size prevents prices
from neutralizing the effect of the maker rebate.
In this study, we use the difference-in-differences (DID) method to examine the impact of the exchange
access fee change on market competition, liquidity, and high frequency trading (HFT) behavior.
Specifically, we first test whether reducing the exchange maker-taker fee attracts liquidity from off-
exchange venues. Second, we test whether the components of maker-taker fee changes matter when the
net exchange fee remains relatively constant. Third, we extend the purpose of the Nasdaq pilot to test
how HFT behavior changes in response to the maker-taker fee change.
The Nasdaq access fee reduction pilot offers an informative natural experiment. Nasdaq charge taker fee
for removing liquidity by submitting marketable orders, and provide maker rebate for adding liquidity
by submitting non-marketable orders (i.e., limit order s which cannot be executed immediately). On
February 2, 2015, Nasdaq implemented a maker-taker fee pilot for 14 traded stocks on Nasdaq where the
taker fee was lowered to 5 cents per 100 shares (CPS) from 30 CPS to remove displayed liquidity; the
3 In addition, the SEC is considering implementing a market-wide exchange access fee pilot. See SEC Memorandum:
Framework for Potential Access Fee Pilot, 2016, available at https://www.sec.gov/spotlight/emsac/emsac-regulation-nms-
subcommittee-recommendation-041916.pdf.
3
maker rebate for adding displayed liquidity was lowered to 4 CPS from an indicative4 29 CPS. For
simplicity, the indicative rebate for the PilotOff period is summarized in Table 1. The pilot ended on
May 31, 2015, when the fee reverted to its pre-pilot level.
<Insert Table 1 here>
The International Organization of Securities Commissions defines maker-taker fees as “a pricing model
whereby the maker of liquidity, or passive [limit] order, is paid a rebate and the taker of liquidity, or
aggressive [market] order, is charged a fee.” Maker-taker fees for protected quotes in the equities
markets are bound by Rule 610 of Regulation NMS5, which caps fees at 30 CPS traded. Maker rebates
aim to both improve liquidity, by rewarding its provision, and increase trading volume.
The maker-taker payment model originated with electronic trading venues in the late 1990s (Harris,
2013). In 1997, the Island electronic communication network (ECN) was among the first markets to
adopt maker-taker fees, which attract order flow through liquidity rebates. These rebates provide traders
with an additional source of income other than the bid-ask spread, incentivizing liquidity providers to
post more competitive quotes to attract order flows from other markets. As a result, Island’s market
share of reported Nasdaq trades increased from approximately 3% in 1997 to almost 13% in 1999
(Cardella, Hao, and Kalcheva, 2015). Other alternative trading systems (ATSs) soon followed Island’s
fee model to attract liquidity and order flows from lit exchanges (SEC, 2015a).
<Insert Table 2 here>
In response to the ATS competition, many exchanges adopted maker-taker fees of their own. Over the
past decade, the maker-taker pricing model has thus gained widespread adoption in the U.S. equities
4 The maker rebate scheme is much more complicated (see http://nasdaqtrader.com/Trader.aspx?id=PriceListTrading2).
Further, see ITG Takeaways from the NASDAQ Pilot Program report, available at
http://www.itg.com/marketing/ITG_Pearson_WP_20150602.pdf. 5 If the price of a protected quotation is less than $1, the fee cannot exceed 0.3% of the quotation price. See SEC Rule 610.

4
market (see Table 2), rewarding liquidity suppliers and charging liquidity demanders. Only three U.S.
exchanges (BATS-Y, EDGA, Nasdaq/BX) adopt the inverted fee (taker-maker) model, offering rebates
to take liquidity accompanied by a higher fee in order to add liquidity.
Taker fees and maker rebates comprise a significant proportion of overall trading costs, given the typical
bid-ask spread in a liquid stock is tick constrained, which is 1 cent set by the SEC for stock prices above
$1. Although most retail investors do not have access to this information, all institutional investors and
market makers, which account for majority of trading activity, make use of such data. Brokers
commonly sell their marketable orders to wholesale dealers to capture the bid-ask spread and to avoid
access fees, and send their non-marketable orders to exchanges for executions to gain maker rebate
(Angel, Harris, and Spatt, 2015). In particular, they employ so-called “smart order routers” that take into
account real-time state information and formulate an order routing problem that considers various
execution metrics to decide whether to place a limit order or market order and accordingly to which
venue(s) to direct their order (Maglaras, Moallemi, and Zheng, 2012).
Because of its effect on execution probability in a fragmented market, we expect this liquidity impact of
an exchange’s fee-based net pricing to be increasingly important in the high frequency trading
environment and perhaps explain the shift from lit exchanges to off-exchange venues. The venues that
offer the highest rebates and lowest fees may not provide the best execution of customer orders, given
the types of order flows they tend to attract. For nonmarketable orders, brokers may therefore be
incentivized to route customer orders to rest on a trading venue with the highest maker rebate. However,
venues with high maker rebates are necessarily financed with higher taker fees, meaning that they tend
to be ranked low on a broker’s routing tables for routing marketable orders that take liquidity. Further,
although the SEC Order Protection Rule establishes price priority in U.S. equity markets, it does not
specify who trades first when multiple trading venues have the best posted price (Battalio, Corwin, and
Jennings, 2015). Hence, all else being equal, a price-sensitive market participant is more likely to route
an order to take liquidity from an exchange with a lower taker fee. As a result, nonmarketable orders
sent to rest on trading venues with high taker fees may experience lower fill rates (SEC, 2015). They
may also be more likely to trade when the price moves against them (Angel, Harris, and Spatt, 2011).
For example, an order to buy resting at $9.50 on an exchange with a high taker fee might not get filled if
the market price fell to $9.50 but not below and then moved up, because that exchange would likely be
ranked low on market participants’ routing tables.
5
Angel, Harris, and Spatt (2011) argue that introducing a maker rebate financed by a taker fee should
have no effect, because prices in competitive markets adjust by the rebate amount. However, this
argument assumes that the information content in order flows is the same across venues and breaks
down when different venues have different fee structures. Colliard and Foucault (2012) formalize Angel,
Harris, and Spatt’s intuition and prove, without relying on perfect competition, that in the absence of
frictions only changes in the net total fee retained by the exchange affect liquidity and trading volume.
Foucault, Kadan, and Kandel (2013), by contrast, show that trading volume may increase or decrease
(depending on the model parameters), even in the absence of a change in the net total fee, because a
fixed tick size prevents prices from neutralizing the effect of the maker rebate. A problem, however,
with this extensive literature is that it does not take into account the switch in informed order flow away
from a high liquidity subsidy exchange to its closest competitors when the subsidy is lowered. This may
be caused by the change in the exchange’s relative position of the routing table.
From an empirical perspective, Malinova and Park (2015) analyze whether and why the breakdown of
trading fees between liquidity demanders and suppliers matters by using a change in trading fees on the
Toronto Stock Exchange (TSX), which is a monopoly exchange in their sample period. They find that
posted quotes adjust after the change in fee composition, but that the transaction costs for liquidity
demanders remain unaffected once fees are taken into account. In the absence of competition from
competing exchanges, one does not expect any change in the composition of the order flow. However,
we find that adverse selection costs decrease after the maker-taker fee reduces, holding the net exchange
fee relatively constant6.
Colliard and Foucault (2012) theorize that in the absence of frictions, changes in the breakdown of the
total fee between makers and takers should not affect trading behavior; only changes in the net exchange
fee are economically meaningful for participant welfare. However, the informed traders in a competitive
trading environment are not included in their model as patient and impatient traders are not informed
traders. If an exchange introduces a maker rebate and finances it by adopting an increased taker fee
without changing the total fee, then, ceteris paribus, placing a market order becomes relatively more
expensive than trading with a limit order. As some traders switch from market orders to limit orders,
each limit order’s execution probability declines and thus traders may improve quotes to attract matches
6 Because more than 90% of execution volume is displayed liquidity and more than 6% is non-displayed liquidity in our
sample (Table 3), the overall net fee change remains relatively stable.

6
for their limit orders. Without frictions, the benefit from maker rebates could be exactly offset by the
narrowed bid-ask spread but only if the information content in the order flow is unaffected by the
introduction of the matching fee subsidy. However, the implicit assumption of an unchanged order flow
is implausible since informed trades with short-lived information need to be more aggressive to achieve
a higher executive probability.
Consequently, changes in the breakdown of the total fee between makers and takers should affect
trading behavior and raise the spread, as liquidity trades are the first to be shifted toward making
liquidity, while trades taking liquidity contain a higher proportion of asymmetric information. The
alternative prediction of an unchanged spread made by Angel, Harris, and Spatt (2011) arises since they
do not consider the altered order flow. While the Angel, Harris, and Spatt (2011) prediction is
empirically supported by Malinova and Park (2015), this concurrence is most likely because they study
the 2005 TSX fee change when it was a monopoly. In contrast, our study finds that when holding the
total exchange fee relatively constant, the change in the breakdown of the fee components does matter.
This difference may be driven by that our study examines the Nasdaq fee change in a competitive
trading environment with 11 competing stock exchanges, approximately 40 active ATSs, and numerous
broker-dealer platforms (Hatheway, Kwan, and Zheng, 2016). On a monopoly exchange, the variation in
order flow informativeness is likely to be exceedingly small.
Barclay, Kandel, and Marx (1998) empirically study how changes in bid-ask spreads influence volume
and prices, finding that higher transaction costs reduce trading volume. Lutat (2010) argues that the
Swiss Stock Exchange’s removal of a maker fee (without changing the taker fee) has not affected the
quoted spreads. Cardella, Hao, and Kalcheva (2015) study a number of maker-taker fee changes in the
United States from 2008 to 2010. They find that an exchange’s total fee relative to that of other
exchanges affects its trading volume and that a change in the taker fee has a stronger effect than a
change in the maker rebate. They also show that the breakdown of the total fee into maker rebates and
taker fees does not affect the quoted spreads. However, Malinova and Park (2015) argue that in Lutat
(2010) and Cardella, Hao, and Kalcheva (2015), changes in the maker-taker fees are in fact accompanied
by changes in the total fee.
Foucault, Kadan, and Kandel (2013) examine the relative importance of the net fee and the levels of the
maker and taker fees. They show that the breakdown of the total fee between makers and takers only
becomes economically meaningful when the minimum tick size restricts adjustments to bid and ask
7
prices but do not consider how the competition between maker-taker business models affects the
information content of the order flow. Exchanges can maximize their trading volume by differentiating
their maker rebates and taker fees. If liquidity demand (supply) is insufficient, the venue can decrease
(increase) its taker fee and maker rebate.
We also examine how such a maker-taker fee reduction affects market efficiency, which is an important
aspect of market quality. The market efficiency hypothesis introduced by Fama (1970) emphasizes a
lack of return predictability as the criterion for efficiency. Lo and MacKinlay (1988) tests market
efficiency using variance ratio test which exploits the underlying property of the random walk process.
Chordia, Roll, and Subrahmanyam (2008) present return predictability from order flows can arise in at
least two ways. First, illiquidity raises implicit transaction costs (spreads) which squelch arbitrage
activity. Second, market makers may mis-react to the information content of the order flow. This
mispricing can create an incentive for outside agents to gather such information and trade on it. In this
case, market makers will face increased adverse selection, which raises the equilibrium spread and leads
to a less liquid market. Chordia, Roll, and Subrahmanyam (2008) find that liquidity enhances the
incorporation of private information into prices. When the maker-taker fee is reduced, we typically find
that the variance ratios increase, while first-order return autocorrelations decline in Nasdaq. This pattern
suggests that the observed increase in these variance ratios is caused by increased mispricing, with less
private information being reflected in prices. Moreover, compared with Nasdaq, the three other highest
rebate-paying exchanges (Arca, BATS Z, NYSE) experience a relatively low decline in market
efficiency.
Brolley and Malinova (2012) argue that the effect of changes in the breakdown of the total fee into a
maker rebate and a taker fee is not neutral if some traders (e.g., retail traders) only pay them on average,
for example, through a flat commission to their brokers. In their model, only a fraction of traders receive
maker rebates for each executed limit order. As the maker rebate increases, these traders improve their
quotes and the raw bid-ask spread thus declines. Ceteris paribus, traders who pay the flat fee base their
order choices on the raw bid-ask spread rather than the cum fee bid-ask spread, thereby submitting
relatively more market orders as the raw bid-ask spread declines. The authors then predict that in the
presence of asymmetric information, the change in trader behavior causes market orders to become less
informative. Their prediction is driven by the monotonic equilibrium behavior of traders in their model
whereby, similar to Kaniel and Liu (2006) and Rosu (2012), traders with a sufficiently large
8
informational advantage use market orders and those with weaker information use limit orders. This is
due to privately informed traders facing a trade-off between the better price offered by a limit order and
the potential loss of their informational advantage if their limit order does not execute. Those with the
strongest informational advantage thus choose market orders and pay the bid-ask spread, whereas those
with a weaker advantage choose limit orders and (hope to) receive the spread.
However, HFT traders place either limit orders to gain rebates or market orders to pay a fee depending
on their degree of information. In the maker-taker pricing model, the liquidity supplier has two main
sources of revenue, namely bid-ask spreads and rebates, while liquidity takers profit from price
movement minus the taker fee. In electronic markets, large market orders consume the available
liquidity and widen the bid-ask spread. This drop in liquidity creates a profit opportunity for liquidity
suppliers, which react by posting new quotes (make liquidity phase), which in turn create a new trading
opportunity for liquidity demanders (take liquidity phase). Foucault, Kadan, and Kandel (2013) theorize
this “liquidity cycle” process appears repeatedly. Each trading opportunity is short-lived as it disappears
once a trader exploits it. Thus, HFT traders, who react faster than their competitors, gain the most from
the profit opportunity.
The SEC has requested comment on the HFT volume geared toward earning liquidity rebates and has
questioned whether “rebates [are] unfair to long-term investors because they necessarily will be paid
primarily to [high-frequency] proprietary firms engaging in passive market making strategies. Or do
they generally benefit long-term investors by promoting narrower spreads and more immediately
accessible liquidity?” (SEC, 2010). Angel, Harris, and Spatt (2011, p. 39) further argue that the maker-
taker model has “aggravated agency problems among brokers and their clients” because a typical broker
does not forward the exchange fees to its clients on a trade-by-trade basis and may have a conflict of
interests with its clients regarding the choice of trading venue.
The strength of our analysis lies in the structure of the Nasdaq fee pilot change. First, Nasdaq introduced
the maker-taker fee reduction only for a predefined subset of 14 securities, permitting the analysis of the
impact using a DID approach. Second, the pilot only lasted for four months in 2015, enabling us to
compare PilotOn with PilotOff events. Third, Nasdaq data allow us to analyze how HFT reacts to the
maker-taker fee reduction compared with non-HFT across different resting order types, giving us new
insights into the nature of HFT.

9
Our results show that when Nasdaq reduces the maker-taker fee unilaterally without the cooperation of
other exchanges, there are no significant changes in the market share of off-exchange trading venues (we
classify these into dark pools and non-dark pools). Instead, we observe a redistribution effect among
exchanges, whereby the reduced Nasdaq market share tends to shift to exchanges with higher maker
rebates. Hence, holding the exchange net fee relatively constant, when the maker rebate reduces, the
queue of Nasdaq limit orders shrinks, as evidenced by the drop in the percentage of time and depth at the
National Best Bid and Offer (NBBO).
Because the taker fee of removing liquidity declined (i.e., the tax on buyer- and seller-initiated trades
fell), more market orders are submitted since they are less costly to trade. Moreover, the fill ratio and
speed of fill increased as a wider class of investors could now profit with the lowered taker fee. Prior to
the experimental pilot, the high taker fee discouraged all but relatively informed investors owing to the
relative position of a market in routing tables. Since the exchange access fee is a material portion of the
transaction cost given a stock is tick constrained, if one exchange’s taker fee is relatively high, such a
market tends to be ranked relatively low in the routing table. Thus, only the most informed orders are
likely to reach it. Recall that traders possessing relatively short-lived information require immediate
(liquidity taking) execution and hence are the most willing to pay the taker tax. With the lower access
fee, Nasdaq would have moved up in the tables. Hence, we predict that the information content of trade
will decline. The thinner limit order book deprived of its former subsidies becomes less attractive for
informed traders and these are likely to switch to other exchanges that have retained their high liquidity
subsidies in a competitive environment. Realized spreads should then increase to reflect the high but
falling proportion of informed traders, but the cum-rebate (i.e., the net realized spread) decreases
because of the smaller proportion of informed traders hitting limit orders. Hence, not only does the pilot
reduce the net realized spread, but also the effective spread and market impact costs lower, which are all
indicators of the switch in the informed order flow toward other high-rebate venues. As a net result, the
Nasdaq market share declines on average and is captured by the other high rebate-paying exchanges in
close competition with Nasdaq. This finding indicates that the components of the exchange access fee do
matter in a competitive trading environment.
Since the provision of liquidity to highly informed traders is specialized, we also find a more than
proportionate departure of HFT from the provision of liquidity but, more surprisingly, there is no net
loss in HFT, as there is a shift to the expanding sector engaged in removing liquidity (i.e., market

10
orders). One explanation, according to the SEC (2010) concept release, is the rebate capture by HFT;
however, more relevant is the contribution of the speed of execution when dealing with highly informed
order flows.
The rest of the paper is organized as follows. Section II discusses the institutional details. Section III
describes the data, sample selection, and research methodology. Section IV tests our empirical
predictions on trading volume, market liquidity, and HFT trading behavior. Section V presents the
results of our robustness tests and Section VI concludes.
II. Institutional Details
In this section, we describe the U.S. stock exchanges, off-exchange trading, and securities information
processor (SIP) data. The following 11 lit exchanges account for approximately 65% of the market share
in U.S. equities7: BATS Exchange (BATS), BATS Y Exchange (BATS Y), Chicago Stock Exchange
(CHX), EDGA Exchange (EDGA), EDGX Exchange (EDGX), NASDAQ BX (BX), NASDAQ PHLX
(PSX), Nasdaq Stock Market (NASDAQ), New York Stock Exchange (NYSE), NYSE MKT (AMEX),
and NYSE Arca (ARCA). Among these 11 lit exchanges, NASDAQ, BX, and PSX are within the
NASDAQ group (18.2% market share); NYSE, ARCA, and AMEX are within the Intercontinental
Exchange group (24.6%); and BATS, BATS Y, EDGA, and EDGX are within BATS Global Markets
(21.6% ) and Chicago Stock Exchange (0.6% of total market share)8. At the exchange level, NASDAQ
has the largest market share (approximately 15%) followed by NYSE and ARCA. NASDAQ follows the
price, display type, and time execution priority model.
Off-exchange trades for NMS stocks, which account for about 35% of total volume, need to be reported
to FINRA trade reporting facility (TRF) by members for which the Participant ID (Pid) is D in
centralized SIP data. FINRA has established two TRFs in conjunction with NASDAQ and NYSE9. U.S.
equities trade execution venues can be classified into three main categories: exchanges, dark pools, non-
7 The CBOE Stock Exchange and National Stock Exchange, Inc. ceased market operations on April 30, 2014 and May 30,
2014, respectively. 8 Nasdaq Trader website in December 2015: http://nasdaqtrader.com/trader.aspx?id=FullVolumeSummary. 9 FINRA Trade Reporting FAQ: http://www.finra.org/industry/trade-reporting-faq.
11
dark pools off-exchange venues which consists of ECNs10, voice-brokered trades, and broker-dealer
internalization. Dark pools and ECNs are also called ATSs. The primary difference between an ATS
(typically operated by broker-dealers) and an exchange includes less regulatory scrutiny, fewer reporting
requirements, and restricted access.
III. Data, Sample Selection, and Methodology
A. Data source
Our analysis is based on trader-level data and U.S. SIP data. Our HFT data are identified by Nasdaq
based on the method described in Brogaard, Hendershott, and Riordan (2014). We analyze the effect of
Nasdaq’s fee pilot for an eight-month window (December 1, 2014 to July 31, 2015), which is two
months before to two months after the introduction of the maker-taker fee pilot, which ran from
February 2, 2015 to May 31, 2015. We exclude the half-day trading on Christmas Eve.
Our data include all information on order submission and trades, including price, volume, and a unique
identifier for the trader that submitted the order, which allow us to construct the HFT data. We restrict
our attention to transactions that occur in the limit order book and trades during regular trading hours.
For each limit order book transaction, the data contain identifiers for buyer- or seller-initiated trade,
adding or removing liquidity, and types of liquidity (such as displayed, non-displayed midpoint, and
non-displayed non-midpoint). Further, our ATS data are provided via www.FINRA.org/ATS,
copyrighted by FINRA 2015. ATS data is reported weekly. Our 38 dark pools list is taken from the SEC
report on the “Regulation of NMS Stock Alternative Trading Systems.”
B. Sample selection
Nasdaq introduced a maker-taker fee reduction only for 14 stocks (seven listed on Nasdaq—AAL, MU,
FEYE, GPRO, GPRN, SIRI, and ZNGA—and seven listed on the NYSE—BAC, GE, KMI, RAD, RIG,
S, and TWTR). We use the remaining companies on each corresponding listing exchange to find a one-
to-one control group without replacement to ensure that our results are not driven by market-wide, 10 ECNs are prohibited from listing stocks and are not self-regulating organizations. The only remaining ECN in the United
States, LavaFlow owned by Citi, ceased market operations on January 30, 2015.

12
exchange-wide, or industry-wide fluctuations. Moreover, we exclude securities that had stock splits,
switched listing exchange, or had days with a stock price below $1. In our sample, the minimum trade
count per stock per day is 450.
Our control sample matches listing exchange, closing price, market capitalization, and average daily
trading volume (ADV) based on one month prior our sample period data. Davies and Kim (2009) argue
that one-to-one matching without replacement based on closing price and market capitalization is the
most appropriate method to test for differences in trade execution costs. O’Hara and Ye (2011) followed
their approach and matched on closing price, market capitalization and listing exchange. We add ADV
as a matching criterion since this study focuses not only on trade execution costs but also on trader
behavior.
In addition, we randomize the matching order by sorting the stocks in the treatment group alphabetically
by ticker symbol. The match for each treatment group security i is then defined to be the control group
security j that minimizes the following matching error:
𝑚𝑎𝑡𝑐ℎ𝑒𝑟𝑟𝑜𝑟𝑖𝑗 = |𝐶𝑃𝑖−𝐶𝑃𝑗
𝐶𝑃𝑖+𝐶𝑃𝑗| + |
𝑀𝐶𝑖−𝑀𝐶𝑗
𝑀𝐶𝑖+𝑀𝐶𝑗| + |
𝐴𝐷𝑉𝑖−𝐴𝐷𝑉𝑗
𝐴𝐷𝑉𝑖+𝐴𝐷𝑉𝑗|,
where CP, MC, and ADV denote the security’s closing price, market capitalization as of the end of
November 2014, and average November 2014 ADV on its corresponding listing exchange (i.e., Nasdaq
or NYSE), respectively. Our panel regression analysis employs a DID approach to account for market-
wide fluctuations. The estimation is based on the following DID regression specification:
𝑌𝑖𝑡 = 𝛼0 + 𝛼1𝑇𝑟𝑒𝑎𝑡𝑖 + 𝛼2𝑃𝑖𝑙𝑜𝑡𝑂𝑛𝑡 + 𝛽1𝑇𝑟𝑒𝑎𝑡𝑖 ∗ 𝑃𝑖𝑙𝑜𝑡𝑂𝑛𝑡 + 𝛾𝑉𝐼𝑋𝑡 + 𝜑𝑋𝑖 + 𝜖𝑖𝑡 , (1)
where 𝑌𝑖𝑡 is the dependent variable; 𝛼0 is the intercept; 𝑇𝑟𝑒𝑎𝑡𝑖 is the dummy variable if security i is a
pilot stock; PilotOn is the dummy variable that is one if date t is during the pilot period and zero
otherwise; 𝑉𝐼𝑋𝑡 is the closing value of CBOE’s volatility index for day t; and 𝑋𝑖 is the vector of security-
level control variables including the log of the average closing price during the sample period, the log of
the average market capitalization during the sample period, and average volatility, measured by daily
high price minus daily low price over closing price, during the sample period. We estimate the
specification with and without stock fixed effects.
13
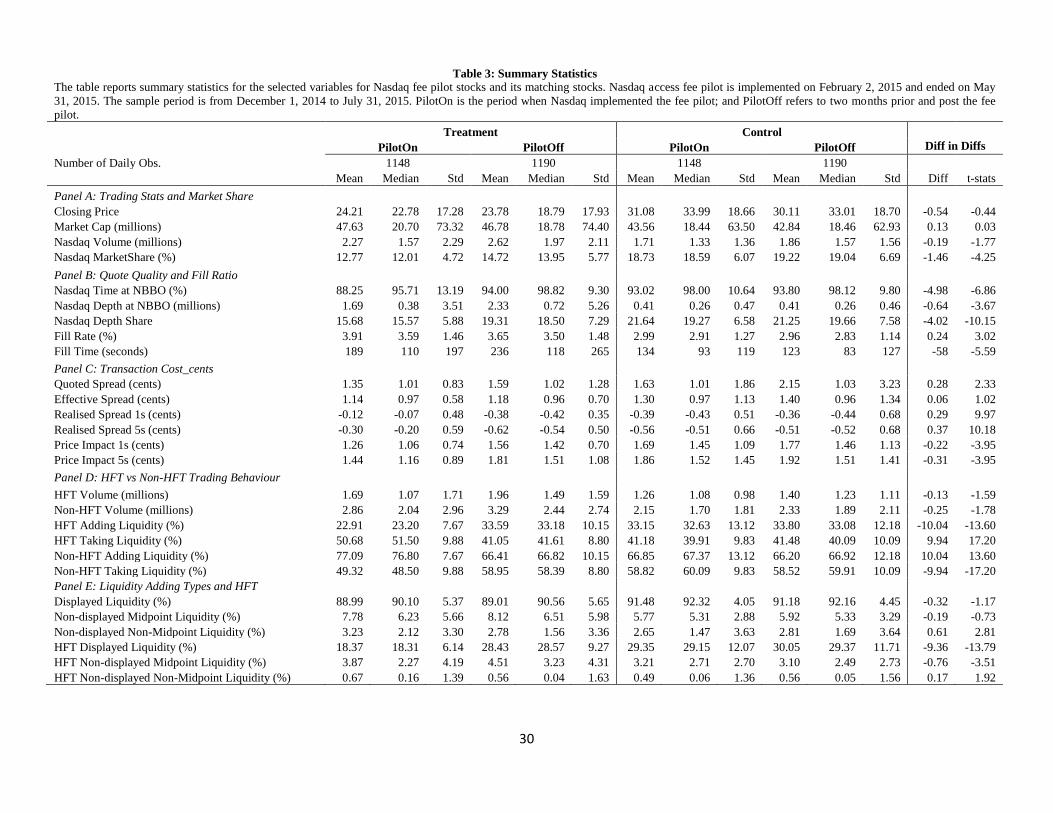
Table 3 reports the summary statistics across U.S. equity trading venues for our sample of 28 stocks
between December 1, 2014 and July 31, 2015. The sample period is divided into two parts: (i) the pilot
period between February 2, 2015 and May 31, 2015 and (ii) the two months before and after the pilot
from December 1, 2014 to February 1, 2015 and June 1, 2015 to July 31, 2015. The Nasdaq market
share dropped by 1.45% on average during the pilot period, while the average price and market
capitalization remained relatively stable. The Nasdaq depth at the NBBO and depth share declined,
while the fill ratio and speed of fill improved. The raw effective spread increased, while the realized
spread decreased, and the price impact decreased. By using Nasdaq data, we found that HFT changed
trading behavior from adding liquidity (dropped by 10.04%) to taking liquidity (increased by 9.94%)
after the reduction of the maker rebate and taker fee. The decline in HFT adding liquidity mainly came
from the displayed liquidity type.
<Insert Table 3 here>
IV. Empirical Results
A. Trading volume and market share
A1. Does a reduced exchange access fee attract trading volume from off-exchange venues?
Prediction: The Nasdaq access fee pilot aimed to test whether a lower exchange access fee can raise the
market share of off-exchange venues. In this regard, the SEC (2014) filing states the following: “Off-
exchange orders do not generate quotes on public markets, do not interact with orders on public
markets and consequently do not promote or contribute to price discovery to the same extent as do
orders posted and executed on exchanges. Economic studies from markets spanning the world conclude
that as more orders migrate away from exchanges, the price discovery process weakens, trading spreads
widen, and overall investor trading costs increase… Nasdaq believes that proposed changes may
improve price discovery in the select securities.” Kwan, Masulis, and McInish (2015) find that the U.S.
minimum tick constrains some stock spreads, causing large limit order queues, and that dark pools allow
traders to bypass existing limit order queues with minimal price improvement. Moreover, Foley and
Putniņš (2014) find that when Canada and Australia implemented minimum price improvement, the
level of dark trading decreased. We expect no change in dark pools trading volume after the maker-taker
14
fee reduction since their ability to circumvent the time priority of displayed limit orders is not affected
and nor are they required to provide price improvement.
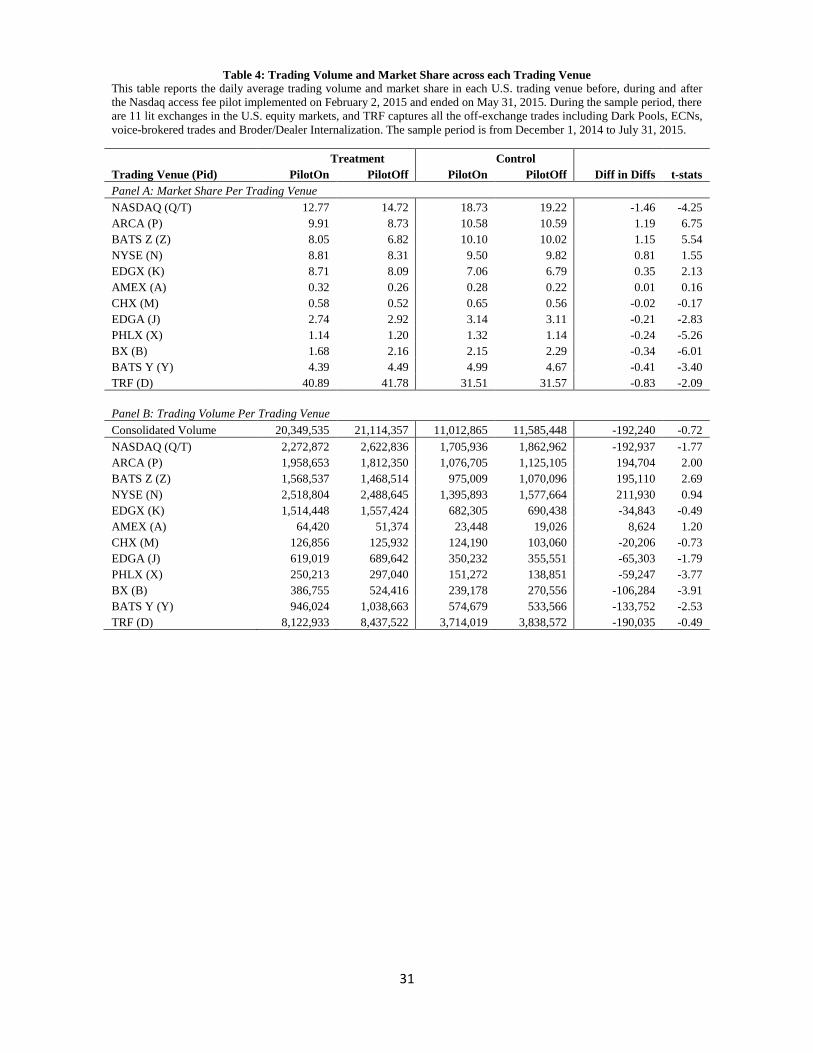
Result: Table 4 shows that after the Nasdaq fee reduction, the Nasdaq market share declined on average
(see also Hatheway, 2015a, 2015b), while the consolidated trading volume remained stable and the share
losses was captured by the other three highest rebate-paying stock exchanges (ARCA, BATS Z, NYSE).
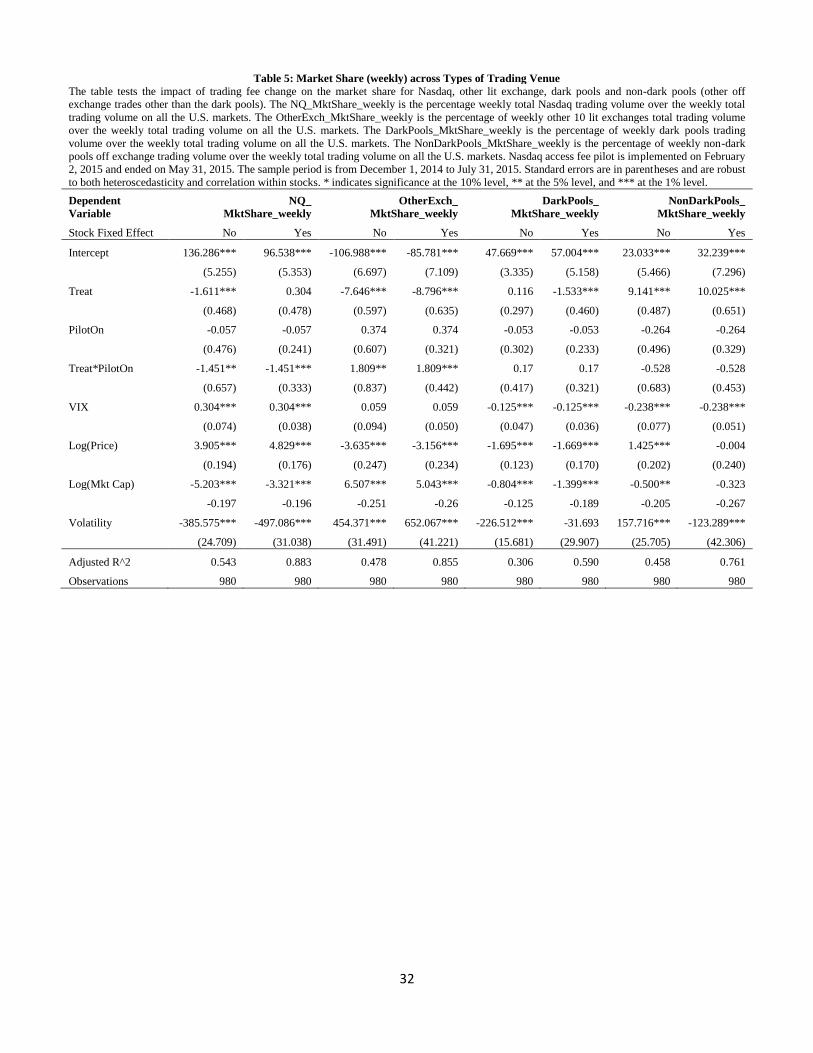
Table 5 shows that when Nasdaq reduced the maker rebate and taker fee, there was no significant market
share drop from the off-exchange trading venues of dark pools and other non-dark pools. Instead, we
observe a redistribution of market share among lit exchanges (i.e., the lost market share shifted to those
lit exchanges with the highest liquidity provision rebate).
<Insert Table 4 here>
<Insert Table 5 here>
A2. How does the lit exchange trading volume and market share change in response to the maker-taker
fee reduction?
Prediction: In traditional maker-taker markets, the liquidity rebate, which is financed by a taker fee, is
initially designed to increase liquidity. If the liquidity rebate is reduced, the trading volume and market
share tends to decline. More specifically, when the rebate is reduced, the incentive to post limit orders
on Nasdaq is reduced, the queue of limit orders declines, and the limit orders tend to flow to other
exchanges with higher rebate payments. However, this effect is offset by the reduced taker fee since it is
cheaper to remove liquidity as well. Overall, the Nasdaq market share declines since trade only occurs
when there is liquidity supply, and the reduced volume goes to other exchanges with higher incentives.
Result: Cardella, Hao, and Kalcheva (2015) find that reductions in relative taker fees in U.S. equity
markets are associated with increased market share. Malinova and Park (2015) argue that the change in
the maker-taker fees in Cardella, Hao, and Kalcheva (2015) are accompanied by changes in the total fee.
Indeed, Malinova and Park (2015) find that holding the total exchange fee constant, TSX’s trading
volume in 2005 was unaffected by the component change.

15
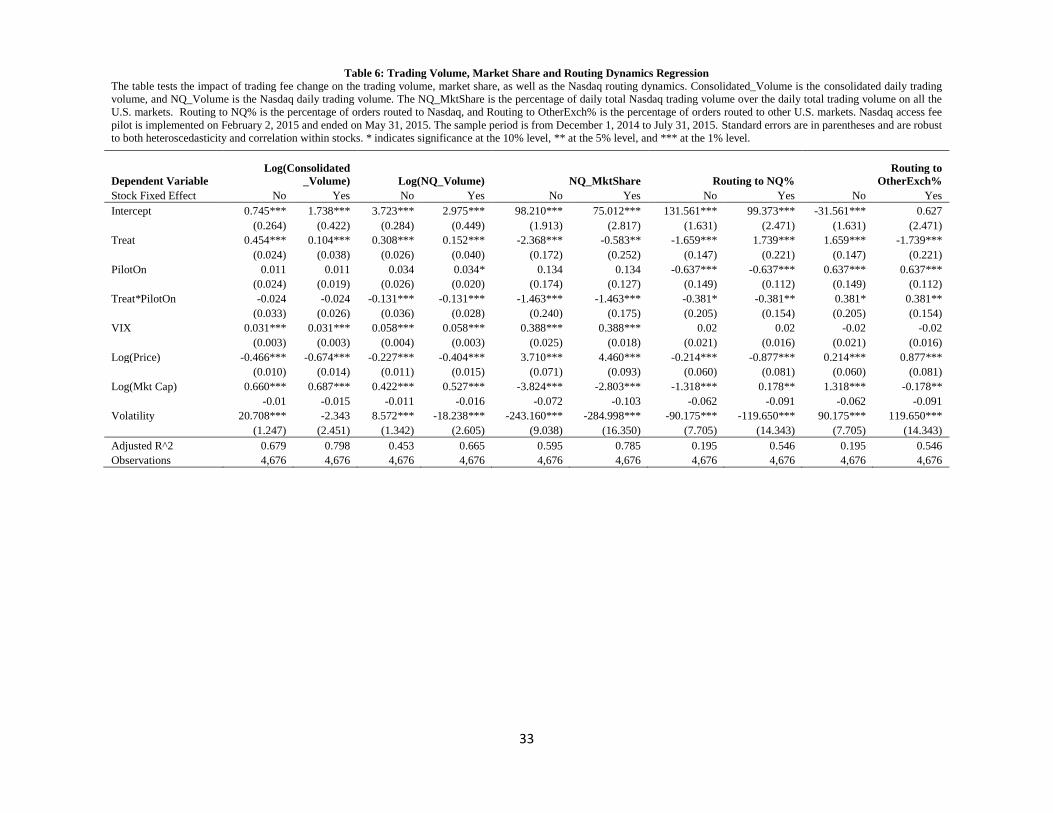
However, the DID regression model in Table 6 shows that the Nasdaq market share decreases in
response to the maker-taker fee reduction. To verify whether this reduced market share is caused by a
reduction in liquidity supply, we compare the Nasdaq depth at the NBBO change with the Nasdaq
trading volume change. We find that the Nasdaq depth at the NBBO (coefficient of -0.337*** in Table
7) dropped about three times more than the Nasdaq trading volume drop (coefficient of -0.131*** in
Table 6). We also did further statistical test and find statistically significant relationship between Nasdaq
market share and depth at the NBBO. This finding indicates that the reduced Nasdaq market share is
also associated with the drop in the depth at the NBBO.
<Insert Table 6 here>
A3. How do the Nasdaq routing dynamics change?
Prediction: Reg NMS Rule 61111, also known as the “Order Protection Rule” or “Trade-through” rule,
restricts trading, either as agent or principal, on one venue at prices inferior to the displayed quotations
at another trading venue during regular trading hours (9:30 am to 4:00 pm ET). Thus, if one exchange
does not have the NBBO when it receives incoming orders and if it is eligible for immediate electronic
execution, it is obligated to route the incoming order to another trading venue with the NBBO. After the
Nasdaq rebate is reduced, the incentive to submit nonmarketable orders on Nasdaq decreases. Thus, the
Nasdaq percentage of time at the NBBO is likely to decline and outbound routing is likely to increase.
Result: Table 6 shows that the Nasdaq incoming orders routed to Nasdaq declined and that the
proportion routed away to other exchanges increased. Moreover, the percentage of volume routed to off-
exchange trading venues remained stable.
B. Market quality and the information content of trades
11 “Rule 611 does not affirmatively require the routing of orders to trading venues displaying the best prices. Rather, it only
restricts trades at prices worse than a protected quotation. Any trading venue is free to execute trades at prices equal to or
better than a protected quotation, regardless of whether such a trading center is currently quoting at that price or is a dark
venue that never displays quotations.” (SEC, 2015b).
16
B1. How does the Nasdaq percentage of time at the NBBO, market depth, and fill rate change?
Prediction: When Nasdaq reduces the rebate, the incentive to post liquidity is reduced, resulting in less
quoting on Nasdaq at the NBBO. Thus, the Nasdaq percentage of time at the NBBO and corresponding
depth and depth share will drop. After the taker fee is reduced, the fill rate and speed of fill is expected
to increase.
Result: After the maker rebate was reduced, the Nasdaq queue in the limit order book lowered. Table 7
shows that the Nasdaq percentage time and depth at the NBBO declined. Compared with the slightly
decrease in market share (coefficient of -1.451*** in Table 5), there is a larger drop in the depth share
at the NBBO (coefficient of -4.010*** in Table 7). This finding indicates Nasdaq’s quote became
relatively more attractive and their routing table position may have risen. Further, when the taker fee
was reduced, the fill rate and speed of fill increased, since afterwards it was cheaper to remove liquidity
by using market orders.
<Insert Table 7 here>
B2. How do the quoted spread, effective spread, realized spread, and price impact change?
Prediction: Malinova and Park (2015) find that prices adjust as the maker rebate changes, using the TSX
pricing change in 2005. In particular, holding the total fee constant, the raw bid-ask spread declines as
the maker rebate increases. In addition, they show that the effective spread declines as the taker fee
increases, consistent with the finding of Colliard and Foucault (2012). As the quoted spread declines,
market orders become relatively cheap for these traders and more thus prefer market orders to limit
orders. Brolley and Malinova (2012) show that this behavior is an equilibrium outcome, with the
increased use of market orders causes a decline in adverse selection.
The quoted spread is the difference between the ask price and bid price. Specifically,
𝑞𝑠𝑝𝑟𝑒𝑎𝑑𝑖,𝑡 = 𝑎𝑖,𝑡 − 𝑏𝑖,𝑡, (2)

17
The effective spread is twice the signed difference between the transaction price and the midpoint of the
bid and offer quotes at the time of the transaction. Specifically,
𝑒𝑠𝑝𝑟𝑒𝑎𝑑𝑖,𝑡 = 2 ∗ 𝑞𝑖,𝑡 ∗ (𝑝𝑖,𝑡 − 𝑚𝑖,𝑡), (3)
The realized spread is a measure of profit to market makers. Previous studies have set τ to five minutes
after the trade. The choice of this time horizon should be sufficiently long to incorporate the permanent
impact of the trade and thus to ensure that quotes are subsequently stabilized, temporary effects are
dissipated, and there is a sufficiently long period for liquidity providers to close their positions (Conrad,
Wahal, and Xiang, 2015). In today’s ultra-high frequency trading environment that has upgraded trading
systems with an accuracy of mere nanoseconds, five minutes is excessively long. Similar to Conrad,
Wahal, and Xiang (2015), we estimate realized spreads from one second to five seconds after each trade.
The realized spread is then calculated as twice the signed difference between the transaction price and
the midpoint of the bid and offer quotes one second and five seconds after the transaction. Specifically,
𝑟𝑠𝑝𝑟𝑒𝑎𝑑𝑖,𝑥𝑡 = 2 ∗ 𝑞𝑖,𝑡 ∗ (𝑝𝑖,𝑡 − 𝑚𝑖,𝑡+𝜏), (4)
Price impact is defined as the signed change between the midpoint of the quote one second and five
seconds after the trade and the midpoint of the prevailing quote at the time of the trade. It captures the
information that is revealed by the trade. A decline in the price impact indicates a decline in adverse
selection costs. Specifically,
𝑝𝑟𝑖𝑐𝑒 𝑖𝑚𝑝𝑎𝑐𝑡𝑖,𝑡 = 2 ∗ 𝑞𝑖,𝑡 ∗ (𝑚𝑖,𝑡+𝜏 − 𝑚𝑖,𝑡), (5)
To test whether the fee change truly matters, we also compute the cum fee quoted spread, cum fee
effective spread, and cum rebate realized spread as follows:
𝑐𝑢𝑚 𝑓𝑒𝑒 𝑞𝑠𝑝𝑟𝑒𝑎𝑑𝑖,𝑡 = (𝑎𝑖,𝑡 − 𝑏𝑖,𝑡) + 2 ∗ 𝑓𝑖,𝑡, (6)
𝑐𝑢𝑚 𝑓𝑒𝑒 𝑒𝑠𝑝𝑟𝑒𝑎𝑑𝑖,𝑡 = 2 ∗ 𝑞𝑖,𝑡 ∗ (𝑝𝑖,𝑡 − 𝑚𝑖,𝑡) + 2 ∗ 𝑓𝑖,𝑡, (7)
𝑐𝑢𝑚 𝑟𝑒𝑏𝑎𝑡𝑒 𝑟𝑠𝑝𝑟𝑒𝑎𝑑𝑖,𝑥𝑡 = 2 ∗ 𝑞𝑖,𝑡 ∗ (𝑚𝑖,𝑡+𝜏 − 𝑚𝑖,𝑡) + 2 ∗ 𝑟𝑖,𝑡, (8)
where 𝑓𝑖,𝑡 is the taker fee for security i at time t, 𝑟𝑖,𝑡 is the maker rebate for security i at time t, 𝑎𝑖,𝑡 is the
ask price of the quote, where 𝑏𝑖,𝑡 is the bid price of the quote, 𝑝𝑖,𝑡 is the transaction price for security i
at time t, 𝑚𝑖,𝑡 is the midpoint of the prevailing quote at the time of the trade, 𝑚𝑖,𝑡+𝜏 is the midpoint of
18
the one second and five seconds after the trade, and 𝑞𝑖,𝑡 is an indicator variable that equals one if the
trade is buyer-initiated and minus one if the trade is seller-initiated. Our data report the prevailing quotes
as well as contain a marker that signs each trade as buyer- or seller-initiated.
Result: Tables 8a and 8b shows the cum fee quoted spread and cum fee effective spread decrease
(coefficients of -0.215*** and -0.438***, respectively), which is inconsistent with the findings of
Malinova and Park (2015). The cum fee quoted and effective spreads are adjusted by the taker fee, while
the cum rebate realized spread is adjusted by the maker rebate. However, we find that the price impact
declined (-0.232*** for the one second price impact and -0.304*** for the five second price impact)
after the maker-taker fee reduction. This decrease may have been caused by the relative position of a
market in routing tables. In other words, if a market is ranked low in the routing table, only the most
informed orders are likely to reach it. With a lower access fee, Nasdaq would have risen in the tables,
resulting in a reduction in the price impact. Further, owing to the less competition in the limit order
flow, the realized spread increases, while after taking into account the rebate reduction, the cum rebate
spread decreases.
Discussion
The inconsistency between our spread and price impact findings and those of Malinova and Park
(2015)12 may be driven by the different trading environments analyzed. In 2005, TSX was the only stock
exchange in Canada; however, our study of U.S. markets comprised 11 competing lit exchanges and
many more off-exchange trading venues. In addition, liquidity suppliers have two main sources of
revenue: the bid ask spread and rebate. Since traders had limited choices about where to trade in Canada
in 2005, the impact rebate increase accompanied with increased fee had to be adjusted within TSX.
Colliard and Foucault (2012) predict that the effective spread declines as the taker fee increases.
Because the cost of market orders increases if the taker fee increase, traders switch to limit orders and
the spread decreases.
By contrast, in our competitive trading environment, when Nasdaq decreases the maker rebate, traders
may post liquidity on other exchanges with a higher rebate. Hence, although the effective spread
increases, we find a decreased cum fee effective spread because of the lower amount of information (i.e.,
12 The liquidity supplier does not necessarily need to adjust the realized spread since the trader has only the one trading venue
to trade; hence, the realized spread does not change and the cum rebate realized spread increases.
19
lower toxicity) in the order flow as a result of the change in order routing. To compensate the liquidity
supplier for the rebate loss, the realized spread must be widened for a given order flow type. After the
rebate reduction is adjusted, the cum rebate realized spread decreases, indicating that the order flow is
likely to be less informed. The high maker rebate financed with the high taker fee may attract informed
traders given the other cheaper venues for removing liquidity, because the high rebate attracts a thick
limit order book, which is particularly beneficial for informed traders. When the rebate is reduced, the
limit order book gets thinner, which is less attractive to informed traders, although it is less costly to
remove liquidity via a market order. As a net effect, we find that the information content of the order
flow declines.
<Insert Tables 8a and 8b here>
B3. How does market efficiency change?
Prediction: To test the informational efficiency of prices, we use variance ratio tests of the random walk
hypothesis (Lo and MacKinlay, 1988) and autocorrelation, which are identified as the two information-
associated measures in Chordia, Roll, and Subrahmanyam (2008), in multiple time intervals:
𝑉𝑎𝑟𝑖𝑎𝑛𝑐𝑒 𝑟𝑎𝑡𝑖𝑜 = 𝑣𝑎𝑟(𝑟𝑖,𝑡) ∗ 𝑥/𝑣𝑎𝑟(𝑟𝑖,𝑥∗𝑡), (9)
𝐴𝑢𝑡𝑜𝑐𝑜𝑟𝑟𝑒𝑙𝑎𝑡𝑖𝑜𝑛 = 𝐶𝑜𝑟𝑟(𝑟𝑖,𝑡, 𝑟𝑖,𝑡−1), (10)
where 𝑣𝑎𝑟(𝑟𝑖,𝑡) refers to the variance of the return during the 𝑡𝑡ℎ time interval for i, 𝑣𝑎𝑟(𝑟𝑖,𝑥∗𝑡) refers to
the variance of the return during the x*t time interval for i and 𝐶𝑜𝑟𝑟(𝑟𝑖,𝑡, 𝑟𝑖,𝑡−1) refers to the
autocorrelation of the midpoint return during the 𝑡𝑡ℎ time period for i. Specifically, when a stock’s price
follows a random walk, the variance of its returns is a linear function of the measurement frequency, i.e.
𝑣𝑎𝑟(𝑟𝑖,𝑥∗𝑡) is k times larger than 𝑣𝑎𝑟(𝑟𝑖,𝑡).
When the maker-taker fee is reduced, we find that liquidity worsens (see the results presented above)
and there is less information in the order flow. Thus, we expect the informational efficiency of prices to
decrease.
20
Result: Table 9 shows that in response to the maker-taker fee reduction, the variance ratios in Nasdaq
generally increased, while first-order return autocorrelations declined. This pattern suggests that the
variance ratios rise because of increased mispricing, with less private information being reflected in
prices following the maker-taker fee reduction. Compared with Nasdaq, the market efficiency of the
three other highest rebate-paying exchanges (Arca, BATS Z, NYSE) become less bad than Nasdaq given
overall market efficiency declines.
<Insert Table 9 here>
C. HFT vs. non-HFT trading behavior
C1: HFT vs. non-HFT adding/taking liquidity_volume
Prediction: SEC (2010) summarizes that one HFT strategy is passive market making to earn the
liquidity rebate, which primarily involves the submission of nonmarketable resting orders (limit bids and
offers) that provide liquidity to the marketplace at specified prices. This is not a discerning observation
since all liquidity providers aim to gain rebates, especially when realized spreads are negative; however,
HFT arguably has a speed advantage.
In Rosu’s (2015) model, the trader who sees a signal containing information before a slower trader will
take liquidity as he is informed. Nevertheless, as holding inventory is expensive, a risk-averse trader
reverses part of his order to make money supplying liquidity to slower traders who receive a delayed
signal. The fast trader could even post some of these reversed trades as limit orders. Hence, HFT traders
are likely to have information and thus take liquidity but can also make liquidity. As both the rebate and
the tax on liquidity makers fall, HFT traders are likely to shift from making to taking liquidity.
Result: Table 10 shows that in response to the maker-taker fee reduction, HFT traders switched trading
behavior on Nasdaq from posting liquidity (coefficient of -10.043***) to taking liquidity (coefficient of
9.936***), as predicted, while the overall Nasdaq HFT volume remained stable (coefficient of -0.054
with no statistical significance).
21
<Insert Table 10 here>
C2: HFT vs. non-HFT adding and taking liquidity_spreads and price impact
Prediction: Carrion (2013) finds that spreads are wider (tighter) when HFT traders provide (take)
liquidity, which suggests HFTs provide liquidity when it is scarce and consume liquidity when it is
plentiful. Because of their effective real-time forecasting of the state of the market, HFT traders face
lower adverse selection costs than non-HFT traders when supplying liquidity in larger trades, suggesting
they have an informational advantage when demanding liquidity and avoiding the supply of liquidity to
informed traders. SEC (2010) thus questions whether “rebates generally benefit long-term investors by
promoting narrower spreads and more immediately accessible liquidity?”
Result: Focusing on the cum fee/rebate column in Table 11, we analyze the net effect of the participation
of the two trader types after taking into account the tax/subsidy alteration, the effective spread for HFT
is lower compared with non-HFT when placing market orders, with the spread sizably reduced for both
types because of the removal of the tax on market orders. This is because HFT market orders are less
informed than non-HFT market orders as the market impact over both the one-second and the-five
second intervals falls by a larger amount than that for non-HFT, such that the fall in the realized spread
is less for HFT market orders.
HFT is therefore more inclined to add to liquidity relative to non-HFT when the effective spread is
narrower because of its relatively less informed order flow, as shown by both the one-second and the
five-second delay price impacts being relatively low. As a consequence, the realized spread is higher
when HFT traders provide liquidity relative to non-HFT traders. These findings imply that HFT is more
likely to take liquidity when it is relatively plentiful (spreads are narrow and consistent with Carrion
(2013)) and provide liquidity when it is relatively cheap (the effective spread is relatively narrow), as it
uses its informational advantage to supply liquidity to less informed counterparts.
Discussion
Subsidized limit orders and taxed market orders benefit relatively informed short-term traders, as can be
seen when Nasdaq’s unilateral withdrawal of the subsidy and tax during the pilot led to the movement of

22
such traders to exchange with higher subsidy/tax regimes. Insofar as long-term investors are also
informed, high subsidy/tax regimes might also benefit them; however, but if they are not informed then
they may be better off without the subsidy/tax regime as their trades are infrequent and thus they gain
little from a subsidized spread.
<Insert Table 11 here>
D. Adding liquidity by submitting different types of resting orders
Prediction: In lowering the taker fee to remove liquidity to 5 CPS traded, Nasdaq reduced the rebate by
varying levels for different order types (displayed, non-displayed midpoint, non-displayed non-
midpoint), We predict that, trading volume and percentage of HFT adding liquidity will differ across
order types. For non-displayed non-midpoint liquidity (which accounts for about 3% of total volume),
unlike the other two types of liquidity, the net fee reduced significantly. Hence, we predict that trading
volume and the percentage of HFT adding liquidity increases.
Result: Table 12 shows that the overall percentage of displayed and non-displayed midpoint volume
reduced (coefficients of -0.316 and -0.194, respectively) but that the fall is not statistically significant;
moreover, the percentage of non-displayed non-midpoint volume increase (coefficient of 0.615***). In
terms of HFT in different liquidity types, the percentage of HFT adding displayed liquidity and HFT
non-displayed midpoint volume decreased (coefficients of -9.357*** and -0.756***, respectively)
significantly. The percentage of HFT non-displayed non-midpoint volume increased (coefficient of
0.175***). In sum, the major HFT liquidity enhancing comes from displayed liquidity, as predicted.
<Insert Table 12 here>

23
V. Robustness Test
To explore the robustness of our strikingly different results to those presented by previous studies, we
change the matching variable used to identify the control sample. An obvious alternative was to
construct the control sample by using only the price and ADV selection criteria in line with the sample
in the Nasdaq fee pilot report. The results are qualitatively consistent.
A second robustness test involved normalizing our dependent variables. We compute the quote spread,
effective spread, realized spread, and price impact (both one second and five second) in bps rather than
cents (see Table 13). Again, the results are generally consistent. The results of these additional
robustness tests are presented in the online appendix.
<Insert Table 13 here>
VI. Conclusion
This study analyzes how a reduction in the maker-taker fee affects market competition, liquidity, and
HFT. In particular, we assess whether high exchange access fees cause trading to shift away from public
markets, using the Nasdaq access fee pilot as a natural experiment. We find no evidence for such a shift,
perhaps because only one exchange reduced its access fee unilaterally in a competitive trading
environment. However, even if all lit exchanges had participated, the outcome may have remained the
same, as the net fee does not substantially alter and nothing fundamental changes in the competition
between market and off-market venues. Dark pools rely on mid-point prices and are protected by the
inability of lit exchanges to reduce the minimum tick size because of the SEC’s regulations. Instead, we
observe a redistribution effect among existing lit exchanges. Even with a uniform fee reduction across
the entire lit market, a movement toward the lit market is unlikely as dark pools can still undercut the 1
cent tick rule and there is still no requirement to provide the minimum price improvement which, in any
case, could be illusory.
The current literature holds that only changes in the net exchange fee matter for market quality and
transaction cost efficiency. Our findings show that holding the net fee relatively constant, the change in
24
component fees and rebates does matter, but not for competition between market and non-market
venues. When Nasdaq’s fee pilot reduced both the fee and the rebate, its market share declined and the
reduced amount was shared by the other high rebate-paying exchanges. We find that the equivalently
reduced fee and rebate lowers quote quality and routed volume to Nasdaq. However, it improves the fill
rate and speed of fill because of the reduced taker fee. When Nasdaq’s relative routing position
improves, adverse selection costs decline and liquidity supplier profit increases (but the cum rebate
realized spread decreases). In addition, the decline in informed order flows on Nasdaq owing to the fall
in liquidity leads to a decline in market efficiency. The fall in Nasdaq’s market share indicates the strong
benefit of its existing strategy of providing the highest possible subsidy to liquidity takers funded by its
tax on liquidity makers and this also encourages better price discovery and higher market efficiency.
Further, we have shown that as exchange access fees and rebates decrease, HFT traders tend to switch
from adding to removing liquidity. While standard quality measures such as the effective spread,
realized spread, and market impact costs all appear to improve on a cum rebate basis, these apparent
improvements reflect the lower information content in Nasdaq’s order flow during the experiment as
informed order flows shift to exchanges that maintain high rebates. Even when HFT increases liquidity
taking as it retreats from making liquidity, it does so with a less informative order flow.
25
References
Angel, James, Lawrence Harris, and Chester S. Spatt, 2011, Equity trading in the 21st century, Quarterly
Journal of Finance 1, 1–53.
Angel, James, Lawrence Harris and Chester S. Spatt, 2015, Equity trading in the 21st century: An
Update, Quarterly Journal of Finance 5, 1-39.
Barclay, Michael J., Eugene Kandel, and Leslie M. Marx, 1998, The effects of transaction costs on stock
prices and trading volume, Journal of Financial Intermediation 7, 130–150.
Battalio, Robert H., Shane A. Corwin and Robert Jennings, 2016, Can brokers have it all? On the
relation between make-take fees and limit order execution quality, Journal of Finance, forthcoming.
Brogaard, Jonathan, Terrence Hendershott, and Ryan Riordan, 2014, High-frequency trading and price
discovery, Review of Financial Studies 27, 2267–2306.
Brolley, Michael, and Katya Malinova, 2012, Informed trading and maker-taker fees in a low latency
limit order market, Working Paper, University of Toronto.
Cardella, Laura, Jia Hao, and Ivalina Kalcheva, 2015, Make and Take Fees in the U.S. Equity Market,
Working Paper, Texas Tech University.
Carrion, Allen, 2013, Very fast money: High-frequency trading on the NASDAQ, Journal of Financial
Markets 16, 680–771.
Chordia, Tarun, Richard Roll, and Avanidhar Subrahmanyam, 2008, Liquidity and market efficiency,
Journal of Financial Economics 87, 249–268.
Colliard, Jean-Edouard, and Thierry Foucault, 2012, Trading fees and efficiency in limit order markets,
Review of Financial Studies 25, 3389–3421.
26
Conrad, Jennifer, Sunil Wahal, and Jin Xiang, 2015, High-frequency quoting, trading, and the efficiency
of prices, Journal of Financial Economics 116, 271–291.
Davies, Ryan J., and Sang Soo Kim, 2009, Using matched samples to test for differences in trade
execution costs, Journal of Financial Markets 12, 173–202.
Foley, Sean, and Talis Putniņš, 2014, Regulatory efforts to reduce dark trading in Canada and Australia:
How have they worked? Report prepared for the CFA Institute.
Fama, Eugene, 1970, Efficient capital markets: A review of theory and empirical work, Journal of
Finance 25, 383–417.
Foucault, Thierry, Ohad Kadan, and Eugene Kandel, 2013, Liquidity cycles and make/take fees in
electronic markets, Journal of Finance 68, 299–341.
Hatheway, Frank, Amy Kwan and Hui Zheng, 2016, An empirical analysis of market segmentation on
U.S. equities markets, Journal of Financial and Quantitative Analysis, forthcoming.
Hatheway, Frank, 2015a, Nasdaq Access Fee Experiment: Report I, Nasdaq Report.
Hatheway, Frank, 2015b, Nasdaq Access Fee Experiment: Report II, Nasdaq Report.
Kaniel, Ron and Hong Liu, 2006, So what orders do informed traders use? Journal of Business 79,
1867–1913.
Kwan, Amy, Ronald Masulis, and Thomas H. McInish, 2015, Trading rules, competition for order flow
and market fragmentation, Journal of Financial Economics 115, 330–348.
Harris, Larry 2013, Maker-taker pricing effects on market quotations, Working Paper, University of
Southern California.

27
Lo, Andrew, W. and Craig MacKinlay, 1988, Stock market prices do not follow random walks:
Evidence from a simple specification test, Review of Financial Studies 1, 41–66.
Lutat, Marco, 2010, The effect of maker-taker pricing on market liquidity in electronic trading
systems—Empirical evidence from European equity trading, Working Paper, University of Frankfurt.
Maglaras, Costis, Ciamac C. Moallemi, and Hua Zheng, 2012, Optimal order routing in a fragmented
market, Working Paper, Columbia University.
Malinova, Katya, and Andreas Park, 2015, Subsidizing liquidity: The impact of make/take fees on
market quality, Journal of Finance 70, 509–536.
O’Hara, Maureen, and Mao Ye, 2011, Is market fragmentation harming market quality?, Journal of
Financial Economics 100, 459-474.
Rosu, Ioanid, 2012, Liquidity and information in order driven markets, Working Paper, HEC Paris.
Rosu, Ioanid, 2015, Fast and slow informed trading, Working Paper, HEC Paris.
SEC, 2010, Concept release on market structure, Release No. 34-61358, File No. S7-02-10, Discussion
paper.
SEC, 2014, Nasdaq Form 19b-4 filing on proposed access fee pilot, available at
http://nasdaq.cchwallstreet.com/NASDAQ/pdf/nasdaq-filings/2014/SR-NASDAQ-2014-128.pdf.
SEC, 2015a, Memo on maker-taker fees on equities exchange, available at
https://www.sec.gov/spotlight/emsac/memo-maker-taker-fees-on-equities-exchanges.pdf.
SEC, 2015b, Memo on Rule 611 of Regulation NMS, available at
https://www.sec.gov/spotlight/emsac/memo-rule-611-regulation-nms.pdf.

28
Table 1: Nasdaq Maker-Taker Fee Structure
This table reports the Nasdaq pricing measured in cents per 100 shares (CPS) traded during (PilotOn) and pre/post (PilotOff) the
Nasdaq access fee pilot implemented on February 2, 2015 and ended on May 31, 2015. The sample period is from December 1,
2014 to July 31, 2015. Net fee is defined as the sum of the taker fee and the maker rebate, which is the exchange revenue per
100 shares traded. The taker fee is the highest rate Nasdaq can charge and maker rebate is the most indicative rate Nasdaq
provides in the Nasdaq pricing table.
Fee/ Rebate PilotOn (CPS) PilotOff (CPS) Difference
Taker Fee to Remove Liquidity: 5 30 -25
Maker Rebate to Add Liquidity:
Displayed Liquidity 4 29 -25
Non-Displayed Midpoint 2 25 -23
Other Non-Displayed Liquidity 0 10 -10
Net Fee:
Displayed Liquidity 1 1 0
Non-Displayed Midpoint 3 5 -2
Other Non-Displayed Liquidity 5 20 -15

29
Table 2: Indicative U.S. Exchange Fee Structure
This table reports the U.S. stock exchanges pricing, measured in cents per 100 shares (CPS) traded. Fee is the exchange
charge (pay) in the maker-taker (taker-maker) market. Rebate is the exchange pay (charge) in the maker-taker (taker-
maker) market. Net fee is defined as the sum of the taker fee and the maker rebate, which is the exchange revenue per
100 shares traded. For simplicity, the fee is the highest rate the exchange can charge and rebate is the highest rate below
the fee given its pre-determined fee structure in their pricing table.
Exchange Fee Model Fee (CPS) Rebate (CPS) Net Fee (CPS)
NASDAQ Maker-Taker 30 -29 1
ARCA Maker-Taker 30 -29 1
BATS Z Maker-Taker 30 -29 1
NYSE Maker-Taker 27.5 -26 1.5
AMEX Maker-Taker 30 -25 5
PHLX Maker-Taker 29 -23 6
EDGX Maker-Taker 29 -20 9
CHX Maker-Taker 30 -20 10
EDGA Taker-Maker -2 5 3
BATS Y Taker-Maker -15 18 3
BX Taker-Maker -17 19 2
30
Table 3: Summary Statistics
The table reports summary statistics for the selected variables for Nasdaq fee pilot stocks and its matching stocks. Nasdaq access fee pilot is implemented on February 2, 2015 and ended on May
31, 2015. The sample period is from December 1, 2014 to July 31, 2015. PilotOn is the period when Nasdaq implemented the fee pilot; and PilotOff refers to two months prior and post the fee
pilot.
Treatment Control
PilotOn PilotOff PilotOn PilotOff Diff in Diffs
Number of Daily Obs. 1148 1190 1148 1190
Mean Median Std Mean Median Std Mean Median Std Mean Median Std Diff t-stats
Panel A: Trading Stats and Market Share
Closing Price 24.21 22.78 17.28 23.78 18.79 17.93 31.08 33.99 18.66 30.11 33.01 18.70 -0.54 -0.44
Market Cap (millions) 47.63 20.70 73.32 46.78 18.78 74.40 43.56 18.44 63.50 42.84 18.46 62.93 0.13 0.03
Nasdaq Volume (millions) 2.27 1.57 2.29 2.62 1.97 2.11 1.71 1.33 1.36 1.86 1.57 1.56 -0.19 -1.77
Nasdaq MarketShare (%) 12.77 12.01 4.72 14.72 13.95 5.77 18.73 18.59 6.07 19.22 19.04 6.69 -1.46 -4.25
Panel B: Quote Quality and Fill Ratio
Nasdaq Time at NBBO (%) 88.25 95.71 13.19 94.00 98.82 9.30 93.02 98.00 10.64 93.80 98.12 9.80 -4.98 -6.86
Nasdaq Depth at NBBO (millions) 1.69 0.38 3.51 2.33 0.72 5.26 0.41 0.26 0.47 0.41 0.26 0.46 -0.64 -3.67
Nasdaq Depth Share 15.68 15.57 5.88 19.31 18.50 7.29 21.64 19.27 6.58 21.25 19.66 7.58 -4.02 -10.15
Fill Rate (%) 3.91 3.59 1.46 3.65 3.50 1.48 2.99 2.91 1.27 2.96 2.83 1.14 0.24 3.02
Fill Time (seconds) 189 110 197 236 118 265 134 93 119 123 83 127 -58 -5.59
Panel C: Transaction Cost_cents
Quoted Spread (cents) 1.35 1.01 0.83 1.59 1.02 1.28 1.63 1.01 1.86 2.15 1.03 3.23 0.28 2.33
Effective Spread (cents) 1.14 0.97 0.58 1.18 0.96 0.70 1.30 0.97 1.13 1.40 0.96 1.34 0.06 1.02
Realised Spread 1s (cents) -0.12 -0.07 0.48 -0.38 -0.42 0.35 -0.39 -0.43 0.51 -0.36 -0.44 0.68 0.29 9.97
Realised Spread 5s (cents) -0.30 -0.20 0.59 -0.62 -0.54 0.50 -0.56 -0.51 0.66 -0.51 -0.52 0.68 0.37 10.18
Price Impact 1s (cents) 1.26 1.06 0.74 1.56 1.42 0.70 1.69 1.45 1.09 1.77 1.46 1.13 -0.22 -3.95
Price Impact 5s (cents) 1.44 1.16 0.89 1.81 1.51 1.08 1.86 1.52 1.45 1.92 1.51 1.41 -0.31 -3.95
Panel D: HFT vs Non-HFT Trading Behaviour
HFT Volume (millions) 1.69 1.07 1.71 1.96 1.49 1.59 1.26 1.08 0.98 1.40 1.23 1.11 -0.13 -1.59
Non-HFT Volume (millions) 2.86 2.04 2.96 3.29 2.44 2.74 2.15 1.70 1.81 2.33 1.89 2.11 -0.25 -1.78
HFT Adding Liquidity (%) 22.91 23.20 7.67 33.59 33.18 10.15 33.15 32.63 13.12 33.80 33.08 12.18 -10.04 -13.60
HFT Taking Liquidity (%) 50.68 51.50 9.88 41.05 41.61 8.80 41.18 39.91 9.83 41.48 40.09 10.09 9.94 17.20
Non-HFT Adding Liquidity (%) 77.09 76.80 7.67 66.41 66.82 10.15 66.85 67.37 13.12 66.20 66.92 12.18 10.04 13.60
Non-HFT Taking Liquidity (%) 49.32 48.50 9.88 58.95 58.39 8.80 58.82 60.09 9.83 58.52 59.91 10.09 -9.94 -17.20
Panel E: Liquidity Adding Types and HFT
Displayed Liquidity (%) 88.99 90.10 5.37 89.01 90.56 5.65 91.48 92.32 4.05 91.18 92.16 4.45 -0.32 -1.17
Non-displayed Midpoint Liquidity (%) 7.78 6.23 5.66 8.12 6.51 5.98 5.77 5.31 2.88 5.92 5.33 3.29 -0.19 -0.73
Non-displayed Non-Midpoint Liquidity (%) 3.23 2.12 3.30 2.78 1.56 3.36 2.65 1.47 3.63 2.81 1.69 3.64 0.61 2.81
HFT Displayed Liquidity (%) 18.37 18.31 6.14 28.43 28.57 9.27 29.35 29.15 12.07 30.05 29.37 11.71 -9.36 -13.79
HFT Non-displayed Midpoint Liquidity (%) 3.87 2.27 4.19 4.51 3.23 4.31 3.21 2.71 2.70 3.10 2.49 2.73 -0.76 -3.51
HFT Non-displayed Non-Midpoint Liquidity (%) 0.67 0.16 1.39 0.56 0.04 1.63 0.49 0.06 1.36 0.56 0.05 1.56 0.17 1.92
31
Table 4: Trading Volume and Market Share across each Trading Venue
This table reports the daily average trading volume and market share in each U.S. trading venue before, during and after
the Nasdaq access fee pilot implemented on February 2, 2015 and ended on May 31, 2015. During the sample period, there
are 11 lit exchanges in the U.S. equity markets, and TRF captures all the off-exchange trades including Dark Pools, ECNs,
voice-brokered trades and Broder/Dealer Internalization. The sample period is from December 1, 2014 to July 31, 2015.
Treatment Control
Trading Venue (Pid) PilotOn PilotOff PilotOn PilotOff Diff in Diffs t-stats
Panel A: Market Share Per Trading Venue
NASDAQ (Q/T) 12.77 14.72 18.73 19.22 -1.46 -4.25
ARCA (P) 9.91 8.73 10.58 10.59 1.19 6.75
BATS Z (Z) 8.05 6.82 10.10 10.02 1.15 5.54
NYSE (N) 8.81 8.31 9.50 9.82 0.81 1.55
EDGX (K) 8.71 8.09 7.06 6.79 0.35 2.13
AMEX (A) 0.32 0.26 0.28 0.22 0.01 0.16
CHX (M) 0.58 0.52 0.65 0.56 -0.02 -0.17
EDGA (J) 2.74 2.92 3.14 3.11 -0.21 -2.83
PHLX (X) 1.14 1.20 1.32 1.14 -0.24 -5.26
BX (B) 1.68 2.16 2.15 2.29 -0.34 -6.01
BATS Y (Y) 4.39 4.49 4.99 4.67 -0.41 -3.40
TRF (D) 40.89 41.78 31.51 31.57 -0.83 -2.09
Panel B: Trading Volume Per Trading Venue
Consolidated Volume 20,349,535 21,114,357 11,012,865 11,585,448 -192,240 -0.72
NASDAQ (Q/T) 2,272,872 2,622,836 1,705,936 1,862,962 -192,937 -1.77
ARCA (P) 1,958,653 1,812,350 1,076,705 1,125,105 194,704 2.00
BATS Z (Z) 1,568,537 1,468,514 975,009 1,070,096 195,110 2.69
NYSE (N) 2,518,804 2,488,645 1,395,893 1,577,664 211,930 0.94
EDGX (K) 1,514,448 1,557,424 682,305 690,438 -34,843 -0.49
AMEX (A) 64,420 51,374 23,448 19,026 8,624 1.20
CHX (M) 126,856 125,932 124,190 103,060 -20,206 -0.73
EDGA (J) 619,019 689,642 350,232 355,551 -65,303 -1.79
PHLX (X) 250,213 297,040 151,272 138,851 -59,247 -3.77
BX (B) 386,755 524,416 239,178 270,556 -106,284 -3.91
BATS Y (Y) 946,024 1,038,663 574,679 533,566 -133,752 -2.53
TRF (D) 8,122,933 8,437,522 3,714,019 3,838,572 -190,035 -0.49
32
Table 5: Market Share (weekly) across Types of Trading Venue
The table tests the impact of trading fee change on the market share for Nasdaq, other lit exchange, dark pools and non-dark pools (other off
exchange trades other than the dark pools). The NQ_MktShare_weekly is the percentage weekly total Nasdaq trading volume over the weekly total
trading volume on all the U.S. markets. The OtherExch_MktShare_weekly is the percentage of weekly other 10 lit exchanges total trading volume
over the weekly total trading volume on all the U.S. markets. The DarkPools_MktShare_weekly is the percentage of weekly dark pools trading
volume over the weekly total trading volume on all the U.S. markets. The NonDarkPools_MktShare_weekly is the percentage of weekly non-dark
pools off exchange trading volume over the weekly total trading volume on all the U.S. markets. Nasdaq access fee pilot is implemented on February
2, 2015 and ended on May 31, 2015. The sample period is from December 1, 2014 to July 31, 2015. Standard errors are in parentheses and are robust
to both heteroscedasticity and correlation within stocks. * indicates significance at the 10% level, ** at the 5% level, and *** at the 1% level.
Dependent
Variable
NQ_
MktShare_weekly
OtherExch_
MktShare_weekly
DarkPools_
MktShare_weekly
NonDarkPools_
MktShare_weekly
Stock Fixed Effect No Yes No Yes No Yes No Yes
Intercept 136.286*** 96.538*** -106.988*** -85.781*** 47.669*** 57.004*** 23.033*** 32.239***
(5.255) (5.353) (6.697) (7.109) (3.335) (5.158) (5.466) (7.296)
Treat -1.611*** 0.304 -7.646*** -8.796*** 0.116 -1.533*** 9.141*** 10.025***
(0.468) (0.478) (0.597) (0.635) (0.297) (0.460) (0.487) (0.651)
PilotOn -0.057 -0.057 0.374 0.374 -0.053 -0.053 -0.264 -0.264
(0.476) (0.241) (0.607) (0.321) (0.302) (0.233) (0.496) (0.329)
Treat*PilotOn -1.451** -1.451*** 1.809** 1.809*** 0.17 0.17 -0.528 -0.528
(0.657) (0.333) (0.837) (0.442) (0.417) (0.321) (0.683) (0.453)
VIX 0.304*** 0.304*** 0.059 0.059 -0.125*** -0.125*** -0.238*** -0.238***
(0.074) (0.038) (0.094) (0.050) (0.047) (0.036) (0.077) (0.051)
Log(Price) 3.905*** 4.829*** -3.635*** -3.156*** -1.695*** -1.669*** 1.425*** -0.004
(0.194) (0.176) (0.247) (0.234) (0.123) (0.170) (0.202) (0.240)
Log(Mkt Cap) -5.203*** -3.321*** 6.507*** 5.043*** -0.804*** -1.399*** -0.500** -0.323
-0.197 -0.196 -0.251 -0.26 -0.125 -0.189 -0.205 -0.267
Volatility -385.575*** -497.086*** 454.371*** 652.067*** -226.512*** -31.693 157.716*** -123.289***
(24.709) (31.038) (31.491) (41.221) (15.681) (29.907) (25.705) (42.306)
Adjusted R^2 0.543 0.883 0.478 0.855 0.306 0.590 0.458 0.761
Observations 980 980 980 980 980 980 980 980
33
Table 6: Trading Volume, Market Share and Routing Dynamics Regression
The table tests the impact of trading fee change on the trading volume, market share, as well as the Nasdaq routing dynamics. Consolidated_Volume is the consolidated daily trading
volume, and NQ_Volume is the Nasdaq daily trading volume. The NQ_MktShare is the percentage of daily total Nasdaq trading volume over the daily total trading volume on all the
U.S. markets. Routing to NQ% is the percentage of orders routed to Nasdaq, and Routing to OtherExch% is the percentage of orders routed to other U.S. markets. Nasdaq access fee
pilot is implemented on February 2, 2015 and ended on May 31, 2015. The sample period is from December 1, 2014 to July 31, 2015. Standard errors are in parentheses and are robust
to both heteroscedasticity and correlation within stocks. * indicates significance at the 10% level, ** at the 5% level, and *** at the 1% level.
Dependent Variable
Log(Consolidated
_Volume) Log(NQ_Volume) NQ_MktShare Routing to NQ%
Routing to
OtherExch%
Stock Fixed Effect No Yes No Yes No Yes No Yes No Yes
Intercept 0.745*** 1.738*** 3.723*** 2.975*** 98.210*** 75.012*** 131.561*** 99.373*** -31.561*** 0.627
(0.264) (0.422) (0.284) (0.449) (1.913) (2.817) (1.631) (2.471) (1.631) (2.471)
Treat 0.454*** 0.104*** 0.308*** 0.152*** -2.368*** -0.583** -1.659*** 1.739*** 1.659*** -1.739***
(0.024) (0.038) (0.026) (0.040) (0.172) (0.252) (0.147) (0.221) (0.147) (0.221)
PilotOn 0.011 0.011 0.034 0.034* 0.134 0.134 -0.637*** -0.637*** 0.637*** 0.637***
(0.024) (0.019) (0.026) (0.020) (0.174) (0.127) (0.149) (0.112) (0.149) (0.112)
Treat*PilotOn -0.024 -0.024 -0.131*** -0.131*** -1.463*** -1.463*** -0.381* -0.381** 0.381* 0.381**
(0.033) (0.026) (0.036) (0.028) (0.240) (0.175) (0.205) (0.154) (0.205) (0.154)
VIX 0.031*** 0.031*** 0.058*** 0.058*** 0.388*** 0.388*** 0.02 0.02 -0.02 -0.02
(0.003) (0.003) (0.004) (0.003) (0.025) (0.018) (0.021) (0.016) (0.021) (0.016)
Log(Price) -0.466*** -0.674*** -0.227*** -0.404*** 3.710*** 4.460*** -0.214*** -0.877*** 0.214*** 0.877***
(0.010) (0.014) (0.011) (0.015) (0.071) (0.093) (0.060) (0.081) (0.060) (0.081)
Log(Mkt Cap) 0.660*** 0.687*** 0.422*** 0.527*** -3.824*** -2.803*** -1.318*** 0.178** 1.318*** -0.178**
-0.01 -0.015 -0.011 -0.016 -0.072 -0.103 -0.062 -0.091 -0.062 -0.091
Volatility 20.708*** -2.343 8.572*** -18.238*** -243.160*** -284.998*** -90.175*** -119.650*** 90.175*** 119.650***
(1.247) (2.451) (1.342) (2.605) (9.038) (16.350) (7.705) (14.343) (7.705) (14.343)
Adjusted R^2 0.679 0.798 0.453 0.665 0.595 0.785 0.195 0.546 0.195 0.546
Observations 4,676 4,676 4,676 4,676 4,676 4,676 4,676 4,676 4,676 4,676
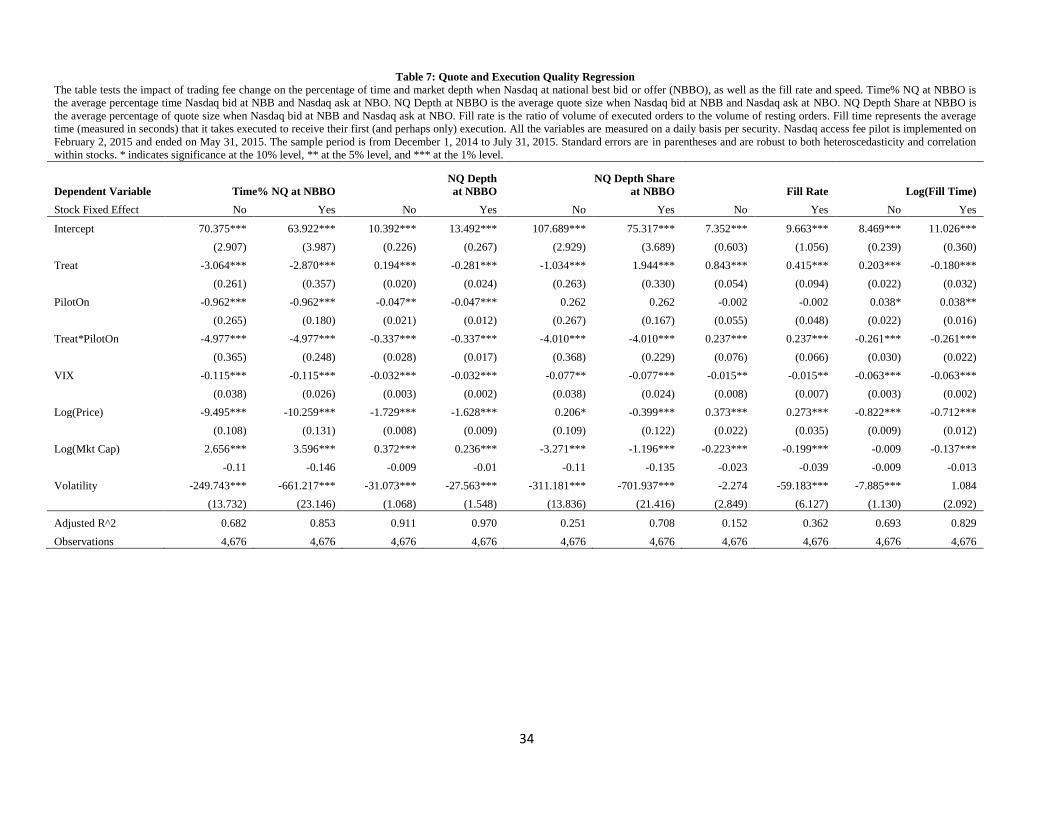
34
Table 7: Quote and Execution Quality Regression
The table tests the impact of trading fee change on the percentage of time and market depth when Nasdaq at national best bid or offer (NBBO), as well as the fill rate and speed. Time% NQ at NBBO is
the average percentage time Nasdaq bid at NBB and Nasdaq ask at NBO. NQ Depth at NBBO is the average quote size when Nasdaq bid at NBB and Nasdaq ask at NBO. NQ Depth Share at NBBO is
the average percentage of quote size when Nasdaq bid at NBB and Nasdaq ask at NBO. Fill rate is the ratio of volume of executed orders to the volume of resting orders. Fill time represents the average
time (measured in seconds) that it takes executed to receive their first (and perhaps only) execution. All the variables are measured on a daily basis per security. Nasdaq access fee pilot is implemented on
February 2, 2015 and ended on May 31, 2015. The sample period is from December 1, 2014 to July 31, 2015. Standard errors are in parentheses and are robust to both heteroscedasticity and correlation
within stocks. * indicates significance at the 10% level, ** at the 5% level, and *** at the 1% level.
Dependent Variable Time% NQ at NBBO
NQ Depth
at NBBO
NQ Depth Share
at NBBO Fill Rate Log(Fill Time)
Stock Fixed Effect No Yes No Yes No Yes No Yes No Yes
Intercept 70.375*** 63.922*** 10.392*** 13.492*** 107.689*** 75.317*** 7.352*** 9.663*** 8.469*** 11.026***
(2.907) (3.987) (0.226) (0.267) (2.929) (3.689) (0.603) (1.056) (0.239) (0.360)
Treat -3.064*** -2.870*** 0.194*** -0.281*** -1.034*** 1.944*** 0.843*** 0.415*** 0.203*** -0.180***
(0.261) (0.357) (0.020) (0.024) (0.263) (0.330) (0.054) (0.094) (0.022) (0.032)
PilotOn -0.962*** -0.962*** -0.047** -0.047*** 0.262 0.262 -0.002 -0.002 0.038* 0.038**
(0.265) (0.180) (0.021) (0.012) (0.267) (0.167) (0.055) (0.048) (0.022) (0.016)
Treat*PilotOn -4.977*** -4.977*** -0.337*** -0.337*** -4.010*** -4.010*** 0.237*** 0.237*** -0.261*** -0.261***
(0.365) (0.248) (0.028) (0.017) (0.368) (0.229) (0.076) (0.066) (0.030) (0.022)
VIX -0.115*** -0.115*** -0.032*** -0.032*** -0.077** -0.077*** -0.015** -0.015** -0.063*** -0.063***
(0.038) (0.026) (0.003) (0.002) (0.038) (0.024) (0.008) (0.007) (0.003) (0.002)
Log(Price) -9.495*** -10.259*** -1.729*** -1.628*** 0.206* -0.399*** 0.373*** 0.273*** -0.822*** -0.712***
(0.108) (0.131) (0.008) (0.009) (0.109) (0.122) (0.022) (0.035) (0.009) (0.012)
Log(Mkt Cap) 2.656*** 3.596*** 0.372*** 0.236*** -3.271*** -1.196*** -0.223*** -0.199*** -0.009 -0.137***
-0.11 -0.146 -0.009 -0.01 -0.11 -0.135 -0.023 -0.039 -0.009 -0.013
Volatility -249.743*** -661.217*** -31.073*** -27.563*** -311.181*** -701.937*** -2.274 -59.183*** -7.885*** 1.084
(13.732) (23.146) (1.068) (1.548) (13.836) (21.416) (2.849) (6.127) (1.130) (2.092)
Adjusted R^2 0.682 0.853 0.911 0.970 0.251 0.708 0.152 0.362 0.693 0.829
Observations 4,676 4,676 4,676 4,676 4,676 4,676 4,676 4,676 4,676 4,676
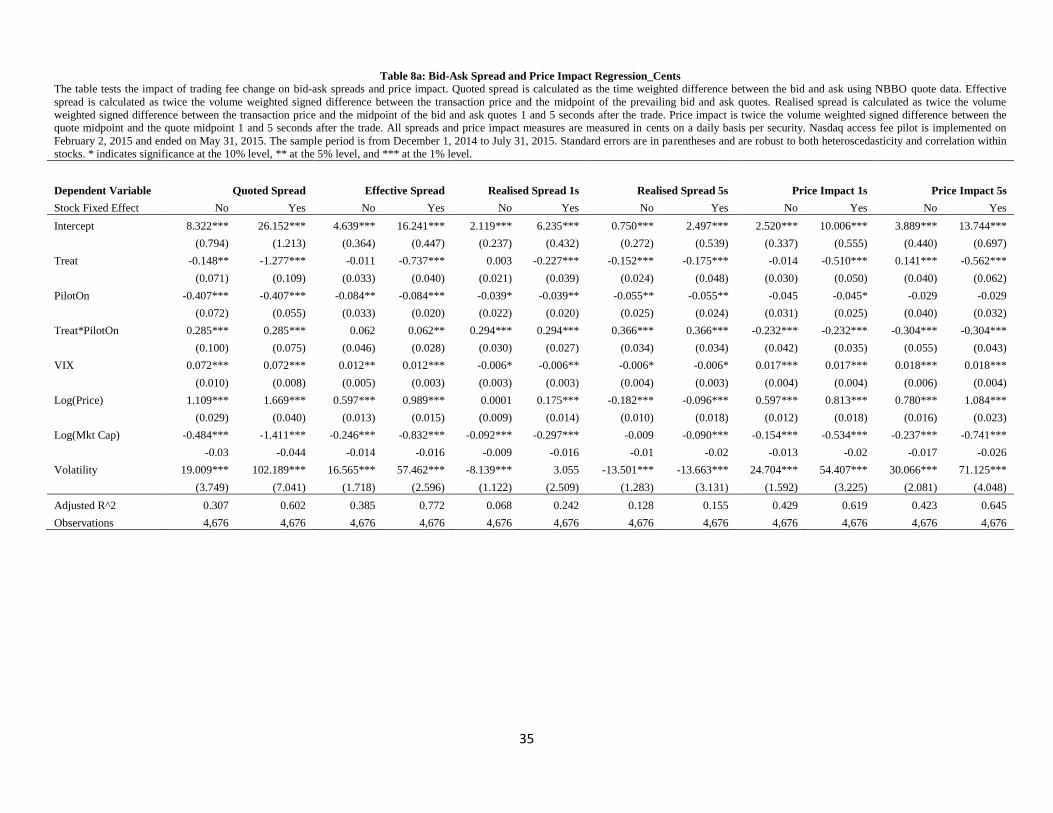
35
Table 8a: Bid-Ask Spread and Price Impact Regression_Cents
The table tests the impact of trading fee change on bid-ask spreads and price impact. Quoted spread is calculated as the time weighted difference between the bid and ask using NBBO quote data. Effective
spread is calculated as twice the volume weighted signed difference between the transaction price and the midpoint of the prevailing bid and ask quotes. Realised spread is calculated as twice the volume
weighted signed difference between the transaction price and the midpoint of the bid and ask quotes 1 and 5 seconds after the trade. Price impact is twice the volume weighted signed difference between the
quote midpoint and the quote midpoint 1 and 5 seconds after the trade. All spreads and price impact measures are measured in cents on a daily basis per security. Nasdaq access fee pilot is implemented on
February 2, 2015 and ended on May 31, 2015. The sample period is from December 1, 2014 to July 31, 2015. Standard errors are in parentheses and are robust to both heteroscedasticity and correlation within
stocks. * indicates significance at the 10% level, ** at the 5% level, and *** at the 1% level.
Dependent Variable Quoted Spread Effective Spread Realised Spread 1s Realised Spread 5s Price Impact 1s Price Impact 5s
Stock Fixed Effect No Yes No Yes No Yes No Yes No Yes No Yes
Intercept 8.322*** 26.152*** 4.639*** 16.241*** 2.119*** 6.235*** 0.750*** 2.497*** 2.520*** 10.006*** 3.889*** 13.744***
(0.794) (1.213) (0.364) (0.447) (0.237) (0.432) (0.272) (0.539) (0.337) (0.555) (0.440) (0.697)
Treat -0.148** -1.277*** -0.011 -0.737*** 0.003 -0.227*** -0.152*** -0.175*** -0.014 -0.510*** 0.141*** -0.562***
(0.071) (0.109) (0.033) (0.040) (0.021) (0.039) (0.024) (0.048) (0.030) (0.050) (0.040) (0.062)
PilotOn -0.407*** -0.407*** -0.084** -0.084*** -0.039* -0.039** -0.055** -0.055** -0.045 -0.045* -0.029 -0.029
(0.072) (0.055) (0.033) (0.020) (0.022) (0.020) (0.025) (0.024) (0.031) (0.025) (0.040) (0.032)
Treat*PilotOn 0.285*** 0.285*** 0.062 0.062** 0.294*** 0.294*** 0.366*** 0.366*** -0.232*** -0.232*** -0.304*** -0.304***
(0.100) (0.075) (0.046) (0.028) (0.030) (0.027) (0.034) (0.034) (0.042) (0.035) (0.055) (0.043)
VIX 0.072*** 0.072*** 0.012** 0.012*** -0.006* -0.006** -0.006* -0.006* 0.017*** 0.017*** 0.018*** 0.018***
(0.010) (0.008) (0.005) (0.003) (0.003) (0.003) (0.004) (0.003) (0.004) (0.004) (0.006) (0.004)
Log(Price) 1.109*** 1.669*** 0.597*** 0.989*** 0.0001 0.175*** -0.182*** -0.096*** 0.597*** 0.813*** 0.780*** 1.084***
(0.029) (0.040) (0.013) (0.015) (0.009) (0.014) (0.010) (0.018) (0.012) (0.018) (0.016) (0.023)
Log(Mkt Cap) -0.484*** -1.411*** -0.246*** -0.832*** -0.092*** -0.297*** -0.009 -0.090*** -0.154*** -0.534*** -0.237*** -0.741***
-0.03 -0.044 -0.014 -0.016 -0.009 -0.016 -0.01 -0.02 -0.013 -0.02 -0.017 -0.026
Volatility 19.009*** 102.189*** 16.565*** 57.462*** -8.139*** 3.055 -13.501*** -13.663*** 24.704*** 54.407*** 30.066*** 71.125***
(3.749) (7.041) (1.718) (2.596) (1.122) (2.509) (1.283) (3.131) (1.592) (3.225) (2.081) (4.048)
Adjusted R^2 0.307 0.602 0.385 0.772 0.068 0.242 0.128 0.155 0.429 0.619 0.423 0.645
Observations 4,676 4,676 4,676 4,676 4,676 4,676 4,676 4,676 4,676 4,676 4,676 4,676

36
Table 8b: Cum Fee Bid-Ask Spread and Price Impact Regression_cents
The table tests the impact of trading fee change on bid-ask spreads and price impact. Quoted spread is calculated as the time weighted difference between the bid and ask using NBBO quote data. Effective
spread is calculated as twice the volume weighted signed difference between the transaction price and the midpoint of the prevailing bid and ask quotes. Realised spread is calculated as twice the volume
weighted signed difference between the transaction price and the midpoint of the bid and ask quotes 1 and 5 seconds after the trade. Price impact is twice the volume weighted signed difference between the
quote midpoint and the quote midpoint 1 and 5 seconds after the trade. All spreads and price impact measures are measured in cents on a daily basis per security. Nasdaq access fee pilot is implemented on
February 2, 2015 and ended on May 31, 2015. The sample period is from December 1, 2014 to July 31, 2015. Standard errors are in parentheses and are robust to both heteroscedasticity and correlation within
stocks. * indicates significance at the 10% level, ** at the 5% level, and *** at the 1% level.
Dependent Variable Quoted Spread Effective Spread Realised Spread 1s Realised Spread 5s Price Impact 1s Price Impact 5s
Stock Fixed Effect No Yes No Yes No Yes No Yes No Yes No Yes
Intercept 8.922*** 26.752*** 5.239*** 16.841*** 2.699*** 6.815*** 1.330*** 3.077*** 2.520*** 10.006*** 3.889*** 13.744***
(0.794) (1.213) (0.364) (0.447) (0.237) (0.432) (0.272) (0.539) (0.337) (0.555) (0.440) (0.697)
Treat -0.148** -1.277*** -0.011 -0.737*** 0.003 -0.227*** -0.152*** -0.175*** -0.014 -0.510*** 0.141*** -0.562***
(0.071) (0.109) (0.033) (0.040) (0.021) (0.039) (0.024) (0.048) (0.030) (0.050) (0.040) (0.062)
PilotOn -0.407*** -0.407*** -0.084** -0.084*** -0.039* -0.039** -0.055** -0.055** -0.045 -0.045* -0.029 -0.029
(0.072) (0.055) (0.033) (0.020) (0.022) (0.020) (0.025) (0.024) (0.031) (0.025) (0.040) (0.032)
Treat*PilotOn -0.215** -0.215*** -0.438*** -0.438*** -0.206*** -0.206*** -0.134*** -0.134*** -0.232*** -0.232*** -0.304*** -0.304***
(0.100) (0.075) (0.046) (0.028) (0.030) (0.027) (0.034) (0.034) (0.042) (0.035) (0.055) (0.043)
VIX 0.072*** 0.072*** 0.012** 0.012*** -0.006* -0.006** -0.006* -0.006* 0.017*** 0.017*** 0.018*** 0.018***
(0.010) (0.008) (0.005) (0.003) (0.003) (0.003) (0.004) (0.003) (0.004) (0.004) (0.006) (0.004)
Log(Price) 1.109*** 1.669*** 0.597*** 0.989*** 0.0001 0.175*** -0.182*** -0.096*** 0.597*** 0.813*** 0.780*** 1.084***
(0.029) (0.040) (0.013) (0.015) (0.009) (0.014) (0.010) (0.018) (0.012) (0.018) (0.016) (0.023)
Log(Mkt Cap) -0.484*** -1.411*** -0.246*** -0.832*** -0.092*** -0.297*** -0.009 -0.090*** -0.154*** -0.534*** -0.237*** -0.741***
-0.03 -0.044 -0.014 -0.016 -0.009 -0.016 -0.01 -0.02 -0.013 -0.02 -0.017 -0.026
Volatility 19.009*** 102.189*** 16.565*** 57.462*** -8.139*** 3.055 -13.501*** -13.663*** 24.704*** 54.407*** 30.066*** 71.125***
(3.749) (7.041) (1.718) (2.596) (1.122) (2.509) (1.283) (3.131) (1.592) (3.225) (2.081) (4.048)
Adjusted R^2 0.327 0.614 0.428 0.788 0.061 0.236 0.123 0.150 0.429 0.619 0.423 0.645
Observations 4,676 4,676 4,676 4,676 4,676 4,676 4,676 4,676 4,676 4,676 4,676 4,676

37
Table 9: Market Efficiency Univariate Analysis
This table reports variance ratio (panel A) and autocorrelation (panel B) univariate analysis for Nasdaq fee pilot stocks and its matching stocks. Nasdaq access fee pilot is implemented on February
2, 2015 and ended on May 31, 2015. The sample period is from December 1, 2014 to July 31, 2015. PilotOn is the period when Nasdaq implemented the fee pilot; and PilotOff refers to two
months prior and post the fee pilot. Variance ratio are computed in 1 to 10 seconds, 10 to 60 seconds, and 1 to 300 seconds time intervals; and autocorrelation are computed in 1 seconds, 10
seconds and 300 seconds. Chicago Stock Exchange and NYSE Amex are not reported in this table due to small market share which both are smaller than 0.5%.
Treatment Control
PilotOn PilotOff PilotOn PilotOff DiD t-Stats
Panel A: Variance Ratio
Exchange 1t10s 10t60s 1t300s 1t10s 10t60s 1t300s 1t10s 10t60s 1t300s 1t10s 10t60s 1t300s 1t10s 10t60s 1t300s 1t10s 10t60s 1t300s
NASDAQ 1.083 1.146 1.509 1.003 1.044 1.221 1.108 1.099 1.466 1.117 1.091 1.413 0.089 0.094 0.234 8.590 6.763 5.819
ARCA 1.125 1.169 1.585 1.087 1.109 1.425 1.175 1.153 1.701 1.195 1.167 1.732 0.058 0.075 0.190 5.687 6.204 4.214
BATS Z 1.214 1.236 1.933 1.172 1.172 1.723 1.226 1.188 1.912 1.235 1.187 1.865 0.051 0.063 0.163 3.959 4.260 2.327
NYSE 1.128 1.153 1.521 1.092 1.108 1.401 1.101 1.086 1.389 1.128 1.120 1.558 0.063 0.080 0.290 6.830 4.772 3.497
PHLX 3.375 3.098 40.301 2.647 2.358 22.506 3.453 3.214 53.811 3.189 2.904 40.701 0.465 0.431 4.684 3.493 4.478 1.436
EDGX 1.167 1.192 1.699 1.152 1.162 1.705 1.268 1.263 2.379 1.353 1.358 3.076 0.100 0.125 0.692 6.168 6.282 4.802
EDGA 1.796 1.575 5.772 1.753 1.550 5.522 1.928 1.660 6.781 2.048 1.775 8.464 0.163 0.141 1.934 2.350 3.351 2.532
BATS Y 1.790 1.551 5.604 1.786 1.543 5.934 1.942 1.663 8.752 1.895 1.643 7.722 -0.044 -0.011 -1.361 -0.691 -0.260 -1.519
BX 2.478 2.055 19.667 2.711 2.187 30.773 2.452 2.095 20.437 2.956 2.459 34.489 0.271 0.231 2.946 2.130 2.875 0.975
Consolidated 1.057 1.128 1.416 1.605 1.302 5.290 1.044 1.059 1.294 1.764 1.386 9.881 0.172 0.152 4.713 3.155 4.300 4.455
Panel B: Autocorrelation
Exchange ac1s ac10s ac300s ac1s ac10s ac300s ac1s ac10s ac300s ac1s ac10s ac300s ac1s ac10s ac300s ac1s ac10s ac300s
NASDAQ -0.016 0.892 0.995 -0.002 0.900 0.996 -0.024 0.890 0.995 -0.028 0.889 0.996 -0.017 -0.009 -0.001 -6.538 -8.800 -6.108
ARCA -0.029 0.888 0.995 -0.021 0.892 0.996 -0.038 0.884 0.995 -0.040 0.882 0.995 -0.011 -0.006 -0.001 -4.996 -6.147 -4.286
BATS Z -0.045 0.879 0.994 -0.037 0.884 0.995 -0.047 0.879 0.994 -0.048 0.878 0.994 -0.009 -0.005 0.000 -3.485 -4.163 -2.204
NYSE -0.029 0.887 0.995 -0.023 0.891 0.996 -0.029 0.890 0.996 -0.029 0.888 0.995 -0.005 -0.007 -0.001 -2.563 -7.031 -3.418
PHLX -0.234 0.675 0.890 -0.174 0.754 0.940 -0.206 0.676 0.869 -0.193 0.703 0.904 -0.047 -0.051 -0.015 -5.589 -4.460 -1.987
EDGX -0.041 0.884 0.995 -0.035 0.885 0.995 -0.053 0.875 0.993 -0.064 0.867 0.991 -0.017 -0.010 -0.002 -6.070 -6.329 -5.223
EDGA -0.112 0.827 0.982 -0.110 0.831 0.984 -0.117 0.817 0.980 -0.120 0.810 0.978 -0.004 -0.010 -0.003 -0.703 -1.826 -1.505
BATS Y -0.119 0.827 0.983 -0.128 0.824 0.981 -0.125 0.816 0.972 -0.130 0.815 0.976 0.003 0.002 0.005 0.493 0.325 1.610
BX -0.127 0.771 0.952 -0.150 0.739 0.922 -0.120 0.774 0.950 -0.169 0.719 0.917 -0.026 -0.023 -0.002 -3.538 -2.083 -0.311
Consolidated -0.009 0.894 0.995 -0.061 0.840 0.983 -0.010 0.896 0.996 -0.080 0.825 0.970 -0.018 -0.017 -0.013 -4.026 -3.145 -4.203
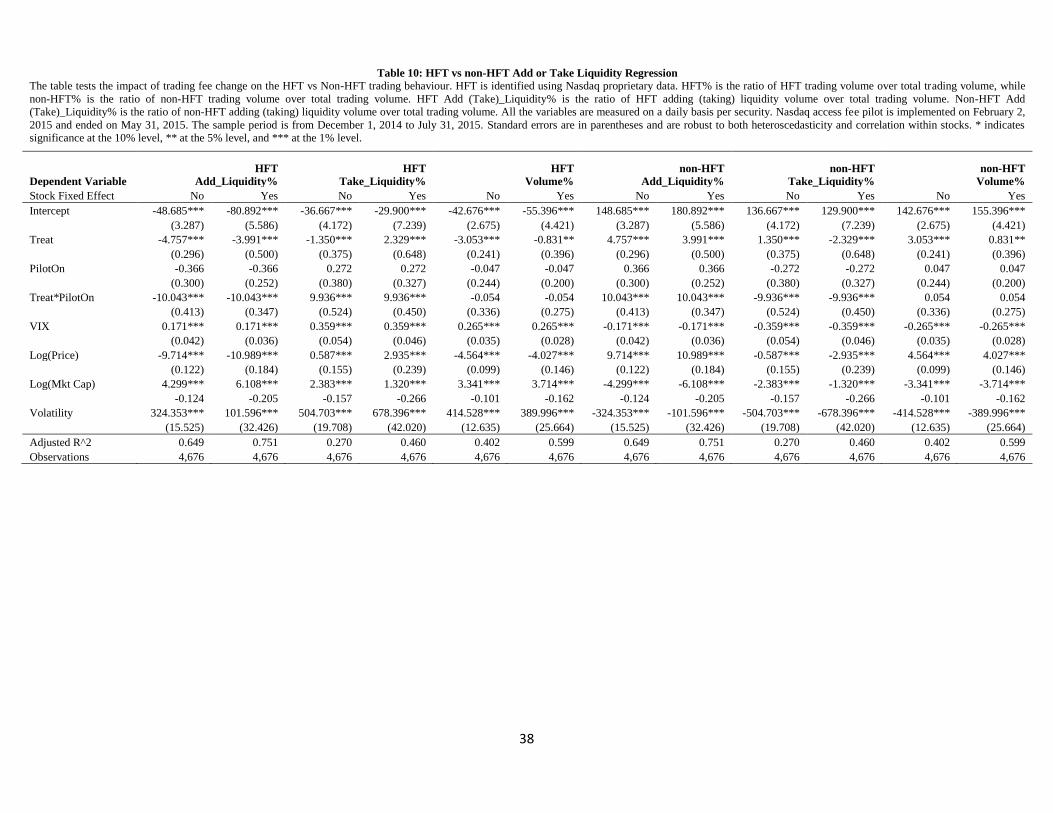
38
Table 10: HFT vs non-HFT Add or Take Liquidity Regression
The table tests the impact of trading fee change on the HFT vs Non-HFT trading behaviour. HFT is identified using Nasdaq proprietary data. HFT% is the ratio of HFT trading volume over total trading volume, while
non-HFT% is the ratio of non-HFT trading volume over total trading volume. HFT Add (Take)_Liquidity% is the ratio of HFT adding (taking) liquidity volume over total trading volume. Non-HFT Add
(Take)_Liquidity% is the ratio of non-HFT adding (taking) liquidity volume over total trading volume. All the variables are measured on a daily basis per security. Nasdaq access fee pilot is implemented on February 2,
2015 and ended on May 31, 2015. The sample period is from December 1, 2014 to July 31, 2015. Standard errors are in parentheses and are robust to both heteroscedasticity and correlation within stocks. * indicates
significance at the 10% level, ** at the 5% level, and *** at the 1% level.
Dependent Variable
HFT
Add_Liquidity%
HFT
Take_Liquidity%
HFT
Volume%
non-HFT
Add_Liquidity%
non-HFT
Take_Liquidity%
non-HFT
Volume%
Stock Fixed Effect No Yes No Yes No Yes No Yes No Yes No Yes
Intercept -48.685*** -80.892*** -36.667*** -29.900*** -42.676*** -55.396*** 148.685*** 180.892*** 136.667*** 129.900*** 142.676*** 155.396***
(3.287) (5.586) (4.172) (7.239) (2.675) (4.421) (3.287) (5.586) (4.172) (7.239) (2.675) (4.421)
Treat -4.757*** -3.991*** -1.350*** 2.329*** -3.053*** -0.831** 4.757*** 3.991*** 1.350*** -2.329*** 3.053*** 0.831**
(0.296) (0.500) (0.375) (0.648) (0.241) (0.396) (0.296) (0.500) (0.375) (0.648) (0.241) (0.396)
PilotOn -0.366 -0.366 0.272 0.272 -0.047 -0.047 0.366 0.366 -0.272 -0.272 0.047 0.047
(0.300) (0.252) (0.380) (0.327) (0.244) (0.200) (0.300) (0.252) (0.380) (0.327) (0.244) (0.200)
Treat*PilotOn -10.043*** -10.043*** 9.936*** 9.936*** -0.054 -0.054 10.043*** 10.043*** -9.936*** -9.936*** 0.054 0.054
(0.413) (0.347) (0.524) (0.450) (0.336) (0.275) (0.413) (0.347) (0.524) (0.450) (0.336) (0.275)
VIX 0.171*** 0.171*** 0.359*** 0.359*** 0.265*** 0.265*** -0.171*** -0.171*** -0.359*** -0.359*** -0.265*** -0.265***
(0.042) (0.036) (0.054) (0.046) (0.035) (0.028) (0.042) (0.036) (0.054) (0.046) (0.035) (0.028)
Log(Price) -9.714*** -10.989*** 0.587*** 2.935*** -4.564*** -4.027*** 9.714*** 10.989*** -0.587*** -2.935*** 4.564*** 4.027***
(0.122) (0.184) (0.155) (0.239) (0.099) (0.146) (0.122) (0.184) (0.155) (0.239) (0.099) (0.146)
Log(Mkt Cap) 4.299*** 6.108*** 2.383*** 1.320*** 3.341*** 3.714*** -4.299*** -6.108*** -2.383*** -1.320*** -3.341*** -3.714***
-0.124 -0.205 -0.157 -0.266 -0.101 -0.162 -0.124 -0.205 -0.157 -0.266 -0.101 -0.162
Volatility 324.353*** 101.596*** 504.703*** 678.396*** 414.528*** 389.996*** -324.353*** -101.596*** -504.703*** -678.396*** -414.528*** -389.996***
(15.525) (32.426) (19.708) (42.020) (12.635) (25.664) (15.525) (32.426) (19.708) (42.020) (12.635) (25.664)
Adjusted R^2 0.649 0.751 0.270 0.460 0.402 0.599 0.649 0.751 0.270 0.460 0.402 0.599
Observations 4,676 4,676 4,676 4,676 4,676 4,676 4,676 4,676 4,676 4,676 4,676 4,676
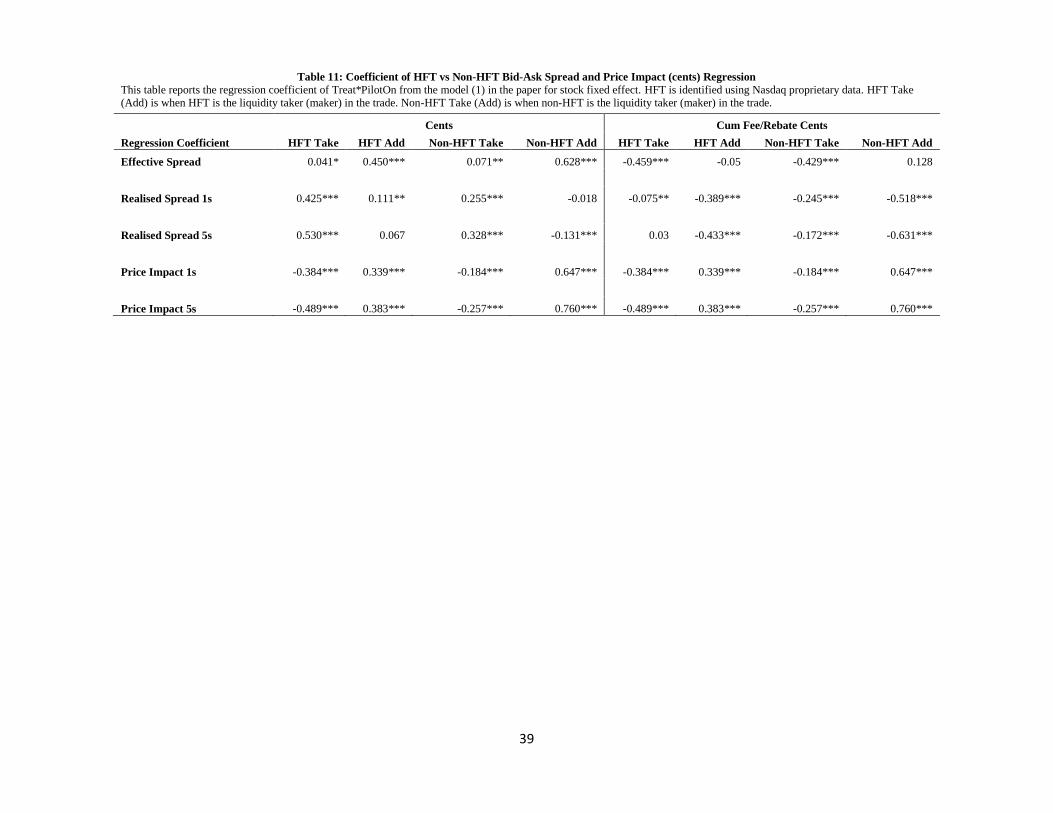
39
Table 11: Coefficient of HFT vs Non-HFT Bid-Ask Spread and Price Impact (cents) Regression
This table reports the regression coefficient of Treat*PilotOn from the model (1) in the paper for stock fixed effect. HFT is identified using Nasdaq proprietary data. HFT Take
(Add) is when HFT is the liquidity taker (maker) in the trade. Non-HFT Take (Add) is when non-HFT is the liquidity taker (maker) in the trade.
Cents Cum Fee/Rebate Cents
Regression Coefficient HFT Take HFT Add Non-HFT Take Non-HFT Add HFT Take HFT Add Non-HFT Take Non-HFT Add
Effective Spread 0.041* 0.450*** 0.071** 0.628*** -0.459*** -0.05 -0.429*** 0.128
Realised Spread 1s 0.425*** 0.111** 0.255*** -0.018 -0.075** -0.389*** -0.245*** -0.518***
Realised Spread 5s 0.530*** 0.067 0.328*** -0.131*** 0.03 -0.433*** -0.172*** -0.631***
Price Impact 1s -0.384*** 0.339*** -0.184*** 0.647*** -0.384*** 0.339*** -0.184*** 0.647***
Price Impact 5s -0.489*** 0.383*** -0.257*** 0.760*** -0.489*** 0.383*** -0.257*** 0.760***
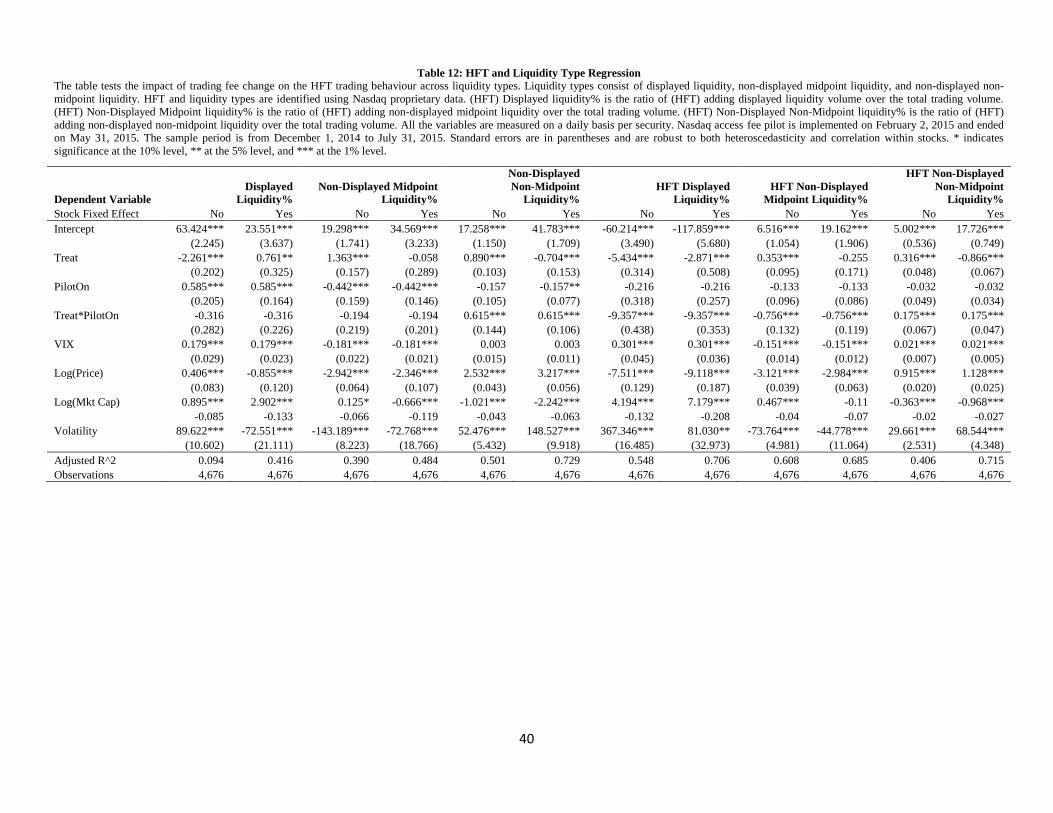
40
Table 12: HFT and Liquidity Type Regression
The table tests the impact of trading fee change on the HFT trading behaviour across liquidity types. Liquidity types consist of displayed liquidity, non-displayed midpoint liquidity, and non-displayed non-
midpoint liquidity. HFT and liquidity types are identified using Nasdaq proprietary data. (HFT) Displayed liquidity% is the ratio of (HFT) adding displayed liquidity volume over the total trading volume.
(HFT) Non-Displayed Midpoint liquidity% is the ratio of (HFT) adding non-displayed midpoint liquidity over the total trading volume. (HFT) Non-Displayed Non-Midpoint liquidity% is the ratio of (HFT)
adding non-displayed non-midpoint liquidity over the total trading volume. All the variables are measured on a daily basis per security. Nasdaq access fee pilot is implemented on February 2, 2015 and ended
on May 31, 2015. The sample period is from December 1, 2014 to July 31, 2015. Standard errors are in parentheses and are robust to both heteroscedasticity and correlation within stocks. * indicates
significance at the 10% level, ** at the 5% level, and *** at the 1% level.
Dependent Variable
Displayed
Liquidity%
Non-Displayed Midpoint
Liquidity%
Non-Displayed
Non-Midpoint
Liquidity%
HFT Displayed
Liquidity%
HFT Non-Displayed
Midpoint Liquidity%
HFT Non-Displayed
Non-Midpoint
Liquidity%
Stock Fixed Effect No Yes No Yes No Yes No Yes No Yes No Yes
Intercept 63.424*** 23.551*** 19.298*** 34.569*** 17.258*** 41.783*** -60.214*** -117.859*** 6.516*** 19.162*** 5.002*** 17.726***
(2.245) (3.637) (1.741) (3.233) (1.150) (1.709) (3.490) (5.680) (1.054) (1.906) (0.536) (0.749)
Treat -2.261*** 0.761** 1.363*** -0.058 0.890*** -0.704*** -5.434*** -2.871*** 0.353*** -0.255 0.316*** -0.866***
(0.202) (0.325) (0.157) (0.289) (0.103) (0.153) (0.314) (0.508) (0.095) (0.171) (0.048) (0.067)
PilotOn 0.585*** 0.585*** -0.442*** -0.442*** -0.157 -0.157** -0.216 -0.216 -0.133 -0.133 -0.032 -0.032
(0.205) (0.164) (0.159) (0.146) (0.105) (0.077) (0.318) (0.257) (0.096) (0.086) (0.049) (0.034)
Treat*PilotOn -0.316 -0.316 -0.194 -0.194 0.615*** 0.615*** -9.357*** -9.357*** -0.756*** -0.756*** 0.175*** 0.175***
(0.282) (0.226) (0.219) (0.201) (0.144) (0.106) (0.438) (0.353) (0.132) (0.119) (0.067) (0.047)
VIX 0.179*** 0.179*** -0.181*** -0.181*** 0.003 0.003 0.301*** 0.301*** -0.151*** -0.151*** 0.021*** 0.021***
(0.029) (0.023) (0.022) (0.021) (0.015) (0.011) (0.045) (0.036) (0.014) (0.012) (0.007) (0.005)
Log(Price) 0.406*** -0.855*** -2.942*** -2.346*** 2.532*** 3.217*** -7.511*** -9.118*** -3.121*** -2.984*** 0.915*** 1.128***
(0.083) (0.120) (0.064) (0.107) (0.043) (0.056) (0.129) (0.187) (0.039) (0.063) (0.020) (0.025)
Log(Mkt Cap) 0.895*** 2.902*** 0.125* -0.666*** -1.021*** -2.242*** 4.194*** 7.179*** 0.467*** -0.11 -0.363*** -0.968***
-0.085 -0.133 -0.066 -0.119 -0.043 -0.063 -0.132 -0.208 -0.04 -0.07 -0.02 -0.027
Volatility 89.622*** -72.551*** -143.189*** -72.768*** 52.476*** 148.527*** 367.346*** 81.030** -73.764*** -44.778*** 29.661*** 68.544***
(10.602) (21.111) (8.223) (18.766) (5.432) (9.918) (16.485) (32.973) (4.981) (11.064) (2.531) (4.348)
Adjusted R^2 0.094 0.416 0.390 0.484 0.501 0.729 0.548 0.706 0.608 0.685 0.406 0.715
Observations 4,676 4,676 4,676 4,676 4,676 4,676 4,676 4,676 4,676 4,676 4,676 4,676
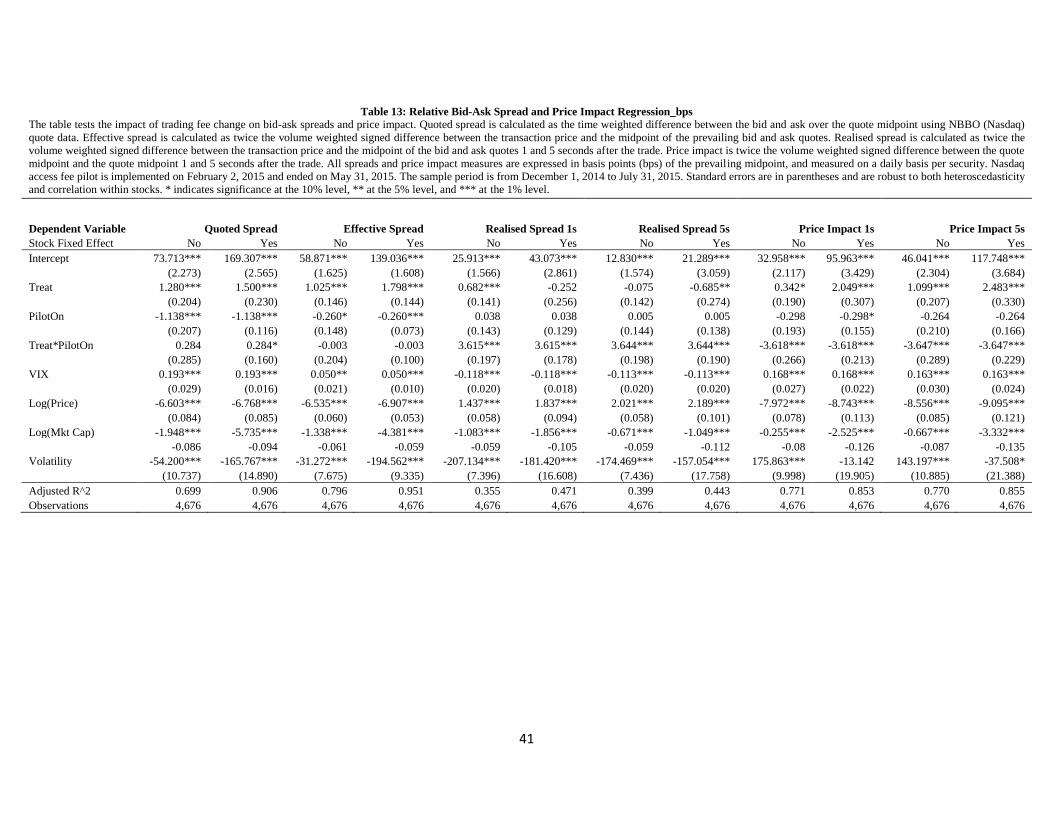
41
Table 13: Relative Bid-Ask Spread and Price Impact Regression_bps
The table tests the impact of trading fee change on bid-ask spreads and price impact. Quoted spread is calculated as the time weighted difference between the bid and ask over the quote midpoint using NBBO (Nasdaq)
quote data. Effective spread is calculated as twice the volume weighted signed difference between the transaction price and the midpoint of the prevailing bid and ask quotes. Realised spread is calculated as twice the
volume weighted signed difference between the transaction price and the midpoint of the bid and ask quotes 1 and 5 seconds after the trade. Price impact is twice the volume weighted signed difference between the quote
midpoint and the quote midpoint 1 and 5 seconds after the trade. All spreads and price impact measures are expressed in basis points (bps) of the prevailing midpoint, and measured on a daily basis per security. Nasdaq
access fee pilot is implemented on February 2, 2015 and ended on May 31, 2015. The sample period is from December 1, 2014 to July 31, 2015. Standard errors are in parentheses and are robust to both heteroscedasticity
and correlation within stocks. * indicates significance at the 10% level, ** at the 5% level, and *** at the 1% level.
Dependent Variable Quoted Spread Effective Spread Realised Spread 1s Realised Spread 5s Price Impact 1s Price Impact 5s
Stock Fixed Effect No Yes No Yes No Yes No Yes No Yes No Yes
Intercept 73.713*** 169.307*** 58.871*** 139.036*** 25.913*** 43.073*** 12.830*** 21.289*** 32.958*** 95.963*** 46.041*** 117.748***
(2.273) (2.565) (1.625) (1.608) (1.566) (2.861) (1.574) (3.059) (2.117) (3.429) (2.304) (3.684)
Treat 1.280*** 1.500*** 1.025*** 1.798*** 0.682*** -0.252 -0.075 -0.685** 0.342* 2.049*** 1.099*** 2.483***
(0.204) (0.230) (0.146) (0.144) (0.141) (0.256) (0.142) (0.274) (0.190) (0.307) (0.207) (0.330)
PilotOn -1.138*** -1.138*** -0.260* -0.260*** 0.038 0.038 0.005 0.005 -0.298 -0.298* -0.264 -0.264
(0.207) (0.116) (0.148) (0.073) (0.143) (0.129) (0.144) (0.138) (0.193) (0.155) (0.210) (0.166)
Treat*PilotOn 0.284 0.284* -0.003 -0.003 3.615*** 3.615*** 3.644*** 3.644*** -3.618*** -3.618*** -3.647*** -3.647***
(0.285) (0.160) (0.204) (0.100) (0.197) (0.178) (0.198) (0.190) (0.266) (0.213) (0.289) (0.229)
VIX 0.193*** 0.193*** 0.050** 0.050*** -0.118*** -0.118*** -0.113*** -0.113*** 0.168*** 0.168*** 0.163*** 0.163***
(0.029) (0.016) (0.021) (0.010) (0.020) (0.018) (0.020) (0.020) (0.027) (0.022) (0.030) (0.024)
Log(Price) -6.603*** -6.768*** -6.535*** -6.907*** 1.437*** 1.837*** 2.021*** 2.189*** -7.972*** -8.743*** -8.556*** -9.095***
(0.084) (0.085) (0.060) (0.053) (0.058) (0.094) (0.058) (0.101) (0.078) (0.113) (0.085) (0.121)
Log(Mkt Cap) -1.948*** -5.735*** -1.338*** -4.381*** -1.083*** -1.856*** -0.671*** -1.049*** -0.255*** -2.525*** -0.667*** -3.332***
-0.086 -0.094 -0.061 -0.059 -0.059 -0.105 -0.059 -0.112 -0.08 -0.126 -0.087 -0.135
Volatility -54.200*** -165.767*** -31.272*** -194.562*** -207.134*** -181.420*** -174.469*** -157.054*** 175.863*** -13.142 143.197*** -37.508*
(10.737) (14.890) (7.675) (9.335) (7.396) (16.608) (7.436) (17.758) (9.998) (19.905) (10.885) (21.388)
Adjusted R^2 0.699 0.906 0.796 0.951 0.355 0.471 0.399 0.443 0.771 0.853 0.770 0.855
Observations 4,676 4,676 4,676 4,676 4,676 4,676 4,676 4,676 4,676 4,676 4,676 4,676