Embed Size (px)
Citation preview

We
L i s t e n ,
U n d e r s t a n d ,
a n d
M a k e i t Wo r k .
S e r v i n g C u s t o m e r s B e t t e r
NTT DATA CORPORATIONAnnual Report 2000
Fiscal Year Ended March 31, 2000

NTT DATA - Past, Present, and Future
NTT DATA CORPORATION’s earliest incarnation was as an internaldepartment, the Data Communications Bureau, of the then whollypublicly owned Nippon Telegraph and Telephone Public Corporation.Originally set up in October 1967, the Company was reestablishedin May 1988 as a wholly owned subsidiary of Nippon Telegraph andTelephone Corporation (NTT), and since then has been developingits business as Japan’s leading provider of information systems andcomputer networks.
Our Business, Our ProspectsNTT DATA’s principal businesses are centered around interlockingand complementary areas. In its System Integration (SI) business, the Company—in consultation with individual customers—develops,sells, leases, and services data communications systems. In theNetwork System Services business, the Company provides a varietyof information, data-processing, and other services based on comput-er networks typified by the Internet. The Company is also developingbusinesses in such areas as data communi-cations system proposals and planning,maintenance, facility management, andresearch and analysis of customer opera-tions. In addition to the sectors that havebeen our traditional bastions of strength—the public administration and financialsectors—we are also focusing our energieson expanding into new areas, such asInternet-related business. NTT DATA isnot confined to being a mere solutionsprovider—we are skilled at forecasting mar-ket and consumer trends and aim to be acorporation that can create and offer completely new businesses.
Cautionary Statement Regarding Forward-Looking StatementsThis annual report contains forward-looking statements concerningNTT DATA’s future plans, strategies, and performance. These forward-looking statements are not historical facts; rather, they representassumptions and beliefs based on economic, financial, and competi-tive data currently available. Forward-looking statements includeinformation preceded by, followed by, or that include the words “predicts,” “expects,” “anticipates,” “could,” “may,” or similarexpressions. Furthermore, they are subject to a number of risks anduncertainties that, without limitation, relate to economic conditions,fierce competition in the information service industry, customerdemand, tax rules, regulations, and other factors. Readers of thisannual report are cautioned not to place undue reliance on these forward-looking statements. NTT DATA therefore wishes to cautionreaders that actual results may differ materially from its expectations.
Contents
Consolidated Financial Highlights...1 Message from the Management...2 From a Solutions Provider to a Service Provider/IT Partner...5
Review and Outlook...10 Review and Outlook by Sector...12 International Business Strategy...14 R&D...15 Society and
the Environment...16 Consolidated Six-Year Summary...17 Financial Review...18 Consolidated Financial Statements...22
Non-Consolidated Six-Year Summary...37 Non-Consolidated Financial Statements...38 Directors and Auditors...51 Major Subsidiaries
and Affiliates...51 Investor Information...52 Corporate Data...53
Enhancing the promotion
of new businesses
Strengtheningcompetitive-
ness in SI
Moving to a newbusiness model

1Annual Report 2000
Thousands ofMillions of yen U.S. dollars
1998 1999 2000 2000
Net Sales ¥ 676,581 ¥ 710,152 ¥ 725,348 $ 6,842,906
Operating Income 54,197 56,833 50,738 478,660
Income (Loss) before Income Taxes 34,275 37,747 (29,177) (275,255)
Net Income (Loss) 15,612 16,313 (18,114) (170,887)
New Orders Received — — 714,882 6,744,170
Total Assets 900,693 1,002,805 1,071,653 10,109,934
Total Shareholders’ Equity 205,799 369,244 363,758 3,431,679
Capital Expenditures — — 210,375 1,984,670
Depreciation and Amortization/Loss on Disposal of Property and Equipment and Intangibles — — 152,525 1,438,915
Research and Development Expenses 15,874 14,042 22,684 214,000
Return on Equity (%) 7.8 5.7 (4.9) —
Free Cash Flow — — (23,763) (224,179)
Yen U.S. dollars
Per Share:Net Income (Loss) ¥ 61,708 ¥ 5,905 ¥ (6,458) $ (60.92)
Cash Dividends 10,000 1,000 1,000 9.43
Number of Employees — — 10,500 —
Note: Yen amounts are translated into U.S. dollars, solely for convenience, at the prevailing exchange rate on 31st March, 2000, of¥106=U.S.$1.00.
Consolidated Financial HighlightsNTT DATA CORPORATION AND SUBSIDIARIESYears ended 31st March
’96 ’97 ’98 ’99 ’000
100
200
300
400
500
600
700
800
Net Income
Net Income per Share (Yen)
–20
–15
–10
–5
0
5
10
15
20
–10,000
0
10,000
20,000
30,000
40,000
50,000
60,000
70,000
’96 ’97 ’98 ’99 ’00
Total Assets
Equity Ratio (%)
0
200
400
600
800
1,000
1,200
0
10
20
30
40
50
60
’96 ’97 ’98 ’99 ’00–5
0
5
10
15
’96 ’97 ’98 ’99 ’00
Net Sales Net Income and Net Income Per Share
Total Assets and Equity Ratio Return on Equity (ROE)
Note: A change in par value from ¥50,000 to ¥5,000 went into effect on 1st August, 1998.
Net income per share for the fiscal year ended 31st March,1999 reflects the stock split at the beginning of the period.
(Billions of yen) (Billions of yen) (Yen) (Billions of yen) (%) (%)

Message from the Management
Sales for fiscal 2000 increased only marginally, and profits were
negatively affected by the postponement of several service starts
and the redesign of certain systems under development. The NTT
DATA Group posted losses of ¥63.8 billion during the period
under review due to changes made to the accounting procedures
concerning reserves for employees’ retirement benefits, made in
preparation for the March 2001 introduction of new accounting
standards relating to employees’ retirement benefits, and the appli-
cation of deferred tax accounting, as well as changes in accounting
procedures regarding software in conjunction with the adoption of
new accounting standards relating to R&D expenses, reflecting the
arrival of fair-value accounting in Japan.
As a result of these factors, consolidated net sales in fiscal 2000
increased ¥15.2 billion, or 2.1%, to ¥725.3 billion, operating income
declined ¥6.1 billion, or 10.7%, to ¥50.7 billion, and net income
deteriorated ¥34.4 billion as net losses amounted to ¥18.1 billion.
2 Annual Report 2000
Tomeo KambayashiChairman of the Board
Toshiharu AokiPresident and Chief Executive Officer
Operating Environment and Business Results
During fiscal 2000, ended 31st March, 2000, the Japanese economy
remained parlous, characterized by a weak recovery in private-
sector demand. However, thanks to the economic stimulus mea-
sures taken by the government since the previous fiscal year and
the recovery of the economies of other Asian countries, a gradual
improvement in the economy was seen. At the end of fiscal 2000,
there were signs of recovery in corporate capital investment and indi-
cations that the economy was on a self-sustaining recovery track.
IT investment by corporations and other organizations is fore-
cast to grow as the digitization of society continues apace and
the Internet further permeates our lives. It is widely hoped that
the information service industry, in which the NTT DATA Group
operates, will act as a catalyst to kick-start economic recovery
in earnest.
Against this background, the NTT DATA Group formulated two
key policies: to enhance its management capabilities to improve
investment efficiencies, the goal being to secure optimal profits;
and to commit positively to new businesses for greater medium-
and long-term expansion. We are developing our businesses while
bolstering our close working partnerships with other companies
in the NTT Group.
3Annual Report 2000
IT PartnerDeveloping new businesses in con-
junction with client corporations
Service Provider Providing a full line of core platformservices necessary to an informa-
tion networked society
System Integrator(SI business)
Creating and expand-ing IT markets
Developing ser-vices necessary toexpand into newbusiness areas
Developing jointventures usingknow-how andtechnologiesacquired in the SI business
Individual SI development for customers using our services
Developing jointventures throughpartnering withcustomers usingour services
UndertakingSI work in therelated busi-nesses of ourbusiness part-ners
Deploying tech-nologies and ser-vices acquired inSI businesses
NTT DATA’s Business Value Chain
NTT DATA Mid-Term Management Policy—Aiming to
Create New Businesses
As more and more computer manufacturers become involved in
the solutions business, NTT DATA is being forced into fiercer
competition in its specialty, the System Integration (SI) business.
With the Internet’s expansion and diffusion into previously un-
imagined areas, customer requirements and desires are continually
changing. In fact, the very way that business is conducted is being
altered as the pace of technological progress continues unrelenting
and business-to-business (B2B) and business-to-consumer (B2C)
environments change dramatically.
Fully aware of the situation, we formulated and are currently
implementing the NTT DATA Mid-Term Management Policy,
which charts the course ahead for our operations over the next
three years, through March 2003. The policy’s design is for NTT
DATA to attain sustained growth and development and to create
new businesses that anticipate changes to come.
From a Solutions Provider to a Service Provider and IT Partner
The essential point behind the NTT DATA Mid-Term Manage-
ment Policy is this— as we aim to enhance our competitiveness in
our core competency, the SI business, we are developing our busi-
ness on three fronts. The traditional SI business represents one of
these fronts, and we are opening up two other fronts, as a “Service
Provider” with a substantial and devoted client base, and con-
structing a dynamic platform from which to respond to changes
in technology and the markets, and an “IT Partner,” a business-
creating powerhouse, both in alliance with our customers and
independently.
The policy envisages us becoming a major player by creating
and expanding an IT market for and by ourselves while looking
for synergistic effects between these three businesses and moving
to a new business model from our previous solutions provider
earning model, which only focused on our traditional SI business.
We believe that we have to think about and provide B2B from
the point of view of individual consumers, looking at B2C trends
and constantly forecasting with precision how consumers—the
customers of our customers—will change, the better to cultivate
our own B2B business.
Creating Internet-Related and Other New Businesses
The NTT DATA Mid-Term Management Policy focuses the Com-
pany’s priorities on the swift establishment of Internet-related and
other new businesses. In promoting this objective, we are devoting
our energies to initiatives that will make us a respected Service
Provider and IT Partner.
As a Service Provider—having assembled and vertically integrat-
ed a full line of services vital to the functioning of a networked
society in such areas as data-center and security services by pro-
viding optimized services to our customers—we differentiate our-
selves from competitors. We are providing quick response and
maneuverable services, mainly through subsidiary companies.
We are considering moving into such businesses as settlement
portals, which would leverage our traditional strengths in network
infrastructure, which are evinced by such systems as ANSER and
CAFIS.
Moreover, as an IT Partner we are concentrating our efforts
on the creation of previously untapped businesses through joint
investments and business alliances with our customers. We have
just begun to explore business development in this field through
such tie-ups as an outsourcing subsidiary we plan to set up with
First Data Corporation, a major credit card company, and a leading
credit process-outsourcing company, and with several large con-
struction companies we have set up a joint venture company
called Construction-ec.com Co., Ltd., in the launching of an
Internet-based marketplace for construction materials.
The growing popularity of the Internet is unstoppable, and has
even begun to affect the way that consumers live their lives. For
us, what is important is being able to anticipate the direction in
which things are moving. To launch new Internet-related businesses,
NTT DATA is impelled to consider every business measure at its
disposal, from M&A to alliances with powerful outside players
that have matching technologies. The Company must also focus
on the development of advanced technologies, based on a clear
and unerring evaluation of market and technology trends.
Accordingly, we are making ample investments in new busi-
nesses by improving our free cash flow through the rapid realiza-
tion of enhanced cash flow arising from our SI business and by
means of off-balance-sheet financing, such as improving the
liquidity of assets as well as operation management based on
cash flow.
We expect, through the promotion of new businesses, to also
enhance our SI business and attract new customers in our existing
public administration, financial, and industrial business sectors,
securing an even more advantageous position in the market.
4 Annual Report 2000
Enhancing Shareholder Value
The environment in which the NTT DATA Group operates is
distinguished by the emergence of new business opportunities
brought about not only by the Internet, such as the application
service provider (ASP) business, but also by a rash of new entrants
from other business sectors—and the transformations are only
going to become more pronounced.
Against this backdrop, the NTT DATA Group is striving to
improve growth and profitability through promoting and enhanc-
ing its new businesses by anticipating changes on the horizon. We
are also working to further improve our competitive strength in
our SI business and pressing ahead with initiatives that will raise
productivity and improve cost ratios.
Emphasizing improved capital efficiency and the importance
of shareholder value, the NTT DATA Group has added return on
equity (ROE) and free cash flow indexes to its traditional yard-
sticks—of management success, net sales, new orders received,
and ordinary income. In this way and others, we are promoting
heightened management awareness of shareholder value.
We are endeavoring to enhance corporate value across the
entire NTT DATA Group by pushing steadily and confidently
ahead with these programs. We look forward to the continued
support of all our shareholders in our efforts.
August 2000
Tomeo Kambayashi
Chairman of the Board
Toshiharu Aoki
President and Chief Executive Officer

M a k e i t Wo r k .
The IT revolution is unfolding on a global
scale. For the management of corporations
everywhere, IT is one of the principal fac-
tors shaping the future of business. There
is little doubt that in the 21st century, too,
the information services industry is going
to be one of the fastest growing industries
around.
Management
of corporations
is becoming
more efficient
and high-value-
added, and people’s lives are becoming
ever more comfortable as new services
made possible by IT blossom.
NTT DATA is responding quickly and
decisively to changes in the market and the
demands of our clients by deploying in
new areas the strengths we have acquired
through being Japan’s top corporation in
the information services industry. Our
track record in large-scale systems con-
struction in financial, public administra-
tion, and other sectors is proof positive of
our project management capabilities. We
have the technological resources and the
business-model solutions to succeed in
today’s growth
industries—
typified by the
Internet. What
is more, we are
reaping the syn-
ergistic benefits that come from a variety
of tie-ups with companies in the NTT
Group. Exploiting these advantages to
the fullest, NTT DATA will in the future
be doing everything in its power to secure
an unchallenged position as the industry
leader.
From a Solutions Provider
to
a Service Provider/
IT Partner
We L i s t e n , U n d e r s t a n d , a n d M a k e i t Wo r k .
5Annual Report 2000
While bringing into full play the synergies available from our three types ofbusinesses, we are developing business both upstream and downstream.
Strategic Planning
Systems Planning
Systems Design and Installation
Systems Maintenance andFacility Management
System Integrator
(SI Business)
IT Partner
Service Provider
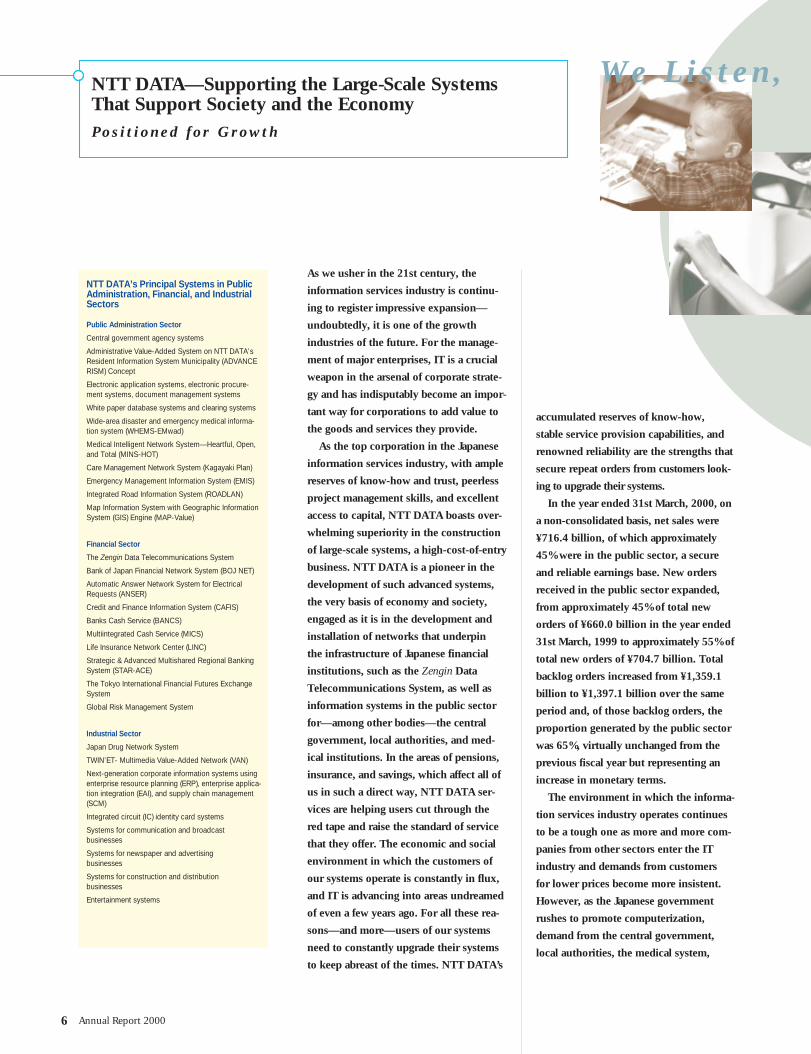
We L i s t e n ,NTT DATA—Supporting the Large-Scale Systems That Support Society and the Economy
P o s i t i o n e d f o r G r o w t h
As we usher in the 21st century, the
information services industry is continu-
ing to register impressive expansion—
undoubtedly, it is one of the growth
industries of the future. For the manage-
ment of major enterprises, IT is a crucial
weapon in the arsenal of corporate strate-
gy and has indisputably become an impor-
tant way for corporations to add value to
the goods and services they provide.
As the top corporation in the Japanese
information services industry, with ample
reserves of know-how and trust, peerless
project management skills, and excellent
access to capital, NTT DATA boasts over-
whelming superiority in the construction
of large-scale systems, a high-cost-of-entry
business. NTT DATA is a pioneer in the
development of such advanced systems,
the very basis of economy and society,
engaged as it is in the development and
installation of networks that underpin
the infrastructure of Japanese financial
institutions, such as the Zengin Data
Telecommunications System, as well as
information systems in the public sector
for—among other bodies—the central
government, local authorities, and med-
ical institutions. In the areas of pensions,
insurance, and savings, which affect all of
us in such a direct way, NTT DATA ser-
vices are helping users cut through the
red tape and raise the standard of service
that they offer. The economic and social
environment in which the customers of
our systems operate is constantly in flux,
and IT is advancing into areas undreamed
of even a few years ago. For all these rea-
sons—and more—users of our systems
need to constantly upgrade their systems
to keep abreast of the times. NTT DATA’s
accumulated reserves of know-how,
stable service provision capabilities, and
renowned reliability are the strengths that
secure repeat orders from customers look-
ing to upgrade their systems.
In the year ended 31st March, 2000, on
a non-consolidated basis, net sales were
¥716.4 billion, of which approximately
45% were in the public sector, a secure
and reliable earnings base. New orders
received in the public sector expanded,
from approximately 45% of total new
orders of ¥660.0 billion in the year ended
31st March, 1999 to approximately 55% of
total new orders of ¥704.7 billion. Total
backlog orders increased from ¥1,359.1
billion to ¥1,397.1 billion over the same
period and, of those backlog orders, the
proportion generated by the public sector
was 65%, virtually unchanged from the
previous fiscal year but representing an
increase in monetary terms.
The environment in which the informa-
tion services industry operates continues
to be a tough one as more and more com-
panies from other sectors enter the IT
industry and demands from customers
for lower prices become more insistent.
However, as the Japanese government
rushes to promote computerization,
demand from the central government,
local authorities, the medical system,
6 Annual Report 2000
NTT DATA’s Principal Systems in PublicAdministration, Financial, and IndustrialSectors
Public Administration Sector
Central government agency systems
Administrative Value-Added System on NTT DATA’sResident Information System Municipality (ADVANCERISM) Concept
Electronic application systems, electronic procure-ment systems, document management systems
White paper database systems and clearing systems
Wide-area disaster and emergency medical informa-tion system (WHEMS-EMwad)
Medical Intelligent Network System—Heartful, Open,and Total (MINS-HOT)
Care Management Network System (Kagayaki Plan)
Emergency Management Information System (EMIS)
Integrated Road Information System (ROADLAN)
Map Information System with Geographic InformationSystem (GIS) Engine (MAP-Value)
Financial Sector
The Zengin Data Telecommunications System
Bank of Japan Financial Network System (BOJ NET)
Automatic Answer Network System for ElectricalRequests (ANSER)
Credit and Finance Information System (CAFIS)
Banks Cash Service (BANCS)
Multiintegrated Cash Service (MICS)
Life Insurance Network Center (LINC)
Strategic & Advanced Multishared Regional BankingSystem (STAR-ACE)
The Tokyo International Financial Futures ExchangeSystem
Global Risk Management System
Industrial Sector
Japan Drug Network System
TWIN’ET- Multimedia Value-Added Network (VAN)
Next-generation corporate information systems usingenterprise resource planning (ERP), enterprise applica-tion integration (EAI), and supply chain management(SCM)
Integrated circuit (IC) identity card systems
Systems for communication and broadcast businesses
Systems for newspaper and advertising businesses
Systems for construction and distribution businesses
Entertainment systems

U n d e r s t a n d ,
and other public-sector institutions—
together with demand from financial and
other private sectors—is expected to con-
tinue to be robust. Against this backdrop,
NTT DATA is aiming for further increases
in profitability through cost ratio and pro-
ductivity improvement initiatives.
NTT DATA has been engaged in such
public-sector and financial-sector projects
as the Zengin Data Telecommunications
System, which links approximately 2,900
financial institutions across Japan and
facilitates interbank exchanges, and
the Wide-area disaster and emergency
medical information system (WHEMS-
EMwad), which has networked the emer-
gency medical information systems among
most prefectures and is designed to sup-
port relief and rescue operations in the
event of a major disaster covering an ex-
tensive area. This system was developed
based on the urgent recommendations of
the research committee formed to improve
the readiness of Japan’s medical system
for a disaster, prompted by the Great
Hanshin (Kobe) Earthquake of 1995.
NTT DATA has also been engaged in the
supply of numerous systems to central
government bodies in such areas as
finance, customs, transportation, and
computerized applications.
In addition to our work toward the
realization of a paperless electronic gov-
ernment, we have been focusing on the
construction of the NTT DATA Banking
Center for Regional Banks, in which six
regional banks are participating as of
June 2000.
The banks participating in the Center
have between them approximately ¥16 tril-
lion in assets, and it is already the largest
center of its kind in Japan. The Center
offers the latest system functions compati-
ble with such next-generation systems as
a centralized customer information sys-
tem that enables banks to undertake more
efficient marketing, flexibility in an era
characterized by the emergence of such
new delivery channels as the Internet, and
security measures that comply fully with
security standards established by supervi-
sory agencies and other bodies. The
results of a detailed investigation that
commenced in October 1999 show that
the Center operates at about half the cost
of most current systems. The results also
confirm that the banks using it have been
able to secure for themselves on a perma-
nent basis the very latest features. NTT
DATA constructs and operates such cen-
ters by leveraging its superlative track
record and many years of experience in
the field, having built and run not merely
account systems for numerous major
regional banks but also shared systems
for Shinkin banks and credit associations,
life insurers, and the STAR series of cen-
ters for regional banks. NTT DATA’s role
is not confined to being a systems out-
sourcer. In IT strategies, too, NTT DATA
offers its customers specific proposals and
suggestions through tie-ups with other
NTT Group companies and major con-
sulting corporations, and it is forging
ahead with the construction of shared
infrastructure in the busily reorganizing
world of finance.
7Annual Report 2000
NTT DATA Net Sales by Sector (as of March 2000)
The PublicAdministrationSector 45%
The IndustrialSector
25%
The FinancialSector
30%

The markets in which NTT DATA does
most of its business have undergone dras-
tic changes in the last two years. The
biggest change of all has been the explo-
sive increase in use of the Internet. It has
made its way into our everyday lives, and
customer expectations and entire indus-
tries have been forever changed. Our cus-
tomers’ business processes are changing
and the whole structure of the industry is
in upheaval.
As these changes advance, new busi-
ness opportunities arise. It is no longer
enough to follow the traditional pattern of
merely offering solutions by responding
to individual needs; what is needed is a
mold-breaking service provider paradigm.
NTT DATA, as a leading corporation in
Japan’s information services industry, has
accumulated the know-how that matters
in the construction of large-scale systems
deploying SI. In search of new growth,
NTT DATA is constructing a new busi-
ness value chain revolving around the
Internet, bringing its customers full-line
services as a Service Provider and devel-
oping its business Groupwide. With
these core strategies, NTT DATA is
actively investing management resources
in new areas.
We are aiming for an expansion of the
fields in which we as a Group do business
by enhancing the competitiveness of both
NTT DATA and our subsidiaries,
strengthening our new business profile
through M&A and alliances, and estab-
lishing subsidiaries according to function.
At the same time, we are looking to opti-
mize the distribution of management
resources and rebuild our internal busi-
ness portfolio.
In Internet-related businesses, we have
already begun to advance our various Ser-
vice Provider businesses, in particular our
Internet service provider (ISP) and appli-
cation service provider (ASP) businesses.
Of particular note are our ISP, DreamNet,
and office goods procurement service
for corporations, “orderit.” In these and
dozens of other ways, NTT DATA is deliv-
ering results in e-commerce business
solutions.
8 Annual Report 2000
New Businesses—Coming to Grips with Fast-Paced Market Changes
S o a r i n g t o N e w H e i g h t s
ECSP(E–Commerce Service Provider)
ASP(Application Service Provider)
CSP(Computer Service Provider)
ISP(Internet Service Provider)
SSP(Security Service Provider)
NSP(Network Service Provider)
Offerin
gO
ur
Cu
stomers
Op
timal
Services
Service Layer Service Menu
Security Authentication
Data Center
Networks
Applications
Infrastructure
We are maintaining our superiority by offering our customers full-line, IT-based services and byvertically integrating every layer of our service menu.
NTT DATA, Service Provider
NTT DATA’s Principal Service Systems inInternet-Related or Advanced InformationNetwork Services
orderit, an office supply procurement service for corpo-rations
i.commerce sellside, an e-commerce package solution
Machiko, an on-line marketplace and virtual communityfor women
magnet, a cyber community for children and parents
GAMER’S DREAM, a multiplayer, members-only net-work game service
Sankenjin, a healthy lifestyle promotion service
IC identification card multisolution
DreamNet, an Internet service provider, in conjunctionwith NTT DoCoMo, Inc.
InterVia, an Internet service provider for corporations
ASPORT, an applications service provider
Hosting and housing services
Easy&Safe, a comprehensive security service
DBN, a network provider service
NI+, a network integration service
Platform system for digital broadcasting
Marketing Analysis and Planning System (Meal MAP)
Intercompany e-commerce systems
a n d M a k e i t W o r k .
In the computer service provider (CSP)
and security service provider (SSP) fields,
too, NTT DATA is establishing a firm
business foothold. Specifically, as a CSP
we are moving ahead with the construc-
tion of a large Internet data center that
will host and manage servers of clients
who are expanding their own e-commerce
and ASP businesses by leveraging our net-
work and data center buildings. Services
are expected to commence in October
2000. We plan to offer highly reliable
service covering all the bases, including
ASP functions, through alliances with
companies with the right technology as
well as the deployment of our experience
and know-how as a large-scale system
integrator.
As one of Japan’s foremost SSPs, we are
putting into place a 360-degree security
service. This will uniquely position us to
respond to the growing security needs that
come hand-in-hand with the ever-evolving
Internet and are required to protect corpo-
rate computer systems from every kind of
menace, including improper accessing of
sensitive information. Specifically, we are
working in close collaboration with NTT
DATA Security Corporation, a joint venture
set up in partnership with Trend Micro
Inc., Hitachi, Ltd., Cisco Systems K.K.,
and other leading information content
security companies. This collaboration
will enable everything from the drafting
of security policy plans to system design,
construction, management, surveillance,
auditing, and diagnosis—comprehensive
service supporting every aspect of our cor-
porate customers’ information systems
security throughout the life cycle of the
system.
Although these new businesses have
extremely promising growth potential,
competition is intensifying with the entry
of more and more businesses from other
9Annual Report 2000
Alliances as an IT Partner
sectors and we anticipate that it will take a
few years before these promising business-
es begin to make a significant contribution
to profits. However, by adapting to market
trends, applying the latest technology to
our existing SI business, and expanding
into new businesses, such as those that
exploit the potential of the Internet, we are
adding value to the services we offer and
establishing a comprehensive circle linking
our existing and new business areas. All of
this is helping to secure an even brighter
future for the NTT DATA Group.
In August 2000, NTT DATA, together with six other
companies—Kajima Corp., Shimizu Corp., Taisei
Corp., Obayashi Corp., Takenaka Corp., and
Oracle Corp. Japan—established Construction-
ec.com Co., Ltd., a joint venture to build a con-
struction materials Web site and marketplace on
the Internet. From December 2000, the joint ven-
ture will provide marketplace services using the
Internet to support the lease and rental of materi-
al and equipment for temporary and permanent
construction, from estimates to orders, billing,
and payment. Collectively, we are aiming to bring
together NTT DATA’s coordinating skills, IT capa-
bilities, and the construction business know-how
of major general contractors as well as make the
procurement of construction materials and equip-
ment a more open process, thereby setting a new
standard for the industry.
NTT DATA has reached an agreement with U.S.-
based First Data Corporation, the world’s largest
credit card outsourcing company, DC Card Co.,
Ltd., a major credit card company, and Diamond
Computer Service Co., Ltd., to carry out research
and preparations for establishing a joint venture
offering outsourcing services in Japan to domes-
tic credit card companies. By combining NTT
DATA’s IT competencies and the know-how
of its partners, we will provide competitively
priced, high-quality outsourcing services to the
credit card market, where growth is continuing
but competition is intensifying. Our goals are to
capture 30% or more of the domestic market in
terms of numbers of cards issued within five
years and for the joint venture to be the largest
outsourcing service company in Japan.

Review and Outlook
The NTT DATA Group previously has not
released segment information by business
type because the Group provides services
relating to data communications systems,
a single segment. From the fiscal year
under review, however, we determined
that in the interests of providing you, our
shareholders, with more useful informa-
tion concerning our activities, we would
divide services relating to data communi-
cations systems into three segments—
System Integration, Network System
Services, and Others—chosen in consider-
ation of the similarity of the markets and
the type and nature of the services we
offer. The reason these particular seg-
ments have been chosen is closely allied
to the effective implementation of NTT
DATA’s current management policies,
which stress enhancing the Group’s pres-
ence in new business areas and further
strengthening its competitiveness in the
SI business.
System Integration
The System Integration (SI) Business
develops data communications systems,
sells and leases them, and provides system
integration and other services, all in align-
ment with the needs of individual clients.
In the period under review, this Busi-
ness continued to offer its traditional
customers stable and reliable services,
upgrading their existing systems where
requested, and also furnished customers
with entirely new systems.
As a result, in the year ended March
2000, net sales to external customers
amounted to ¥583.7 billion and operating
income amounted to ¥53.4 billion.
The SI Business is the NTT DATA
Group’s earnings engine, but competition
in the industry is likely to grow fiercer in
the coming months and years as business-
es from other sectors enter it in increasing
numbers and customers demand ever
more competitive prices. The NTT DATA
Group is aiming to strengthen the Busi-
ness’s competitiveness by cutting costs
and establishing policies designed to
expand earnings further.
Specifically, we are developing this
Business by placing more stress than
ever before on a program of selection
and concentration. We are offering more
high-value-added services by strengthen-
ing upstream processes in cooperation
with businesses both inside and outside
the NTT Group. We are also making the
best use of our strengths in preexisting
business areas, exemplified by our activi-
ties in the public administration sector
and the provision of account settlement
10 Annual Report 2000
Others
80.5%(¥583.7 billion)
6.7% (¥48.7 billion)
System Integration
¥725.3billion
Network SystemServices
12.8%(¥92.9billion)
P Composition of Net Sales to External CustomersFor the year ended 31st March, 2000
Segment by Net Sales Operating IncomeBusiness Type Main Products and Services (billion ¥) (billion ¥)
System Data Communications Service for 586.8 53.4Integration specific customers and Systems
Development Service
Network CAFIS, ANSER, Internet-related 49.1 4.6System business, line resale, and other Services businesses
Others Consulting, maintenance, operation, 103.5 6.2installation, facility management, and other businesses
Elimination (14.1) (13.5)or Corporate
Consolidated 725.3 50.7
networks in the financial sector. By turn-
ing alliances and M&As to good account,
we are entering previously uncharted
business areas, expanding the types of
customers that we serve, and realizing an
early acquisition of know-how. By taking
such measures, we are aiming for a general
expansion of scale, making our SI base
firmer than ever before.
At the production stage, as part of our
cost-cutting activities, we are pressing
ahead with policies that will increase pro-
ductivity and improve initial costs, and
we are simultaneously introducing rigor-
ous risk management methods. Across
the Group, we are carrying out structural
reforms in our regional businesses and
operating and maintenance businesses as
well as sharing tasks more efficiently with
our subsidiaries. We are also paring costs
by expanding outsourcing in our back
office departments and consolidating
departmental functions.
We anticipate that net sales to external
customers in the next fiscal period will rise
year on year approximately 8%, to ¥631 bil-
lion, reflecting a steady rise in new orders
received as of 31st March, 2000.
Network System Services
In line with the demands of the market,
the Network System Services Business
provides such services as information pro-
vision, data processing, and other services,
with the base of its business focused on
such computer networks as the Internet.
In the period under review, the
Business worked hard to strengthen its
ISP business and directed its attention to
the construction of a new business model.
As a result, in the year ended 31st
March, 2000, net sales amounted to ¥48.7
billion and operating income amounted to
¥4.6 billion.
The NTT DATA Group has high hopes
for the substantial future growth of new
business, particularly in Internet-related
and network systems, and is consequently
taking steps to reconstitute its business
portfolio, optimize the allocation of its
management resources, and form alliances
with other companies. Specifically, we
established a team to formulate a new
business model and we are currently look-
ing to strengthen the functions of devel-
oping new business models. At the same
time, we have reviewed our traditional
operational system, which was divided by
customer market, and established an orga-
nizational framework to facilitate expan-
sion into new business areas efficiently
and effectively while responding to
requirements that cut across market types.
Moreover, the Business is aggressively
expanding into such new fields as the
Service Provider and IT Partner fields
through collaboration with subsidiaries
and affiliates, independently managing
developments with speed and purpose.
We are fostering a business environment
that makes innovation possible and creat-
ing an environment in which new busi-
nesses can be launched by consolidating
the infrastructure sections and back office
operations of internal company ventures.
We predict that net sales in this Busi-
ness will rise approximately 9% year on
year, or ¥53 billion, due to the growth of
new Internet-related business.
Others
The NTT DATA Group’s Others Business
researches, identifies, and evaluates cus-
tomers’ management issues, plans and
provides solutions on the optimization of
data communications systems, performs
maintenance and facility management,
and provides other related services.
In the period under review, the Others
Business was proactively engaged in con-
sulting work and achieved systems stabi-
lization through network and terminal
operation and maintenance.
As a result, in the year ended 31st
March, 2000, net sales amounted to
¥92.9 billion and operating income
amounted to ¥6.2 billion.
We anticipate that prospects for
the next period will be vulnerable to a
decrease in sales in certain parts of our
systems management and maintenance-
related business, and that, as a result,
net sales will fall 3% year on year, to
¥90 billion.
11Annual Report 2000

Review and Outlook by Sector
We continue with our analysis by lookingat how our three business segments—System Integration, Network SystemServices, and Others—performed collec-tively in the four principal sectors inwhich NTT DATA operates.
Public Administration SectorIn the year ended 31st March, 2000, theCompany achieved its targets in thePublic Administration Sector for net salesand the amount of new orders received.
This was made possible by our effortsto secure new business in SI services, inaddition to our trailblazing move intoperipheral businesses, as well as steadyorders for upgrades of existing systemsand large-scale systems, demand for whichwas supported by heavy investment in ITon the part of the central government,local authorities, and other public agen-cies. In September 1999, NTT DATA setup a Public Administration Community Business Sector, a new organization, toexpand its services for local authoritiesand industries.
Government investment in IT is expect-ed to rise, based on the continuing trendtoward expansion, supported by theDecember 1999 delivery by the VirtualAgency task force to the Prime Minister ofa final report on the desirability of a shiftto a wired, paperless administration andthe importance that is being attached toan important agenda called the “Millen-nium Project,” which brings together aca-demics, industrialists, and civil servants toadvise on policies for the new millenniumin IT and other areas.
NTT DATA strongly supports the agen-da, and is making active proposals andplans to introduce paperless administra-tion, electronic applications, and electron-ic procurement, making “ElectronicGovernment” and “ElectronicMunicipalities” its watchwords.
P What is “Electronic Government”?“Electronic government” as a conceptrefers to the computerization of the ser-vices that government and municipalitiesprovide and the delivery of these servicesby means of computers and networks.
Financial SectorDuring the year ended 31st March, 2000,net sales in the Financial Sector werebrisk as demand for upgrades of existingaccount systems was stable and the Com-pany’s Network System Services Businesswas favorable. The target of new ordersreceived was achieved as it secured a num-ber of important new projects.
In the coming years, e-commerce isforecast to develop further and financialinstitutions to increasingly recognize theneed to reduce costs in their core busi-nesses while new entrants to financialbusiness, stimulated by deregulation,make their presence felt.
NTT DATA plans to focus its attentionon expanding sales of its shared systems,bringing into play the know-how theCompany has accumulated in similar sys-tems with a proven track record of suc-cess in the industry. At the same time, weplan to move into new financial networkbusinesses in the capital market, debit
12 Annual Report 2000
Applications for Electronic GovernmentE-Applications, E-Statistics, E-Procurement,
E-Voting, One-Stop Service, Information Disclosure
Document infrastructure
Payment infrastructure
Authentication infrastructure
Network infrastructure
DocumentManagementInfrastructure
inAdministrative
office
CitizensAdministration
All information transfersb/w citizens and admin-istration electronically
Interface ensuringsettlement transactions
regardless of formof payment
Identity confirmationbased on a digitalcertificate of seal
impression
Security measuresdesigned to defend
against unauthorizedaccess
Information accumulation and utilization/computerizing
irregular work (non-routine work)
0
10
20
30
40
50
60
’00’99’98’97’96
0
10
20
30
40
50
60
Public Administration Sector
Sales (%)
New Orders (%)
0
10
20
30
40
50
0
10
20
30
40
50
Financial Sector
Sales (%)
New Orders (%)
(non-consolidated basis)
(non-consolidated basis)
’00’99’98’97’96
’00’99’98’97’96
’00’99’98’97’96
P Toward Electronic Government

cards, and Internet-based transactions,including Electronic Bill Presentment andPayment Service. These businesses arejust a few of the areas we have earmarkedfor expansion.
P Electronic Bill Presentment andPayment (EBPP) Service—Outline
Through EBPP, customers can obtaininformation regarding their gas, water,electricity, and telephone bills, and cancheck their credit cards’ itemized balancesheets, the current state of accounts theyhold with financial institutions, andrecent deposits and withdrawals on thoseaccounts—all without having to leavehome, thanks to the convenience of theInternet. They can even obtain guidanceand information about services of interestto them from the companies concerned.
NTT DATA formed an “Internet Billing Information Service Consortium”with NTT Communications Corp. andMicrosoft Corporation, in July 1999, and now is examining and planning an EBPPbusiness model suitable for the Japanesemarket.
Industrial Sector In the Industrial Sector, both new ordersreceived and net sales were strong overallin the year ended 31st March, 2000, as theCompany focused its efforts on courtingnew customers as well as orders for up-grading and replacing existing systems,having reorganized its operations accord-ing to industry type. In September 1999,the Company put in place an operationalstructure designed to carve out newInternet-related business and, in March2000, established an operational structureto strengthen the Company’s approach inenterprise application integration (EAI),which organically consolidates corporatedata applications. We are looking for stillgreater success in enterprise resource plan-ning (ERP), and to that end we acquiredmanagerial control over a company with aproven track record in the field, relaunch-ing it as NTT DATA Science Corporationin October 1999. We are also taking afresh approach to platform systems fordigital broadcasting, working hard to
realise our goal of making these systemsthe basis of a highly advanced system.
Looking to the future, we intend to bolster our position in next-generationcorporate data systems by the intelligentdeployment of ERP, EAI, supply chainmanagement (SCM), and strategic con-sulting, and we will actively pursue thedevelopment of our Internet and platformsystems businesses as well as the cultiva-tion of new clients.
P Platform Systems for DigitalBroadcasting
The digitization of broadcasting is givingadded impetus to the development of truly interactive broadcasting. Digitalbroadcasting platform systems link thebroadcaster, the audience, financial insti-tutions, and the information provider (IP)or the service provider (SP), enabling theviewer to pay for items bought while TVshopping and also make requests forinformation about products seen onTV commercials from the comfort ofhis or her armchair as the platform system handles the transaction andaccount processing.
Advanced Information NetworkServices SectorNet sales in the Advanced InformationNetwork Services Sector were buoyant,supported by the expansion of the e-commerce market and the increasingnumber of Internet users. As the Internetcontinues to develop and spread at abreathtaking pace, the e-commerce mar-ket will expand still further. NTT DATAis optimistic about the potential of suchnew high-value-added Internet servicesas security provision relating to Internetusage by corporations in their mission-critical operations. Thus, NTT DATA isworking hard to expand its field of opera-tions by entering into such new businessareas as Internet security provision, whileseriously committing to its ISP businessthrough the formation of a subsidiary,DreamNet Corporation, the subjectof a joint equity investment with NTTDoCoMo, Inc. Moreover, NTT DATAis launching many other new services,
including ASPORT, an application serviceprovider (ASP) for corporate businessprocesses, and Sankenjin, a health promo-tion and lifestyle support service.
NTT DATA will organize its Internet-related businesses under the name xSP,and in the future will continue to be afull-line service provider in all informa-tion service settings.
P Internet Service Provider (ISP)—DreamNet
DreamNet is a major player in theInternet connection service business.Using the technological capabilities ofNTT DATA and NTT DoCoMo, Inc.,DreamNet offers highly reliable and user-friendly Internet access and a diversity ofservices perfectly suited to the needs ofmobile phone users.
13Annual Report 2000
0
10
20
30
40
50
’00’99’98’97’96
0
10
20
30
40
50
Industrial Sector
Sales (%)
New Orders (%)
(non-consolidated basis)
’00’99’98’97’96

International Business Strategy
Since its founding, the Company has
aimed to seize new business opportunities
and carve out new markets globally. We
now have branches in the United Kingdom,
Hong Kong, and Malaysia and wholly
owned subsidiaries in the United States
and China, and are striving to take our
international business to new heights.
Following are the key policies that will
help us to achieve this:
• Linking international projects to our
domestic businesses
• Localizing our overseas bases and using
them as a fulcrum to develop our local
businesses
• Collecting information and importing
state-of-the-art technology from the
advanced markets of the United States
and Europe
• Promoting software development in
Asia
Business Operations in Asia
In Asia, where IT needs are growing
explosively, we are making effective use
of our local bases, such as our branches
in Hong Kong and Malaysia as well as
subsidiaries in China, and engaging in
the development of systems that under-
pin modern society.
In China, NTT DATA has won a suc-
cession of important orders: in June 1994
for the Ministry of Posts and Telecommu-
nications (MPT) Beijing Postal Financial
Network System, in January 1995 for the
National Postal Financial Clearance and
Network System, in October 1995 for a
smart ID card system for employees of the
Beijing People’s Municipal Government,
and in November 1996 for the China
National Automated Payment System for
the People’s Bank of China. NTT DATA
has also been involved in information sys-
tem trials for an intelligent building in
Shanghai and in Electronic Road Pricing
System trials in Hong Kong.
In Southeast Asia, the Company won
an order for an intelligent database cus-
toms system in Indonesia in December
1997. The Company also won an order
for an electronic procurement system for
the Multimedia Super Corridor Project in
Malaysia in July 1999, which is currently
being developed and implemented.
Business Operations in Europe
and the United States
To build a U.S. base from which to nurture
businesses linked to its domestic opera-
tions, in April 2000 NTT DATA made its
U.S. branch a wholly owned subsidiary,
NTT DATA USA L.L.C., and simultane-
ously established a U.S. holding company,
NTT DATA International L.L.C., to super-
vise and manage the Company’s sub-
sidiaries in the United States.
NTT DATA also engages in a variety
of joint R&D activities in Europe and
the United States, which have highly
advanced computer-related technologies,
and imports world-class software pack-
ages from those countries.
14 Annual Report 2000
P NTT DATA Overseas Operations (as of 31st March, 2000)
U.K. BranchBusiness: information collection and analysis
Beijing Zhong Ban Ri XunInformation SystemsIntegration Co., Ltd. Business: systems develop-ment, sales, maintenance
NTT DATA (China)CorporationBusiness: systems design,development, maintenance
Beijing NTT DATA SystemsIntegration Co., Ltd.Business: systems develop-ment, operation, maintenance,systems engineer dispatch
Hong Kong BranchBusiness: project support,information collection andanalysis
Shanghai Venus SoftwareCo., Ltd.Business: systems develop-ment, operation, mainte-nance, systems engineerdispatch, etc.
Malaysia BranchBusiness: project support, informa-tion collection and analysis
NTT DATA USA L.L.C.Business: facility manage-ment services, information collection and analysis
NTT DATA International L.L.C.
First Data Systems Inc. Business: systems construc-tion, hardware sales
M.I.S.I. Co., Ltd.Business: SE dispatch,hardware sales, systemconsulting
Technical Center ofCaliforniaBusiness: high technolo-gy information collectionand analysis

The NTT DATA Group’s R&D activities
revolve around the Company’s Research
and Development Headquarters and
Research Institute for System Science,
where it forges ahead with an array of
R&D programs to create new businesses.
NTT DATA has benefited from an R&D
tie-up with NTT in the field of fundamen-
tal research. Putting the results of that
R&D to effective use, the NTT DATA
Group is concentrating its resources on
applied R&D themes.
R&D expenses for the fiscal year
totaled ¥22,684 million. The principal
R&D activities in which the Group is
currently involved are as follows:
Opening Up New Business Fields
Development Technology for a New
Business Model Utilizing Information
Networks
For businesses where the consumer rules,
NTT DATA has been developing a tech-
nology that makes it easier than ever before
to carry out consumer profiling, collect
Internet site access information, and ana-
lyze the resultant data. We have also been
working to develop a technology that opti-
mizes document information usage, such
as through the development of a model
that computerizes administrative applica-
tion and registration processes and makes
possible “one-stop filing” on the Internet.
This technology cuts across the jurisdic-
tions of a number of ministries and ren-
ders separate filing with individual
ministries a thing of the past.
We have also developed new tech-
niques and components to quickly build
Internet services.
Integration Technology for Social Systems
With the advent in Japan of digital broad-
casting, we have been pursuing R&D in
advertising services that blend telecom-
munications and broadcasting technolo-
gies as well as moving-image delivery
systems for interactive broadcasting. We
exhibited these systems at World Telecom
’99, held under the auspices of the Inter-
national Telecommunications Union, in
Geneva, Switzerland. The Company is
also conducting R&D on a system that
in the event of a disaster will provide
accurate, timely information on the state
of events surrounding the disaster to
increase safety and the speed of response
in rescue activities. This will be accompa-
nied by bringing together cartographic
and satellite imaging data technologies to
complement such existing information
transmission technologies as telephone
and data communications.
Expanding the Foundations of Systems
Architecture
RASIS—Reliability, Availability,
Serviceability, Integrity, Security
NTT DATA has evolved a highly effective
design method, RASIS, through the analy-
sis of the service risk of such large-scale,
backbone systems as those used by banks
for account services, an area that calls for
high standards of reliability and operabili-
ty, and through verification tests for relia-
bility and availability. We are progressing
with R&D in the provision of services that
link multiple systems using NTT’s distrib-
uted object software packaging technology.
We have also formulated guidelines for
the development of highly secure systems
based on ISO 15408 Common Criteria,
international standards for the security
appraisal of IT systems.
Areas for Common Technology
We are carrying out research in systems
development with applications in smart
ID cards equipped with integrated circuits
(ICs) that can satisfy all the functions
required of an identity verification system.
In line with this, we are also conducting
research in technology that can verify that
an image is the original and not a copy by
means of digital watermarks and surveil-
lance features.
15Annual Report 2000
R&D
Society and the Environment
Today, there are increasing demands
made on corporations to exist for more
than the single-minded pursuit of prof-
itable business; they are expected to fulfill
their social responsibilities as members of
a wider, international society by engaging
in activities that do not directly contribute
to profits. NTT DATA is in full accord
with these demands, and energetically
involves itself in environmental preserva-
tion activities as well as a broad range of
social and cultural programs.
Contributions to Society
NTT DATA’s corporate philosophy stress-
es the importance of assisting in “the real-
ization of happiness” and “the creation of
culture” by adding value to information
and contributing—through the Com-
pany’s corporate social activities—to
“building a new society, building the
future.” NTT DATA engages in a wide
variety of cultural, social, and other
activities based on this philosophy. They
can be classified into four basic areas of
endeavor—corporate donations, volunteer
activities, sponsorship of artistic and other
events, and environment-preservation
activities. For instance, most of our
employees participate in Christmas charity
fund-raising activities, help promote the
use of recycled products, conscientiously
separate used paper from other rubbish for
recycling, and donate computers made
redundant by newer models to volunteer
organizations or the handicapped.
In sponsorship of artistic activities,
we have held classical music concerts, the
NTT DATA Concert of Concerts, annually
since 1995, a program of free classical
music entertainment for the public. We
are also active in our support and pro-
motion of all manner of sports.
As a member of the communities where
we operate, we also enthusiastically pro-
mote exchanges between our employees
and local citizens. Every year, we hold
courses for local citizens in Tokyo’s Koto
Ward, where our head office is located,
and Meguro Ward, where our training
institute is located, on how to use PCs
for the first-time user or creating a home
page for enjoying the Internet in daily life.
We have also collaborated in hosting
Company tours for junior high school stu-
dents so that they can experience directly
for themselves the rewards and impor-
tance of honest work—in this and many
other, varied ways we conduct corporate
social activities in line with themes that
are specific to NTT DATA’s corporate
philosophy.
Environmental Preservation Initiatives
The impact on people’s daily lives of envi-
ronmental destruction is growing, and
corporations have a social responsibility
to take action and deliver on policies to
protect the environment. We are of the
opinion that our information systems act
as a substitute for the actual movement of
people and commodities, and in that way
reduce the burden placed on the environ-
ment and contribute directly and indirect-
ly to environmental preservation. At the
same time, it is undoubtedly true that in
the construction of information systems
a great deal of energy and resources are
consumed, and the systems themselves
have a not insignificant impact on the
environment.
In light of this, NTT DATA regards it as
imperative that, to fulfill its social respon-
sibilities, it remain constantly aware of the
need to protect the environment in the
conduct of its business. We are concen-
trating our activities in three particular
areas: obtaining ISO 14001 certification,
heightening environmental awareness
among our staff, and raising the Com-
pany’s presence in environmental issues.
In April 1998, we set up the Eco-
Activity Promotion Office and, through
this body, are developing our environ-
mental preservation activities in such
areas as electricity and paper conservation
initiatives, green purchasing, the develop-
ment of environment-friendly systems
and materials—and the machines used
in those systems—and the establishment
of environment management systems
(EMS.) These activities bore fruit when,
in July 1999, NTT DATA’s Headquarters,
the Toyosu Center Building, and NTT
Shinagawa TWINS Data Building acquired
ISO 14001 certification. NTT DATA plans
to extend the scope of such certification
to include its other buildings in the Tokyo
metropolitan area and its branches
nationwide.
16 Annual Report 2000
NTT DATA’s Environmental PreservationLogo “The Kindness of the Earth”

17Annual Report 2000
Financial Section
Thousands ofMillions of yen U.S. dollars
1995 1996 1997 1998 1999 2000 2000
Net Sales ¥479,939 ¥562,227 ¥611,603 ¥676,581 ¥ 710,152 ¥ 725,348 $ 6,842,906
System Integration — — — — — 586,829 5,536,123
Network System Services — — — — — 49,108 436,283
Others — — — — — 103,539 976,783
Elimination or Corporate — — — — — (14,128) (133,283)
Cost of Sales 342,907 402,581 447,184 497,713 522,190 539,715 5,091,651
Operating Income 43,866 55,411 51,862 54,197 56,833 50,738 478,660
Income (Loss) before Income Taxes 20,647 25,898 34,355 34,275 37,747 (29,177) (275,255)
Net Income (Loss) 7,122 11,671 14,241 15,612 16,313 (18,114) (170,887)
New Orders Received — — — — — 714,882 6,744,170
Property and Equipment, at Cost 702,335 754,971 858,051 932,566 1,069,069 991,547 9,354,217
Less: Accumulated Depreciation (306,690) (361,047) (433,303) (50,864) (551,688) (565,383) (5,333,802)
Total Assets 723,968 814,046 854,386 900,693 1,002,805 1,071,653 10,109,934
Long-Term Debt 397,005 364,320 352,290 364,152 372,519 382,229 3,605,934
Total Liabilities 673,696 631,741 660,671 693,968 632,662 706,739 6,667,349
Total Shareholders’ Equity 49,408 181,397 192,816 205,799 369,244 363,758 3,431,679
Capital Expenditures — — — — — 210,375 1,984,670
Research and Development Expenses 12,354 14,391 14,783 15,874 14,042 22,684 214,000
Return on Sales (%) 1.5 2.1 2.3 2.3 2.3 (2.5) —
Return on Equity (%) 14.4 10.1 7.6 7.8 5.7 (4.9) —
Return on Assets (%) 1.0 1.5 1.7 1.8 1.7 (1.7) —
Free Cash Flow — — — — — (23,763) (224,179)
EBITDA — — — — — 203,263 1,917,575
EBITDA Margin (%) — — — — — 28.0 —
Yen U.S. dollars
Per Share:Net Income (Loss) ¥ 35,608 ¥ 52,212 ¥ 56,288 ¥ 61,708 ¥ 5,905 ¥ (6,458) $ (60.92)
Shareholders’ Equity 247,041 716,984 762,119 813,436 131,638 129,682 1,223,415
Number of Employees — — — — — 10,500 —
Notes: (1) EBITDA refers to operating income before deducting depreciation and amortization/loss on disposal of property and equipment
and intangibles.
(2) EBITDA margin refers to EBITDA divided by net sales.
Consolidated Six-Year SummaryNTT DATA CORPORATION AND SUBSIDIARIESYears ended 31st March

18 Annual Report 2000
Overview of Business ResultsAs was outlined earlier in this annual report, the volatile Japanese economic situation, the ITrevolution—driving corporate computerization and increased appetites for investment—and the dramatic increase of new players, especially computer manufacturers involved in theinformation service industry, are all emblematic of the intensity of the changes taking place inthe NTT DATA Group’s business environment.
Against this backdrop, the NTT DATA Group formulated two key policies: to enhance itsmanagement capabilities so that more attention is paid to investment efficiencies, the goalbeing to secure optimal profits; and to commit positively to new businesses for greater medium-and long-term expansion. Simultaneously, we are developing our business through closeworking partnerships with other companies in the NTT Group. Specifically, we are movinginto new businesses and pushing ahead with the expansion of the services we offer our clientsin response to the imperatives of the times.
Reflecting our various initiatives, consolidated net sales for the year ended 31st March,2000 edged up 2.1%, to ¥725.3 billion. However, as a result of a substantial amount of one-offlosses associated with changes to accounting procedures introduced along with revisions toaccounting standards, NTT DATA was obliged to record a net loss of ¥18.1 billion.
Free cash flow amounted to a net cash outflow of ¥23.8 billion, due to active capital investmentto secure future profitability. Cash dividends paid to shareholders were unchanged from theprevious term, at ¥1,000 per share, which include interim cash dividends.
As a consequence of thoroughgoing countermeasures taken by us as a whole to avert anypotential Year 2000 problems, no malfunctions or other issues arose that had any significanteffect on profitability.
Sales Consolidated net sales for the period under review amounted to ¥725.3 billion, a slight rise of2.1%, or ¥15.2 billion, compared with the previous period, the marginal nature of the rise dueto a tightening of service starts for large-scale systems and system upgrades, compounded by arescheduling of some system service starts for the next fiscal period. Net sales to external customers by segment were as follows.
The NTT DATA Group’s System Integration (SI) Business, which develops, sells, leases, and services data communications systems tailored to the needs of individual customers, reported net sales of ¥583.7 billion. The SI Business continued to offer its tradi-tional customers stable and reliable services while providing upgrades to existing systems and also furnished customers with new systems. These efforts are reflected in the sales figures.
In line with market demands, our Network System Services Business provides such servicesas information provision, data-processing, and other services, with the base of its businessfocused on computer networks related to the Internet. In the period under review, we workedhard to strengthen our ISP business in this segment and directed our attention to the construc-tion of a new business model. As a consequence, net sales amounted to ¥48.7 billion.
NTT DATA’s Others Business is to research, identify, and evaluate customer managementissues, plan and provide solutions on the optimization of data communications systems, per-form maintenance and facility management, and provide other related services. In fiscal 2000,the Others Business was proactively engaged in consulting work and achieved systems stabiliza-tion through network and terminal operation and maintenance. As a result, in the year ended31st March, 2000, net sales amounted to ¥92.9 billion.
New orders received in the period under review amounted to ¥619.5 billion in the SIBusiness and ¥95.4 billion in the Others Business, making total new orders received ¥714.9billion. Order backlog amounted to ¥1,374.0 billion in the SI Business, and ¥27.8 billion inOthers business, making total order backlog ¥1,401.8 billion.
Cost of Sales and Other Income (Expenses)Cost of sales (cost of goods sold) in the period under review amounted to ¥539.7 billion, a riseof 3.4%, or ¥17.5 billion, compared with the previous period, which was higher than the 2.1%rise in net sales. The increase in cost of sales was attributable in part to an increase in costs
Financial Review
’96 ’97 ’98 ’99 ’00
Net SalesCost of Sales
0
100
200
300
400
500
600
700
800
’96 ’97 ’98 ’99 ’00
Operating IncomeOperating Income Margin (%)
0
10
20
30
40
50
60
0
2
4
6
8
10
12
Net IncomeNet Income per Share (Yen)
’96 ’97 ’98 ’99 ’00–20
–15
–10
–5
0
5
10
15
20
–10,000
0
10,000
20,000
30,000
40,000
50,000
60,000
70,000
1
1
Net Sales and Cost of Sales
Operating Income andOperating Income Margin
Net Income and Net Income per Share
Note: A change in par value from ¥50,000 to ¥5,000 went into effect on 1st August, 1998.Net income per share for the fiscal year ended 31st March, 1999 reflects the stock
split at the beginning of the period.
(Billions of yen)
(Billions of yen) (%)
(Billions of yen) (Yen)

19Annual Report 2000
caused by the readjustment of some systems, in addition to an increase in costs in proportionto the increase in earnings. Looking at expenses by type, cost of sales was affected by rises insuch fixed costs as depreciation and amortization, due to systems renewal, and transfers froma part of selling, general, and administrative expenses, or SG&A expenses, due to more appro-priate cost accounting of welfare expenses related to Company housing. As a result, the cost ofsales ratio rose 0.9 percentage point, from 73.5% to 74.4%. Regarding the increase in costs ofcertain projects, the Company is working hard to avoid its repetition by implementing policiesdesigned to prevent a worsening of the cost of sales ratio, including thorough risk manage-ment at the systems development stage.
SG&A expenses rose ¥3.8 billion, or 2.9%, to ¥134.9 billion. Although there was a declinedue to the aforementioned transfers of welfare expenses from SG&A expenses, the increase isattributable principally to expenses related to software expenses that were previously stated asassets, which are now stated in their entirety and when they are incurred, commencing with theperiod under review. This change is in line with new accounting standards related to researchand development expenses.
Research and development expenses rose ¥8.6 billion, to ¥22.7 billion, due partially to the pre-viously mentioned change in software accounting procedures. Due to this change, ¥23.5 bil-lion, which was capitalized in previous years, is now stated as non-operating expenses. As aconsequence, the ratio of SG&A expenses to sales increased slightly, from 18.5% to 18.6%.The ratio of R&D expenses to sales stood at 3.1%.
As a result of the events described above, the increase in earnings did not fully offset theincrease in expenses, and operating income declined 10.7%, or ¥6.1 billion, to ¥50.7 billion.The ratio of operating income to net sales fell 1.0 percentage point, from 8.0% to 7.0%.
Non-operating expenses, net, increased markedly, to ¥79.9 billion, a rise of ¥60.8 billion.Interest expenses related to the issuance of new stock decreased, but, with the introduction ofnew accounting standards relating to research and development expenses, software, upon whichproduction had begun in the previous accounting period or before, and machines and devicesused in the course of research and development are required by the new standards to be stated intheir entirety when they occur. Consequently, ¥23.5 billion of the prior year’s research anddevelopment expenses were stated as losses in the period under review. In preparation for theintroduction of new accounting standards regarding retirement benefits, effective from thebeginning of the next fiscal year, a loss of ¥40.3 billion was stated as a transfer to the reserve forretirement allowances to cover a reserve shortfall in relation to retirement benefit obligations.
Income (loss) before income taxes amounted to a loss of ¥29.2 billion, compared with incomeof ¥37.7 billion in the previous period. Due to the introduction of deferred tax accounting fromthe beginning of the period under review, income taxes, current, for the period amounted to¥19.3 billion. However, income taxes, deferred amounted to ¥30.3 billion and, hence, the net taxburden was negative ¥11.0 billion. As a result, net loss amounted to ¥18.1 billion, in contrast tonet income of ¥16.3 billion in the previous period. These losses had no effect on cash flows inthe period under review.
Net income (loss) per share decreased to a net loss of ¥6,458, from a net income of ¥5,905 inthe previous fiscal year. Dividends paid by the parent company were as previously mentioned.
Financial Position In the period under review, the Company invested management resources in the fields mostimportant to the Company, such as software—the axis of the Company’s business.Accordingly, total assets held by the Company as of 31st March, 2000 rose ¥68.8 billion, to¥1,071.7 billion.
Total current assets fell ¥12.3 billion, to ¥266.6 billion. This was due principally to thewrite-off of certain assets as part of expenses. These assets were previously listed as invento-ries—primarily jobs and software in progress—due to the aforementioned application of newaccounting standards relating to research and development expenses. The transfer resulted ina decline of ¥14.8 billion in inventories.
Regarding property and equipment and intangible assets, capital expenditures in the periodunder review amounted to ¥210.4 billion, centered on investment of ¥194.7 billion in NTTDATA’s SI Business. Property and equipment, less accumulated depreciation declined ¥91.2 billion,
SG&A Expenses andSG&A Expenses Ratio
100
110
120
130
140
SG&A Expenses SG&A Expenses Ratio (%)
18.00
18.25
18.50
18.75
19.00
’96 ’97 ’98 ’99 ’00
’96 ’97 ’98 ’99 ’00–
1
1
0
1
2
3
4
’96 ’97 ’98 ’99 ’00–5
0
5
10
15
R&D Expenses Ratio
Return on Equity (ROE)
(Billions of yen) (%)
(%)
(%)

20 Annual Report 2000
to ¥426.2 billion, due principally to the expediting of depreciation and the transfer of productionexpenses for software in production for in-Company use to a temporary account for intangiblefixed software assets, which, up to the previous fiscal period, were included in work in progress.
Deferred charges and intangibles increased ¥135.4 billion, to ¥296.5 billion, due principally tothe expansion of software production and the aforementioned transfer from property and equip-ment of software for in-Company use. The increase in intangible fixed assets, due to the intro-duction of tax-effect accounting, effective from the period under review, which resulted in the creation of deferred tax assets of ¥33.6 billion, was the principal cause of the increase in total assets.
On the liabilities side, total liabilities increased ¥74.1 billion, to ¥706.7 billion. Of this total,short- and long-term interest-bearing debt, net increased ¥20.2 billion, to ¥451.9 billion, as aconsequence of financing for software development and capital investment. Of this, there werenew corporate bonds issued amounting to ¥60 billion and a redemption amounting to ¥10 bil-lion, resulting in an increase of ¥50 billion. Short- and long-term debt, net fell ¥29.8 billion asa result of repayments and borrowings.
Operating liabilities and other liabilities increased ¥53.8 billion, to ¥254.9 billion. Principalfactors leading to this increase were an increase of ¥13.2 billion in obligations to accountspayable, an increase of ¥4.7 billion in income taxes payable, and an increase of ¥41.0 billion intransfers to the reserve for retirement benefits in advance of the introduction of new account-ing standards regarding retirement benefits, as previously described.
Shareholders’ equity fell ¥5.5 billion, to ¥363.8 billion, as a result of a reduction in consolidat-ed retained earnings, a net loss of ¥18.1 billion, and cash dividends to shareholders of ¥2.8 bil-lion. Prior year’s adjustments for the adoption of tax-effect accounting rose ¥15.6 billion. As aconsequence, the shareholders’ equity ratio slipped 2.9 percentage points, from 36.8% to 33.9%.
Cash FlowsCash and cash equivalents amounted to ¥90.4 billion at year-end, ¥6.7 billion lower than theprevious fiscal year, due to a slight reduction in cash on hand and at banks.
Net cash provided by operating activities amounted to ¥174.7 billion. Of this total, cashinflows, loss before income taxes, depreciation and amortization, and other non-cash items,after deduction of income taxes paid, amounted to ¥170.4 billion. Cash inflows in relation tooperating assets and liabilities amounted to ¥4.3 billion, due to a reduction in accounts receiv-able and an increase in accounts payable.
Net cash flows from investing activities amounted to an outflow of ¥198.5 billion, due prin-cipally to the acquisition of property and equipment and intangible assets of ¥194.1 billion.NTT DATA is investing aggressively, principally in its SI Business, to enhance future earningsprospects.
As a result of the Company’s operating and investing activities, free cash flow amounted toan outflow of ¥23.8 billion.
Net cash provided by financing activities amounted to ¥17.1 billion, as a result of borrow-ing, repayment, and redemption activities.
’96 ’97 ’98 ’99 ’00
ROAAsset Turnover (Times)
–2
–1
0
1
2
0
0.25
0.50
0.75
1.00
’96 ’97 ’98 ’99 ’00
Interest-Bearing DebtOther LiabilitiesShareholders’ EquityEquity Ratio (%)
0
200
400
600
800
1,000
1,200
–10
0
10
20
30
40
50
ROA and Asset Turnover
Composition of TotalCapital Employed
(%) (Times)
(Billions of yen) (%)

21Annual Report 2000
X Cost Flow for Data Communications Service and Systems
Development Service
X Net Sales, Orders, and Order Backlog in Data
Communications Service
Data CommunicationsService
Systems DevelopmentService
X Depreciation/Amortization of Fixed Assets
Hardware Software
Depreciation/ Declining-balance basis Straight-line basisAmortizationMethod
Depreciation/ The same standards for the Fee payment periodAmortization methods stipulated by Japanese (standard: 5 to 6 years)Period corporate tax law (6 years) based on contact with client
X-3 X-2 X-1 X+4
100
X+2
20 20
Period of Development (Investment) 2 to 3 years
Period of Contract (Collecting fees)5 to 6 years
Order Accepted
Initial Service Provision
Net Sales
Orders
Order Backlog
100 100 100
X
20
80
X+1
20
60 40
X+3
20
20
During Designing andInstallationConstruction in
ProgressSoftware in Progress pDirect cost
Materials costLabor costSubcontracting costExpenses
pIndirect cost
Jobs and Software in Progress
pDirect costMaterials costLabor costSubcontracting costExpenses
pIndirect cost
At Time of ServiceStartup/DeliveryFixed Assets
Cost of Sales (depreciation cost)
Cost of Sales
p Structure of NTT DATA’s SI Business NTT DATA offers two varieties of service in its SI business, Data
Communications Service and Systems Development Service.
The Data Communications Service is a development and service provi-
sion format unique to NTT DATA. In the Data Communications Service,
NTT DATA retains ownership of the assets involved while developing sys-
tems and providing management and maintenance services for a client who
pays a fee for their use. In this way, the client can avoid the burdens of a
substantial commitment of funds. For NTT DATA, there is a fairly large
capital investment necessary in the initial stages, but once the order has
been received it represents a stable revenue source for the length of the
time that the client uses the services.
X The Major Differences between Data Communications Service
and Systems Development Service
Data Communications Service Systems Development Service
Type of Contract Stipulated Contract Individual Contract
Ownership The Company Clientof Assets
Payment Method Monthly Fees Lump-Sum Payment
X Selection of Data Communications Service or Systems
Development Service (party responsible for decision)
The decision whether to choose Data Communications Service or Systems
Development Service is up to the client.
DATA COMMUNICATIONS SERVICE
SYSTEMS DEVELOPMENTSERVICE
StrategicPlanning
SystemsPlanning
SystemsDesign andInstallation
Delivery
SystemsMaintenance and Facility
Management
The Company worksclosely with clients toidentify and evaluatetheir information tech-nology requirementsand to develop astrategic plan thatmeets each client’sneeds and considersthe future develop-ment of the client’soperations.
At the strategic plan-ning stage, the Com-pany designs theoptimal system tomeet the client’sneeds in a compre-hensive plan for theentire data communi-cations system de-velopment process.
This stage involvesdesign and installa-tion, from planning to the client’s finalapproval—includingsoftware develop-ment, hardware selec-tion and procurement,and system testing.
The Company pro-vides complete sup-port for all mattersrelated to its clients’data communica-tions system facili-t ies, including themaintenance andmanagement of com-puter centers, termi-nals, and networks.
SystemsMaintenanceand Facility
Management
Service ProvisionService
Provision

Thousands ofU.S. dollars
Millions of yen (Note 3)
ASSETS 1999 2000 2000
Current Assets:Cash on hand and at banks ¥ 97,412 ¥ 90,776 $ 856,377
Accounts receivable: Outside clients, including NTT 107,468 104,244 983,434
Unconsolidated subsidiaries and affiliates 2,419 1,869 17,632
109,887 106,113 1,001,066
Less: allowance for bad debts (533) (411) (3,877)
109,354 105,702 997,189
Inventory, primarily jobs and software in progress 58,374 43,546 410,811
Deferred tax assets–current (Note 8) — 12,614 119,000
Other current assets 13,721 13,932 131,434
Total current assets 278,861 266,570 2,514,811
Investments and Advances:
Investments in securities (Note 9) 6,447 6,081 57,368
Investments in unconsolidated subsidiaries and affiliates 5,368 7,456 70,340
Other investments and advances 33,683 35,290 332,924
Total investments and advances 45,498 48,827 460,632
Property and Equipment, at Cost 1,069,069 991,547 9,354,217
Less: accumulated depreciation (551,688) (565,383) (5,333,802)
517,381 426,164 4,020,415
Deferred Tax Assets–Non-Current (Note 8) — 33,622 317,189
Deferred Charges and Intangibles:
Software 158,036 177,654 1,675,981
Development costs of software in progress (Note 1 (2)) — 115,380 1,088,491
Other 3,029 3,436 32,415
161,065 296,470 2,796,887
¥1,002,805 ¥1,071,653 $10,109,934
The accompanying notes are an integral part of the statements.
Consolidated Balance SheetsNTT DATA CORPORATION AND SUBSIDIARIESYears ended 31st March, 1999 and 2000
22 Annual Report 2000

Thousands ofU.S. dollars
Millions of yen (Note 3)
LIABILITIES AND SHAREHOLDERS’ EQUITY 1999 2000 2000
Current Liabilities:
Short-term bank loans (Note 4) ¥ 1,200 ¥ 5,840 $ 55,094
Current portion of long-term debt (Note 4) 57,893 63,790 601,792
Accounts payable:Suppliers, including NTT 60,704 76,654 723,151
Unconsolidated subsidiaries and affiliates 6,529 8,134 76,736
Other 30,862 26,477 249,783
98,095 111,265 1,049,670
Income taxes payable (Note 2 (8)) 12,725 17,413 164,274
Other current liabilities 22,692 23,833 224,840
Total current liabilities 192,605 222,141 2,095,670
Long-Term Debt (Note 4) 372,519 382,229 3,605,934
Reserve for Retirement Benefits (Notes 2 (10) and (11)) 58,944 99,905 942,500
Other Liabilities 8,594 2,464 23,245
Total liabilities 632,662 706,739 6,667,349
Minority Interests in Consolidated Subsidiaries 899 1,156 10,906
Commitments and Contingent Liabilities (Note 5)
Shareholders’ Equity:
Commom stock, par value—¥5,000 per share at 31st March, 1999 and 2000Authorized—11,220,000 shares at 31st March, 1999 and 2000Issued—2,805,000 shares at 31st March, 1999 and 2000 142,520 142,520 1,344,528
Additional paid-in capital 139,300 139,300 1,314,151
Retained earnings 87,424 81,938 773,000
Total shareholders’ equity 369,244 363,758 3,431,679
¥1,002,805 ¥1,071,653 $10,109,934
23Annual Report 2000

Thousands ofU.S. dollars
Millions of yen (Note 3)
1998 1999 2000 2000
Net Sales (Note 11) ¥676,581 ¥710,152 ¥725,348 $6,842,906
Cost of Sales (Note 1 (3)) 497,713 522,190 539,715 5,091,651
Gross profit 178,868 187,962 185,633 1,751,255
Selling, General and Administrative Expenses
(Notes 1 (3) and 6) 124,671 131,129 134,895 1,272,595
Operating income 54,197 56,833 50,738 478,660
Non-Operating Income (Expenses):
Interest and dividend income 287 650 130 1,226
Interest expenses (15,449) (11,747) (10,143) (95,689)
Lease rental income from buildings 870 751 1,015 9,575
Cost of lease rental buildings (564) — — —
Amortization of past service cost of the pension plan (1,843) — — —
New share issue expenses — (5,148) — —
Prior year’s research and development expenses — — (23,540) (222,075)
Provision for retirement benefits — — (40,333) (380,500)
Others, net (3,223) (3,592) (7,044) (66,452)
(19,922) (19,086) (79,915) (753,915)
Income (loss) before income taxes 34,275 37,747 (29,177) (275,255)
Income Taxes (Note 2 (8)):Current 18,627 21,450 19,271 181,802
Deferred — — (30,279) (285,651)
18,627 21,450 (11,008) (103,849)
Income (loss) before minority interests 15,648 16,297 (18,169) (171,406)
Minority Interests in Consolidated Subsidiaries (36) 16 55 519
Net income (loss) ¥ 15,612 ¥ 16,313 ¥ (18,114) $ (170,887)
Yen U.S. dollars
Per Share:
Net income (loss) ¥ 61,708 ¥ 5,905 ¥ (6,458) $ (60.92)
Cash dividends 10,000 1,000 1,000 9.43
The accompanying notes are an integral part of the statements.
24 Annual Report 2000
Consolidated Statements of OperationsNTT DATA CORPORATION AND SUBSIDIARIESFor the years ended 31st March, 1998, 1999 and 2000
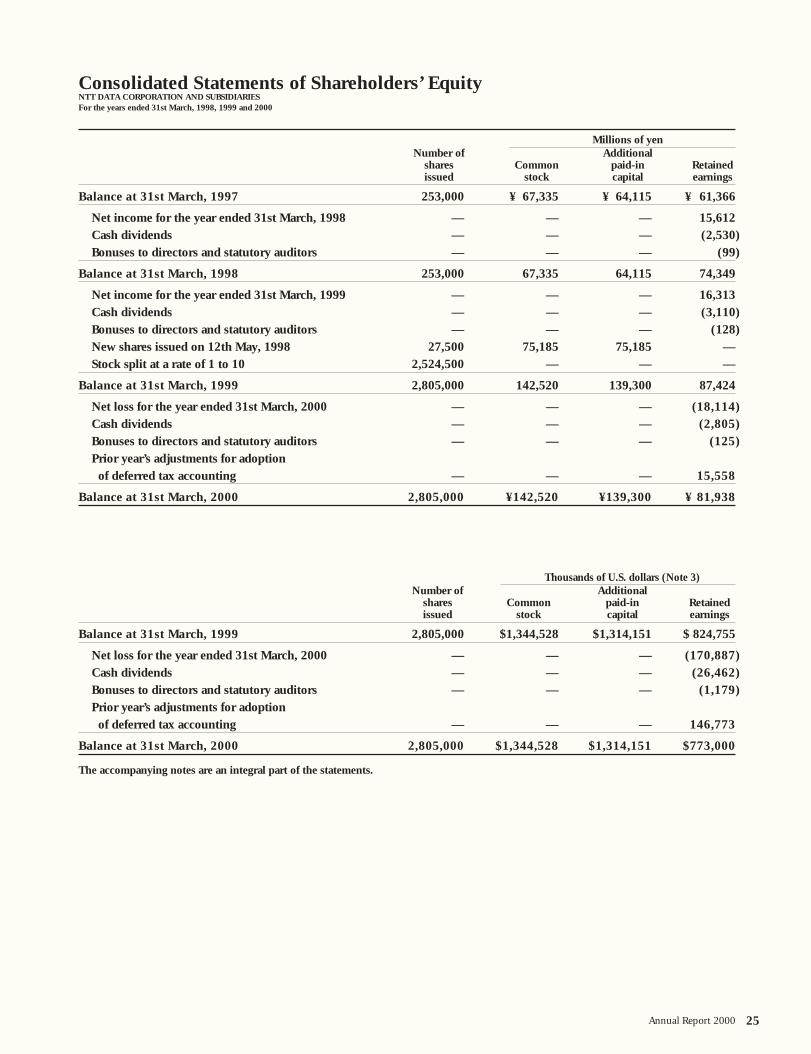
Millions of yenNumber of Additional
shares Common paid-in Retainedissued stock capital earnings
Balance at 31st March, 1997 253,000 ¥ 67,335 ¥ 64,115 ¥ 61,366
Net income for the year ended 31st March, 1998 — — — 15,612Cash dividends — — — (2,530)Bonuses to directors and statutory auditors — — — (99)
Balance at 31st March, 1998 253,000 67,335 64,115 74,349
Net income for the year ended 31st March, 1999 — — — 16,313Cash dividends — — — (3,110)Bonuses to directors and statutory auditors — — — (128)New shares issued on 12th May, 1998 27,500 75,185 75,185 — Stock split at a rate of 1 to 10 2,524,500 — — —
Balance at 31st March, 1999 2,805,000 142,520 139,300 87,424
Net loss for the year ended 31st March, 2000 — — — (18,114)
Cash dividends — — — (2,805)
Bonuses to directors and statutory auditors — — — (125)
Prior year’s adjustments for adoption of deferred tax accounting — — — 15,558
Balance at 31st March, 2000 2,805,000 ¥142,520 ¥139,300 ¥ 81,938
Thousands of U.S. dollars (Note 3)Number of Additional
shares Common paid-in Retainedissued stock capital earnings
Balance at 31st March, 1999 2,805,000 $1,344,528 $1,314,151 $ 824,755
Net loss for the year ended 31st March, 2000 — — — (170,887)
Cash dividends — — — (26,462)
Bonuses to directors and statutory auditors — — — (1,179)
Prior year’s adjustments for adoption of deferred tax accounting — — — 146,773
Balance at 31st March, 2000 2,805,000 $1,344,528 $1,314,151 $773,000
The accompanying notes are an integral part of the statements.
25Annual Report 2000
Consolidated Statements of Shareholders’ EquityNTT DATA CORPORATION AND SUBSIDIARIESFor the years ended 31st March, 1998, 1999 and 2000

Consolidated Statement of Cash FlowsNTT DATA CORPORATION AND SUBSIDIARIESFor the year ended 31st March, 2000
26 Annual Report 2000
Thousands ofU.S. dollars
Millions of yen (Note 3)
2000 2000
Cash Flows from Operating Activities:Loss before income taxes ¥(29,177) $ (275,255)Prior year’s research and development expenses 23,540 222,075Provision for retirement benefits 40,333 380,500Depreciation 92,019 868,104Amortization 40,954 386,358Loss on disposal of property and equipment 14,043 132,481Loss on disposal of intangible assets 5,509 51,972Provision of reserve for retirement benefits (5,465) (51,557)
and increase in long-term accrued expensesUnrealised loss on valuation of investments in securities 1,585 14,953Decrease in accounts receivable 3,774 35,604Increase in inventories (3,212) (30,302)Increase in accounts payable 3,803 35,877Interest expenses 10,143 95,689Others, net 1,661 15,671
Sub total 199,510 1,882,170Interest and dividends received 130 1,226Interest paid (10,243) (96,632)Income taxes paid (14,670) (138,396)
Net cash provided by operating activities 174,727 1,648,368
Cash Flows from Investing Activities:Acquisition of property and equipment (104,671) (987,462)Acquisition of intangible assets (89,453) (843,896) Proceeds from sales of property and equipment 1,591 15,009Acquisition of investments in securities and affiliates (3,571) (33,689)Others, net (2,386) (22,509)
Net cash used in investing activities (198,490) (1,872,547)
Cash Flows from Financing Activities:Proceeds from issue of bonds 59,697 563,179Redemption of bonds at maturity (10,000) (94,340)Borrowings of long-term debt 13,500 127,358Repayments of long-term borrowings (47,892) (451,811)Net increase in short-term bank loans 4,640 43,774Cash dividends (2,809) (26,500)Cash dividends to minority shareholders (5) (47)
Net cash provided by financing activities 17,131 161,613
Effects of Change of Exchange Rate on Cash and Cash Equivalents (82) (773)
Net Decrease in Cash and Cash Equivalents (6,714) (63,339)
Cash and Cash Equivalents at Beginning of Year 97,115 916,179
Cash and Cash Equivalents at End of Year ¥ 90,401 $ 852,840
(Reference)Free Cash Flow ¥ (23,763) $ (224,179)
The accompanying notes are an integral part of the statements.
27Annual Report 2000
(1) Accounting PrinciplesThe accompanying consolidated financial statements of NTTDATA CORPORATION (the “Company”) and subsidiarieshave been prepared in conformity with accounting principlesand practices generally accepted in Japan. The accounts of theCompany and its consolidated subsidiaries (all domestic com-panies) are maintained in accordance with the provisions setforth in the Japanese Commercial Code, the JapaneseSecurities and Exchange Law and in conformity with account-ing principles and practices generally accepted in Japan, whichare different in certain respects as to application and disclosurerequirements of International Accounting Standards.
The accompanying consolidated financial statements of theCompany and its subsidiaries are essentially the translation ofthose included in the Securities Annual Report filed with theJapanese Minister of Finance and the Stock Exchanges asrequired by the provisions of the Japanese Securities andExchange Law and related regulations in Japan.
Accordingly, the information disclosed in the accompanyingconsolidated financial statements is derived from the originaltext and the scope and nature of the information is limited tothose disclosed therein. However, certain reclassification orsummarization of accounts has been made to present the con-solidated financial statements in a form which is more familiarto foreign readers.
The consolidated financial statements are not intended topresent the consolidated financial position, results of opera-tions and cash flows in accordance with accounting principles
and practices generally accepted in countries and jurisdictionsother than Japan.
The consolidated statement of cash flows has been requiredto be prepared with effect for the year ended 31st March, 2000,in accordance with a new accounting standard.
(2) Change in Presentation of AccountsDue to the amendments of the Consolidated FinancialStatements Regulation of Japan, the following presentations ofthe accounts in the consolidated financial statements havebeen changed for the fiscal year ended 31st March, 2000.
Previously, costs of software for internal use under develop-ment were included in “Property and Equipment, at Cost.”From the fiscal year ended 31st March, 2000, the cost is sepa-rately disclosed as “Development costs of software in progress”on the consolidated balance sheets.
(3) Change of Accounting PolicyAllocation of expenses related to Company housing:
Previously, social and welfare expenses related to companyhouses were included in “Selling, General and AdministrativeExpenses.” From this fiscal year, such expenses are allocated to“Selling, General and Administrative Expenses,” “Cost ofGoods” and “Cost of Sales.” This accounting change decreased“Selling, General and Administrative Expenses” ¥2,737 million($25,821 thousand), while it increased “Cost of Goods” and“Cost of Sales” the same amount. This change is not material to“Operating income” and “Loss before income taxes.”
Notes to the Consolidated Financial StatementsNTT DATA CORPORATION AND SUBSIDIARIES
1. BASIS OF PRESENTING THE CONSOLIDATED FINANCIAL STATEMENTS
2. SUMMARY OF SIGNIFICANT ACCOUNTING POLICIES
(1) Scope of ConsolidationThe accompanying consolidated financial statements includethe accounts of the Company and nine of its subsidiaries(together, referred to as the “Companies”), which are listedbelow:
NTT System Technologies Inc.NTT System Service CorporationFUKUSHIMA NTT DATA COMMUNICATIONS
SYSTEMS CORPORATION TOKYO NTT DATA COMMUNICATIONS SYSTEMS
CORPORATIONNAGANO NTT DATA COMMUNICATIONS SYSTEMS
CORPORATION TOKAI NTT DATA COMMUNICATIONS SYSTEMS
CORPORATIONKANSAI NTT DATA COMMUNICATIONS SYSTEMS
CORPORATIONCHUGOKU NTT DATA COMMUNICATIONS SYSTEMS
CORPORATIONKYUSHU NTT DATA COMMUNICATIONS SYSTEMS
CORPORATION
The accounts of the unconsolidated subsidiaries (ex. NTTDATA HOKKAIDO TECSYS CORPORATION, etc.) had totalassets, net sales, net income (loss) and retained earnings,which in the aggregate are not significant in relation to theconsolidated totals, and therefore have been excluded fromconsolidation with the Company.
All of the above consolidated subsidiaries use the fiscal yearending on 31st March of each year, which is in agreement withthat of the Company.
(2) Equity Method of Accounting for Investments in Unconsolidated Subsidiaries and AffiliatesThe equity method is applied to the investments in an affiliate,Japan Network System Corporation, because the investmentsin the unconsolidated subsidiaries and remaining affiliateswould not have a material effect on consolidated net incomeand retained earnings had they been accounted for by the equi-ty method.
The investments in such unconsolidated subsidiaries andaffiliates are carried at cost or less.

28 Annual Report 2000
(3) Elimination and Combination For the purposes of preparing the consolidated financial state-ments of the Companies, all significant intercompany transac-tions, account balances and unrealised profits among theCompanies have been entirely eliminated and the portionapplicable to minority interests is charged or credited to“Minority Interests in Consolidated Subsidiaries.”
In elimination, any difference between the cost of an invest-ment in a subsidiary and the amount of underlying equity innet assets of the subsidiary is treated as an asset or a liability,as the case may be, and amortized over a period of five yearson a straight-line basis.
(4) Inventories“Inventories, primarily jobs and software in progress,” is statedat cost, which is determined on an individual project basis.
Supplies are valued at cost, which is principally determinedby the first-in, first-out method.
(5) Valuation of SecuritiesSecurities having market quotations on stock exchanges areprincipally valued at the lower of cost or market value, costbeing determined by the moving-average method. Other secu-rities are valued at cost which is determined by the moving-average method.
(6) Property and EquipmentDepreciation is computed by the declining-balance method, atrates based on the estimated useful lives of assets that are pre-scribed by the Japanese income tax laws. However, deprecia-tion of buildings (except for building improvements) acquiredafter 1st April, 1998 is computed by the straight-line method.
(7) Deferred Charges and Intangibles
1) Intangible AssetsAmortization of intangible assets, except for software, is com-puted by the straight-line method over the period prescribedby the Japanese income tax laws.
Amortization of software is based on the following:
a) Software developed for saleThe amortization costs of software developed for external saleare computed as the higher of: (a) the amount based on salesin the year, as a proportion of total estimated sales over notmore than a three-year sales period, or (b) the amount com-puted on a straight-line basis over the remaining sales periodin which the software can be sold by the Company.b) Software developed for internal useSoftware for internal use is amortized on a straight-line basisover the estimated useful lives, not exceeding five years.
However, software which is exclusively developed for thepurpose of tailor-made Data Communications Services toclients under specific contracts is amortized on a straight-linebasis over the relevant contract period.
2) Deferred ChargesBond issue expenses, bond discounts at issue and new shareissue expenses are charged to expenses as incurred.
(8) Income TaxesIncome taxes of the Companies consist of corporate income tax-es, local inhabitants taxes and enterprise taxes.
In the year ended 31st March, 2000, the Companies adoptedthe deferred tax accounting method in accordance with theamended regulations for the preparation of consolidated finan-cial statements. Income taxes were determined using the assetand liability approach, whereby deferred tax assets and liabili-ties were recognized in respect of temporary differencesbetween the tax basis of assets and liabilities and those asreported in the financial statements. The cumulative effect ofadopting deferred tax accounting at 1st April, 1999 wascharged to retained earnings.
In the years ended 31st March, 1998 and 1999, income tax-es of the Companies were provided for at an amount currentlypayable based on the tax returns filed with tax authorities.
(9) Allowance for Bad DebtsThe allowance for bad debts account is provided for in anamount equivalent to the maximum allowable deduction fortax purposes that is determined as a prescribed percentage oftotal receivables (net of any payables to whom the Companyhas receivables), plus the amount to cover all individualaccounts that are estimated to be uncollectible.
(10) Reserve for Retirement BenefitsThe “Reserve for retirement benefits” is provided in an amountequivalent to the undiscounted liability the Company wouldhave been required to pay if all eligible employees had volun-tarily retired at the balance sheet date. Previously, a reserve forretirement benefits was provided in an amount equivalent tothe discounted present value of the liability the Companywould have been required to pay under the same circum-stances. For the previous fiscal year, consolidated subsidiariesprovided for a reserve for retirement benefits in an amountequivalent to 40% of the liability under the same circum-stances. In this fiscal year, principally all consolidated sub-sidiaries provided for 100% of such liability. This accountingchange increased “Provision for retirement benefits,” shownunder “Non-Operating Income (Expenses),” ¥40,333 million($380,500 thousand), which resulted in an increase in “Lossbefore income taxes” of the same amount.
(11) Reserve for Retirement Benefits to Directors and Statutory AuditorsReserves for retirement benefits payable to directors and statu-tory auditors are provided by the Company and certain consol-idated subsidiaries in an amount equivalent to the liability the
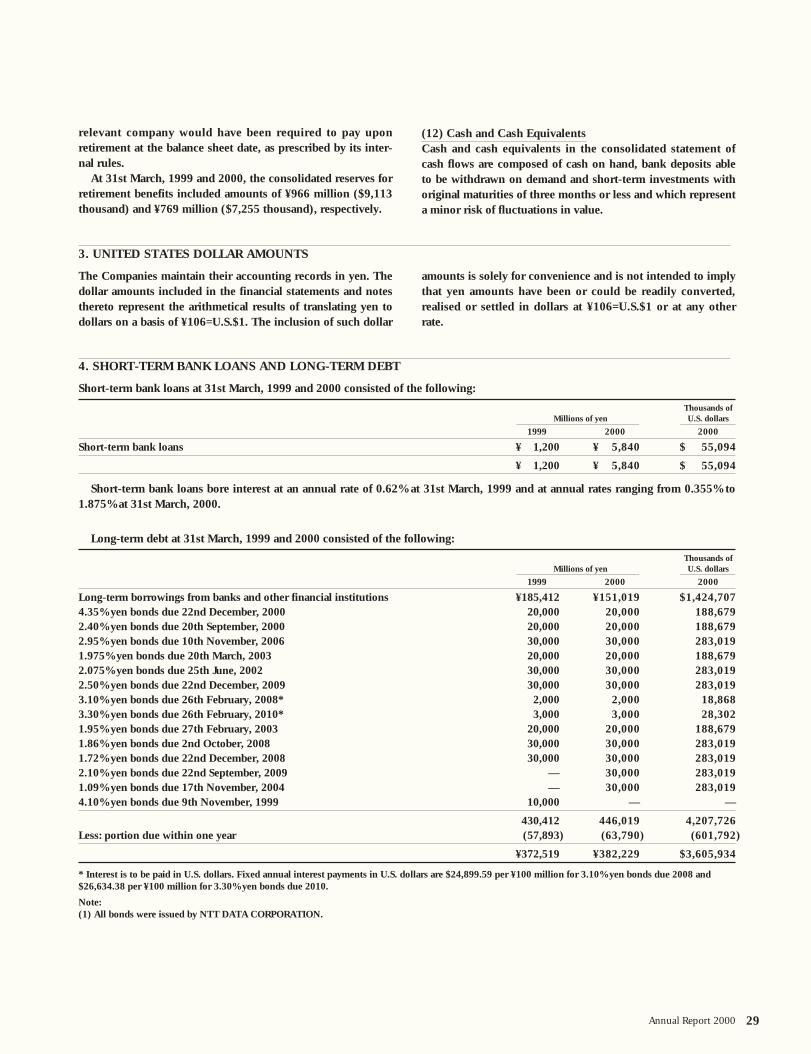
29Annual Report 2000
3. UNITED STATES DOLLAR AMOUNTS
The Companies maintain their accounting records in yen. Thedollar amounts included in the financial statements and notesthereto represent the arithmetical results of translating yen todollars on a basis of ¥106=U.S.$1. The inclusion of such dollar
amounts is solely for convenience and is not intended to implythat yen amounts have been or could be readily converted,realised or settled in dollars at ¥106=U.S.$1 or at any otherrate.
4. SHORT-TERM BANK LOANS AND LONG-TERM DEBT
Short-term bank loans at 31st March, 1999 and 2000 consisted of the following:
Thousands ofMillions of yen U.S. dollars
1999 2000 2000
Short-term bank loans ¥ 1,200 ¥ 5,840 $ 55,094
¥ 1,200 ¥ 5,840 $ 55,094
Short-term bank loans bore interest at an annual rate of 0.62% at 31st March, 1999 and at annual rates ranging from 0.355% to1.875% at 31st March, 2000.
Long-term debt at 31st March, 1999 and 2000 consisted of the following:
Thousands ofMillions of yen U.S. dollars
1999 2000 2000
Long-term borrowings from banks and other financial institutions ¥185,412 ¥151,019 $1,424,7074.35% yen bonds due 22nd December, 2000 20,000 20,000 188,6792.40% yen bonds due 20th September, 2000 20,000 20,000 188,6792.95% yen bonds due 10th November, 2006 30,000 30,000 283,0191.975% yen bonds due 20th March, 2003 20,000 20,000 188,6792.075% yen bonds due 25th June, 2002 30,000 30,000 283,0192.50% yen bonds due 22nd December, 2009 30,000 30,000 283,0193.10% yen bonds due 26th February, 2008* 2,000 2,000 18,8683.30% yen bonds due 26th February, 2010* 3,000 3,000 28,3021.95% yen bonds due 27th February, 2003 20,000 20,000 188,6791.86% yen bonds due 2nd October, 2008 30,000 30,000 283,0191.72% yen bonds due 22nd December, 2008 30,000 30,000 283,0192.10% yen bonds due 22nd September, 2009 — 30,000 283,0191.09% yen bonds due 17th November, 2004 — 30,000 283,0194.10% yen bonds due 9th November, 1999 10,000 — —
430,412 446,019 4,207,726Less: portion due within one year (57,893) (63,790) (601,792)
¥372,519 ¥382,229 $3,605,934
* Interest is to be paid in U.S. dollars. Fixed annual interest payments in U.S. dollars are $24,899.59 per ¥100 million for 3.10% yen bonds due 2008 and$26,634.38 per ¥100 million for 3.30% yen bonds due 2010.
Note: (1) All bonds were issued by NTT DATA CORPORATION.
relevant company would have been required to pay uponretirement at the balance sheet date, as prescribed by its inter-nal rules.
At 31st March, 1999 and 2000, the consolidated reserves forretirement benefits included amounts of ¥966 million ($9,113thousand) and ¥769 million ($7,255 thousand), respectively.
(12) Cash and Cash Equivalents Cash and cash equivalents in the consolidated statement ofcash flows are composed of cash on hand, bank deposits ableto be withdrawn on demand and short-term investments withoriginal maturities of three months or less and which representa minor risk of fluctuations in value.
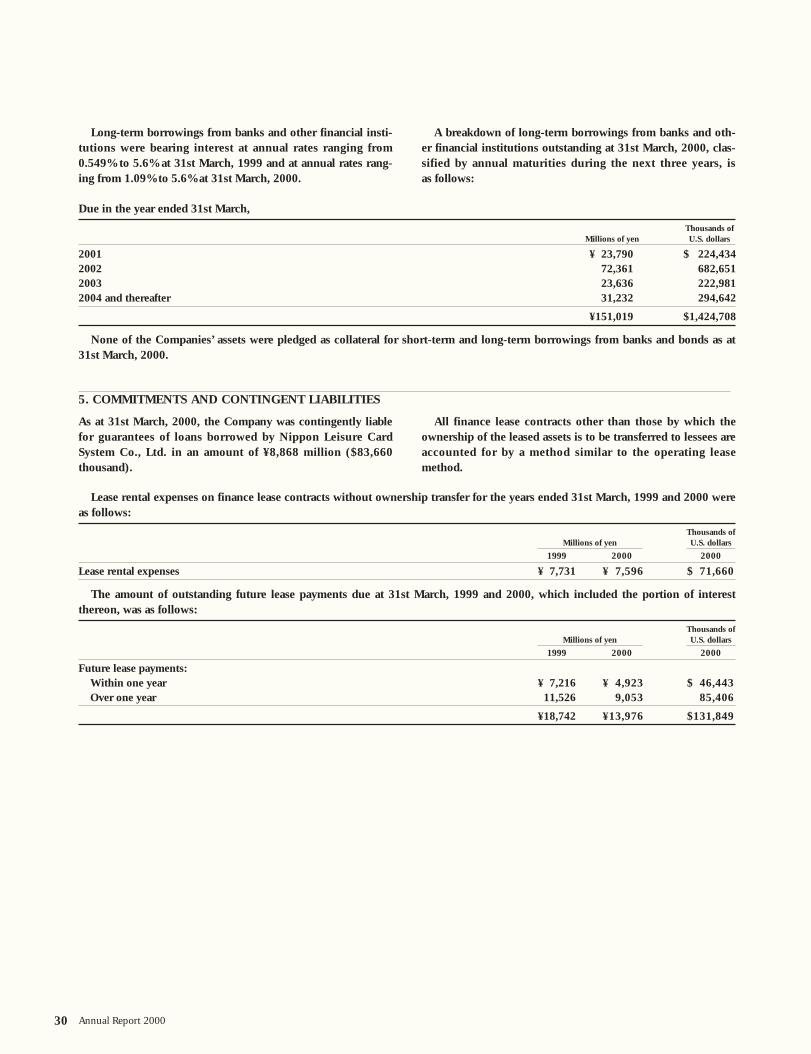
Long-term borrowings from banks and other financial insti-tutions were bearing interest at annual rates ranging from0.549% to 5.6% at 31st March, 1999 and at annual rates rang-ing from 1.09% to 5.6% at 31st March, 2000.
A breakdown of long-term borrowings from banks and oth-er financial institutions outstanding at 31st March, 2000, clas-sified by annual maturities during the next three years, is as follows:
Due in the year ended 31st March,
Thousands ofMillions of yen U.S. dollars
2001 ¥ 23,790 $ 224,4342002 72,361 682,6512003 23,636 222,9812004 and thereafter 31,232 294,642
¥151,019 $1,424,708
None of the Companies’ assets were pledged as collateral for short-term and long-term borrowings from banks and bonds as at31st March, 2000.
30 Annual Report 2000
5. COMMITMENTS AND CONTINGENT LIABILITIES
As at 31st March, 2000, the Company was contingently liablefor guarantees of loans borrowed by Nippon Leisure CardSystem Co., Ltd. in an amount of ¥8,868 million ($83,660thousand).
All finance lease contracts other than those by which theownership of the leased assets is to be transferred to lessees areaccounted for by a method similar to the operating leasemethod.
Lease rental expenses on finance lease contracts without ownership transfer for the years ended 31st March, 1999 and 2000 wereas follows:
Thousands ofMillions of yen U.S. dollars
1999 2000 2000
Lease rental expenses ¥ 7,731 ¥ 7,596 $ 71,660
The amount of outstanding future lease payments due at 31st March, 1999 and 2000, which included the portion of interestthereon, was as follows:
Thousands ofMillions of yen U.S. dollars
1999 2000 2000
Future lease payments:Within one year ¥ 7,216 ¥ 4,923 $ 46,443Over one year 11,526 9,053 85,406
¥18,742 ¥13,976 $131,849
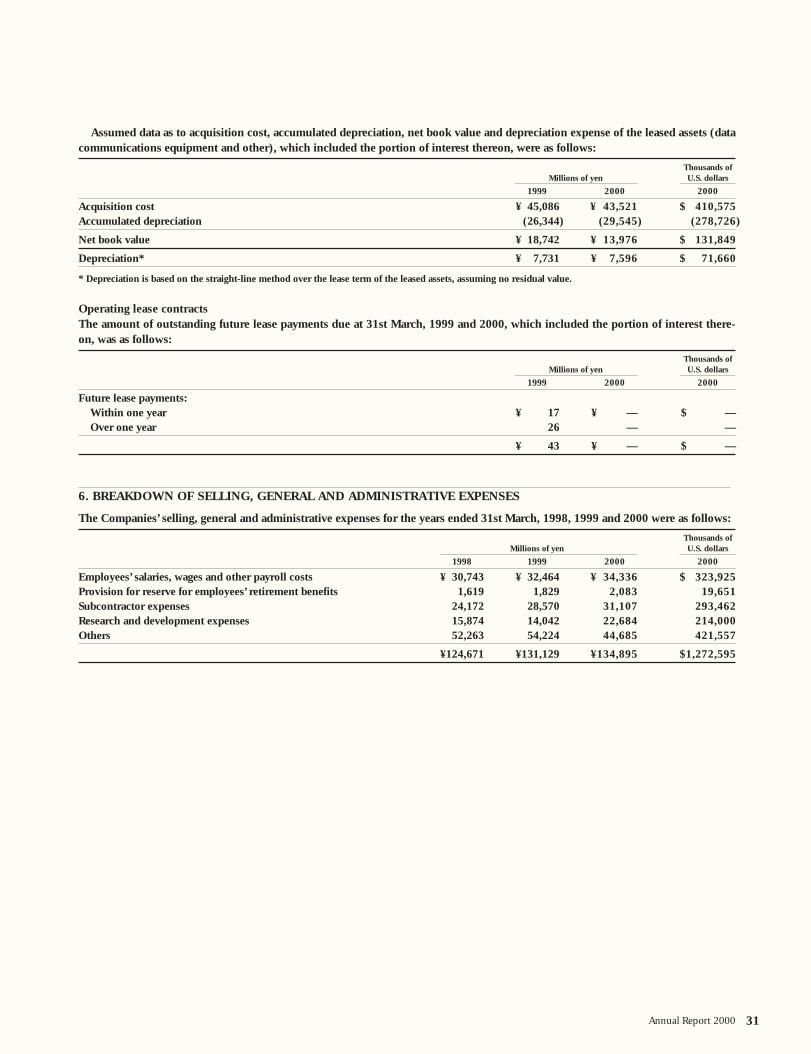
31Annual Report 2000
The Companies’ selling, general and administrative expenses for the years ended 31st March, 1998, 1999 and 2000 were as follows:
Thousands ofMillions of yen U.S. dollars
1998 1999 2000 2000
Employees’ salaries, wages and other payroll costs ¥ 30,743 ¥ 32,464 ¥ 34,336 $ 323,925Provision for reserve for employees’ retirement benefits 1,619 1,829 2,083 19,651Subcontractor expenses 24,172 28,570 31,107 293,462Research and development expenses 15,874 14,042 22,684 214,000Others 52,263 54,224 44,685 421,557
¥124,671 ¥131,129 ¥134,895 $1,272,595
6. BREAKDOWN OF SELLING, GENERAL AND ADMINISTRATIVE EXPENSES
Assumed data as to acquisition cost, accumulated depreciation, net book value and depreciation expense of the leased assets (datacommunications equipment and other), which included the portion of interest thereon, were as follows:
Thousands ofMillions of yen U.S. dollars
1999 2000 2000
Acquisition cost ¥ 45,086 ¥ 43,521 $ 410,575Accumulated depreciation (26,344) (29,545) (278,726)
Net book value ¥ 18,742 ¥ 13,976 $ 131,849
Depreciation* ¥ 7,731 ¥ 7,596 $ 71,660
* Depreciation is based on the straight-line method over the lease term of the leased assets, assuming no residual value.
Operating lease contractsThe amount of outstanding future lease payments due at 31st March, 1999 and 2000, which included the portion of interest there-on, was as follows:
Thousands ofMillions of yen U.S. dollars
1999 2000 2000
Future lease payments:Within one year ¥ 17 ¥ — $ —Over one year 26 — —
¥ 43 ¥ — $ —

32 Annual Report 2000
The statutory tax rates used for calculating deferred tax assets and deferred tax liabilities as at 31st March, 2000 was 42.05%.
(1) At 31st March, 2000, significant components of deferred tax assets and liabilities were as follows:
Thousands ofMillions of yen U.S. dollars
2000 2000
Deferred tax assets:Non-deductible provision for retirement benefits ¥27,919 $263,387 Loss on write-down of inventories 9,245 87,217Non-deductible depreciation 10,803 101,915Other 6,935 65,424
Total 54,902 517,943Valuation allowance (50) (471)
Total deferred tax assets 54,852 517,472
Deferred tax liabilities:Special tax purpose reserve (7,774) (73,340)Other (842) (7,943)
Total deferred tax liabilities (8,616) (81,283)
Deferred tax assets, net ¥46,236 $436,189
(2) Reconciliation between the statutory tax rate and effective tax rate is as follows:
Percent
2000
Statutory tax rate: 42.05%(Reconciliation)Entertainment expenses (2.04)Dividend income 0.05Inhabitant tax per capita (0.63)Other (1.70)
Effective tax rate 37.73%
8. DEFERRED TAX ASSETS
Reconciliation between “Cash on hand and at bank” and “Cash and cash equivalents” is as follows:
Thousands ofMillions of yen U.S. dollars
2000 2000
Cash on hand and at bank ¥90,776 $856,377Term deposits falling due in more than three months (375) (3,537)
Cash and cash equivalents ¥90,401 $852,840
7. NOTES TO THE CONSOLIDATED STATEMENT OF CASH FLOWS

33Annual Report 2000
Market value information of listed corporate shares and other securities included in “Investments in securities” held by theCompanies as at 31st March, 2000 is as follows:
Thousands ofMillions of yen U.S. dollars
2000 2000
Book Market Unrealised Unrealisedvalue value gain gain
Non-current assets:Shares ¥1,293 ¥2,938 ¥1,645 $15,519Other securities — — — —
Total ¥1,293 ¥2,938 ¥1,645 $15,519
Notes:(1) Source of market value:
Listed securities—principally based on the last price on the Tokyo Stock ExchangeOver-the-counter securities—based on trading prices issued by the Japan Securities Dealers Association
(2) Book value of securities, which are excluded from the above table:Non-current assets: unlisted securities (excluding over-the-counter securities)Book value: ¥12,245 million as at 31st March, 2000
(3) Market value information of investments in securities on a non-consolidated basis as at 31st March, 1999 is disclosed in Note 13, “MARKET VALUEINFORMATION OF INVESTMENTS IN SECURITIES,” which is included in the non-consolidated financial statements.
9. MARKET VALUE INFORMATION OF INVESTMENTS IN SECURITIES
10. INFORMATION ON DERIVATIVES
The Company uses derivative financial instruments, whichcomprise principally foreign forward exchange contracts andinterest rate and currency swap agreements, to reduce itsexposure to market risks from fluctuations in foreign currencyexchange and interest rates. The Company does not hold orissue financial instruments for trading purposes.
Although the Company may be exposed to losses in theevent of nonperformance by counterparties or interest and cur-rency fluctuations, it does not anticipate significant losses fromthe arrangements previously described.
As at 31st March, 2000, currency swap and interest swap contracts outstanding at year-end were as follows:
(1) Currency Swap
Thousands ofMillions of yen U.S. dollars
2000 2000
Notional Of which due Fair Valuation Valuationamount over one year value gain (loss) gain (loss)
Currency swap:Receiving dollars and paying yen ¥15,000 ¥15,000 ¥686 ¥686 $6,472
Total ¥15,000 ¥15,000 ¥686 ¥686 $6,472
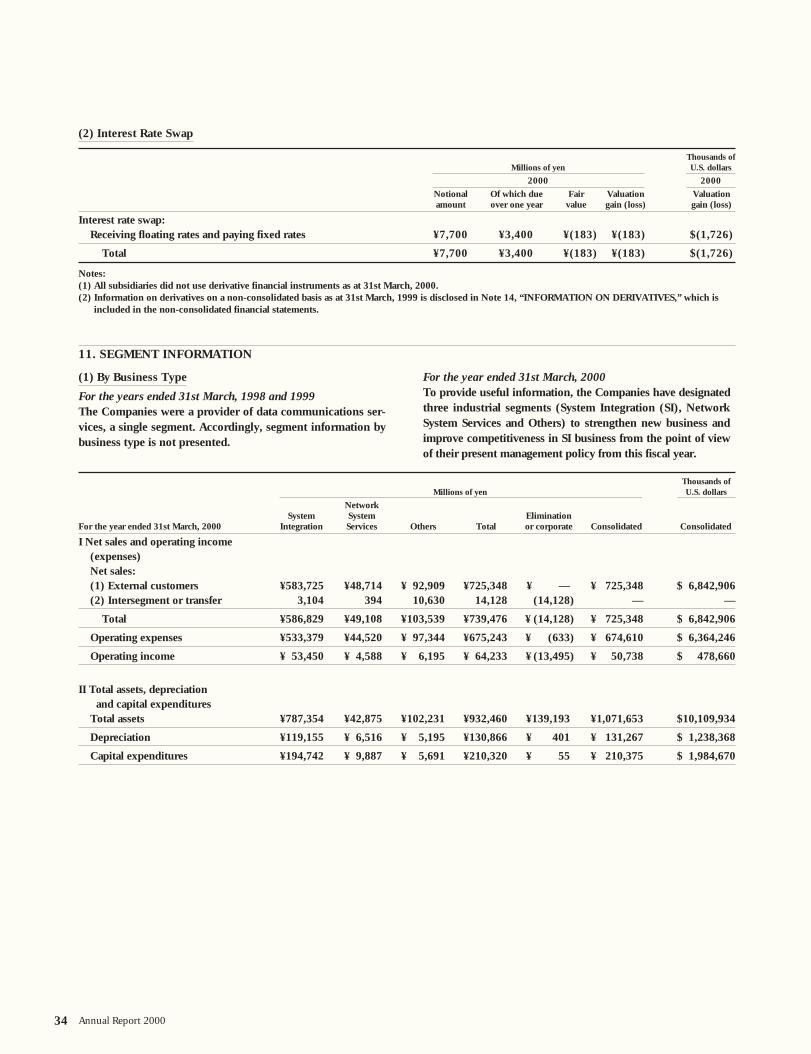
34 Annual Report 2000
(2) Interest Rate Swap
Thousands ofMillions of yen U.S. dollars
2000 2000
Notional Of which due Fair Valuation Valuationamount over one year value gain (loss) gain (loss)
Interest rate swap:Receiving floating rates and paying fixed rates ¥7,700 ¥3,400 ¥(183) ¥(183) $(1,726)
Total ¥7,700 ¥3,400 ¥(183) ¥(183) $(1,726)
Notes:(1) All subsidiaries did not use derivative financial instruments as at 31st March, 2000.(2) Information on derivatives on a non-consolidated basis as at 31st March, 1999 is disclosed in Note 14, “INFORMATION ON DERIVATIVES,” which is
included in the non-consolidated financial statements.
(1) By Business Type
For the years ended 31st March, 1998 and 1999 The Companies were a provider of data communications ser-vices, a single segment. Accordingly, segment information bybusiness type is not presented.
For the year ended 31st March, 2000 To provide useful information, the Companies have designatedthree industrial segments (System Integration (SI), NetworkSystem Services and Others) to strengthen new business andimprove competitiveness in SI business from the point of viewof their present management policy from this fiscal year.
11. SEGMENT INFORMATION
Thousands ofMillions of yen U.S. dollars
NetworkSystem System Elimination
For the year ended 31st March, 2000 Integration Services Others Total or corporate Consolidated Consolidated
I Net sales and operating income (expenses)Net sales:(1) External customers ¥583,725 ¥48,714 ¥ 92,909 ¥725,348 ¥ — ¥ 725,348 $ 6,842,906(2) Intersegment or transfer 3,104 394 10,630 14,128 (14,128) — —
Total ¥586,829 ¥49,108 ¥103,539 ¥739,476 ¥ (14,128) ¥ 725,348 $ 6,842,906
Operating expenses ¥533,379 ¥44,520 ¥ 97,344 ¥675,243 ¥ (633) ¥ 674,610 $ 6,364,246
Operating income ¥ 53,450 ¥ 4,588 ¥ 6,195 ¥ 64,233 ¥ (13,495) ¥ 50,738 $ 478,660
II Total assets, depreciation and capital expenditures
Total assets ¥787,354 ¥42,875 ¥102,231 ¥932,460 ¥139,193 ¥1,071,653 $10,109,934
Depreciation ¥119,155 ¥ 6,516 ¥ 5,195 ¥130,866 ¥ 401 ¥ 131,267 $ 1,238,368
Capital expenditures ¥194,742 ¥ 9,887 ¥ 5,691 ¥210,320 ¥ 55 ¥ 210,375 $ 1,984,670

35Annual Report 2000
Notes:(1) Classification of business was based on the types of services provided and the similarity of related markets and relevant assets.
(2) Major products of each business type are as follows:
Business Type Major ProductsSystem Integration In response to customers’ unique needs, to develop data communications systems, sell and lease such systems and provide sys-
tem integration and other related services
Network System Services In accordance with market needs, to provide a variety of information as well as data-processing and other services based on the Internet and other computer networks
Others To research, identify and evaluate customers’ management issues, plan and propose strategic plans for data communicationssystems, perform maintenance and facility management and provide other related services
(3) Unallocated operating expenses, included in “Elimination or Corporate,” amounted to ¥13,495 million. Such expenses primarily occurred in the adminis-trative section of the General Affairs Department of the Company.
(4) Corporate assets, included in “Elimination or Corporate,” amounted to ¥139,193 million. Such assets include temporary cash investments (cash on handand at bank) and assets in the administrative division of the Company.
On 21st June, 2000, the Company issued 1.88% yen bondsdue 21st June, 2010, in the principal amount of ¥30,000 mil-lion at the issue price of ¥99.93 per par value of ¥100, based
on a resolution made by the Board of Directors at the meetingheld on 22nd May, 2000.
12. SUBSEQUENT EVENT
(2) By Business Area
For the years ended 31st March, 1998 and 1999Not applicable because there were no foreign consolidatedsubsidiaries or significant overseas branches
For the year ended 31st March, 2000 Not applicable because there were no foreign consolidatedsubsidiaries or significant overseas branches
(3) Net Sales—Overseas
For the years ended 31st March, 1998 and 1999 The information is not required to be disclosed because net
sales overseas represent less than 10% of consolidated net sales.
For the year ended 31st March, 2000 The information is not required to be disclosed because net
sales overseas represent less than 10% of consolidated net sales.
36 Annual Report 2000
To: The Board of Directors ofNTT DATA CORPORATION
We have audited the accompanying consolidated balance sheets of NTT DATA CORPORATION and its consolidated subsidiaries asat 31st March, 1999 and 2000, and the related consolidated statements of operations, shareholders’ equity for the years ended 31stMarch, 1998, 1999 and 2000 and the statement of cash flows for the year ended 31st March, 2000, all expressed in Japanese yen.Our audits were made in accordance with auditing standards, procedures and practices generally accepted and applied in Japan and,accordingly, included such tests of the accounting records and such other auditing procedures as we considered necessary in the cir-cumstances.
In our opinion, the consolidated financial statements referred to above present fairly the consolidated financial position of NTTDATA CORPORATION and its consolidated subsidiaries as at 31st March, 1999 and 2000, and the consolidated results of theiroperations for the years ended 31st March, 1998, 1999 and 2000, and their cash flows for the year ended 31st March, 2000 in con-formity with accounting principles and practices generally accepted in Japan (see Note 1) applied on a consistent basis, except forthe changes, with which we concur, in accounting for allocation of expenses related to company houses as described in detail inNote 1 (3), “Change of Accounting Policy” and provision for retirement benefits as described in detail in Note 2 (10), “Reserve forRetirement Benefits,” of the Notes to the Consolidated Financial Statements.
As described in Note 2, “Summary of Significant Accounting Policies,” and Note 8, “Deferred Tax Assets,” of the Notes to theConsolidated Financial Statements, effective for the year ended 31st March, 2000, NTT DATA CORPORATION and its subsidiarieshave adopted new Japanese accounting standards for preparation of consolidated financial statements, accounting for research anddevelopment expenses and accounting for deferred income taxes.
The amounts expressed in U.S. dollars, provided solely for the convenience of the readers, have been translated on the basis set forthin Note 3.
ChuoAoyama Audit Corporation
Tokyo, Japan27th June, 2000
Report of Independent Certified Public Accountants on the ConsolidatedFinancial Statements
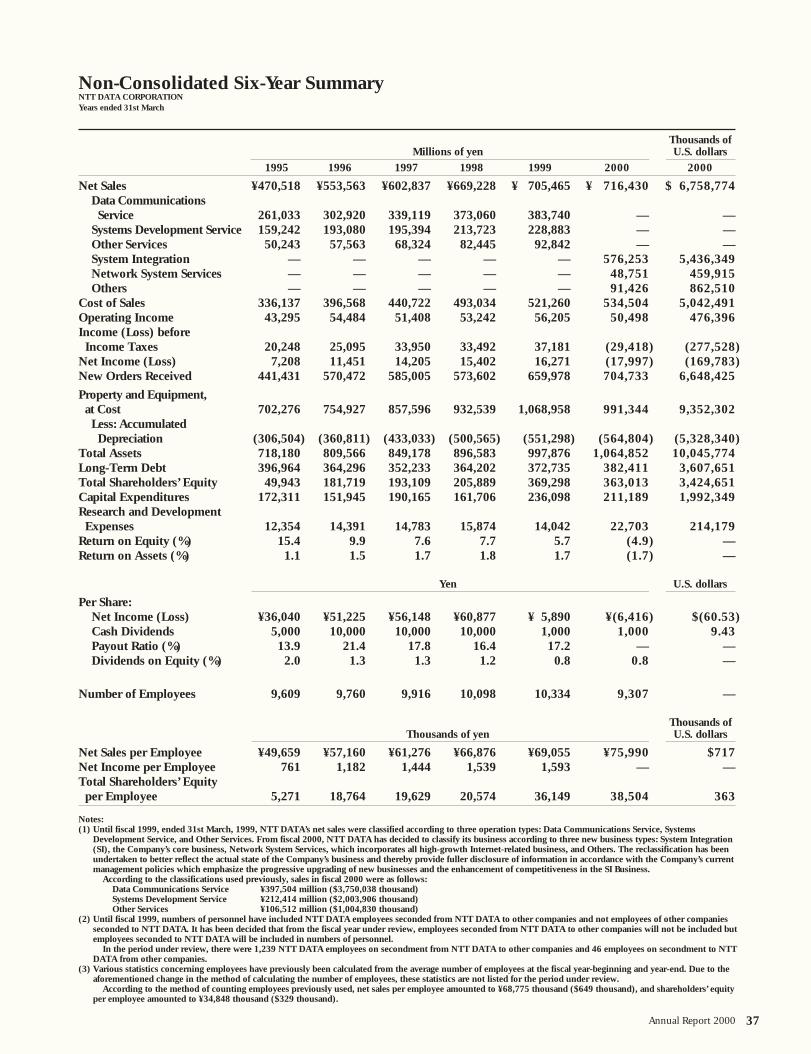
37Annual Report 2000
Thousands ofMillions of yen U.S. dollars
1995 1996 1997 1998 1999 2000 2000
Net Sales ¥470,518 ¥553,563 ¥602,837 ¥669,228 ¥ 705,465 ¥ 716,430 $ 6,758,774Data CommunicationsService 261,033 302,920 339,119 373,060 383,740 — —
Systems Development Service 159,242 193,080 195,394 213,723 228,883 — —Other Services 50,243 57,563 68,324 82,445 92,842 — —System Integration — — — — — 576,253 5,436,349Network System Services — — — — — 48,751 459,915Others — — — — — 91,426 862,510
Cost of Sales 336,137 396,568 440,722 493,034 521,260 534,504 5,042,491Operating Income 43,295 54,484 51,408 53,242 56,205 50,498 476,396Income (Loss) before
Income Taxes 20,248 25,095 33,950 33,492 37,181 (29,418) (277,528)Net Income (Loss) 7,208 11,451 14,205 15,402 16,271 (17,997) (169,783)New Orders Received 441,431 570,472 585,005 573,602 659,978 704,733 6,648,425
Property and Equipment, at Cost 702,276 754,927 857,596 932,539 1,068,958 991,344 9,352,302
Less: Accumulated Depreciation (306,504) (360,811) (433,033) (500,565) (551,298) (564,804) (5,328,340)
Total Assets 718,180 809,566 849,178 896,583 997,876 1,064,852 10,045,774Long-Term Debt 396,964 364,296 352,233 364,202 372,735 382,411 3,607,651Total Shareholders’ Equity 49,943 181,719 193,109 205,889 369,298 363,013 3,424,651Capital Expenditures 172,311 151,945 190,165 161,706 236,098 211,189 1,992,349Research and Development
Expenses 12,354 14,391 14,783 15,874 14,042 22,703 214,179Return on Equity (%) 15.4 9.9 7.6 7.7 5.7 (4.9) —Return on Assets (%) 1.1 1.5 1.7 1.8 1.7 (1.7) —
Yen U.S. dollars
Per Share:Net Income (Loss) ¥36,040 ¥51,225 ¥56,148 ¥60,877 ¥ 5,890 ¥(6,416) $(60.53)Cash Dividends 5,000 10,000 10,000 10,000 1,000 1,000 9.43Payout Ratio (%) 13.9 21.4 17.8 16.4 17.2 — —Dividends on Equity (%) 2.0 1.3 1.3 1.2 0.8 0.8 —
Number of Employees 9,609 9,760 9,916 10,098 10,334 9,307 —
Thousands ofThousands of yen U.S. dollars
Net Sales per Employee ¥49,659 ¥57,160 ¥61,276 ¥66,876 ¥69,055 ¥75,990 $717Net Income per Employee 761 1,182 1,444 1,539 1,593 — —Total Shareholders’ Equity
per Employee 5,271 18,764 19,629 20,574 36,149 38,504 363
Notes: (1) Until fiscal 1999, ended 31st March, 1999, NTT DATA’s net sales were classified according to three operation types: Data Communications Service, Systems
Development Service, and Other Services. From fiscal 2000, NTT DATA has decided to classify its business according to three new business types: System Integration(SI), the Company’s core business, Network System Services, which incorporates all high-growth Internet-related business, and Others. The reclassification has beenundertaken to better reflect the actual state of the Company’s business and thereby provide fuller disclosure of information in accordance with the Company’s currentmanagement policies which emphasize the progressive upgrading of new businesses and the enhancement of competitiveness in the SI Business.
According to the classifications used previously, sales in fiscal 2000 were as follows: Data Communications Service ¥397,504 million ($3,750,038 thousand)Systems Development Service ¥212,414 million ($2,003,906 thousand)Other Services ¥106,512 million ($1,004,830 thousand)
(2) Until fiscal 1999, numbers of personnel have included NTT DATA employees seconded from NTT DATA to other companies and not employees of other companiesseconded to NTT DATA. It has been decided that from the fiscal year under review, employees seconded from NTT DATA to other companies will not be included butemployees seconded to NTT DATA will be included in numbers of personnel.
In the period under review, there were 1,239 NTT DATA employees on secondment from NTT DATA to other companies and 46 employees on secondment to NTTDATA from other companies.
(3) Various statistics concerning employees have previously been calculated from the average number of employees at the fiscal year-beginning and year-end. Due to theaforementioned change in the method of calculating the number of employees, these statistics are not listed for the period under review.
According to the method of counting employees previously used, net sales per employee amounted to ¥68,775 thousand ($649 thousand), and shareholders’ equityper employee amounted to ¥34,848 thousand ($329 thousand).
Non-Consolidated Six-Year SummaryNTT DATA CORPORATIONYears ended 31st March

Thousands ofU.S. dollars
Millions of yen (Note 3)
ASSETS 1999 2000 2000
Current Assets:Cash on hand and at banks ¥ 94,039 ¥ 87,277 $ 823,368
Accounts receivable:Outside clients 91,325 100,253 945,783
“NTT” 11,731 24 226
Subsidiaries and affiliates 3,816 3,267 30,821
106,872 103,544 976,830
Less: allowance for bad debts (515) (394) (3,717)
106,357 103,150 973,113
Jobs and software in progress (Note 4) 54,991 39,430 371,981
Supplies 2,240 3,059 28,858
Prepaid expenses 3,702 4,307 40,632
Deferred tax assets–current (Note 12) — 12,105 114,198
Other current assets 10,019 9,373 88,425
Total current assets 271,348 258,701 2,440,575
Investments and Advances:
Investments in securities (Note 13) 6,437 6,019 56,783
Investments in subsidiaries and affiliates 7,221 9,312 87,849
Other investments and advances 3,139 5,016 47,321
Total investments and advances 16,797 20,347 191,953
Property and Equipment, at Cost (Note 5) 1,068,958 991,344 9,352,302
Less: accumulated depreciation (551,298) (564,804) (5,328,340)
517,660 426,540 4,023,962
Fixed Leasehold Deposits (Note 6) 29,897 29,602 279,264
Deferred Tax Assets–Non-Current (Note 12) — 32,838 309,792
Deferred Charges and Intangibles:
Software 159,181 178,077 1,679,972
Development cost of software in progress (Note 1 (3)) — 115,346 1,088,170
Other 2,993 3,401 32,086
162,174 296,824 2,800,228
¥ 997,876 ¥1,064,852 $10,045,774
The accompanying notes are an integral part of the statements.
38 Annual Report 2000
Non-Consolidated Balance SheetsNTT DATA CORPORATIONYears ended 31st March, 1999 and 2000

Thousands ofU.S. dollars
Millions of yen (Note 3)
LIABILITIES AND SHAREHOLDERS’ EQUITY 1999 2000 2000
Current Liabilities:
Short-term bank loans ¥ — ¥ 4,000 $ 37,736
Current portion of long-term debt 57,880 63,790 601,792
Accounts payable: Suppliers 55,631 81,597 769,783
“NTT” 723 105 991
Subsidiaries and affiliates 9,846 1,815 17,123
Subcontracting fees and other 30,708 26,296 248,075
96,908 109,813 1,035,972
Income taxes payable (Note 2 (6)) 12,352 17,265 162,877
Accrued expenses 8,351 8,110 76,509
Advances received 10,028 10,705 100,991
Other current liabilities 3,241 3,919 36,972
Total current liabilities 188,760 217,602 2,052,849
Long-Term Debt 372,735 382,411 3,607,651
Reserve for Retirement Benefits (Notes 2 (8) and (9)) 58,708 99,545 939,104
Long-Term Accrued Expenses (Note 2 (8)) 8,375 2,281 21,519
Total liabilities 628,578 701,839 6,621,123
Commitments and Contingent Liabilities (Note 7)
Shareholders’ Equity:
Common stock, par value—¥5,000 per share at 31st March, 1999 and 2000
Authorized—11,220,000 shares at 31st March, 1999 and 2000Issued—2,805,000 shares at 31st March, 1999 and 2000 142,520 142,520 1,344,528
Additional paid-in capital 139,300 139,300 1,314,151
Legal reserve (Note 8) 1,553 1,845 17,406
Special tax-purpose reserve 23,113 12,252 115,585
General reserve (Note 8) 44,000 59,000 556,604
Retained earnings (Note 15) 18,812 8,096 76,377
Total shareholders’ equity 369,298 363,013 3,424,651
¥ 997,876 ¥1,064,852 $10,045,774
39Annual Report 2000

40 Annual Report 2000
Thousands ofU.S. dollars
Millions of yen (Note 3)
1998 1999 2000 2000
Net Sales (Notes 9 and 10) ¥669,228 ¥705,465 ¥716,430 $6,758,774
Cost of Sales (Notes 1 (4) and 9) 493,034 521,260 534,504 5,042,491
Gross profit 176,194 184,205 181,926 1,716,283
Selling, General and Administrative Expenses
(Notes 1 (4) and 11) 122,952 128,000 131,428 1,239,887
Operating income 53,242 56,205 50,498 476,396
Non-Operating Income (Expenses):
Interest income 226 551 62 585
Interest expenses (15,438) (11,734) (10,127) (95,538)
Lease rental income on buildings (Note 9) 965 791 1,057 9,972
Cost of lease rental buildings (625) (515) (613) (5,783)
Amortization of past service cost of the pension plan (1,843) (2,008) (987) (9,311)
(Note 2 (8))New share issue expenses — (5,148) — —
Prior year’s research and development expenses — — (23,755) (224,104)
Provision for retirement benefits — — (40,245) (379,670)
Others, net (3,035) (961) (5,308) (50,075)
(19,750) (19,024) (79,916) (753,924)
Income (loss) before income taxes 33,492 37,181 (29,418) (277,528)
Income Taxes (Note 2 (6)):Current 18,090 20,910 18,887 178,179
Deferred — — (30,308) (285,924)
18,090 20,910 (11,421) (107,745)
Net income (loss) ¥ 15,402 ¥ 16,271 ¥(17,997) $ (169,783)
Yen U.S. dollars
Per Share:
Net income (loss) ¥ 60,877 ¥ 5,890 ¥ (6,416) $ (60.53)
Cash dividends 10,000 1,000 1,000 9.43
The accompanying notes are an integral part of the statements.
Non-Consolidated Statements of OperationsNTT DATA CORPORATIONFor the years ended 31st March, 1998, 1999 and 2000

41Annual Report 2000
Millions of yenNumber of Additional Special
shares Common paid-in Legal tax-purpose General Retained issued stock capital reserve reserve reserve earnings
Balance at 31st March, 1997 253,000 ¥ 67,335 ¥ 64,115 ¥ 968 ¥ 21,246 ¥ 24,000 ¥ 15,445
Net income for the year ended 31st March, 1998 — — — — — — 15,402Cash dividends — — — — — — (2,530)Transfer to legal reserve — — — 262 — — (262)Bonuses to directors and statutory auditors — — — — — — (92)Transfer to special tax-purpose reserve — — — — 1,842 — (1,842)Transfer to general reserve — — — — — 9,000 (9,000)
Balance at 31st March, 1998 253,000 67,335 64,115 1,230 23,088 33,000 17,121
Net income for the year ended 31st March, 1999 — — — — — — 16,271Cash dividends — — — — — — (3,110)Transfer to legal reserve — — — 323 — — (323)Bonuses to directors and statutory auditors — — — — — — (122)Transfer to special tax-purpose reserve — — — — 25 — (25)Transfer to general reserve — — — — — 11,000 (11,000)New shares issued on 12th May, 1998 27,500 75,185 75,185 — — — —Stock split at a rate of 1 into 10 2,524,500 — — — — — —
Balance at 31st March, 1999 2,805,000 142,520 139,300 1,553 23,113 44,000 18,812
Net loss for the year ended 31st March, 2000 — — — — — — (17,997)Cash dividends — — — — — — (2,805)Transfer to legal reserve — — — 292 — — (292)Bonuses to directors and statutory auditors — — — — — — (118)Transfer to special tax-purpose reserve — — — — (1,971) — 1,971Transfer to general reserve — — — — — 15,000 (15,000)Prior year’s adjustments for
adoption of deferred tax accounting — — — — — — 14,635Reversal of special tax purpose reserve with
adoption of deferred tax accounting — — — — (8,890) — 8,890
Balance at 31st March, 2000 2,805,000 ¥142,520 ¥139,300 ¥1,845 ¥12,252 ¥59,000 ¥ 8,096
Thousands of U.S. dollars (Note 3)
Number of Additional Specialshares Common paid-in Legal tax-purpose General Retained issued stock capital reserve reserve reserve earnings
Balance at 31st March, 1999 2,805,000 $ 1,344,528 $ 1,314,151 $ 14,651 $ 218,046 $ 415,095 $ 177,472
Net loss for the year ended 31st March, 2000 — — — — — — (169,783)Cash dividends — — — — — — (26,462)Transfer to legal reserve — — — 2,755 — — (2,755)Bonuses to directors and statutory auditors — — — — — — (1,113)Transfer to special tax-purpose reserve — — — — (18,593) — 18,593Transfer to general reserve — — — — — 141,509 (141,509)Prior year’s adjustments for
adoption of deferred tax accounting — — — — — — 138,066Reversal of special tax purpose reserve with
adoption of deferred tax accounting — — — — (83,868) — 83,868
Balance at 31st March, 2000 2,805,000 $1,344,528 $1,314,151 $17,406 $115,585 $556,604 $ 76,377
The accompanying notes are an integral part of the statements.
Non-Consolidated Statements of Shareholders’ EquityNTT DATA CORPORATIONFor the years ended 31st March, 1998, 1999 and 2000
42 Annual Report 2000
1. BASIS OF PRESENTING THE NON-CONSOLIDATED FINANCIAL STATEMENTS
(1) Accounting PrinciplesThe accompanying non-consolidated financial statements ofNTT DATA CORPORATION (the “Company”) have been pre-pared from accounts and records maintained by the Companyin accordance with the provisions set forth in the JapaneseCommercial Code and in conformity with accounting princi-ples and practices generally accepted in Japan, which are dif-ferent in certain respects as to application and disclosurerequirements of International Accounting Standards.
Relevant notes have been added, and certain reclassi-fications of account balances as disclosed in the basic non-consolidated financial statements in Japan have been made, so as to present them in a form that is more familiar to readersoutside Japan.
The non-consolidated financial statements are not intendedto present the non-consolidated financial position and resultsof operations in accordance with accounting principles andpractices generally accepted in countries and jurisdictions oth-er than Japan.
(2) Nippon Telegraph and Telephone Corporation (“NTT”)The Company is a subsidiary of NTT, which owned 1,520,010shares, or 54.18%, of common stock of the Company at 31stMarch, 2000.
(3) Change in Presentation of AccountsDue to the amendments of the Non-Consolidated FinancialStatements Regulation of Japan, the following presentations ofthe accounts in the non-consolidated financial statements havebeen changed for the fiscal year ended 31st March, 2000.
Previously, costs of software for internal use under develop-ment were included in “Property and Equipment, at Cost.” Inthis fiscal year, the cost has been separately disclosed as “Development costs of software in progress” on the non-consolidated balance sheets.
(4) Change of Accounting PolicyAllocation of expenses related to Company housing:
Previously, social and welfare expenses related to companyhouses were included in “Selling, General and AdministrativeExpenses.” In this fiscal year, such expenses have been allocat-ed to “Selling, General and Administrative Expenses,” “Cost ofGoods” and “Cost of Sales.” This accounting change decreased“Selling, General and Administrative Expenses” ¥2,737 million($25,821 thousand), while it increased “Cost of Goods” and“Cost of Sales” the same amount. This change is not material to“Operating income” and “Loss before income taxes.”
Notes to the Non-Consolidated Financial StatementsNTT DATA CORPORATION
2. SUMMARY OF SIGNIFICANT ACCOUNTING POLICIES
(1) InventoriesJobs and software in progress is stated at cost, which is deter-mined on an individual project basis.
Supplies are valued at cost, which is determined by the first-in, first-out method.
(2) Valuation of SecuritiesSecurities having market quotations on stock exchangesincluded in marketable securities (current portfolio) or invest-ments in securities (non-current portfolio) are valued at thelower of cost or market value, cost being determined by themoving-average method. Other securities are valued at cost,which is determined by the moving-average method.
(3) Investments in Subsidiaries and AffiliatesInvestments in subsidiaries (majority-owned companies and40% to 50% owned companies which are controlled by theCompany, substantially) and affiliates (20% to 50% ownedcompanies and 15% to 20% owned companies which areaffected by the Company, substantially) are valued at cost. Theequity method of accounting for investments in common stockof subsidiaries and affiliates has not been followed by theCompany in the accompanying non-consolidated financialstatements under Japanese accounting practices. Appropriatewrite-downs are recorded for investments in certain companies
in cases where their value has declined substantially and suchimpairments of value are not deemed temporary.
(4) Property and EquipmentDepreciation is computed by the declining-balance method atrates based on the estimated useful lives of assets that are pre-scribed by the Japanese income tax laws. The range of usefullives is principally from three to 50 years for buildings, struc-tures and facilities and from two to 20 years for machinery,vehicles, equipment, furniture and tools.
Normal repairs and maintenance, including minor renova-tions and improvements, are charged to expenses as incurred.
The Company has changed the depreciation method ofbuildings (except for building improvements) which wereacquired after 1st April, 1998 from the declining-balancemethod to the straight-line method pursuant to the amend-ments to the corporate income tax laws, which took effectfrom the year starting on and after 1st April, 1998.
(5) Deferred Charges and Intangibles
1) Intangible AssetsAmortization of intangible assets, except for software, is com-puted on the straight-line method over the period prescribedby the Japanese income tax laws.

43Annual Report 2000
Amortization of software is based on the following:
a) Software developed for saleThe amortization costs of software developed for external saleare computed as the higher of: (a) the amount based on salesin the year, as a proportion of total estimated sales over notmore than a three-year sales period, or (b) the amount com-puted on a straight-line basis over the remaining sales periodin which the software can be sold by the Company.
b) Software developed for internal useSoftware for internal use is amortized on a straight-line basisover the estimated useful lives, not exceeding five years.
However, software which is exclusively developed for thepurpose of tailor-made Data Communications Services toclients under specific contracts is amortized on a straight-linebasis over the relevant contract period.
2) Deferred ChargesBond issue expenses, bond discounts at issue and new shareissue expenses are charged to expenses as incurred.
(6) Income TaxesIncome taxes of the Company consist of corporate income tax-es, local inhabitants taxes and enterprise taxes.
In the year ended 31st March, 2000, the Company adoptedthe deferred tax accounting method in accordance with theamended regulations for the preparation of non-consolidatedfinancial statements. Income taxes were determined using theasset and liability approach, whereby deferred tax assets andliabilities were recognized in respect of temporary differencesbetween the tax basis of assets and liabilities and those asreported in the financial statements. The cumulative effect ofadopting deferred tax accounting as at 1st April, 1999 wascharged to retained earnings.
In the years ended 31st March, 1998 and 1999, income tax-es of the Company were provided for at an amount currentlypayable based on the tax returns filed with tax authorities.
(7) Allowance for Bad Debts The allowance for bad debts account is provided for in anamount equivalent to the maximum allowed deduction for taxpurposes that is determined as a prescribed percentage of totalreceivables (net of any payables to whom the Company hasreceivables), plus the amount to cover all individual accountsthat are estimated to be uncollectible.
(8) Reserve for Retirement BenefitsThe “Reserve for retirement benefits” is provided in an amountequivalent to the undiscounted liability the Company wouldhave been required to pay if all eligible employees had volun-tarily retired at the balance sheet date. For the previous fiscalyear, a reserve for retirement benefits was provided in anamount equivalent to the discounted present value of the lia-bility the Company would have been required to pay under the
same circumstances. This accounting change was made for andfor dealing with the shortage in the reserve for employees’retirement benefits based on pension accounting which will beadopted for the year ended 31st March, 2001. This accountingchange increased “Provision for retirement benefits” of¥40,245 million ($379,670 thousand), which resulted in anincrease in “Loss before income taxes” of the same amount.
In addition, the Company has a funded pension plan to cov-er a portion of the retirement benefits payable to employees.The past service costs arising from the adoption of the pensionplan were recorded as long-term accrued expenses.
The balance of long-term accrued expenses is to be paidover an eight-year period from the adoption of the funded pen-sion plan.
As of 31st March, 2000, the accumulated fund assets of thepension plan aggregated ¥38,239 million ($360,745 thousand).
(9) Reserve for Retirement Benefits to Directors and Statutory AuditorsWith respect to directors and statutory auditors, the Companyhas no legal obligation to pay retirement benefits: however, itis a customary practice in Japan to make lump-sum paymentsto a director or statutory auditor upon retirement with theapproval of a general meeting of shareholders. Annual provi-sions are made in the accounts for the estimated costs of thistermination plan, which is not funded. The balance of accruedretirement benefits relative to directors and statutory auditorsin an amount of ¥611 million ($5,764 thousand) is included in“Reserve for Retirement Benefits” in the accompanying non-consolidated balance sheet as at 31st March, 2000.
(10) Dividends per ShareCash dividends per share shown for each year in the accompa-nying non-consolidated statements of operations representdividends declared as applicable to the respective years.
(11) Appropriation of Retained EarningsUnder the Japanese Commercial Code and the Articles ofIncorporation of the Company, the plan for appropriation ofretained earnings (including cash dividend payments) pro-posed by the Board of Directors should be approved at theshareholders’ meeting, which must be held within threemonths after the end of each fiscal year. The appropriationcharged to retained earnings as reflected in the accompanyingnon-consolidated financial statements represents that applica-ble to the immediately preceding fiscal year that wereapproved at the shareholders’ meeting and disposed of duringthat year.
As is customary in Japan, the payment of bonuses to direc-tors and statutory auditors is made out of retained earningsinstead of being charged to income for the year, which consti-tutes a part of the appropriations mentioned above.
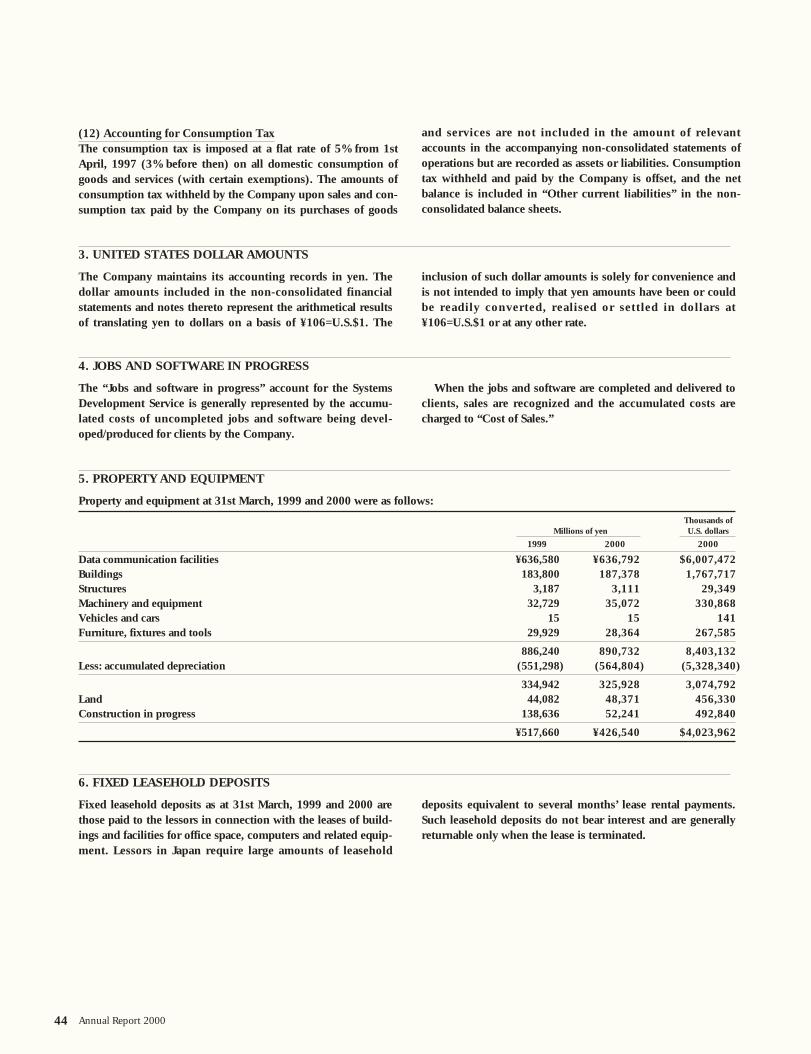
44 Annual Report 2000
(12) Accounting for Consumption TaxThe consumption tax is imposed at a flat rate of 5% from 1stApril, 1997 (3% before then) on all domestic consumption ofgoods and services (with certain exemptions). The amounts ofconsumption tax withheld by the Company upon sales and con-sumption tax paid by the Company on its purchases of goods
and services are not included in the amount of relevantaccounts in the accompanying non-consolidated statements ofoperations but are recorded as assets or liabilities. Consumptiontax withheld and paid by the Company is offset, and the netbalance is included in “Other current liabilities” in the non-consolidated balance sheets.
6. FIXED LEASEHOLD DEPOSITS
Fixed leasehold deposits as at 31st March, 1999 and 2000 arethose paid to the lessors in connection with the leases of build-ings and facilities for office space, computers and related equip-ment. Lessors in Japan require large amounts of leasehold
deposits equivalent to several months’ lease rental payments.Such leasehold deposits do not bear interest and are generallyreturnable only when the lease is terminated.
5. PROPERTY AND EQUIPMENT
Property and equipment at 31st March, 1999 and 2000 were as follows:
Thousands ofMillions of yen U.S. dollars
1999 2000 2000
Data communication facilities ¥636,580 ¥636,792 $6,007,472Buildings 183,800 187,378 1,767,717Structures 3,187 3,111 29,349Machinery and equipment 32,729 35,072 330,868Vehicles and cars 15 15 141Furniture, fixtures and tools 29,929 28,364 267,585
886,240 890,732 8,403,132Less: accumulated depreciation (551,298) (564,804) (5,328,340)
334,942 325,928 3,074,792Land 44,082 48,371 456,330Construction in progress 138,636 52,241 492,840
¥517,660 ¥426,540 $4,023,962
3. UNITED STATES DOLLAR AMOUNTS
The Company maintains its accounting records in yen. Thedollar amounts included in the non-consolidated financialstatements and notes thereto represent the arithmetical resultsof translating yen to dollars on a basis of ¥106=U.S.$1. The
inclusion of such dollar amounts is solely for convenience andis not intended to imply that yen amounts have been or couldbe readily converted, realised or settled in dollars at¥106=U.S.$1 or at any other rate.
4. JOBS AND SOFTWARE IN PROGRESS
The “Jobs and software in progress” account for the SystemsDevelopment Service is generally represented by the accumu-lated costs of uncompleted jobs and software being devel-oped/produced for clients by the Company.
When the jobs and software are completed and delivered toclients, sales are recognized and the accumulated costs arecharged to “Cost of Sales.”

45Annual Report 2000
7. COMMITMENTS AND CONTINGENT LIABILITIES
As at 31st March, 2000, the Company was contingently liablefor guarantees of loans borrowed by Nippon Leisure CardSystem Co., Ltd. in an amount of ¥8,868 million ($83,660thousand).
All finance lease contracts other than those by which theownership of the leased assets is to be transferred to lesseesare accounted for by a method similar to the operating leasemethod.
Thousands ofMillions of yen U.S. dollars
1999 2000 2000
Acquisition cost ¥44,680 ¥42,899 $404,708Accumulated depreciation (26,172) (29,295) (276,368)
Net book value ¥18,508 ¥13,604 $128,340
Depreciation* ¥ 7,669 ¥ 7,481 $ 70,575
* Depreciation is based on the straight-line method over the lease term of the leased assets, assuming no residual value.
Lease rental expenses on finance lease contracts without ownership transfer for the years ended 31st March, 1999 and 2000 wereas follows:
Thousands ofMillions of yen U.S. dollars
1999 2000 2000
Lease rental expenses ¥ 7,669 ¥ 7,481 $ 70,575
The amount of outstanding future lease payments due at 31st March, 1999 and 2000, which included the portion of interestthereon, was as follows:
Thousands ofMillions of yen U.S. dollars
1999 2000 2000
Future lease payments:Within one year ¥ 7,152 ¥ 4,821 $ 45,481Over one year 11,356 8,783 82,859
¥18,508 ¥13,604 $128,340
8. LEGAL RESERVE AND GENERAL RESERVE
The Japanese Commercial Code provides that an amount equalto at least 10% of cash distributions paid out of retained earn-ings be appropriated each year to a legal reserve until suchreserve equals 25% of the common stock account. This reservemay be transferred to common stock by a resolution of theBoard of Directors or used to reduce a deficit by a resolution ofthe shareholders’ meeting, but is not available for dividendpayments.
The Company’s Board of Directors, with subsequentapproval by shareholders, has made annual appropriations ofretained earnings for unspecified purposes, the accumulatedbalance of which is presented as “General reserve” in theaccompanying non-consolidated financial statements. Any dis-position of such appropriations shall be at the discretion of theBoard of Directors and shareholders.
Assumed data as to acquisition cost, accumulated deprecia-tion, net book value and depreciation expense of the leased
assets (data communication equipment and other), whichincluded the portion of interest thereon, were as follows:
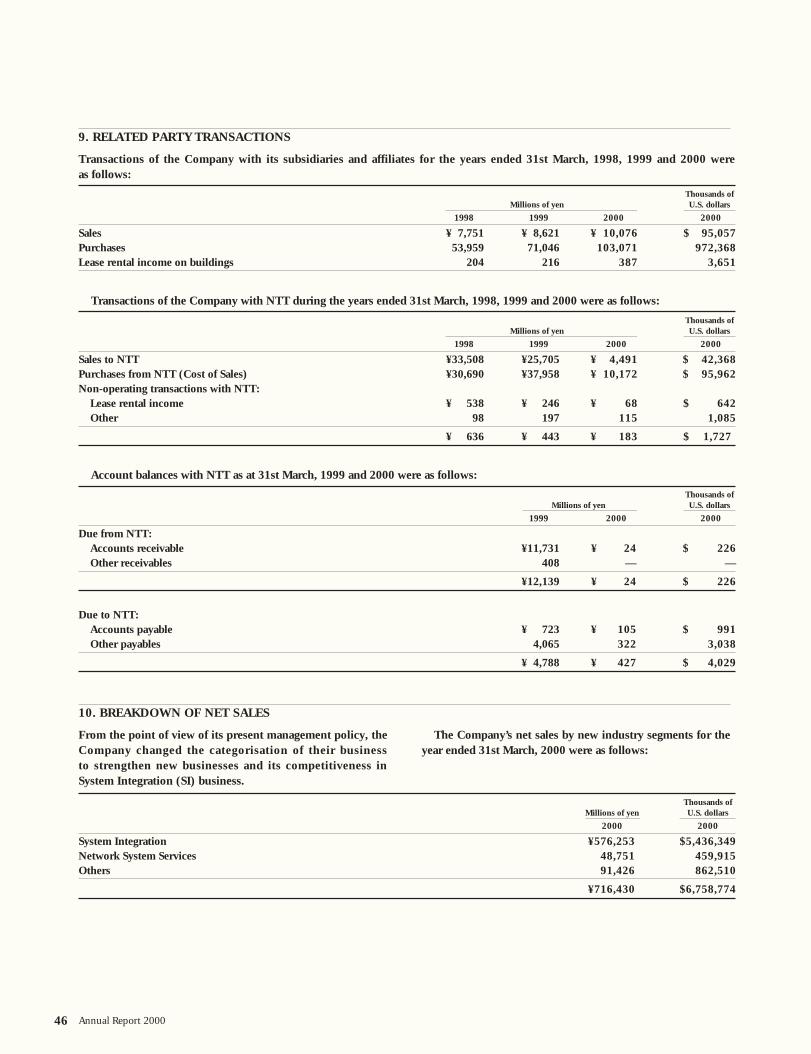
46 Annual Report 2000
9. RELATED PARTY TRANSACTIONS
Transactions of the Company with its subsidiaries and affiliates for the years ended 31st March, 1998, 1999 and 2000 were as follows:
Thousands ofMillions of yen U.S. dollars
1998 1999 2000 2000
Sales ¥ 7,751 ¥ 8,621 ¥ 10,076 $ 95,057Purchases 53,959 71,046 103,071 972,368Lease rental income on buildings 204 216 387 3,651
Transactions of the Company with NTT during the years ended 31st March, 1998, 1999 and 2000 were as follows:
Thousands ofMillions of yen U.S. dollars
1998 1999 2000 2000
Sales to NTT ¥33,508 ¥25,705 ¥ 4,491 $ 42,368Purchases from NTT (Cost of Sales) ¥30,690 ¥37,958 ¥ 10,172 $ 95,962Non-operating transactions with NTT:
Lease rental income ¥ 538 ¥ 246 ¥ 68 $ 642Other 98 197 115 1,085
¥ 636 ¥ 443 ¥ 183 $ 1,727
Account balances with NTT as at 31st March, 1999 and 2000 were as follows:
Thousands ofMillions of yen U.S. dollars
1999 2000 2000
Due from NTT:Accounts receivable ¥11,731 ¥ 24 $ 226Other receivables 408 — —
¥12,139 ¥ 24 $ 226
Due to NTT:Accounts payable ¥ 723 ¥ 105 $ 991Other payables 4,065 322 3,038
¥ 4,788 ¥ 427 $ 4,029
10. BREAKDOWN OF NET SALES
From the point of view of its present management policy, theCompany changed the categorisation of their business to strengthen new businesses and its competitiveness inSystem Integration (SI) business.
The Company’s net sales by new industry segments for theyear ended 31st March, 2000 were as follows:
Thousands ofMillions of yen U.S. dollars
2000 2000
System Integration ¥576,253 $5,436,349Network System Services 48,751 459,915Others 91,426 862,510
¥716,430 $6,758,774

47Annual Report 2000
The breakdown by operation type for the years ended 31st March, 1998, 1999 and 2000 are as follows:
Thousands ofMillions of yen U.S. dollars
1998 1999 2000 2000
Data Communications Service ¥373,060 ¥383,740 ¥397,504 $3,750,038Systems Development Service 213,723 228,883 212,414 2,003,906Other Services 82,445 92,842 106,512 1,004,830
¥669,228 ¥705,465 ¥716,430 $6,758,774
11. BREAKDOWN OF SELLING, GENERAL AND ADMINISTRATIVE EXPENSES
The Company’s selling, general and administrative expenses for the years ended 31st March, 1998, 1999 and 2000 are as follows:
Thousands ofMillions of yen U.S. dollars
1998 1999 2000 2000
Employees’ salaries, wages and other payroll cost ¥ 40,696 ¥ 42,559 ¥ 42,494 $ 400,887Lease rentals 11,351 11,189 10,195 96,179Research and development expenses 15,874 14,042 22,703 214,179Depreciation 7,442 7,282 6,176 58,264Subcontractor expenses 25,061 28,411 30,962 292,095Advertising expenses 2,800 3,514 2,707 25,538Other 19,728 21,003 16,191 152,745
¥122,952 ¥128,000 ¥131,428 $1,239,887
12. DEFERRED TAX ASSETS
The statutory tax rates used for calculating deferred tax assets and deferred tax liabilities as of 31st March, 2000 were 42.05%.(1) At 31st March, 2000, significant components of deferred tax assets and liabilities were as follows:
Thousands ofMillions of yen U.S. dollars
2000 2000
Deferred tax assets:Non-deductible provision for retirement benefits ¥ 27,873 $262,953 Loss on write-down of inventories 10,802 101,906Non-deductible depreciation 9,119 86,028Other 5,751 54,255
Total deferred tax assets 53,545 505,142
Deferred tax liabilities:Special tax purpose reserve (7,771) (73,311)Other (831) (7,840)
Total deferred tax liabilities (8,602) (81,151)
Deferred tax assets, net ¥ 44,943 $423,991
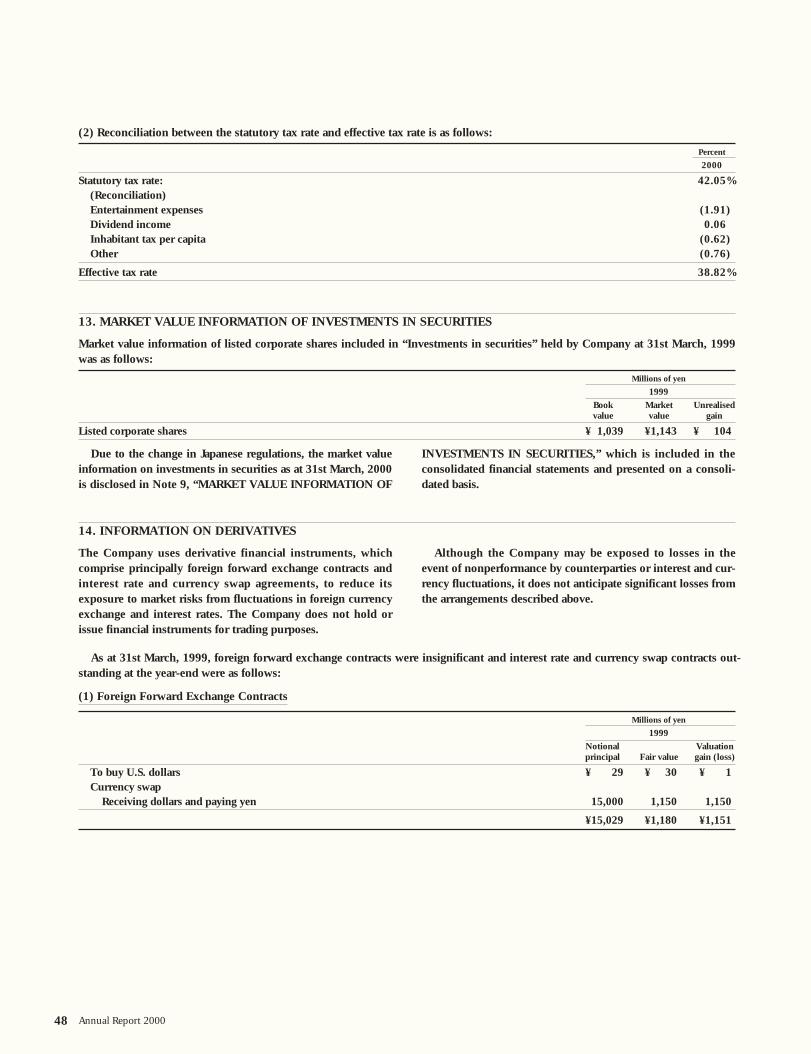
48 Annual Report 2000
As at 31st March, 1999, foreign forward exchange contracts were insignificant and interest rate and currency swap contracts out-standing at the year-end were as follows:
(1) Foreign Forward Exchange Contracts
Millions of yen
1999
Notional Valuation principal Fair value gain (loss)
To buy U.S. dollars ¥ 29 ¥ 30 ¥ 1Currency swap
Receiving dollars and paying yen 15,000 1,150 1,150
¥15,029 ¥1,180 ¥1,151
Due to the change in Japanese regulations, the market valueinformation on investments in securities as at 31st March, 2000is disclosed in Note 9, “MARKET VALUE INFORMATION OF
INVESTMENTS IN SECURITIES,” which is included in theconsolidated financial statements and presented on a consoli-dated basis.
13. MARKET VALUE INFORMATION OF INVESTMENTS IN SECURITIES
Market value information of listed corporate shares included in “Investments in securities” held by Company at 31st March, 1999was as follows:
Millions of yen
1999
Book Market Unrealisedvalue value gain
Listed corporate shares ¥ 1,039 ¥1,143 ¥ 104
14. INFORMATION ON DERIVATIVES
The Company uses derivative financial instruments, whichcomprise principally foreign forward exchange contracts andinterest rate and currency swap agreements, to reduce itsexposure to market risks from fluctuations in foreign currencyexchange and interest rates. The Company does not hold orissue financial instruments for trading purposes.
Although the Company may be exposed to losses in theevent of nonperformance by counterparties or interest and cur-rency fluctuations, it does not anticipate significant losses fromthe arrangements described above.
(2) Reconciliation between the statutory tax rate and effective tax rate is as follows:
Percent
2000
Statutory tax rate: 42.05%(Reconciliation)Entertainment expenses (1.91)Dividend income 0.06Inhabitant tax per capita (0.62)Other (0.76)
Effective tax rate 38.82%

49Annual Report 2000
Thousands ofMillions of yen U.S. dollars
Retained earnings:Balance at 31st March, 2000 ¥ 8,096 $76,377Reversal of special tax purpose reserve into retained earnings 2,121 20,009Appropriations:
Cash dividends (¥500 per share) (1,403) (13,236)Transfer to legal reserve (151) (1,424)Bonuses to directors and statutory auditors (110) (1,038)Transfer to special tax purpose reserve program (580) (5,472)Transfer to special tax purpose reserve for specified communications equipment (209) (1,971)Transfer to general reserve (4,000) (37,736)
(6,453) (60,877)
Balance to be carried forward to the next year ¥ 3,764 $35,509
15. SUBSEQUENT EVENTS
(1) Appropriations of Retained EarningsAppropriations of retained earnings in respect of the year end-ed 31st March, 2000, which was proposed by the Board of
Directors and approved at the shareholders’ meeting held on27th June, 2000, were as follows:
Due to the change in Japanese regulations, information onderivatives is disclosed in Note 10, “INFORMATION ON
DERIVATIVES,” which is included in the consolidated finan-cial statements and presented on a consolidated basis.
(2) Issued BondsOn June 21, 2000, the Company issued 1.88% yen bonds dueJune 21, 2010, in the principal amount of ¥30,000 million at
the issue price of ¥99.93 per par value of ¥100, based on a res-olution made by the Board of Directors at the meeting held on22nd May, 2000.
(2) Interest Rate Swap
Millions of yen
1999
Notional Valuation principal Fair value gain (loss)
Receiving floating rates and paying fixed rates ¥12,700 ¥(342) ¥(342)
50 Annual Report 2000
To: The Board of Directors ofNTT DATA CORPORATION
We have audited the accompanying non-consolidated balance sheets of NTT DATA CORPORATION as at 31st March, 1999 and2000, and the related non-consolidated statements of operations and shareholders’ equity for the years ended 31st March, 1998,1999 and 2000, all expressed in Japanese yen. Our audits were made in accordance with auditing standards, procedures and prac-tices generally accepted and applied in Japan and, accordingly, included such tests of the accounting records and such other audit-ing procedures as we considered necessary in the circumstances.
In our opinion, the non-consolidated financial statements referred to above present fairly the non-consolidated financial position ofNTT DATA CORPORATION as at 31st March, 1999 and 2000, and the non-consolidated results of its operations for the years ended31st March, 1998, 1999 and 2000, in conformity with accounting principles and practices generally accepted in Japan (see Note 1(1)) applied on a consistent basis, except for the changes, with which we concur, in accounting for allocation of expenses related tocompany houses as described in detail in Note 1 (4), “Change of Accounting Policy,” and provision for retirement benefits asdescribed in detail in Note 2 (8), “Reserve for Employees Retirement Benefits,” of the Notes to the Non-consolidated FinancialStatements.
As described in Note 2, “Summary of Significant Accounting Policies,” and Note 12, “Deferred Tax Assets,” of the Notes to the Non-Consolidated Financial Statements, effective for the year ended 31st March, 2000, NTT DATA CORPORATION has adopted newJapanese accounting standards with respect to accounting for research and development expenses and accounting for deferredincome taxes.
The amounts expressed in U.S. dollars, provided solely for the convenience of the readers, have been translated on the basis set forthin Note 3.
ChuoAoyama Audit Corporation
Tokyo, Japan27th June, 2000
Report of Independent Certified Public Accountants on the Non-ConsolidatedFinancial Statements

51Annual Report 2000
As of 31st March, 2000, the Company had 44 subsidiaries and 14 affiliates.The Company prepared, for the first time, consolidated financial statements as at and for the year ended 31st March, 1995, in
which the financial statements of the Company and nine major subsidiaries were consolidated. One affiliate was accounted for bythe equity method.
The following table provides information relating to the Company’s consolidated subsidiaries and principal affiliate, all of whichare engaged in business in Japan, as of 31st March, 2000.
Major Subsidiaries and Affiliates
Issued Share Capitalas at 31st March, 2000 Percentage Held
Name (millions of yen) (directly or indirectly) Principal Business
Consolidated Subsidiaries:NTT System Technologies Inc. 100 75.0 Systems planning
NTT System Service Corporation 70 65.0 Systems planning
FUKUSHIMA NTT DATA COMMUNICATIONSSYSTEMS CORPORATION 100 53.0 Systems sales
TOKYO NTT DATA COMMUNICATIONSSYSTEMS CORPORATION 800 75.0 Systems sales
NAGANO NTT DATA COMMUNICATIONSSYSTEMS CORPORATION 100 52.0 Systems sales
TOKAI NTT DATA COMMUNICATIONSSYSTEMS CORPORATION 300 59.0 Systems sales
KANSAI NTT DATA COMMUNICATIONSSYSTEMS CORPORATION 400 56.5 Systems sales
CHUGOKU NTT DATA COMMUNICATIONSSYSTEMS CORPORATION 150 59.3 Systems sales
KYUSHU NTT DATA COMMUNICATIONSSYSTEMS CORPORATION 200 99.8 Systems sales
Affiliate:Japan Network System Corporation 1,375 29.1 Systems sales
Chairman of the Board
Tomeo Kambayashi*
President and Chief
Executive Officer
Toshiharu Aoki*
Senior Executive Vice
Presidents
Teruyoshi Kawai*
Shigetoshi Takaki*
Makoto Sato*
Executive Vice Presidents
Noboru Hagiwara
Tomokazu Hamaguchi
Atsushi Ohashi
Masayoshi Isoi
Yuji Imai
Kiyoshi Nakaki
Naoshi Nakamura
Senior Vice Presidents
Toshihiko Yamamori
Takeo Kojima
Katsumi Haga
Hiroki Arakawa
Masayoshi Horikoshi
Yoshitaka Makitani
Noboru Hirata
Toru Yamashita
Shunichi Kominami
Noritaka Uji
Kenichi Abe
Yuji Inoue
Kanji Koide
Standing Statutory
Auditors
Hiromi Kanba
Koji Toda
Hiroshi Hongo
Statutory Auditor
Kouichi Tanaka
Directors and Auditors(As of 27th June, 2000)
*Representative Director

NTT DATA 1793-015 (W) 610 pt x (H) 794 pt
52 Annual Report 2000
Investor InformationThe ten largest shareholders of the Company appearing on the Company’s register ofshareholders as of 31st March, 2000 were as follows:
Percentage Number of of Total
Name Shares Held Shares in Issue
Nippon Telegraph and Telephone Corporation 1,520,010 54.18%
The Mitsubishi Trust and Banking Corporation, Trust Account 69,784 2.48
The Sumitomo Trust & Banking Co., Limited, Trust Account 64,325 2.29
The Toyo Trust and Banking Company, Limited, Trust Account (A) 40,904 1.45
The Chuo Trust & Banking Co., Ltd., Trust Account 34,272 1.22
The Norinchukin Trust & Banking Co., Ltd. 29,856 1.06
State Street Bank and Trust Company 23,678 0.84
UBS AG London Asia Equities 23,308 0.83
Nippon Life Insurance Company 22,796 0.81
Nippon Life Insurance Company (Special Account of Pension Fund) 19,771 0.70
Total 1,848,704 65.90%
Number of Shares Issued and Number of Shareholders
(1) Total Number of Authorized Shares 11,220,000
(2) Number of Shares Issued and Outstanding 2,805,000
(3) Number of Shareholders 95,780
Stock Price Chart
Notes:
(1) The Nikkei Stock Average is the average stock
price of 225 companies listed on the First Section
of the Tokyo Stock Exchange.
(2) The Company’s stock price has been adjusted to
the current par value of ¥5,000 per share.
Japanese financial institutions 23.17%
Foreign institutions and others 11.05%
Japanese individuals and others 8.72%
Japanese securities companies 1.83%
Other Japanese corporations 55.23%
Distribution of Ownership among Shareholders(On a number of shares basis)
10,000
15,000
20,000
25,000
600
1,100
1,600
2,100
2,600
2000/Mar.1999/Apr.1998/Apr.1997/Apr.1996/Apr.
NTT DATA’s Stock Price (Closing)
NTT DATA’s Stock Price (Closing)(Thousands of yen)
Nikkei Stock Average (Closing)
NikkeiStock Average (Closing)(Yen)

NTT DATA 1793-015 (W) 610 pt x (H) 794 pt
53Annual Report 2000
Brief History
1967 Oct. The Data Communications Bureau, which was thepredecessor of the Company, was established withinNippon Telegraph and Telephone Public Corporation as an internal bureau.
1988 May The Company was incorporated as a joint stock compa-ny under the laws of Japan for an indefinite durationand as a wholly owned subsidiary of Nippon Telegraphand Telephone Corporation (NTT).
July The operations of the Data Communications Sector ofNTT were transferred to the Company.
1993 Nov. The Company became the first company in the Japaneseinformation services industry to receive the prestigiousDeming Prize, which is given to the company with thebest record in research and quality control.
1995 Apr. The Company conducted a public offering of 20,000new shares, each share having a par value of ¥50,000.The outstanding shares were listed on the SecondSection of the Tokyo Stock Exchange (TSE).
1996 Feb. The Company conducted a global offering of 27,000new shares in Japan, in conjunction with an offering of6,000 new shares outside Japan, each share having a parvalue of ¥50,000.
June The English version of the Company’s name waschanged from NTT DATA Communications SystemsCorporation to NTT DATA CORPORATION.
Sept. The outstanding shares were listed on the First Sectionof the TSE.
1998 May The Company conducted a global offering of 16,500new shares in Japan, in conjunction with an offering of11,000 new shares outside Japan, each share having apar value of ¥50,000.
Aug. A stock split resulted in a change in par value wherebyeach ¥50,000 par value share was divided into ten¥5,000 par value shares.
Corporate Data
Head Office:Toyosu Center Bldg., 3-3, Toyosu 3-chome,Koto-ku, Tokyo 135-6033, JapanTelephone: +81-3-5546-8202
Date of Establishment:23rd May, 1988
Common Stock:¥142,520 million
Account Settlement Date:31st March
Independent Auditors:ChuoAoyama Audit Corporation
Outline of Personnel (Non-consolidated basis) (As of 31st March, 2000)
Category Number Average Average LengthAge of Service (years)
Total (or Avg.) 9,307 39.0 17.7Note 1: Until fiscal 1999, numbers of personnel have included NTT DATA employees seconded from
NTT DATA to other companies, and not employees of other companies seconded to NTTDATA. To gain a clearer understanding of the employment situation at NTT DATA, it has beendecided that from the fiscal year under review employees seconded from NTT DATA to othercompanies will not be included, but that employees seconded to NTT DATA will be includedin numbers of personnel.
In the period under review, there were 1,239 NTT DATA employees on secondment fromNTT DATA to other companies and 46 employees on secondment to NTT DATA from othercompanies.
Note 2: In calculating the average length of service with regard to personnel transferred to NTT DATAfrom Nippon Telegraph and Telephone Corp., NTT Communications Corp., NTT East Corp.,and NTT West Corp., the length of service these personnel had accumulated at their previouscompany has been added to their length of service at NTT DATA.
Note 3: Number of employees on a consolidated basis was 10,500 as of 31st March, 2000.
Overseas OfficesU.K. BranchLevel 10, City Tower, 40 Basinghall Street, London EC2V 5DE, U.K.Telephone: +44-20-7374-0040Facsimile: +44-20-7374-2275Hong Kong Branch19/F., CRE Building, 303 Hennessy Road, Wanchai, Hong Kong Telephone: +852-2596-0503Facsimile: +852-2596-0812Malaysia Branch27th floor, UBN TOWER, No. 10, JALAN P. RAMLEE, 50250 Kuala Lumpur, MalaysiaTelephone: +60-3-206-4112Facsimile: +60-3-206-4118Technical Center of California4005 Miranda Avenue, Suite 150, Palo Alto, CA 94304, U.S.A.Telephone: +1-650-687-0635Facsimile: +1-650-687-0645NTT DATA International L.L.C830 Third Avenue, 3rd Floor, New York, NY 10022, U.S.A.Telephone: +1-212-355-3388Facsimile: +1-212-355-0357NTT DATA U.S.A. L.L.C95 Christopher Columbus Drive,Jersey City, NJ 07302, U.S.A.Telephone: +1-201-413-5400Facsimile: +1-201-413-5485
NTT DATA provides information on its own home page on the Internet.Available through a WWW server, the URLs are:(in Japanese) http://www.nttdata.co.jp/(in English) http://www.nttdata.co.jp/index_e.html
Aforementioned trademarks and product names are valid in Japan.
Number of Employees at Fiscal Year-end
0
3,000
6,000
9,000
12,000
’00’99’98’97’96
*
*Number of employees according to previous method of calculation

Toyosu Center Bldg., 3-3 Toyosu 3-chome,
Koto-ku, Tokyo 135-6033, Japan
Telephone: +81-3-5546-8202
URL: http://www.nttdata.co.jp/Printed in Japan using recycled paper
2000.9.8000