Embed Size (px)
Citation preview

APRIL 4, 2013
Majority Now Supports Legalizing Marijuana
FOR FURTHER INFORMATION CONTACT
THE PEW RESEARCH CENTER FOR THE
PEOPLE & THE PRESS
Michael Dimock
Director
Carroll Doherty
Associate Director
Seth Motel
Research Assistant
1615 L St, N.W., Suite 700
Washington, D.C. 20036
Tel (202) 419-4372
Fax (202) 419-4399
www.people-press.org

www.people-press.org
12
24
17
32
45
52
84
73 78
61
50
45
1969 1980 1991 2002 2013
Illegal
Legal
7
14
15
32
21
54
43
17
50
34
65
1969 1980 1991 2002 2013
Greatest (born before 1928)
Silent (born 1925-1945)
Boomer (born 1946-1964)
Gen X (born 1965-1980)
Millennial (born 1981-now)
Majority Now Supports Legalizing Marijuana
For the first time in more
than four decades of polling
on the issue, a majority of
Americans favor legalizing
the use of marijuana. A
national survey finds that
52% say that the use of
marijuana should be made
legal while 45% say it should
not.
Support for legalizing
marijuana has risen 11 points
since 2010. The change is
even more dramatic since the
late 1960s. A 1969 Gallup
survey found that just 12%
favored legalizing marijuana
use, while 84% were
opposed.
The survey by the Pew
Research Center, conducted
March 13-17 among 1,501
adults, finds that young
people are the most
supportive of marijuana
legalization. Fully 65% of
Millennials –born since
1980 and now between 18
and 32 – favor legalizing the
use of marijuana, up from
just 36% in 2008. Yet there
also has been a striking
change in long-term
Views of Legalizing Marijuana: 1969-2013
% saying marijuana should be …
PEW RESEARCH CENTER March 13-17, 2013. 1973-2008 data from General Social Survey; 1969 and 1972 data from Gallup.
Boomers’ Support for Legalization Rebounds to 1970s Levels
PEW RESEARCH CENTER March 13-17, 2013. 1973-2008 data from General Social Survey; 1969 and 1972 data from Gallup. Generational lines shown when significant sample is available.

2
www.people-press.org
attitudes among older generations, particularly Baby Boomers.
Half (50%) of Boomers now favor legalizing marijuana, among the highest percentages
ever. In 1978, 47% of Boomers favored legalizing marijuana, but support plummeted
during the 1980s, reaching a low of 17% in 1990. Since 1994, however, the percentage of
Boomers favoring marijuana legalization has doubled, from 24% to 50%.
Generation X, born between 1965 and 1980, came of age in the 1990s when there was
widespread opposition to legalizing marijuana. Support for marijuana legalization
among Gen X also has risen dramatically – from just 28% in 1994 to 42% a decade later
and 54% currently.
The Silent Generation continues to be less supportive of marijuana legalization than
younger age cohorts. But the percentage of Silents who favor
legalization has nearly doubled –from 17% to 32% – since
2002.
The survey finds that an increasing percentage of Americans
say they have tried marijuana. Overall, 48% say they have ever
tried marijuana, up from 38% a decade ago. Roughly half in all
age groups, except for those 65 and older, say they have tried
marijuana.
About one-in-ten (12%) say they have used marijuana in the
past year. Age differences are much more pronounced when it
comes to the recent use of marijuana: 27% of those younger
than 30 say they have used marijuana in the past year, at least
three times the percentage in any other age group.
Among those who say they have used marijuana in the past
year, 47% say they used it “just for fun,” while 30% say it was
for a medical issue; 23% volunteer they used it for medical
purposes and also just for fun.
Nearly Half Have Ever Tried Marijuana
Have you ever used marijuana?
Mar 2013
%
Yes 48
Used it in the past year?
In past year 12
Not in past year 36
No 51
Don’t know 1
100
In the past year, did you use marijuana for* …
Medical issue 30
Just for fun 47
Both (Vol.) 23
Don’t know 0
100
PEW RESEARCH CENTER March 13-17, 2013. *Asked of those who say they used marijuana in past year (N=146). Figures may not add to 100% because of rounding.

3
www.people-press.org
50
32 35
50
10 12
2006 2013
Morally wrong
Not a moral issue
Morally acceptable
As support for marijuana legalization has grown, there has been a decline in the
percentage viewing it as a “gateway drug.” Currently, just 38% agree that “for most
people the use of marijuana leads to the use of
hard drugs.” In 1977, 60% said its use led to
the use of hard drugs.
More recently, there has been a major shift in
attitudes on whether it is immoral to smoke
marijuana. Currently, 32% say that smoking
marijuana is morally wrong, an 18-point
decline since 2006 (50%). Over this period,
the percentage saying that smoking marijuana
is not a moral issue has risen 15 points (from
35% then to 50% today).
Amid changing attitudes about marijuana, a
sizable percentage of Americans (72%) say
that government efforts to enforce marijuana
laws cost more than they are worth. And 60%
say that the federal government should not
enforce federal laws prohibiting the use of
marijuana in states where it is legal. Last fall,
voters in two states – Colorado and
Washington state – approved the personal use
of small amounts of marijuana for recreational
use.
There are partisan differences over legalizing
marijuana use and whether smoking marijuana
is morally wrong. But Republicans and
Democrats have similar views on enforcing
marijuana laws: 57% of Republicans and 59%
of Democrats say that the federal government should not enforce federal marijuana laws
in states that permit its use. Substantial majorities of both Republicans (67%) and
Democrats (71%) also say federal enforcement of marijuana laws is not worth the cost.
More Today Say That Smoking Marijuana Not a Moral Issue
PEW RESEARCH CENTER Jan. 9-13, 2013.
Partisans Differ on Legalization, But Agree on Law Enforcement
Total Rep Dem Ind
Marijuana should be … % % % %
Legal 52 37 59 60
Illegal 45 60 39 37
In states that allow use, federal government …
Should enforce laws 35 40 35 32
Should not enforce laws 60 57 59 64
Gov’t efforts to enforce marijuana laws cost more than they are worth
Agree 72 67 71 78
Disagree 23 26 24 18
PEW RESEARCH CENTER March 13-17, 2013.

4
www.people-press.org
While Americans increasingly support legalizing marijuana and fewer see its potential
dangers, many still do not like the idea of people using marijuana around them. About
half (51%) say they would feel uncomfortable if people around them were using
marijuana, while 48% would not feel uncomfortable. As with nearly all attitudes about
marijuana, there are substantial age differences in discomfort with others using
marijuana – 74% of those 65 and older say they would be uncomfortable if people
around them used marijuana, compared with 35% of those under 30.
Recent Rise in Support for Legalization
The long-term shift in favor of legalizing
marijuana has accelerated in the past three
years. About half (52%) of adults today support
legalizing the use of marijuana, up from 41% in
2010. Since then, support for legalization has
increased among all demographic and political
groups.
Nearly two-thirds of those under 30 (64%)
favor legalizing marijuana use, as do about half
or more of those 30 to 49 (55%) and 50 to 64
(53%). There is far less support for legalization
among those 65 and older (33%); still, there
has been an 11-point rise in support among
older Americans since 2010.
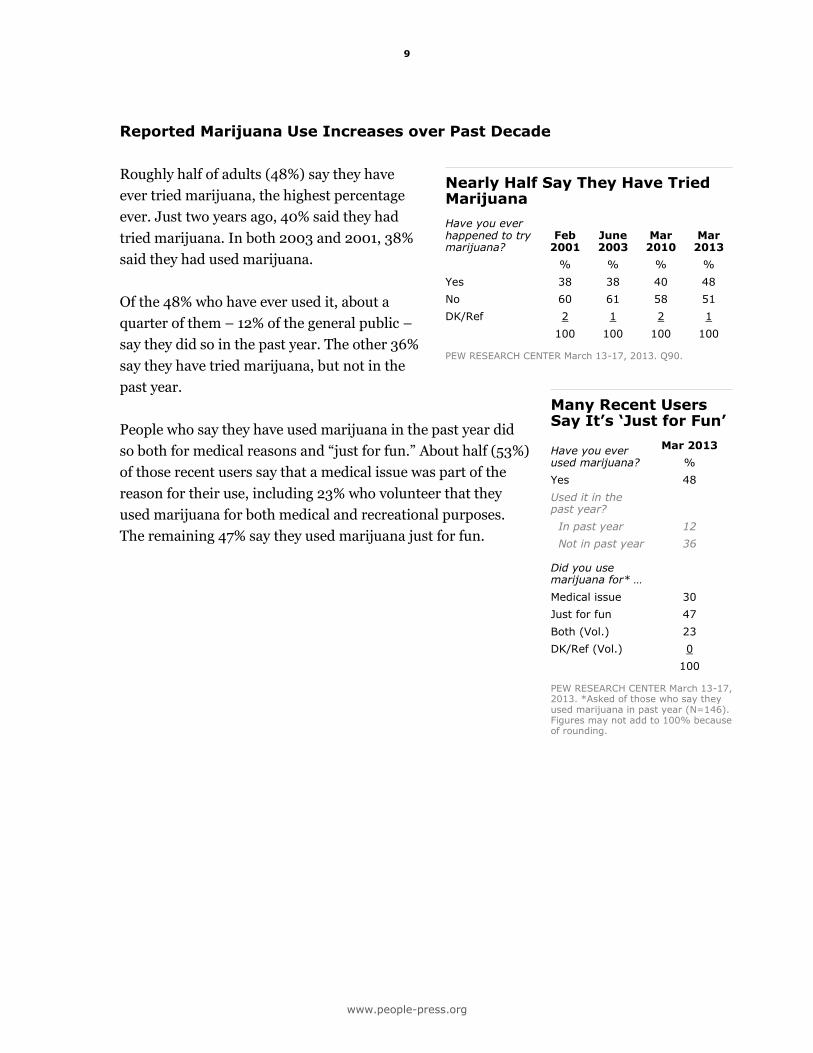
Men (57%) are somewhat more likely than
women (48%) to support marijuana
legalization. Support is comparable among
racial and ethnic groups — roughly half of
whites (52%), blacks (56%) and Hispanics
(51%) favor legalizing the use of marijuana.
Only about three-in-ten conservative
Republicans (29%) say marijuana use should
be legal. Moderate and liberal Republicans are
Across-the-Board Increase in Support for Marijuana Legalization
% saying marijuana should be legalized
Mar 2010
Mar 2013
10-13 change
% % %
Total 41 52 +11
Men 45 57 +12
Women 38 48 +10
White 42 52 +10
Black 41 56 +15
Hispanic 35 51 +16
18-29 58 64 +6
30-49 42 55 +13
50-64 40 53 +13
65+ 22 33 +11
College grad+ 39 52 +13
Some college 45 59 +14
HS or less 41 47 +6
Republican 24 37 +13
Conservative Rep 20 29 +9
Mod/Lib Rep 36 53 +17
Democrat 48 59 +11
Cons/Mod Dem 44 52 +8
Liberal Dem 57 73 +16
Independent 49 60 +11
Ever tried marijuana 64 70 +6
Never tried marijuana 25 35 +10
PEW RESEARCH CENTER March 13-17, 2013. Whites and blacks include only those who are not Hispanic; Hispanics are of any race.

5
www.people-press.org
far more likely than conservatives to favor legalization (53%).
Like Republicans, Democrats are ideologically
divided over legalizing marijuana. While 73%
of liberal Democrats favor legalizing use of
marijuana, only about half of conservative and
moderate Democrats agree (52%).
Fully 70% of those who have ever tried
marijuana, including 89% of those who have
tried it in the past year, say the use of
marijuana should be legal. That compares with
just 35% of those who have never tried
marijuana. Support for legalization has
increased since 2010 among those who have
ever tried marijuana (by six points) as well as
those who have not (by 10 points).
Opinions about legalizing marijuana vary little
among states that have more permissive
marijuana laws and those that do not. A
majority (55%) of those in states that have
legalized medical marijuana or have
decriminalized (or legalized) marijuana for
personal use favor legalizing marijuana. Yet
50% of those in states in which marijuana is
not decriminalized (or legal for any purpose)
also favor its legalization.
Shifting Attitudes about Marijuana
Over the past three decades, there has been a
substantial decline in the percentage saying
that for most people marijuana leads to the use
of hard drugs. Just 38% express that view
currently; in a 1977 Gallup survey, 60% said
marijuana led to the use of hard drugs.
Views of Legalization Similar in States with Different Laws
Marijuana should be
States where …
Legal Illegal DK
% % %
Medical marijuana is legal; marijuana decriminalized or legal (24 states and D.C.) 55 42 3=100
Just medical is legal (8 states and D.C.) 57 40 3=100
Marijuana is decriminalized; medical marijuana is illegal (6 states) 54 44 2=100
Medical marijuana is legal and marijuana decriminalized (10 states) 55 41 4=100
Not decriminalized or medical (26 states) 50 47 3=100
PEW RESEARCH CENTER March 13-17, 2013. Decriminalization laws reduce the penalties associated with the use or possession of small amounts of marijuana. Figures may not add to 100% because of rounding. See Appendix for list of states.
Boomers’ Views of Marijuana as ‘Gateway’ Same Now as in 1977
% saying marijuana use leads to use of hard drugs
Apr 1977
Mar 2013
77-13 change
% % %
Total 60 38 -22
Millennial -- 31 --
Gen X -- 36 --
Boomer 39 37 -2
Silent 62 60 -2
Greatest 76 -- --
Republican 70 48 -22
Democrat 61 37 -24
Independent 53 33 -20
Ever tried marijuana?
Yes 19 26 +7
No 72 50 -22
PEW RESEARCH CENTER March 13-17, 2013. April 1977 data from Gallup.
6
www.people-press.org
Much of this shift is the result of generational change. In the 1977 survey, most of those
in Greatest Generation (76%), born before 1928, accepted the link between marijuana
and hard drug use. The generations that have come of age since 1977 – Gen X and
Millennials – are far less likely to say that marijuana use leads to the use of hard drugs
(36% of Gen X, 31% of Millennials).
Notably, Boomers view this issue in about the same way as they did in 1977, when there
was relatively broad support among this age cohort for legalization. Currently, 37% of
Boomers say that marijuana use leads to the use of hard drugs; in 1977, 39% expressed
this view. Similarly, 60% of Silents currently say that marijuana use leads to the use of
hard drugs, which is virtually the same as opinion among this age cohort in 1977 (62%).
Those who have never tried marijuana are much less likely to view marijuana as a
gateway to hard drugs than in the 1970s. In 1977, 72% of those who had never tried
marijuana said it led to use of hard drugs; today, just half (50%) of those who have never
tried it express this view. In 1977, few who had tried marijuana said there was a link to
hard drugs (19%); that remains the case today (26%).
Most Say Marijuana Has Medical Uses
Opinions also have changed about whether
marijuana has legitimate medical uses. By 77%
to 16%, most say that marijuana does have
legitimate medical uses. In an ABC News
survey in 1997, a smaller majority (58%) said it
had legitimate medical uses, while 34% said it
did not.
There are only modest partisan differences in
views of the medical uses of marijuana: 82% of
independents, 76% of Democrats and 72% of
Republicans say it has legitimate medical uses.
Age is also a factor in these views, but even
among those 65 and older – who oppose
legalizing marijuana use by nearly two-to-one – a majority (60%) says that marijuana
has legitimate medical uses.
Older Americans Say Marijuana Has Legitimate Medical Uses
Does marijuana have legitimate medical uses?
Does Does not DK
% % %
Total 77 16 7=100
18-29 84 12 4=100
30-49 81 14 5=100
50-64 77 17 6=100
65+ 60 23 16=100
Republican 72 20 8=100
Democrat 76 16 8=100
Independent 82 13 5=100
PEW RESEARCH CENTER March 13-17, 2013. Q88. Figures may not add to 100% because of rounding.

7
www.people-press.org
Morality of Smoking Marijuana
The percentage of Americans who say that
smoking marijuana is morally wrong also has
declined dramatically since 2006. A survey
earlier this year found that 32% of Americans
say that smoking marijuana is morally wrong,
down 18 points since 2006. Over the same
period, the percentage saying it is not a moral
issue has increased by 15 points (from 35% to
50%).
As with many of the changes in opinions about
marijuana and its use, the decline in the
percentages who think that smoking marijuana
is morally wrong has occurred across most
demographic and political groups.
Those in the Silent Generation are more likely
than younger people to say that smoking
marijuana is morally wrong. But since 2006,
the percentage of Silents expressing this view
has decreased from 71% to 48%.
More Say That Smoking Marijuana Is Not a Moral Issue
Smoking marijuana is …
Feb 2006
Jan 2013
06-13 Change
% %
Morally acceptable 10 12 +2
Morally wrong 50 32 -18
Not a moral issue 35 50 +15
Depends/DK 5 6 +1
100 100
PEW RESEARCH CENTER Jan. 9-13, 2013. Figures may not add to 100% because of rounding.
Across Generations, Fewer Think Marijuana Use Is Morally Wrong
% saying that smoking marijuana is morally wrong
Feb 2006
Jan 2013
06-13 Change
% %
Millennial -- 26
Gen X 47 34 -13
Boomer 47 29 -18
Silent 71 48 -23
Republican 65 47 -18
Democrat 47 26 -21
Independent 41 28 -13
PEW RESEARCH CENTER Jan. 9-13, 2013

8
www.people-press.org
Federal Enforcement of Marijuana Laws
Nearly three-quarters of Americans (72%) say that in general, government efforts to
enforce marijuana laws cost more than they are worth. And when it comes to the
question of whether the federal government should enforce marijuana laws in states that
have approved marijuana use, a majority (60%) says it should not.
There is agreement across partisan and
demographic groups that federal government
enforcement of marijuana laws is not worth the
cost. Fully 78% of independents, 71% of
Democrats and 67% of Republicans say
government enforcement efforts cost more
than they are worth.
Similarly, there is substantial opposition to the
federal government enforcing marijuana laws
in states that permit the legal use of marijuana:
64% of independents say the federal
government should not enforce federal
marijuana laws in such states, as do 59% of
Democrats and 57% of Republicans.
Gov’t Enforcement of Marijuana Laws Seen as Not Worth the Cost
Gov’t efforts to enforce marijuana laws cost more than they are worth
Agree Dis-
agree DK
% % %
Total 72 23 6=100
Republican 67 26 6=100
Democrat 71 24 5=100
Independent 78 18 4=100
Should fed gov’t enforce fed laws in states that allow marijuana use?
Should Should
not DK
% % %
Total 35 60 5=100
Republican 40 57 3=100
Democrat 35 59 5=100
Independent 32 64 4=100
PEW RESEARCH CENTER March 13-17, 2013. Figures may not add to 100% because of rounding.
9
www.people-press.org
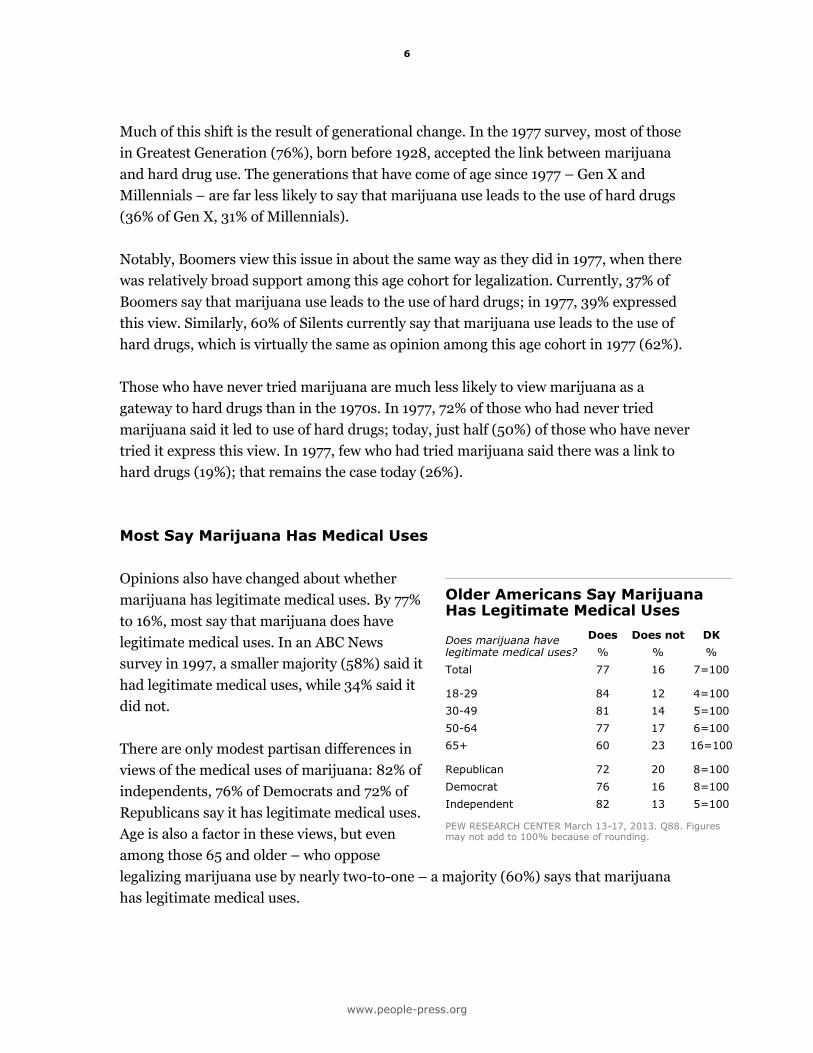
Reported Marijuana Use Increases over Past Decade
Roughly half of adults (48%) say they have
ever tried marijuana, the highest percentage
ever. Just two years ago, 40% said they had
tried marijuana. In both 2003 and 2001, 38%
said they had used marijuana.
Of the 48% who have ever used it, about a
quarter of them – 12% of the general public –
say they did so in the past year. The other 36%
say they have tried marijuana, but not in the
past year.
People who say they have used marijuana in the past year did
so both for medical reasons and “just for fun.” About half (53%)
of those recent users say that a medical issue was part of the
reason for their use, including 23% who volunteer that they
used marijuana for both medical and recreational purposes.
The remaining 47% say they used marijuana just for fun.
Nearly Half Say They Have Tried Marijuana
Have you ever happened to try marijuana?
Feb 2001
June 2003
Mar 2010
Mar 2013
% % % %
Yes 38 38 40 48
No 60 61 58 51
DK/Ref 2 1 2 1
100 100 100 100
PEW RESEARCH CENTER March 13-17, 2013. Q90.
Many Recent Users Say It’s ‘Just for Fun’
Have you ever used marijuana?
Mar 2013
%
Yes 48
Used it in the past year?
In past year 12
Not in past year 36
Did you use marijuana for* …
Medical issue 30
Just for fun 47
Both (Vol.) 23
DK/Ref (Vol.) 0
100
PEW RESEARCH CENTER March 13-17, 2013. *Asked of those who say they used marijuana in past year (N=146). Figures may not add to 100% because of rounding.

10
www.people-press.org
More than half of young people (56%) say they
have ever tried marijuana, and 27% say they
have tried it in the past year – by far the
highest percentage in any age category.
About half of those 30- to 49 (51%) and 50-64
(54%) have ever tried marijuana, although only
about one-in-ten did so last year. Just 22% of
adults 65 and older have ever used marijuana,
including 2% who say they have used it in the
past year.
Men are more likely to say they have tried
marijuana than women, 54% vs. 42%. Half of
whites and blacks (50%) say they have ever
tried marijuana, compared with 34% of
Hispanics.
Democrats and Republicans are about equally
likely to say they have tried the drug over their
lifetimes, 47% vs. 43%; independents are
somewhat more likely to have used it (53%). However, over the past year, more
independents (14%) and Democrats (13%) than Republicans (7%) say they have used
marijuana.
There is no significant difference in lifetime or recent use between people in states with
some form of legalized marijuana and those in other states.
Young People More Likely to Have Used Marijuana in Past Year
Have you ever happened to try marijuana/In the past year? Yes, ever
Yes, in the past
year Never
% % %
Total 48 12 51
18-29 56 27 43
30-49 51 9 48
50-64 54 7 44
65+ 22 2 78
Men 54 13 45
Women 42 10 57
White 50 11 48
Black 50 15 48
Hispanic 34 13 66
Republican 43 7 56
Democrat 47 13 51
Independent 53 14 46
PEW RESEARCH CENTER March 13-17, 2013. Figures may not add to 100% because of rounding. Whites and blacks include only those who are not Hispanic; Hispanics are of any race.

11
www.people-press.org
Half Would Be Uncomfortable around Marijuana Users
About half of Americans (51%) say they would
feel uncomfortable if people around them used
marijuana while 48% would not. Just 35% of
those under 30 say they would be
uncomfortable if people around them used
marijuana, the lowest percentage of any age
group. Twice as many of those 65 and older
(74%) say they would feel uncomfortable
around marijuana use.
More women than men say they would be
bothered by people around them using
marijuana. Nearly six-in-ten women (57%) say
they would feel uncomfortable if people
around them used marijuana, compared with
44% of men.
Parents are about as likely as non-parents to
have ever tried marijuana and they have
similar feelings about people using marijuana
around them. About half of parents (50%) and
non-parents (51%) say they would feel
uncomfortable if people around them used
marijuana.
More Women Feel Uncomfortable Around Marijuana Users
People using marijuana around you would make you feel …
Uncom-fortable
Not uncom- fortable DK
% % %
Total 51 48 1=100
18-29 35 65 *=100
30-49 49 50 1=100
50-64 51 48 1=100
65+ 74 24 3=100
Men 44 55 1=100
Women 57 42 1=100
White 51 48 1=100
Black 46 54 *=100
Hispanic 42 48 *=100
College grad+ 58 39 2=100
Some college 43 57 1=100
HS or less 52 47 *=100
Republican 61 39 1=100
Democrat 49 49 2=100
Independent 46 54 1=100
Parent 50 49 1=100
Non-Parent 51 48 1=100
Ever tried marijuana?
Yes 27 72 1=100
No 74 25 1=100
PEW RESEARCH CENTER March 13-17, 2013. Figures may not add to 100% because of rounding.
12
www.people-press.org
9 12 14
1969 1980 1991 2002 2013
60 Independent 59 Democrat
37 Republican
14
10
1969 1980 1991 2002 2013
48 Female
57 Male
Appendix: State Marijuana Laws
Only medical marijuana is legal:
AZ, DE, DC, HI, MI, MT, NJ, NM, VT
Marijuana is decriminalized:
MN, MS, NE, NY, NC, OH
Medical marijuana is legal and marijuana decriminalized:
AK, CA, CO, CT, ME, MA, MS, NV, OR, RI, WA
Not decriminalized or medical:
AL, AR, FL, GA, ID, IL, IN, IA, KS, KY, LA, MD, MO, NH, ND, OK, PA, SC, SD, TN, TX,
UT, VA, WV, WI, WY
Source: National Conference of State Legislatures and National Organization for the
Reform of Marijuana Laws, 2013.
Men Historically More in Favor of Legalization
PEW RESEARCH CENTER March 13-17, 2013. 1973-2008 from General Social Survey; 1969 and 1972 from Gallup.
Republicans Far Less Supportive of Legalizing Marijuana
PEW RESEARCH CENTER March 13-17, 2013. 1973-2008 from General Social Survey; 1969 and 1972 from Gallup.

13
www.people-press.org
About the Surveys
Most of the analysis in this report is based on telephone interviews conducted March 13-17, 2013, among a national sample of 1,501 adults, 18 years of age or older, living in all 50 U.S. states and the District of Columbia (750 respondents were interviewed on a landline telephone, and 751 were interviewed on a cell phone, including 385 who had no landline telephone). The survey was conducted by Abt SRBI. A combination of landline and cell phone random digit dial samples were used; both samples were provided by Survey Sampling International. Interviews were conducted in English and Spanish. Respondents in the landline sample were selected by randomly asking for the youngest adult male or female who is now at home. Interviews in the cell sample were conducted with the person who answered the phone, if that person was an adult 18 years of age or older. For detailed information about our survey methodology, see http://people-press.org/methodology/. The combined landline and cell phone sample are weighted using an iterative technique that matches gender, age, education, race, Hispanic origin and nativity and region to parameters from the 2011 Census Bureau's American Community Survey and population density to parameters from the Decennial Census. The sample also is weighted to match current patterns of telephone status and relative usage of landline and cell phones (for those with both), based on extrapolations from the 2012 National Health Interview Survey. The weighting procedure also accounts for the fact that respondents with both landline and cell phones have a greater probability of being included in the combined sample and adjusts for household size among respondents with a landline phone. Sampling errors and statistical tests of significance take into account the effect of weighting. The following table shows the unweighted sample sizes and the error attributable to sampling that would be expected at the 95% level of confidence for different groups in the survey:
Group Unweighted sample size Plus or minus…
Total sample 1,501 2.9 percentage points
Republican 420 5.6 percentage points
Democrat 487 5.2 percentage points
Independent 498 5.1 percentage points
Generations
Millennial (Born after 1980) 284 6.8 percentage points
Generation X (1965-1980) 322 6.4 percentage points
Baby Boomer (1946-1964) 593 4.7 percentage points
Silent (1928-1945) 258 7.1 percentage points
Tried marijuana 680 4.4 percentage points
Never tried marijuana 800 4.0 percentage points
Sample sizes and sampling errors for other subgroups are available upon request.

14
www.people-press.org
Some of the analysis in this report is based on telephone interviews conducted January 9-13, 2013 among a national sample of 1,502 adults, 18 years of age or older, living in all 50 U.S. states and the District of Columbia (752 respondents were interviewed on a landline telephone, and 750 were interviewed on a cell phone, including 369 who had no landline telephone). The survey was conducted by interviewers at Princeton Data Source under the direction of Princeton Survey Research Associates International. A combination of landline and cell phone random digit dial samples were used; both samples were provided by Survey Sampling International. Interviews were conducted in English and Spanish. Respondents in the landline sample were selected by randomly asking for the youngest adult male or female who is now at home. Interviews in the cell sample were conducted with the person who answered the phone, if that person was an adult 18 years of age or older. The combined landline and cell phone sample are weighted using an iterative technique that matches gender, age, education, race, Hispanic origin and nativity and region to parameters from the 2011 Census Bureau's American Community Survey and population density to parameters from the Decennial Census. The sample also is weighted to match current patterns of telephone status and relative usage of landline and cell phones (for those with both), based on extrapolations from the 2012 National Health Interview Survey. The weighting procedure also accounts for the fact that respondents with both landline and cell phones have a greater probability of being included in the combined sample and adjusts for household size among respondents with a landline phone. Sampling errors and statistical tests of significance take into account the effect of weighting. The following table shows the sample sizes and the error attributable to sampling that would be expected at the 95% level of confidence for different groups in the survey:
Group Unweighted sample size Plus or minus…
Total sample 1,502 2.9 percentage points
Republicans 403 5.7 percentage points
Democrats 473 5.2 percentage points
Independents 557 4.8 percentage points
Sample sizes and sampling errors for other subgroups are available upon request. In addition to sampling error, one should bear in mind that question wording and practical difficulties in conducting surveys can introduce error or bias into the findings of opinion polls.
© Pew Research Center, 2013

15
www.people-press.org
PEW RESEARCH CENTER FOR THE PEOPLE & THE PRESS MARCH 2013 POLITICAL SURVEY
FINAL TOPLINE March 13-17, 2013
N=1,501 QUESTIONS 1, 5d, 6-7, 15a-c, 18, 20-24, 26-29, 35-38, 45-48, 56-57, 61-63, 65, 70-71, 73, 77
PREVIOUSLY RELEASED
NO QUESTIONS 2-4, 8-14, 15d, 16-17, 19, 25, 30-34, 39-44, 49-55, 58-60, 64, 66-69, 72, 74-76, 78-84 QUESTIONS 5a-c, 15e HELD FOR FUTURE RELEASE ASK ALL: On another subject… Q.85 Do you think the use of marijuana should be made legal, or not?
(VOL.) Yes, legal No, illegal DK/Ref
Mar 13-17, 2013 52 45 3 Feb 22-Mar 1, 2011 45 50 5 Mar 10-14, 2010 41 52 7 Gallup October, 2012 48 50 1 October, 2011 50 46 3 October, 2010 46 50 4 October, 2009 44 54 2 October 2005 36 60 4 November, 2003 34 64 2 August, 2001 34 62 4 August, 2000 31 64 5
August, 1995 25 73 2 May, 1985 23 73 4 June, 1980 25 70 5 May, 1979 25 70 5 April, 1977 28 66 6 January, 1973 16 78 6 March, 1972 15 81 4 October, 1969 12 84 4 General Social Survey 2012 43 49 8 2010 44 47 9
2008 35 57 8 2006 32 60 7 2004 33 59 9 2002 32 61 6 2000 31 63 6 1998 27 67 6 1996 25 70 5 1994 22 73 5 1993 22 73 5 1991 17 78 5 1990 16 81 3 1989 16 81 3
1988 17 79 4 1987 16 81 3 1986 17 80 2 1984 22 74 4 1983 19 77 3 1980 24 73 3 1978 30 66 4

16
www.people-press.org
Q.85 CONTINUED… (VOL.) Yes, legal No, illegal DK/Ref 1976 28 69 3 1975 20 74 5 1973 19 79 2
ASK ALL: Q.86 Please tell me whether you agree or disagree with each of the following statements. First, do you
agree or disagree that [INSERT ITEM; RANDOMIZE]? What about [NEXT ITEM]? [IF NECESSARY: Do you agree or disagree that (ITEM)?]
(VOL.) Agree Disagree DK/Ref a. For most people the use of marijuana leads
to the use of hard drugs Mar 13-17, 2013 38 58 4 Gallup: April, 1977 60 31 10
b. Government efforts to enforce marijuana laws cost more than they are worth
Mar 13-17, 2013 72 23 6 ASK ALL: Q.87 If people were using marijuana around you, would that make you feel UNcomfortable, or not? Mar 13-17 2013 51 Would make you feel uncomfortable 48 Not 1 Don't know/Refused (VOL.)
ASK ALL: Q.88 Do you think marijuana does or does not have legitimate medical uses? TREND FOR COMPARISON: ABC News Mar 13-17 May 2013 19971 77 Does 58 16 Does not 34 7 Don't know/Refused (VOL.) 8
ASK ALL: Q.89 As you may know, some states have decided to allow marijuana use, but it is still prohibited under
federal law. Do you think the federal government should or should not enforce federal marijuana laws in these states?
Mar 13-17 2013 35 Should 60 Should not 5 Don't know/Refused (VOL.)
1 Results from ABC News May 1997 are shown as a trend for comparison because of differences in the context in which
questions were asked.

17
www.people-press.org
ASK ALL: Q.90 Keeping in mind that all of your answers in this survey are confidential, have you, yourself, ever
happened to try marijuana? ----------------Gallup ----------------- Mar 13-17 Mar 10-14 June Feb Sept May April Jan Mar Oct
2013 2010 2003 2001 1999 1985 1977 1973 1972 1969 48 Yes 40 38 38 34 33 24 12 11 4 51 No 58 61 60 66 67 76 88 89 94 1 Don’t know/Refused (VOL.) 2 1 2 * 0 0 * 0 2 ASK IF EVER TRIED MARIJUANA (Q.90=1) [N=680]: Q.91 Have you used marijuana in the past year, or not? Mar 13-17 2013 25 Yes, used in past year 75 No, not in past year
* Don’t know/Refused (VOL.) ASK IF USED MARIJUANA IN PAST YEAR (Q.91=1) [N=146]: Q.92 In the past year, did you use marijuana [RANDOMIZE: for a medical issue OR just for fun]? Mar 13-17 2013 30 Medical issue 47 Just for fun 23 Both (VOL.) 0 Don’t know/Refused (VOL.)
NO QUESTIONS 93-97 QUESTIONS 98-102 PREVIOUSLY RELEASED ASK ALL: PARTY In politics TODAY, do you consider yourself a Republican, Democrat, or independent? ASK IF INDEP/NO PREF/OTHER/DK/REF (PARTY=3,4,5,9): PARTYLN As of today do you lean more to the Republican Party or more to the Democratic Party? (VOL.) (VOL.) No Other (VOL.) Lean Lean
Republican Democrat Independent preference party DK/Ref Rep Dem Mar 13-17, 2013 26 33 34 3 1 3 14 15 Feb. 13-18, 2013 22 32 41 2 * 2 15 19 Jan 9-13, 2013 25 32 38 2 * 2 15 16 Dec 17-19, 2012 21 32 38 4 * 4 15 14 Dec 5-9, 2012 23 33 38 3 1 2 14 19 Oct 31-Nov 3, 2012 26 34 34 3 1 3 13 16 Oct 24-28, 2012 28 33 33 4 * 2 12 16 Oct 4-7, 2012 27 31 36 3 1 3 15 15 Sep 12-16, 2012 24 35 36 2 * 2 14 16 Jul 16-26, 2012 22 33 38 4 * 3 14 15 Jun 28-Jul 9, 2012 24 33 37 3 * 3 15 17
Jun 7-17, 2012 24 33 39 2 * 2 17 17 May 9-Jun 3, 2012 24 32 36 4 * 4 13 14 Apr 4-15, 2012 24 31 39 3 * 2 15 15 Mar 7-11, 2012 24 34 36 3 1 2 16 17 Feb 8-12, 2012 26 32 36 4 1 2 13 17 Yearly Totals 2012 24.7 32.6 36.4 3.1 .5 2.7 14.4 16.1 2011 24.3 32.3 37.4 3.1 .4 2.5 15.7 15.6 2010 25.2 32.7 35.2 3.6 .4 2.8 14.5 14.1

18
www.people-press.org
PARTY/PARTYLN CONTINUED … (VOL.) (VOL.) No Other (VOL.) Lean Lean Republican Democrat Independent preference party DK/Ref Rep Dem 2009 23.9 34.4 35.1 3.4 .4 2.8 13.1 15.7 2008 25.7 36.0 31.5 3.6 .3 3.0 10.6 15.2
2007 25.3 32.9 34.1 4.3 .4 2.9 10.9 17.0 2006 27.8 33.1 30.9 4.4 .3 3.4 10.5 15.1 2005 29.3 32.8 30.2 4.5 .3 2.8 10.3 14.9 2004 30.0 33.5 29.5 3.8 .4 3.0 11.7 13.4 2003 30.3 31.5 30.5 4.8 .5 2.5 12.0 12.6 2002 30.4 31.4 29.8 5.0 .7 2.7 12.4 11.6 2001 29.0 33.2 29.5 5.2 .6 2.6 11.9 11.6 2001 Post-Sept 11 30.9 31.8 27.9 5.2 .6 3.6 11.7 9.4 2001 Pre-Sept 11 27.3 34.4 30.9 5.1 .6 1.7 12.1 13.5 2000 28.0 33.4 29.1 5.5 .5 3.6 11.6 11.7 1999 26.6 33.5 33.7 3.9 .5 1.9 13.0 14.5 1998 27.9 33.7 31.1 4.6 .4 2.3 11.6 13.1
1997 28.0 33.4 32.0 4.0 .4 2.3 12.2 14.1 1996 28.9 33.9 31.8 3.0 .4 2.0 12.1 14.9 1995 31.6 30.0 33.7 2.4 .6 1.3 15.1 13.5 1994 30.1 31.5 33.5 1.3 -- 3.6 13.7 12.2 1993 27.4 33.6 34.2 4.4 1.5 2.9 11.5 14.9 1992 27.6 33.7 34.7 1.5 0 2.5 12.6 16.5 1991 30.9 31.4 33.2 0 1.4 3.0 14.7 10.8 1990 30.9 33.2 29.3 1.2 1.9 3.4 12.4 11.3 1989 33 33 34 -- -- -- -- -- 1987 26 35 39 -- -- -- -- -- ASK REPUBLICANS AND REPUBLICAN LEANERS ONLY (PARTY=1 OR PARTYLN=1) [N=623]:
TEAPARTY3 From what you know, do you agree or disagree with the Tea Party movement, or don’t you have an opinion either way?
Mar 13-17 Feb 13-18 Jan 9-13 2013 2013 2013 43 Agree 36 35 7 Disagree 9 10 47 No opinion either way 52 51 1 Haven’t heard of (VOL.) 1 2 1 Refused (VOL.) 3 2

19
www.people-press.org
PEW RESEARCH CENTER FOR THE PEOPLE & THE PRESS JANUARY 2013 POLITICAL SURVEY
FINAL TOPLINE January 9-13, 2013
N=1,502
NOTE: OTHER QUESTIONS FROM THIS SURVEY PREVIOUSLY RELEASED ASK ALL: Now, a different kind of question … Q.18 Do you personally believe that [INSERT ITEM AND RANDOMIZE] is morally acceptable, morally
wrong, or is it not a moral issue. [IF NECESSARY: And is [INSERT ITEM] morally acceptable, morally wrong, or is it not a moral issue?]
Not a (VOL.) Morally Morally moral Depends on (VOL.) acceptable wrong issue the situation DK/Ref b. Smoking marijuana
Jan 9-13, 2013 12 32 50 2 4 February, 2006 10 50 35 4 1


![Legalizing Marijuana and Abating Environmental Harm: An …lawreview.law.ucdavis.edu/issues/50/2/Topic/50-2_Vitiello.pdf · 2016] Legalizing Marijuana and Abating Environmental Harm](https://img.dokumen.tips/doc/110x75/5f11d48f3ee38a1c4f11c318/legalizing-marijuana-and-abating-environmental-harm-an-2016-legalizing-marijuana.jpg)


![Legalizing Marijuana[1]](https://img.dokumen.tips/doc/110x75/554d5ef0b4c90578428b4bac/legalizing-marijuana1.jpg)