Embed Size (px)
Citation preview
Volume 11 No. 4 Quezon City, Philippines
ISSN 2094-6201
Major Fruit Crops Quarterly Bulletin
Solid ∙ Responsive ∙ World Class PHILIPPINE STATISTICS AUTHORITY
Republic of the Philippines
October-December 2017

Major
Fruit Crops Quarterly Bulletin
October-December 2017
Solid ∙ Responsive ∙ World Class PHILIPPINE STATISTICS AUTHORITY
Republic of the Philippines

ii
Major Fruit Crops Quarterly Bulletin is a publication of the Philippine Statistics Authority. The PSA reserves exclusive right to reproduce this publication in whatever form. Should any portion of this publication be included in a report/article, the title of the publication and the PSA should be cited as the source of data. The PSA will not be responsible for any information derived from the processing of data contained in this bulletin.
REPUBLIC OF THE PHILIPPINES
HIS EXCELLENCY
PRESIDENT RODRIGO R. DUTERTE
PHILIPPINE STATISTICS AUTHORITY
LISA GRACE S. BERSALES, Ph.D.
Undersecretary
National Statistician and Civil Registrar General
JOSIE B. PEREZ
Assistant Secretary
Deputy National Statistician
Census and Technical Coordination Office
ROMEO S. RECIDE
Assistant Secretary
Deputy National Statistician
Sectoral Statistics Office

FOREWORD
The Major Fruit Crops Quarterly Bulletin provides updates on production of banana,
calamansi, mango, and pineapple. These crops are highlighted in the report on the
Performance of Agriculture that the Philippine Statistics Authority (PSA) releases
quarterly.
This 4th quarter 2017 issue of the Bulletin presents the final estimates of production for July-September 2017 and preliminary estimates for October-December 2017. It also contains the July-December 2017 preliminary estimates on area planted and number of bearing trees/hills. The main source of data is the quarterly Crops Production Survey (CrPS) of the PSA.
LISA GRACE S. BERSALES, Ph. D.
Undersecretary National Statistician and Civil Registrar General
Quezon City, Philippines February 2018
iii

TABLE OF CONTENTS
Administrative Page ii Foreword iii Table of Contents iv Technical Notes v
Banana 2
Calamansi 4 Mango 6 Pineapple 8
List of Tables
TABLE 1 Volume of Production for Selected Fruit Crops, Philippines, July-September: 2016-2017 and October-December: 2016-2017p 10 TABLE 2 Volume of Production for Banana by Region, July-September: 2016-2017 and October-December: 2016-2017p 11 TABLE 3 Volume of Production for Calamansi by Region, July-September: 2016-2017 and October-December: 2016-2017p 12 TABLE 4 Volume of Production for Mango by Region, July-September: 2016-2017 and October-December: 2016-2017p 13 TABLE 5 Volume of Production for Pineapple by Region, July-September: 2016-2017 and October-December: 2016-2017p 14 TABLE 6 Area Planted and Number of Bearing Trees/Hills for Selected
Crops, Philippines, July-December: 2016-2017p 15
List of Figures
FIGURE 1 Banana Production by Region, October-December: 2017p 1 FIGURE 2 Distribution of Banana Production by Region, October-December: 2017p 2 FIGURE 3 Percent Distribution of Banana Production by Variety, October-December: 2017p 2 FIGURE 4 Calamansi Production by Region, October-December: 2017p 3 FIGURE 5 Distribution of Calamansi Production by Region, October-December: 2017p 4 FIGURE 6 Mango Production by Region, October-December: 2017p 5 FIGURE 7 Distribution of Mango Production by Region, October-December: 2017p 6 FIGURE 8 Percent Distribution of Mango Production by Variety, October-December: 2017p 6 FIGURE 9 Pineapple Production by Region, October-December: 2017p 7 FIGURE 10 Distribution of Pineapple Production by Region, October-December: 2017p 8 Note: p - Preliminary Estimate
iv

TECHNICAL NOTES Production refers to the quantity produced and actually harvested for a particular crop during the reference period. For other crops, area planted refers to the actual physical area planted while area harvested refers to the actual area from which harvests are realized. Bearing trees/hills is the number of trees/hills where harvesting has been made in the past but may or may not have borne fruits or productive during the reference period due to cyclical production pattern of the crop. Estimates of production, area planted/harvested, and number of bearing trees/hills are generated from the Quarterly Crops Production Survey (CrPS) of which there are four survey rounds in a year, that is, February, May, August, and November.
v

1
FIGURE 1 Banana Production by Region, October-December: 2017p
,

Banana
• The volume of production of Banana went up by 3.1 percent from 2.33 million metric tons for the period October to December 2016 to 2.41 million metric tons during the current period of 2017. The increase was attributed to: o additional bearing hills from expansion areas of Dole Food Company, Inc., Del
Monte Foods, Inc., Lapanday Foods Corporation, Mt. Kitanglad Agri-Development Corporation (MKADC), Davao Agricultural Ventures Corporation (DAVCO), Sumifru Philippines Corp., Dole Food Company, Inc., and MAI-Maguindanao Agri-traders Inc., due to increasing demand; and
o bigger sizes of fruits developed resulting from less weather disturbances in Cagayan Valley (Isabela and Quirino) and sufficient rainfall in ARMM.
• Davao Region was the biggest contributor to the total production with 37.4 percent or 901.53 thousand metric tons, followed by Northern Mindanao with 20.2 percent and SOCCSKSARGEN with 13.5 percent (Figure 2).
• More than half or 51.4 percent of the total production of banana was from Cavendish variety (Figure 3).
2
FIGURE 2 Distribution of Banana Production by Region,
October-December: 2017p
FIGURE 3 Percent Distribution of Banana Production by Variety,
October-December: 2017p
Cavendish51.4%
Saba28.0%
Lakatan10.2%
Others10.4%
Davao Region37.4%
Northern Mindanao
20.2%
SOCCSKSARGEN
13.5%
Other Regions28.9%

3
FIGURE 4 Calamansi Production by Region, October-December: 2017p

4
Calamansi
• For the period October to December 2017, the level of production of Calamansi was recorded at 28.03 thousand metric tons, a decline of 0.1 percent from 28.05 thousand metric tons during the same period of 2016. This was due to: o lesser application of fertilizer due to frequent rainfall in Zamboanga Peninsula
(Zamboanga Sibugay); and o dropping of young fruits caused by strong winds and rains in Caraga (Agusan del
Sur).
• The largest share was from CALABARZON with 15.1 percent followed by Zamboanga Peninsula with 13.5 percent and Caraga with 12.9 percent (Figure 5).
FIGURE 5 Distribution of Calamansi Production by Region, October-December: 2017p
CALABARZON15.1%
Zamboanga Peninsula
13.5%
Caraga12.9%
Other Regions58.5%

5
FIGURE 6 Mango Production by Region, October-December: 2017p

Mango
• Mango production dropped by 10.1 percent from 30.58 thousand metric tons to 27.49 thousand metric tons during the fourth quarter of 2017. The decline was attributed to:
o discouragement of farmers to conduct flower induction activities due to occurrence of intermittent rains in Zamboanga Peninsula (Zamboanga del Norte and Zamboanga del Sur); and
o lesser fruits developed because of frequent rains during flowering stage in Northern Mindanao (Misamis Occidental).
• The top producer of mango was Zamboanga Peninsula with 7.04 thousand metric tons, representing a 25.6 percent share to the total national production. Caraga came next with 23.6 percent and Northern Mindanao with 15.3 percent (Figure 7).
• The biggest share was mango Carabao with 81.1 percent share from the aggregate national production (Figure 8).
6
FIGURE 7 Distribution of Mango Production by Region,
October-December: 2017p
FIGURE 8 Percent Distribution of Mango Production by Variety,
October-December: 2017p
Zamboanga Peninsula
25.6%
Caraga23.6%
Northern Mindanao
15.3%Other Regions
35.5%
Carabao81.1%
Piko4.3%
Others14.6%
7
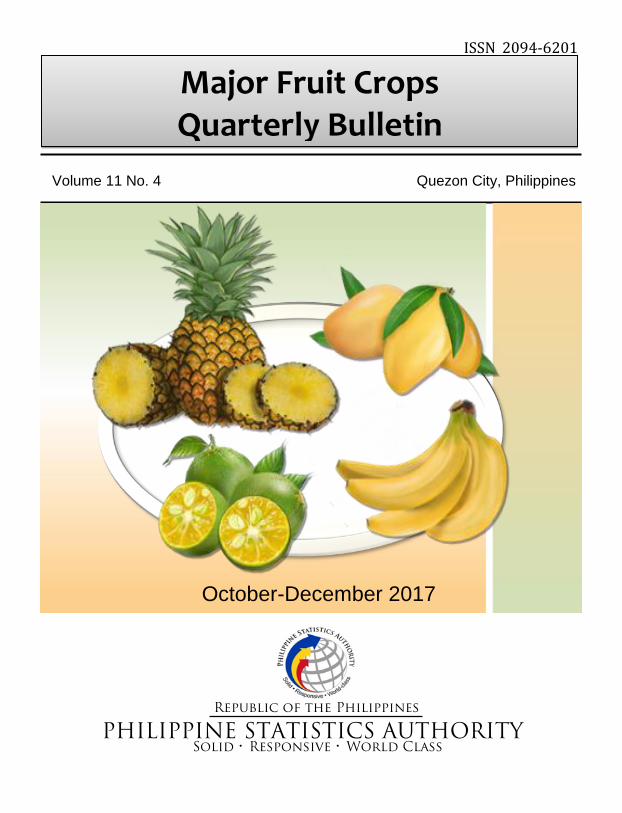
FIGURE 9 Pineapple Production by Region, October-December: 2017p

8
Pineapple
• Pineapple production increased by 3.0 percent during last quarter of 2017 reaching the level of 699.22 thousand metric tons. The growth was attributed to: o additional areas harvested from corporate farms of Dole-Stanfilco and Sumifru
Philippines Corp. in SOCCSKSARGEN (Sultan Kudarat, North Cotabato and South Cotabato) and Northern Mindanao (Bukidnon).
• Northern Mindanao was the top pineapple producer at 448.70 thousand metric tons contributing 64.2 percent to the country’s total pineapple production and followed by SOCCSKSARGEN with 30.0 percent share (Figure 10).
FIGURE 10 Distribution of Pineapple Production by Region, October-December: 2017p
Northern Mindanao
64.2%
SOCCSKSARGEN
30.0%
Other Regions5.8%

STATISTICAL TABLES

TABLE 1 Volume of Production for Selected Fruit Crops, Philippines: July-September: 2016-2017 and October to December: 2016-2017p (In metric tons)
10
pPreliminary
2016 2017 2016 2017p Jul-Sep Oct-Dec
Banana 2,304,240 2,383,721 2,335,941 2,409,147 3.4 3.1
Cavendish 1,176,610 1,232,499 1,209,320 1,238,405 4.8 2.4
Lakatan 245,138 249,844 239,206 245,621 1.9 2.7
Saba 653,862 667,724 643,787 674,284 2.1 4.7
Calamansi 56,019 54,695 28,052 28,031 (2.4) (0.1)
Mango 58,603 55,440 30,579 27,488 (5.4) (10.1)
Carabao 46,531 44,782 24,751 22,297 (3.8) (9.9)
Pineapple 673,474 683,763 679,168 699,221 1.5 3.0
July-SeptemberCROP October-December Change
PercentProduction
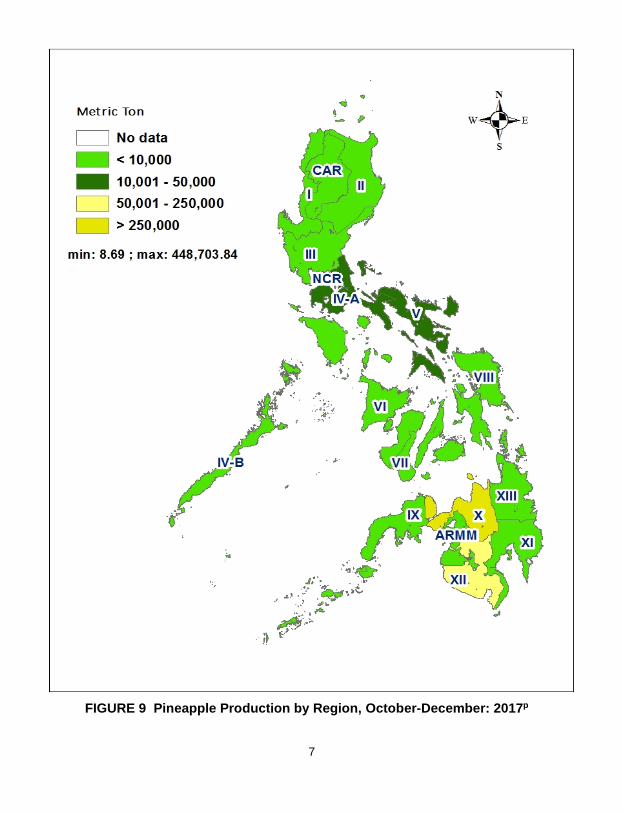
TABLE 2 Volume of Production for Banana by Region, July-September: 2016-2017 and October to December: 2016-2017p (In metric tons)
11
pPreliminary - no data
2016 2017 2016 2017p Jul-Sep Oct-Dec
PHILIPPINES 2,304,240 2,383,721 2,335,941 2,409,147 3.4 3.1
National Capital Region - - - - - -
CAR 8,407 8,493 2,853 3,122 1.0 9.4
Ilocos Region 8,870 9,268 11,235 11,967 4.5 6.5
Cagayan Valley 99,295 89,715 36,538 44,776 (9.6) 22.5
Central Luzon 12,491 12,621 12,654 13,019 1.0 2.9
CALABARZON 38,113 40,266 17,768 18,539 5.6 4.3
MIMAROPA 28,978 27,415 27,096 28,899 (5.4) 6.7
Bicol Region 24,924 24,922 20,189 20,465 (0.0) 1.4
Western Visayas 49,770 50,648 95,445 97,297 1.8 1.9
Central Visayas 36,344 40,100 57,448 59,529 10.3 3.6
Eastern Visayas 63,329 65,998 51,606 52,305 4.2 1.4
Zamboanga Peninsula 66,617 68,962 92,984 90,252 3.5 (2.9)
Northern Mindanao 503,148 512,253 481,501 487,646 1.8 1.3
Davao Region 907,501 918,970 897,716 901,531 1.3 0.4
SOCCSKSARGEN 245,743 291,556 307,879 325,030 18.6 5.6
Caraga 78,040 86,274 69,411 73,338 10.6 5.7
ARMM 132,671 136,259 153,619 181,434 2.7 18.1
Region
Percent
Change
Production
July-September October-December

TABLE 3 Volume of Production for Calamansi by Region, July-September: 2016-2017 and October to December: 2016-2017p
(In metric tons)
12
pPreliminary - no data
2016 2017 2016 2017p Jul-Sep Oct-Dec
PHILIPPINES 56,019 54,695 28,052 28,031 (2.4) (0.08)
National Capital Region - - - - - -
CAR 82 89 111 114 9.4 3.0
Ilocos Region 1,016 1,047 890 888 3.1 (0.3)
Cagayan Valley 2,006 1,817 2,274 2,444 (9.4) 7.5
Central Luzon 2,888 3,098 2,934 2,912 7.3 (0.8)
CALABARZON 5,811 6,060 4,079 4,246 4.3 4.1
MIMAROPA 31,302 29,146 1,186 1,182 (6.9) (0.4)
Bicol Region 839 855 661 640 1.9 (3.1)
Western Visayas 863 906 1,783 1,664 5.1 (6.6)
Central Visayas 532 500 195 177 (5.9) (9.1)
Eastern Visayas 666 694 428 444 4.3 3.8
Zamboanga Peninsula 3,577 3,606 4,012 3,786 0.8 (5.6)
Northern Mindanao 825 852 534 551 3.3 3.2
Davao Region 2,717 2,713 2,414 2,468 (0.2) 2.2
SOCCSKSARGEN 1,088 1,271 2,318 2,375 16.8 2.4
Caraga 902 938 3,786 3,618 4.0 (4.4)
ARMM 908 1,102 447 521 21.4 16.5
ChangeRegion
Production Percent
July-September October-December
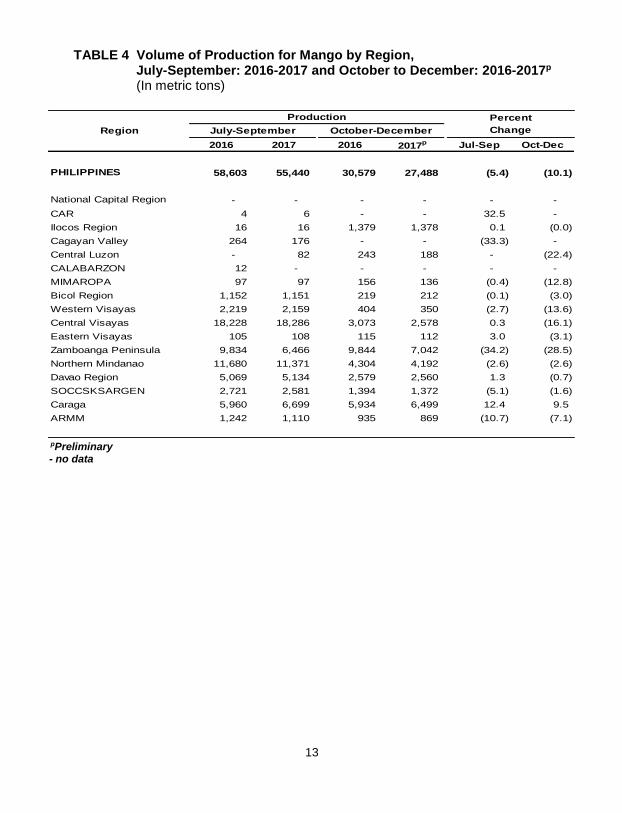
TABLE 4 Volume of Production for Mango by Region, July-September: 2016-2017 and October to December: 2016-2017p (In metric tons)
13
pPreliminary - no data
2016 2017 2016 2017p Jul-Sep Oct-Dec
PHILIPPINES 58,603 55,440 30,579 27,488 (5.4) (10.1)
National Capital Region - - - - - -
CAR 4 6 - - 32.5 -
Ilocos Region 16 16 1,379 1,378 0.1 (0.0)
Cagayan Valley 264 176 - - (33.3) -
Central Luzon - 82 243 188 - (22.4)
CALABARZON 12 - - - - -
MIMAROPA 97 97 156 136 (0.4) (12.8)
Bicol Region 1,152 1,151 219 212 (0.1) (3.0)
Western Visayas 2,219 2,159 404 350 (2.7) (13.6)
Central Visayas 18,228 18,286 3,073 2,578 0.3 (16.1)
Eastern Visayas 105 108 115 112 3.0 (3.1)
Zamboanga Peninsula 9,834 6,466 9,844 7,042 (34.2) (28.5)
Northern Mindanao 11,680 11,371 4,304 4,192 (2.6) (2.6)
Davao Region 5,069 5,134 2,579 2,560 1.3 (0.7)
SOCCSKSARGEN 2,721 2,581 1,394 1,372 (5.1) (1.6)
Caraga 5,960 6,699 5,934 6,499 12.4 9.5
ARMM 1,242 1,110 935 869 (10.7) (7.1)
Region
Production Percent
July-September October-December Change

TABLE 5 Volume of Production for Pineapple by Region, July-September: 2016-2017 and October to December: 2016-2017p (In metric tons)
14
pPreliminary - no data
2016 2017 2016 2017p Jul-Sep Oct-Dec
PHILIPPINES 673,474 683,763 679,168 699,221 1.5 3.0
National Capital Region - - - - - -
CAR 250 271 8 9 8.7 4.2
Ilocos Region 25 26 55 55 7.2 0.4
Cagayan Valley 13,635 14,885 133 212 9.2 59.5
Central Luzon 298 416 92 124 39.4 34.2
CALABARZON 3,496 3,739 14,697 15,180 6.9 3.3
MIMAROPA 61 63 52 42 3.7 (20.3)
Bicol Region 47,539 38,734 15,580 14,535 (18.5) (6.7)
Western Visayas 3,145 3,528 4,857 4,566 12.2 (6.0)
Central Visayas 988 1,021 467 464 3.3 (0.6)
Eastern Visayas 1,257 1,283 567 598 2.1 5.5
Zamboanga Peninsula 289 337 659 590 16.8 (10.5)
Northern Mindanao 411,326 417,152 431,874 448,704 1.4 3.9
Davao Region 3,951 4,072 4,063 4,075 3.1 0.3
SOCCSKSARGEN 185,799 196,492 205,586 209,592 5.8 1.9
Caraga 1,194 1,522 210 213 27.4 1.8
ARMM 224 222 269 264 (0.6) (1.8)
Region
Production Percent
July-September October-December Change

TABLE 6 Area Planted and Number of Bearing Trees/Hills for Selected Crops, Philippines, July-December: 2016-2017p
15
NA Not Applicable
Percent
2016 2017p Change
Area Planted (Ha)
Banana 439,641 445,562 1.3
Cavendish 86,590 87,782 1.4
Lakatan 53,909 54,811 1.7
Saba 181,656 184,945 1.8
Calamansi 19,675 19,685 0.1
Mango 187,033 185,463 (0.8)
Carabao 146,509 144,717 (1.2)
Pineapple 64,524 65,534 1.6
Number of Bearing Trees/Hills
Banana 281,658,554 284,464,402 1.0
Cavendish 121,435,166 121,449,721 0.0
Lakatan 31,651,950 32,254,955 1.9
Saba 79,077,310 80,404,329 1.7
Calamansi 8,442,105 8,338,312 (1.2)
Mango 9,594,044 9,438,333 (1.6)
Carabao 7,236,379 7,095,724 (1.9)
Pineapple NA NA NA
Selected CropsJuly-December

/Philippine Statistics Authority /PSAgovph

Republic of the Philippines PHILIPPINE STATISTICS AUTHORITY
16th Floor, ETON Cyberpod Centris 3 EDSA, Quezon City
www.psa.gov.ph