Embed Size (px)
Citation preview
How Immigrant Small Businesses Help Local Economies Grow
MAIN STREET
BRINGING VITALITY TO
1 Americas Society is a tax-exempt public charity described in 501(c)(3) and 509(a)(1) of the Internal Revenue Code of 1986.
2 Council of the Americas is a tax-exempt business league under 501(c)(6) of the Internal Revenue Code of 1986, and as such, actively pursues lobbying activities to advance its purpose and the interests of its members.
About Americas Society/Council of The Americas
Americas Society and Council of the Americas (AS/COA) unite opinion leaders to exchange ideas and create solutions to the challenges of the Americas today.
Americas Society (AS) is the premier forum dedicated to education, debate and dialogue in the Americas.1 Council of the Americas (COA), affiliate organization to AS, is the premier international business organization with a membership that consists of leading international companies representing a broad spectrum of sectors including banking and finance, consulting services, consumer products, energy and mining, manufacturing, media, technology, and transportation.2
The positions and opinions expressed in this publication do not represent those of Americas Society and Council of the Americas members or the boards of directors of either organization.
This report was made possible with support from the Rockefeller Brothers Fund. The opinions and views of the authors do not necessarily state or reflect those of the Fund.
For further information about AS/COA, visit AS/COA Online at www.as-coa.org
About the Fiscal Policy Institute
The Fiscal Policy Institute (www.fiscalpolicy.org) is an independent, non-partisan, non-profit research and education organization committed to improving public policies and private practices to better the economic and social conditions of all New Yorkers. Founded in 1991, FPI works to create a strong economy in which prosperity is broadly shared. FPI’s Immigration Research Initiative examines the role of immigrants in the New York State economy and beyond. The Immigration Research Initiative receives core funding from the Carnegie Corporation of New York, the Ford Foundation and the Open Society Foundations for its role in the State Priorities Partnership (coordinated by the Center on Budget and Policy Priorities). Opinions expressed here do not necessarily reflect the views of the foundations that support this work.
No part of this publication may be reproduced in any form without permission in writing from Americas Society/Council of the Americas and the Fiscal Policy Institute.
How Immigrant Small Businesses Help Local Economies Grow
Main Street
Bringing Vitality to
—January 2015
David Dyssegaard Kallick, director of the Immigration Research Initiative at the Fiscal Policy Institute, prepared this report. He gratefully acknowledges the constant research support of James Parrott, FPI’s chief economist, review from Ron Deutsch, FPI’s interim executive director, and invaluable data analysis by FPI research associates Hui Liu and Eloy Fisher. The Immigration Research Initiative’s research advisory panel provided valuable input and review, and the report is deeply indebted to interviewees in Philadelphia, Minneapolis–St. Paul and Nashville, too numerous to name here. Both the advisory committee and interviewees are acknowledged at www.fiscalpolicy.org/Acknowledgements.
at americas Society/Council of the americas, Kate Brick, policy manager, leads the AS/COA Immigration and Integration Initiative, under which this report was produced. Steven McCutcheon Rubio, policy associate, helps oversee the organization’s immigration work. Susan Segal, president and CEO, supports and guides the organization’s immigration work. Richard André, former policy manager at AS/COA, played a fundamental role in the development of this report, which was also supported by the work of policy intern Zachary Bleckner.
Paula Daneze designed this publication.
ALL PHOTOS BY DAVID DYSSEGAARD KALLICK
BrInGInG vItaLIty to maIn StrEEt: how immigrant small businesses help local economies grow 1
Executive Summary
Introduction
Part 1: Immigrants and Small Business Ownership: An Outsize Role on Main Street
Part 2: Lessons from the Field: Philadelphia, Minneapolis–St. Paul, and Nashville
Conclusion & Best Practices: A Toolkit for Supporting Immigrant Business Growth
Methodology
taBle of ContentS
2
4
5
14
34
37
2 BrInGInG vItaLIty to maIn StrEEt: how immigrant small businesses help local economies grow
Over the past decade, several studies have shown that immigrants are more likely than their U.S.-born counterparts to be business
owners. Less well known, however, is the outsize role immigrants are playing among “Main Street” businesses—the shops and services that are the backbone of neighborhoods around the country.
Immigrants’ role in Main Street businesses is striking. While accounting for 16 percent of the labor force nationally and 18 percent of business owners, immigrants make up 28 percent of Main Street business owners. And, immigrants play an even bigger role in certain Main Street businesses. Data from 2013, the most recent year available, show that in the U.S. as a whole immigrants make up 61 percent of all gas station owners, 58 percent of dry cleaners owners, 53 percent of grocery store owners, 45 percent of nail salon owners, 43 percent of liquor store owners, 38 percent of restaurant owners, and 32 percent of both jewelry and clothing store owners.
And, immigrants make up a bigger pro-portion of Main Street business owners in metropolitan areas with large immigrant populations. Immigrants make up fully 64 percent of all Main Street business owners in the Los Angeles metro area, 61 percent in metro San Jose, 56 percent in metro Wash-ington, D.C., and 54 percent in metro Miami.
Main Street businesses make a direct contribution to the economy, but they also leverage that contribution by playing a critical role in making neighborhoods attractive places to live and work. A restaurant comes into a part of town that has had boarded-up storefronts and—while mainly serving local customers at first—starts to attract a clientele from around the city before long. A grocery store opens nearby, a few clothes stores, and maybe a barber or a beauty salon. More eyes on the street mean safer streets, and before long the neighborhood becomes a place more people
want to come and live. What may have been an area in disrepair becomes more vibrant and more economically viable, with an increased tax base, more local spending, and more local jobs.
The statistics here include all immigrants, including undocumented immigrants, refugees and high-skilled visa holders. There are important distinctions among these groups, but there are business owners among all of them, in varying proportions.
The role of immigrants and immigrant Main Street business owners in neighborhood revitalization and local economic development should be of
particular interest to cities that saw significant population decline in the 1950s, 1960s and 1970s and are eager to bring about a rebound in population today—cities such as Baltimore, St. Louis, Detroit, Pittsburgh, and Chicago. Over the past several decades, immigrants have given a critical population boost to cities with population decline. Among the 50 cities that had the largest populations in 1970, all of those cities with low levels of immigration have seen a total population decline from their mid-20th century peak.
Offering a welcoming environment and a supportive infrastructure for immigrant communities is a smart strategy
exeCutiVe SuMMary
iMMigrantS MaKe up 28 perCent of Main Street
BuSineSS ownerS.
BrInGInG vItaLIty to maIn StrEEt: how immigrant small businesses help local economies grow 3
for cities and states. And paying particular attention to immigrant Main Street business owners can be a very valuable part of that strategy, boosting neighborhood growth and often helping U.S.-born business owners along the way.
Case studies from three metro areas that have experienced population rebound or growth yield some important lessons about realistic ways to help nurture immigrant Main Street business ownership and the economic revitalization it can spur.
In Philadelphia, city government and non-profit groups have focused on supporting the integration of immigrant businesses into the commercial corridors around the city, helping to boost their revival and to ease tensions with existing communities.
In Minneapolis–St. Paul, a range of non-profit groups, together with support from a federal tax credit program, foundations and corporations developed a series of mall-sized markets that are both incubators for new businesses and neighborhood development projects in their own right.
In Nashville, a broad coalition of business, labor, community, and political leaders came together to push back against a referendum that was seen to be anti-immigrant, in the process creating a lasting set of relationships that have helped set a positive tone around immigrant integration in the city. And, in all of the areas there were innovations in small
business financing, culturally competent approaches to providing business services and classes, and a rethinking of how small businesses relate to city agencies.
Immigrants are not magic ingredients to an economic development strategy, but they are an asset to the cities they join. When that asset is underutilized, it is a loss to the local economy. Finding ways to maximize the potential of immigrant Main Street business owners while creating a positive climate for U.S.-born business owners should be an important project for cities seeking to leverage the contribution of their immigrant populations.
Some of the recommendations from our research are:
• Create a government office to address immigrant integration.
• Provide culturally competent business training and services.
• Make sure programs are open to all.
• Make financing innovative and community-based.
• Strengthen incubators—especially commercial kitchens.
• Improve (and clarify) licensing and inspection processes for everyone.
4 BrInGInG vItaLIty to maIn StrEEt: how immigrant small businesses help local economies grow
introDuCtion
Despite the growing body of research on the economic impact of immigrants, few studies have focused on the outsize role that immigrants have played in “Main Street” businesses—the shops that give a neighborhood its character, such as restaurants, grocery stores, clothing boutiques, and beauty salons. Even less research has looked at how various programs and initiatives can
support immigrant small business owners, or the impact of removing barriers to immigrant entrepreneurship on a city’s economic development.
This reports aims to address that gap. It seeks to uncover and quantify the valuable role immigrants play as business owners in cities around the country, and to highlight—through in-depth looks into three metro areas that are gateways for immigrants—how local government, civil society and the private sector can work together to support this population.
Part One presents a quantitative analysis of the impressive role immigrants are playing among Main Street businesses in the U.S., looking at Main Street business ownership in the country’s 50 largest metro areas. It looks at the particular challenge of central cities with declining populations and considers the role Main Street businesses play in revitalizing neighborhoods and rebuilding central city business districts.
Part Two combines quantitative analysis with a qualitative study of immigrant Main Street businesses—and efforts of local governments and non-profits to support them—in Philadelphia, Minneapolis–St. Paul and Nashville. In Philadelphia and Minneapolis–St. Paul, it examines the role immigrant businesses have played in reversing decades of population decline, and, in particular, how these businesses helped re-establish a commercial base for neighborhoods that were in disrepair, giving them new character and a critical economic boost. And, in Nashville, it shows how the vibrancy of immigrant neighborhoods have helped fill in and transform areas that were the less expensive parts of town, in some cases spurring the interest of a new generation of hipsters and foodies who now come to visit or to live in neighborhoods they might previously have overlooked.
few StuDieS haVe foCuSeD
on the outSize role that
iMMigrantS haVe playeD
in Main Street BuSineSSeS.
BrInGInG vItaLIty to maIn StrEEt: how immigrant small businesses help local economies grow 5
part i: iMMigrantS anD SMall BuSineSS ownerShip: an outSize role on Main Street
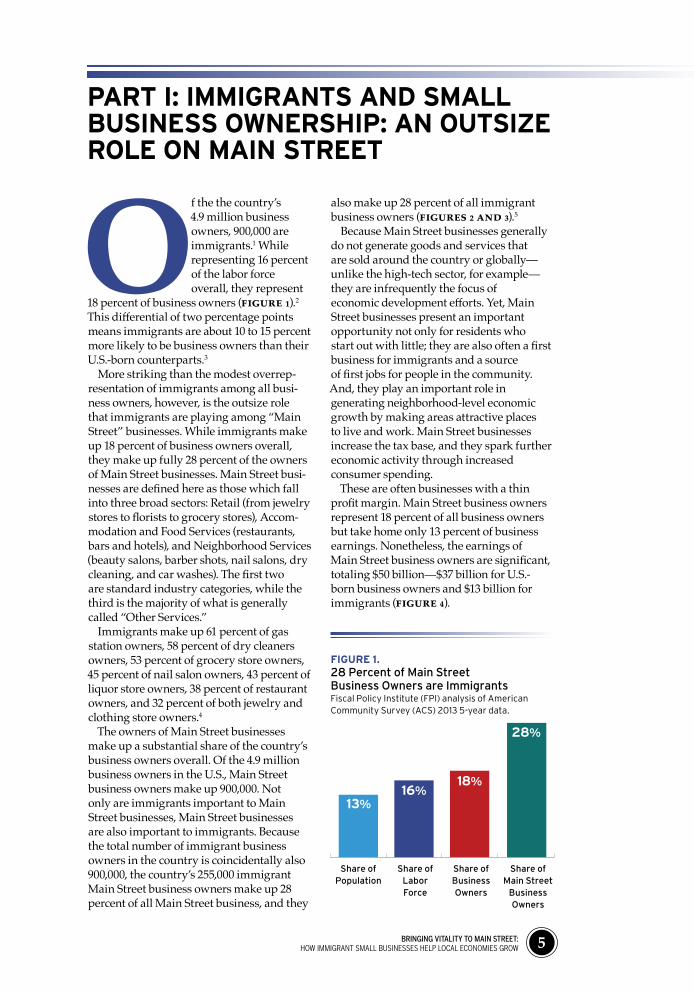
Of the the country’s 4.9 million business owners, 900,000 are immigrants.1 While representing 16 percent of the labor force overall, they represent
18 percent of business owners (Figure 1).2
This differential of two percentage points means immigrants are about 10 to 15 percent more likely to be business owners than their U.S.-born counterparts.3
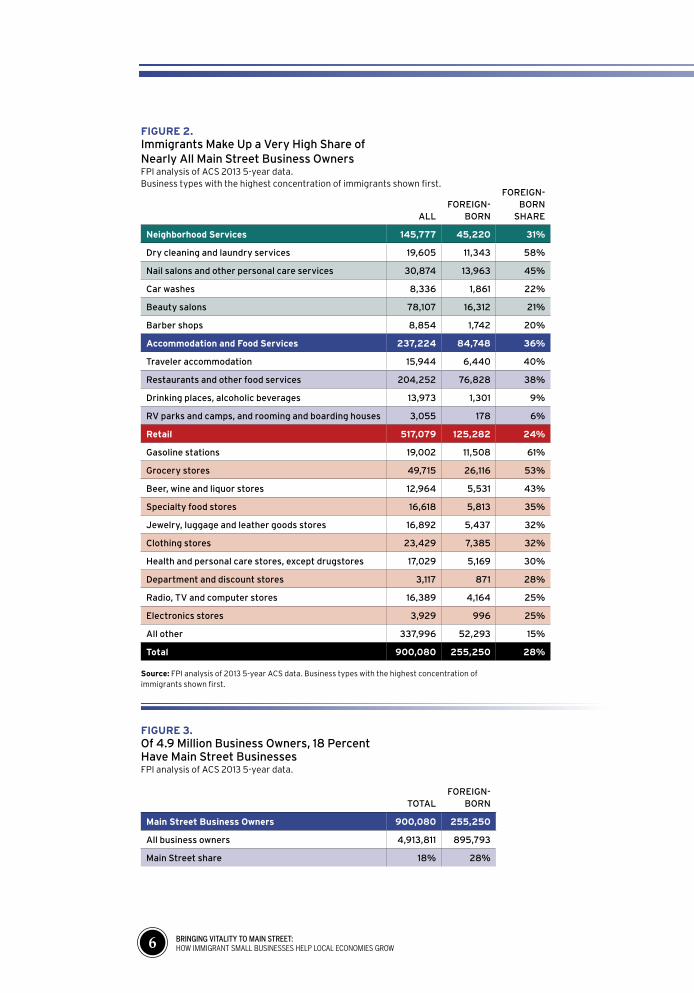
More striking than the modest overrep-resentation of immigrants among all busi-ness owners, however, is the outsize role that immigrants are playing among “Main Street” businesses. While immigrants make up 18 percent of business owners overall, they make up fully 28 percent of the owners of Main Street businesses. Main Street busi-nesses are defined here as those which fall into three broad sectors: Retail (from jewelry stores to florists to grocery stores), Accom-modation and Food Services (restaurants, bars and hotels), and Neighborhood Services (beauty salons, barber shots, nail salons, dry cleaning, and car washes). The first two are standard industry categories, while the third is the majority of what is generally called “Other Services.”
Immigrants make up 61 percent of gas station owners, 58 percent of dry cleaners owners, 53 percent of grocery store owners, 45 percent of nail salon owners, 43 percent of liquor store owners, 38 percent of restaurant owners, and 32 percent of both jewelry and clothing store owners.4
The owners of Main Street businesses make up a substantial share of the country’s business owners overall. Of the 4.9 million business owners in the U.S., Main Street business owners make up 900,000. Not only are immigrants important to Main Street businesses, Main Street businesses are also important to immigrants. Because the total number of immigrant business owners in the country is coincidentally also 900,000, the country’s 255,000 immigrant Main Street business owners make up 28 percent of all Main Street business, and they
also make up 28 percent of all immigrant business owners (Figures 2 and 3).5
Because Main Street businesses generally do not generate goods and services that are sold around the country or globally— unlike the high-tech sector, for example—they are infrequently the focus of economic development efforts. Yet, Main Street businesses present an important opportunity not only for residents who start out with little; they are also often a first business for immigrants and a source of first jobs for people in the community. And, they play an important role in generating neighborhood-level economic growth by making areas attractive places to live and work. Main Street businesses increase the tax base, and they spark further economic activity through increased consumer spending.
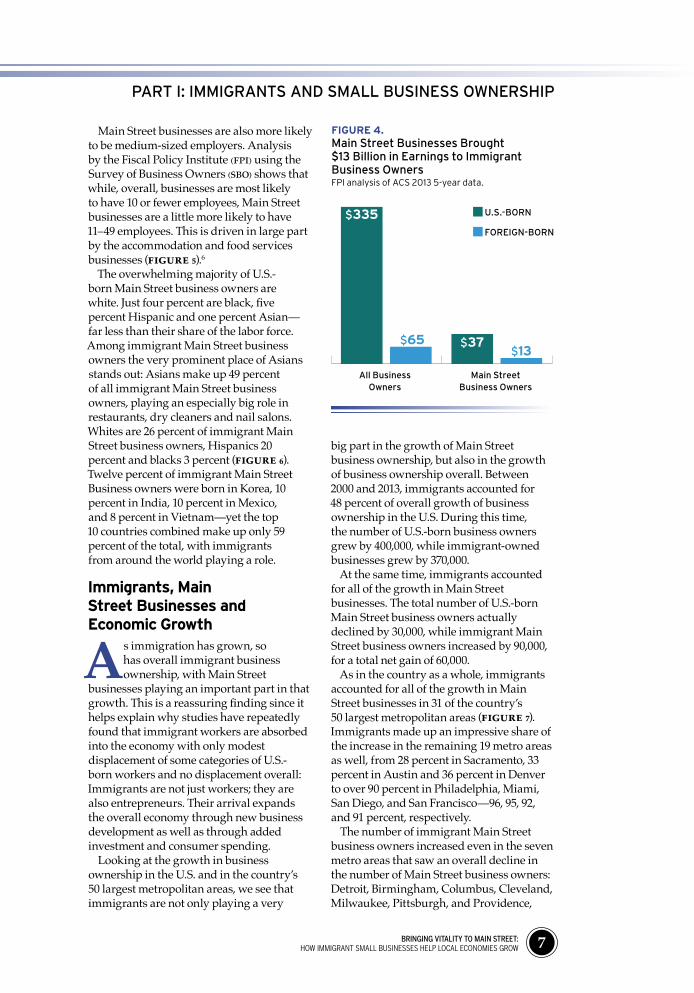
These are often businesses with a thin profit margin. Main Street business owners represent 18 percent of all business owners but take home only 13 percent of business earnings. Nonetheless, the earnings of Main Street business owners are significant, totaling $50 billion—$37 billion for U.S.-born business owners and $13 billion for immigrants (Figure 4).
figure 1. 28 Percent of Main Street Business Owners are ImmigrantsFiscal Policy Institute (FPI) analysis of American Community Survey (ACS) 2013 5-year data.
Share of Population
Share of Labor Force
Share of Business Owners
13%16%
18%
28%
Share of Main Street
Business Owners
6 BrInGInG vItaLIty to maIn StrEEt: how immigrant small businesses help local economies grow
ALLFOREIGN-
BORN
FOREIGN-BORN
SHARE
neighborhood Services 145,777 45,220 31%
Dry cleaning and laundry services 19,605 11,343 58%
Nail salons and other personal care services 30,874 13,963 45%
Car washes 8,336 1,861 22%
Beauty salons 78,107 16,312 21%
Barber shops 8,854 1,742 20%
accommodation and food Services 237,224 84,748 36%
Traveler accommodation 15,944 6,440 40%
Restaurants and other food services 204,252 76,828 38%
Drinking places, alcoholic beverages 13,973 1,301 9%
RV parks and camps, and rooming and boarding houses 3,055 178 6%
retail 517,079 125,282 24%
Gasoline stations 19,002 11,508 61%
Grocery stores 49,715 26,116 53%
Beer, wine and liquor stores 12,964 5,531 43%
Specialty food stores 16,618 5,813 35%
Jewelry, luggage and leather goods stores 16,892 5,437 32%
Clothing stores 23,429 7,385 32%
Health and personal care stores, except drugstores 17,029 5,169 30%
Department and discount stores 3,117 871 28%
Radio, TV and computer stores 16,389 4,164 25%
Electronics stores 3,929 996 25%
All other 337,996 52,293 15%
total 900,080 255,250 28%
figure 2. Immigrants Make Up a Very High Share of Nearly All Main Street Business OwnersFPI analysis of ACS 2013 5-year data. Business types with the highest concentration of immigrants shown first.
Source: FPI analysis of 2013 5-year ACS data. Business types with the highest concentration of immigrants shown first.
TOTALFOREIGN-
BORN
Main Street Business owners 900,080 255,250
All business owners 4,913,811 895,793
Main Street share 18% 28%
figure 3. Of 4.9 Million Business Owners, 18 Percent Have Main Street Businesses FPI analysis of ACS 2013 5-year data.
BrInGInG vItaLIty to maIn StrEEt: how immigrant small businesses help local economies grow 7
figure 4. Main Street Businesses Brought $13 Billion in Earnings to Immigrant Business OwnersFPI analysis of ACS 2013 5-year data.
All Business Owners
Main Street Business Owners
$335
$65 $37$13
U.S.-BORN
FOREIGN-BORN
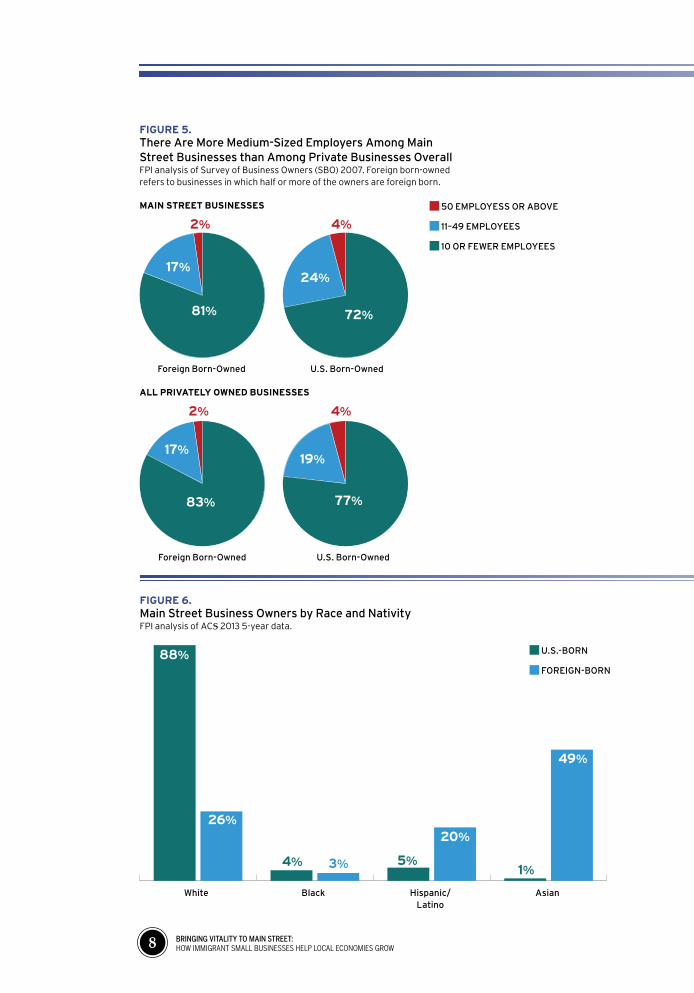
Main Street businesses are also more likely to be medium-sized employers. Analysis by the Fiscal Policy Institute (FPI) using the Survey of Business Owners (SBO) shows that while, overall, businesses are most likely to have 10 or fewer employees, Main Street businesses are a little more likely to have 11–49 employees. This is driven in large part by the accommodation and food services businesses (Figure 5).6
The overwhelming majority of U.S.-born Main Street business owners are white. Just four percent are black, five percent Hispanic and one percent Asian—far less than their share of the labor force. Among immigrant Main Street business owners the very prominent place of Asians stands out: Asians make up 49 percent of all immigrant Main Street business owners, playing an especially big role in restaurants, dry cleaners and nail salons. Whites are 26 percent of immigrant Main Street business owners, Hispanics 20 percent and blacks 3 percent (Figure 6). Twelve percent of immigrant Main Street Business owners were born in Korea, 10 percent in India, 10 percent in Mexico, and 8 percent in Vietnam—yet the top 10 countries combined make up only 59 percent of the total, with immigrants from around the world playing a role.
immigrants, Main Street Businesses and economic growth
As immigration has grown, so has overall immigrant business ownership, with Main Street
businesses playing an important part in that growth. This is a reassuring finding since it helps explain why studies have repeatedly found that immigrant workers are absorbed into the economy with only modest displacement of some categories of U.S.-born workers and no displacement overall: Immigrants are not just workers; they are also entrepreneurs. Their arrival expands the overall economy through new business development as well as through added investment and consumer spending.
Looking at the growth in business ownership in the U.S. and in the country’s 50 largest metropolitan areas, we see that immigrants are not only playing a very
big part in the growth of Main Street business ownership, but also in the growth of business ownership overall. Between 2000 and 2013, immigrants accounted for 48 percent of overall growth of business ownership in the U.S. During this time, the number of U.S.-born business owners grew by 400,000, while immigrant-owned businesses grew by 370,000.
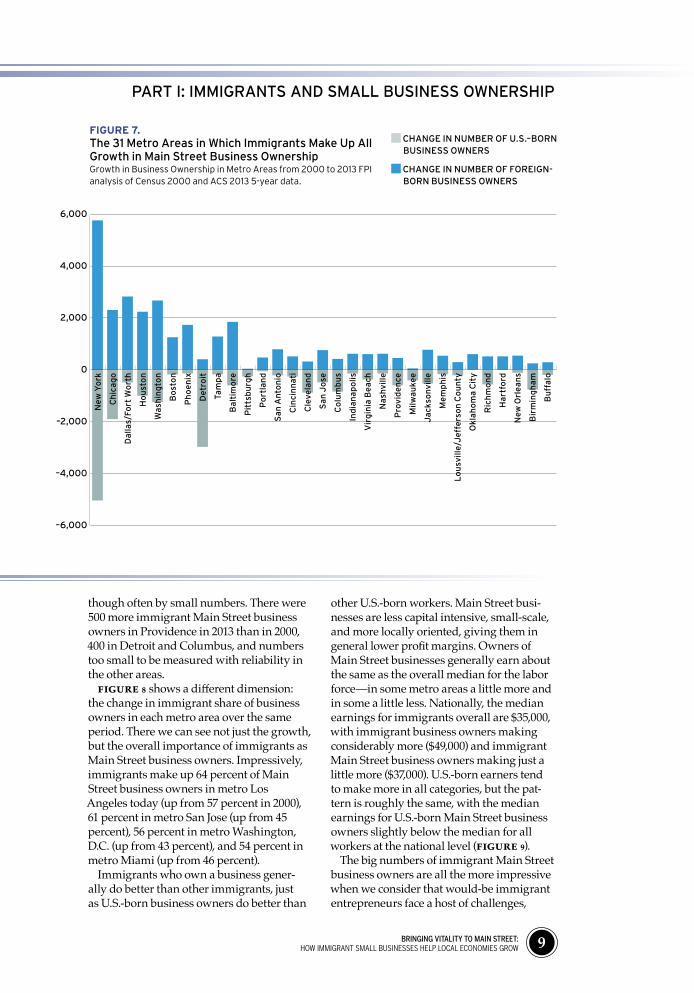
At the same time, immigrants accounted for all of the growth in Main Street businesses. The total number of U.S.-born Main Street business owners actually declined by 30,000, while immigrant Main Street business owners increased by 90,000, for a total net gain of 60,000.
As in the country as a whole, immigrants accounted for all of the growth in Main Street businesses in 31 of the country’s 50 largest metropolitan areas (Figure 7). Immigrants made up an impressive share of the increase in the remaining 19 metro areas as well, from 28 percent in Sacramento, 33 percent in Austin and 36 percent in Denver to over 90 percent in Philadelphia, Miami, San Diego, and San Francisco—96, 95, 92, and 91 percent, respectively.
The number of immigrant Main Street business owners increased even in the seven metro areas that saw an overall decline in the number of Main Street business owners: Detroit, Birmingham, Columbus, Cleveland, Milwaukee, Pittsburgh, and Providence,
PART I: IMMIGRANTS AND SMALL BUSINESS OwNERSHIP
8 BrInGInG vItaLIty to maIn StrEEt: how immigrant small businesses help local economies grow
figure 6. Main Street Business Owners by Race and NativityFPI analysis of ACS 2013 5-year data.
white Black Hispanic/Latino
Asian
U.S.-BORN
FOREIGN-BORN
88%
26%
20%
49%
4% 5%1%3%
50 EMPLOyESS OR ABOVE
11–49 EMPLOyEES
10 OR FEwER EMPLOyEES
figure 5. There Are More Medium-Sized Employers Among Main Street Businesses than Among Private Businesses OverallFPI analysis of Survey of Business Owners (SBO) 2007. Foreign born-owned refers to businesses in which half or more of the owners are foreign born.
Main Street BuSineSSeS
Foreign Born-Owned U.S. Born-Owned
72%81%
2%
24%
4%
17%
all priVately owneD BuSineSSeS
Foreign Born-Owned U.S. Born-Owned
83%
2%
19%
4%
17%
77%
BrInGInG vItaLIty to maIn StrEEt: how immigrant small businesses help local economies grow 9
CHANGE IN NUMBER OF U.S.–BORN BUSINESS OwNERS
CHANGE IN NUMBER OF FOREIGN- BORN BUSINESS OwNERS
figure 7. The 31 Metro Areas in which Immigrants Make Up All Growth in Main Street Business OwnershipGrowth in Business Ownership in Metro Areas from 2000 to 2013 FPI analysis of Census 2000 and ACS 2013 5-year data.
6,000
4,000
2,000
0
–2,000
–4,000
–6,000
New
yo
rk
Ch
ica
go
Da
llas/
Fort
wo
rth
Ho
ust
on
was
hin
gto
n
Bo
sto
n
Ph
oe
nix
De
tro
it
Tam
pa
Ba
ltim
ore
Pit
tsb
urg
h
Po
rtla
nd
Sa
n A
nto
nio
Cin
cin
nat
i
Cle
vela
nd
Sa
n J
ose
Co
lum
bu
s
Ind
ian
ap
olis
Vir
gin
ia B
ea
ch
Nas
hvi
lle
Pro
vid
en
ce
Milw
au
kee
Ja
ckso
nvi
lle
Me
mp
his
Lo
usv
ille/
Jef
fers
on
Co
un
ty
Okl
ah
om
a C
ity
Ric
hm
on
d
Ha
rtfo
rd
New
Orl
ea
ns
Bir
min
gh
am
Bu
ffa
lo
PART I: IMMIGRANTS AND SMALL BUSINESS OwNERSHIP
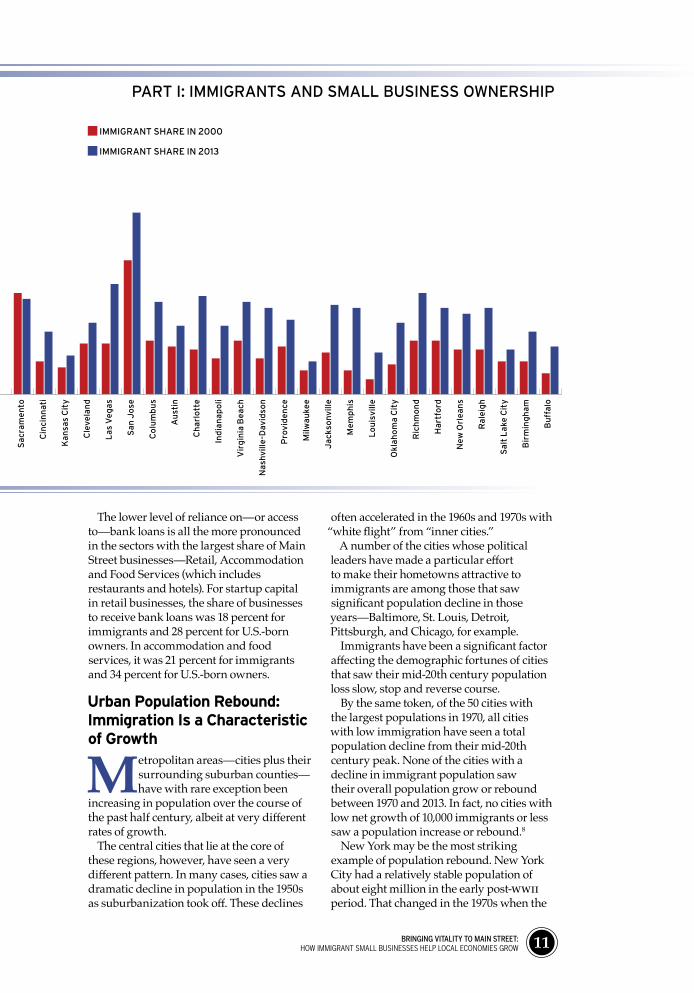
though often by small numbers. There were 500 more immigrant Main Street business owners in Providence in 2013 than in 2000, 400 in Detroit and Columbus, and numbers too small to be measured with reliability in the other areas.
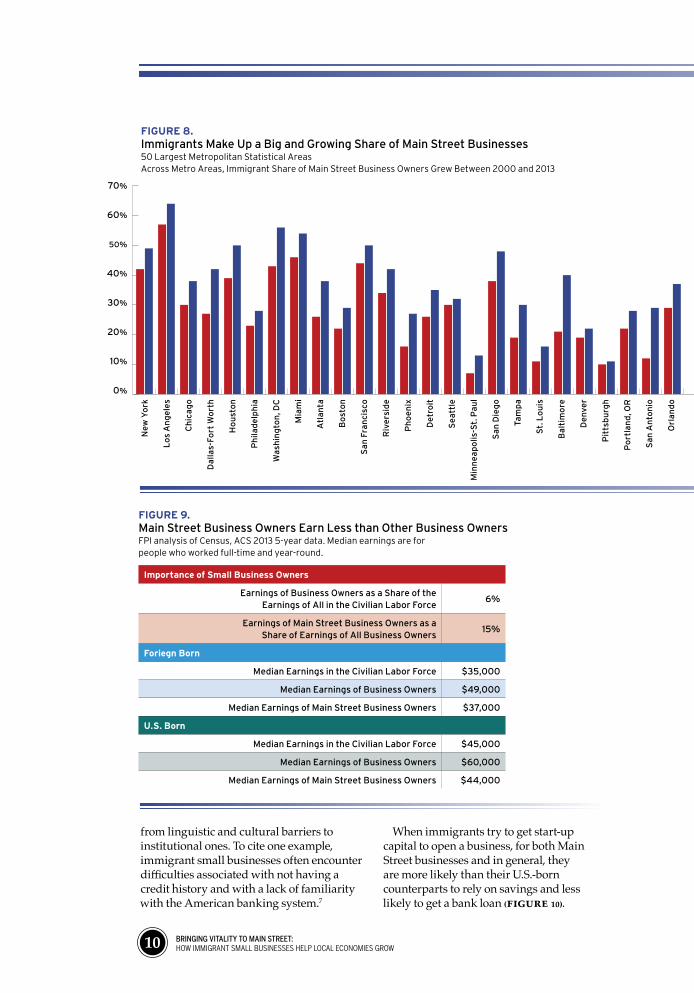
Figure 8 shows a different dimension: the change in immigrant share of business owners in each metro area over the same period. There we can see not just the growth, but the overall importance of immigrants as Main Street business owners. Impressively, immigrants make up 64 percent of Main Street business owners in metro Los Angeles today (up from 57 percent in 2000), 61 percent in metro San Jose (up from 45 percent), 56 percent in metro Washington, D.C. (up from 43 percent), and 54 percent in metro Miami (up from 46 percent).
Immigrants who own a business gener-ally do better than other immigrants, just as U.S.-born business owners do better than
other U.S.-born workers. Main Street busi-nesses are less capital intensive, small-scale, and more locally oriented, giving them in general lower profit margins. Owners of Main Street businesses generally earn about the same as the overall median for the labor force—in some metro areas a little more and in some a little less. Nationally, the median earnings for immigrants overall are $35,000, with immigrant business owners making considerably more ($49,000) and immigrant Main Street business owners making just a little more ($37,000). U.S.-born earners tend to make more in all categories, but the pat-tern is roughly the same, with the median earnings for U.S.-born Main Street business owners slightly below the median for all workers at the national level (Figure 9).
The big numbers of immigrant Main Street business owners are all the more impressive when we consider that would-be immigrant entrepreneurs face a host of challenges,
10 BrInGInG vItaLIty to maIn StrEEt: how immigrant small businesses help local economies grow
from linguistic and cultural barriers to institutional ones. To cite one example, immigrant small businesses often encounter difficulties associated with not having a credit history and with a lack of familiarity with the American banking system.7
When immigrants try to get start-up capital to open a business, for both Main Street businesses and in general, they are more likely than their U.S.-born counterparts to rely on savings and less likely to get a bank loan (Figure 10).
figure 8. Immigrants Make Up a Big and Growing Share of Main Street Businesses50 Largest Metropolitan Statistical AreasAcross Metro Areas, Immigrant Share of Main Street Business Owners Grew Between 2000 and 2013
New
yo
rk
Lo
s A
ng
ele
s
Ch
ica
go
Da
llas-
Fort
wo
rth
Ho
ust
on
Ph
ilad
elp
hia
was
hin
gto
n, D
C
Mia
mi
Atl
an
ta
Bo
sto
n
Sa
n Fr
an
cisc
o
Riv
ers
ide
Ph
oe
nix
De
tro
it
Se
attl
e
Min
ne
ap
olis
-St.
Pa
ul
Sa
n D
ieg
o
Tam
pa
St.
Lo
uis
Ba
ltim
ore
De
nve
r
Pit
tsb
urg
h
Po
rtla
nd
, OR
Sa
n A
nto
nio
Orl
an
do
Sa
cra
me
nto
Cin
cin
nat
i
Ka
nsa
s C
ity
Cle
vela
nd
Las
Ve
gas
Sa
n J
ose
Co
lum
bu
s
Au
stin
Ch
arl
ott
e
Ind
ian
ap
oli
Vir
gin
ia B
ea
ch
Nas
hvi
lle-D
avid
son
Pro
vid
en
ce
Milw
au
kee
Ja
ckso
nvi
lle
Me
mp
his
Lo
uis
ville
Okl
ah
om
a C
ity
Ric
hm
on
d
Ha
rtfo
rd
New
Orl
ea
ns
Ra
leig
h
Sa
lt L
ake
Cit
y
Bir
min
gh
am
Bu
ffa
lo
70%
60%
50%
40%
30%
20%
10%
0%
importance of Small Business owners
Earnings of Business Owners as a Share of the Earnings of All in the Civilian Labor Force
6%
Earnings of Main Street Business Owners as a Share of Earnings of All Business Owners
15%
foriegn Born
Median Earnings in the Civilian Labor Force $35,000
Median Earnings of Business Owners $49,000
Median Earnings of Main Street Business Owners $37,000
u.S. Born
Median Earnings in the Civilian Labor Force $45,000
Median Earnings of Business Owners $60,000
Median Earnings of Main Street Business Owners $44,000
figure 9. Main Street Business Owners Earn Less than Other Business OwnersFPI analysis of Census, ACS 2013 5-year data. Median earnings are for people who worked full-time and year-round.
BrInGInG vItaLIty to maIn StrEEt: how immigrant small businesses help local economies grow 11
IMMIGRANT SHARE IN 2000
IMMIGRANT SHARE IN 2013
New
yo
rk
Lo
s A
ng
ele
s
Ch
ica
go
Da
llas-
Fort
wo
rth
Ho
ust
on
Ph
ilad
elp
hia
was
hin
gto
n, D
C
Mia
mi
Atl
an
ta
Bo
sto
n
Sa
n Fr
an
cisc
o
Riv
ers
ide
Ph
oe
nix
De
tro
it
Se
attl
e
Min
ne
ap
olis
-St.
Pa
ul
Sa
n D
ieg
o
Tam
pa
St.
Lo
uis
Ba
ltim
ore
De
nve
r
Pit
tsb
urg
h
Po
rtla
nd
, OR
Sa
n A
nto
nio
Orl
an
do
Sa
cra
me
nto
Cin
cin
nat
i
Ka
nsa
s C
ity
Cle
vela
nd
Las
Ve
gas
Sa
n J
ose
Co
lum
bu
s
Au
stin
Ch
arl
ott
e
Ind
ian
ap
oli
Vir
gin
ia B
ea
ch
Nas
hvi
lle-D
avid
son
Pro
vid
en
ce
Milw
au
kee
Ja
ckso
nvi
lle
Me
mp
his
Lo
uis
ville
Okl
ah
om
a C
ity
Ric
hm
on
d
Ha
rtfo
rd
New
Orl
ea
ns
Ra
leig
h
Sa
lt L
ake
Cit
y
Bir
min
gh
am
Bu
ffa
lo
The lower level of reliance on—or access to—bank loans is all the more pronounced in the sectors with the largest share of Main Street businesses—Retail, Accommodation and Food Services (which includes restaurants and hotels). For startup capital in retail businesses, the share of businesses to receive bank loans was 18 percent for immigrants and 28 percent for U.S.-born owners. In accommodation and food services, it was 21 percent for immigrants and 34 percent for U.S.-born owners.
urban population rebound: immigration is a Characteristic of growth
Metropolitan areas—cities plus their surrounding suburban counties—have with rare exception been
increasing in population over the course of the past half century, albeit at very different rates of growth.
The central cities that lie at the core of these regions, however, have seen a very different pattern. In many cases, cities saw a dramatic decline in population in the 1950s as suburbanization took off. These declines
often accelerated in the 1960s and 1970s with “white flight” from “inner cities.”
A number of the cities whose political leaders have made a particular effort to make their hometowns attractive to immigrants are among those that saw significant population decline in those years—Baltimore, St. Louis, Detroit, Pittsburgh, and Chicago, for example.
Immigrants have been a significant factor affecting the demographic fortunes of cities that saw their mid-20th century population loss slow, stop and reverse course.
By the same token, of the 50 cities with the largest populations in 1970, all cities with low immigration have seen a total population decline from their mid-20th century peak. None of the cities with a decline in immigrant population saw their overall population grow or rebound between 1970 and 2013. In fact, no cities with low net growth of 10,000 immigrants or less saw a population increase or rebound.8
New York may be the most striking example of population rebound. New York City had a relatively stable population of about eight million in the early post-WWII period. That changed in the 1970s when the
PART I: IMMIGRANTS AND SMALL BUSINESS OwNERSHIP
12 BrInGInG vItaLIty to maIn StrEEt: how immigrant small businesses help local economies grow
population declined precipitously by one million residents. Photographs from that period look similar to photos of abandoned properties in Detroit today.
What is rarely recognized is that, although New York’s population rebounded dramat-ically and has today reached a new peak of over 8 million, the U.S.-born population is about the same as it was at the city’s decen-nial census lowpoint of 1980: 5.3 million (Figure 11). The entire arithmetic differ-ence between then and now is the increase of the immigrant population from 1.7 to 3.1 million. Immigrants now account for 37 per-cent of the city’s population. They—along with people who stuck it out in depopulated neighborhoods and a mixture of other new-comers—helped revive neighborhood after neighborhood, playing an important role in making New York the global city it is today.9
New York is not the only example of a city where an overall population decline was checked and eventually reversed by immigration gain. Seventeen of the 50 cities with the largest population in 1950 followed this pattern of decline and then rebound, with immigrants playing an important role and not infrequently making up the difference between growth and decline. Among them are San Francisco, Washington, D.C., Boston, Seattle, Kansas City, and Atlanta as well as Philadelphia, Minneapolis–St. Paul—cities that will receive detailed attention in Part Two of this report.
For a city, a bigger population is not always better, but a steeply declining population is almost always worse. Cities that are sev-eral hundred thousand people smaller than they were at their population peaks wres-tle with a fundamental structural prob-lem. They have to maintain infrastructure such as school buildings, roads and water supply on a tax base that is much smaller than the one it was originally designed to serve. The result is a seeming para-dox: high tax rates and low tax revenues.
Population growth certainly has its own attendant challenges—from managing gentrification and controlling suburban sprawl to ensuring a strong floor in the labor market. But, as leaders in any city with a declining population will acknowledge, these are challenges you want to have.
Main Street businesses are only one mod-est aspect of population rebound, but they
are an often underappreciated part of the story. Indeed, an influx of immigrants and, by extension, immigrant-owned Main Street businesses often plays an important role in the revitalization of neighborhoods and cities. Immigrants often get a foothold in this coun-try by opening small businesses in run-down areas, which also have immigrant residents. A Dominican, Kurdish, or African immigrant may have a better sense of what their compa-triots in the area would like to buy in a gro-cery or clothing store, or what would entice them to a restaurant. Often these stores and restaurants begin to attract others from the community to that neighborhood, and they
eventually break out and begin attracting the general population. Gradually, the neighbor-hood becomes more interesting, and with more “eyes on the street” it starts to feel safer. Before long, a vibrant neighborhood takes root, and the challenges may be more about rising rents than dangerous streets.10
The lesson of these past 50 years is that cities that expect to grow should also expect a growing immigrant population and would do well to help make sure that immigrants who come to an area will thrive. There are many ways that cities can welcome immigrants, but supporting immigrant entrepreneurship is one good place to start.
[iMMigrantS] helpeD reViVe neighBorhooD
after neighBorhooD
[...] MaKing new yorK the gloBal City it iS toDay.

BrInGInG vItaLIty to maIn StrEEt: how immigrant small businesses help local economies grow 13
figure 11. New york City Population Drop and Rebound, 1950 to 2013FPI analysis of Census and ACS data.
Source: FPI analysis of Census historical data, ACS and the State of the Cities data system of the U.S. Department of Housing and Urban Development.
FOREIGN BORN
U.S. BORN
1950 1960 1970 1980 1990 2000 2013
9
8
7
6
5
4
3
2
1
0
MIL
LIO
NS
24% 20% 18%
24% 28%26%
37%
FAMILy LOAN
BANK LOAN
CREDIT CARD
SAVINGS
figure 10. Immigrants Are Less Likely to Get Bank Loans and More Likely to Rely on SavingsFPI analysis of SBO 2007.
Main Street BuSineSSeS
Immigrant-Owned U.S. Born-Owned
68% 62%
7% 8%
19%28%
12%
11%
all priVately owneD BuSineSSeS
Immigrant-Owned U.S. Born-Owned
69% 65%12%
11%
16% 21%
5% 5%
PART I: IMMIGRANTS AND SMALL BUSINESS OwNERSHIP
14 BrInGInG vItaLIty to maIn StrEEt: how immigrant small businesses help local economies grow
part 2: leSSonS froM the fielD: philaDelphia, MinneapoliS–St. paul anD naShVille
To get a clearer picture of the role immigrants are playing at the local level as well as the ways that role can be supported and boosted to enhance growth further, we looked at three places:
Philadelphia, Minneapolis–St. Paul, and Nashville—one in the Northeast, one in the Midwest and one in the South.
These three areas are all in the middle range of the country’s experience with immigration. Nationally, the immigrant share of the population is 13 percent. Only the city of St. Paul, with an immigrant share of 19 percent, has a substantially higher share than that—in Philadelphia it is 13 percent, in Minneapolis 16 percent and in Nashville 12 percent.
All three metropolitan areas have seen fast growth in immigration over the past two decades. In 1990, all were well below the national average in immigrant share of population. In the Brooking Institution’s categorization of immigrant gateways, Philadelphia and Minneapolis–St. Paul are “re-emerging gateways,” places with a history of substantial immigration in the early 20th century that have only recently regained that role. Nashville is a “pre-emerging gateway,” an area with little immigration in the past century, but with an immigrant population that grew very quickly in recent years.11
In Minneapolis–St. Paul and Nashville, refugee resettlement played a significant role in seeding the immigrant communities that grew around them. Secondary migration also played a role—immigrants who first settled in other parts of the U.S. but then moved, often to join others from their country or ethnic group who had gained a footing in the local economy. Refugees have also been a part of the story in Philadelphia.
The populations of all four cities would be falling if immigration were removed from
the equation. This is not necessarily to say that if immigrants hadn’t come no one else would have, but it is clear that for a time immigrants in these cities offset a decline in the U.S.-born population.
In all three places immigrants have also played a big part in business growth. Between 2000 and 2013, immigrants represented 18 percent of overall growth in the number of small business owners in Philadelphia, 16 percent in Minneapolis–St. Paul and 32 percent in Nashville. In all three metro areas immigrants represented an even bigger share of growth in Main Street business owners: 96 percent in Philadelphia, 68 percent in Minneapolis–St. Paul and all of the growth in Nashville.
Some commonalities emerge. In each area there is a level of government support and messaging that signals that immigrants are welcome. In Philadelphia and Nashville in particular, the current mayors have been strong advocates for immigrants, and both established mayor’s offices to address immigrant and multicultural issues. There is also a strong network of nonprofit groups supporting immigrant small business development.
These three places—Philadelphia, Minneapolis–St. Paul and Nashville—were chosen because the support systems in place for immigrant business owners provide good case studies of how to foster growth. That is not to say that the infrastructure is fully developed or that settlement is easy for immigrants. But, what follows are examples of how, when supported properly, immigrant small businesses—and particularly Main Street businesses—can play a significant role in neighborhood-level development. The ways that these cities support their immigrant population offer important best practices that can be replicated in cities that are considering how to leverage the contributions of their immigrant population.
BrInGInG vItaLIty to maIn StrEEt: how immigrant small businesses help local economies grow 15
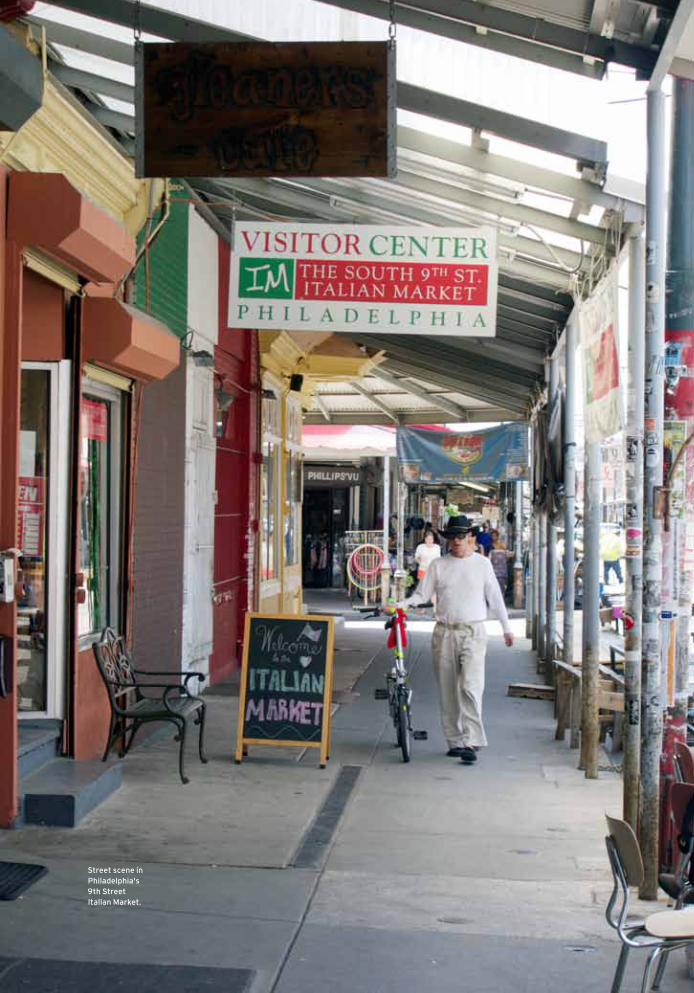
Street scene in Philadelphia's 9th Street Italian Market.
16 BrInGInG vItaLIty to maIn StrEEt: how immigrant small businesses help local economies grow
philaDelphia economic integration Strategy: revitalizing the Commercial Corridors
When the newly elected Mayor of Philadelphia, Michael Nutter, promised in his 2008 inaugural
address to increase the population of the city, more than a few observers raised their eyebrows. Philadelphia’s population reached a peak in 1950 and had fallen ever since—most dramatically in the 1970s, but with significant declines continuing through the 2000 Census. Hoping for a rebound seemed optimistic, to say the least.
But, a little-noticed change had begun to take place in the 1990s that made the mayor’s prediction realistic: for the first time since the early 20th century, Philadelphia was seeing an increase in immigration. By 2000, there were 32,000 more immigrants living in the city than a decade earlier. This influx was not enough to stop the overall decline in population on its own, but it did temper the loss. In the 2000s, the decline in U.S.-born population slowed and the increase in immigration picked up. By 2013, the city’s total population had grown by a modest 36,000 over its 2000 level, with an increase of 60,000 immigrants offsetting a decline of 24,000 U.S.-born residents. This increase in total population, though small, was a new phenomenon for the city (Figure 12).
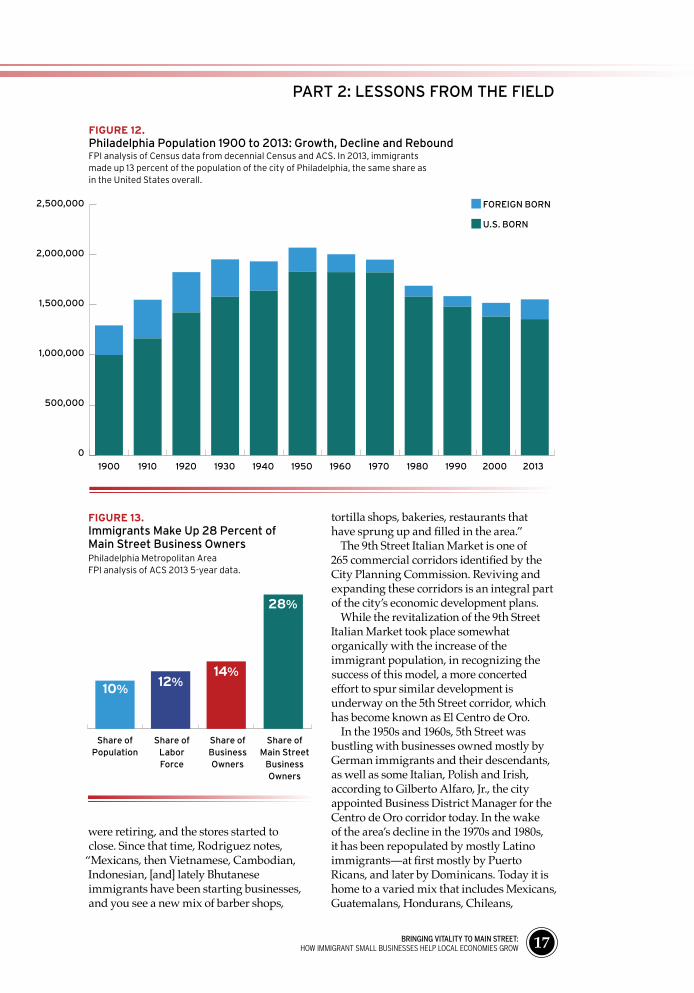
Immigrants and Main Street BusinessAs the growing immigrant population began to occupy residential neighborhoods, immigrant small businesses started to fill the city’s commercial corridors. In 1990, immigrants made up five percent of the population, five percent of the labor force and eight percent of small business owners in the Philadelphia metro area. By 2013, FPI’s data analysis of ACS data shows that immigrants made up 10 percent of the population, 12 percent of the labor force and 14 percent of business owners (Figure 13).
And, in Philadelphia, as at the national level, immigrant business owners are highly concentrated in “Main Street” businesses. Immigrants make up 28 percent of the area’s Main Street business owners, including 23 percent of retail store owners and 34 percent of restaurant owners.
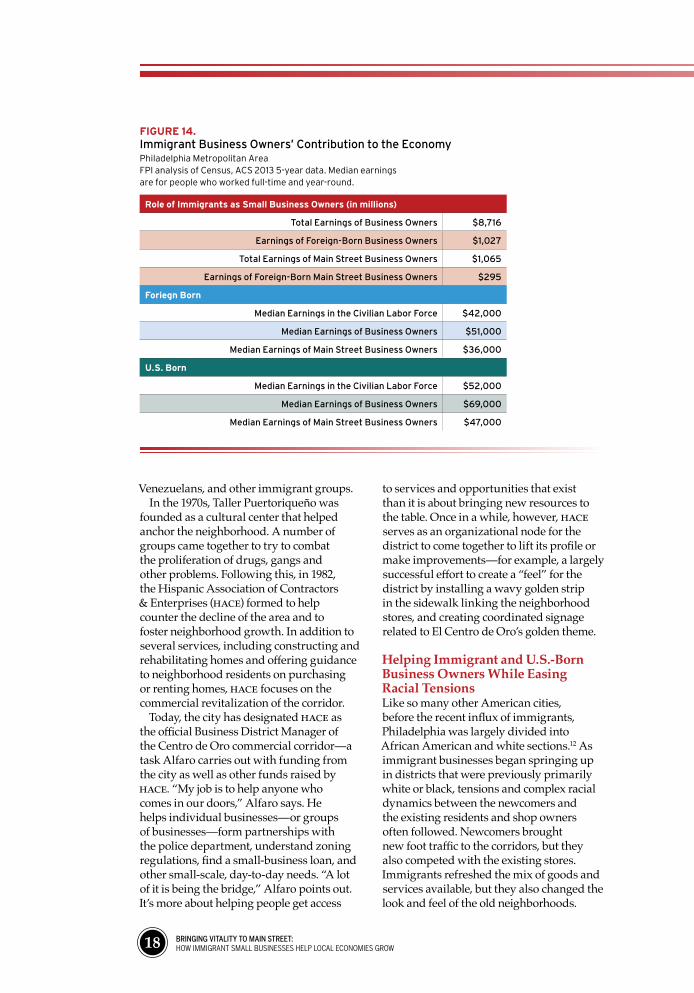
In Philadelphia, where a number of immigrants are in comparatively well-paying jobs, the median earnings for immigrants overall are $42,000—higher than the corresponding national median for immigrants of $35,000 cited above. On the other hand, median earnings for immigrant Main Street business owners are about the same in Philadelphia ($36,000) as around the country ($37,000). Here as elsewhere, Main Street businesses are small businesses with narrow profit margins, so it is not surprising that the earnings of Main Street business owners are not very high. At the same time, they are a good starting point for entrepreneurs, and a real help to neighborhood development. The annual earnings of Main Street business owners in metro Philadelphia are $1 billion, of which immigrant Main Street business owners earn $295 million. This money, like the wages paid to employees, expands the local consumer base. And, particularly where storefronts had previously gone unused, these small businesses help build the local tax base (Figure 14).
Our analysis does not allow us to get a statistically significant breakdown of the country of birth of Main Street business owners in metro Philadelphia. But, we can see that of the 13,000 immigrant business owners overall in metro Philadelphia, 1,800 were born in India—the largest single country of birth for immigrant business owners. Metro Philadelphia’s next biggest group of immigrant business owners come from Korea, followed by Greece, China, Vietnam, Ukraine, Italy, Pakistan, Mexico, and Iran.
Revitalizing Philadelphia’s Commercial CorridorsImmigrants’ strong representation as independent business owners—and their equally strong contribution to neighborhood-level economic growth—is perhaps nowhere more visible than in the 9th Street Italian Market. Jennifer Rodriguez, Executive Director of the Mayor’s Office of Immigrant and Multicultural Affairs (MOIMA), explains that immigration has played a major role in revitalizing the market. “Ten years ago, the Italian Market was in decline,” she recalls. In the 1980s and 1990s, Italian and Irish shopkeepers
BrInGInG vItaLIty to maIn StrEEt: how immigrant small businesses help local economies grow 17
PART 2: LESSONS FROM THE FIELD
figure 12. Philadelphia Population 1900 to 2013: Growth, Decline and ReboundFPI analysis of Census data from decennial Census and ACS. In 2013, immigrants made up 13 percent of the population of the city of Philadelphia, the same share as in the United States overall.
1900 1910 1920 1930 1940 1950 1960 1970 1980 1990 2000 2013
2,500,000
2,000,000
1,500,000
1,000,000
500,000
0
FOREIGN BORN
U.S. BORN
were retiring, and the stores started to close. Since that time, Rodriguez notes,
“Mexicans, then Vietnamese, Cambodian, Indonesian, [and] lately Bhutanese immigrants have been starting businesses, and you see a new mix of barber shops,
tortilla shops, bakeries, restaurants that have sprung up and filled in the area.”
The 9th Street Italian Market is one of 265 commercial corridors identified by the City Planning Commission. Reviving and expanding these corridors is an integral part of the city’s economic development plans.
While the revitalization of the 9th Street Italian Market took place somewhat organically with the increase of the immigrant population, in recognizing the success of this model, a more concerted effort to spur similar development is underway on the 5th Street corridor, which has become known as El Centro de Oro.
In the 1950s and 1960s, 5th Street was bustling with businesses owned mostly by German immigrants and their descendants, as well as some Italian, Polish and Irish, according to Gilberto Alfaro, Jr., the city appointed Business District Manager for the Centro de Oro corridor today. In the wake of the area’s decline in the 1970s and 1980s, it has been repopulated by mostly Latino immigrants—at first mostly by Puerto Ricans, and later by Dominicans. Today it is home to a varied mix that includes Mexicans, Guatemalans, Hondurans, Chileans,
figure 13. Immigrants Make Up 28 Percent of Main Street Business Owners Philadelphia Metropolitan AreaFPI analysis of ACS 2013 5-year data.
Share of Population
Share of Labor Force
Share of Business Owners
10%12%
14%
28%
Share of Main Street
Business Owners
18 BrInGInG vItaLIty to maIn StrEEt: how immigrant small businesses help local economies grow
role of immigrants as Small Business owners (in millions)
Total Earnings of Business Owners $8,716
Earnings of Foreign-Born Business Owners $1,027
Total Earnings of Main Street Business Owners $1,065
Earnings of Foreign-Born Main Street Business Owners $295
foriegn Born
Median Earnings in the Civilian Labor Force $42,000
Median Earnings of Business Owners $51,000
Median Earnings of Main Street Business Owners $36,000
u.S. Born
Median Earnings in the Civilian Labor Force $52,000
Median Earnings of Business Owners $69,000
Median Earnings of Main Street Business Owners $47,000
figure 14. Immigrant Business Owners’ Contribution to the Economy Philadelphia Metropolitan AreaFPI analysis of Census, ACS 2013 5-year data. Median earnings are for people who worked full-time and year-round.
Venezuelans, and other immigrant groups. In the 1970s, Taller Puertoriqueño was
founded as a cultural center that helped anchor the neighborhood. A number of groups came together to try to combat the proliferation of drugs, gangs and other problems. Following this, in 1982, the Hispanic Association of Contractors & Enterprises (HACE) formed to help counter the decline of the area and to foster neighborhood growth. In addition to several services, including constructing and rehabilitating homes and offering guidance to neighborhood residents on purchasing or renting homes, HACE focuses on the commercial revitalization of the corridor.
Today, the city has designated HACE as the official Business District Manager of the Centro de Oro commercial corridor—a task Alfaro carries out with funding from the city as well as other funds raised by HACE. “My job is to help anyone who comes in our doors,” Alfaro says. He helps individual businesses—or groups of businesses—form partnerships with the police department, understand zoning regulations, find a small-business loan, and other small-scale, day-to-day needs. “A lot of it is being the bridge,” Alfaro points out. It’s more about helping people get access
to services and opportunities that exist than it is about bringing new resources to the table. Once in a while, however, HACE serves as an organizational node for the district to come together to lift its profile or make improvements—for example, a largely successful effort to create a “feel” for the district by installing a wavy golden strip in the sidewalk linking the neighborhood stores, and creating coordinated signage related to El Centro de Oro’s golden theme.
Helping Immigrant and U.S.-Born Business Owners While Easing Racial TensionsLike so many other American cities, before the recent influx of immigrants, Philadelphia was largely divided into African American and white sections.12 As immigrant businesses began springing up in districts that were previously primarily white or black, tensions and complex racial dynamics between the newcomers and the existing residents and shop owners often followed. Newcomers brought new foot traffic to the corridors, but they also competed with the existing stores. Immigrants refreshed the mix of goods and services available, but they also changed the look and feel of the old neighborhoods.
BrInGInG vItaLIty to maIn StrEEt: how immigrant small businesses help local economies grow 19
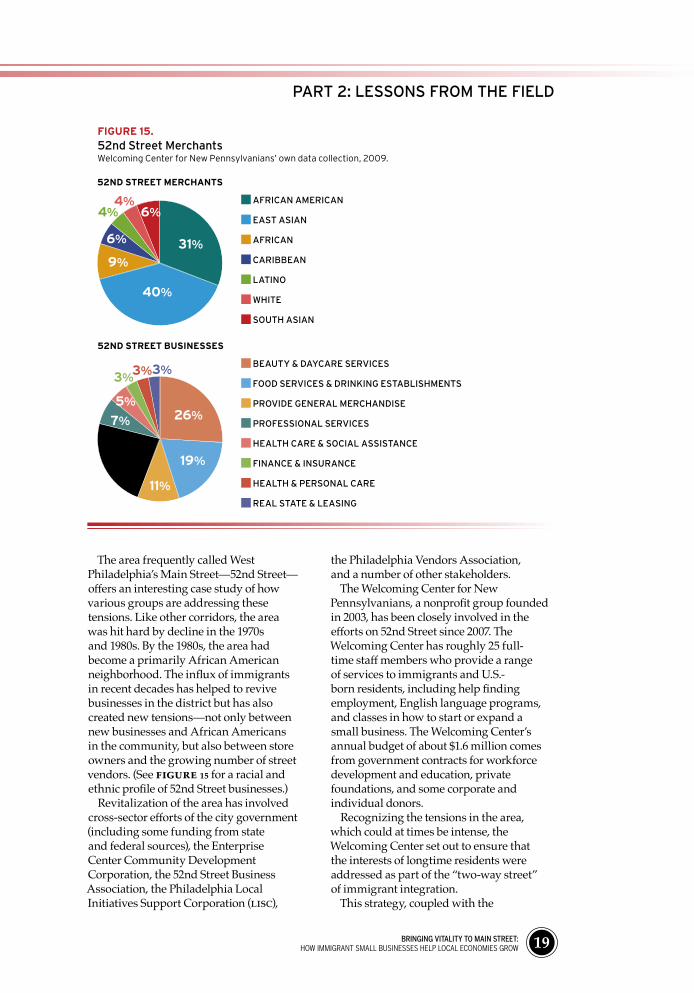
The area frequently called West Philadelphia’s Main Street—52nd Street—offers an interesting case study of how various groups are addressing these tensions. Like other corridors, the area was hit hard by decline in the 1970s and 1980s. By the 1980s, the area had become a primarily African American neighborhood. The influx of immigrants in recent decades has helped to revive businesses in the district but has also created new tensions—not only between new businesses and African Americans in the community, but also between store owners and the growing number of street vendors. (See Figure 15 for a racial and ethnic profile of 52nd Street businesses.)
Revitalization of the area has involved cross-sector efforts of the city government (including some funding from state and federal sources), the Enterprise Center Community Development Corporation, the 52nd Street Business Association, the Philadelphia Local Initiatives Support Corporation (LISC),
the Philadelphia Vendors Association, and a number of other stakeholders.
The Welcoming Center for New Pennsylvanians, a nonprofit group founded in 2003, has been closely involved in the efforts on 52nd Street since 2007. The Welcoming Center has roughly 25 full-time staff members who provide a range of services to immigrants and U.S.-born residents, including help finding employment, English language programs, and classes in how to start or expand a small business. The Welcoming Center’s annual budget of about $1.6 million comes from government contracts for workforce development and education, private foundations, and some corporate and individual donors.
Recognizing the tensions in the area, which could at times be intense, the Welcoming Center set out to ensure that the interests of longtime residents were addressed as part of the “two-way street” of immigrant integration.
This strategy, coupled with the
PART 2: LESSONS FROM THE FIELD
figure 15. 52nd Street MerchantsWelcoming Center for New Pennsylvanians’ own data collection, 2009.
52nD Street MerChantS
AFRICAN AMERICAN
EAST ASIAN
AFRICAN
CARIBBEAN
LATINO
wHITE
SOUTH ASIAN
31%
40%
9%
6%
4%4%
6%
52nD Street BuSineSSeS
BEAUTy & DAyCARE SERVICES
FOOD SERVICES & DRINKING ESTABLISHMENTS
PROVIDE GENERAL MERCHANDISE
PROFESSIONAL SERVICES
HEALTH CARE & SOCIAL ASSISTANCE
FINANCE & INSURANCE
HEALTH & PERSONAL CARE
REAL STATE & LEASING
26%
19%
11%
7%
5%
3%3%3%
20 BrInGInG vItaLIty to maIn StrEEt: how immigrant small businesses help local economies grow
center’s reputation as an “honest broker,” contributed to several successes in the effort to bring both the area’s immigrant and receiving communities closer together. For example, the Welcoming Center was instrumental in aiding the area’s existing business association’s successful outreach—after many frustrated attempts—to the corridor’s immigrant business owners. The Welcoming Center also played a role, together with many other partners, in helping to establish a Community Development Corporation to receive city funds and house a corridor manager.
The services the Welcoming Center offers, such as workshops for small business owners and those who aspire to launch a business, serve the entire community. While started with the intention of helping immigrants, it became clear that the need for this kind of education was community-wide. The curriculum developed to help small-scale, often first-time entrepreneurs get started—which covers everything from drawing up a business plan to navigating city regulations—is accessible to everyone. Today, the Welcoming Center reports that roughly 70 percent of the people served by the small business team are immigrants and 30 percent are U.S. born.
Direct Engagement with the CommunityAs a business association and a vendor’s association were established, the Welcoming Center hired Herman Nyamunga, a Kenyan immigrant with an MBA from Eastern University, to help business owners along the 52nd Street Corridor—immigrants and non-immigrants alike. Nyamunga lets business owners know about government assistance for businesses, helps them navigate regulations, connects them with good professional service providers and sources of financing, and mentors them based in part on his own business experience.
Nyamung’s job is to help businesses, but it is also to build trust. “There is a lot of mistrust among the players here,” Nyamunga explains, and that has stood in the way of coming up with compromises that would help move the area forward.
“Gaining their trust has not been easy.” Since Nyamunga has been working on 52nd Street,
however, he has been able to ease the way around difficult issues such as the removal of a street-long awning, or ongoing issues around how to accommodate both street vendors and shopkeepers.
Recognizing the time it has taken Nyamunga to develop relationships and encourage the many small steps that can add up to neighborhood change might lead to questions about how this type of initiative can be expanded city-wide. The Welcoming Center works in a handful of commercial corridors, and additional groups work in others. The modest investment the Welcoming Center has made in hiring Nyamunga to engage directly with the community seems to be paying off. But really bringing it to scale—in Philadelphia or elsewhere—requires a big step up in both staffing and resources.
“The work is very labor intensive,” acknowledges Amanda Bergson-Shilcock, vice president for policy and evaluation for the Welcoming Center, noting for example that it often takes three visits before busi-ness owners will tell Welcoming Center staff whether they have paid employees. “Many people have admired the success of this pro-gram and said that’s great, what’s the short-cut? There isn’t one. You can’t sit behind your desk and send out emails and expect that it will magically result in economic growth.”
Financing Immigrant BusinessesAccess to financial services is crucial for small business development. National data presented in Part One of this report show
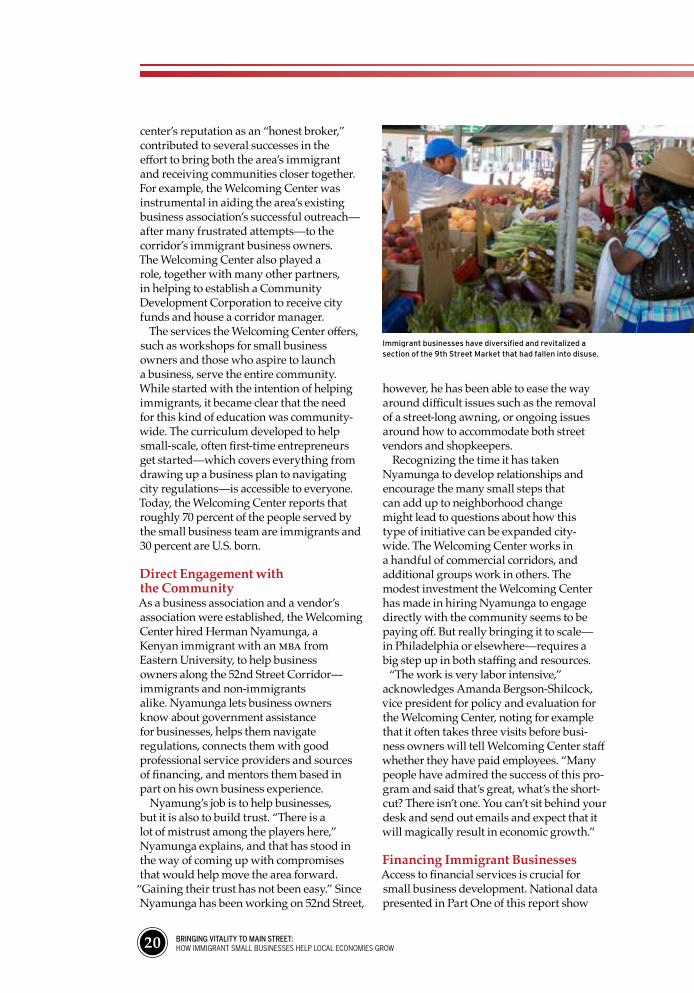
Immigrant businesses have diversified and revitalized a section of the 9th Street Market that had fallen into disuse.
21
that immigrants are somewhat less likely than U.S.-born business owners to get a bank loan as a source of start-up capital, and more likely to rely on other sources such as savings, family loans or credit cards. Relying on these sources, however, might mean waiting longer to start a business than someone who can get a bank loan. And, borrowing on a credit card—or, indeed, from a bank that charges usurious interest rates—can be a high cost to businesses.
Consequently, Community Development Financial Institutions (CDFIs) have an important role to play in small business development in general, and in immigrant small business development in particular. In Philadelphia, there are several nonprofit Community Development Financial Institutions that help fill this need. FINANTA, a leading CDFI in the region, provides loans at below-market rates, often linked with business services such as assistance with credit building, accounting, legal issues, filing taxes, or creating a business plan. Furthermore, its staff is fully bilingual in Spanish and English. The group started by providing services in the Lower Kensington neighborhood—“Girard Street used to be the south boundary; banks didn’t use to make loans north of Girard eighteen years
ago,” FINANTA’s founder and president, Luis Mora, explains. Today, the group works city-wide with a budget of $1.5 million and staff of 15. It has made 235 loans to businesses in its target areas, many of them run by Latinos.
FINANTA looks for the same qualities in a borrower as traditional banks—character, capacity, capital, credit, and collateral. But, as a mission-driven nonprofit, it works harder to understand how these “5 Cs” apply—sometimes in non-traditional ways—in low-income communities, communities of color and immigrant communities.
This can include reaching out to lending circles—a way communities can pool money together to invest in a business or buy a home. Called tandas or cundinas in Latin America, susu in West Africa and the Caribbean, and hui in China, lending circles have a similar basic structure—people who
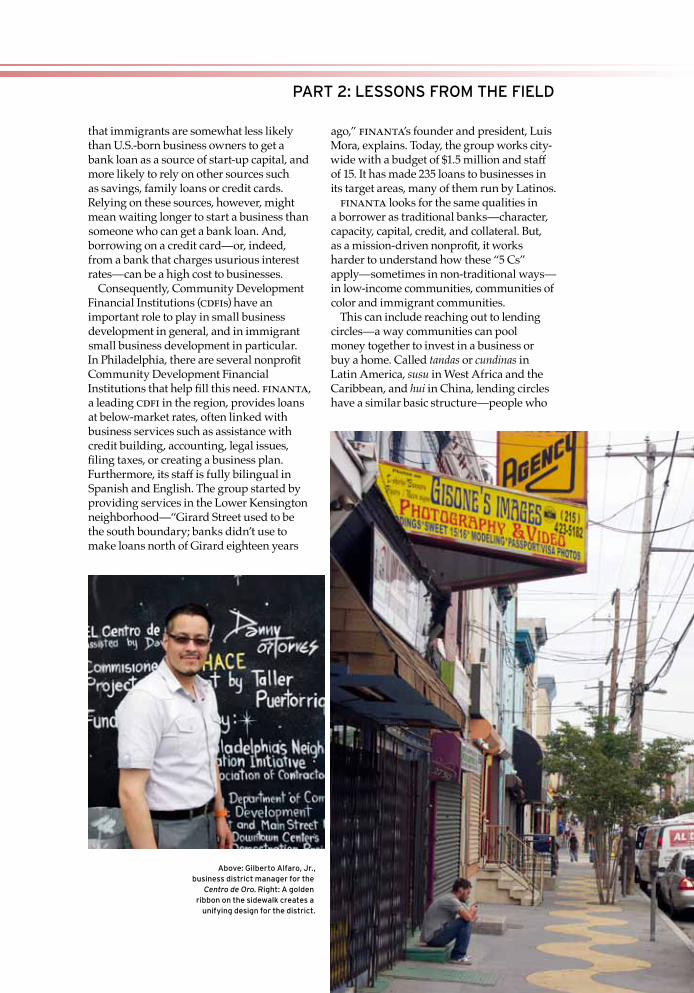
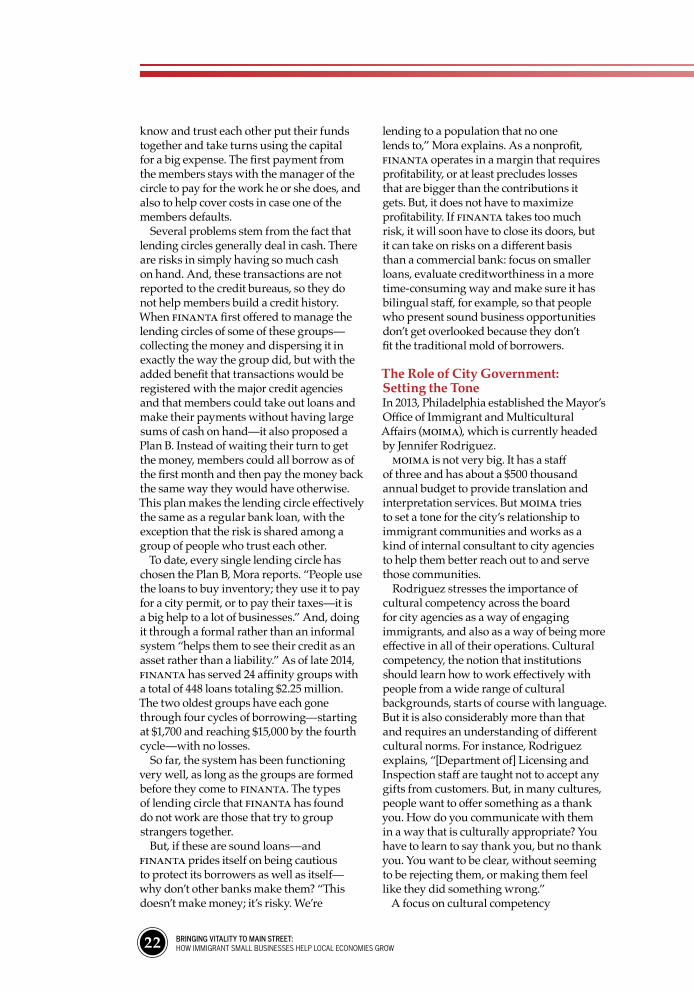
Above: Gilberto Alfaro, Jr., business district manager for the
Centro de Oro. Right: A golden ribbon on the sidewalk creates a
unifying design for the district.
PART 2: LESSONS FROM THE FIELD
22 BrInGInG vItaLIty to maIn StrEEt: how immigrant small businesses help local economies grow
know and trust each other put their funds together and take turns using the capital for a big expense. The first payment from the members stays with the manager of the circle to pay for the work he or she does, and also to help cover costs in case one of the members defaults.
Several problems stem from the fact that lending circles generally deal in cash. There are risks in simply having so much cash on hand. And, these transactions are not reported to the credit bureaus, so they do not help members build a credit history. When FINANTA first offered to manage the lending circles of some of these groups—collecting the money and dispersing it in exactly the way the group did, but with the added benefit that transactions would be registered with the major credit agencies and that members could take out loans and make their payments without having large sums of cash on hand—it also proposed a Plan B. Instead of waiting their turn to get the money, members could all borrow as of the first month and then pay the money back the same way they would have otherwise. This plan makes the lending circle effectively the same as a regular bank loan, with the exception that the risk is shared among a group of people who trust each other.
To date, every single lending circle has chosen the Plan B, Mora reports. “People use the loans to buy inventory; they use it to pay for a city permit, or to pay their taxes—it is a big help to a lot of businesses.” And, doing it through a formal rather than an informal system “helps them to see their credit as an asset rather than a liability.” As of late 2014, FINANTA has served 24 affinity groups with a total of 448 loans totaling $2.25 million. The two oldest groups have each gone through four cycles of borrowing—starting at $1,700 and reaching $15,000 by the fourth cycle—with no losses.
So far, the system has been functioning very well, as long as the groups are formed before they come to FINANTA. The types of lending circle that FINANTA has found do not work are those that try to group strangers together.
But, if these are sound loans—and FINANTA prides itself on being cautious to protect its borrowers as well as itself—why don’t other banks make them? “This doesn’t make money; it’s risky. We’re
lending to a population that no one lends to,” Mora explains. As a nonprofit, FINANTA operates in a margin that requires profitability, or at least precludes losses that are bigger than the contributions it gets. But, it does not have to maximize profitability. If FINANTA takes too much risk, it will soon have to close its doors, but it can take on risks on a different basis than a commercial bank: focus on smaller loans, evaluate creditworthiness in a more time-consuming way and make sure it has bilingual staff, for example, so that people who present sound business opportunities don’t get overlooked because they don’t fit the traditional mold of borrowers.
The Role of City Government: Setting the ToneIn 2013, Philadelphia established the Mayor’s Office of Immigrant and Multicultural Affairs (MOIMA), which is currently headed by Jennifer Rodriguez.
MOIMA is not very big. It has a staff of three and has about a $500 thousand annual budget to provide translation and interpretation services. But MOIMA tries to set a tone for the city’s relationship to immigrant communities and works as a kind of internal consultant to city agencies to help them better reach out to and serve those communities.
Rodriguez stresses the importance of cultural competency across the board for city agencies as a way of engaging immigrants, and also as a way of being more effective in all of their operations. Cultural competency, the notion that institutions should learn how to work effectively with people from a wide range of cultural backgrounds, starts of course with language. But it is also considerably more than that and requires an understanding of different cultural norms. For instance, Rodriguez explains, “[Department of] Licensing and Inspection staff are taught not to accept any gifts from customers. But, in many cultures, people want to offer something as a thank you. How do you communicate with them in a way that is culturally appropriate? You have to learn to say thank you, but no thank you. You want to be clear, without seeming to be rejecting them, or making them feel like they did something wrong.”
A focus on cultural competency
BrInGInG vItaLIty to maIn StrEEt: how immigrant small businesses help local economies grow 23
may be prompted by the need to serve multicultural communities, but it often winds up achieving an even larger goal. “In trying to be intentional about including immigrants […] you end up really thinking about the process and products and programs you’ve developed,” Rodriguez observes. “The barriers that immigrants are facing are often the same that residents are facing, but for one reason or another they have not been addressed.”
“What I often say,” Rodriguez adds, “is that what’s good for immigrants is good for everyone.“
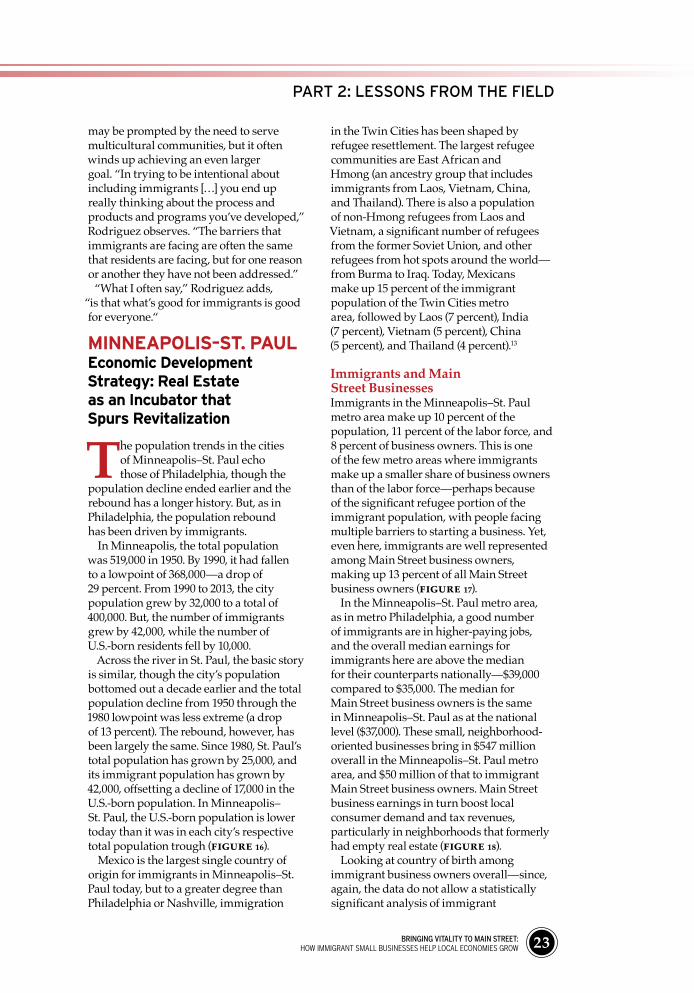
MinneapoliS–St. paul economic Development Strategy: real estate as an incubator that Spurs revitalization
The population trends in the cities of Minneapolis–St. Paul echo those of Philadelphia, though the
population decline ended earlier and the rebound has a longer history. But, as in Philadelphia, the population rebound has been driven by immigrants.
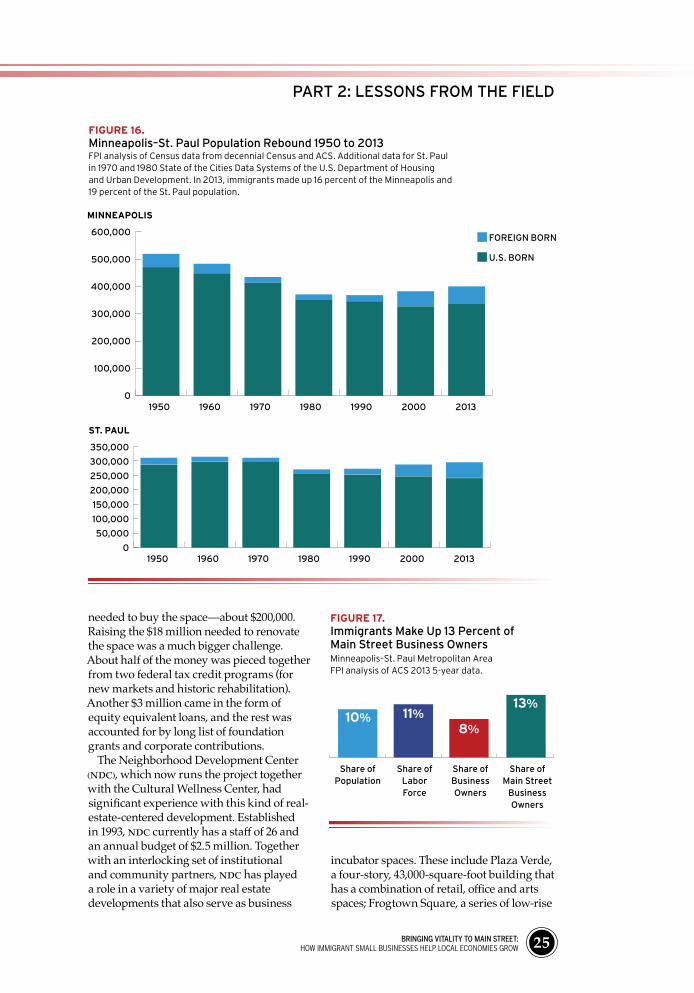
In Minneapolis, the total population was 519,000 in 1950. By 1990, it had fallen to a lowpoint of 368,000—a drop of 29 percent. From 1990 to 2013, the city population grew by 32,000 to a total of 400,000. But, the number of immigrants grew by 42,000, while the number of U.S.-born residents fell by 10,000.
Across the river in St. Paul, the basic story is similar, though the city’s population bottomed out a decade earlier and the total population decline from 1950 through the 1980 lowpoint was less extreme (a drop of 13 percent). The rebound, however, has been largely the same. Since 1980, St. Paul’s total population has grown by 25,000, and its immigrant population has grown by 42,000, offsetting a decline of 17,000 in the U.S.-born population. In Minneapolis–St. Paul, the U.S.-born population is lower today than it was in each city’s respective total population trough (Figure 16).
Mexico is the largest single country of origin for immigrants in Minneapolis–St. Paul today, but to a greater degree than Philadelphia or Nashville, immigration
in the Twin Cities has been shaped by refugee resettlement. The largest refugee communities are East African and Hmong (an ancestry group that includes immigrants from Laos, Vietnam, China, and Thailand). There is also a population of non-Hmong refugees from Laos and Vietnam, a significant number of refugees from the former Soviet Union, and other refugees from hot spots around the world—from Burma to Iraq. Today, Mexicans make up 15 percent of the immigrant population of the Twin Cities metro area, followed by Laos (7 percent), India (7 percent), Vietnam (5 percent), China (5 percent), and Thailand (4 percent).13
Immigrants and Main Street BusinessesImmigrants in the Minneapolis–St. Paul metro area make up 10 percent of the population, 11 percent of the labor force, and 8 percent of business owners. This is one of the few metro areas where immigrants make up a smaller share of business owners than of the labor force—perhaps because of the significant refugee portion of the immigrant population, with people facing multiple barriers to starting a business. Yet, even here, immigrants are well represented among Main Street business owners, making up 13 percent of all Main Street business owners (Figure 17).
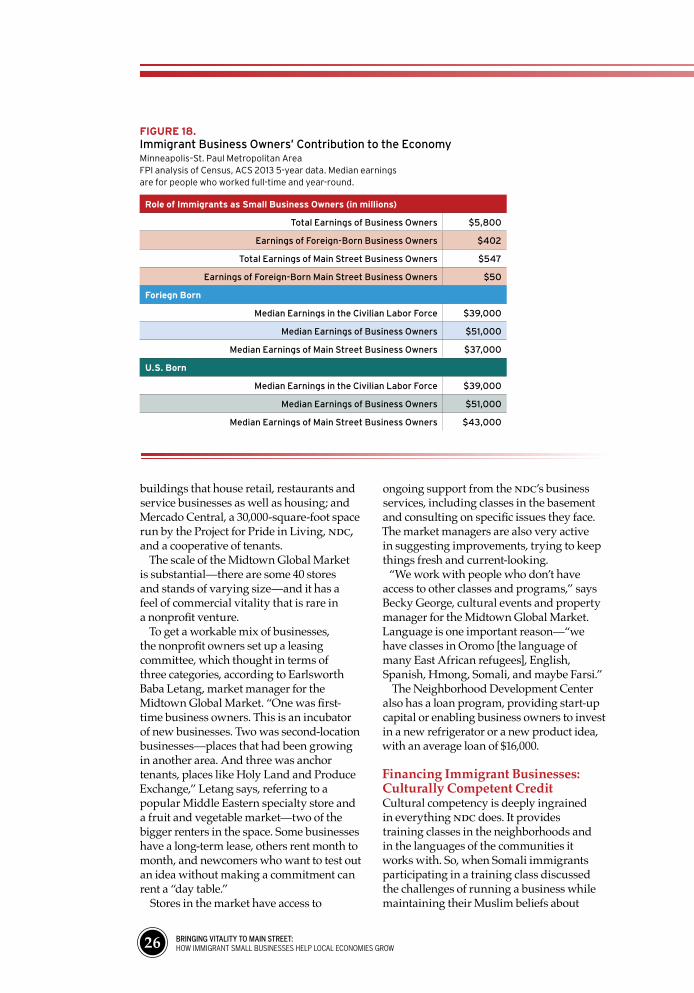
In the Minneapolis–St. Paul metro area, as in metro Philadelphia, a good number of immigrants are in higher-paying jobs, and the overall median earnings for immigrants here are above the median for their counterparts nationally—$39,000 compared to $35,000. The median for Main Street business owners is the same in Minneapolis–St. Paul as at the national level ($37,000). These small, neighborhood-oriented businesses bring in $547 million overall in the Minneapolis–St. Paul metro area, and $50 million of that to immigrant Main Street business owners. Main Street business earnings in turn boost local consumer demand and tax revenues, particularly in neighborhoods that formerly had empty real estate (Figure 18).
Looking at country of birth among immigrant business owners overall—since, again, the data do not allow a statistically significant analysis of immigrant
PART 2: LESSONS FROM THE FIELD
24 BrInGInG vItaLIty to maIn StrEEt: how immigrant small businesses help local economies grow
Main Street business owners—in the Minneapolis–St. Paul metro area, there are 5,700 immigrant business owners, with the largest numbers coming from China, Canada, Vietnam, India, and Mexico. In a separate analysis, we considered the Hmong community, registered in Census data as an ancestry rather than a place of birth, and found roughly 400 small business owners of Hmong descent, almost all of them foreign-born.
Building on Twin Cities Immigrants’ Entrepreneurial PotentialIn Philadelphia, nonprofit groups and government agencies provide support to small businesses, reaching out in particular to immigrant and minority communities in a patchwork fashion that is centered around that city’s historic commercial corridors. In contrast, in Minneapolis–St. Paul there are a number of examples of nonprofit groups acting as large-scale developers to help restructure the environment in which local businesses operate.
A prime example of this approach is the Midtown Global Market, a multi-million dollar development undertaken by a
consortium of four nonprofit groups—the Neighborhood Development Center, the Latino Economic Development Center, the African Development Center, and the Cultural Wellness Center—that came together to buy part of an enormous abandoned property.
The project started in 2005 around the idea of transforming a central part of the Midtown Exchange—formerly a retail and distribution center for Sears Roebuck and Company—into a multicultural market. The 1.2-million-square-foot property had been abandoned since 1994, and the site had become a dangerous island of urban decay. It was not an area most Twin City residents wanted to visit, and its presence cast a pall on the surrounding neighborhood along Lake Street, one of the most ethnically and racially diverse in the city. Ryan Properties, a private developer, bought the property from the city, and in the end divvied up the space into an area for mixed-income housing, space for a major health care company and the 80,000 square feet that became the Midtown Global Market.
The nonprofit consortium was able to put together the modest amount of money
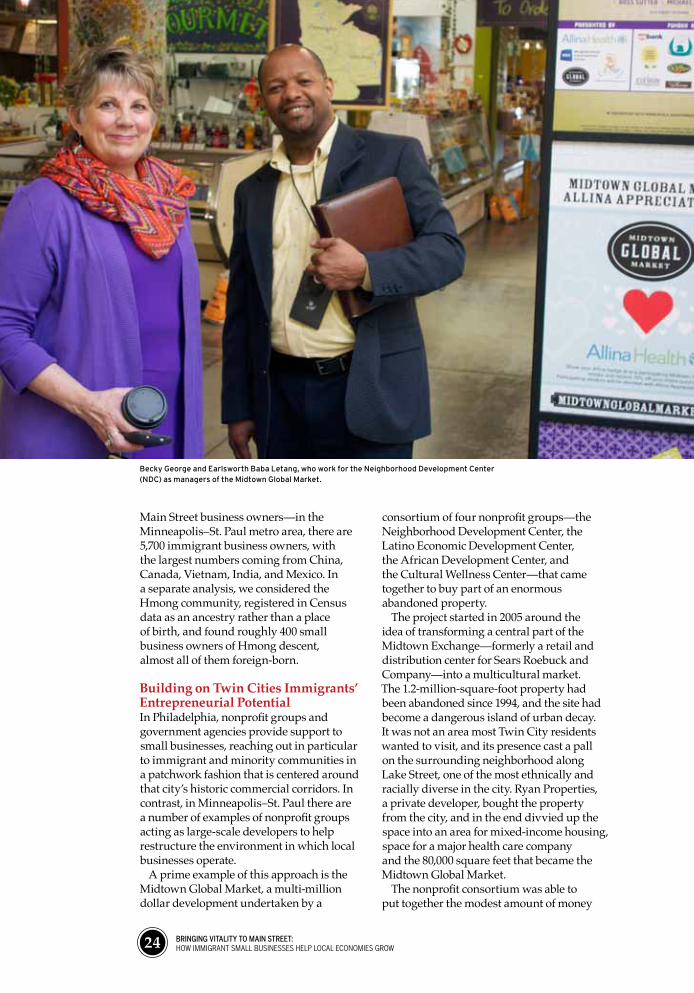
Becky George and Earlsworth Baba Letang, who work for the Neighborhood Development Center (NDC) as managers of the Midtown Global Market.
BrInGInG vItaLIty to maIn StrEEt: how immigrant small businesses help local economies grow 25
needed to buy the space—about $200,000. Raising the $18 million needed to renovate the space was a much bigger challenge. About half of the money was pieced together from two federal tax credit programs (for new markets and historic rehabilitation). Another $3 million came in the form of equity equivalent loans, and the rest was accounted for by long list of foundation grants and corporate contributions.
The Neighborhood Development Center (NDC), which now runs the project together with the Cultural Wellness Center, had significant experience with this kind of real-estate-centered development. Established in 1993, NDC currently has a staff of 26 and an annual budget of $2.5 million. Together with an interlocking set of institutional and community partners, NDC has played a role in a variety of major real estate developments that also serve as business
incubator spaces. These include Plaza Verde, a four-story, 43,000-square-foot building that has a combination of retail, office and arts spaces; Frogtown Square, a series of low-rise
figure 16.Minneapolis–St. Paul Population Rebound 1950 to 2013FPI analysis of Census data from decennial Census and ACS. Additional data for St. Paul in 1970 and 1980 State of the Cities Data Systems of the U.S. Department of Housing and Urban Development. In 2013, immigrants made up 16 percent of the Minneapolis and 19 percent of the St. Paul population.
1950 1960 1970 1980 1990 2000 2013
600,000
500,000
400,000
300,000
200,000
100,000
0
FOREIGN BORN
U.S. BORN
MinneapoliS
1950 1960 1970 1980 1990 2000 2013
350,000
300,000
250,000
200,000
150,000
100,000
50,000
0
St. paul
figure 17. Immigrants Make Up 13 Percent of Main Street Business Owners Minneapolis–St. Paul Metropolitan AreaFPI analysis of ACS 2013 5-year data.
Share of Population
Share of Labor Force
Share of Business Owners
10% 11%8%
13%
Share of Main Street
Business Owners
PART 2: LESSONS FROM THE FIELD
26 BrInGInG vItaLIty to maIn StrEEt: how immigrant small businesses help local economies grow
buildings that house retail, restaurants and service businesses as well as housing; and Mercado Central, a 30,000-square-foot space run by the Project for Pride in Living, NDC, and a cooperative of tenants.
The scale of the Midtown Global Market is substantial—there are some 40 stores and stands of varying size—and it has a feel of commercial vitality that is rare in a nonprofit venture.
To get a workable mix of businesses, the nonprofit owners set up a leasing committee, which thought in terms of three categories, according to Earlsworth Baba Letang, market manager for the Midtown Global Market. “One was first-time business owners. This is an incubator of new businesses. Two was second-location businesses—places that had been growing in another area. And three was anchor tenants, places like Holy Land and Produce Exchange,” Letang says, referring to a popular Middle Eastern specialty store and a fruit and vegetable market—two of the bigger renters in the space. Some businesses have a long-term lease, others rent month to month, and newcomers who want to test out an idea without making a commitment can rent a “day table.”
Stores in the market have access to
ongoing support from the NDC’s business services, including classes in the basement and consulting on specific issues they face. The market managers are also very active in suggesting improvements, trying to keep things fresh and current-looking.
“We work with people who don’t have access to other classes and programs,” says Becky George, cultural events and property manager for the Midtown Global Market. Language is one important reason—“we have classes in Oromo [the language of many East African refugees], English, Spanish, Hmong, Somali, and maybe Farsi.”
The Neighborhood Development Center also has a loan program, providing start-up capital or enabling business owners to invest in a new refrigerator or a new product idea, with an average loan of $16,000.
Financing Immigrant Businesses: Culturally Competent CreditCultural competency is deeply ingrained in everything NDC does. It provides training classes in the neighborhoods and in the languages of the communities it works with. So, when Somali immigrants participating in a training class discussed the challenges of running a business while maintaining their Muslim beliefs about
role of immigrants as Small Business owners (in millions)
Total Earnings of Business Owners $5,800
Earnings of Foreign-Born Business Owners $402
Total Earnings of Main Street Business Owners $547
Earnings of Foreign-Born Main Street Business Owners $50
foriegn Born
Median Earnings in the Civilian Labor Force $39,000
Median Earnings of Business Owners $51,000
Median Earnings of Main Street Business Owners $37,000
u.S. Born
Median Earnings in the Civilian Labor Force $39,000
Median Earnings of Business Owners $51,000
Median Earnings of Main Street Business Owners $43,000
figure 18. Immigrant Business Owners’ Contribution to the Economy Minneapolis–St. Paul Metropolitan AreaFPI analysis of Census, ACS 2013 5-year data. Median earnings are for people who worked full-time and year-round.
BrInGInG vItaLIty to maIn StrEEt: how immigrant small businesses help local economies grow 27
not paying interest, NDC stepped up to the challenge. NDC hired a Palestinian immigrant well versed in finance to help develop a loan product that was reba free—an arrangement where no interest is charged—as is commonly available in Middle Eastern countries. Now, there are others that provide these loans as well. Nasibu Sareva, interim executive director of the African Development Center, another lender that provides reba-free loans, explains how the process works:
“We buy the asset. We add profit, and sell it to you. You then pay us on a monthly basis. At the end of the day, the result is the same,” but clients have not been paying interest; they have been buying an asset.
NDC won an award for this innovation, the first program of its kind tailored to the Muslim community in the United States. As of 2014, Brian Singer, director of lending for NDC, says more than 100 loans have been made through this program to about 60 or 70 small businesses. Repayment rates are generally strong, and some businesses have come back more than once. The program has been highly successful and has attracted attention from around the country. For all its success, however, there are also limitations. “You can’t finance everything this way,” Singer notes. “You can’t finance
working capital, for instance—there has to be something to buy and resell.”
The Importance of Being on the Ground: The role of trust
“We start from the premise that all low-income communities include entrepreneurial people,” says Mihailo Temali, NDC’s founder and chief executive officer. “We look for people who have talent and try to remove the barriers that prevent them from succeeding.” The NDC works with placed-based Community Development Corporations—partnerships with community-based organizations that can help “bring talented entrepreneurs out of the woodwork and help us gain their trust.” NDC runs 20-week training classes in their neighborhoods, in community organizations’ offices, and in multiple languages. “We’re in the background,” Temali says of the NDC’s role. “Everything is under the auspices of the community group.”
There is the “business lab,” which provides a range of business services and consulting to entrepreneurs. And there is “the connection of all of this back to the neighborhoods—we want as many of these people as possible to open businesses in their own neighborhoods, and we think the successful small business people
On the map: A coffeeshop in Midtown Global Market.
PART 2: LESSONS FROM THE FIELD

28 BrInGInG vItaLIty to maIn StrEEt: how immigrant small businesses help local economies grow
Wilder Research
Neighborhood Development Center’s
estimated impact around Dale and University Data collected within a one mile radius from October 2011-September 2012
n Businesses and employees*
→ 65 open businesses → 576 full-time and part-time jobs created or retained (including business owners and their employees)
n $11,321,200 annual financial return to the neighborhood by businesses*
→ $5,073,500 payroll → $883,000 payments to subcontractors and cash workers → $231,300 in property taxes → $927,700 rent → $788,300 sales tax → $3,287,600 services/supplies/materials purchased in the neighborhood** → $129,800 cash/in-kind contributions for neighborhood organizations/events**
n Other contributions to the neighborhood
→ 87% of owners say they are a role model for youth or young adults
→ 70% have contributed time, money, and/or in-kind contributions to neighborhood events
→ 47% say they serve as a leader for groups or associations in their community
→ 60% say their business serves as a gathering place for the neighborhood
n Profile of surveyed businesses
→ 30 surveys completed in a one mile radius of the Dale and University intersection
→ 47% of the businesses surveyed are service-related, 23% retail, 17% restaurants or catering, 7% construction, and 7% manufacturing
→ 47% of the surveyed owners identify as African American, 30% Asian, 13% African, 7% Caucasian, and 3% Hispanic or Latino
* Estimates based on responses of 30 surveyed businesses. ** Total does not include purchases and financial contributions made by businesses outside their immediate neighborhood.
30 NDC alumni businesses within a one mile radius of the Dale and University intersection.
Larger icon on map represents more than one business.
figure 19. Alumni of NDC Business Training in Frogtown Neighborhood A study by the independent firm Wilder Research, commissioned by the NDC, mapped 65 businesses in the Frogtown neighborhood, with an estimated 576 full- and part-time employees (including the business owners). Payroll is estimated at about $5 million, and property taxes paid at $800,000. Wilder Research, 2013.
can become important leaders in their communities.” The Center prides itself on its long-term relationships with individuals and with communities.
There is also the question of financing. “A certain percent of people who complete the classes are ready to start a business, but no bank will finance them,” Temali explains. Like Luis Mora of FINANTA, Temali talks about the 5 Cs of lending, and how his group can do better than a traditional bank at assessing risk, allowing them to make loans where traditional banks wouldn’t. “One of the Cs of lending is character,” Temali explains. “But we have a way of gauging character that no bank will ever have: we’ve seen people in our classes for 20 weeks. Did they take advice; did they follow through? And, of course, they have a connection to us,” making it all the more likely they will go the extra mile to repay the loan.
The scale is at the level of the block and the neighborhood. The Center and its partners and parallel organizations (such
as the African Development Center or the Latino Economic Development Center) are having slow, but real, long-term impacts on local areas where crime and abandoned properties were serious problems.
The effect of this type of work is beginning to be felt, even at the city-wide level. The above-referenced FPI analysis of ACS data shows that there are 67,000 business own-ers in the Minneapolis–St. Paul metro area, 5,700 of them immigrants. A 2013 evalua-tion showed that the NDC alone helped 410 entrepreneurs who have businesses that were still in operation as of the study date in 2013. Of the 198 who were surveyed, about half had employees. More than half of the businesses were in buildings that were for-merly vacant—a hugely important statis-tic for neighborhood revitalization. These are not big businesses, but they are busi-nesses that, together, are changing neigh-borhoods.14 (See Figure 19 for the density of businesses that received NDC train-ing in the Frogtown neighborhood.)
BrInGInG vItaLIty to maIn StrEEt: how immigrant small businesses help local economies grow 29
naShVille– DaViDSon County economic integration Strategy: welcome, Connect, incubate, repeat
In terms of its demographic trends, Nashville stands in contrast to Philadelphia and the Twin Cities in two
important ways.First, the immigrant population
in Nashville has been growing at an exceptionally fast pace. Although Nashville today has an immigrant share that is the same as the nation as a whole, it has experienced some of the fastest rates of growth in the nation. Immigrants made up just two percent of the population as recently as 1990, growing quickly to 7 and then 12 percent in 2000 and 2013. As a result, the change seems dramatic: many people living in Nashville today can remember a time when there were few immigrants in the city, and now the percentage of immigrants matches the national average.
And, second, the Nashville metro area did not see a mid-twentieth-century population decline. Comparable data for Nashville–Davidson are not available for 1950 and 1960 since the consolidated government was created in 1963. But from 1970 until today, both U.S.-born and immigrant populations have been growing. Looking at Davidson County as a whole allows for an apples-to-apples comparison back to 1950. Unlike in Philadelphia, Minneapolis or St. Paul, the trend has been continuous population growth (Figure 20).
Immigrants and Main Street BusinessesIn the larger Nashville metro area,15 immigrants make up 8 percent of the population, 9 percent of the labor force, and 9 percent of business owners. But immigrants make up a whopping 29 percent of Main Street business owners— a vastly disproportionate role (Figure 21).
Immigrant Main Street business owners in Nashville are also doing considerably better economically than immigrants in the labor force overall. In the Nashville metro area, the median earnings for immigrants overall are $30,000—well below the national
median for immigrants of $35,000—with many immigrants working in lower-wage occupations. Yet, immigrant Main Street business owners still earn about the same in Nashville as nationally and in the other metro areas—$36,000 (equivalent to metro Philadelphia, just one thousand dollars less than the national median and the median in the Twin Cities). The aggregate earnings of immigrant Main Street business owners is $52 million, out of a total of $220 million to Main Street business owners overall (Figure 22).
Countries of birth for immigrant business owners in general in Nashville (not just Main Street business owners) include India, Mexico, Korea, El Salvador, and Canada. East African, Kurdish, and Hmong refugees also make up notable fraction of immigrant business owners. Of immigrant business owners in the Nashville metro area, 21 percent are from India, and 9 percent are from Mexico, El Salvador, Guatemala, Panama or Colombia, though it is difficult to give statistically reliable data with this level of detail in a metro area that is considerably smaller than Philadelphia or Minneapolis-St. Paul.16
Putting Out the Welcoming MatIn any conversation about immigration in Nashville, one of the first things to come up is the 2009 referendum on an amendment to the charter of the metro government that would have prohibited government officials from using any language other than English in their work. The amendment failed, 43 percent to 57 percent. But the very fact that it was proposed and stood a chance of passing galvanized and brought together a range of actors: business, labor, religious, and immigrant leaders, as well as community leaders in general.
Garrett Harper, research director for the Nashville Area Chamber of Com-merce, stresses the potential economic dam-age the English-Only initiative could have caused. “There was a high level of concern in the chamber and among business lead-ers,” Harper says. Looking back at what happened in Arizona, where business lead-ers deeply regretted not having been more engaged in the effort to prevent passage of SB1070, that state’s “show me your papers” law,17 Harper notes: “Nashville has some
PART 2: LESSONS FROM THE FIELD
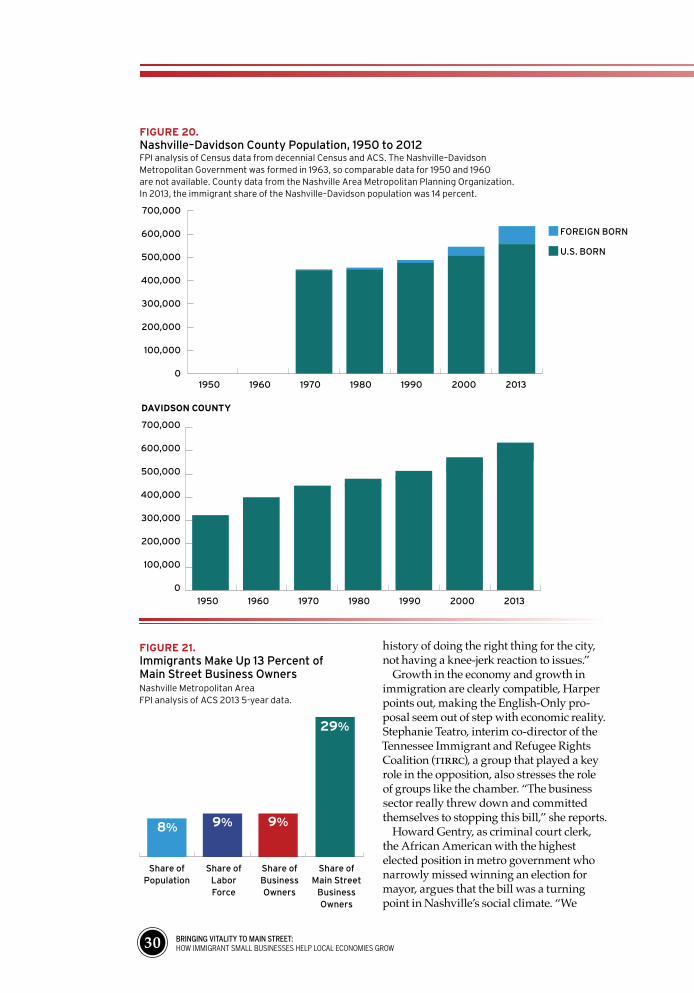
30 BrInGInG vItaLIty to maIn StrEEt: how immigrant small businesses help local economies grow
history of doing the right thing for the city, not having a knee-jerk reaction to issues.”
Growth in the economy and growth in immigration are clearly compatible, Harper points out, making the English-Only pro-posal seem out of step with economic reality. Stephanie Teatro, interim co-director of the Tennessee Immigrant and Refugee Rights Coalition (TIRRC), a group that played a key role in the opposition, also stresses the role of groups like the chamber. “The business sector really threw down and committed themselves to stopping this bill,” she reports.
Howard Gentry, as criminal court clerk, the African American with the highest elected position in metro government who narrowly missed winning an election for mayor, argues that the bill was a turning point in Nashville’s social climate. “We
figure 20.Nashville–Davidson County Population, 1950 to 2012FPI analysis of Census data from decennial Census and ACS. The Nashville–Davidson Metropolitan Government was formed in 1963, so comparable data for 1950 and 1960 are not available. County data from the Nashville Area Metropolitan Planning Organization. In 2013, the immigrant share of the Nashville–Davidson population was 14 percent.
FOREIGN BORN
U.S. BORN
700,000
600,000
500,000
400,000
300,000
200,000
100,000
01950 1960 1970 1980 1990 2000 2013
figure 21. Immigrants Make Up 13 Percent of Main Street Business Owners Nashville Metropolitan AreaFPI analysis of ACS 2013 5-year data.
Share of Population
Share of Labor Force
Share of Business Owners
8% 9% 9%
29%
Share of Main Street
Business Owners
DaViDSon County
1950 1960 1970 1980 1990 2000 2013
700,000
600,000
500,000
400,000
300,000
200,000
100,000
0
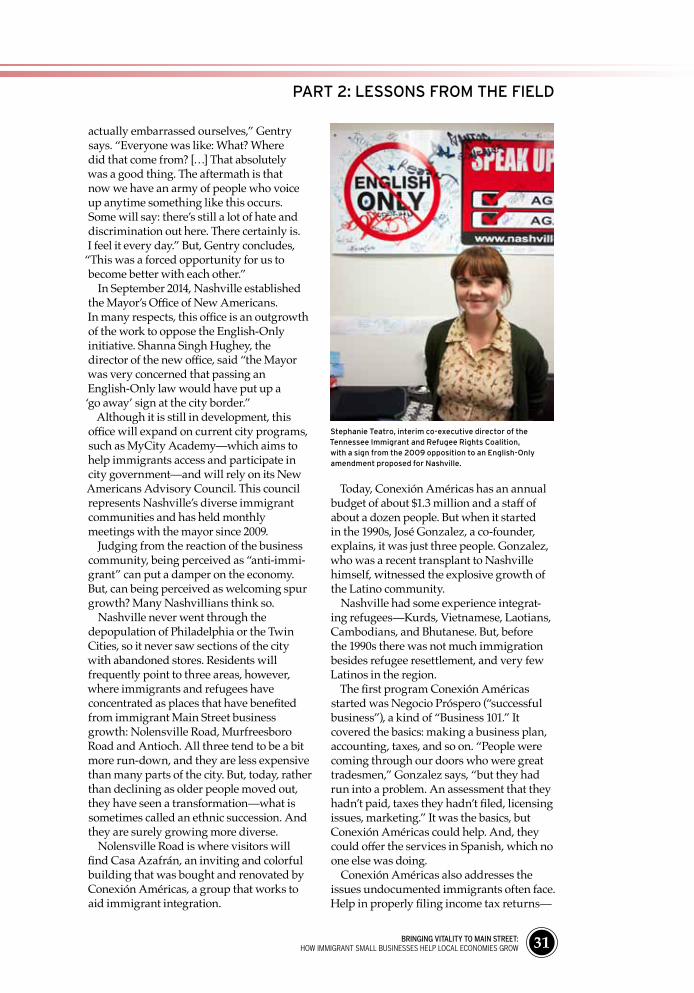
BrInGInG vItaLIty to maIn StrEEt: how immigrant small businesses help local economies grow 31
actually embarrassed ourselves,” Gentry says. “Everyone was like: What? Where did that come from? […] That absolutely was a good thing. The aftermath is that now we have an army of people who voice up anytime something like this occurs. Some will say: there’s still a lot of hate and discrimination out here. There certainly is. I feel it every day.” But, Gentry concludes,
“This was a forced opportunity for us to become better with each other.”
In September 2014, Nashville established the Mayor’s Office of New Americans. In many respects, this office is an outgrowth of the work to oppose the English-Only initiative. Shanna Singh Hughey, the director of the new office, said “the Mayor was very concerned that passing an English-Only law would have put up a ‘go away’ sign at the city border.”
Although it is still in development, this office will expand on current city programs, such as MyCity Academy—which aims to help immigrants access and participate in city government—and will rely on its New Americans Advisory Council. This council represents Nashville’s diverse immigrant communities and has held monthly meetings with the mayor since 2009.
Judging from the reaction of the business community, being perceived as “anti-immi-grant” can put a damper on the economy. But, can being perceived as welcoming spur growth? Many Nashvillians think so.
Nashville never went through the depopulation of Philadelphia or the Twin Cities, so it never saw sections of the city with abandoned stores. Residents will frequently point to three areas, however, where immigrants and refugees have concentrated as places that have benefited from immigrant Main Street business growth: Nolensville Road, Murfreesboro Road and Antioch. All three tend to be a bit more run-down, and they are less expensive than many parts of the city. But, today, rather than declining as older people moved out, they have seen a transformation—what is sometimes called an ethnic succession. And they are surely growing more diverse.
Nolensville Road is where visitors will find Casa Azafrán, an inviting and colorful building that was bought and renovated by Conexión Américas, a group that works to aid immigrant integration.
Today, Conexión Américas has an annual budget of about $1.3 million and a staff of about a dozen people. But when it started in the 1990s, José Gonzalez, a co-founder, explains, it was just three people. Gonzalez, who was a recent transplant to Nashville himself, witnessed the explosive growth of the Latino community.
Nashville had some experience integrat-ing refugees—Kurds, Vietnamese, Laotians, Cambodians, and Bhutanese. But, before the 1990s there was not much immigration besides refugee resettlement, and very few Latinos in the region.
The first program Conexión Américas started was Negocio Próspero (“successful business”), a kind of “Business 101.” It covered the basics: making a business plan, accounting, taxes, and so on. “People were coming through our doors who were great tradesmen,” Gonzalez says, “but they had run into a problem. An assessment that they hadn’t paid, taxes they hadn’t filed, licensing issues, marketing.” It was the basics, but Conexión Américas could help. And, they could offer the services in Spanish, which no one else was doing.
Conexión Américas also addresses the issues undocumented immigrants often face. Help in properly filing income tax returns—
Stephanie Teatro, interim co-executive director of the Tennessee Immigrant and Refugee Rights Coalition, with a sign from the 2009 opposition to an English-Only amendment proposed for Nashville.
PART 2: LESSONS FROM THE FIELD
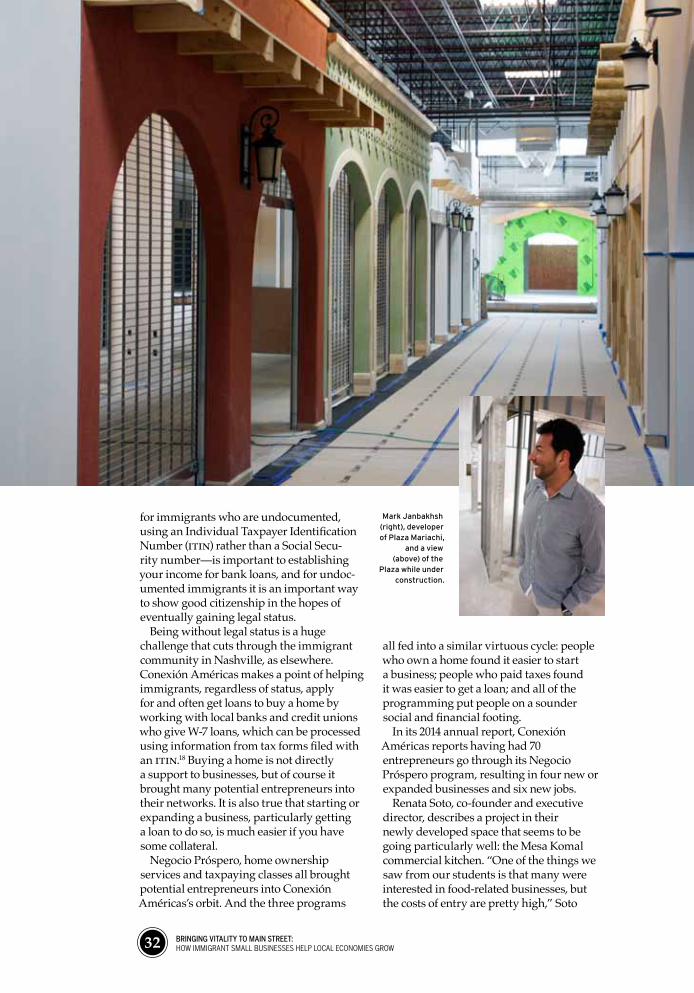
32 BrInGInG vItaLIty to maIn StrEEt: how immigrant small businesses help local economies grow
for immigrants who are undocumented, using an Individual Taxpayer Identification Number (ITIN) rather than a Social Secu-rity number—is important to establishing your income for bank loans, and for undoc-umented immigrants it is an important way to show good citizenship in the hopes of eventually gaining legal status.
Being without legal status is a huge challenge that cuts through the immigrant community in Nashville, as elsewhere. Conexión Américas makes a point of helping immigrants, regardless of status, apply for and often get loans to buy a home by working with local banks and credit unions who give W-7 loans, which can be processed using information from tax forms filed with an ITIN.18 Buying a home is not directly a support to businesses, but of course it brought many potential entrepreneurs into their networks. It is also true that starting or expanding a business, particularly getting a loan to do so, is much easier if you have some collateral.
Negocio Próspero, home ownership services and taxpaying classes all brought potential entrepreneurs into Conexión Américas’s orbit. And the three programs
all fed into a similar virtuous cycle: people who own a home found it easier to start a business; people who paid taxes found it was easier to get a loan; and all of the programming put people on a sounder social and financial footing.
In its 2014 annual report, Conexión Américas reports having had 70 entrepreneurs go through its Negocio Próspero program, resulting in four new or expanded businesses and six new jobs.
Renata Soto, co-founder and executive director, describes a project in their newly developed space that seems to be going particularly well: the Mesa Komal commercial kitchen. “One of the things we saw from our students is that many were interested in food-related businesses, but the costs of entry are pretty high,” Soto
Mark Janbakhsh (right), developer of Plaza Mariachi,
and a view (above) of the
Plaza while under construction.

BrInGInG vItaLIty to maIn StrEEt: how immigrant small businesses help local economies grow 33
explains. “There’s only so much you can do from your house, and it’s very difficult to get a home kitchen up to the requirements to pass a health inspection.”
When Conexión Américas moved from their old space to the new one, they set up the kitchen so that students from the Negocio Próspero classes could have an affordable place to rent. The kitchen, it turned out, also attracted a range of hipsters, foodies and people in general looking for a space to start out. While the construction-related businesses were started by men, the food-related businesses were primarily run by women. So far, 14 food entrepreneurs have launched or expanded their businesses in the kitchen.
Like everything at Casa Azafrán, there was also cross-pollination. Mesa Komal doesn’t just provide a kitchen space; it also provides opportunities for parties that introduced people’s food to new audiences, help with marketing and help finding staff. Some people just rented the space; others got a range of business services support.
Casa Azafrán is itself an economic development project, helping to revitalize the Nolensville Road area. In addition to Conexión Américas and Mesa Komal, the building houses several other nonprofits.19
A great deal of trading ideas and supporting each other goes on among these groups, spurring new projects and reinforcing existing ones.
As with all of the major capital projects in this report, Casa Azafrán was financed with funds that were pieced together from multiple sources, taking advantage of support from foundations and individual donors as well as unexpected opportunities that came up for funding—in this case, FEMA support for rebuilding after Tennessee’s 2010 floods.
At a much larger scale is the for-profit development Plaza Mariachi. In some ways similar to the Midtown Global Market in St. Paul, Plaza Mariachi is a 60,000-square-foot indoor space that is meant to feel like an outdoor market. The Plaza is being developed by Mark Janbakhsh, an Iranian immigrant who came to Nashville as a child and whose wife is Mexican.
The Plaza is expected to open sometime in 2015, so it is too soon to judge its success. The very planning of it, however, seems to be a testament to the vibrancy of the Latino neighborhood as it has developed. And, of course, the hope is that the project’s success will also help bring a new level of foot traffic and customers to the area.
role of immigrants as Small Business owners (in millions)
Total Earnings of Business Owners $2,021
Earnings of Foreign-Born Business Owners $141
Total Earnings of Main Street Business Owners $220
Earnings of Foreign-Born Main Street Business Owners $52
foreign Born
Median Earnings in the Civilian Labor Force $30,000
Median Earnings of Business Owners $43,000
Median Earnings of Main Street Business Owners $36,000
u.S. Born
Median Earnings in the Civilian Labor Force $43,000
Median Earnings of Business Owners $36,000
Median Earnings of Main Street Business Owners $45,000
figure 22. Immigrant Business Owners’ Contribution to the Economy Nashville Metropolitan AreaFPI analysis of ACS 2013 5-year data. Median earnings are restricted to people working full-time and year-round.
PART 2: LESSONS FROM THE FIELD
34 BrInGInG vItaLIty to maIn StrEEt: how immigrant small businesses help local economies grow
ConCluSion & BeSt praCtiCeS: a toolKit for Supporting iMMigrant BuSineSS growth
Immigrants are playing an important role in the revitalization and growth of cities around the country. They are a key part of the story of reversing the decline in population of a number of cities, sometimes despite a continued
decline in U.S.-born populations. That’s a good thing for cities that have a hard time supporting their infrastructure without an adequate tax base. Immigrant business owners also play an outsize role on Main Street and are often at the center of revitalizing business corridors, drawing a new consumer base to previously dilapidated areas, and giving new life and character to cities that had previously been in decline. This was certainly the case in the three metro areas that were the focus of this report: Philadelphia, Minneapolis–St. Paul, and Nashville. In all three, immigrants made important contributions to neighborhood-level economic development and overall city growth.
We have also seen that the contributions immigrants make to their cities through Main Street business ownership can be maximized when local efforts work to support them. In Philadelphia and Minneapolis–St. Paul, where immigrants were a driving force in neighborhood-level revitalization, programs aimed at helping immigrant business development—and along the way helping U.S.-born business owners as well—have played a role in easing the transition as newcomers arrive, and have removed numerous barriers to small business startups and growth. In Nashville, where even low-income neighborhoods never declined to the point of having boarded-up storefronts, there has been more of a transformation than a revitalization, with businesses growing as the population grows and changing character as the demographics of an area change. There, the overall climate toward immigrants has been an important factor, and modest-scale supports from nonprofit groups have also been a boost.
In all three metro areas, what quickly
becomes clear is that what’s good for immigrants is also good for the rest of the population. English language ability, trust in institutions, knowledge of American systems and processes, and questions of legal status are particularly salient for immigrants. But, when immigrants have a hard time understanding how city forms should be filled out, or how to negotiate a lease, or what exactly health inspectors are looking for, it’s likely there are plenty of others with the same problem.
Immigrants are not magic ingredients to an economic development strategy, but they are an asset to the cities they join. When that asset is underutilized, it is a loss to the local economy. Finding ways to maximize the potential of immigrant small business owners, and to do so in a way that also creates a positive climate for U.S.-born business owners, is an important project for anyone focused on city-based economic development.
The initiatives described here are all relatively small. Even the biggest pale in comparison to major economic development projects in cities such as building a stadium or luring a major company with tax breaks. The benefit of these programs being small, while perhaps difficult to bring to a much larger scale, is that they are often low-hanging fruit. For a very modest investment, a great deal can be achieved that can help a city’s neighborhoods and its overall economic growth.
What can cities and states looking to maximize the economic benefit of their immigrant communities learn from these three case studies?
Establish a climate of welcoming. The first rule of welcoming is to do
no harm. Business leaders in Nashville breathed a collective sigh of relief when that city’s controversial 2009 “English Only” referendum did not pass. Indeed, the coalitions and campaigns welcoming immigrants became a point of pride among many Nashvillians, and Mayor
BrInGInG vItaLIty to maIn StrEEt: how immigrant small businesses help local economies grow 35
Karl Dean has made a point of stressing that “embracing [...] diversity only makes [Nashville] stronger.”20 Leadership from the top makes an enormous difference, but so does a well-organized coalition, especially one that goes beyond the usual suspects and includes the private sector.
Create a government office to address immigrant integration. In Philadelphia
there is a Mayor’s Office of Multicultural and Immigrant Affairs, and in Nashville a newly created Mayor’s Office of New Americans. About a dozen other cities and states have similar offices. These generally have a staff of only a few people, but they can serve an important role in bringing together city agencies and helping them understand how to better address an area’s increasingly multicultural population, and how to better serve newcomers to the area. The symbolism of an official office is also powerful: having a representative of the government at a meeting or issuing a statement on official letterhead can have a significant impact.
Provide culturally competent business training and services. Opportunities
to learn about American business practices can be very valuable for immigrants. How to make a business plan, what licensing is required, how to do accounting and the like are the basics of Business 101. But, there is a huge difference when these services can be provided in the language of immigrants, in their neighborhoods, and by people who understand their traditions. Helping people to think of what they are already doing as businesses (cleaning carpets, providing daycare) and to formalize and expand those as “real” businesses can also be an important benefit of classes.
Make sure programs are open to all. Immigrants are not the only ones
who may need help in understanding how to navigate licensing procedures or apply for a bank loan. Finding out where immigrants face a barrier in starting a business often puts a spotlight on areas
that plenty of U.S.-born residents have trouble with as well. Proactively supporting communities that have historically not had a big share of business ownership should be a part of this process.
Be attentive to the challenges undocumented immigrants face.
At a time when there are an estimated 11 million undocumented immigrants in the U.S. and any permanent federal solution seems remote, it makes sense for states and cities to do what they can to remove barriers for undocumented immigrants living in their communities. Some are business owners, and with help can formalize many aspects of their businesses. And, with President Obama’s recently announced executive action, many will now have work permits as well, opening the door to further opportunities for their own advancement and for economic growth in the places they live.
Take advantage of the valuable services refugee resettlement agencies offer.
There are federal government resources to aid refugees in their resettlement, though funds are modest and extremely time-limited, and these are often supplemented by private or state funds. Workforce development is generally a central component of what resettlement agencies do; working with them to develop and expand entrepreneurship programs can be a significant way to expand the base of immigrant entrepreneurship.
Make financing innovative and community-based. Banks with a staff
that understands the communities they’re working with can often make loans that do a lot better than traditional banks. Speaking the language helps. Knowing the level of responsibility potential borrowers showed in a training class, as the Neighborhood Development Center does, allows for a different kind of evaluation of character, one of the 5 Cs of lending. And, being creative can help overcome barriers—such
36 BrInGInG vItaLIty to maIn StrEEt: how immigrant small businesses help local economies grow
as bringing community lending circles into the world of formal banking, providing the option of reba-free loans to Muslim borrowers, or helping undocumented immigrants apply for loans using Individual Taxpayer Identification Numbers as they attempt to adjust their legal status.
Link financing to training and business support. Applying for bank financing
for a business idea is a great way to identify where a business plan may still need work. What helps less experienced entrepreneurs most is when financing sources can be linked to business services that help improve their business plans.
Establish some incubators, especially commercial kitchens. Just as financing
can be linked to business services, so can where you rent a space. Incubators provide below-market rate places to work, but good ones also provide help with marketing, staffing, accounting, making a business plan, financing, and other services as needed. Commercial kitchens seem to be a type of incubator that is in particular demand because of the large number of immigrant-related food businesses and the challenges of meeting health inspection requirements in a home kitchen.
Improve licensing and inspections for everyone. A constant refrain among
people who work in small business development is that there is confusion and red tape that seems unnecessary around licensing and inspection issues. When cities have made improvements aimed at making the process clearer to immigrants, it has often also resulted in an improved process for everyone.
Use place-based development strategies to help Main Street businesses
build neighborhoods. Immigrant residents and businesses often cluster in certain neighborhoods, so placed-based strategies for business development are particularly well suited to immigrant entrepreneurs. The commercial corridor work in Philadelphia, the Midtown Global Market in St. Paul and the for-profit Plaza Mariachi in Nashville are three very different but useful models for development that takes advantage of the geographic patterns of immigrant business formation.
Expand the reach of chambers of commerce and trade or interest
groups. Ethnic chambers of commerce, city chambers of commerce and associations such as a vendors’ association can help organize interests in ways that make it easier for businesses to deal with government, to deal with each other, and to increase their own level of business sophistication.
Help manage cultural and economic tensions. While immigrant entrepre-
neurship is good for a city and a neighbor-hood, it is important not to turn a blind eye to the problems that can arise. Cultural and economic tensions with businesses, cus-tomers and residents can be based on both real grievances and traditional resistance to change. Both types of tension should be met honestly and taken seriously.
Pay attention to wages for workers. Many Main Street businesses don’t have
many employees or employ only family members. But an important part of business development is to make sure that businesses move toward a solid footing in paying decent wages to workers and that they are compliant with wage and hours laws just as they are with health inspections.
BrInGInG vItaLIty to maIn StrEEt: how immigrant small businesses help local economies grow 37
The statistical analysis in this report is based on two sources for data about immigrant business owners: the American Community Survey (ACS) and the Survey of Business Owners (SBO).
When using the ACS, our unit of analysis is business owners. Business owners are defined as people who own an incorporated business, and whose main job is
to run that business. To allow for detailed analysis, we pool the five most recent years of data available, from 2009 to 2013, and call it “2013 5-year data.” The terms “immigrant” and “foreign-born” are used interchangeably, and refer to anyone currently living in the United States who was born in another country. This includes undocumented immigrants, naturalized citizens and refugees, among others.
In using the SBO, our unit of analysis is businesses. Since many businesses have more than one owner, we define immigrant-owned businesses as those in which half or more of the owners were born in another country. We use the most recent year for which data are available, 2007. The SBO has a very large sample, but in using these data to look at immigrant business ownership it is important to note that there is a high non-response rate to questions about nativity. The analysis is based on cases with responses.
When using the ACS, we define Main Street businesses owners as those who own a business in the Retail Trade or the Accommodations and Food Services sectors. Also included are a subset of the Other Services sector: drycleaning and laundry services, nail salons and other personal care services, car washes, beauty salons, and barber shops. We call this grouping Neighborhood Services. When using the SBO, we define Main Street businesses in the same way, except that all “other services” are included because data limitations do not allow us to focus just on neighborhood services.
The author spent several days in each of the three metro areas over the course of six months in 2014, making site visits to programs that were identified as particularly good examples of work supporting immigrant entrepreneurship. In each metro area, he conducted interviews with over a dozen people, including government and private sector representatives and nonprofit service providers. He also spoke to researchers at universities, the Federal Reserve Bank and in the private sector. A full list of interviewees is avilable at www.fiscalpolicy.org/Acknowledgements.
MethoDology
1 Immigrants in this analysis include all people born in a foreign country residing in the United States. In Part 2, where possible, the report addresses distinctions between undocumented immigrants and those with legal status, and between refugees and non-refugee immigrants.
2 According to a Fiscal Policy Institute analysis of the most recent Census statistics (American Community Survey 2013; the five-year data sample is used to give detailed results). Business owners are, in our analysis of this data set, defined as people who own an incorpo-rated business—not publicly traded corporations—and whose full-time job is to run that business.
3 Some reports have shown far more substantial differentials between immigrant and U.S.-born business starts, although they show about the same differential in business ownership. There is some question about whether there may or may not be significantly more churn among immigrant businesses, but there is widespread agreement that immigrants are about 10 to 15 percent more likely to be small business owners. For a more detailed discussion of the findings on immigrant business ownership, see www.fiscalpolicy.org/ImmigrantEntrepreneurs
4 The first two sectors are standard definitions in the North American Industry Classification System (NAICS).
“Neighborhood Services” are those types of businesses listed above, all of which fall in the NAICS “Other Services” category.
5 Main Street is not the only place immigrant business owners are playing a disproportionate role. In health care and social services, immigrants make up 21 percent of the business owners, including 27 percent of the private offices of physicians. In wholesale trade, with its connections to both servicing retail and to import-export, immigrants make up 23 percent of business owners. And, immigrants are playing a big and often well-known role in high-tech businesses—as seen, for example, in the manufacturing of computer and peripheral equipment (31 percent), aerospace products and parts (27 percent), or medical equipment and supplies (26 percent).
6 See the Methodology regarding differences between data from the Survey of Business Owners (SBO), which takes businesses as its unit of analysis and is conducted only every five years, and the American Community Survey (ACS), which takes as its unit of analysis people whose full-time job is running their own business. where the SBO is used, Main Street Businesses are defined to include all “other services” rather than just some. SBO data are from the most recent year available, 2007.
7 Among the first empirical works with chapter-length discussions of these factors were A. Portes & R. Bach, Latin Journey (UC Press 1985) and G. DeFreitas, Inequality At work: Hispanics in the U.S. Labor Force (Oxford U. Press, 1991).
8 For details see the interactive chart available at www.fiscalpolicy.org/50Cities
9 See, for example, David Dyssegaard Kallick, “Immigration and Economic Growth in New york City,” in One Out of Three, Nancy Foner, editor (New york: New york University Press, 2013). For an interesting look at crime data, see Jacob L. Vigdor, “Immigration and New york City: The Contributions of Foreign-born Americans to New york’s Renaissance, 1975–2013,” (New york: America’s Society, April 2014).
10 Other studies that have addressed this story of neigh-borhood growth include: Sharon Zukin’s Naked City: The Death and Life of Authentic Urban Places (New york: Oxford University Press, 2010), Ivan Light and Steven Gold’s Ethnic Economies (San Diego: Academic Press,
2000), and Timothy Bates’s Race, Self-Employment and Upward Mobility: An Elusive American Dream (Baltimore: Johns Hopkins University Press, 1997).
11 The most recent Brookings report with this categorization outlined and updated is “The Geography of Immigrant Skills: Educational Profiles of Metropolitan Areas,” (washington, D.C.: Brookings Institution, 2011). An earlier classification categorized Philadelphia as a former gateway, but recent levels of immigration have shifted it to a re-emerging gateway.
12 In the course of the twentieth century, the city’s Quaker, Jewish, Italian, Irish, and German populations maintained distinct identities, but also saw themselves clearly—and arguably primarily—as white.
13 Cumulative data about refugee arrivals in Minnesota is available at www.health.state.mn.us/divs/idepc/refugee/stats/refcumm.pdf. This does not include the effects of secondary migration and does not include deaths since arrival.
14 See “Neighborhood Development Center Outcomes Evaluation,” (St. Paul: wilder Research, 2013), available on the center’s website at www.ndc-mn.org/sites/default/files/NDC%20Outcomes%20Evaluation%20-%20April%202013.pdf (accessed September 28, 2014).
15 “Nashville–Davidson,” or just “Nashville,” refers here to the areas that were combined in 1963 to form the Nashville–Davidson Metro Government. The Nashville metro area refers to the Metropolitan Statistical Area that is used by the Census Bureau to give statistics about a central city and its suburbs—effectively, a local labor market.
16 Galen Hull, a longtime activist and researcher around immigrant small business development in Nashville, developed a profile of Hispanic, East Indian, Somali, Kurdish, Bhutanese, and Nigerian small business own-ers in “Immigrant Entrepreneurs: The Face of the New Nashville,” published online in iBusiness, 2010, 2: 1-30.
17 See David Dyssegaard Kallick, “Arizona Business Leaders: An Anti-Immigrant Reputation Hurts Our Economy,” Huffington Post, April 16, 2014.
18 Gonzalez notes that the financial crisis dramatically dampened the home ownership program. “where before the crisis we were doing eight to ten a month, now we’ve done maybe ten this year.” One big reason: “the downpayment requirements have gone from 3 percent to 35 percent.”
19 These include the Tennessee Immigrant and Refugee Coalition; the American Center for Outreach, representing Tennessee’s Muslim community; the American Muslim Advisory Council, which works to create a bridge between Muslim communities and law enforcement and other government agencies; Family and Children’s Services, a center for families in crisis; the Financial Empowerment Center, which helps people open bank accounts, manage bills, deal with debt collectors, improve credit, and create a budget; the Global Education Center, which gives classes “from African drumming to ballet to folkloric dance, and Zumba;” and the nonprofit United Neighborhood Health Services Clinic.
20 The contrast to Arizona after it passed the “show me your papers” law, SB1070, is striking: “Six million media hits, almost all of them negative,” Denise Resnick, then marketing chair for the Greater Phoenix Economic Development Council, said recently. “what does that do to your brand as a welcoming, diverse state?” (See David Dyssegaard Kallick, “Arizona Business Leaders: An Anti-Immigrant Reputation Hurts Our Economy,” Huffington Post, April 16, 2014.)
endnotes