Embed Size (px)
Citation preview

16 November 2013 Side event at Japan Pavilion, COP19, Warsaw
Toshizo Maeda, IGES Kitakyushu Urban Centre
Project on Low-Carbon and Environmentally Sustainable City Planning in Surabaya, Indonesia
Main Findings of the Low-Carbon Feasibility Study in Surabaya

Objectives of the Project • Assist Surabaya City in developing low-carbon and environmentally
sustainable city plans in energy, transport, waste and water sectors • Identification of projects which can reduce CO2 emissions (save energy and
cost) in a short term • Identification of projects which can reduce CO2 emissions and bring about
multiple social, economical and environmental benefits in a long run • Support development of a data management system to measure CO2
emission reductions and establish a CO2 measurement methodology
Project on Low-Carbon and ESC Planning in Surabaya
Inception Meeting in Surabaya on July 10th
Ir. Hermien Roosita M.M., Executive Secretary, Ministry of Environment, Indonesia (left); Ir. Tri Rismaharini, MT., Mayor
of Surabaya City (center); Mr. Noboru Nomura, Consul General, Consulate General of Japan at Surabaya (right)
Project on Low-Carbon and ESC Planning in Surabaya
Green Sister City (Nov. 2012)
City of Kitakyushu City of Surabaya
IGES Development Planning Agency(BAPPEKO)
Cooperation Div. Kitakyushu Asian Center for Low Carbon Society
Japan-side Indonesia-side (counterpart)
NTT DATA Institute of Management Consulting Inc. , KPMG Azusa LCC, NTT Facilities Inc., Hohkohsya Inc., Green Prop Co., Ltd
ALMEC VPI Corp.
IGES
Hitachi Zosen Corp.
Amita Corp.
Matsuo Sekkei Corp., City of Kitakyushu,
Kitakyushu City Waster and Sewer Bureau
Cooperation: TOTO Ltd.
Cooperation: Nishihara Corp. and NTT DATA
Institute of Management
Consulting Inc.
Energy sector
Transportation sector
Solid waste sector
Water resource sector National Highway
Corporation (PERSERO)
PT SIER, local companies, National Electricity Company
(PLN)
Local companies, city hall, universities, hospitals, shopping malls, data
centres etc.
Cooperation: Fuji Electric Co., Ltd., Nippon Steel &
Sumikin Engineering Co., Ltd.
FS for energy saving and dispersed power
system
Cogeneration technology
PDAM, Keputih sludge treatment plant, Industrial Estate Company (PT SIER)
Community, Hotels, etc. Transportation Section, Taxi company, DKP
Dept. of Cleanliness and Landscaping (DKP),
Environment Dept. (BLH)
Local company, cement company
Energy saving at water and sewage plant
Introducing water-saving equipment
Waste to energy for industrial waste
FS for incineration
Waste sorting, recycling,
composting
Ministry of Energy and Mineral Resources,
Ministry of Public Work, Ministry of Environment
Public transportation, Improvement of traffic system for waste collection vehicles, low emission vehicles
Project Management
Distributed sewage treatment
Cooperation: Japan NUS Co., Ltd.
LED conversion at highway
3

Project on Low-Carbon and ESC Planning in Surabaya
Green Sister City (Nov. 2012)
City of Kitakyushu City of Surabaya
IGES Kitakyushu Development Planning Agency(BAPPEKO)
Cooperation Div. Kitakyushu Asian Center for Low Carbon Society
Japan-side Indonesia-side (counterpart)
NTT DATA Institute of Management Consulting Inc. , KPMG Azusa LCC, NTT Facilities Inc., Hohkohsya Inc., Green Prop Co., Ltd
ALMEC VPI Corp.
IGES
Hitachi Zosen Corp.
Amita Corp.
Matsuo Sekkei Corp., City of Kitakyushu,
Kitakyushu City Waster and Sewer Bureau
Cooperation: TOTO Ltd.
Cooperation: Nishihara Corp. and NTT DATA
Institute of Management
Consulting Inc.
Energy sector
Transportation sector
Solid waste sector
Water resource sector National Highway
Corporation (PERSERO)
PT SIER, local companies, National Electricity Company
(PLN)
Local companies, city hall, universities, hospitals, shopping malls, data
centres etc.
Cooperation: Fuji Electric Co., Ltd., Nippon Steel &
Sumikin Engineering Co., Ltd.
FS for energy saving and dispersed power
system
Cogeneration technology
PDAM, Keputih sludge treatment plant, Industrial Estate Company (PT SIER)
Community, Hotels, etc. Transportation Section, Taxi company, DKP
Dept. of Cleanliness and Landscaping (DKP),
Environment Dept. (BLH)
Local company, cement company
Energy saving at water and sewage plant
Introducing water-saving equipment
Waste to energy for industrial waste
FS for incineration
Waste sorting, recycling,
composting
Ministry of Energy and Mineral Resources,
Ministry of Public Work, Ministry of Environment
Public transportation, Improvement of traffic system for waste collection vehicles, low emission vehicles
Project Management
Distributed sewage treatment
Cooperation: Japan NUS Co., Ltd.
LED conversion at highway
4
F/S supported by Kitakyushu City, funded by Ministry of Economy, Trade and Industry (METI), Japan
F/S supported by Kitakyushu City, funded by Japan International
Cooperation Agency (JICA)
Kitakyushu City-based companies
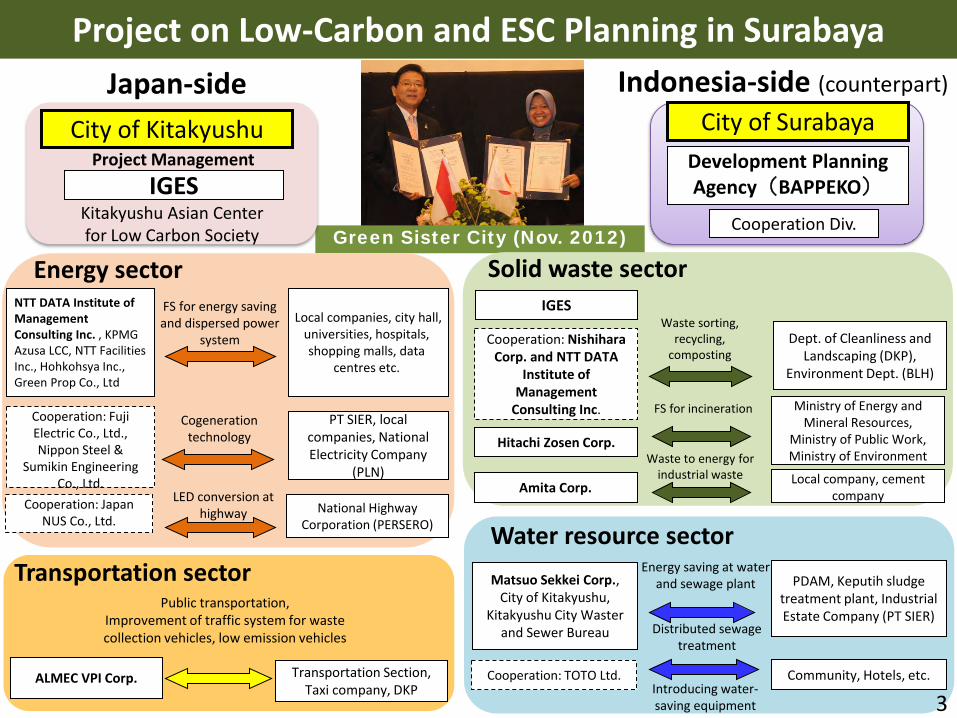
Water resource sector Energy saving at water purification
plants and pumping stations 900 t-CO2/year
Water supply leakage reduction 5,300 t-CO2/year
Sewage treatment in SIER and Keputih sludge treatment plant 30 t-CO2/year
Transportation sector Fuel switch for vehicles (public buses,
public vehicles, taxis) 26,000t-CO2/year
Waste hauling vehicles replaced with low-emission vehicles and operation management improvement
3,000t-CO2/year
Solid waste sector
Solid waste sorting and recycling 21,000 t-CO2/year
Waste-to-energy project 8,000 t-CO2/year
industrial waste Incineration at cement kilns 12,000 t-CO2/year
Project on Low-Carbon and ESC Planning in Surabaya
Energy sector
Co-generation system at SIER Industrial Park
38,000t-CO2/year
Energy saving in buildings 10,000t-CO2/year
LED highway lights 630t-CO2/year
Targeted sectors and expected GHG emissions reduction
Total reduction: 120,000t-CO2/year
5

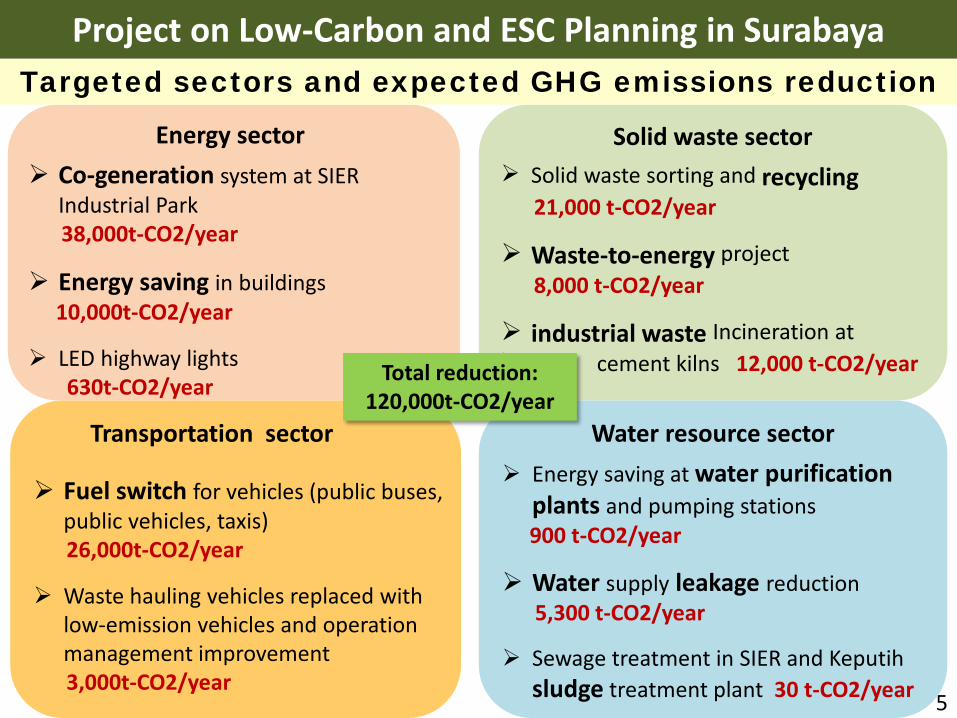
Progress of Energy sector
6
Progress of Energy sector
7

Progress of Energy sector
8

9 Copyright © 2013 NTT DATA INSTITUTE OF MANAGEMENT CONSULTING, Inc.
Pasuruan Industrial Estate Rembang (PIER) B. Energy Conservation
A. CHP
Finding Candidate Factory Interview survey / Data Collection Planning
Company List
Factory A
Factory B
Factory C
Factory D
・・・
List up candidates based on business category
1st round survey Oct 8 - 11
2nd round survey Dec 3 – 5 (Tentative)
Visit factories not visited in 1st round survey
Steam Demand Factory A : 20t/h Factory B : 2t/h Factory C : 2t/h
We have started interview survey and found a large amount of steam demand in PIER. Interview survey will be continued for examining a possible capacity of CHP Plant.

1
Copyright © 2013 NTT DATA INSTITUTE OF MANAGEMENT CONSULTING, Inc.
Proposal to Hotel A
1. Replacement of Laundry Machine
Existing Equipment : Using old equipments, both electricity consumption and water consumption can be reduced by installing new equipments.
→ We ask them to provide specification of each equipment. After receiving specification data, we will propose a plan in detail
→ Hotel will increase capacity of laundry service because of expansion plan at the adjacent shopping complex, in which a new hotel will be opened.
→ Similar needs may exist in many hotels because each hotel usually provide laundry service by themselves (not outsourcing)
B. Energy Conservation
A. CHP

1
Copyright © 2013 NTT DATA INSTITUTE OF MANAGEMENT CONSULTING, Inc.
Proposal to Hotel A
2. Installation of BEMS Existing Equipment : They install
BAS (Building Automation System) which has limited functions. Installing BEMS by adding some functions, energy consumption may be reduced by 5%. → Hotel asked us to provide
detailed information about how BEMS can reduce energy consumption.(now in preparation)
3. Installation of LED Hotel asked us to propose LED
installation with profit sharing scheme. → Some manufactures made a
proposal of installing LED. → Hotel would like not only to install
LED but also to decrease initial cost with profit sharing scheme.
→ Based on the request above, we are now revising our proposal.
B. Energy Conservation
A. CHP
1
Copyright © 2013 NTT DATA INSTITUTE OF MANAGEMENT CONSULTING, Inc.
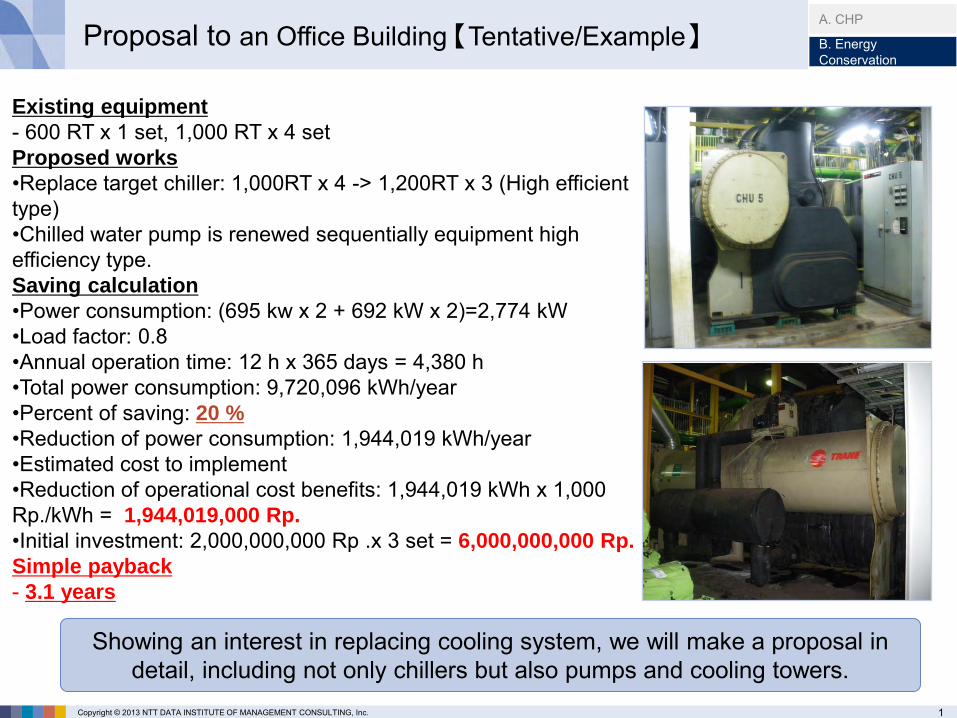
Proposal to an Office Building 【Tentative/Example】
Existing equipment - 600 RT x 1 set, 1,000 RT x 4 set Proposed works •Replace target chiller: 1,000RT x 4 -> 1,200RT x 3 (High efficient type) •Chilled water pump is renewed sequentially equipment high efficiency type. Saving calculation •Power consumption: (695 kw x 2 + 692 kW x 2)=2,774 kW •Load factor: 0.8 •Annual operation time: 12 h x 365 days = 4,380 h •Total power consumption: 9,720,096 kWh/year •Percent of saving: 20 % •Reduction of power consumption: 1,944,019 kWh/year •Estimated cost to implement •Reduction of operational cost benefits: 1,944,019 kWh x 1,000 Rp./kWh = 1,944,019,000 Rp. •Initial investment: 2,000,000,000 Rp .x 3 set = 6,000,000,000 Rp. Simple payback - 3.1 years
Showing an interest in replacing cooling system, we will make a proposal in detail, including not only chillers but also pumps and cooling towers.
B. Energy Conservation
A. CHP

Applicable Technologies Introduction of low carbon
vehicles
Improvement of operation efficiency
1. Survey Activity
Target vehicles Route Bus
City taxi
Intra-city public transport (angkot)
Garbage collector
To assess potential environmental improvement and possible CO2 emission reduction by way of introduction of low carbon vehicles and improvement of operation efficiency.
angkot taxi garbage collector bus

4. Outline of GPS Survey To install GPS devices with communication function to the target vehicles and collect traffic data for one week. Collect data of Positioning, Time, Speed of the target vehicles with sampling rate of 30 seconds, and analyze to identify following; any inefficient operational route any traffic congestion on the operational route
Receive Server Web Server
GPS Database
AWS Cloud GPS Track
Inside Car
vehicle
GPS
GPS devices installation : 19-22 August GPS devises removing : 27-30 August

Bus Operation Routes in Surabaya (2,000 buses by 32 companies)
Source: Surabaya City (and Almec VPI Corporation)

Angkot Operation Routes in Surabaya (79 routes, 3,000 vehicles)
Source: Surabaya City (and Almec VPI Corporation)

Result of GPS Survey
Angkot ✔Travel time ratio is low (under 50%) and the results are considerably different in vehicles. →Improvement of management and traffic efficiency are
expected by the reduction of the number of the vehicles.
Bus ✔Travel time ratio is high and the results are not different much in vehicles. →Taking an approach against each vehicle is more
effective than the improvement of operation efficiency. (e.g. Replace existing vehicle by low-carbon vehicles)
→Survey of the availability of CNG
✔The idle time ratio is quite high. →Reduction of energy is expected by turning off a vehicle
engine when stopped every time 「idling stop」.
✔Travel speed varies widely
→Energy reduction is expected by “Eco-driving”.
EV Angkot

Taxi ✔Travel speed varies widely
→Energy reduction is expected by “Eco-driving”. ✔Travel time ratio is moderately high and the results are
not different much in vehicles. →Taking an approach against each vehicle is more
effective than the improvement of operation efficiency. (e.g. Replace existing vehicle by low-carbon vehicles)
→Survey of the availability of CNG/Hybrid
Garbage Truck
✔Travel time ratio is low
✔After the result of the on-going study on solid waste management, necessary measures will be proposed for transport.
CNG conversion kit CNG station

[1]
[2]
[3]
[4]
[5]
[6]
[7][8]
[9][10]
Existing and planned CNG Stations in Surabaya
Source: Surabaya City (and Almec VPI Corporation)

0-1.Flow of Waste in Surabaya SURABAYA
ECO MANAGEMENT
Households/ Offices
Collection by communities
Waste pickers (Several thousands)
Transfer Station
• Depo 160 facilities
Waste pickers (Several thousands)
Transfer of waste
Surabaya City Department of Cleanliness and Gardens (DKP) /
Private operators
Landfill disposal cost: USD12/t
Benowo Disposal Site • Volume of waste received: 1,200 t/day • Collection vehicles: 300 per day • Cost for collection and treatment:
USD11 million/year
It is the only final disposal site, but its treatment
capacity is nearing the limit.
Waste pickers 1,000 - 1,200 persons
20
Source: Nishihara Corporation

0-2 Outline of the project SURABAYA
ECO MANAGEMENT
Households/ Offices
Collection by communities
Waste pickers (Decrease naturally with
employment at Super Depo, etc.)
Super Depo
• Recycle-based intermediate treatment facility
Commission fee for treatment: USD12/t
Upgrade existing transfer stations (Depos) to recycle-based intermediate facilities, or “Super Depos,” which have functions of
a wholesale.
Landfill disposal cost: USD12/t
Benowo Disposal Site • Volume of waste received: 1,200 tons per day • Collection vehicles: 300 per day • Cost for collection and treatment:
1.1 billion yen per year
Waste pickers (Decrease naturally with
employment at Super Depo, etc.)
Waste sent to the final disposal site will be 30% of the current amount (70% reduction), and the life of the
disposal site could be extended.
Currently brought directly to the final disposal site.
Waste received: 1,200 tons (40 tons per day × 30 facilities)
Super Depo (Recycle-based intermediate treatment facility) Transfer of waste
Return some portion of profit to
communities
• Construction of day nurseries and primary schools
• Improvement of living conditions for informal sector
(50 persons employed in each facility)
Policy of Surabaya City Interested in reducing waste through the deployment of intermediate treatment facilities (TPST) within the city.
Deployment of Super Depos in 40 locations within the city
Operate one Super Depo as a pilot project
Outsource the treatment of residuals at the disposal site - USD12/t
Food waste ⇒ composting (Yield: 20%)
Valuables ⇒ Separation
Residuals
Composting at the compost center USD30-50/t Sell to manufacturers as raw material USD100/t
Selection and processing
Possible to reduce
Possible to reduce
Possible to reduce
21
Source: Nishihara Corporation

0-3 Current Progress SURABAYA
ECO MANAGEMENT
Plastic Paper scraps Food waste
Sold to farmers
SUPER-DEPO (First step)
Compost center (Second step)
final disposal site
85% reduction Sold to resource recovery operators
Was
te c
olle
ctio
n
Plas
tic
Pape
r scr
aps
Met
als
Fore
ign
mat
eria
ls
Org
anic
BENOWO
Transferred by DKP
In operation (Since Mar 2013)
22
Under construction (to be completed by Jan. or Feb., 2014) 60%
~ 70%
Source: Nishihara Corporation

Progress of Solid Waste sector (waste sorting, recycling composting ) Source: Nishihara Corporation

Progress of Solid Waste sector (waste sorting, recycling composting ) Source: Nishihara Corporation

Super Depo
Weighting Implement Waste Incineration plant
Compost plant
Residual Waste
Final disposal site
Bottom Ash
Incombustible Residue
Combustible Residue
Valuables
Electricity Organic
© Hitachi Zosen Corporation
Source:
© Hitachi Zosen Corporation
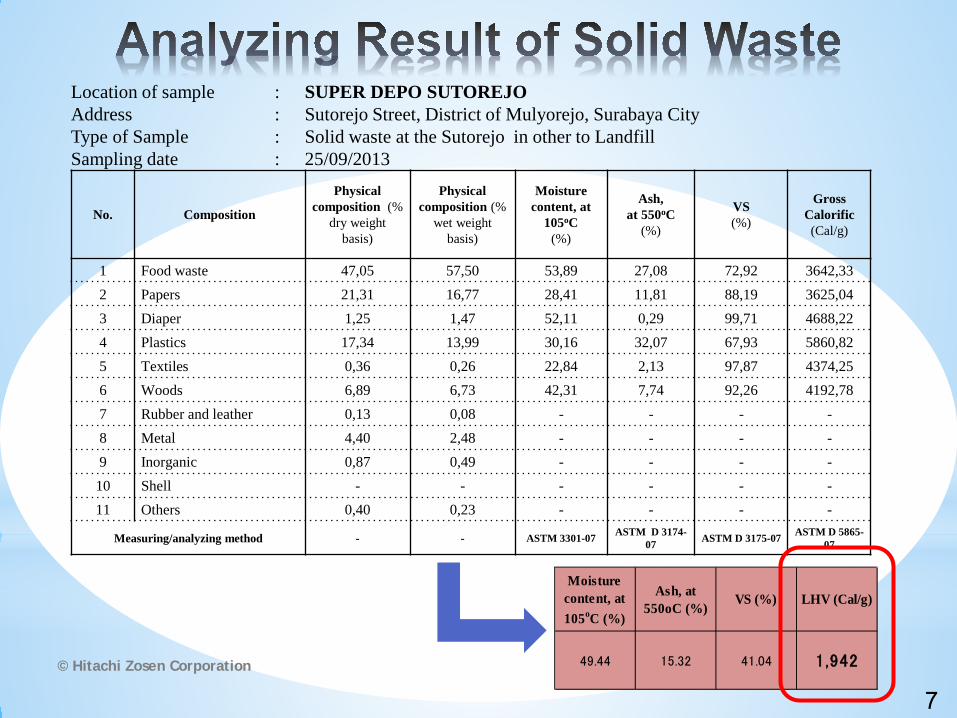
No. Composition
Physical composition (%
dry weight basis)
Physical composition (%
wet weight basis)
Moisture content, at
105oC (%)
Ash, at 550oC
(%)
VS (%)
Gross Calorific (Cal/g)
1 Food waste 47,05 57,50 53,89 27,08 72,92 3642,33 2 Papers 21,31 16,77 28,41 11,81 88,19 3625,04 3 Diaper 1,25 1,47 52,11 0,29 99,71 4688,22 4 Plastics 17,34 13,99 30,16 32,07 67,93 5860,82 5 Textiles 0,36 0,26 22,84 2,13 97,87 4374,25 6 Woods 6,89 6,73 42,31 7,74 92,26 4192,78 7 Rubber and leather 0,13 0,08 - - - - 8 Metal 4,40 2,48 - - - - 9 Inorganic 0,87 0,49 - - - -
10 Shell - - - - - - 11 Others 0,40 0,23 - - - -
Measuring/analyzing method - - ASTM 3301-07 ASTM D 3174-07 ASTM D 3175-07 ASTM D 5865-
07
Location of sample Address Type of Sample Sampling date
: : : :
SUPER DEPO SUTOREJO Sutorejo Street, District of Mulyorejo, Surabaya City Solid waste at the Sutorejo in other to Landfill 25/09/2013
49.44 15.32 41.04 1,942
Moisturecontent, at105oC (%)
Ash, at550oC (%)
VS (%) LHV (Cal/g)
7

© Hitachi Zosen Corporation
8
Waste Treatment Capacity 500 ton/day x 1 line
Waste Calorific Value (LHV) 1,942 kcal/kg (Above mentioned)
Boiler Steam Condition 4 MPa x 400゚C
Main Flow of WtE-Plant See next page

© Hitachi Zosen Corporation 9

© Hitachi Zosen Corporation
10
Power Generation Capacity (Steam Turbine) 9,330 kW
WtE-Plant Internal Electricity Consumption 2,580 kW
Electricity for External supply 6,750 kW 54,000 MWh/year (=8,000h)
Result of CO2-Reduction 30,240 ton-CO2/year (CO2-Emmission Coefficient = 0.560t-CO2/MWh)

© Hitachi Zosen Corporation
施設規模ごとの発電量(Hu=8,800kJ/kg時の試算例)
0
5000
10000
15000
20000
25000
100 200 300 400 500 600 700 800 900 1000
施設規模(t/日)
発電
量(k
W)
Relationship between Capacity of facility and Electricity generated
(Calorific value of waste ; 2,132 Cal/g)
Capacity of facility (t/day)
Ele
ctric
ity (k
W)
11

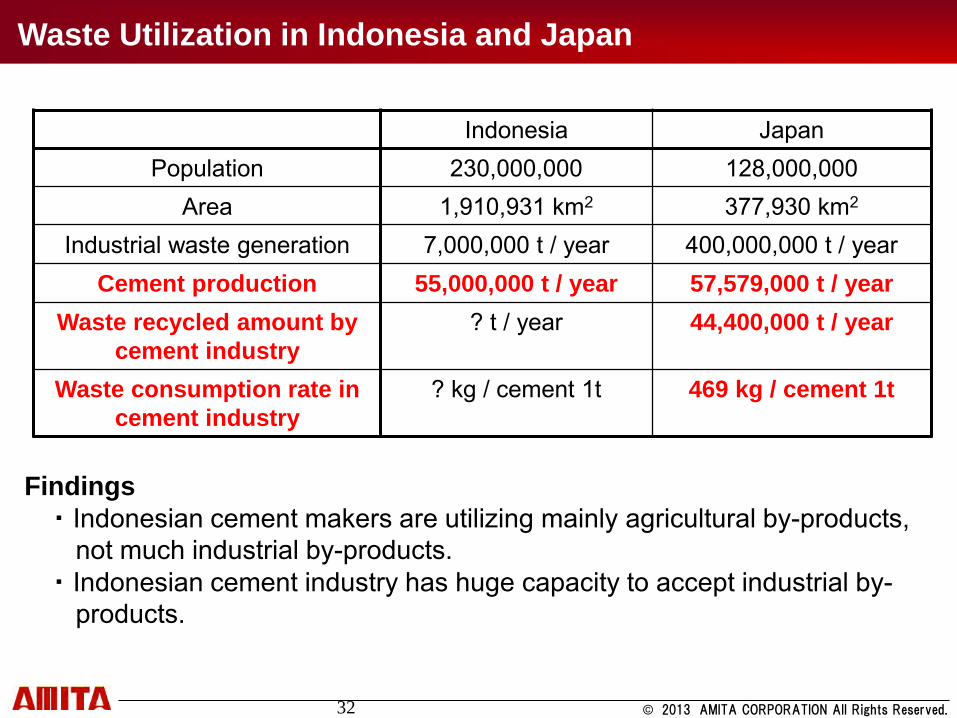
Progress of Solid Waste sector (Waste to energy for industrial waste)
© 2013 AMITA CORPORATION All Rights Reserved. 32
Indonesia Japan Population 230,000,000 128,000,000
Area 1,910,931 km2 377,930 km2
Industrial waste generation 7,000,000 t / year 400,000,000 t / year Cement production 55,000,000 t / year 57,579,000 t / year
Waste recycled amount by cement industry
? t / year 44,400,000 t / year
Waste consumption rate in cement industry
? kg / cement 1t 469 kg / cement 1t
Waste Utilization in Indonesia and Japan
Findings ・ Indonesian cement makers are utilizing mainly agricultural by-products, not much industrial by-products. ・ Indonesian cement industry has huge capacity to accept industrial by- products.
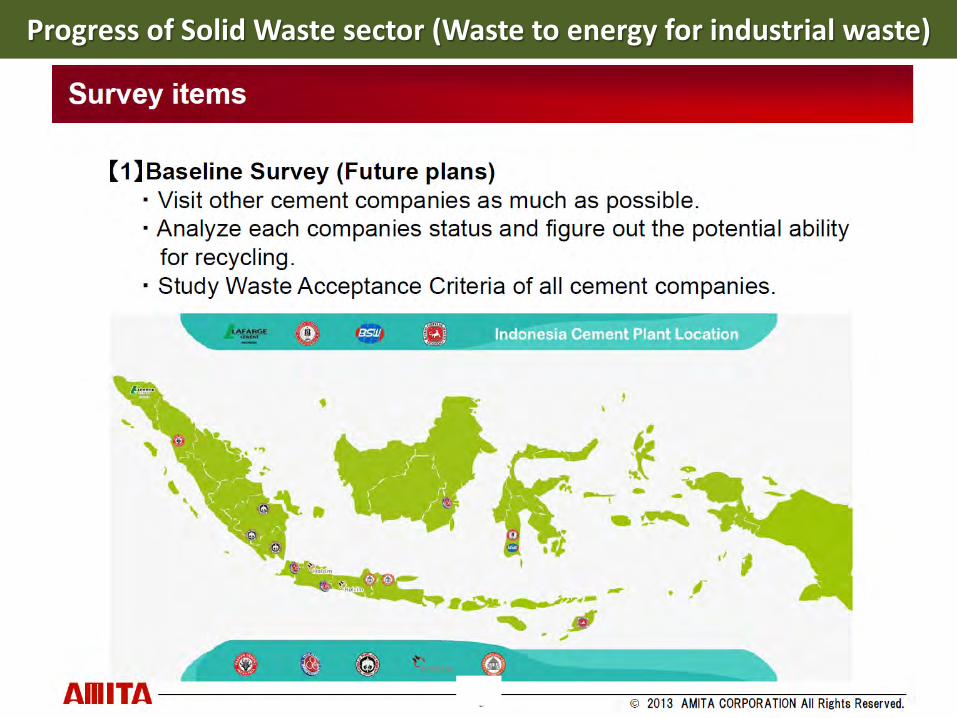
Progress of Solid Waste sector (Waste to energy for industrial waste)
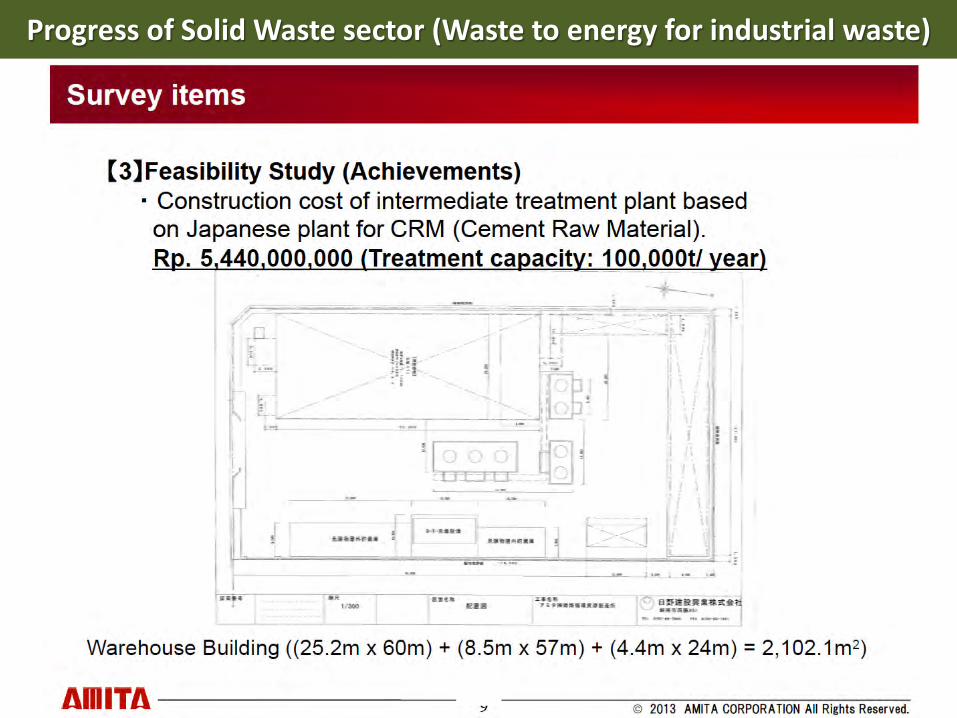
Progress of Solid Waste sector (Waste to energy for industrial waste)

Progress of Solid Waste sector (Waste to energy for industrial waste)
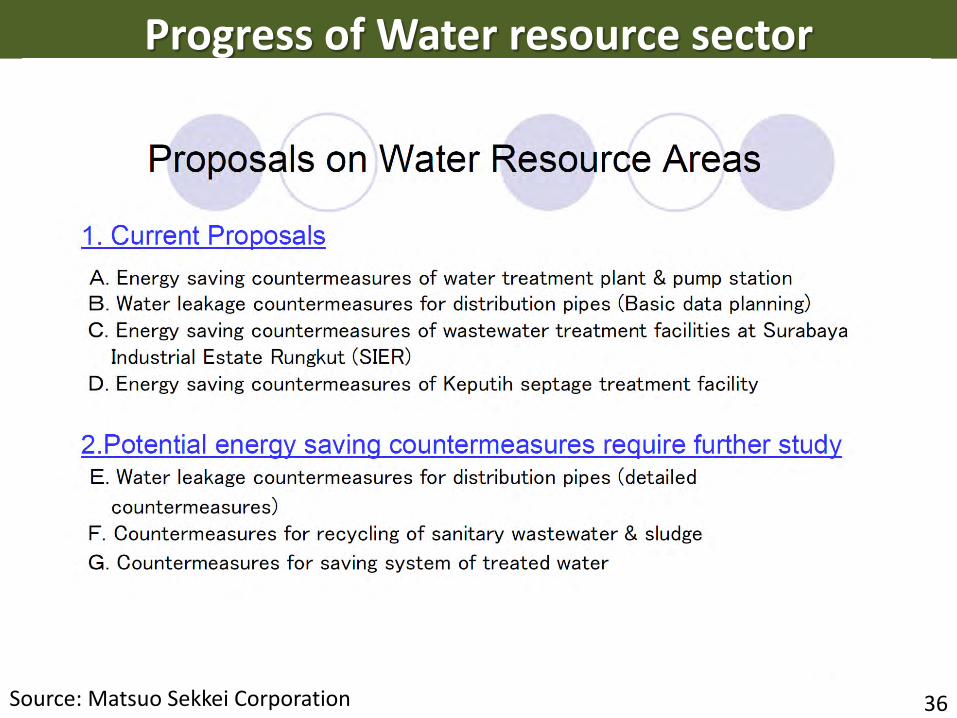
Progress of Water resource sector
36 Source: Matsuo Sekkei Corporation

37
1.Current Proposals A. Energy Saving Countermeasures of Water Treatment Plant & Pump Station A-1.Water Treatment Plants
Source: Matsuo Sekkei Corporation

38
A-2.Booster Pump Stations
Source: Matsuo Sekkei Corporation

39
Major Investigation Result A-1. Water Treatment Plants The degree of soundness of these plants are managed by regular
maintenance. There is no energy loss by facility aging. Therefore, CO2 reduction effects by facility renewal is not feasible. Expecting future demand increase, the expansion plan of water treatment plant is under contemplation.
A-2. Pump Facilities Pump facilities are also managed by regular maintenance,
however, water transmission pump facilities in Ngagel Ⅰwater treatment plant system are aging. Therefore, they are unable to supply pump rated supply amount. Currently, the communication pipe (looped tube) from Karang Pilang water treatment facilities offset the shortage. Also, the capacity of transmission & distribution pipe in NgagelⅠwater treatment plant system is from 3 times to 4 times larger than water processing ability. It is possible to lower energy loss by adjusting capacity & number of unit in pump facilities when they are renewed.
Source: Matsuo Sekkei Corporation

40
B.Water Leakage Countermeasures for Distribution Pipes (Basic Data Planning)
Source: Matsuo Sekkei Corporation

41
Major Investigation Result (B-1) Water Transmission Block The whole city is sectionalized large 5 blocks, then the 5 blocks are divided
middle-sized 149 blocks. Finally, the middle-sized blocks are formed a few small blocks and this plan is under way. Flow meters & pressure gauges are installed & controlled flow rate & pressure in each large, middle & small blocks and these block meters are maintained regularly by replacing parts & meters and repairing pipeline as soon as their malfunctioning such as meter failure is found. The flow rate & pressure maintenances in large, middle & small blocks are systematically performed and the feasibility of energy loss reduction by replacement of block meters which is one of our proposals is low.
(B-2) Pipeline Rehabilitation Pipeline Facilities are well maintained by Water Supply Corporation
Surabaya. Small blocks are formed, detect the location of water leakage and conduct & plan preventive countermeasures for aging pipeline. According to the annual plan, pipeline rehabilitation is planning to perform. Steel pipe is used for middle-large diameter transmission & distribution pipes. Therefore, water leak between joint is little. As a result, the feasibility of energy loss reduction by pipe renewal which is one of our proposals is low.
Source: Matsuo Sekkei Corporation

42
C. Energy Saving Countermeasures of Wastewater Treatment Plant in Surabaya Industrial Estate Rungkut
Source: Matsuo Sekkei Corporation

43
Key Investigation Results □ Aerator Renewal Aerators consume 80% of whole electricity.
Source: Matsuo Sekkei Corporation

44
□ Aerator Renewal
Aerator Types
Model Horizontal shaft Vertical shaft Screw type Axial f low pump Propeller type
Diagram
Functio
n
The surface aeraionsystem which aerates bymixing water surface withthe horizontal brush roter.
The surface aerationsystem by placing its drivesection on the watersurface of ditch and ittransmit information toimpeller. Then sumergedimpeller performs aeration.
The Under-wateraeration systemIt supplys air under thewater as microscopicbubbles utilizing negativepressure created by screwrotation.
It is the combined systemwith axial flow impellermixing & diffusing pipe inlet.The air mixed water ispumped from the bottom ofdownsteam tank.
The propeller under waterperforms chum & mixingand diffusing plate supplysoxgen.
Oxge
nS
upply
Effic
iency
Relatively poor Good Good Excellent Excellent
Pric
e Excellent Good Good Bad Bad
Current aerator Recommending aerator
Source: Matsuo Sekkei Corporation
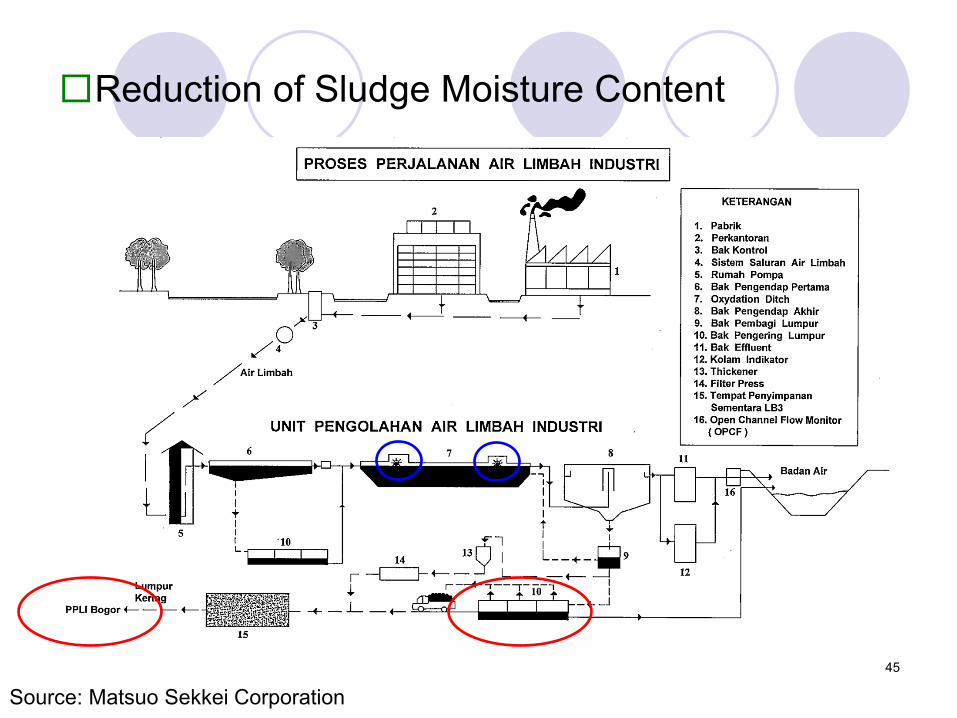
45
□Reduction of Sludge Moisture Content
Source: Matsuo Sekkei Corporation
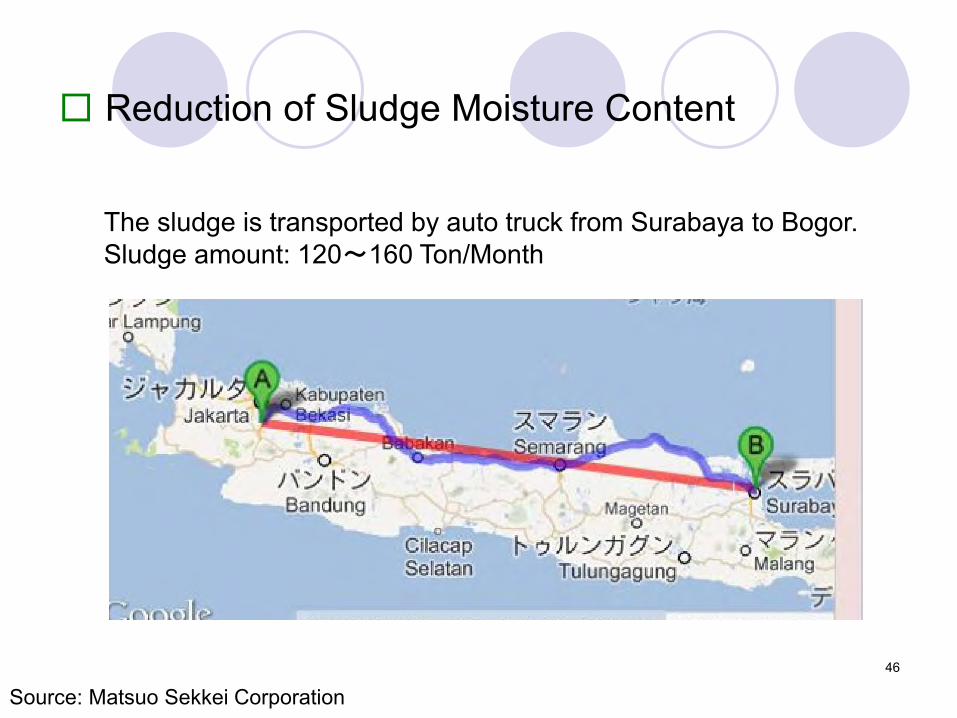
46
□ Reduction of Sludge Moisture Content
The sludge is transported by auto truck from Surabaya to Bogor. Sludge amount: 120~160 Ton/Month
Source: Matsuo Sekkei Corporation
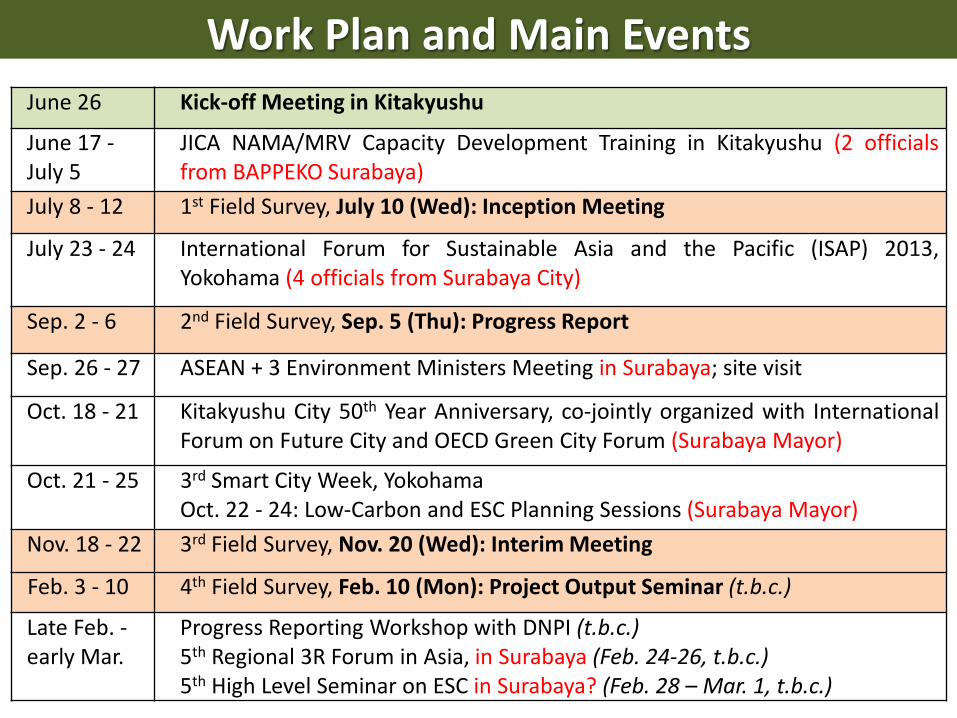
June 26 Kick-off Meeting in Kitakyushu
June 17 - July 5
JICA NAMA/MRV Capacity Development Training in Kitakyushu (2 officials from BAPPEKO Surabaya)
July 8 - 12 1st Field Survey, July 10 (Wed): Inception Meeting
July 23 - 24 International Forum for Sustainable Asia and the Pacific (ISAP) 2013, Yokohama (4 officials from Surabaya City)
Sep. 2 - 6 2nd Field Survey, Sep. 5 (Thu): Progress Report
Sep. 26 - 27 ASEAN + 3 Environment Ministers Meeting in Surabaya; site visit
Oct. 18 - 21 Kitakyushu City 50th Year Anniversary, co-jointly organized with International Forum on Future City and OECD Green City Forum (Surabaya Mayor)
Oct. 21 - 25 3rd Smart City Week, Yokohama Oct. 22 - 24: Low-Carbon and ESC Planning Sessions (Surabaya Mayor)
Nov. 18 - 22 3rd Field Survey, Nov. 20 (Wed): Interim Meeting
Feb. 3 - 10 4th Field Survey, Feb. 10 (Mon): Project Output Seminar (t.b.c.)
Late Feb. - early Mar.
Progress Reporting Workshop with DNPI (t.b.c.) 5th Regional 3R Forum in Asia, in Surabaya (Feb. 24-26, t.b.c.) 5th High Level Seminar on ESC in Surabaya? (Feb. 28 – Mar. 1, t.b.c.)
Work Plan and Main Events

Project Implementation Plan (Energy and Transportation)
Sector FY2014 FY2015 FY2016 Expected CO2 reduction
Energy
Energy saving in buildings
(1) Shopping mall:
Replacement of a chiller plant
(1) Office building: Replacement of a chiller plant and installation of BEMS and LED
(1) Hotel: Replacement of laundry machines and installation of BEMS
(2) Public buildings Installation of energy saving and green building technologies
Shopping malls:
Replacement of a chiller plant
Office buildings: Replacement of a chiller plant
Hotels: Installation of co-generation systems
10,000 t-CO2/year
co-generation system
In-depth study Design co-generation
system targeting PIER (an industrial estate)
In-depth study Detailed design of
co-generation system
Project implementation Construction of co-
generation-system and its operation
38,000 t-CO2/year
Transportation
Project implementation Replacement 200
taxis to CNG vehicles Replacement 50
buses to CNG vehicles
1 CNG station Replacement 300
taxis to CNG vehicles Replacement 50
buses to CNG vehicles
Replacement 300 angkots to CNG vehicles
3 CNG stations Replacement 300
taxis to CNG vehicles
Replacement 100 buses to CNG vehicles
Replacement 600 angkots to CNG vehicles
5,000 t-
CO2/year

Project Implementation Plan (Solid waste and Water) Sector FY2014 FY2015 FY2016 Expected CO2
reduction Solid waste
Waste sorting, recycling, composting
In-depth study Design an intermediate
treatment facility (100t/day) (currently in operation of a facility (15t/day))
Operation of a composting plant (10t/day) JICA project
Project implementation Construct an
intermediate treatment facility (100t/day) and its operation
F/S study for its business expansion
Expansion of the business by setting up a foreign subsidiary company (SPC)
14,500 t-CO2/year
Incineration for MSW
In-depth study Design an
incineration facility (1,000t/day)
In-depth study Detailed design and
stakeholder consultations
Project implementation Construction of an
incineration facility
30,000 t-
CO2/year
Waste to energy for industrial waste
In-depth study Liquid fuel
production (Input: B3 waste)
RDF production
Project implementation Liquid fuel
production (1,000t/month)
RDF production (3,000t/month)
Continuation of the business operation
Set up a foreign subsidiary company (SPC)
34,000 t-CO2/year 12,000t/year (for liquid fuel) 22,000t/year (for RDF)
Water resource
Feasibility study Study on water delivery
and distribution pumps in Ngagel
Study on flow-meters to measure water leakage
Selection of demonstration blocks for replacement of water distributing pipes
In-depth study Detailed design for
replacement of water delivery and distribution pumps in Ngagel
Installation of 31 magnetic flow-meters
Replacement of water distributing pipes
Project implementation Replacement of water
delivery and distribution pumps in Ngagel (34/38 pumps)
Replacement of block meters
Replacement of water distributing pipe (10km demonstration)
3,200t-
CO2/year