Embed Size (px)
Citation preview

Mahaweli Hydro Power Complex
Ceylon Electricity Board
Annual Report 2013
CE (Mahaweli Complex)
April 2014

Contact Details
Address: Mahaweli Complex Office,
Ceylon Electricity board,
PO Box 42,
Ampitiya road,
Kandy
Telephone: 081- 2244568/ 081-4950897 / 081-4950894
Fax : 081-2232802
E-mail : [email protected]
Website : http://www.mahawelicomplex.lk

Contents
• Mahaweli Complex Power stations and reservoirs • Mahaweli Complex Contribution to Generation • Contribution by Stations in Mahaweli Complex • Cumulative Energy Generated During 2013 (GWh) by Mahaweli Complex • Monthly Generation in each station
o Victoria o Kotmale o Upper Kotmale o Randenigala o Rantambe o Ukuwela o Bowatenna o Nillambe
• Availability of Plants 2012 • Planned and Forced Outage Hours • Run Hours • Plant Factors of Generating Units • Number of tripping in 2013 • Yearly Generation of Mahaweli Complex Since 1998 to 2013 • Energy Generated by Individual Stations since 1998 to 2013
o Victoria o Kotmale o Upper Kotmale o Randenigala o Rantambe o Ukuwela o Bowatenna o Nillambe
• No of Employees Vs Units Generated by each Station in Mahaweli Complex for 2013 • Total Expenditure Distribution • Overtime Analysis of Different Grades in Mahaweli Complex and Power Stations • Generation Unit Cost Variation in 2013 • Unit cost variation station wise • Water Consumption • Reservoir Levels • Major jobs carried out during the Year 2013

Mahaweli Hydro power complex consists of seven major power stations which has an installed capacity of 810 MWs. Last year in 2013 Mahaweli Complex has contributed by generating 3507.56 GWhr (i.e. 29.30%) to the total energy generation. The major power stations coming under Mahaweli complex are, Upper Kotmale, Kotmale, Victoria, Randenigala, Rantambe, Ukuwela, Bowatenna and Nilambe covering 1268 sqkm of Mahaweli basin, each station has the following capacities.
Mahaweli Complex Power Stations and reservoirs
• Kothmale (67 x 3 MW) • Victoria (70 x 3 MW ) • Randenigala ( 61 x 2 MW • Rantambe ( 24.5 x 2 MW • Ukuwela ( 20 x 2 MW)
• Bowatenna ( 40 x 1 MW • Nilambe ( 1.66 x 2 MW) • Upper Kotmale (75 x 2MW)

Mahaweli Complex hydro power system consists of Thalawakele, Kothmale, Victoria, Polgolla, Randenigala and Rantambe reservoirs.
Mahaweli Complex Contribution to Generation

Contribution by Stations in Mahaweli Complex

Cumulative Energy Generated During 2013 (GWh) by Mahaweli Complex
Monthly Generation in each station


Unit
Availability of Plants 2012
Running hours Outage hours
Availability % Plant Factor Maintenance Breakdown
Vic 1 7505.40 110.80 12.63 98.59 68.93 Vic 2 7062.00 102.77 27.64 98.51 67.25 Vic 3 6108.10 761.98 1.46 91.28 57.19 Kot 1 6914.40 120.24 33.81 98.24 48.16 Kot 2 3031.43 1834.43 195.13 76.83 22.85 Kot 3 4148.46 809.02 41.72 90.29 29.76
Ukot 1 4819.39 1363.36 400.52 79.86 43.36 UKot 2 4598.55 1106.05 677.56 79.64 43.02 Rand 1 5871.81 112.94 50.21 98.14 60.04 Rand 2 5841.70 124.92 2.50 98.55 60.14 Rant 1 5955.69 156.46 1.76 98.19 59.22 Rant 2 6777.66 106.95 6.35 98.71 67.42 Uku 1 4239.70 273.51 99.82 95.74 45.94 Uku 2 3615.00 687.67 170.88 90.20 38.58 Bow 1 3474.40 1337.27 48.54 84.18 17.66 Nill 1 5494.02 87.70 46.55 98.47 62.72 Nill 2 4934.65 90.83 66.01 98.21 56.35
TOTAL 90392.36 9186.90 1883.10

Planned and Forced Outage Hours
Run Hours
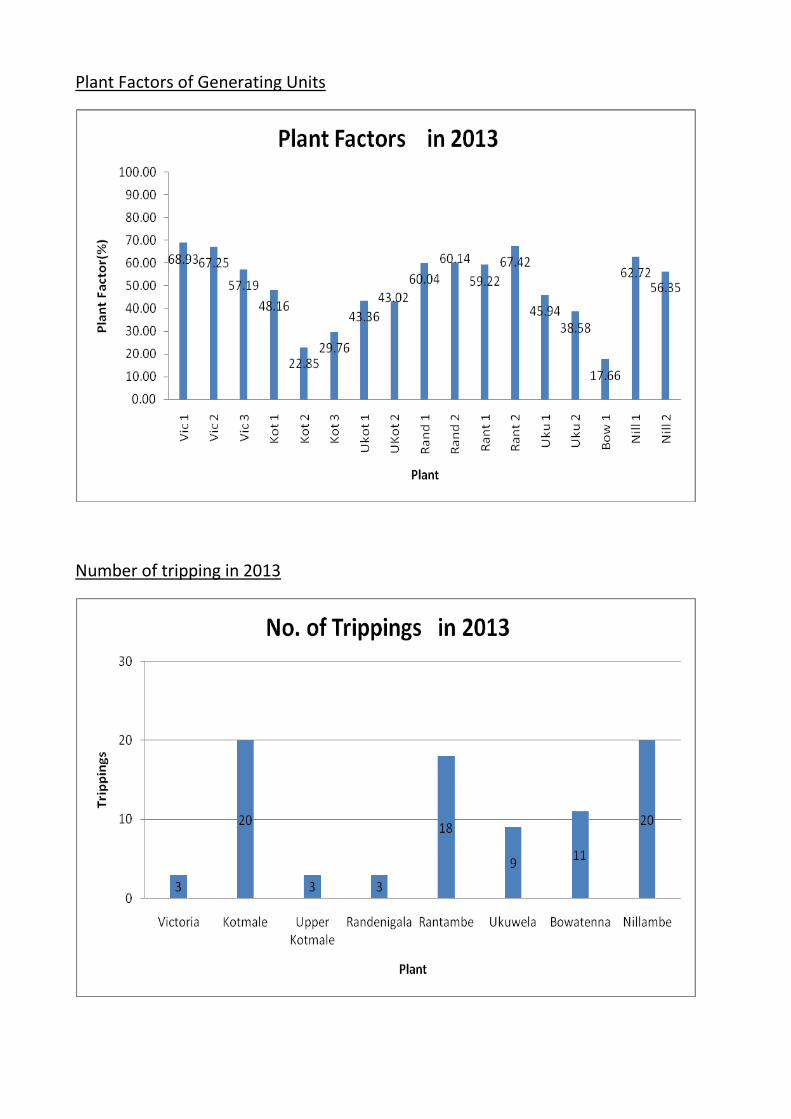
Plant Factors of Generating Units
Number of tripping in 2013
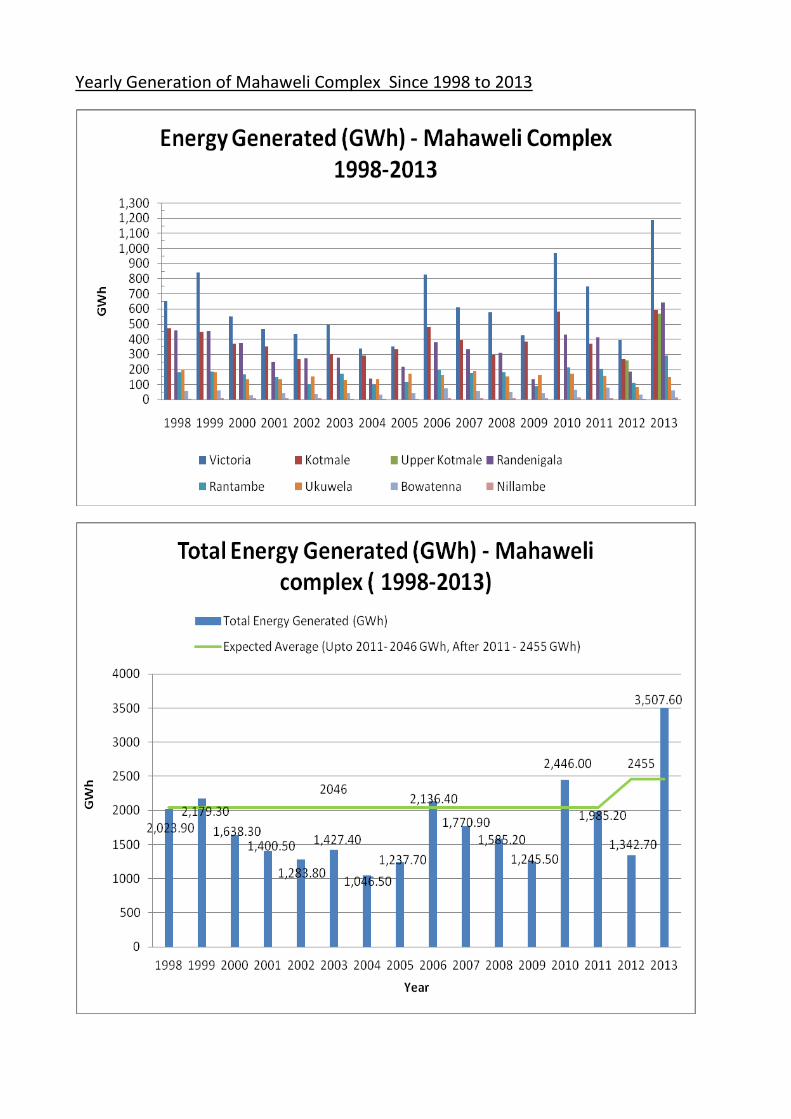
Yearly Generation of Mahaweli Complex Since 1998 to 2013

Year
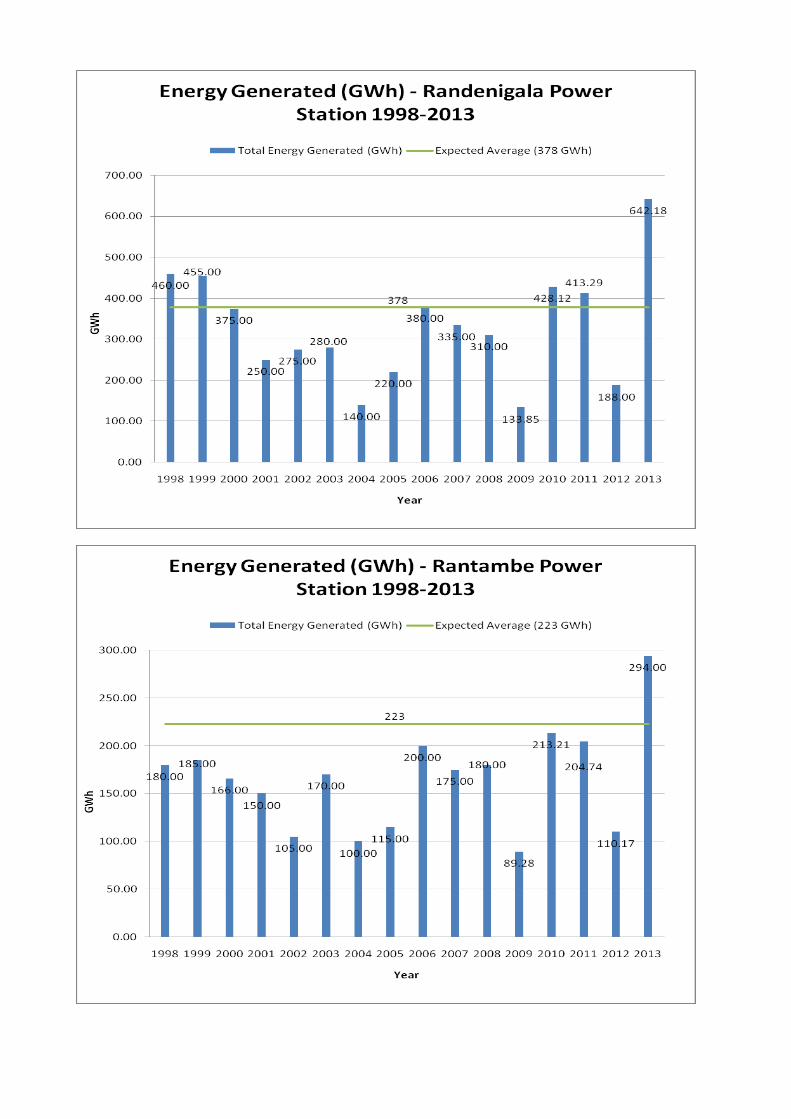
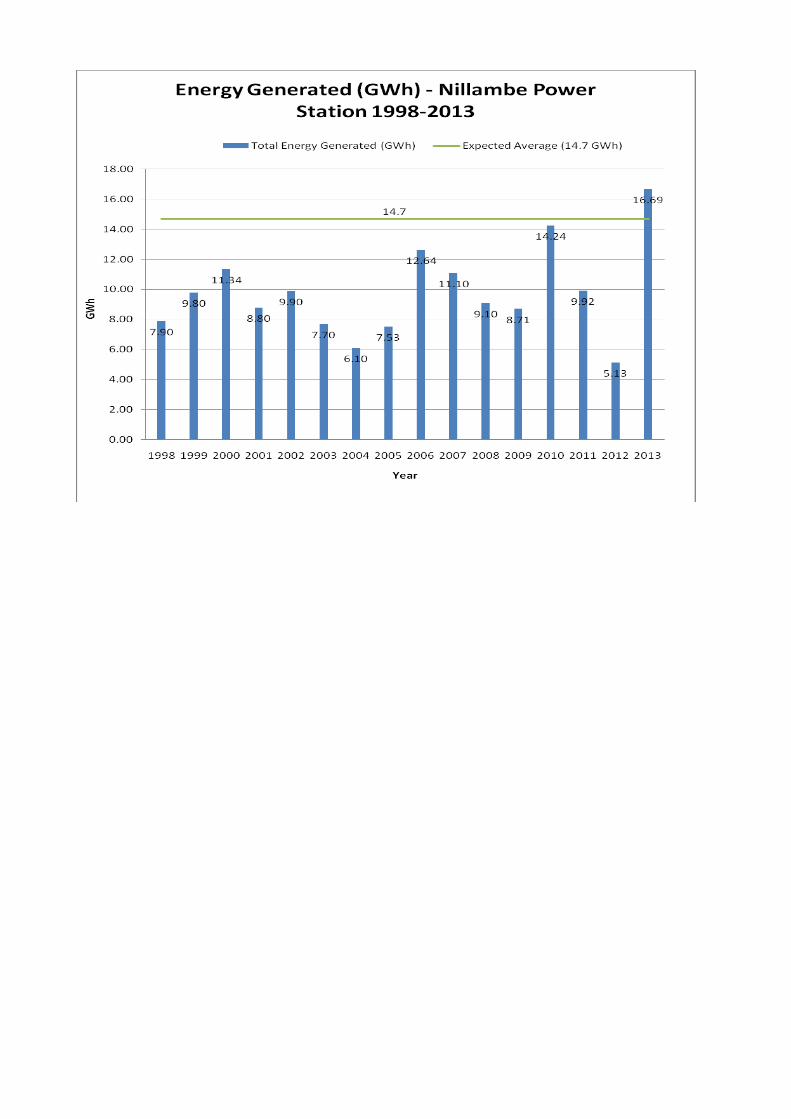
Energy Generated by Individual Stations since 1998 to 2013
Energy Generated (GWh)
Victoria Kotmale Upper
Randenigala Rantambe Ukuwela Bowatenna Nillambe Total Kotmale
1998 650.00 470.00 460.00 180.00 200.00 55.97 7.90 2023.9 1999 840.00 450.00 455.00 185.00 180.00 59.54 9.80 2179.3 2000 550.00 370.00 375.00 166.00 135.00 31.00 11.34 1638.3 2001 466.00 350.00 250.00 150.00 135.00 40.70 8.80 1400.5 2002 435.00 267.00 275.00 105.00 155.00 36.88 9.90 1283.8 2003 495.00 300.00 280.00 170.00 130.00 44.68 7.70 1427.4 2004 340.00 290.00 140.00 100.00 135.00 35.42 6.10 1046.5 2005 350.00 333.00 220.00 115.00 170.00 42.21 7.53 1237.7 2006 825.00 480.00 380.00 200.00 165.00 73.75 12.64 2136.4 2007 610.00 395.00 335.00 175.00 190.00 54.79 11.10 1770.9 2008 580.00 298.00 310.00 180.00 155.00 53.07 9.10 1585.2 2009 428.00 383.00 133.85 89.28 161.47 41.20 8.71 1245.5 2010 971.00 582.61 428.12 213.21 171.00 65.81 14.24 2446 2011 747.04 372.73 413.29 204.74 158.36 79.14 9.92 1985.2 2012 392.75 269.95 259.95 188.00 110.17 85.02 31.76 5.13 1342.7
2013 1185.78 591.43 567.53 642.18 294.00 148.08 61.87 16.69 3507.6


Station
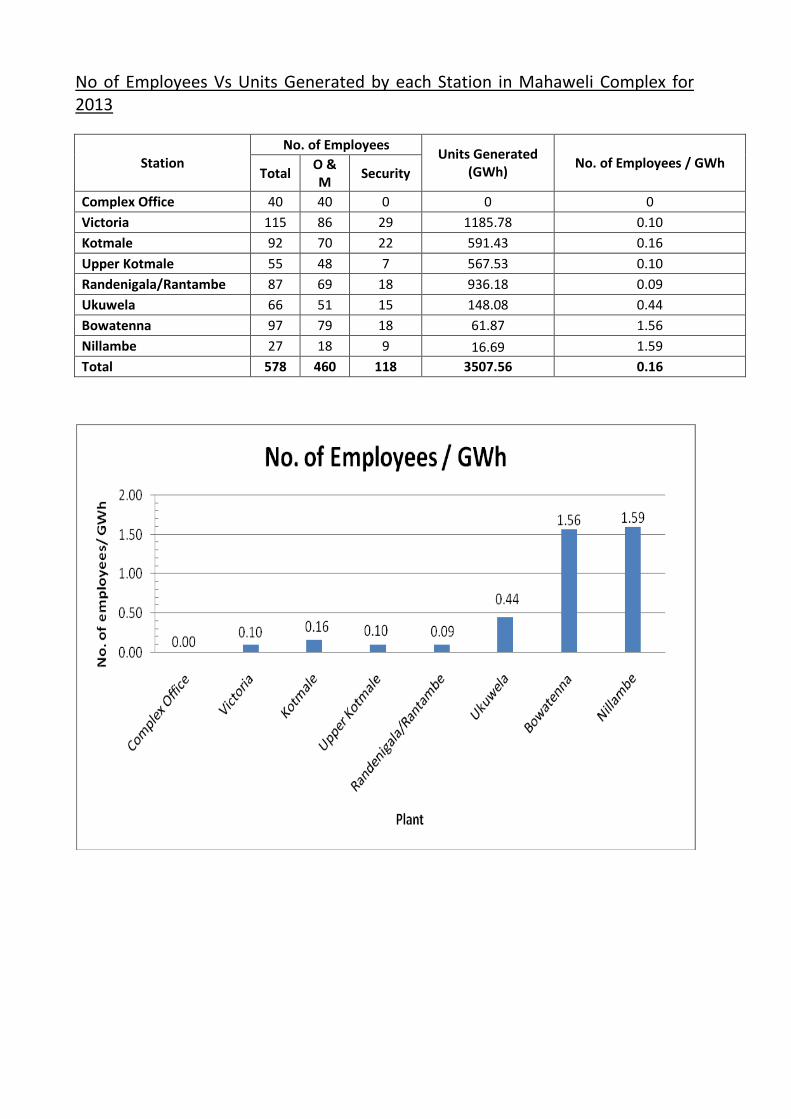
No of Employees Vs Units Generated by each Station in Mahaweli Complex for 2013
No. of Employees Units Generated (GWh) No. of Employees / GWh
Total O & M Security
Complex Office 40 40 0 0 0 Victoria 115 86 29 1185.78 0.10 Kotmale 92 70 22 591.43 0.16 Upper Kotmale 55 48 7 567.53 0.10 Randenigala/Rantambe 87 69 18 936.18 0.09 Ukuwela 66 51 15 148.08 0.44 Bowatenna 97 79 18 61.87 1.56 Nillambe 27 18 9 16.69 1.59 Total 578 460 118 3507.56 0.16

Total Expenditure Distribution
Total Expenditure with Depreciation in 2013
Description Actual (Rs) Budget (Rs) Varience (Rs) %
Personnel 659,631,895.74 734,696,860.00 75,064,964.26 10.22
Material 179,324,547.12 544,042,064.00 364,717,516.88 67.04
Accomodation 65,379,617.27 104,655,000.00 39,275,382.73 37.53
Transport and communication 68,111,543.54 96,402,500.00 28,290,956.46 29.35
Depreciation 2,409,799,196.85 4,453,200,000.00 2,043,400,803.15 45.89
Other 39,704,230.45 64,353,000.00 24,648,769.55 38.30
Finance 952.50 322,000.00 321,047.50 99.70
Total Expenditure 3,421,951,983.47 5,997,671,424.00 2,575,719,440.53 42.95

Total Expenditure without Depreciation in 2013
Description Actual (Rs) Budget (Rs) Varience (Rs) %
Personnel 659,631,895.74 734,696,860.00 75,064,964.26 10.22
Material 179,324,547.12 544,042,064.00 364,717,516.88 67.04
Accomodation 65,379,617.27 104,655,000.00 39,275,382.73 37.53
Transport and communication 68,111,543.54 96,402,500.00 28,290,956.46 29.35
Other 39,704,230.45 64,353,000.00 24,648,769.55 38.30
Finance 952.50 322,000.00 321,047.50 99.70
Total Expenditure 1,012,152,786.62 1,544,471,424.00 532,318,637.38 34.47

Station
Overtime Analysis of Different Grades in Mahaweli Complex and Power Stations
Supn Staff Clerical & Allied Grades Minor Grades & Driver
No Total Average No Total Average No Total Average
MC Office - 830 0 0 0 24 2,822,535 117,199 5 1,185,579 225,825
Victoria - 831 9 2,149,306 243,318 29 8,188,059 280,733 46 5,333,926 116,377
Kotmale - 832 10 2,765,313 283,622 38 8,273,591 218,685 58 12,795,562 222,209
Ukuwela - 833 4 1,023,185 255,796 25 4,728,344 189,134 52 6,007,555 115,715
Bowatenna - 834 9 1,805,194 198,737 22 4,269,465 197,052 33 5,023,856 152,623
Randenigala - 835 11 3,834,035 335,828 25 4,437,734 180,518 52 8,926,547 173,331
Nillambe - 837 1 253,954 338,605 9 1,845,794 205,088 17 2,788,961 165,681
Upper Kotmale - 838 10 2,450,604 249,214 9 3,769,376 439,151 33 7,514,808 226,009
Total 54 14,281,591 266,117 180 38,334,897 213,070 295 49,576,794 168,009

Generation Unit Cost Variation in 2013
Month Unit Generated (KWh) Unit Generated (GWh) Total Expenditure (Rs) Unit Cost (Rs/KWh) January 396,045,340 396.05 274,475,417.95 0.69
February 250,300,880 250.30 282,115,688.61 1.13 March 198,117,360 198.12 284,416,328.87 1.44 April 174,445,740 174.45 301,871,297.00 1.73 May 202,458,210 202.46 341,295,045.41 1.69 June 301,201,570 301.20 292,787,745.48 0.97 July 415,903,220 415.90 294,173,308.79 0.71
August 409,691,710 409.69 134,744,618.59 0.33 September 384,999,490 385.00 310,240,220.82 0.81
October 341,049,840 341.05 276,460,755.72 0.81 November 254,855,290 254.86 274,503,604.21 1.08

December 178,487,700 178.49 354,867,952.02 1.99 Total 3,507,556,350 3507.56 3,421,951,983.47 0.98
Unit cost for 2013 (with depreciation): 0.98 Rs/kWh
Unit cost variation station wise
Station Unit Cost Rs/KWh
Victoria 0.66
Kotmale 1.54
Upper Kotmale 0.14
Randenigala / Rantambe 1.10
Ukuwela 1.50
Bowatenna 4.14
Nillambe 3.81

Water Consumption
Station Power Generation Water Consumption Power Generation Water Consumption
(MWh) (MCM) (GWh) (MCM/GWh)
Victoria 1185784.00 2901.87 1185.78 2.45
Kotmale 591430.00 1107.13 591.43 1.87
Upper Kotmale 567527.00 467.96 567.53 0.82
Randenigala 642182.00 3433.20 642.18 5.35
Rantambe 293995.99 3703.85 294.00 12.60
Ukuwela 148075.00 804.26 148.08 5.43
Bowatenna 61874.00 504.61 61.87 8.16
Nillambe 16688.36 67.49 16.69 4.04

Total 3507556.35 12924.65 3507.56 3.68
Station
Reservoir Levels
Average Reservoir Level of Month (MSL m)
Jan Feb Mar Apr May Jun Jul Aug Sep Oct Nov Dec
Victoria 437.36 434.43 430.88 426.47 424.37 431.69 437.83 436.27 435.54 433.15 428.31 426.09
Kotmale 698.58 698.25 696.65 695.87 696.83 699.73 702.36 698.94 696.46 696.81 696.02 694.35
Upper Kotmale 1190.99 1191.02 1191.91 1191.80 1190.83 1192.46 1193.07 1191.54 1190.57 1190.23 1190.59 1191.00
Randenigala 230.47 229.85 227.41 226.06 226.02 229.03 231.46 230.05 228.13 227.21 226.49 225.60
Rantambe 150.28 150.69 150.02 149.98 149.15 149.74 149.81 150.19 150.31 150.20 150.05 150.05
Ukuwela 440.63 440.87 440.85 440.48 440.66 440.68 440.89 441.03 440.78 440.61 440.72 440.50
Bowatenna 247.88 247.20 247.08 247.52 248.10 248.50 248.45 248.36 248.19 248.05 248.20 248.38
Nillambe 595.33 594.90 594.84 595.06 595.46 595.60 595.78 595.11 595.17 595.52 595.54 595.24

Kotmale Power Station
Major jobs carried out during the Year 2013
1 Stator Winding Repair of U02

2 Generator Inspection of U03

3 Replacement of Pressure Relief Valve Switch U03 Gen. T/Fs
4 Replacement of Dashpot and Limit Switches of 220 kV Circuit Breakers

5 11 kV HAD Breakers Overhaul

6 Installation of PLC based Temperature Monitoring Systems
7 Alms Giving to Cancer Hospital – Kandy

8 Annual Get Together – December 2013

9 “Sahana Malu” Donation Campaign
10 Annual Cricket Match

11 Celebration of Vesak and Poson festivals
12 Year End Concert in Montessori


![MAHAWELI GANGA IRRIGATION AND HYDRO …mahaweli.gov.lk/en/pdf/Library/Mahaweli Ganga Irrigation.pdf · MAHAWELI GANGA IRRIGATION AND ... The project appears feasible [possible] from](https://img.dokumen.tips/doc/110x75/5b90159409d3f20e308d65d6/mahaweli-ganga-irrigation-and-hydro-ganga-irrigationpdf-mahaweli-ganga-irrigation.jpg)