Embed Size (px)
Citation preview
.MAGNETOSPHERIC CONVECTION
AND THE HIGH LATITUDE P2 .IONOSPHERE
•By
•W. C. Knudsen
September 1973
Lockheed Palo Alto Research Laboratory3251 Hanover Street
Palo Alto, California 9^304
https://ntrs.nasa.gov/search.jsp?R=19740014845 2018-08-05T19:35:58+00:00Z
Magnetospheric Convectionand the High Latitude Fo Ionosphere
By
W. C. Knudsen
ABSTRACT
Behavior of the polar ionospheric F-layer as it is convected through
the cleft, over the polar cap and through the night side F-layer trough
zone is investigated. Passage through the cleft adds of the order of
2 x 10s ions cm"3 in the vicinity of the F2 peak and redistributes the
ionization above approximately kdO km altitude to conform with an in-
creased electron temperature. The redistribution of ionization above
kOO km altitude forms the "averaged" Plasma ring seen at 1000 km altitude.
The F-layer is also raised of the order of 20 km in altitude by the con-
vection electric field. The time required for passage across the polar
cap (25°) is about the same as that required for the F-layer peak concen-
tration to decay by e. The F-layer response to passage through the night
side soft electron precipitation zone should be similar to but less than
its response to passage through the cleft. The exception is that the
layer will be lowered in altitude by the convection electric field.
After leaving the night soft electron precipitation zone, the layer
decays, primarily by chemical recombination, as it convects equatorward
and around the dawn side of the earth. In the absence of ionization
sources, decay by factors of the order of 102 to 103 could occur prior
to entry into the sunlit hemisphere, thus forming the F-layer night trough-
INTRODUCTION
In an early study of the winter Arctic ionosphere Sato (1959)
recognized in foFs contours the existence of a "tongue" of ionospheric
plasma at F2 peak heights extending from the dayside toward the night
side ionosphere and suggested that ionospheric plasma ivas being driven
across the polar caps by an electric field spread over the cap. In a
later study of the winter Antarctic ionosphere Sato and Rourke (196̂ -)
noted some similarity between the current systems implied by magnetic
variations and the foFs "tongue" distribution patterns and attempted to
establish that the electric field responsible for the drift arose in
the E-layer.
*••
The principal objection to the suggestion that the "tongue" was
formed by convection was that the convection velocity, then thought to
be of the order of 0.1 km/sec, was too slow. At 0.1 km/sec the F-layer
would decay in crossing the cap (cf Rishbeth, 1970).
More recently, electron concentration data obtained over the poles
by satellite measurement at approximately 1000 km altitude has estab-
lished the existence of a plasma ring or zone in which electron concen-
tration enhancements frequently occur. The ring is poleward of the
plasmapause, approximately coincident with the auroral oval, and pre-
sumably produced by precipitation of a component of the particles
responsible for the auroral oval defined by all sky camera re-
sults (Thomas and Andrews, 1969; Sato and Colin, 1969; Pike,
19?la, b). Thomas and Andrevs (1969) have suggested that the
tongue of ionization observed by Sato (1959) a*id Sato and Rourke
(196̂ ) was basically the ring pattern made difficult to discern
by scarcity of high latitude stations and perhaps by the solar
cycle epoch difference.
The evidence for rapid antisunward convection of plasma across
the geomagnetic poles at F2 heights in response to the dawn to dusk •-
magnetospheric electric field is now sufficiently conclusive that its ••
existence is inescapable. The purpose of this study is to examine some
of the implications of this convection for the high latitude ionospheric
concentration and to attempt to reconcile some observations with the
existence of both a strong antisunward convection and a ring of precipi-
tating energetic particles.
A polar ionospheric convection pattern will first be suggested
followed by semi-quantitative analysis of the expected changes in the
F-layer ionosphere as it is convected from the dayside of the earth
across the cleft, polar cap, night side auroral zone, into the F-iayer
nightside trough and back to the day side. The expected behavior of the
F-layer will then be compared with the observed behavior. Attention
will be focussed on the F-layer behavior above about 200 km and below
the altitude at which G"5" ceases to be the predominant ion. In the polar
region this latter boundary is generally well above 1000 km.
Fa Region Magnetospheric Convection
The dawn to dusk inagnetospheric electric field when mapped down
field lines to the polar regions by assuming the lines to be equipoten-
tials produces convection of the F-layer ionospheric plasma shown sche-
matically in Figure 1 (Axford, 1969; Maynard, 1972; Frank and Ackerson,
1972; Kavanagh et al., 1968). Above approximately 200 km altitude, the
plasma may be considered attached to the magnetic field lines and these
have a magnetospheric circulation pattern which maps at ionospheric alti-
tudes into the two unequal convection cells illustrated when viewed from
a non rotating magnetospheric coordinate system. Field .lines originating
at the cleft latitude (~ 7 6 ° A ) on the dayside of the earth connect with
the solar wind magnetic field, convect over the magnetic poles to the
tail of the magnetosphere, reconnect in the tail and then convect sun-
ward as closed field lines within the magnetosphere until reaching the
dayside magnetopause, and then repeat the process.
The precise convection pattern is unknown and a current topic of
great interest. The pattern given in Figure 1 is presented as a necessary
part of a general description of the polar F-layer behavior. The pattern
may be in error in detail even as a "time average" pattern but it is
generally consistent with current data as the steady non-substorm con-
vection pattern.
The zone between the plasmapause and the equatorward boundary of
the soft electron precipitation zone is that in which closed field tubes
are convecting sunward after reconnection. The convection paths are
those derived for the equatorial plane by Kavanagh et al., (1968) but
which are mapped on a polar diagram. Time between dots, applicable only
to the region equatorward of the closed field line boundary, is 1 hr.f
The most equatorward flow line shown is essentially the boundary between
tubes which convect to the magnetopause and connect with the interplane-
tary magnetic field and those which do not. It is, therefore, the plasma-
pause except near the stagnation point (Mishida, 1966; Chappell, 1972).
Equatorward of the plasmapause the field tubes circulate around Figure 1
counter clockwise at essentially co-rotation velocity.except in the
vicinity of the stagnation point. On the dawn side of the earth just
poleward of the plasmapause the convection is only slightly faster than
co-rotation with the earth. On the dusk side, the field tubes are essen-
tially stationary near the stagnation point, and convect sunward poleward
of the stagnation point.
In the immediate vicinity of the limit of closed field lines, the con-
vection velocity is observed to be typically of the order of 1 km/sec
and in the direction shown (C-urnett and Frank, 1973; Maynard, 1972).
The paths taken by the field tubes after connection with the inter
planetary magnetic field is not known in detail either from theory or
measurement. In Figure 1 I have simply connected the flow lines of
closed field tubes across the cap with a suggestion of divergence
around the pole. The electric field measurements of Gurnett and
Frank (1973), Cauffman and Gurnett (1971), and Maynard (1972)
suggest that the flow may be typically faster near the boundary
of closed field lines (l km/sec) and slower interior to the boun-
dary (0.5 km/sec). On occasion the flow velocity is apparently
uniform across the entire cap and may rise to 3 km/sec.
The boundary of closed field lines as defined by trapping of > 4 5
KeV electrons is evidently the boundary for reversal of the convection
direction from sunward to antisunward and is also the equatorward boun-
dary of the soft electron precipitation zone (Gurnett and Frank, 1973)-
Pike (l971b) has established the general coincidence of the plasma ring,
polar F-layer irregularity zone, and zone of soft electron precipitation.
Hence, the boundary of closed field lines is also the equatorward bound-
ary of the plasma ring and polar F-layer irregularity zone.
The soft electron precipitation zone and character of the electron
precipitation therein is reviewed by Paullkas (197l)> Frank and Ackerson
(1972), and Eather and Mende (1972).
DYNAMIC NATURE: OF THE POLAR IONOSPHERE* ~ _
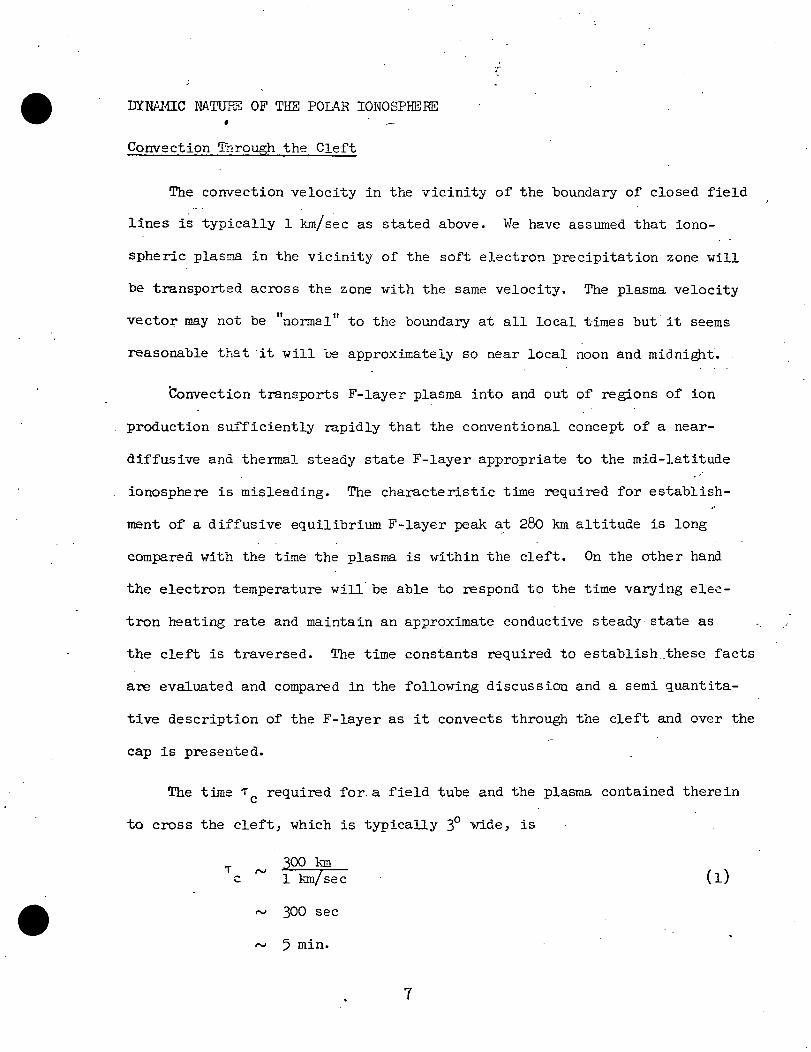
Convection Through the Cleft
The convection velocity in the vicinity of the boundary of closed field
lines is typically 1 km/sec as stated above. We have assumed that iono-
spheric plasma in the vicinity of the soft electron precipitation zone will
be transported across the zone with the same velocity. The plasma velocity
vector may not be "normal" to the boundary at all local times but it seems
reasonable that it will be approximately so near local noon and midnight.
'Convection transports F-layer plasma into and out of regions of ion
production sufficiently rapidly that the conventional concept of a near-
diffusive and thermal steady state F-layer appropriate to the mid-latitude
ionosphere is misleading. The characteristic time required for establish-
ment of a diffusive equilibrium F-layer peak at 280 km altitude is long
compared with the time the plasma is within the cleft. On the other hand
the electron temperature will be able to respond to the time varying elec-
tron heating rate and maintain an approximate conductive steady state as
the cleft is traversed. The time constants required to establish .these facts
are evaluated and compared in the following discussion and a semi quantita-
tive description of the F-layer as it convects through the cleft and over the
cap is presented.
The time T required for a field tube and the plasma contained therein
to cross the cleft, which is typically 3° vide, is
T ^ 300 kmc 1 km/sec (l)
~ 300 sec
~ 5 min.
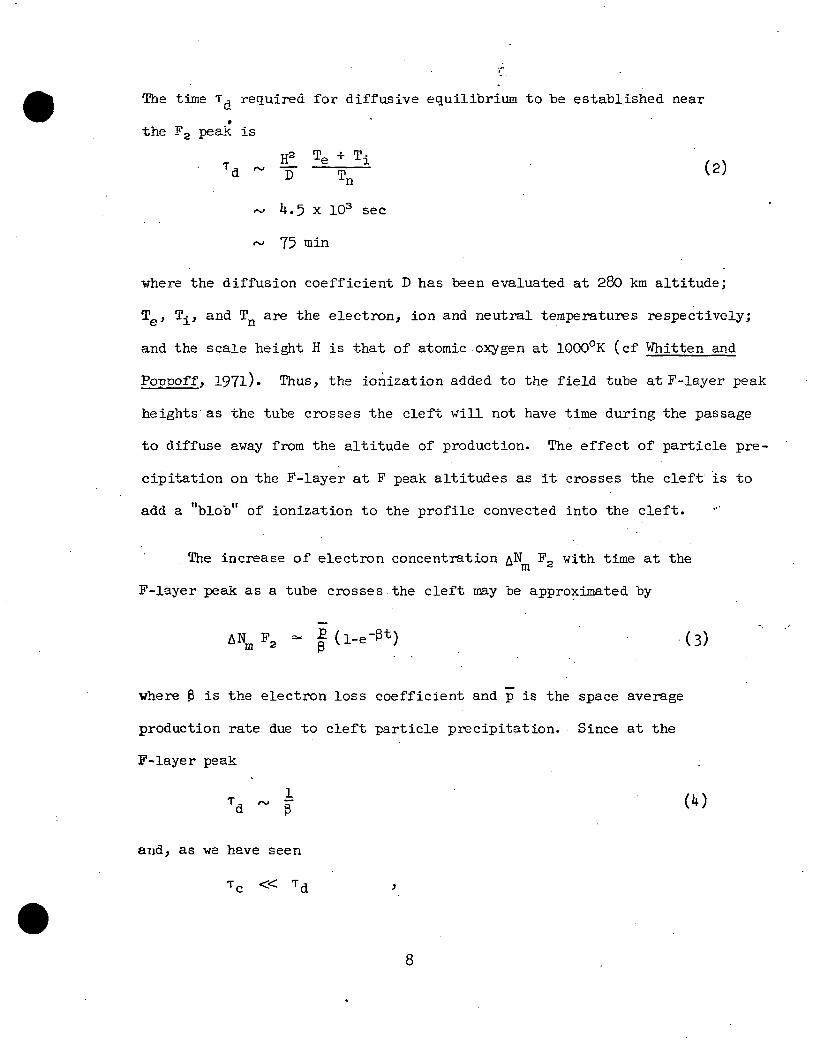
The time T , required for diffusive equilibrium to be established near•
the F2 peak is
~ 4.5 x 10³ sec
~ 75 min
where the diffusion coefficient D has been evaluated at 280 km altitude;
Tg, T.p and TQ are the electron, ion and neutral temperatures respectively;
and the scale height H is that of atomic oxygen at 1000°K (cf Whitten and
Poppoff, 197l). Thus, the ioriization added to the field tube at F-layer peak
heights as the tube crosses the cleft will not have time during the passage
to diffuse away from the altitude of production. The effect of particle pre-
cipitation on the F-layer at F peak altitudes as it crosses the cleft is to
add a "blob" of ionization to the profile convected into the cleft.
The increase of electron concentration AN F,, with time at them rf
F-layer peak as a tube crosses the cleft may be approximated by
(3)
where 3 is the electron loss coefficient and p is the space average
production rate due to cleft particle precipitation. Since at the
F-layer peak
Td ~ F
and, as we have seen
TC « Td
8
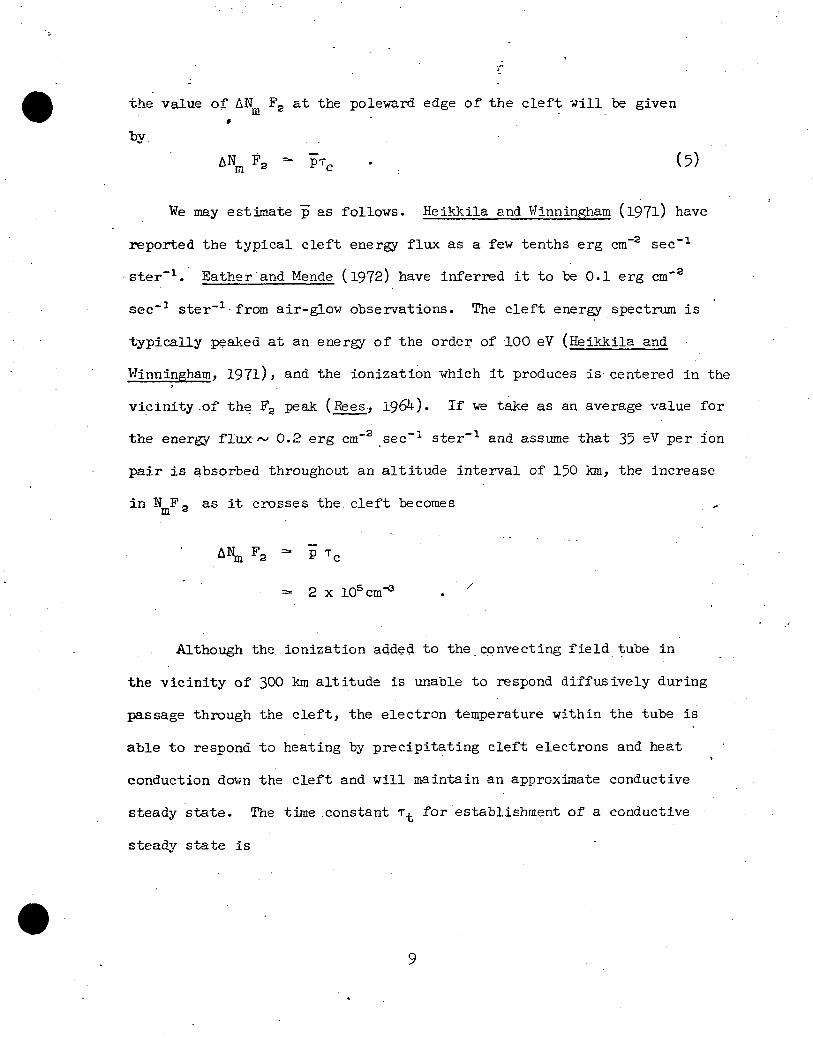
the value of AN F2 at the poleward edge of the cleft will be given
A N m F 3 =- PTC . (5)
We may estimate p as follows. Heikkila and Wjnningham (l9?l) have
reported the typical cleft energy flux as a few tenths erg cm"2 sec"1
•ster"1. Bather and Mende (1972) have inferred it to be 0.1 erg cm"3
see'1 ster"1-from air-glow observations. The cleft energy spectrum is
typically peaked at an energy of the order of 100 eV (Heikkila and
Wjnningham, 197l)j and the ionization which it produces is centered in the
vicinity of the F3 peak (Rees, 1964). If we take as an average value for
the energy f lux ~ 0.2 erg cm"2 sec"1 ster"1 and assume that 35 ev" per ion
pair is absorbed throughout an altitude interval of 150 km, the increase
in N Fs as it crosses the cleft becomes
A\ F3 - p TC
*> 2 x 105cm'<3 . /
Although the.ionization added to the cpnvecting field tube in
the vicinity of 300 km altitude is unable to respond diffusively during
passage through the cleft, the electron temperature within the tube is
able to respond to heating by precipitating cleft electrons and heat
conduction down the cleft and will maintain an approximate conductive
steady state. The time .constant T^ for establishment of a conductive
steady state is
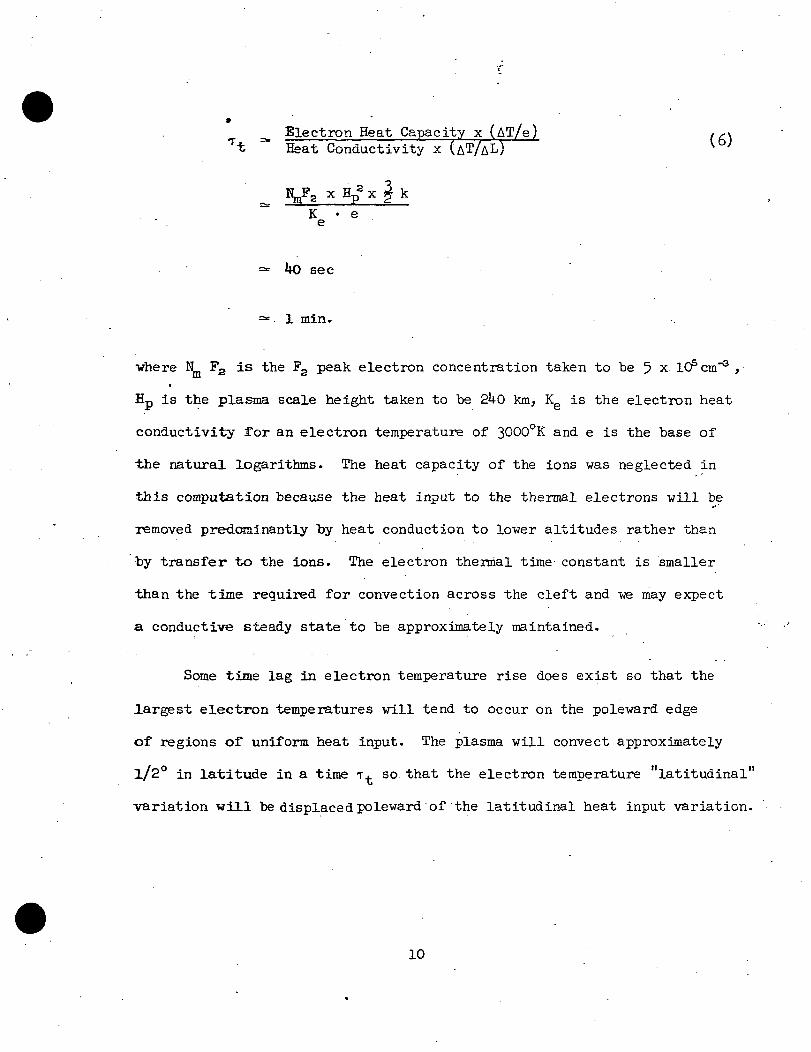
w
^ Electron Heat Capacity x (AT/e) ,,-\T t ̂ Heat Conductivity x ( A T / A L ) * '
K • ee
=« 40 sec
=• 1 min.
vhere Nffl F2 is the F3 peak electron concentration taken to be 5 xt
E.Q is the plasma scale height taken to be 2UO km, K0 is the electron heat* - - C
conductivity for an electron temperature of 3000°K and e is the base of
the natural logarithms. The heat capacity of the ions was neglected in
this computation because the heat input to the thermal electrons will be
removed predominantly "by heat conduction to lower altitudes rather than
by transfer to the ions. The electron thermal time constant is smaller
than the time required for convection across the cleft and we may expect
a conductive steady state to be approximately maintained.
Some time lag in electron temperature rise does exist so that the
largest electron temperatures will tend to occur on the poleward edge
of regions of uniform heat input. The plasma will convect approximately
1/2° in latitude in a time T+ so that the electron temperature "latitudinal"
variation will be displaced poleward of the latitudinal heat input variation.
10
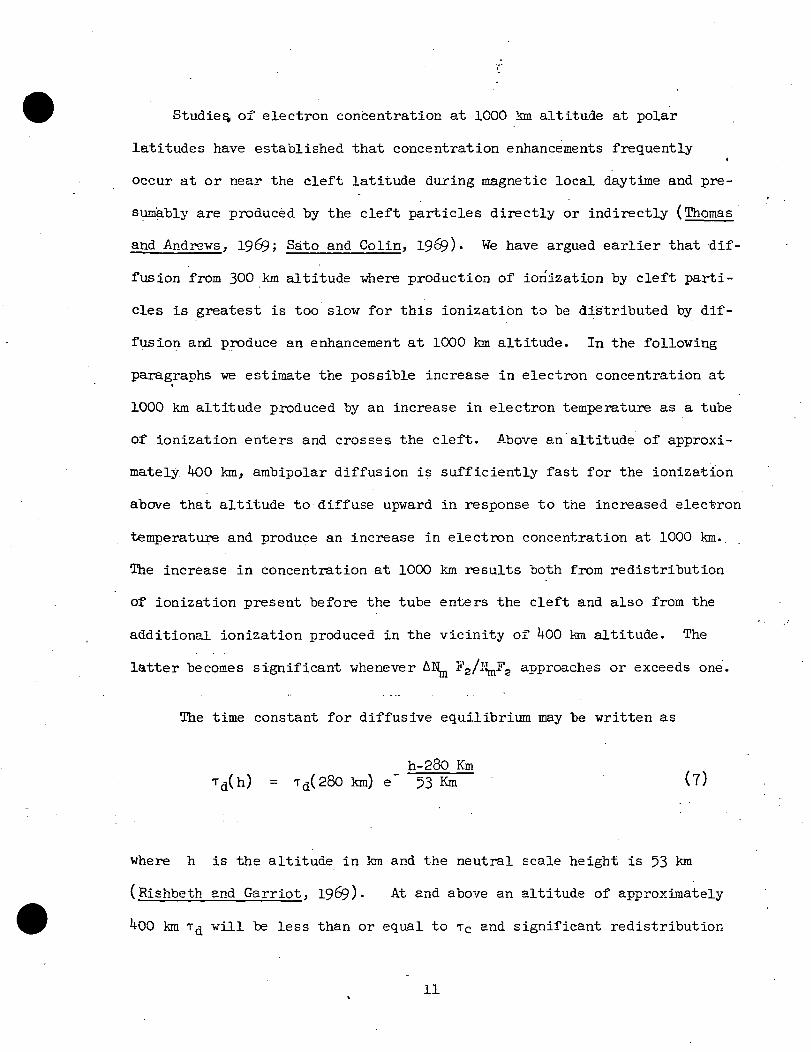
Studies of electron concentration at 1000 km altitude at polar
latitudes have established that concentration enhancements frequentlyI
occur at or near the cleft latitude during magnetic local daytime and pre-
sumably are produced by the cleft particles directly or indirectly ( Thomas
and Andrevsj 1969; Sato and Colin, 1969). We have argued earlier that dif-
fusion from 300 km altitude where production of ion'ization by cleft parti-
cles is greatest is too slow for this ionizatibn to be distributed by dif-
fusion and produce an enhancement at 1000 km altitude. In the following
paragraphs we estimate the possible increase in electron concentration at
1000 km altitude produced by an increase in electron temperature as a tube
of ionization enters and crosses the cleft. Above an altitude of approxi-
mately kOO km, ambipolar diffusion is sufficiently fast for the ionization
above that altitude to diffuse upward in response to the increased electron
temperature and produce an increase in electron concentration at 1000 km.
The increase in concentration at 1000 km results both from redistribution
of ionization present before the tube enters the cleft and also from the
additional ionization produced in the vicinity of UOO km altitude. The
latter becomes significant whenever Al Fg/K̂ Fg approaches or exceeds one.
The time constant for diffusive equilibrium may be written as
h-280 KmTd(h) = Td(280 km) e" 53 Km (?)
where h is the altitude in km and the neutral scale height is 53 km
(jRishbeth and Garriot, 1969)- At and above an altitude of approximately
^00 km T^ will be less than or equal to TC and significant redistribution
11
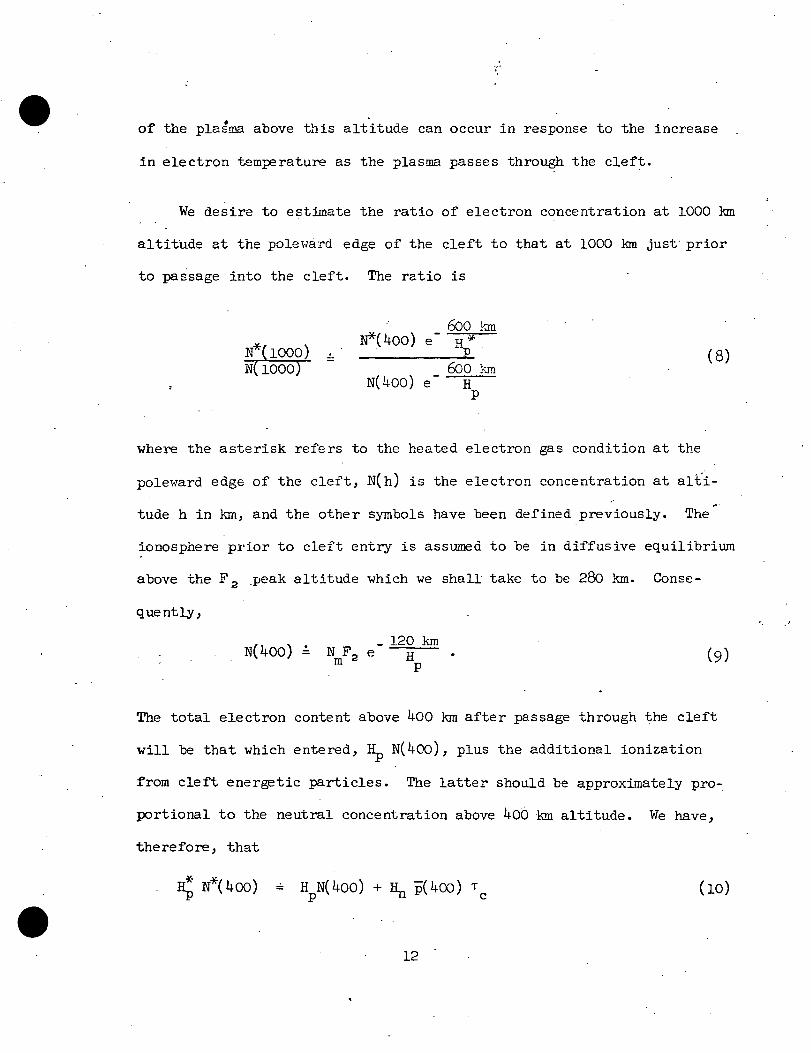
of the plasma above this altitude can occur in response to the increase
in electron temperature as the plasma passes through the cleft.
We desire to estimate the ratio of electron concentration at 1000 km
altitude at the poleward edge of the cleft to that at 1000 km just prior
to passage into the cleft. The ratio is
_ 600 km ' 't/ . 1.1 \-rwv-'/ e HK*(lOOO) ^ -P_ (8)W(1000) 600 km
N(400) e" HP
where the asterisk refers to the heated electron gas condition at the
poleward edge of the cleft, N(h) is the electron concentration at alti-
•••
tude h in km, and the other symbols have been defined previously. The
ionosphere prior to cleft entry is assumed to be in diffusive equilibrium
above the F2 peak altitude which we shall take to be 280 km. Conse-
quently,
., . _ 120 km. . . N(1KX>) = NmF2 e ~ . (9)
The total electron content above 400 km after passage through the cleft
vill be that which entered, H_ N(400), plus the additional ionization
from cleft energetic particles. The latter should be approximately pro-
portional to the neutral concentration above 400 km altitude. We have,
therefore, that
= HP
12
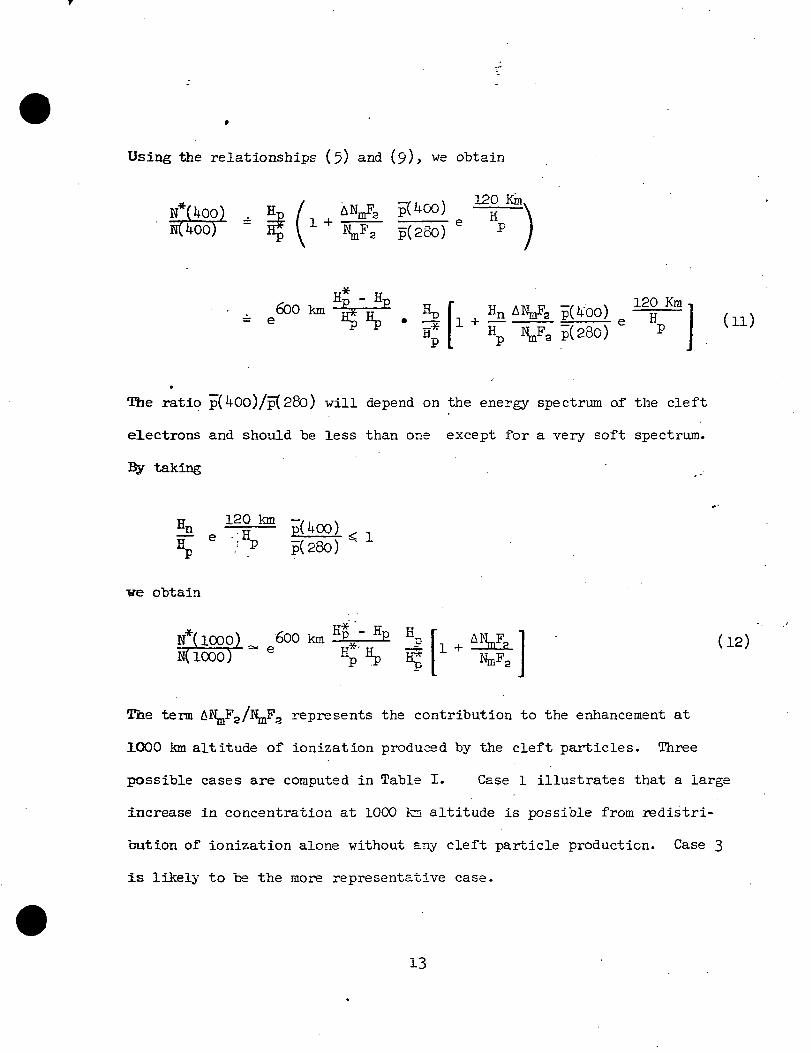
Using the relationships (5) and (9)> we obtain
R*(*iOO) _, __p(2oO)
= e
The ratio p(400)/p(28o) will depend on the energy spectrum of the cleft
electrons and should be less than one except for a very soft spectrum.
By taking
H 120 km
V P(280)
obtain
N*(1000)- ^OOkm ^^l (12)HllOOO) S H Hp
The term AN-Fg/NjjjFjj represents the contribution to the enhancement at
1OOO km altitude of ionization produced by the cleft particles. Three
possible cases are computed in Table I. Case 1 illustrates that a large
increase in concentration at 1000 fa altitude is possible from redistri-
bution of ionization alone without any cleft particle production. Case 3
is likely to be the more representative case.
13
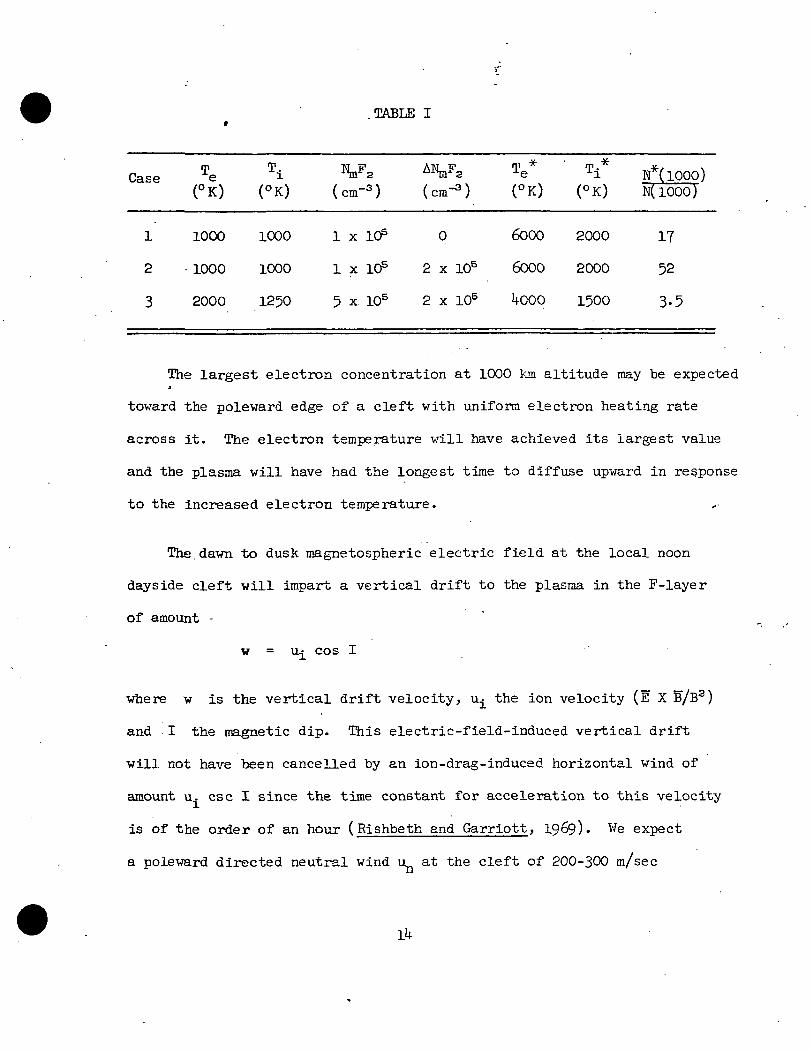
TABLE I
Case
1
2
3
oS
1000
1000
2000
Ji
1000
1000
1250
Va(cm-3)
1 x 10s
1 x 10⁵
5 x 10s
(cnr3")
0
2 x 10s
2 x 10⁵
rn "** m-"•e ±i
6000 2000
6000 2000
kcsQo 1500
N*(lOOO)K(1000)
17
52
3-5
The largest electron concentration at 1000 km altitude may be expected
toward the poleward edge of a cleft with uniform electron heating rate
across it. The electron temperature will have achieved its largest value
and the plasma will have had the longest time to diffuse upward in response
to the increased electron temperature.
The.dawn to dusk magnetospheric electric field at the local noon
dayside cleft will impart a vertical drift to the plasma in the F-layer
of amount -
w = u^ cos I
where w is the vertical drift velocity, Uj_ the ion velocity (E X B~/B2)
and I the magnetic dip. This electric-field-induced vertical drift
will not have been cancelled by an ion-drag-induced horizontal wind of
amount u. esc I since the time constant for acceleration to this velocity
is of the order of an hour (Rishbeth and Garriott, 1969). We expect
a poleward directed neutral wind 11 at the cleft of 200-300 m/sec
produced by 'solar heating (Challinor, 1970) which will impart a nega-
tive vertical drift. The resultant will be
w = (u. - u ) cos I
(13)=• 60 m/sec
In crossing the eleft, the F-layer will be raised •
Ah =~ 60 m/sec • 300 sec .
9
=- 18 km.
Only the F-layer entering the cleft will be raised this amount. The
amount.the cleft-produced ionization is raised will depend on where
within the cleft latitude interval it is produced. In traveling to
the magnetic pole the F-layer will be raised
Ah - T — • 1 x 10³ sec2 sec
= 30 km
where we have taken an average value for the cos I. As the plasma con-
tinues convecting over the cap on the night side, the difference in
velocity between the neutral wind and plasma should decrease so that
the layer will drop less than it is raised. The overall effect will
be to raise the layer and, as a consequence, reduce the loss rate. The
15
amount the F-layer is raised could be more than that indicated above
by a factor of 3-5 during a substorm when the plasma velocities are
greater than 1 km/sec and the cleft is at a lower latitude.
King et al. (1968, 19Tl) have attempted to explain high latitude
ionospheric behavior in terms of vertical drift induced by solar-
produced neutral winds. For stations within and poleward of the
auroral oval, their conclusions must be re-examined, because the ver-
tical drift induced by the convection electric field is larger and
oppositely directed to that induced by the solar-produced wind
field."
The change expected in the sunlit cleft F-layer as the plasma
convects from just south of the cleft to the northern boundary is
summarized qualitatively in Figure 2. lonization is added to the FS
peak in the vicinity of 300 km and the electron concentration at
1000 km altitude is increased by redistribution of ionization above
approximately hOO km altitude. The decrease in concentration just
above ^00 km altitude shown in Figure 2 results from assuming for
this example that no significant ionization is produced above UOO km
altitude by particle precipitation.
Convection Over the Cap
After the plasma passes northward out of the cleft zone of particle
precipitation, the heat input to electrons ceases - at least that from
16
cleft soft electrons - and the electron temperature should drop back
to an ambient value with time constant Tf This time corresponds to a
convection distance of about 1/2° in latitude. Thus, within about 1°
of the northern cleft boundary defined by particle precipitation, the
high electron temperature may be expected to decay and the plasma will
diffuse back down the field line consistent with the reduced plasma
scale height. Again, this redistribution of the plasma will be limited
to altitudes above kQO km since only the time T^. has elapsed.•
As the plasma profile is convected on across the polar cap, the
electron concentration bulge in the vicinity of 300 km altitude will
decay with a time constant somewhat shorter than T, (=« J3"1) toward a'
level consistent with the local ion production rate. Diffusion of the'
concentration bulge and also loss of If1" ions out of the open field tubes
will tend to cause the decay time of NmF2 to be somewhat smaller than T,.
At 0.5 - 1 km/sec the plasma will convect through about 27° of latitude
which is the width of the polar cap in the time T^. We would expect in
the winter hemisphere, therefore, that the electron concentration just pole-
.ward of the auroral oval on the night side of the polar cap will be re-
duced from that on the day side by a factor of the order of e.
Fedder and Banks (l9?2) have computed the temperature rise of ions
at 300 km altitude resulting from a step function increase in electric
field. Ions convecting into the cleft and on across the cap may experience
17
a similar temperature rise. The ion temperature rise is not significant
for our considerations however, for it is small (~ 300°K) compared to that
expected for the electrons.
Convection Through the Njghtside Precipitation Zones
After crossing the polar cap, in which little precipitation of par-
ticles occurs, the plasma will enter the low energy electron precipitation
zone on the night side, be convected to and across the boundary of closed
field lines and, then, convected sunward at a latitude below the boundary
of closed field lines. The response of the plasma in crossing the night
side low energy electron precipitation zone and the harder precipitation
zone equatorward of the closed field line boundary will be, in a general
way, similar to that described above for passage through the day side.
We may expect some enhancement of concentration in the vicinity of 300 km
and an increase in electron temperature with subsequent increase in scale
height above about kOO km. However, the picture is more complicated for
the night passage. The energy spectrum in the soft zone evidently
hardens in the local evening and night sectors (Frank and Ackerson, 1972;
Burch, 1970) which implies ion production at a lower altitude than that
on the day side. The lifetime at low altitude will be correspondingly
shorter, and the plasma will "slip" behind the field lines. In the
hard or plasma sheet electron precipitation zone most of the energy will
18
fl
f
be deposited at still lower altitude in the E region. The convection
paths are also more complicated in the night sector as inferred from
electric field measurements and barium releases (Gurnett and Frank,
1973; Maynard, 1972).
Convection Around Night Side and Return to Cleft
I suggest that after the F-layer plasma crosses the nightside
precipitation zone and is convected around the night sector toward the
dawn, it decays and, in doing so, forms the F-layer trough. The flow
lines of Figure 1 which are just poleward of the plasmapause and which
circulate around the dawn side of the earth take several hours to reach
the solar illuminated morning sector. F-layer plasma convected along
these paths is expected to decay from recombination by a factor of ten . .
for every two or three hours of travel time in the absence of any ioni-
zation source. Thus, the F-layer concentration at 60°A and in the mid-
night and post midnight sectors could be reduced below that in the soft
electron precipitation zone and cap by a factor of 102 and more.
The explanation for the low electron concentration in the F-layer
trough zone as compared with the F-layer concentration equatorward of
the trough is incomplete and is intimately related to the problem of
maintaining the night F-layer. I suggest that the night time maintenance
mechanism is absent or weak poleward of an ebb and flow boundary located at about
19
60°A and tha't the "trough" zone is simply the region between the high
concentration "tongue" of ionization filling the polar cap from the day-
side and the ebb and flow boundary. As the "tongue" of ionization is con-
vected below the trapping boundary on the night side and toward the sunlit
region of the earth, the F-layer decays primarily from dissociative recom-
bination and also to some extent from polar wind loss. The ebb and flow
boundary is a magnetic latitudinal boundary equatorward of which the re-
turn flow of H4" ions from the plasmasphere at night is adequate to main-^
tain the F-layer against dissociative recombination (Park, 1970; Nagy and
Banks, 1972; Rishbeth, 1968). It is approximately at the same latitude
as the plasmapause.
The field tubes correcting across the polar caps are open and are f.
expected to lose their light ions n and He to the solar wind. We may
expect, therefore, a rather continuous upward flux of IT*" ions at 2000 km
altitude of the order of 3 x 10s cm"2 sec"1 as a field tube crosses the
cap, reconnects, and convects toward the sunlit region of the earth
(Park, 1970; Banks et al., 1971; Chappell, 1972). This outflow of hydro-
gen ions diminishes the 0 content through charge exchange and contributes
to the rate at which the F-layer decays as it convects across the cap and
around the nightside of the earth.
The time constant T for this process acting alone to dissipate
the topside Fa layer for an l^Fg of 5 x 105 cm"3 is
20
Hp
TP ~' f ' (15)
10s x 150 x 10s
3 x 10s
=- 2.5 x 10⁴ sec
~ 7 hr.
where f is the upward flux of H4" ions. Outflow of IT*" will thus contri-
bute to the decay of the F-layer but the normal recombination decay is
dominant since it reduces the concentration to 1/e in approximately 1.5 hours.
Equatorward of the ebb and flow boundary we envision that the field
tubes are emptied at sufficiently infrequent intervals that the plasma-
sphere H+ concentration is sufficient for a flow of ionization back into"
the F-layer at night to occur (Park, 1970; Nagy and Banks, 1972). This
flow will contribute to, if not provide, the maintenance of the F3 layer.
The lowest electron concentration at the F-layer peak should occur
on those field tubes for which the time interval since passing the cleft
and nightside soft electron precipitation zone is the greatest and which
have not been exposed to solar radiation subsequently. Those tubes which
circulate on the dawn side of the earth at the lowest latitude but
which have not been exposed to solar radiation as they convect toward
the stagnation point on the dusk side of the earth satisfy this
criteria. From a consideration of Figure 1, we would expect that the trough
would tend, to be centered at about 55° - 60°A and that it would be deepest
21
(least concentration) toward the morning side of the earth. This last
conclusion follows from the fact that the F-layer should continue to decay,
as the field tubes flow toward the morning side of the earth after crossing
the night side soft electron precipitation zone and prior to being exposed
to solar radiation on the morning side. A "rotation" of the trough toward
the morning side is clearly evident in F-layer data as ve shall see.
The elapsed travel time of a plasma tube after it leaves the night side
precipitation zone decreases rather rapidly poleward of the plasiaapause at
a fixed magnetic time meridian. At the 02 hr meridian of Figure 1, for
example, the difference in elapsed time between the two lowest latitude
paths is 12 hours and between the next two paths is about 4 hours. The paths
are approximately 3° apart in latitude. With the plasma decaying an order of
magnitude about every three hours, we may expect the electron concentrat'ion
to increase rapidly - orders of magnitude within 3° - toward the pole from
the position of the minimum concentration.
If the plasmapause location did not move in response to magnetic storms,.
we would expect a very abrupt discontinuity, in F-layer electron concentration
in crossing the plasmapause toward the equator. Occurrence of magnetic
storms will smooth out the discontinuity, however, "by removing the magneto-
spheric plasma on tubes normally closed (Chappell, 1972). Park (l9?o) and
Banks et al., (l97l) have established that several days are required to refill
a tube at L = 5 once emptied and that the diurnal ebb and flow of n ions does
not recommence until the concentration near the equator reaches a dynamic
steady state. We may expect the time of recovery to be a strong function of
L because the tube volume varies strongly with L. During a storm, for ex-
ample, the plasmapause may be shifted to 50°A and following the storm return
22
to 65°A. Return flow of plasma to the F-layer at night at 65° A vill require• »
some days to be reestablished but will continue uninterrupted at 50°A. .In
between these latitudinal limits the return flow at night will be intermed-
iate to these two flow extremes.
The interpretation of the trough given here differs from that outlined
by Rishida (1967) in that the maintenance of the polar cap ion concentration
by strong convection was not recognized by Nishida. It also differs in recog-
nition that the low concentration at night in the trough region is probably
less a direct consequence of polar wind loss of plasma poleward of the ebbt
and flow boundary than it is an absence of the mechanism that maintains the
ionosphere equatorward of the boundary.
e s
COMPARISON WITH OBSERVATIONS 't*~
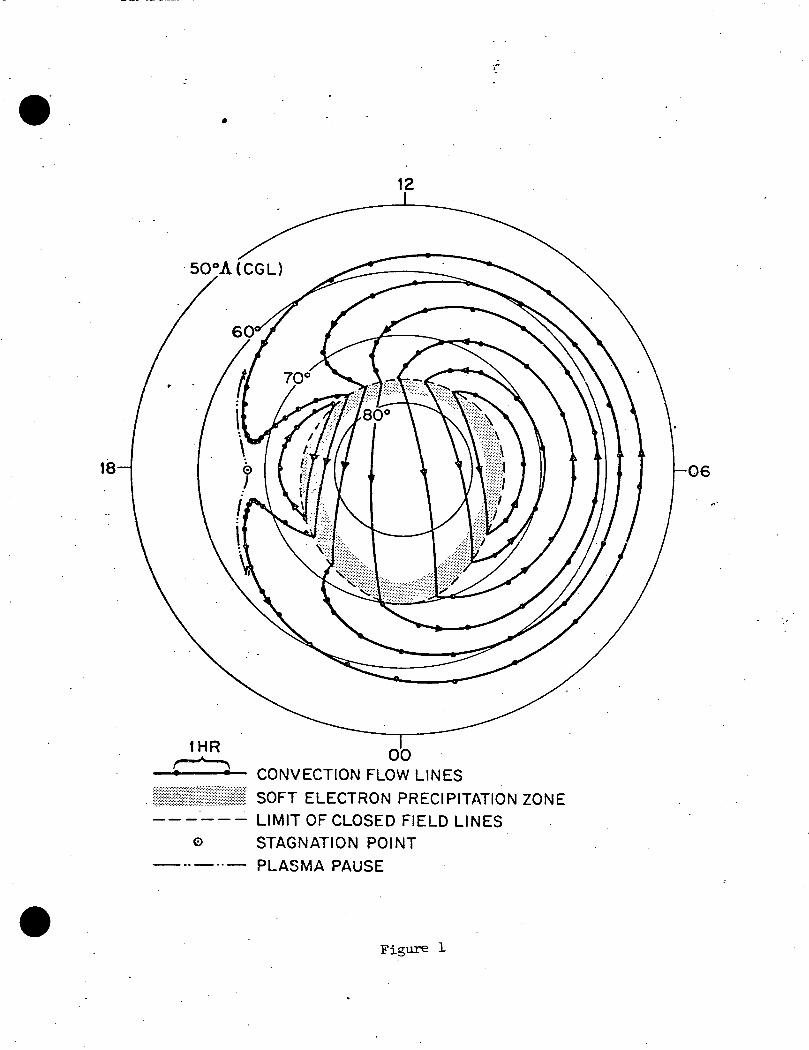
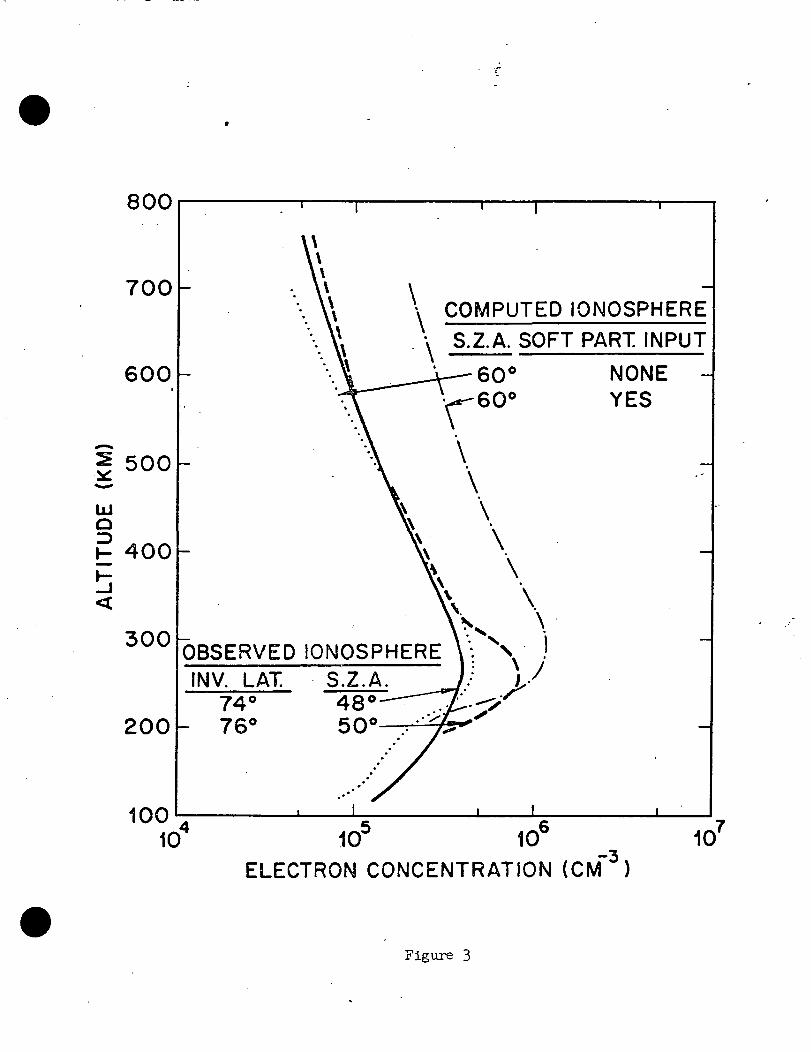
In Figure 3 electron concentration profiles reduced from topside
and bottom side ionograms within and near the cleft are shown. The top-
side and bottomside ionograras were recorded on the ISIS II satellite
and AFCRL Flying Ionospheric Observatory, respectively, during the AFCRL
Airborne Auroral Expedition (Pike, 1972). - The aircraft flew along, the
satellite track under the cleft shortly after the satellite passed over
the cleft on May 28, 1971 at approximately 17:55 UT. The electron con-
centration profile at 7^° invariant latitude (A) is that produced by
solar photons without contribution from the cleft soft electrons. The .
soft particle spectrometer (SPS) on ISIS II recorded the presence of
cleft electrons from 7*4- to 77°A (Wjnningham, 1973). The electron concen-
tration profile measured for 76°A shows an increase of electron concen-
tration of about U x 105 at an altitude of approximately 275"km- Above
approximately 350 km the concentration drops back to values typical of
23
the undisturbed ionosphere measured south of the cleft "but with a some-
vhat greater scale height.
For comparison, two computed electron concentration profiles ob-
tained with and without the soft electron flux from the cleft affecting
the model are shown. The profiles represent steady state solutions to
the continuity, momentum and energy equations governing the ionospheric
plasma. The soft particle spectrum used as input for the cleft profile
was -that measured by the ISIS II SPS. Diffusive equilibrium exists in
the computed profile and is clearly not present in the observed profile.
Further details of the modelling of the cleft ionosphere will be
given in a later publication. Our interest herein is to emphasize the __
apparent lack, of diffusive equilibrium in the abserved profiles.
The lack of diffusive equilibrium at l6°A in the observed profile
is not the result of polar wind flow, evidently. The flow of H ions
into the magnetosphere can reduce the scale height of the F-layer above
the F-layer peak provided the flow is sufficiently large (Holzer, 1970).
However, comparison of the two experimental profiles and the diffusive
equilibrium profiles suggests strongly that the bulge is the result of
ionization having been added between 200 and 300 km altitude which has
not diffused into an equilibrium profile. Furthermore, Alouette 2 top-
side ionosonde profiles from low latitude to high latitude at night
show a large reduction in electron concentration at 3000 km altitude as
•the plasmapause is crossed, but no obvious change in the low altitude
top side F-layer is evident (Nelms and Lockwood 1967). In passing from
a region of no expected polar wind flow to one of expected polar wind
flow no significant change in the low altitude F-layer is evident.
Although time variation in the cleft input electron energy spec-
trum and energy flux could produce a non-diffusive equilibrium profile,
the most probable cause - or at least a contributory cause - is rapid
relative motion of the cleft ion production zone and the F-layer plasma.
A large increase in concentration at high altitude toward the
poleward edge of the cleft is not evident in the experimental profiles
of Figure 3- An increase is evident in statistical results as we shall
see.
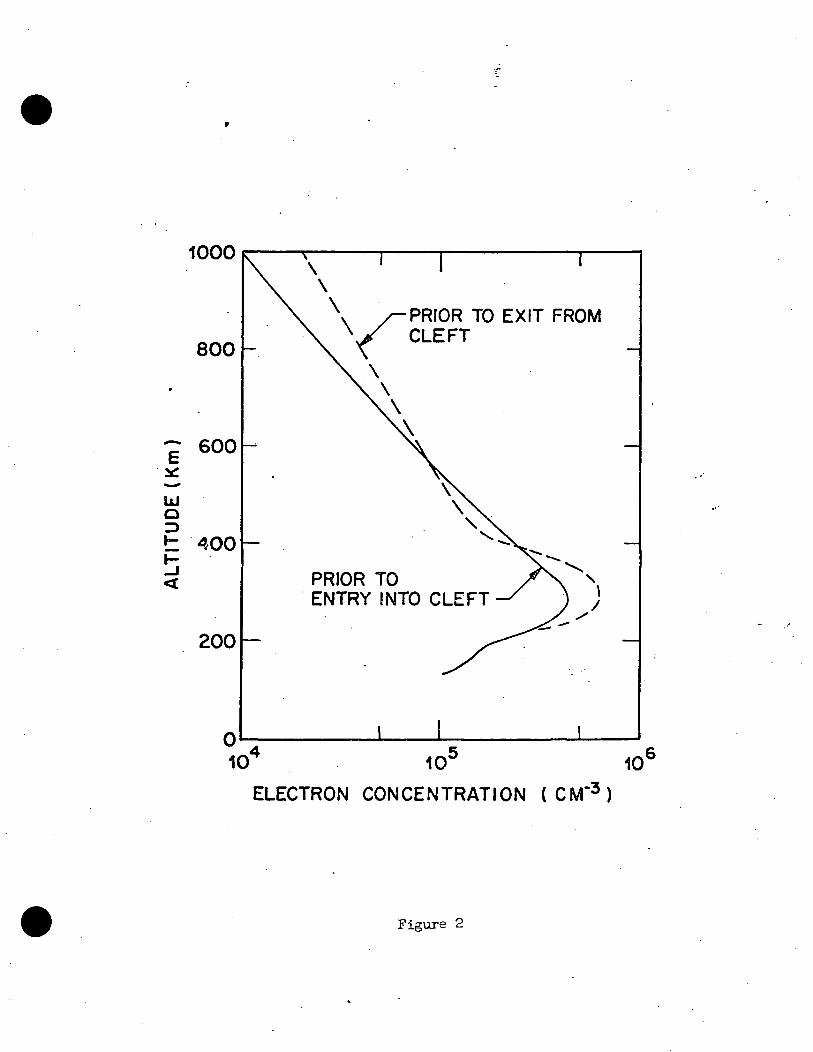
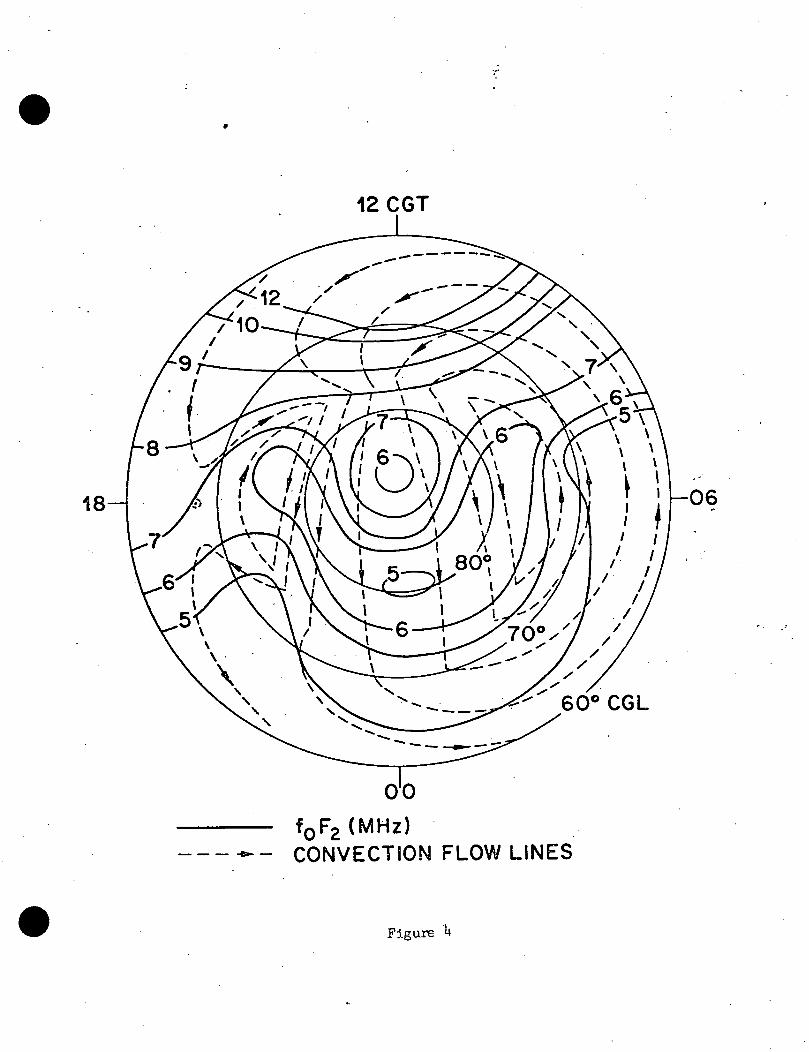
A tongue of ionization extending from the day side toward the night
side of the polar caps has been reported previously as described in the
introduction. More recently Pike (l97la) has plotted in corrected geo-
magnetic latitude and time (Hakura, 19&5) "the monthly median fo^3 data
from ionospheric stations in the Arctic for Dec. 1958 at l'800 UT. The
contours are reproduced in Figure U with the convection pattern of Fig-
ure 1 superimposed. Since the contours are of monthly median values for
the universal time of 1800, the result represents a typical condition
for the Arctic polar winter during sun spot maximum. • The tongue of ioni-
zation transported across the polar cap from the dayside by the magneto-
spheric electric field is clearly evident.
25
The plasma ring at F-layer altitudes is not strongly evident, if
at all, in the bottom side data. The only suggestion is that on the
night side at about 7^° corrected geomagnetic latitude indicated by the
two adjacent 6 MHz contours. Failure to see an increase in foF2 across
the day side cleft (~ 76° CGL) could result from lack of stations or dif-
ficulty in reading ionograms in the vicinity of the cleft. A large in-
crease in foF2 is not expected since an increase of \f3 by 2 x 10s cm"3 ,
which we have seen is the typical increase to be expected, would increase
f0F3 only from 8 MHz to 9 MHz (l̂ Fg(cnT? ) = 1.2k x 10* foF33 (MHz)).
The slight.depression near the center of the cap suggests a polar
cavity in -which the concentration at F-layer height is reduced (Pike_,
1971&). If this feature is real it could result from the slower
convection velocity interior to the cavity and consequent longer de-
cay time. The reduced particle precipitation in the center of the
cap may also contribute to a lower concentration.
Duncan (1962) has demonstrated that the monthly median value of
N F2 has a diurnal maximum at approximately 0600 UT in the Antarctic at
all seasons. In the Arctic the maximum is observed to occur at approxi-
mately 1800 UT (Duncan, 1962; Pike, 1971a). Sato and Rourke (19#0 ob-
served that the tongues in the Antarctic were most prominent between
26
CA-00 and 0900 UT and in vinter. These latter two authors recognized that
the universal time dependence and seasonal appearance had a simple ex-
planation if ionization vere being transported across the cap from the
dayside ionosphere. The solar zenith angle at local magnetic noon and
at the cleft latitude goes through a diurnal cycle and is a minimum
at all seasons at approximately 1700 UT in the Arctic and OkOO UT in the
Antarctic. We would thus expect that the solar produced F-layer just equator-
ward of the cleft,which is that being convected across the cap, would
have the largest concentration at these universal times in the respec-
tive hemispheres. This universal time variation may be visualized as
a receding of the dayside contours of Figure k to a lower latitude by'
approximately 20° for a universal time of 0500 and return to that shown .
at'l800.
The actual universal times of maximum fQF2 in the two polar re-
gions correspond to approximately two hours past local noon in magnetic
local time (Pike, 197la). The local time at which the convection velo-
city switches from eastward to westward at the cleft is also in the
afternoon (Figure 1 and Gurnett and Frank, 1973) and suggests that the
ionization convected across the cap is being drawn primarily from this
local time sector.
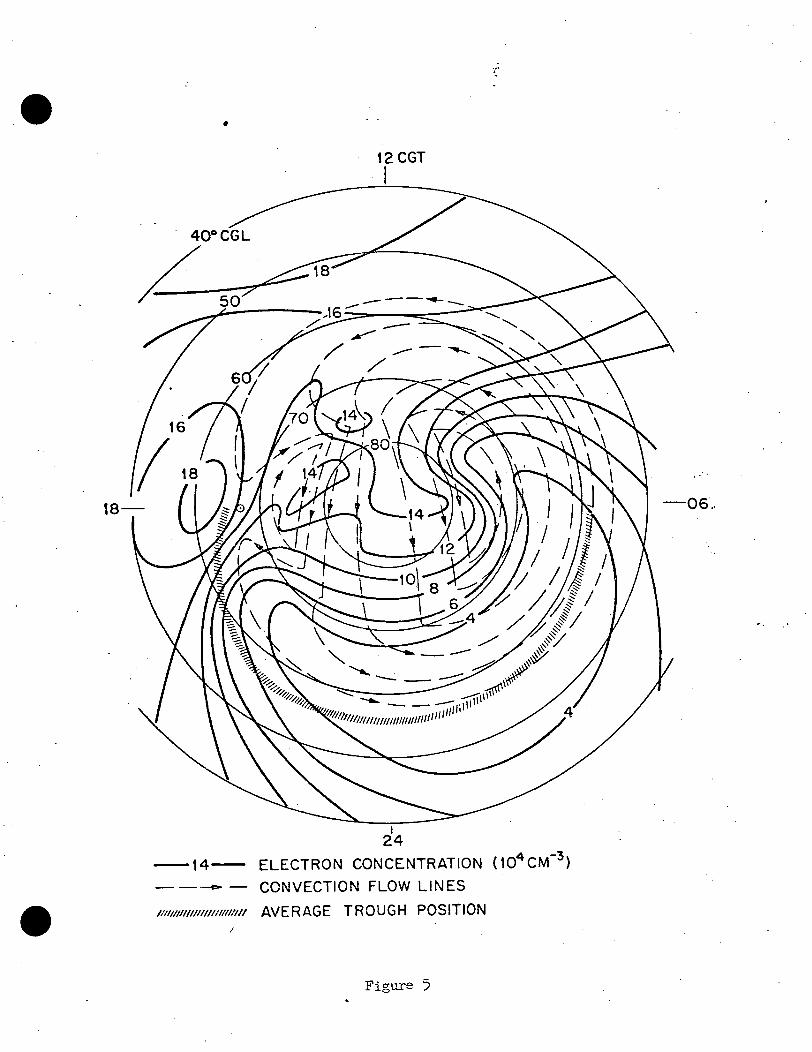
Njshida (1967) has presented average electron concentra-
tions over the north polar area for the low sunspot years 19&2, 19&3 and
196̂ 4- obtained from Alouette topside ionograms during geomagnetically quiet
periods. The results for an altitude of 350 km plotted in corrected
27
geomagnetic coordinates are reproduced in Figure 5 together with the
convection paths of Figure 1. These data represent a universal time
average, evidently, for the autumn (equinox) season. A suggestion of
a small ridge at the dayside cleft is present in these data but an
enhancement at the nightside soft electron precipitation zone is not
evident. The "tongue" is clearly evident as well as the F-layer
trough of low electron concentration on the night side. The contours
again-suggest that the ionization is being drawn from a local time
position of 13-lU CGT.
The enhancement at 18 CGT equatorward of the stagnation point
suggests that it is related to the plasmaspheric bulge. It could
be the result of neutral winds and westward declination of the mag-
netic field lines, however, since the data were obtained around
85°W longitude as noted by Nishida (1967).
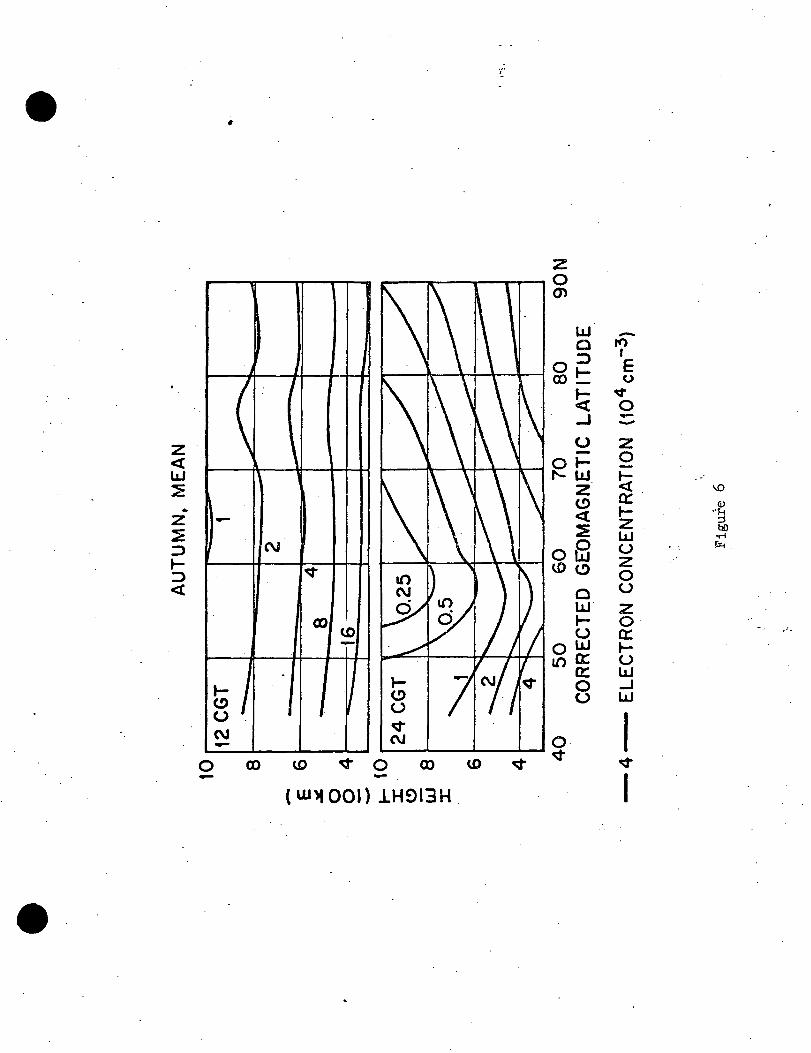
The meridional profiles of average electron density for
corrected geomagnetic times of 12 and 2k hr at equinox are re-
produced in Figure 6( after Nishida, 196?). The 12 CGT profile
illustrates the enhancement of electron concentration at high alti-
tude expected from our foregoing analysis. No significant en-
hancement in electron concentration at the cleft is indicated at
350 km altitude in this profile although one is evident for the winter
season in a profile to be reproduced shortly. Similarly, no
28
electron cdhcentration enhancement is evident in the nightside soft
electron precipitation zone (~ 70-80° CGL) although a steep gradient to
lower values occurs just south of the zone.
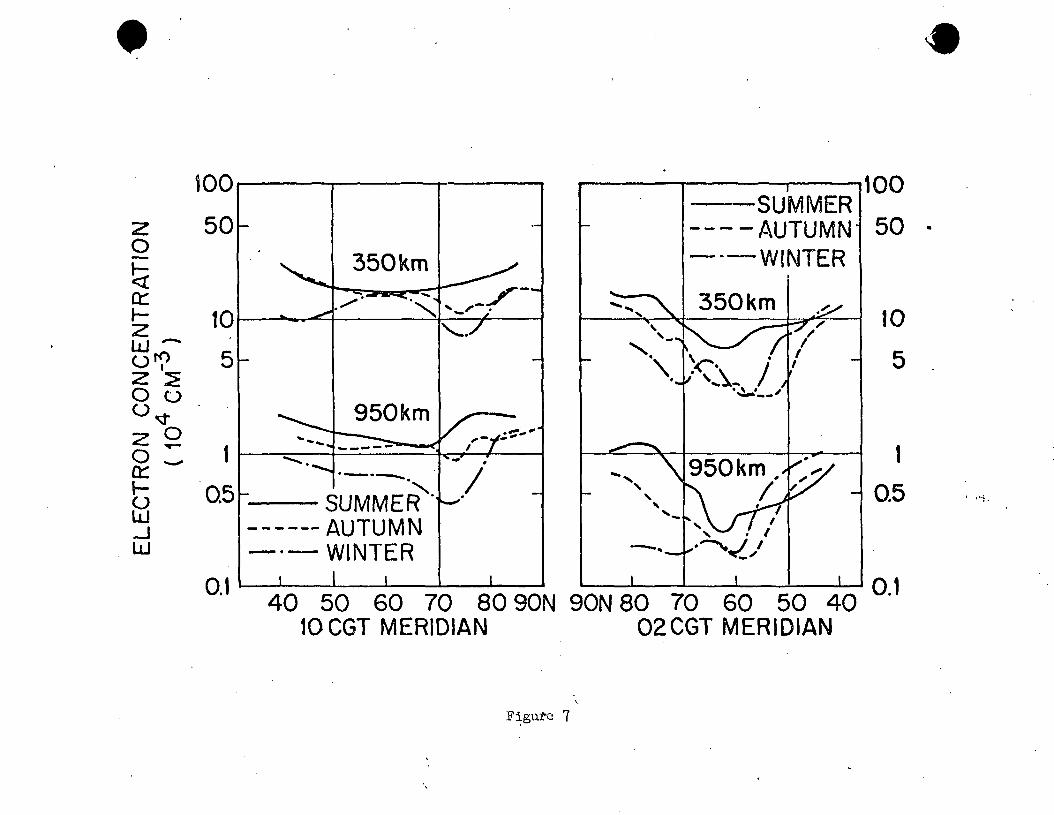
In Figure 7 we reproduce the meridional profiles for 1000 and 0200 CGT
for three seasons. In winter, at 350 km altitude a definite .enhancement at
the days ide cleft f rom ~ 1 x 10⁵ to 2 x 105 cm"3 occurs but is not evident
during the summer. The concentration at 350 km altitude drops by about
a factor of e in crossing the cap (80° Day ~ 75° night) in all seasons.
The largest concentration both at 350 and 950 km altitude in winter evi-
dently occurs at or poleward of 80° CGL which is consistent with the
electron temperature and concentration being largest at the poleward .
boundary of the cleft. The data were averaged in U° latitude intervals^
however, so that a strong case for the location of the maximum cannot be
made. A small enhancement at night and in winter does appear at both
350 and 950 km altitude at about ~ 67° CGL. This may be the signature
of the plasma passing the night side soft electron precipitation zone
since we would expect on the night side that the largest enhancement
in electron temperature and concentration at 950 km and also electron
concentration at 350 km would be on the equatorward edge of the zone.
A zone exists equatorward of the nightside auroral oval referred
to as the trough in which the F-layer concentration is low (Muldrew, 1965;
29
Sharp, 1966; Nishida, 196?; Thomas and Andrews, 1968; Bowman, 1969).
The electron concentration increases rather abruptly in the poleward di-
rection by orders of magnitude from its minimum value and increases more
slowly toward the equator (Sharp, 1966; Bowman, 1969). This behavior is
consistent with that outlined previously. The average position of the
trough as derived from Muldrew* s 1965 data and plotted by Bowman (1969)
is shown in Figure 5- This position follows rather well the lowest
latitude convection flow line and also the center of the electron con-
centration trough derived "by Nishida. The trough is rotated toward the
morning hours in both Figures 4 and 5 which is consistent with the ex-
pected behavior.
The troughs in the averaged data presented in Figures h and 5 are -
broader and not as low in concentration as those observed within a short
time period. Concentrations as low as 1-2 x 103 cm"3 have been reported
(Sharp, 1966; Bowman, 1969; Hultqvist and Liszka, 1972). The concentra-
tion increases from 103 to 10s cm"3 within a degree or two of latitude
on occasion (Hultqvist and Liszka, 1972). Changes in concentration and
latitude of the instantaneous trough with time in response to changes in
the solar.wind presumably produce the averaged troughs illustrated.
30
SUMMARY•
It is suggested that convection of F-layer plasma over the polar
caps in response to the magnetospheric electric field plays a profound
role in the behavior of the layer - particularly in winter when solar
illumination is absent. Plasma equaterward of the dayside cleft is
•convected through the cleft typically in 5 minutes. During cleft pas-
sage, ionization is added to the layer - principally in the altitude
interval 250-350 km. The amount of ionization added is typically
1 - 2 x 10s cm"3 which is relatively insignificant in comparison with«
the solar maintained F-layer concentration in the summer hemisphere.
The amount added is significant in the winter hemisphere - particularly
at universal times when the solar zenith angle at the day side cleft.is
largest. Also during cleft passage the electron gas is heated - largely
independently of the ions - but is maintained in a conductive steady
state. The F-layer plasma above approximately kOO km altitude adjusts
itself into a diffusive equilibrium consistent with the increased elec-
tron temperature and produces the "averaged" enhanced electron concen-
tration seen at 1000 km altitude coincident with the cleft. Some lift-
ing of the F-layer (~ 18 km) resulting from the magnetospheric electric
field will occur.
After passage through the cleft, the electron temperature drops
and the ion concentration at 1000 kin decreases as the top side iono-
sphere "slumps" back down the field tube. This drop in temperature should
occur within about 1° of the poleward boundary of the cleft.
31
At a convection velocity of 0.5-1 tan/sec, the F-layer is convected
from 8o°A on the day side to 75° A on the night side (across the cap) in
a time approximately equal to that required for the layer to decay by a
factor of e.
In crossing the night side soft electron precipitation zone, the
F-layer will respond qualitatively in a similar manner to that described
above for the dayside except that the layer will be lowered in altitude.
The generally harder electron spectrum on the night side implies that ' '
the F-layer will respond less on the nightside than on the dayside.
After passage across the night soft electron precipitation zone,
the F-layer will convect toward lower latitude and around the dawn side
of the earth (Figure l). As it does so at a latitude of ~ 60°A, a decay
in concentration through recombination of the order of 102 - 103 is ex-
pected in the absence of any maintenance sources and the night side
F-layer trough is thus formed. The outflow of H poleward of the plasma--
pause is evidently not the major loss mechanism for the F-layer. It does
provide during sunlit hours the plasma on closed field lines which returns
to the F-layer at night to contribute to the maintenance of the F-layer
equatorward of the plasmapause.
«
ACKNOWLEDGEMENTS
I am indebted to J. D. Winningham for supply of the ISSI3-2 soft
electron spectra used in the model study and to C. Pike for the electron
concentration profiles. Dr. Peter Banks has been intimately involved
in the cusp modelling program the results of which are to be reported
later and has contributed through several discussions. Dr. R. Chappell
has contributed through discussions on the magnetosphere and in provid-
ing the computer results used to construct the convection flow paths of
closed field lines shown in Figure 1. Dr. K. K. Harris has contributed
through several discussions concerning magnetospheric and ionospheric
behavior.
This research was supported by the National Aeronautics and Space
Administration contract NASw 2550 and Lockheed Independent Research
Funds.
33
j, REFERENCES
Axford, W. I., "Magnetospheric Convection," Rev, of Geophys. and Space
. . Phys., I, 421, 1969
Banks, P. M., A. F. Nagy and W. I.Axford, "Dynamical Behavior of Thermal
Protons in the Mid-Latitude Ionosphere and Magnetosphere," Planet.
Space Sci., 12, 1053, 1971
Bowman, G. G., "lonization Troughs Below the F-2 Layer Maximum," Planet.
Space Sci., 3J, 777. 1969
Burch, J. L., ."Satellite Measurements of Low Energy Electrons Precipi-
tated at High Latitudes," in The Polar Ionosphere and Magnetospheric
Processes, G. Skovli, Ed., Gordon and Breach, New York, 1970
Cauffman, D. P., and D. A. Gurnett, "Double-Probe Measurements of Convec-
tion Electric Fields With the Injun-5 Satellite," J. Geophys. Bes.,
J6, 6oik, 1971.
Challinor, R. A., "Neutral Air Winds in the Ionospheric F-Region for an
Asymetric Global Pressure System," Planet. Space Sci., l8, 1^85, 1970.
Chappell, C. R., "Recent Satellite Measurements of the Morphology and
Dynamics of the Plasmasphere," Rev. Geophys. Space Phys., 10, 951;
1972
Duncan, R. A., "Universal Time Control "of the Arctic and Antarctic F-
Begion," J. Geo-phys. Res. , 6j_, 1823, 1962
Eather, R. H. , and 3. B. Mende, "High Latitude Particle Precipitation
and Source Regions in the Magnetosphere," in Magnetosphe re -
Ionosphere Interactions, Kr. Folkestad, Ed., Univ. Press, Oslo,
139, 1972
Fedder, J. A., and P. M. Banks, "Convection Electric Fields and Polar
' Thermospheric Winds," J. Geophys. Res., JJ[, 2328, 1972
Frank, L. A., and K. L. Ackerson, "Local Time Survey of Plasma at Low
Altitude Over the Auroral Zones," J. Geophys. Res., J_J_, Ull6, 1972
Gurnett, D. A., and L. Frank, "Observed Relationships Between Electric
Fields and Auroral Particle Precipitation," J. Geophys. Res., 78,
, 1973
Hakura, Y., Tables and Maps of Geomagnetic Coordinates Corrected By the
Higher Order Spherical Harmonic Terms, Rep. lonos. Space Res., Japan,
121, 1965
Heikkila, W. J. , and J. D. Winningham, "Penetration of Magnetosheath
Plasma to Low Altitudes Through the Dayside Magnetospheric Cusps,"
J. Geophys. Res., ?6, 883, 1971
35
Holzer, T. E*., "Effects of Plasma Flow on Density and Velocity Profiles
in the Polar Ionosphere," in The Polar Ionosphere and Magnetosphere,
Skovli, G., Ed., Gordon and Breach, New York, 209, 1970
Hultqvist, B., and L. Liszka, "The High Latitude Ionosphere Above the
E-Layer," in Magnetosphere-Ionosphere Interactions Kr. Folkestad,
Ed., Uaiv. Press, Oslo, 65, 1972
Kavanagh, L. D., J. W; Freeman, Jr., and A. J. Chen, "Plasma.Flow in the
'Magnetosphere," J. Geophys. Rss., JJj, 5511, 1968
King, J. W., H. Kohl, D. M. Preece, C. Seabrook, "An Explanation of Phe-
nomena Occurring in the High Latitude Ionosphere at Certain Uni-r-
versal Times," J. Atmos. Terr. Phys., 30, 11, 1968
King, J. W., D. Eccles and H. Kohl, "The Behavior of the Antarctic Iono-
sphere," J. Atmos. Terres. Fhys., 33, 1067, 1971
Maynard, N. C., "Electric Fields in the Ionosphere and Magnetosphere," in
Magnetosphere-Ionosphere Interactions, Kr. Folkestad, Ed., Univ.
Press, Oslo, 155, 1972
Muldrew, D. B., "F-Layer lonization Troughs Deduced from Alouette Data,"
J. Geophys. Fes., J_0, 2635, 1965
Nagy, A. F., and P. M. Banks, "Diurnal Variation of the H* Flux Between
the Ionosphere and the Plasmasphere," J. Geophys. Res., 77, ̂ 277 >
1972
36
•Nelms, G. L., and G.E.L. Lockwood, "Early Results from the Topside Sounder
in the Alouette II Satellite/' Space Res., VII, North-Holland Pub-
lishing Company, Amsterday, 6>0k} 1967
Nishida, A., "Formation of Plasmapause, or Magnetospheric Plasma Knee by
Combined Action of Magnetospheric Convection and Plasma Escape From
Tail,"' J. Geophys. Res., 71, 5669, 1966
Nishida, A., "Average Structure and Storm Time Change of the Polar Top-
side Ionosphere at Sunspot Minimum," J. Geophys. Res., 72, 6051, 19^7
Park, C. G., "Whistler Observations of the Interchange of lonization Between
the Ionosphere and Protonosphere," J. Geophys. Res., 73, U2U9, 1970
1 *«'
Paulikas, G. A., "The Patterns and Sources of High-Latitude Particle Pre-
cipitation," Rev. Geophys. Space Phys., 9_, 659, 1971
Pike, C. P., "A Comparison of the North and South-Polar F Layers," J. Geo-
phys. Res., J_6, 6875, 1971a
-Pike, C. P., "A Latitudinal Survey of the Daytime Polar F-Layer," J. Geo-
phys. Res., 76, 77^5> 1971b
Pike, C. P., "Modelling the Arctic F-Layer," in "Arctic Ionospheric
Modelling - Five Related Papers," AFCRL-72-0305, 29, 1972
Rees, M. H., "Note on the Penetration of Energetic Electrons into the
Earth's Atmosphere," Planet. Space Sci., 12, 722,
37
Rishbeth, H.', "On Explaining the Behavior of the Ionospheric F Region,"
Rev. Geophys. Space Phys., 6, 33, 1968
Rishbeth, H. , "The Polar Ionosphere," in The Polar Ionosphere and Magneto-
spheric Processes, Skovli, Ed. , Gordon and Breach, New York, 175, 1970
Rishbeth, K. , and 0. K. Garriott, "introduction to Ionospheric Physics,"
Academic Press, New York, 196?
Sato, T. , "Morphology of Ionospheric P.̂ Disturbances in the Polar Regions,"*
Rept. Ionosphere Space Res. Japan, 13, 91> 1959
Sato, T., and G. F. Rourke, F-Region Enhancements in the Antarctic,"
J. Geophys. Res., 69, 4 591,
Sato, T. , and L. Colin, "Morphology of Electron Concentration Enhancements
at a Height of 1000 km at Polar Latitudes," J. Geophys. Res., 7_4,
2193, 1969
Sharp, G. W. , "Midlatitude Trough in the Wight Ionosphere, J. Geophys. Res.,
, 1966.
Thomas, J. 0., and M. K. Andrews, "The Transpolar Exospheric Plasma, 3,
A Unified Picture," Planet. S-pace Sci. , 17, ̂33, 1969
Winningham, J. D. , Private Communication, 1973
Whitten, R. C. , and I. G. Foppoff , Fundamentals of Aeronomy, John Wiley
& Sons, Inc., New York, 289, 1971
, . FIGURE CAPTIONS
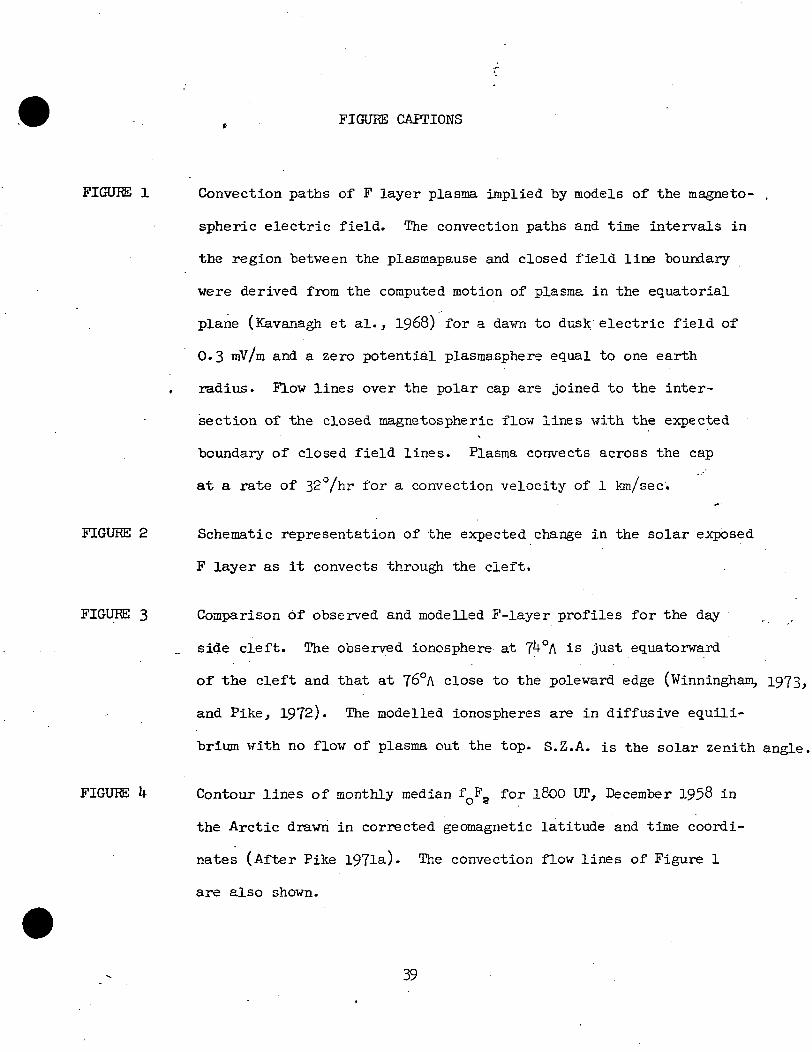
FIGURE 1 Convection paths of F layer plasma implied by models of the magneto- ,
spheric electric field. The convection paths and time intervals in
the region between the plasmapause and closed field line boundary
were derived from the computed motion of plasma in the equatorial
plane (Kavanagh et al., 1968) for a dawn to dusk electric field of
0.3 mV/m and a zero potential plasmasphere equal to one earth
radius. Flow lines over the polar cap are joined to the inter-
section of the closed magnetospheric flow lines with the expected
boundary of closed field lines. Plasma convects across the cap
at a rate of 32°/hr for a convection velocity of 1 km/sec.
FIGURE 2 Schematic representation of the expected change in the solar exposed
F layer as it convects through the cleft.
FIGURE 3 Comparison of observed and modelled F-layer profiles for the day
side cleft. The observed ionosphere at 7̂ °A is just equatorward
of the cleft and that at 76°A close to the poleward edge (Winningham, 1973,
and Pike, 1972). The modelled ionospheres are in diffusive equili-
brium with no flow of plasma out the top. S.Z.A. is the solar zenith angle.
FIGURE k Contour lines of monthly median fQFa for l800 UT, December 1958 in
the Arctic drawn in corrected geomagnetic latitude and time coordi-
nates (After Pike 197la). The convection flow lines of Figure 1
are also shown.
39
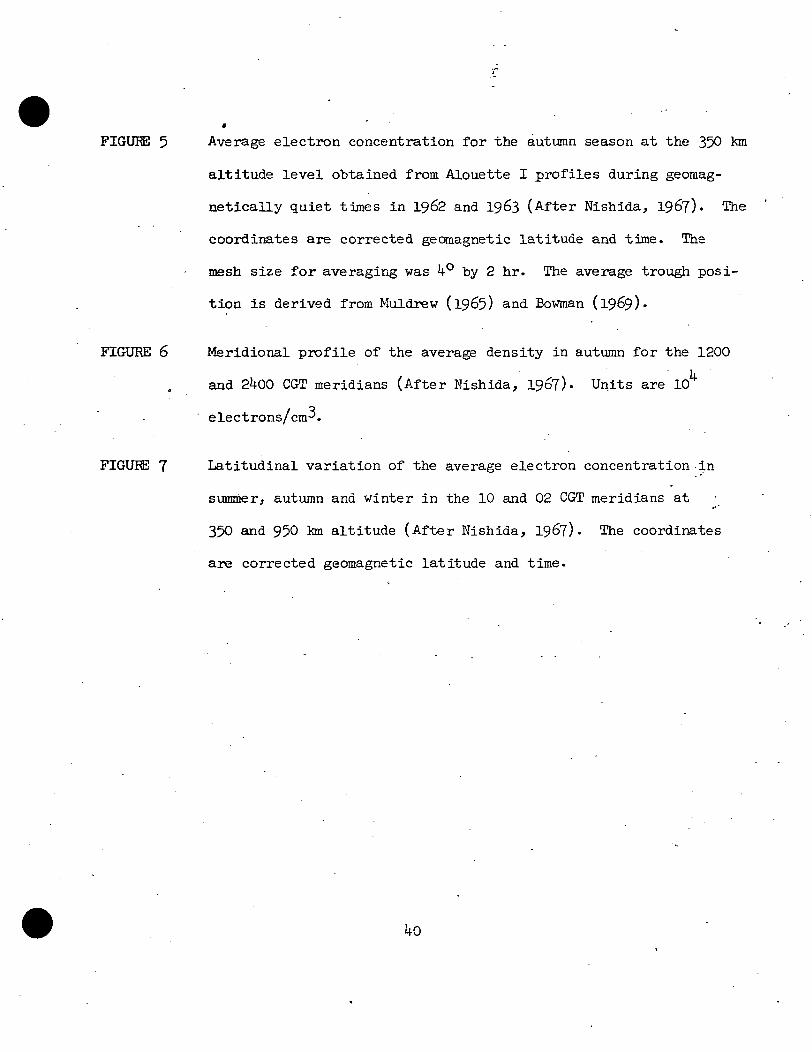
FIGURE 5 Average electron concentration for the autumn season at the 350 tan
altitude level obtained from Alouette I profiles during geomag-
neticaily quiet times in 1962 and 1963 (After Nishida, 1967). The
coordinates are corrected geomagnetic latitude and time. The
mesh size for averaging was *io by 2 hr. The average trough posi-
tion is derived from Muldrew (1965) and Bowman (1969).
FIGURE 6 Meridional profile of the average density in autumn for the 1200
and 2̂ 00 CGT meridians (After Nishida, 196?). Units are 10
electrons/cm-^.
FIGURE 7 Latitudinal variation of the average electron concentration in
summer, autumn and winter in the 10 and 02 CGT meridians at**'
350 and 950 km altitude (After Nishida, 1967). The coordinates
are corrected geomagnetic latitude and time.
50°A(CGL)
CONVECTION FLOW LINES
SOFT ELECTRON PRECIPITATION ZONE
LIMIT OF CLOSED FIELD LINESSTAGNATION POINT
PLASMA PAUSE
h06
Figure 1
1000
800
~ 600
LJO
t 400h-
200
PRIOR TO EXIT FROMCLEFT
PRIOR TOENTRY INTO CLEFT
I I
10 10° 10
ELECTRON CONCENTRATION (CM'3)
Figure 2
800
700
600
500
UJo
400
300
200
100
\
INV. LAT.74°76°
COMPUTED IONOSPHERES.Z.A. SOFT PART INPUT
NONE -1YES
OBSERVED IONOSPHERE
10 )5 106
ELECTRON CONCENTRATION (CM~3)
10'
Figure 3
12CGT
18H
CGL
f0F2(MHz)CONVECTION FLOW LINES
Figure U
12CGT
14 ELECTRON CONCENTRATION (104CM~3)
*•— CONVECTION FLOW LINES
////////////////////////// AVERAGE TROUGH POSITION
06.
V
Figure 5
roiEo
2O
o:
UJo
2Ocrh-oUJ-JLJ
uo•H
1H9I3H
2O
5o:h-2:LUJTo?2 2O O°«2 2o ^o:oUJ-JLU
50
10
0.5
350km
950km
SUMMER 1AUTUMNWINTER
*
SUMMERAUTUMN
-WINTER
350km
950km
100
50
40 50 60 70 8090N 90N 80 70 60 50 4010CGT MERIDIAN 02CGT MERIDIAN
10
5
10.5
).1
Figul-e 1