Embed Size (px)
Citation preview

C
Mgr
Sa
Wb
a
ARRAA
KGMMING
1
coootcbtmfi
h0
ARTICLE IN PRESSG ModelHROMA-355365; No. of Pages 9
Journal of Chromatography A, xxx (2014) xxx–xxx
Contents lists available at ScienceDirect
Journal of Chromatography A
j o ur na l ho me page: www.elsev ier .com/ locate /chroma
agnetic solid phase extraction based on magnetite/reducedraphene oxide nanoparticles for determination of trace isocarbophosesidues in different matrices
han Yana, Ting-Ting Qia, De-Wen Chenb, Zhao Lia, Xiu-Juan Lia,∗, Si-Yi Pana
Key Laboratory of Environment Correlative Dietology (Ministry of Education), College of Food Science & Technology, Huazhong Agricultural University,uhan 430070, China
National Center of Quality Supervision and Inspection for Commodity, Yiwu, Zhejiang 322000, China
r t i c l e i n f o
rticle history:eceived 19 February 2014eceived in revised form 20 April 2014ccepted 22 April 2014vailable online xxx
eywords:rapheneagnetiteagnetic solid phase extraction
socarbophosanoparticlesas chromatography
a b s t r a c t
A simple one-step solvothermal method was applied for the preparation of magnetite/reduced grapheneoxide (MRGO), and the synthetic nanocomposites with a magnetic particle size of ∼8 nm were used as anadsorbent for magnetic solid phase extraction of isocarbophos (ICP) in different sample matrices prior togas chromatography (GC) detection. The identity of the nanomaterial was confirmed using Fourier trans-form infrared spectroscopy, X-ray diffraction, scanning electron microscopy and transmission electronmicroscopy. It was shown that Fe3O4 nanoparticles with a uniform size were homogeneously anchoredon RGO nanosheets. Increased oxidation degrees of graphite oxide, big particle sizes and large loadingamounts of Fe3O4 on the surface of RGO led to a decrease of adsorption capacity of MRGO to ICP. Theadsorption behavior of this adsorbent was better fitted by the pseudo-second-order kinetic model. Sev-eral parameters affecting the extraction efficiency were investigated and optimized, including adsorbentdosage, extraction time, ionic strength and desorption conditions. And then, a rapid and effective methodbased on MRGO combined with GC was developed for the determination of ICP in aqueous samples. Alinear range from 0.05 to 50 ng mL−1 was obtained with a high correlation coefficient (R2) of 0.9995, and
−1
the limit of detection was found to be 0.0044 ng mL . This method was successfully applied to the anal-ysis of ICP in five kinds of samples, including apple, rice, lake water, cowpea and cabbage. The recoveriesin different sample matrices were in the range from 81.00% to 108.51% with relative standard deviationsless than 9.72%. It can be concluded that the proposed analytical method is highly-efficient, sensitive,precise, accurate and practicable.© 2014 Elsevier B.V. All rights reserved.
. Introduction
Sample pretreatment prior to instrumental analysis is a cru-ial step in a whole analytical process, especially in the analysisf trace analytes in complex matrices. To date, a variety of meth-ds have been developed for the separation and preconcentrationf the target compounds from various samples [1]. Among theseechnologies, solid phase extraction (SPE) is one of the most wel-omed technologies because it is cost-effective, eco-friendly, littley-product, high performing, and simple to operate [2]. However,
Please cite this article in press as: S. Yan, et al., J. Chromatogr. A (2014
he process in SPE is also time-consuming. In recent years, a newode of SPE, based on the use of magnetic or magnetically modi-
ed adsorbents termed as magnetic solid-phase extraction (MSPE),
∗ Corresponding author. Tel.: +86 27 87282111; fax: +86 27 8728 8373.E-mail addresses: [email protected], [email protected] (X.-J. Li).
ttp://dx.doi.org/10.1016/j.chroma.2014.04.073021-9673/© 2014 Elsevier B.V. All rights reserved.
has been developed [3]. In comparison with traditional SPE, MSPEhas several advantages. The separation process in MSPE can beperformed directly in crude samples containing suspended solidmaterials by applying an external magnet without the need of addi-tional centrifugation, filtration or gravitational separation, whichgreatly facilitates the extraction process [4].
Magnetic separation based on the superparamagnetic ferrifer-rous oxide (Fe3O4) is obviously much more convenient, economicand efficient [5]. Fe3O4 nanoparticles have been widely usedbecause of their good biocompatibility, strong superparamagneticproperty, catalytic activity, eco-friendliness, low toxicity and lowcost. However, Fe3O4 nanoparticles have drawbacks of severeaggregation between particles and poor cyclic stability, which
), http://dx.doi.org/10.1016/j.chroma.2014.04.073
restrict their application. In addition, it is necessary to furtherimprove the selectivity and extraction capacity of Fe3O4 nanopar-ticles to adapt to various targets. To alleviate these problems, greatefforts have been made to modify Fe3O4 nanoparticles, such as

ING ModelC
2 atogr.
c[ms
tsiwnhavfbcdggtsnFban[[
nhdmMnnttgnfsCp9tchigi
tw�catptWtnoot
ARTICLEHROMA-355365; No. of Pages 9
S. Yan et al. / J. Chrom
hitosan/Fe3O4 [6], carbon nanotube/Fe3O4 [7], graphene/Fe3O48,9] and core–shell structured Fe3O4 [10–12]. Among these
aterials, graphene is one of the most excellent candidates in con-tructing new types of magnetic composite materials.
Graphene, a single-atom-thick sheet of honeycomb carbonlat-ice, possesses extraordinary properties, such as large reversiblepecific capacity, remarkable surface area, excellent conductiv-ty and many other unique physical and chemical properties,
hich provide it with a wide range of applications in many tech-ological fields [13]. However, pristine graphene sheets with aigh specific surface area tend to form irreversible agglomer-tes or even restack to form graphite through �-stacking andan der Waals interactions if the sheets are not well separatedrom each other, which will reduce the surface area, and is noteneficial for the adsorption of contaminants. Therefore, chemi-al modification of graphene is the most efficient means to fullyevelop its excellent properties. Graphene oxide (GO) and reducedraphene oxide (RGO) play important roles in the preparation ofraphene-based materials. The properties of one-atom-thick andwo-dimensional plane structure endow GO and RGO with highpecific surface area, which can immobilize large amounts of Fe3O4anoparticles, prevent their aggregation and further bestow one3O4 some new properties and function. Up to now, graphene-ased Fe3O4 nanocomposites have become a hot topic of researchnd exhibit attractive application prospects in magnetic reso-ance imaging [14], drug delivery [15], environmental remediation16], electrode material [17], and magnetic controlled switches18].
In the past few years, the application based on graphene/Fe3O4anocomposites in sample preparation to sorb trace analytesas also received more and more attention. Sun et al. [19]eveloped a simple one-step solvothermal strategy to prepareagnetite/reduced graphene oxide (MRGO) nanocomposites. TheRGO was fabricated by simultaneously forming superparamag-
etic Fe3O4 nanoparticles and reducing GO. In this process, Fe3O4anoparticles were homogeneously anchored onto the surface ofhe graphene sheets with the aid of –COOH on GO, which preventedhe agglomeration of Fe3O4 nanoparticles and inhibited theirrowth. The average particle size of Fe3O4 was 9 nm. These MRGOanocomposites exhibited excellent removal efficiency (over 94%
or malachite green and over 91% for rhodamine B) and rapideparation from aqueous solution by an external magnetic field.handra et al. [20] synthesized MRGO composites with magnetitearticle size of 10 nm. The composites showed near complete (over9.9%) arsenic removal within 1 ppb. Ai et al. [21] investigatedhe adsorption abilities of the graphene nanosheets (GNS)/Fe3O4omposite, GNS and Fe3O4. The results demonstrated that Fe3O4ad much poorer ability to sorb methylene blue molecule compar-
ng with GNS/Fe3O4 and GNS, indicating that the introduction ofraphene greatly increased the adsorption capacity of the compos-tes.
As far as we know, MRGO is usually applied as adsorbents tohe disposal of metal ions [22–24] and benzenoid compounds fromastewater [25–28]. On the one hand, with a large delocalized-electron system, graphene can interact with the benzene ring
ompounds through strong �–� stacking interaction, so it can serves a good adsorbent for aromatic compounds. On the other hand,he oxygen-containing functional groups on RGO have strong com-lexation capacities with metal ions, and therefore, it is appropriateo remove radionuclides and heavy metal ions from wastewater.
hat’s more, Fe3O4 particles can also adsorb contaminants due toheir surface property, large specific surface area and small inter-
Please cite this article in press as: S. Yan, et al., J. Chromatogr. A (2014
al diffusion resistance. Hence, it is significant to study the effectf the oxidation levels of graphite oxide, the size and distributionf Fe3O4 on RGO on adsorption. However, to our best knowledge,he research on these aspects is very few.
PRESSA xxx (2014) xxx–xxx
As a common and broad-spectrum organophosphorus pesticide(OPP), isocarbophos (ICP) has been considered as one of the mostfrequently detected OPPs residues in rice, cotton, fruit and othercrops [29]. The excessive use has a deleterious effect on humansand the environment and its presence in food is particularly dan-gerous. Hence, it is of great importance to develop an eco-friendly,simple, sensitive and economical method for the separation anddetermination of ICP.
In this paper, a simple one-step solvothermal strategy usingnon-toxic and cost-effective precursors has been developed toprepare MRGO nanocomposites for separation of ICP from differentsamples. The as-prepared MRGO was characterized by transmis-sion electron microscopy (TEM), scanning electron microscopy(SEM), X-ray diffraction (XRD), and Fourier transform infrared spec-troscopy (FTIR). The effects of the oxidation levels of graphite oxide,the particle sizes and distribution of Fe3O4 on RGO on adsorp-tion performance were investigated. The adsorption mechanism ofmagnetic nanocomposites applying kinetic models was discussed.The impacts of some experimental factors on their adsorptionpower were figured out. Coupling this MSPE technique with GCseparation and detection, a highly simple and sensitive analyticalmethod to determine ICP was established.
2. Experimental
2.1. Chemicals, standard solutions and real samples
Graphite powder, potassium permanganate, sulphuric acid(H2SO4), hydrogen peroxide (H2O2, 30%), hydrochloric acid (HCl),anhydrous ferric chloride (FeCl3), sodium acetate (NaOAc), diethyl-ene glycol (DEG), ethanol, acetonitrile, methanol, sodium chloride(NaCl), acetone, and dichloromethane were purchased fromSinopharm Chemical Reagent Co., Ltd. (Shanghai, China). Graphitepowder was of spectroscopically pure grade, and all of the otherreagents were of analytical grade and used without further purifi-cation. Deionized water was used throughout the work.
ICP with the purity of 99% was purchased from Helishun Tech-nology Co., Ltd. (Beijing, China). The stock solution of ICP wasprepared in methanol at a concentration of 1 mg mL−1. Workingstandard solutions of ICP were prepared by diluting the stock solu-tion with methanol. All of the solutions were stored at 4 ◦C in arefrigerator.
Four kinds of real samples (apple, cabbage, cowpea and rice)were randomly purchased from a local market (Wuhan, China);lake water was collected from the South Lake (Wuhan, China). 50 gof cabbage, apple and cowpea were homogenized along with 50,50 and 100 mL of deionized water using a juice extractor (PhilipsChina Co., Guangzhou, China), respectively. The rice sample waspowdered using a cyclone mill (Taisite Instrument Co., Tianjin,China) and passed through an 80 mesh sieve. Subsequently, 20 gof processed rice were diluted with 100 mL of deionized water. Thewater sample was filtered through a 0.45-�m membrane to elim-inate particulate matters before analysis. The processed sampleswere then placed in separate amber glass bottles and stored in afreezer at 4 ◦C until analysis.
2.2. Apparatus and chromatographic conditions
XRD measurements were carried out on a Bruker D8-AdvanceX-ray diffractometer (Bruker, Germany) using Cu K� radiation(� = 0.1514 nm) at a generator voltage of 40 kV and a generator cur-
), http://dx.doi.org/10.1016/j.chroma.2014.04.073
rent of 40 mA. The scattering angles (2�) were in the range of 5–80◦
with a scanning velocity of 10◦ min−1. TEM analysis was obtainedusing a Philip CM 12 transmission electron microscope (Philip,Netherlands) operated at 120 kV. SEM images were recorded on

IN PRESSG ModelC
atogr. A xxx (2014) xxx–xxx 3
acN
cncd5thwtt1
2o
adtuAotmwwwpfsdsHof
watw
2s
iDeGsatga1tlpfiw
Table 1Different synthesis conditions for MRGO nanocomposites.
MRGO Degrees of oxidation ofgraphite oxidea
Solvothermal reactionb
m1:m2 T1 (min) T2 (h) m3:m4
MRGO-1 1:6 30 4 1:1.5MRGO-2 1:6 30 6 1:1.5MRGO-3 1:6 30 8 1:1.5MRGO-4 1:3 30 4 1:1.5MRGO-5 1:4.5 30 4 1:1.5MRGO-6 1:3 15 4 1:1.5MRGO-7 1:3 60 4 1:1.5MRGO-8 1:3 30 4 1:1MRGO-9 1:3 30 4 1:2MRGO-10 1:3 30 4 1:3
a T1, the reaction time of high temperature stage; m1, the mass of graphite; m2,
ARTICLEHROMA-355365; No. of Pages 9
S. Yan et al. / J. Chrom
Zeiss supra55 field-emission SEM system. Infrared analyses wereonducted with a Nicolet Nexus 470 FTIR spectrometer (Thermoicolet, USA) where KBr was used to prepare the sample tablets.
The chromatographic analysis was performed on an SP-6890Aapillary GC system (Shandong Lunan Ruihong Chemical Engi-eering Instrument Co., Ltd., Tengzhou, China) equipped with aapillary split/splitless injector system and a nitrogen phosphorusetector (NPD) system. Separations were accomplished on an SE-4 capillary column (30 m × 0.32 mm × 0.33 �m, Lanzhou ATECHechnologies Co., Ltd., Lanzhou, China). The oven temperature waseld at 150 ◦C and then increased to 230 ◦C at a rate of 10 ◦C min−1,here the temperature was held for 9 min. The temperatures of
he injector and the detector were set at 250 ◦C and 270 ◦C, respec-ively. Nitrogen (99.999%) was used as carrier gas at a flow rate of2–15 cm s−1 for all the analyses.
.3. Preparation of graphite oxide with different degrees ofxidation
Graphite oxide was synthesized from natural graphite powderccording to a modified Hummers method [30]. The procedure isescribed as follows. Graphite powder (2 g) was put into a 1000 mLhree-neck flask containing cold (0 ◦C) concentrated H2SO4 (80 mL)nder vigorous stirring to avoid agglomeration inside an ice bath.fter the graphite powder was well dispersed, the required amountf KMnO4 was added slowly to the mixture. Meanwhile, the reac-ion temperature was controlled to below 10 ◦C by cooling. The
ixture continued to react in this condition for 4 h. The ice bathas then removed and the solution was transferred to a (35 ± 5)◦Cater bath and stirred for about 1 h. After that, 160 mL of deionizedater was gradually added and the solution was stirred at a tem-erature of 90 ◦C for a period of time. Afterwards, the mixture wasurther diluted with 480 mL of deionized water and then a 30 wt%olution of H2O2 was added, turning the color of the solution fromark brown to bright yellow. Finally, the resulting graphite oxideuspension was washed by repeated centrifugation, first with 5 %Cl aqueous solution and then with deionized water until the pHf the solution became neutral. The resulted solid was dried underreeze vacuum for 24 h.
The amount of oxygenated functional groups in graphite oxideas varied by changing the amount of KMnO4 from 3 to 6 g with
n increment of 1.5 g per oxidation level, and setting the reactionime of high-temperature stage at 15, 30 and 60 min, respectively,hile the other parameters in the reaction were kept constant.
.4. Synthesis of MRGO nanocomposites with different particleizes and loading amounts of Fe3O4 nanoparticles
Typical synthesis of MRGO nanocomposites was carried outn a solvothermal system using FeCl3 and GO as precursors andEG as a solvent and reducing agent. Graphite oxide (34 mg) wasxfoliated by ultrasonication in DEG (10 mL) for 3 h to produceO dispersion. Certain quantities of FeCl3 and NaOAc were dis-olved in DEG (24 mL) via ultrasonication for 10 min to produce
transparent solution. Then, the GO dispersion was added intohe solution, followed by ultrasonication for 1 h to obtain a homo-eneous suspension. After that, the mixture was transferred into
50 mL Teflon-lined stainless-steel autoclave and maintained at90 ◦C for a certain period of time, and then cooled naturallyo ambient temperature. The resulting nanocomposites were col-ected by applying an external magnetic field. Finally, the black
Please cite this article in press as: S. Yan, et al., J. Chromatogr. A (2014
roduct was thoroughly rinsed with ethanol and deionized wateror several times, and dried in vacuum at 60 ◦C for 24 h. For compar-son, Fe3O4 nanoparticles were synthesized via the same method
ithout adding graphite oxide.
the mass of KMnO4.b T2, the solvothermal reaction time; m3, the mass of graphite oxide; m4, the mass
of FeCl3.
MRGO nanocomposites with different Fe3O4 particle sizes andloadings were synthesized by simply varying the solvothermalreaction time (4, 6, and 8 h) and the amount of FeCl3 (34, 68,and 102 mg) while the other experimental conditions were keptunchanged. Different conditions are listed in Table 1.
2.5. MSPE procedure
MSPE was carried out by using MRGO as an adsorbent to extractICP from aqueous samples. Typically, 20 mL of ICP solution ofdesired initial concentration (or sample) and 20 mg of MRGO wereadded into a 50-mL centrifuge tube and then the tube was shakenon a platform shaker under ambient temperature. At the com-pletion of preset time intervals, the solid and liquid phases wereseparated by the aid of a permanent magnet and the supernatantwas discarded. After that, the residual solution and MRGO weretotally transferred to a 2-mL centrifuge tube. The adsorbent wasgathered again by depositing a magnet at the outside of tubewall in order to completely remove the residual solution. Afterbeing washed with deionized water to remove impurities that mayexist, the preconcentrated target analytes were desorbed from theisolated MRGO with 0.5 mL of mixed solvents of methanol and ace-tonitrile (1:1, v/v) by vigorously vortexing for 1 min. Afterwards,the desorption solution was collected by placing a magnet to theoutside of the centrifuge tube. The same desorption procedure wasoperated another three times. The supernatant solutions were com-bined together and totally transferred to a 4-mL centrifuge tube,and then evaporated to dryness under a gentle stream of nitrogen.The residue was reconstituted in 50 �L of methanol, and 1 �L wasinjected into the GC system for analysis.
Ultrasound was also introduced to investigate the effect of themode of elution on desorption efficiency. It was proceeded byreplacing vortex processing mode with ultrasound (100 W, 1 min).
3. Results and discussion
3.1. Characterization of MRGO
Infrared spectra were performed to characterize graphite oxideand MRGO. Fig. 1 shows the FTIR spectra of graphite, graphiteoxide and MRGO. In graphite oxide spectrum, the strong andbroad absorption at 3396.61 cm−1 corresponds to O H stretch-ing vibration, the absorption peak appearing at 1723.39 cm−1 is
), http://dx.doi.org/10.1016/j.chroma.2014.04.073
attributed to C O stretching of COOH groups, the absorption at1619.89 cm−1 is due to O H bending vibration, epoxide groupsand skeletal ring vibrations, and the other three vibrational bandslocated at 1409.56 cm−1, 1225.65 cm−1 and 1058.78 cm−1 can be

ARTICLE IN PRESSG ModelCHROMA-355365; No. of Pages 9
4 S. Yan et al. / J. Chromatogr. A xxx (2014) xxx–xxx
aCIoottaatvb5c
gwaag
Fig. 1. Infrared spectra of graphite, graphite oxide and MRGO.
ssigned to COO− symmetric vibration, epoxy C O and alkoxyO stretching vibrations, respectively [31]. The characteristic
R features of graphite oxide indicate the presence of abundantxygen-containing functional groups on the surface of graphitexide, confirming the successful oxidation of graphite. The IR spec-rum of MRGO differs from that of graphite oxide as evidenced byhe disappearance of C O and epoxy C O stretching vibrationsnd the dramatic decrease in the intensities of the characteristicbsorption bands of O H and alkoxy C O. The absorption bandhat appears at 1570.84 cm−1 may be attributed to the skeletalibration of the graphene sheets. It can be concluded that GO hadeen reduced to graphene sheets. In addition, a sharp peak around79.4 cm−1 can be ascribed to lattice absorption of iron oxide, indi-ating that Fe3O4 was successfully grafted on RGO.
To obtain the phase and structure information about graphite,raphite oxide and as synthesized MRGO, powder XRD patterns
Please cite this article in press as: S. Yan, et al., J. Chromatogr. A (2014
ere conducted. As shown in Fig. 2, the graphite powder exhibits typical sharp (0 0 2) diffraction peak at 26.7◦ corresponding ton interlayer distance of 0.316 nm. After oxidation treatment, theraphite peak disappears and is replaced by a sharp diffraction
Fig. 2. XRD patterns of graphite (a), graphite oxide (b) and MRGO (c).
Fig. 3. TEM images of GO (a) and MRGO (b). The synthesis conditions were describedbelow: the mass ratio of graphite oxide to FeCl3 was 1:1, and the solvothermalreaction time was 4 h.
peak at 2� = 11.6◦ (d = 0.76 nm), resulting from the typical diffrac-tion peak of graphite oxide nanosheets. When in situ conversion ofFeCl3 to Fe3O4 and simultaneous reduction of GO into RGO in DEGsolution were achieved, the graphite oxide peak disappears andseven diffraction lines are observed in the representative XRD pat-tern of Fe3O4 at 2� = 30.2◦, 35.5◦, 43.2◦, 53.5◦, 57.2◦, 62.6◦, 74.1◦.These diffraction peaks can be indexed to (2 2 0), (3 1 1), (4 0 0),(4 2 2), (5 1 1), (4 4 0) and (5 3 3) planes, respectively, of the cubicphase Fe3O4 (JCPDS card NO. 19-0629) with a face-centered cubicstructure [32]. These results suggest the presence of Fe3O4 on RGO,which is consistent with the FTIR results. In addition, the broaddiffraction peaks are indications of the nanoparticles with verysmall sizes.
The morphology and structure of GO and MRGO were inves-tigated by SEM and TEM. In Fig. 3a, the copper grid substrateswere covered with large flakes of GO with a few layers thick, con-firming that the GO sheets had been exfoliated. Furthermore, theGO sheet exhibited a smooth surface, an irregular shape and somewrinkles, which maintained a large surface area. From Fig. 3b, TEMimage of MRGO showed significant changes in the surface morphol-ogy and roughness, visually demonstrating the presence of Fe3O4nanoparticles. The Fe3O4 nanoparticles with an average size of8 nm were homogeneously assembled on the surface of RGO sheets,and no big conglomeration of Fe3O4 particles or large vacancy onRGO is observed. In addition, it can be observed that the Fe3O4nanoparticles are still strongly deposited on the surface of RGOsheets even after a long time of sonication during the preparationof the TEM specimen, indicating the strong interaction betweenFe3O4 nanoparticles and RGO sheets. The SEM measurement (Fig. 4)showed that the nanocomposites possessed a three-dimensionalmorphology. The large RGO flakes exhibited slightly wrinkled sur-face and the Fe3O4 nanoparticles appeared as bright dots, denselyand evenly deposited on both sides of RGO sheets.
3.2. Optimization of the synthesis conditions of MRGO
The oxidation level of graphite oxide was varied by changingthe amount of KMnO4 and the reaction time of high tempera-ture. As shown in Fig. 5a and b, the adsorption ability decreasedas the degrees of oxidation of graphite oxide increased. In general,increased oxidation degrees will result in more oxygenated func-tional groups on the surface of GO, which leads to more loading
), http://dx.doi.org/10.1016/j.chroma.2014.04.073
sites for Fe3O4 nanoparticles. That is to say, the adsorption abilityof MRGO to ICP decreased as Fe3O4 loadings increased. Fig. 6a–cshows the TEM images of MRGO with different amounts of FeCl3.As can be seen, the Fe3O4 loadings increased as the amount of FeCl3

Please cite this article in press as: S. Yan, et al., J. Chromatogr. A (2014
ARTICLE ING ModelCHROMA-355365; No. of Pages 9
S. Yan et al. / J. Chromatogr.
Fig. 4. SEM image of MRGO. The synthesis conditions were the same as Fig. 3.
Fig. 5. Adsorption ability of MRGO synth
Fig. 6. TEM images of MRGO-8 (a), M
PRESSA xxx (2014) xxx–xxx 5
increased. But the increased loadings led to a decline of adsorptionability to ICP, as shown in Fig. 5c.
In addition, the effect of particle sizes of Fe3O4 was also stud-ied, and the results are shown in Fig. 5d. The size of the magnetitenanocrystals can be easily tuned by different reaction time [33].The average sizes of the obtained magnetite on RGO were 8, 11 and15 nm after reaction at 190 ◦C for 4 h, 6 h and 8 h, respectively. Asshown in Fig. 5d, the adsorption capacity of MRGO to ICP decreasedwith the increasing of the diameters of Fe3O4.
Figs. 5 and 6 demonstrated that increased oxidation degreesof graphite oxide, big particle sizes and large loading amounts ofFe3O4 on the surface of RGO led to a decrease of adsorption capac-ity of MRGO to ICP. It seemed that Fe3O4 contributed less to the
), http://dx.doi.org/10.1016/j.chroma.2014.04.073
adsorption than graphene, and mainly dedicated to the separationprocess in MSPE.
Fig. 7 compares the adsorption ability of GO, MRGO and Fe3O4.During the separation process, GO was collected by centrifugation.
esized under different conditions.
RGO-9 (b) and MRGO-10 (c).
ARTICLE ING ModelCHROMA-355365; No. of Pages 9
6 S. Yan et al. / J. Chromatogr.
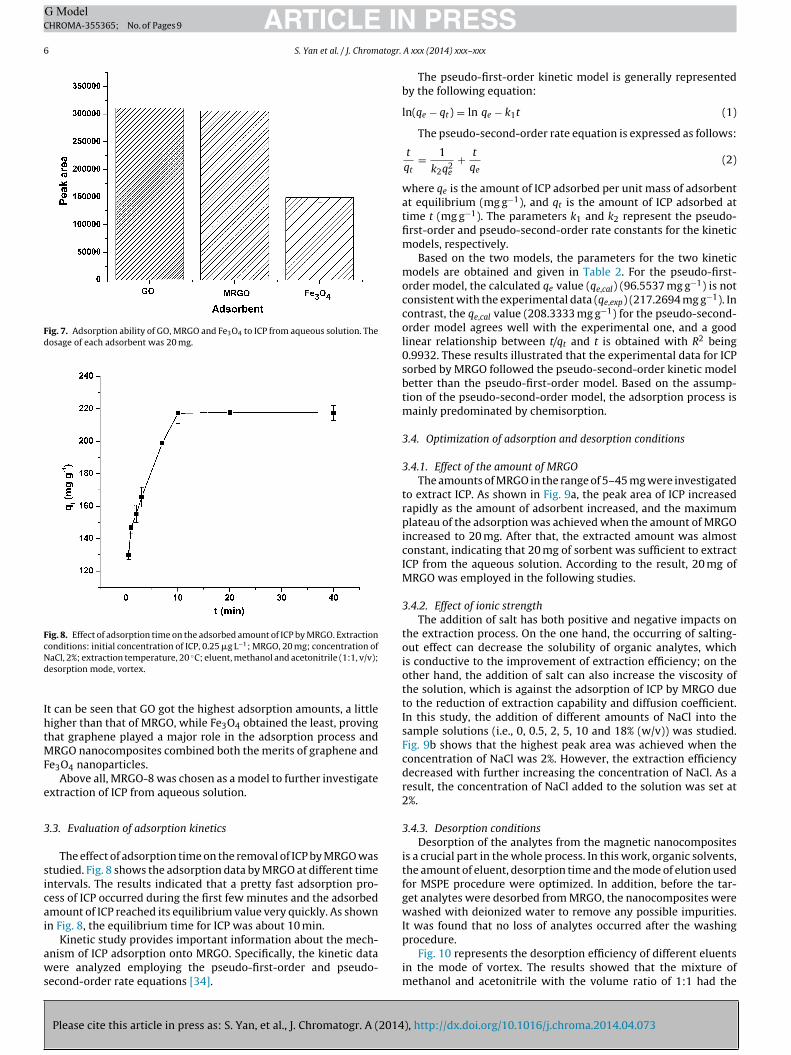
Fig. 7. Adsorption ability of GO, MRGO and Fe3O4 to ICP from aqueous solution. Thedosage of each adsorbent was 20 mg.
Fig. 8. Effect of adsorption time on the adsorbed amount of ICP by MRGO. Extractionconditions: initial concentration of ICP, 0.25 �g L−1; MRGO, 20 mg; concentration ofNd
IhtMF
e
3
sicai
aws
procedure.
aCl, 2%; extraction temperature, 20 ◦C; eluent, methanol and acetonitrile (1:1, v/v);esorption mode, vortex.
t can be seen that GO got the highest adsorption amounts, a littleigher than that of MRGO, while Fe3O4 obtained the least, provinghat graphene played a major role in the adsorption process and
RGO nanocomposites combined both the merits of graphene ande3O4 nanoparticles.
Above all, MRGO-8 was chosen as a model to further investigatextraction of ICP from aqueous solution.
.3. Evaluation of adsorption kinetics
The effect of adsorption time on the removal of ICP by MRGO wastudied. Fig. 8 shows the adsorption data by MRGO at different timentervals. The results indicated that a pretty fast adsorption pro-ess of ICP occurred during the first few minutes and the adsorbedmount of ICP reached its equilibrium value very quickly. As shownn Fig. 8, the equilibrium time for ICP was about 10 min.
Kinetic study provides important information about the mech-
Please cite this article in press as: S. Yan, et al., J. Chromatogr. A (2014
nism of ICP adsorption onto MRGO. Specifically, the kinetic dataere analyzed employing the pseudo-first-order and pseudo-
econd-order rate equations [34].
PRESSA xxx (2014) xxx–xxx
The pseudo-first-order kinetic model is generally representedby the following equation:
ln(qe − qt) = ln qe − k1t (1)
The pseudo-second-order rate equation is expressed as follows:
t
qt= 1
k2q2e
+ t
qe(2)
where qe is the amount of ICP adsorbed per unit mass of adsorbentat equilibrium (mg g−1), and qt is the amount of ICP adsorbed attime t (mg g−1). The parameters k1 and k2 represent the pseudo-first-order and pseudo-second-order rate constants for the kineticmodels, respectively.
Based on the two models, the parameters for the two kineticmodels are obtained and given in Table 2. For the pseudo-first-order model, the calculated qe value (qe,cal) (96.5537 mg g−1) is notconsistent with the experimental data (qe,exp) (217.2694 mg g−1). Incontrast, the qe,cal value (208.3333 mg g−1) for the pseudo-second-order model agrees well with the experimental one, and a goodlinear relationship between t/qt and t is obtained with R2 being0.9932. These results illustrated that the experimental data for ICPsorbed by MRGO followed the pseudo-second-order kinetic modelbetter than the pseudo-first-order model. Based on the assump-tion of the pseudo-second-order model, the adsorption process ismainly predominated by chemisorption.
3.4. Optimization of adsorption and desorption conditions
3.4.1. Effect of the amount of MRGOThe amounts of MRGO in the range of 5–45 mg were investigated
to extract ICP. As shown in Fig. 9a, the peak area of ICP increasedrapidly as the amount of adsorbent increased, and the maximumplateau of the adsorption was achieved when the amount of MRGOincreased to 20 mg. After that, the extracted amount was almostconstant, indicating that 20 mg of sorbent was sufficient to extractICP from the aqueous solution. According to the result, 20 mg ofMRGO was employed in the following studies.
3.4.2. Effect of ionic strengthThe addition of salt has both positive and negative impacts on
the extraction process. On the one hand, the occurring of salting-out effect can decrease the solubility of organic analytes, whichis conductive to the improvement of extraction efficiency; on theother hand, the addition of salt can also increase the viscosity ofthe solution, which is against the adsorption of ICP by MRGO dueto the reduction of extraction capability and diffusion coefficient.In this study, the addition of different amounts of NaCl into thesample solutions (i.e., 0, 0.5, 2, 5, 10 and 18% (w/v)) was studied.Fig. 9b shows that the highest peak area was achieved when theconcentration of NaCl was 2%. However, the extraction efficiencydecreased with further increasing the concentration of NaCl. As aresult, the concentration of NaCl added to the solution was set at2%.
3.4.3. Desorption conditionsDesorption of the analytes from the magnetic nanocomposites
is a crucial part in the whole process. In this work, organic solvents,the amount of eluent, desorption time and the mode of elution usedfor MSPE procedure were optimized. In addition, before the tar-get analytes were desorbed from MRGO, the nanocomposites werewashed with deionized water to remove any possible impurities.It was found that no loss of analytes occurred after the washing
), http://dx.doi.org/10.1016/j.chroma.2014.04.073
Fig. 10 represents the desorption efficiency of different eluentsin the mode of vortex. The results showed that the mixture ofmethanol and acetonitrile with the volume ratio of 1:1 had the

ARTICLE IN PRESSG ModelCHROMA-355365; No. of Pages 9
S. Yan et al. / J. Chromatogr. A xxx (2014) xxx–xxx 7
Fig. 9. Effect of the amounts of MRGO (a) and the ionic strength (b) on MSPE efficiency10 min; extraction temperature, 20 ◦C; eluent, methanol and acetonitrile (1:1, v/v); desor
Fig. 10. The effect of desorption solvents on the extraction efficiency of ICP.E −1
cd
sdtrMarecbsw
TP
xtraction conditions: initial concentration of ICP, 0.25 �g L ; MRGO, 20 mg; con-entration of NaCl, 2%; extraction time, 10 min; extraction temperature, 20 ◦C;esorption mode, vortex.
trongest desorption power among these eluents. The effect ofesorption solution volume was also investigated. Results revealedhat a complete desorption of ICP from MRGO could be achieved byinsing the adsorbent with each 0.5 mL of eluent for four times.eanwhile, the effect of desorption time was studied. The peak
reas after vortexing for 1 min and 3 min were 6102.5 and 6118.950,espectively, suggesting that desorption time had no obvious influ-nce on the desorption efficiency. The modes of elution were
Please cite this article in press as: S. Yan, et al., J. Chromatogr. A (2014
ompared using ultrasound and vortex. The amount of ICP desorbedy vortexing was 2.4 times bigger than that by the mode of ultra-ound, which could be attributed to the fact that oscillation vortexas more intense than ultrasound.
able 2arameters based on the pseudo-first-order and pseudo-second-order kinetic equations f
Analyte qe,exp (mg g−1) Pseudo first-order
qe,cal (mg g−1) K1 (min−1)
ICP 217.2694 96.5537 0.2324
. Extraction conditions: initial concentration of ICP, 0.25 �g L−1; extraction time,ption mode, vortex.
In summary, after extraction and separation, the MRGO waswashed with deionized water, and the ICP was desorbed fromMRGO by vortexing for 1 min with 0.5 mL of mixed eluent ofmethanol and acetonitrile (1:1, v/v) for four times.
3.5. Reusability of MRGO
In order to investigate the reusability of MRGO, the adsorbentwas reused for extraction of ICP after desorption of the analytesfrom MRGO. The peak areas of the first adsorption-desorption cycleand the tenth cycle were 174,658.1 and 156,193.297, respectively,indicating that MRGO can be reused at least 10 times without asignificant decrease of the sorption capacity. It can be seen thatMRGO nanocomposites have the advantage of reuse stability, whichcan significantly reduce the cost in sample preparation.
3.6. Validation of the MSPE-GC method
Several important parameters including linearity, correlationcoefficient (R2), limit of detection (LOD) and limit of quantifica-tion (LOQ) were determined to validate the method. Under theoptimized conditions, a series of standard solutions containing ICPat different concentration levels were prepared to establish thecalibration curve and a linear range from 0.05 to 50 ng mL−1 wasobtained with a high R2 value of 0.9995, indicating good linearity.The LOD and LOQ data were calculated at a signal-to-noise ratio ofthree (S/N = 3) and a signal-to-noise ratio of ten (S/N = 10), respec-tively. It was found to be 0.0044 and 0.0147 ng mL−1, respectively.In addition, the precision of the MSPE-GC method, expressed asrelative standard deviation (RSD), was assessed by three parallelextractions of ICP, and it was calculated as 1.77 %.
Table 3 compares the performance of the proposed method inthis study and other methods reported in literatures. It can beobserved that the MSPE-GC-NPD method has a lower detection
), http://dx.doi.org/10.1016/j.chroma.2014.04.073
limit and RSD in contrast with the methods mentioned above andthe samples used in this study have significant matrix difference,confirming that this method has high sensitivity, good repeatabilityand practicability.
or the adsorption of ICP on MRGO.
Pseudo second-order
R2 qe,cal (mg g−1) K2 (g mg−1 min−1) R2
0.9906 208.3333 0.0092 0.9932

ARTICLE IN PRESSG ModelCHROMA-355365; No. of Pages 9
8 S. Yan et al. / J. Chromatogr. A xxx (2014) xxx–xxx
Table 3Comparison of the proposed method with other methods for the determination of ICP.
Methods Linear range (ng mL−1) LOD (ng mL−1) R2 RSD (%) Matrices Ref.
DSPEa-GC–MS 7–200 1.6 0.9947 2.68–8.48 Peanut oil [35]USAEMEb-HPLC-DAD 1.0–200 0.1 0.9998 3.30 Well, rain, reservoir water [36]DSMEc-GC-FPD 0.1–100 0.03 0.9995 9.20 Wine [37]QuEChERSd-GC-FPD 20–1280 15.0 0.9994 3.43 Morinda roots [38]SDMEe-GC-FPD 10–500 2.2 0.9919 6.30 Orange juices [39]QuEChERS-SPE-LC–MS/MS 2–125 0.08–1.8 0.9993 3.9–9.2 Soil, water [40]MSPE-GC-NPD 0.05–50 0.0044 0.9995 1.77 Apple, cabbage, lake water, cowpea, rice This study
a DSPE: dispersive solid phase extraction.b USAEME: ultrasound-assisted emulsification microextraction.c DSME: dispersive suspended microextraction.d QuEChERS: quick, easy, cheap, effective, rugged and safe.e SDME: single drop microextraction.
Table 4Determination of ICP residues and recoveries in real samples.
Real samples Spiking level(ng g−1)
ICP
Found (ng g−1) RSD (%) Recovery (%)
Apple(n = 3)
0.00 nda
0.1 0.099 2.97 99.201.0 0.925 6.14 92.49
Cabbage(n = 3)
0.00 nd0.1 0.110 7.25 108.511.0 0.863 9.34 86.32
Lakewater(n = 3)
0.00 1.275 7.410.1 0.081 2.00 81.001.0 0.923 1.84 92.33
Cowpea(n = 3)
0.00 nd0.1 0.094 4.03 93.811.0 1.067 6.53 106.72
Rice(n = 3)
0.00 nd0.1 0.103 9.72 103.33
3
rTor
sdttfTtcp
4
scmTcna
[[
[
[
[
[
[[
[
[[
[[
[
[[
1.0 0.994 4.69 99.39
a nd, not detected.
.7. Analysis of real samples
The method was used for the determination of ICP in five kinds ofeal samples including apple, cabbage, cowpea, lake water and rice.he results are summarized in Table 4. Only a low concentrationf ICP (1.275 ng g−1) was found in the lake water sample and noesidues were detected in the other four samples.
To estimate the effect of the matrices, all of the samples werepiked at two concentration levels of ICP (0.1 and 1.0 ng g−1) toetermine the recovery of the targeted analyte. For each concen-ration level, three replicates were conducted. As shown in theable, satisfactory recoveries of ICP from five real samples, rangingrom 81.00% to 108.51% with RSDs less than 9.72%, were observed.he results demonstrated that these real sample matrices had lit-le interference with the performance of MRGO and it can also beoncluded that the MSPE-GC analytical method is highly-efficient,recise and accurate.
. Conclusions
MRGO was synthesized via a simple one-step solvothermaltrategy and charaterized by FTIR, XRD, SEM and TEM. The twoomponents of Fe3O4 and graphene endow the material withanipulative convenience as well as high adsorption capacity.
Please cite this article in press as: S. Yan, et al., J. Chromatogr. A (2014
hus, MRGO exhibited excellent extraction capability for ICP andould be conveniently separated from aqueous samples by an exter-al magnet. Low detection limit and satisfactory recoveries werechieved, indicating that the proposed MSPE-GC-NPD method is
[[
[[
very efficient and sensitive. In addition, different real samples werealso treated using MRGO, and the results demonstrated that sam-ple matrices had little interference with the performance of MRGO.The results suggest that MRGO has a potential application prospectin the determination of trace analytes.
Acknowledgements
This work was kindly supported by the Scientific andTechnological Project of Wuhan City of China (Program No.2013020501010171) and the National Natural Science Foundationof China (Program No. 30901007).
References
[1] J. Fenik, M. Tankiewicz, M. Biziuk, Trends Anal. Chem. 30 (2011) 814.[2] I. Ferrer, J.F. García-Reyes, M. Mezcua, E.M. Thurman, A.R. Fernández-Alba, J.
Chromatogr. A 1082 (2005) 81.[3] M. Safarııková, I. Safarıık, J. Magn. Magn. Mater. 194 (1999) 108.[4] L.M. Ravelo-Pérez, A.V. Herrera-Herrera, J. Hernández-Borges, M.Á. Rodríguez-
Delgado, J. Chromatogr. A 1217 (2010) 2618.[5] Q. Han, Z.H. Wang, J.F. Xia, S. Chen, X.Q. Zhang, M.Y. Ding, Talanta 101 (2012)
388.[6] A. Kaushik, P.R. Solanki, A.A. Ansari, S. Ahmad, B.D. Malhotra, Electrochem.
Commun. 10 (2008) 1364.[7] S. Song, R. Rao, H. Yang, H. Liu, A. Zhang, Nanotechnology 21 (2010) 185602.[8] J.H. Deng, X.R. Zhang, G.M. Zeng, J.L. Gong, Q.Y. Niu, J. Liang, Chem. Eng. J. 226
(2013) 189.[9] D.N. Huang, X.Y. Wang, C.H. Deng, G.X. Song, H.F. Cheng, X.M. Zhang, J. Chro-
matogr. A 1325 (2014) 65.10] J.R. Meng, J. Bu, C.H. Deng, X.M. Zhang, J. Chromatogr. A 1218 (2011) 1585.11] J.R. Meng, C.Y. Shi, B.W. Wei, W.J. Yu, C.H. Deng, X.M. Zhang, J. Chromatogr. A
1218 (2011) 2841.12] Z.B. Li, D.N. Huang, C.F. Fu, B.W. Wei, W.J. Yu, C.H. Deng, X.M. Zhang, J. Chro-
matogr. A 1218 (2011) 6232.13] V. Singh, D. Joung, L. Zhai, S. Das, S.I. Khondaker, S. Seal, Prog. Mater. Sci. 56
(2011) 1178.14] L.Z. Bai, D.L. Zhao, Y. Xu, J.M. Zhang, Y.L. Gao, L.Y. Zhao, J.T. Tang, Mater. Lett. 68
(2012) 399.15] X.Y. Yang, X.Y. Zhang, Y.F. Ma, Y. Huang, Y.S. Wang, Y.S. Chen, J. Mater. Chem.
19 (2009) 2710.16] W.N. Wang, R.Y. Ma, Q.H. Wu, C. Wang, Z. Wang, Talanta 109 (2013) 133.17] Q.H. Wang, L.F. Jiao, H.M. Du, Y.J. Wang, H.T. Yuan, J. Powder Sour. 245 (2014)
101.18] J.J. Liang, Y.F. Xu, D. Sui, L. Zhang, Y. Huang, Y.F. Ma, F.F. Li, Y.S. Chen, J. Phys.
Chem. C 114 (2010) 17465.19] H.M. Sun, L.Y. Cao, L.H. Lu, Nano Res. 4 (2011) 550.20] V. Chandra, J. Park, Y. Chun, J.W. Lee, I. Hwang, K.S. Kim, ACS Nano 4 (2010)
3979.21] L.H. Ai, C.Y. Zhang, Z.L. Chen, J. Hazard. Mater. 192 (2011) 1515.22] P.F. Zong, S.F. Wang, Y.L. Zhao, H. Wang, H. Pan, C.H. He, Chem. Eng. J. 220 (2013)
45.23] X.B. Luo, C.C. Wang, S.L. Luo, R.Z. Dong, X.M. Tu, G.S. Zeng, Chem. Eng. J. 187
(2012) 45.24] L. Zhou, H.P. Deng, J.L. Wan, J. Shi, T. Su, Appl. Surf. Sci. 283 (2013) 1024.25] Q.H. Wu, G.Y. Zhao, C. Feng, C. Wang, Z. Wang, J. Chromatogr. A 1218 (2011)
7936.
), http://dx.doi.org/10.1016/j.chroma.2014.04.073
26] Y.B. Luo, Z.G. Shi, Q. Gao, Y.Q. Feng, J. Chromatogr. A 1218 (2011) 1353.27] W.N. Wang, R.Y. Ma, Q.H. Wu, C. Wang, Z. Wang, J. Chromatogr. A 1293 (2013)
20.28] Q. Ye, L.H. Liu, Z.B. Chen, L.M. Hong, J. Chromatogr. A 1329 (2014) 24.29] D.H. Chen, Z.H. Song, H.R. Lv, Food Chem. 135 (2012) 2549.

ING ModelC
atogr.
[[
[[[[
[
[
[95 (2013) 33.
ARTICLEHROMA-355365; No. of Pages 9
S. Yan et al. / J. Chrom
30] W.S. Hummers, R.E. Offeman, J. Am. Chem. Soc. 80 (1958) 1339.31] Y.X. Ma, Y.F. Li, G.H. Zhao, L.Q. Yang, J.Z. Wang, X. Shan, X. Yan, Carbon 50 (2012)
2976.32] H.P. Cong, J.J. He, Y. Lu, S.H. Yu, Small 6 (2010) 169.
Please cite this article in press as: S. Yan, et al., J. Chromatogr. A (2014
33] L.L. Ren, S. Huang, W. Fan, T.X. Liu, Appl. Surf. Sci. 258 (2011) 1132.34] S. Lagergren, K. Sven, Vetenskapsakad. Handl. 24 (1898) 1.35] R. Su, X. Xu, X.H. Wang, D. Li, X.Y. Li, H.Q. Zhang, A.M. Yu, J. Chromatogr. B 879
(2011) 3423.36] C.X. Wu, N. Liu, Q.H. Wu, C. Wang, Z. Wang, Anal. Chim. Acta 679 (2010) 56.
[
[
PRESSA xxx (2014) xxx–xxx 9
37] Z.H. Yang, Y. Liu, Y.L. Lu, T. Wu, Z.Q. Zhou, D.H. Liu, Anal. Chim. Acta 706 (2011)268.
38] H.M. Liu, W.J. Kong, Y. Qi, B. Gong, Q. Miao, J.H. Wei, M.H. Yang, Chemosphere
), http://dx.doi.org/10.1016/j.chroma.2014.04.073
39] E.C. Zhao, L.J. Han, S.R. Jiang, Q.X. Wang, Z.Q. Zhou, J. Chromatogr. A 1114 (2006)269.
40] Y.B. Li, F.S. Dong, X.G. Liu, J. Xu, X. Chen, Y.T. Han, X.Y. Liang, Y.Q. Zheng, J.Hazard. Mater. 250–251 (2013) 9.