Embed Size (px)
Citation preview
Magnetic Resonance Spectroscopy – from fundamental developments to improved non-
invasive diagnosis and characterisation of children’s brain tumours.
IOP Medical Physics Group Scientific and Networking Meeting 1st December 2014
Martin Wilson
Outline
• Introduction to MRI/MRS.
• Quantitive MRS and decision support systems.
• Future challenges for translating MRS into a clinical tool.
Nuclear Magnetic Resonance (NMR)
• MRI and MRS are both based on the principle of nuclear magnetic resonance.
• NMR allows the detection of signals from nuclei with non-zero spin (intrinsic magnetic moment).
• Due to their high sensitivity and natural abundance in tissue - 1H and 31P are the most commonly observed nuclei in-vivo.
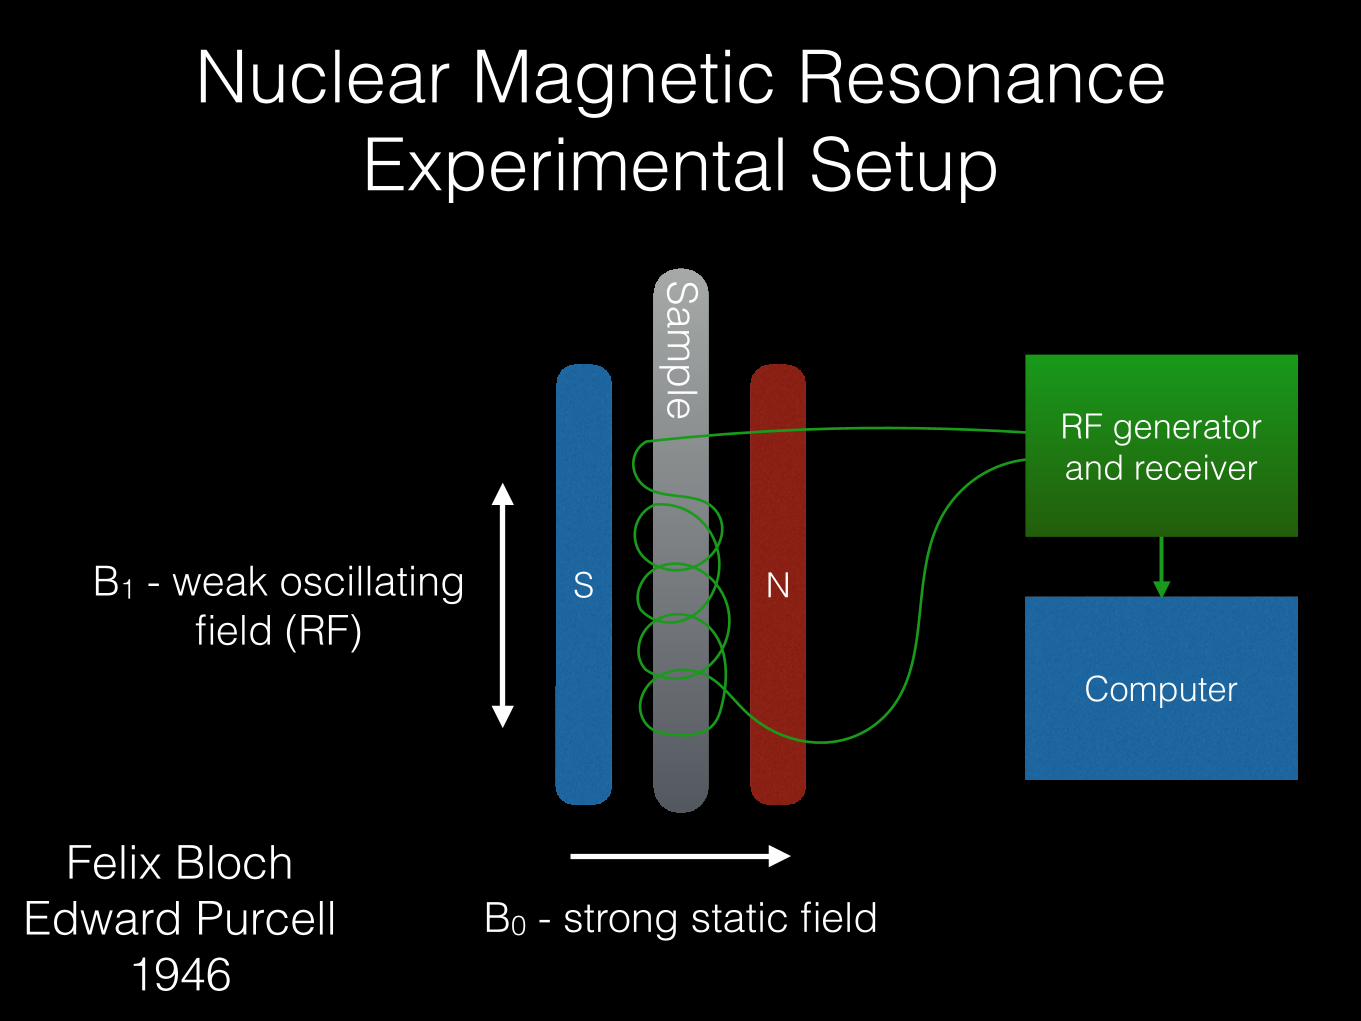
Nuclear Magnetic Resonance Experimental Setup
B1 - weak oscillating field (RF)
S N
B0 - strong static field
Sample
Computer
Felix Bloch Edward Purcell
1946
RF generator and receiver
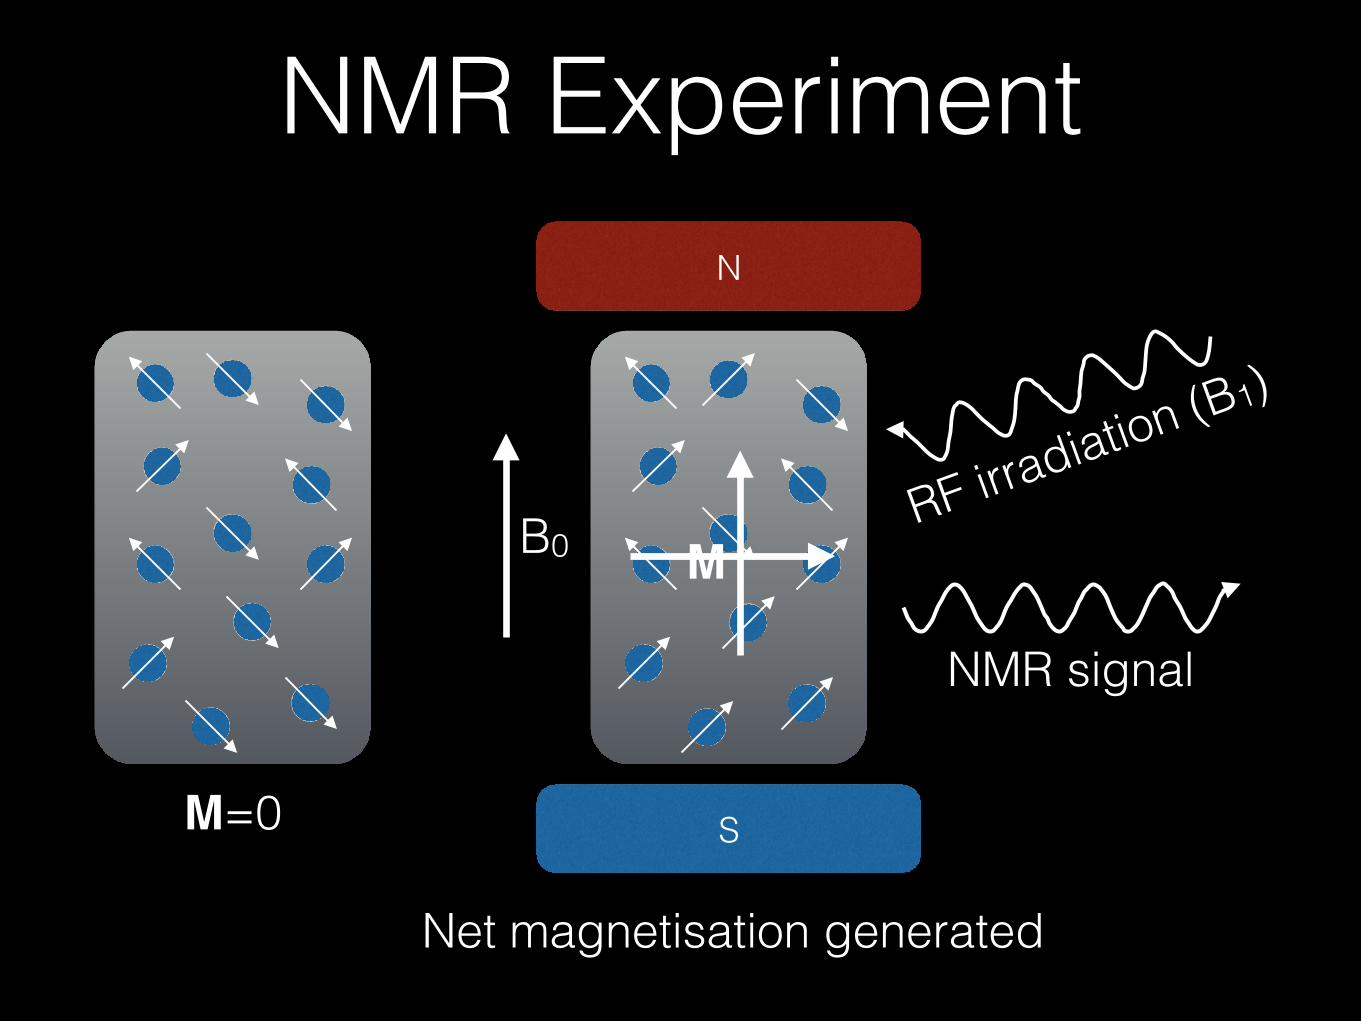
NMR ExperimentN
S
RF irradiation (B1)
Net magnetisation generated
B0
NMR signal
M=0
M

NMR signals
• Signal amplitude is proportional to number of nuclei.
• Oscillate at a frequency dependant on the static field strength (B0), nucleus type (1H, 31P…) and its chemical environment.
• Decay rates depend on microscopic environment.
frequency-domain signal
Fourier transform f(�)time-domain
signalf(t)
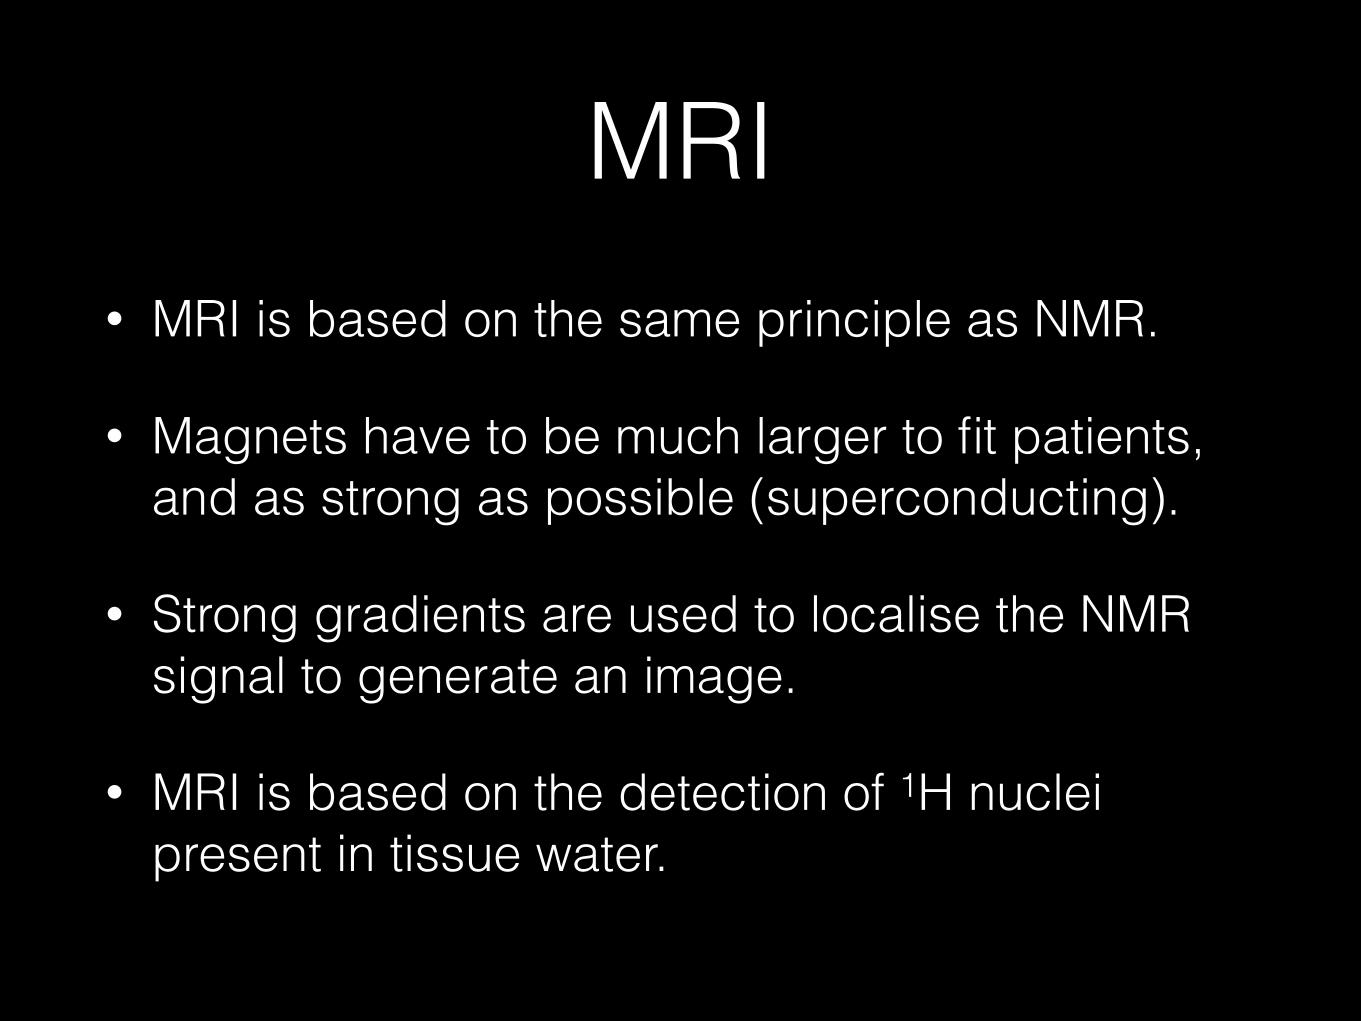
MRI• MRI is based on the same principle as NMR.
• Magnets have to be much larger to fit patients, and as strong as possible (superconducting).
• Strong gradients are used to localise the NMR signal to generate an image.
• MRI is based on the detection of 1H nuclei present in tissue water.
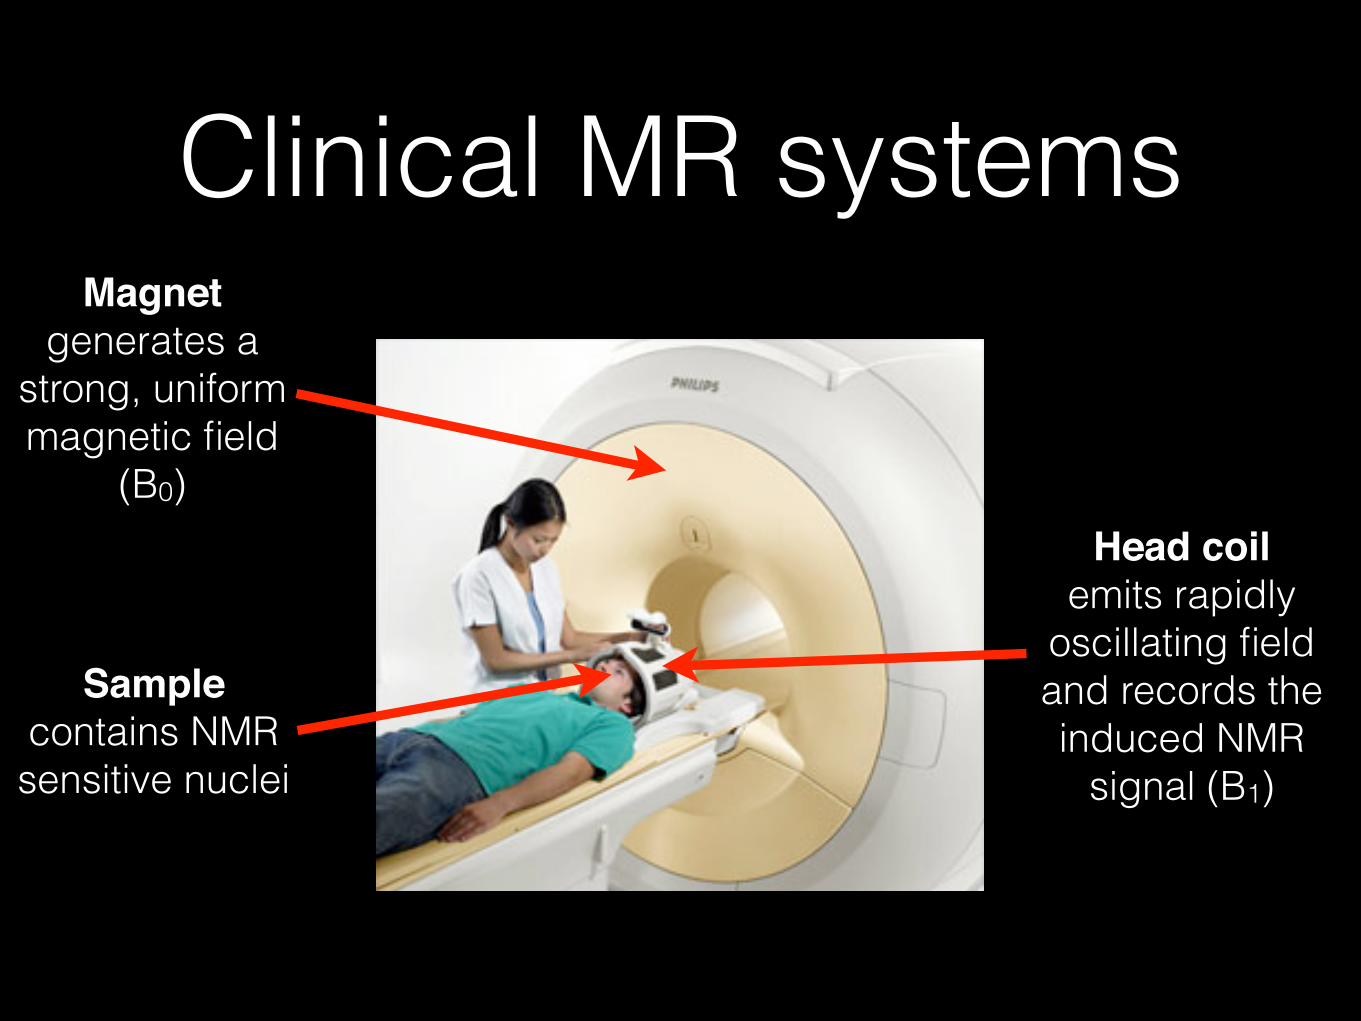
Clinical MR systemsMagnet!
generates a strong, uniform magnetic field
(B0)
Sample!contains NMR sensitive nuclei
Head coil!emits rapidly
oscillating field and records the induced NMR
signal (B1)
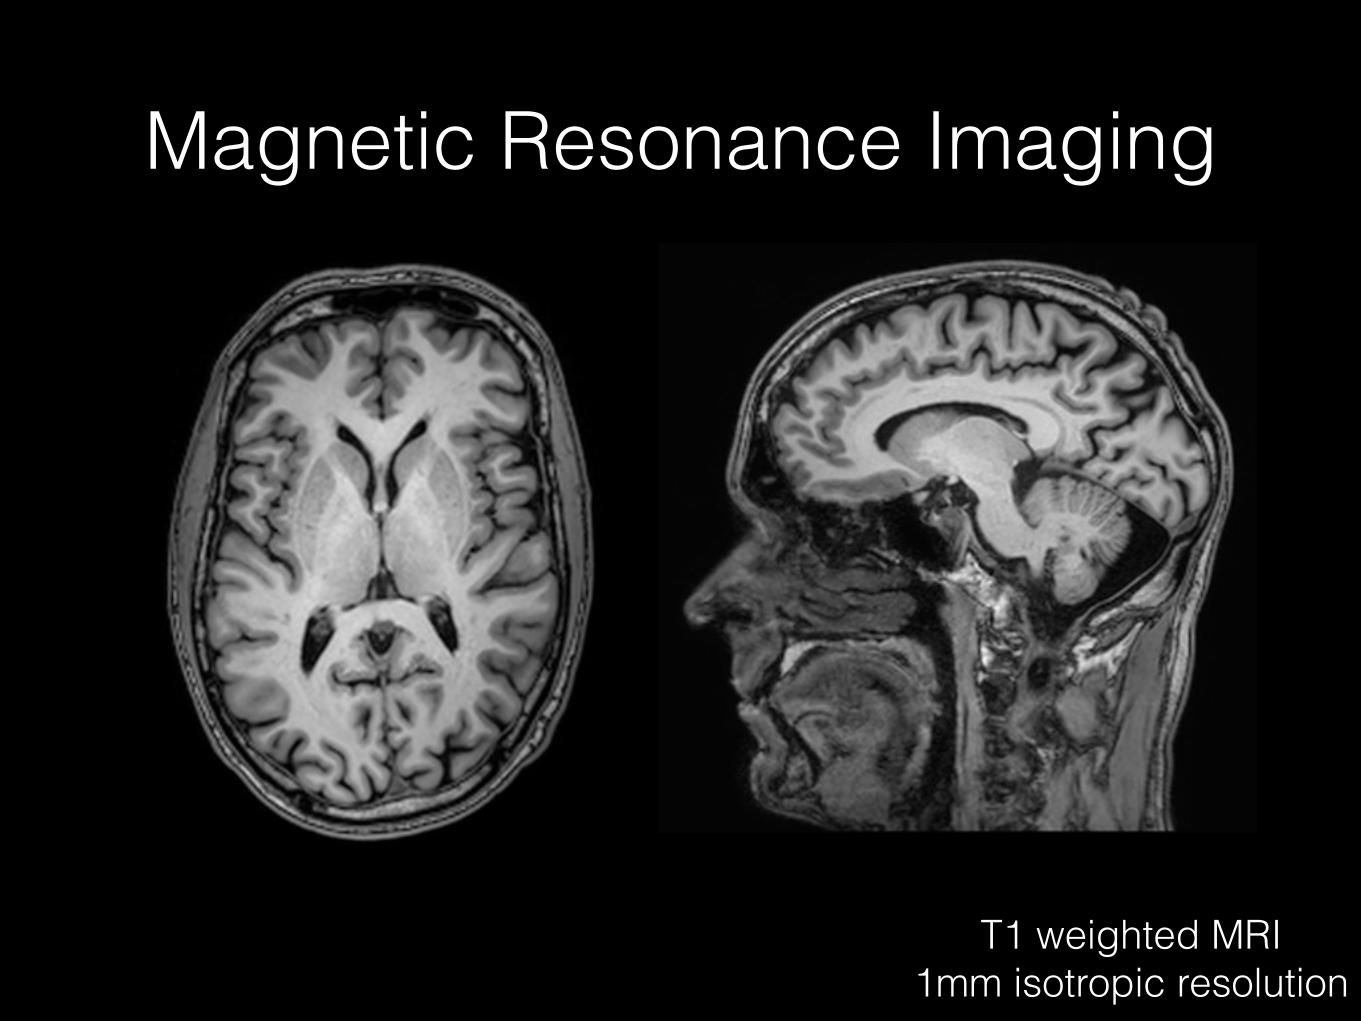
Magnetic Resonance Imaging
T1 weighted MRI 1mm isotropic resolution
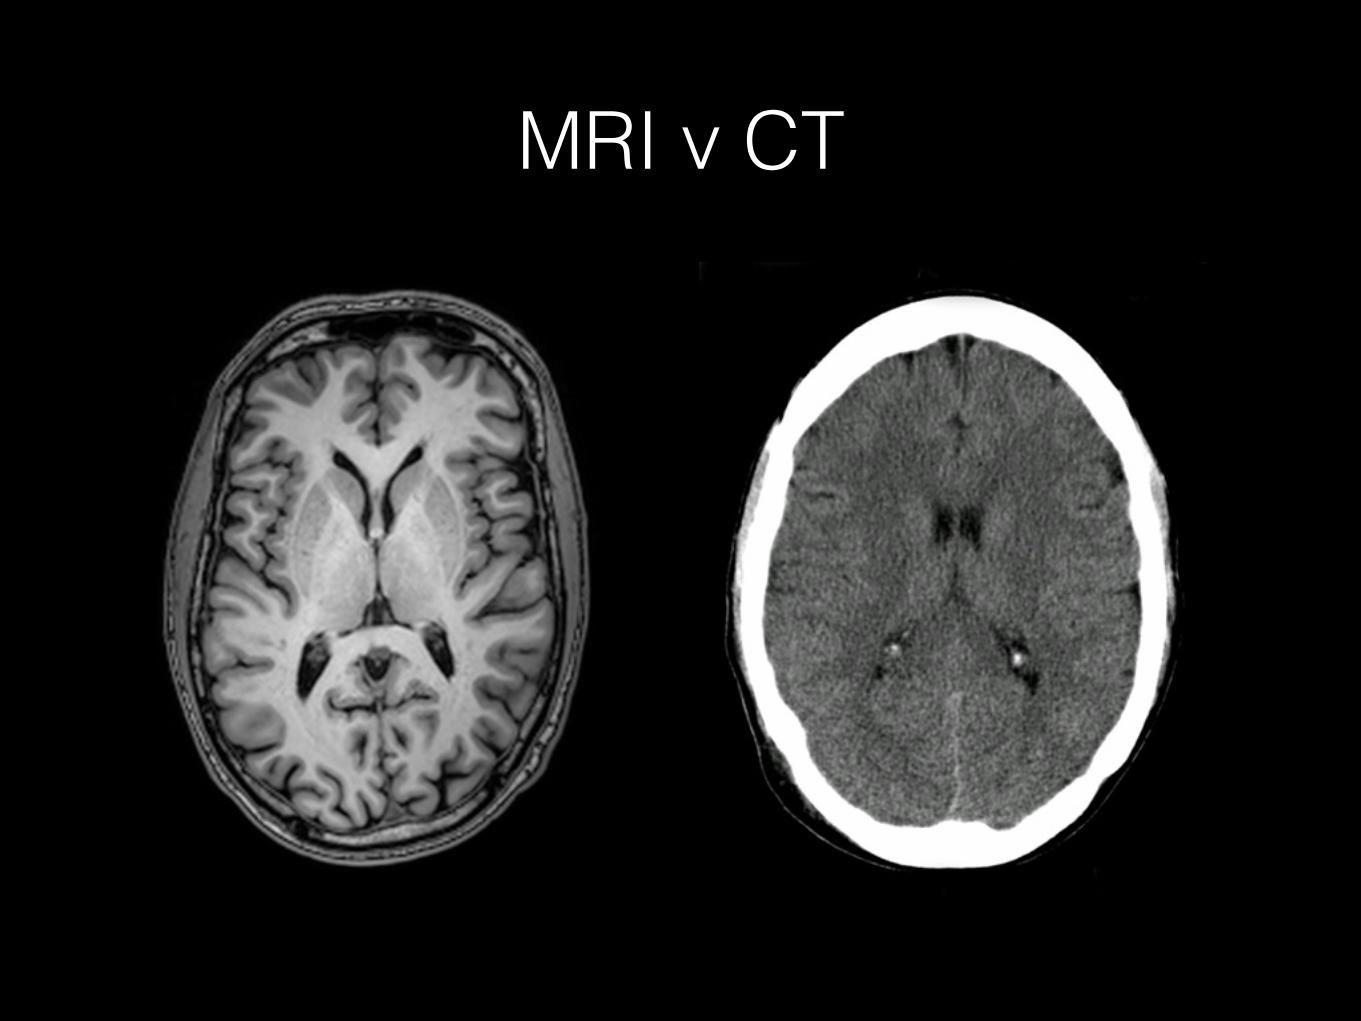
MRI v CT
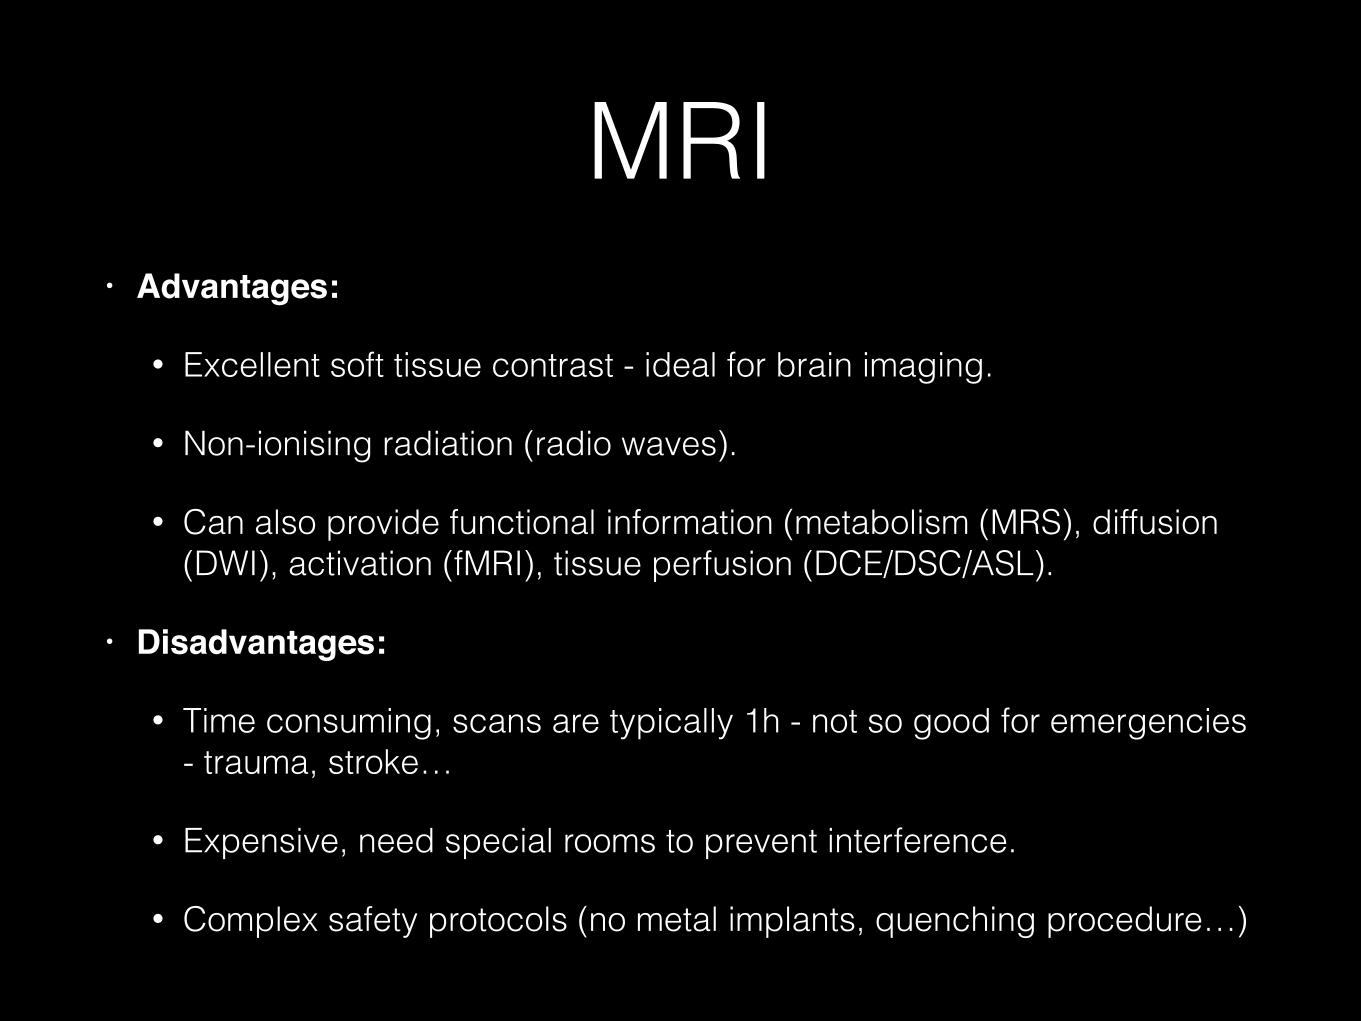
MRI• Advantages:!
• Excellent soft tissue contrast - ideal for brain imaging.
• Non-ionising radiation (radio waves).
• Can also provide functional information (metabolism (MRS), diffusion (DWI), activation (fMRI), tissue perfusion (DCE/DSC/ASL).
• Disadvantages:!
• Time consuming, scans are typically 1h - not so good for emergencies - trauma, stroke…
• Expensive, need special rooms to prevent interference.
• Complex safety protocols (no metal implants, quenching procedure…)
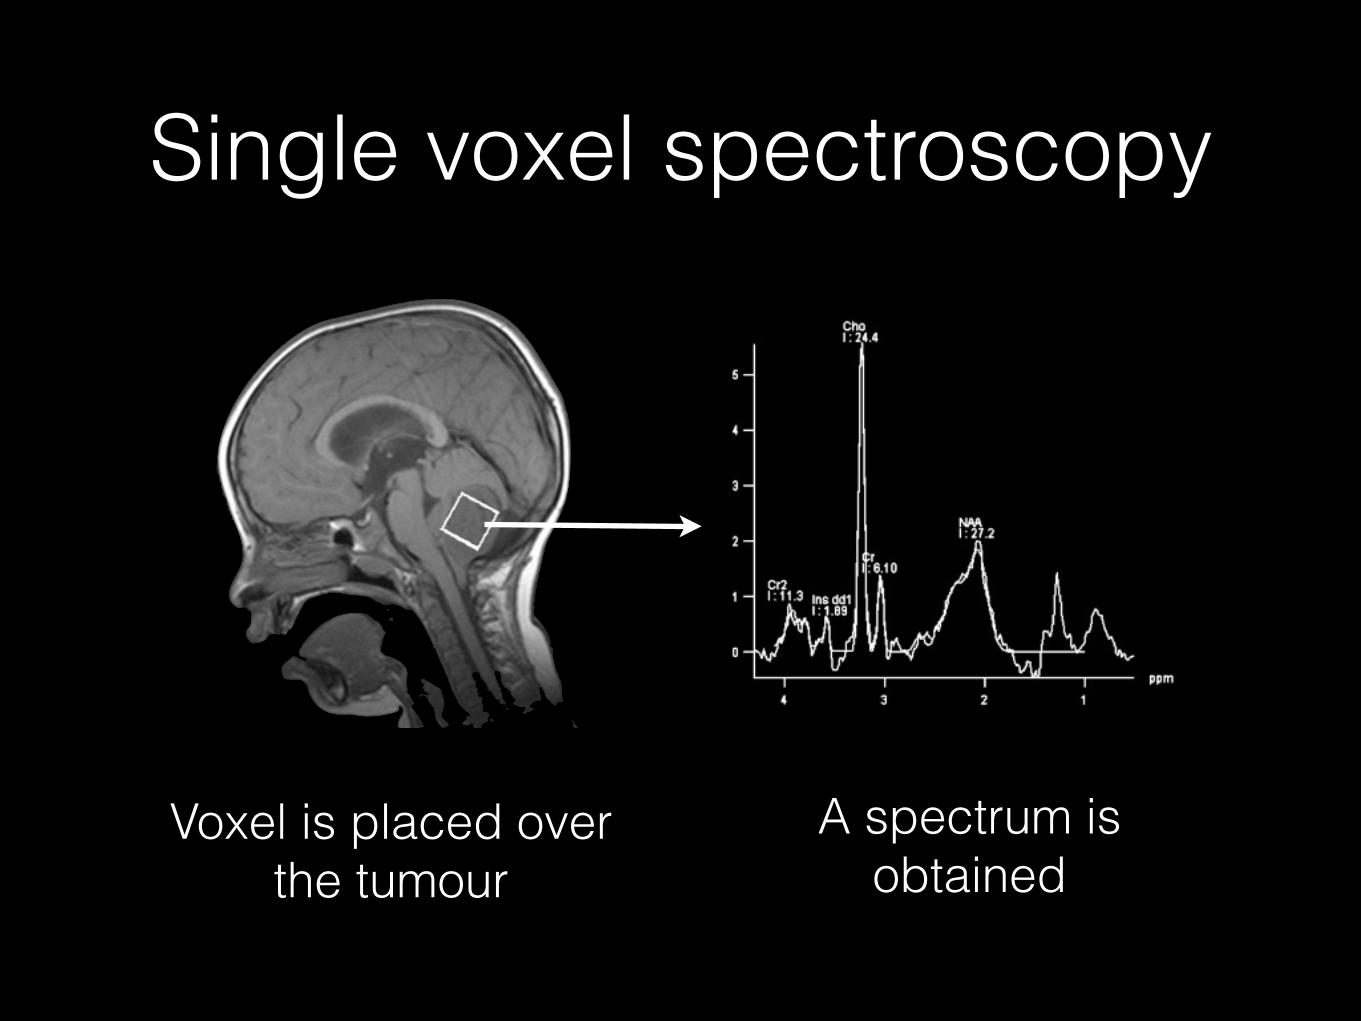
Single voxel spectroscopy
Voxel is placed over the tumour
A spectrum is obtained
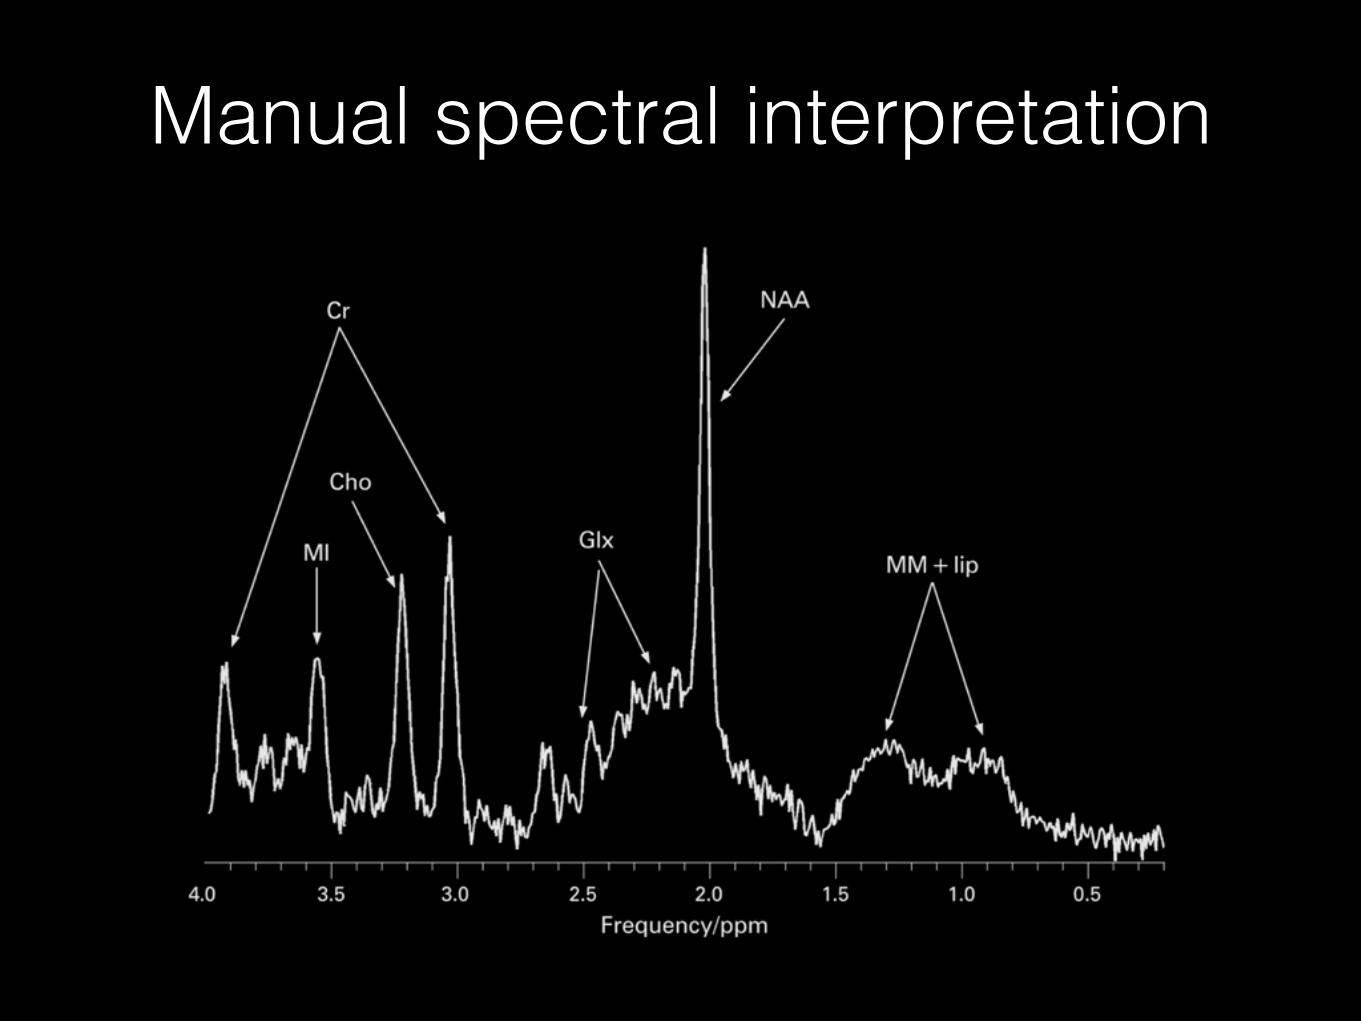
Manual spectral interpretation
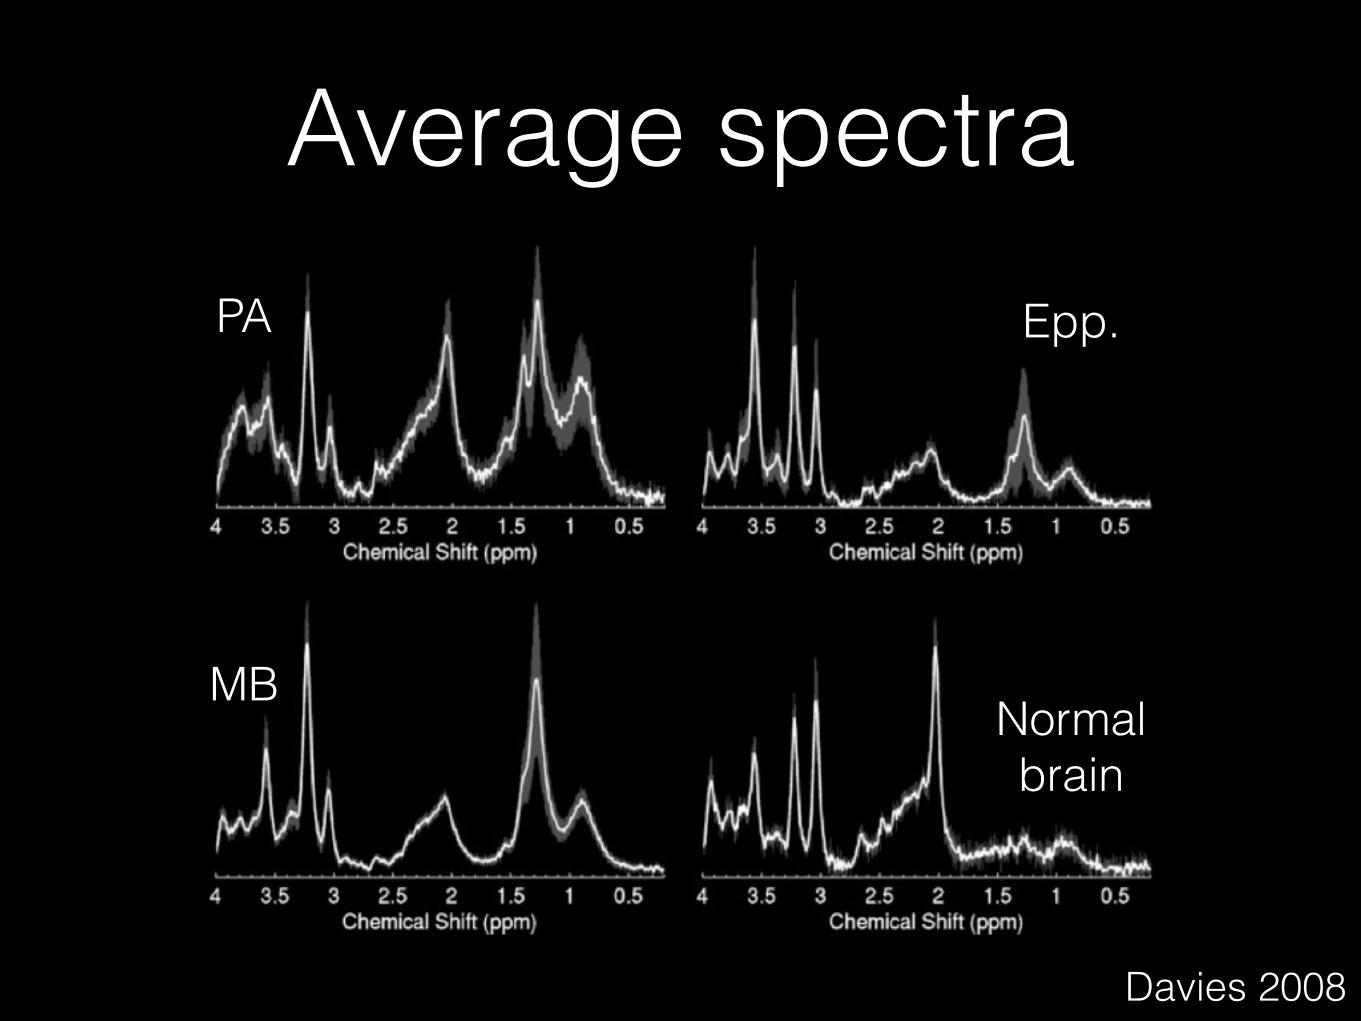
Average spectraPA
Normal brain
Epp.
MB
Davies 2008
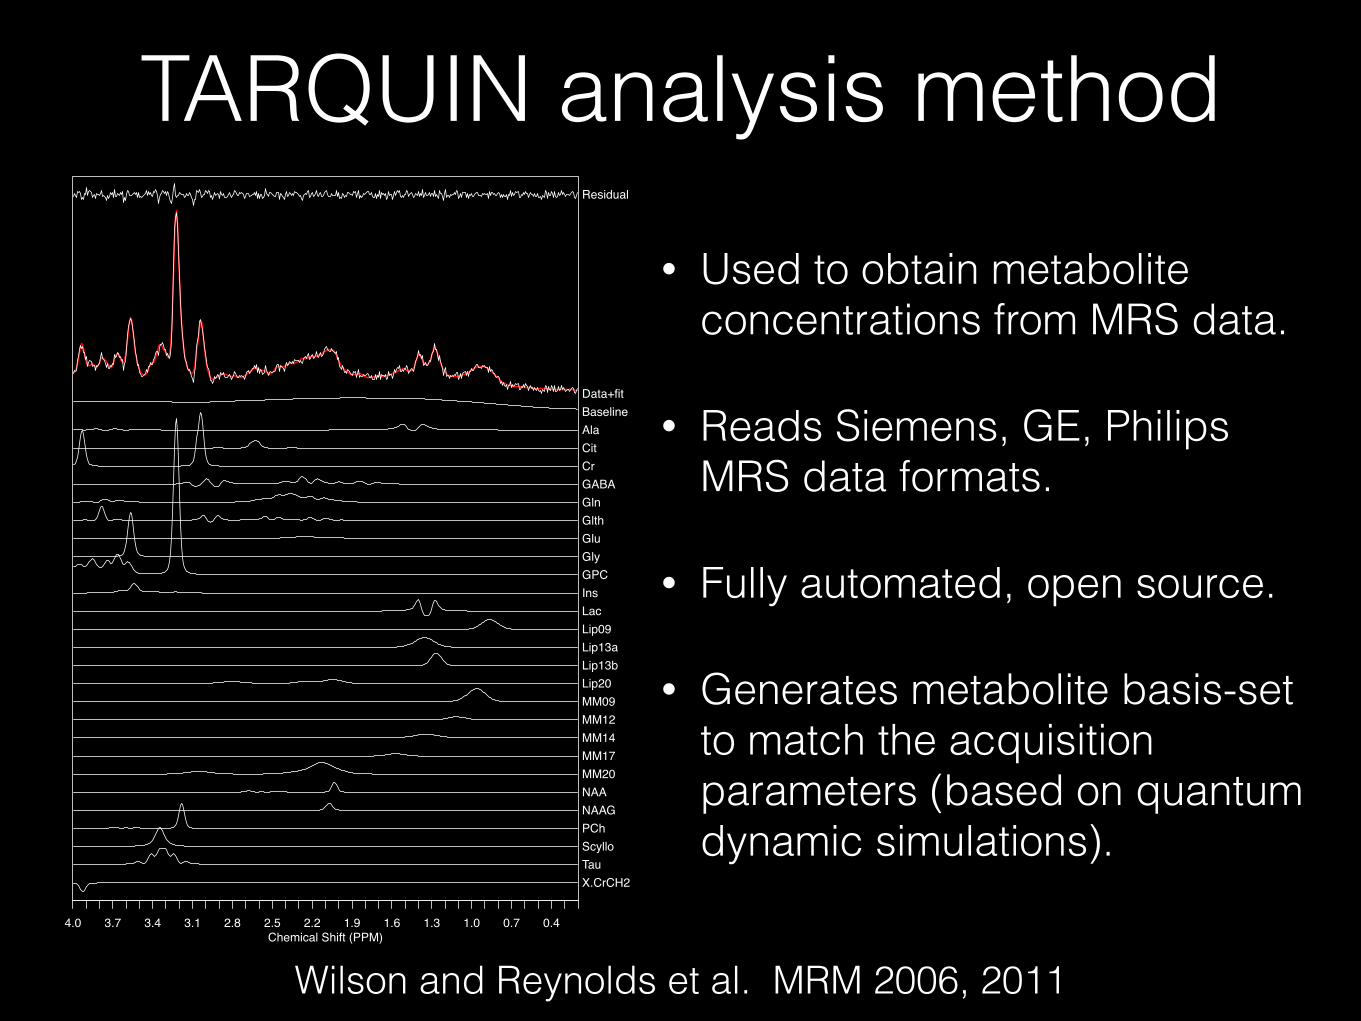
TARQUIN analysis method
Wilson and Reynolds et al. MRM 2006, 2011
• Used to obtain metabolite concentrations from MRS data.
• Reads Siemens, GE, Philips MRS data formats.
• Fully automated, open source.
• Generates metabolite basis-set to match the acquisition parameters (based on quantum dynamic simulations).
4.0 3.7 3.4 3.1 2.8 2.5 2.2 1.9 1.6 1.3 1.0 0.7 0.4Chemical Shift (PPM)
Data+fit
Residual
BaselineAlaCitCrGABAGlnGlthGluGlyGPCInsLacLip09Lip13aLip13bLip20MM09MM12MM14MM17MM20NAANAAGPChScylloTauX.CrCH2

Decision support system
Radiologist evaluation
Database of previous cases
+
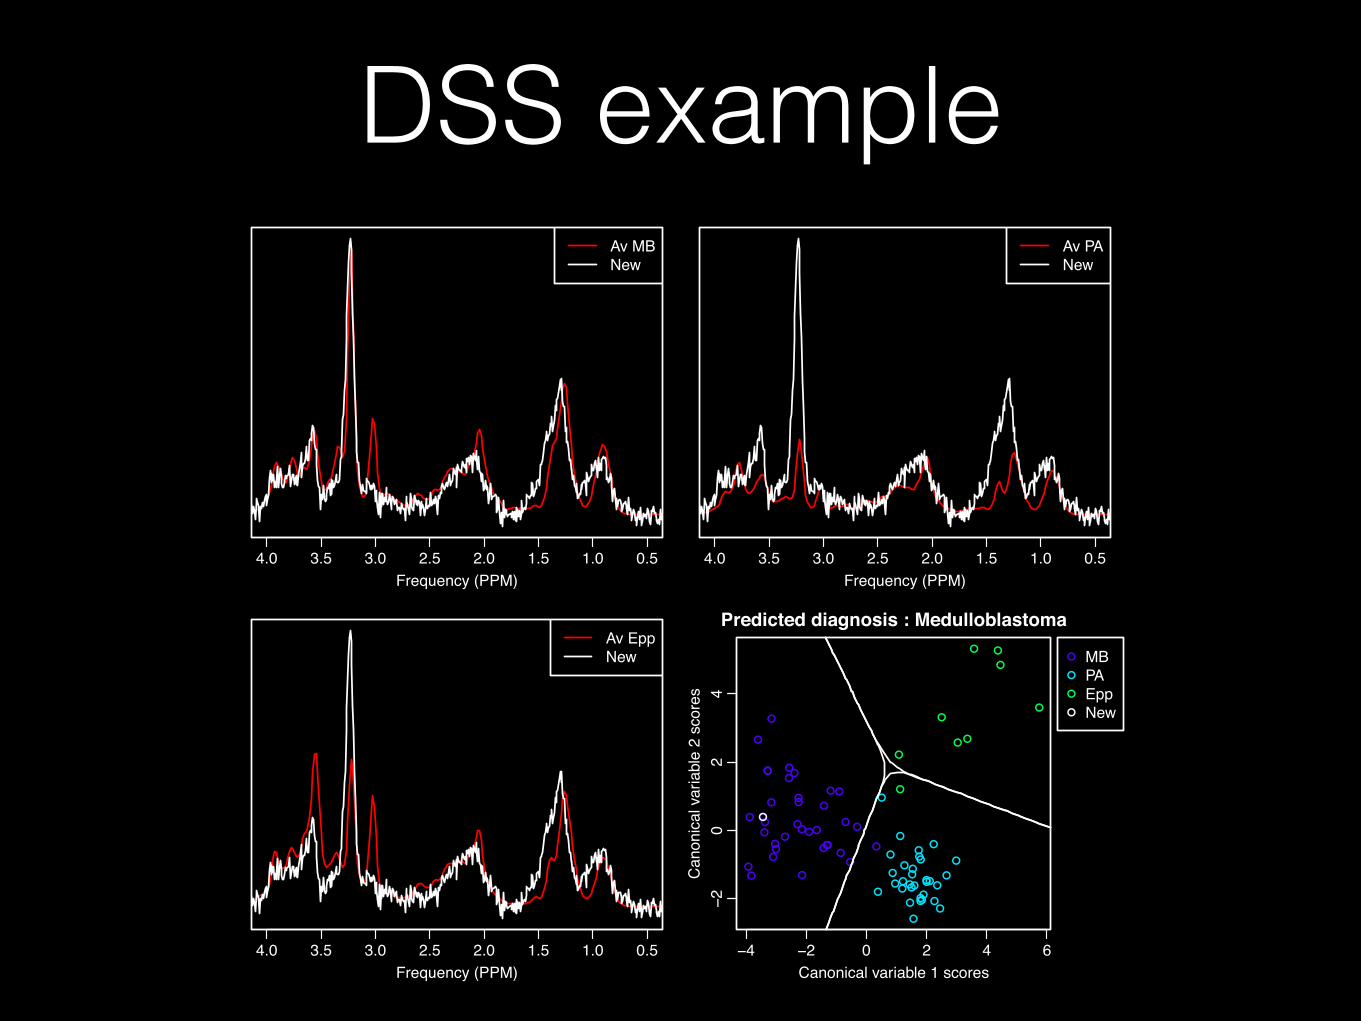
DSS example
4.0 3.5 3.0 2.5 2.0 1.5 1.0 0.5Frequency (PPM)
Av MBNew
4.0 3.5 3.0 2.5 2.0 1.5 1.0 0.5Frequency (PPM)
Av PANew
4.0 3.5 3.0 2.5 2.0 1.5 1.0 0.5Frequency (PPM)
Av EppNew
●
●
●
●
●
●
● ●
●
●
●
●
●
●
●
●
●
●
●
● ●
●
●
●
●
●
●
●
●
●
●
●●
●
●
●
●
●
●
●
●
●
●
●
●
●
●
●
●
●
●
●
●
●
●
●
●
●
●●
●
●●
●
●
●●
●●
●●
●
●
●
●
●
●
●
−4 −2 0 2 4 6
−20
24
Predicted diagnosis : Medulloblastoma
Canonical variable 1 scores
Can
onic
al v
aria
ble
2 sc
ores
●
●
●
●
MBPAEppNew

MRS and field strength
1.5 Tesla 3.0 Tesla
1.5T + 3T MRS DSS• Previous work has shown that MRS based DSS can
be used to aid paediatric tumour diagnosis for 1.5T cases*.
• Hospitals increasingly have a mix of 1.5T and 3T MR systems.
• Can we use the large database of cases collected at 1.5T to predict the diagnosis of cases collected at 3T?
*Davies 2008, Vicente 2013

3T DSS performance• Training set of 77 BCH cases collected at 1.5T.
• Tested prospectively on 22 cases from 3 centres (BCH, QMC, RLCH) collected at 3T.
• TARQUIN was used to obtain metabolite concentrations for classification.
• 86% accuracy was achieved - in agreement with other studies at 1.5T.
Key points• MRS data can be interpreted qaulatievly by visual
comparison with average spectra or by using decision support systems (DSS).
• DSS based on automated MRS analysis software (TARQUIN) have the following advantages:
• Methods can be reproduced at other centres without requiring MRS data processing or interpretation expertise. Important for multi-centre studies.
• Can remove vendor and hardware dependance (eg field strength) by converting spectral information into metabolite concentrations.
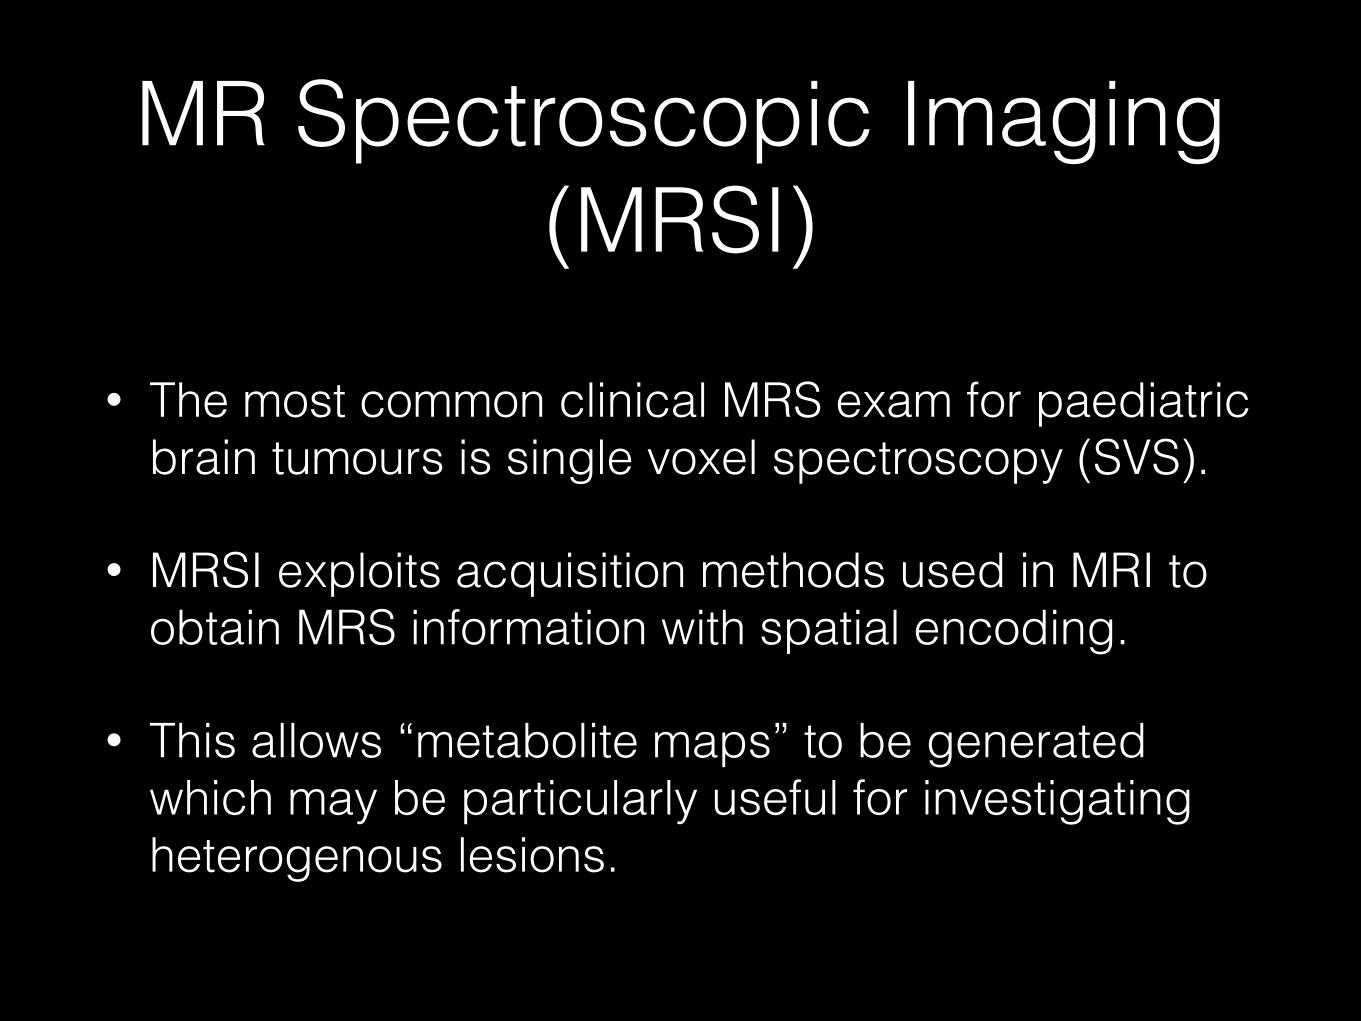
MR Spectroscopic Imaging (MRSI)
• The most common clinical MRS exam for paediatric brain tumours is single voxel spectroscopy (SVS).
• MRSI exploits acquisition methods used in MRI to obtain MRS information with spatial encoding.
• This allows “metabolite maps” to be generated which may be particularly useful for investigating heterogenous lesions.
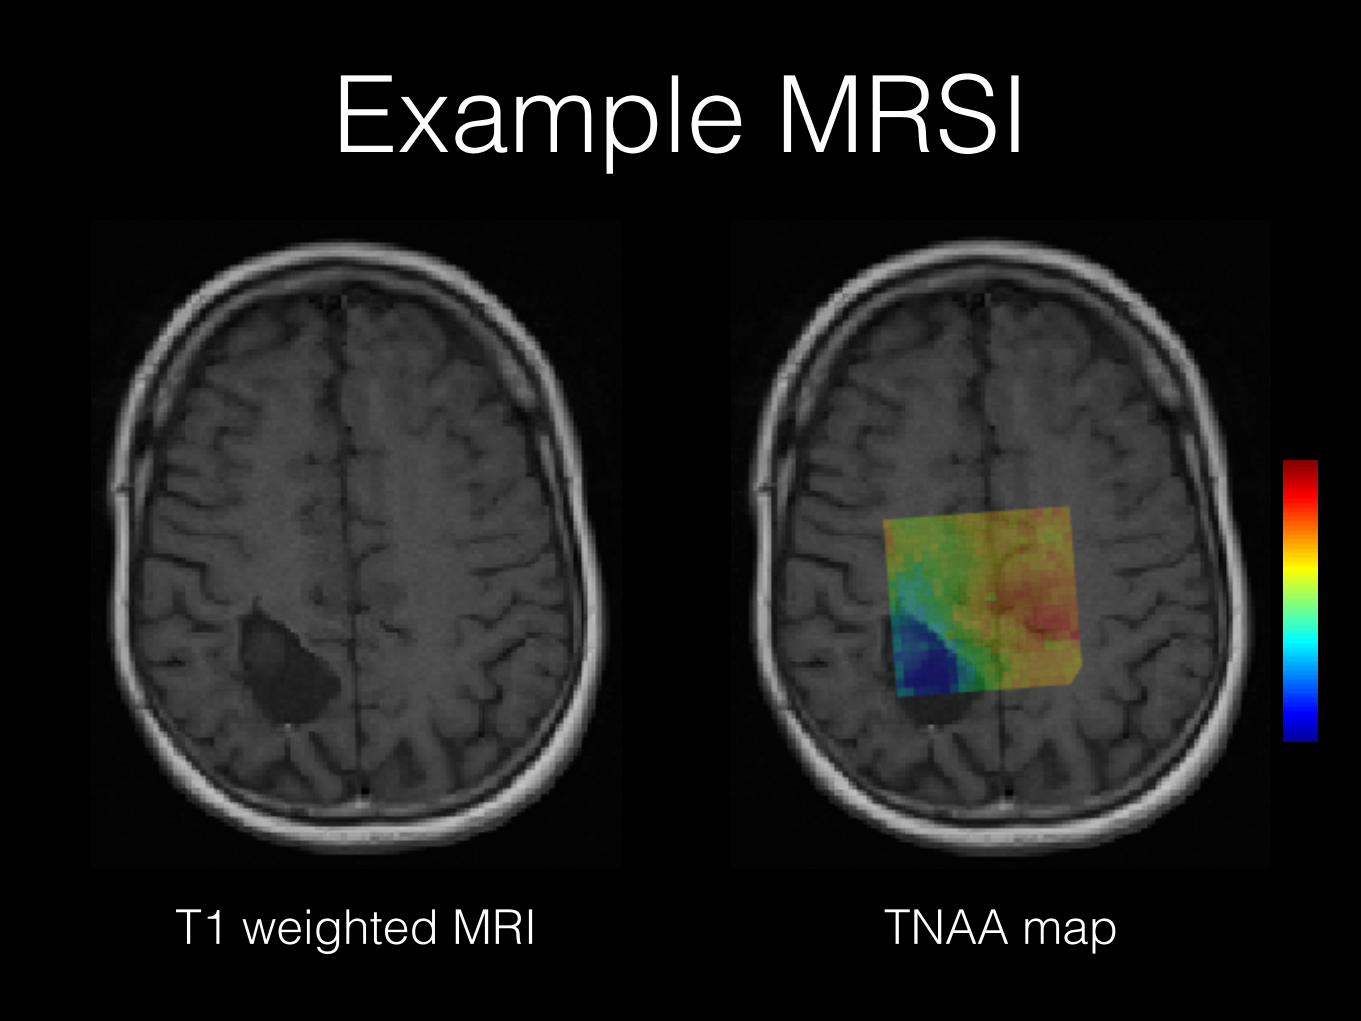
Example MRSI
T1 weighted MRI TNAA map
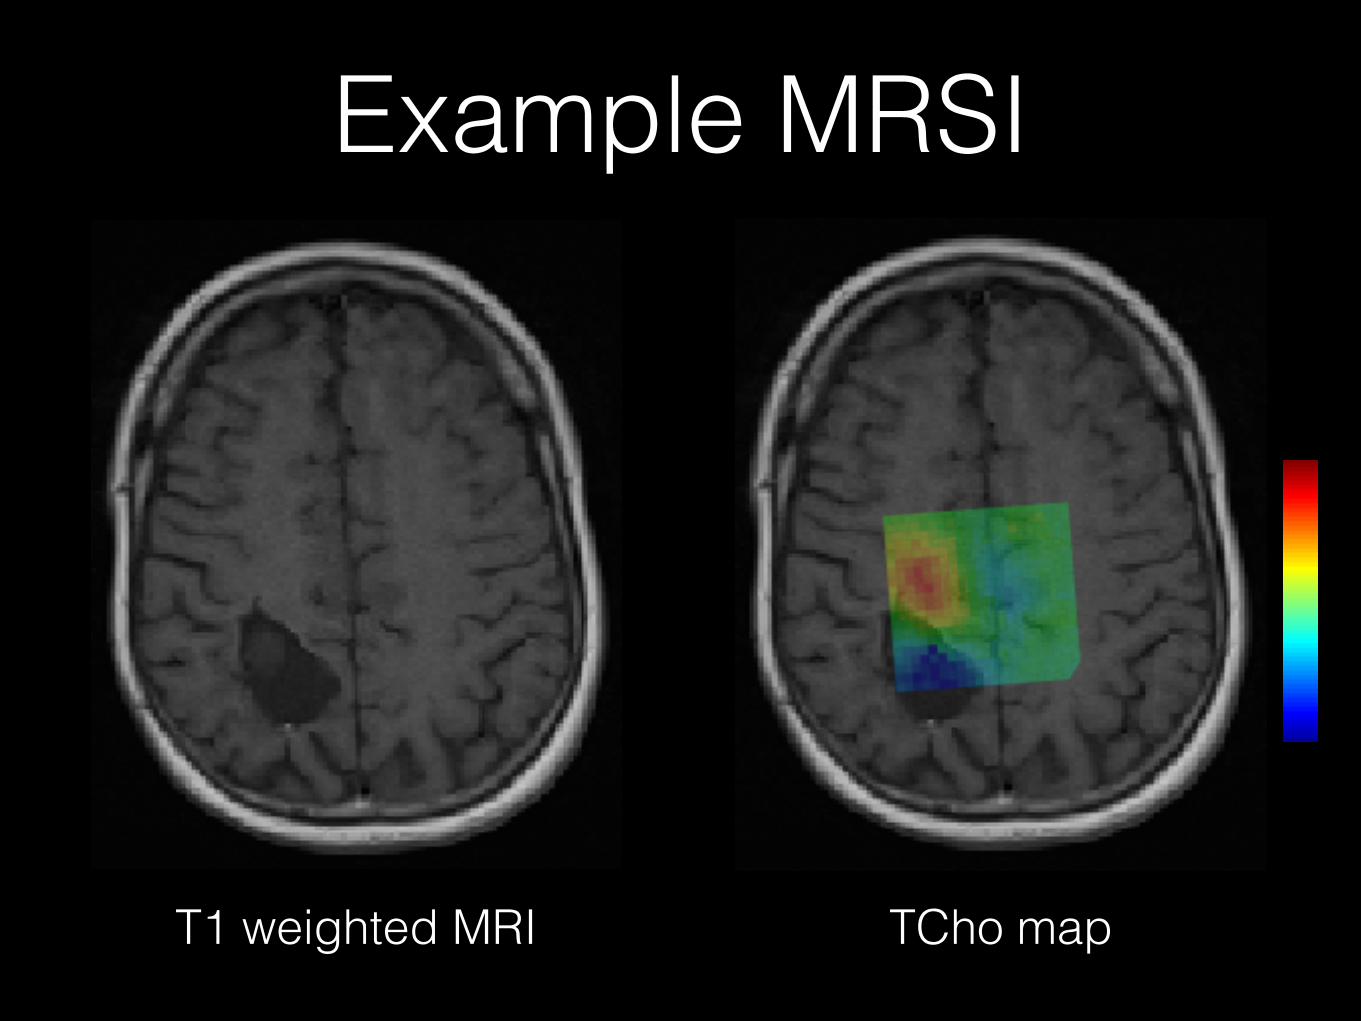
Example MRSI
T1 weighted MRI TCho map

Example MRSI
TCho map m-Ins map
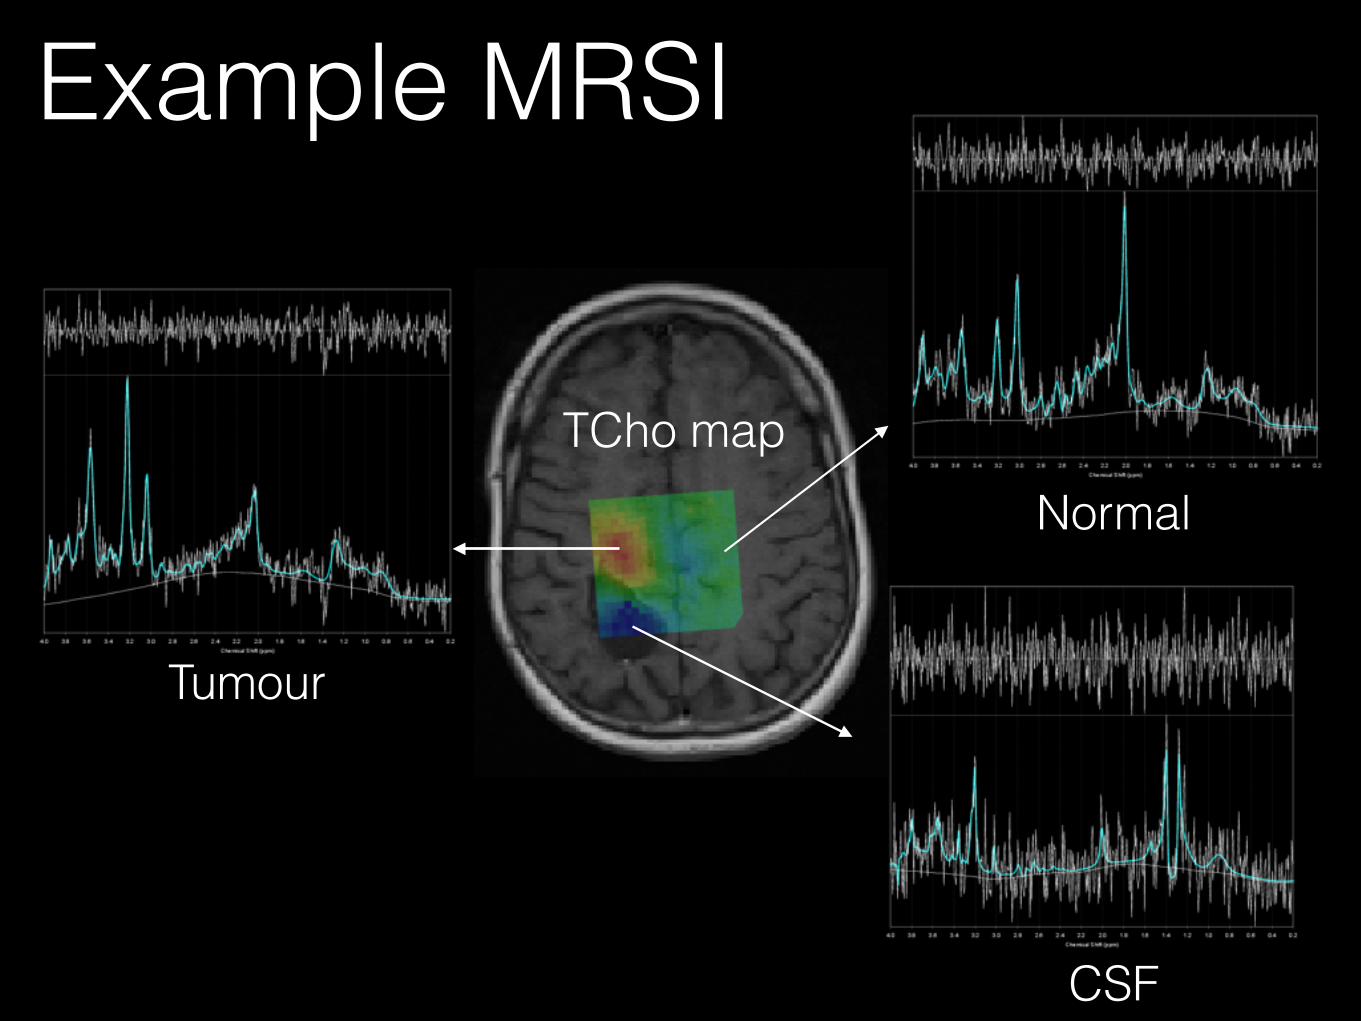
Example MRSI
NormalTCho map
CSF
Tumour

MRSI challenges• High quality automated analysis is not available
on scanner software. - TARQUIN
• Large amounts of information make interpretation difficult for a non-expert. - DSS?
• 3T offers potential advantages for MRSI, however poor field uniformity and accurate localisation (CSD) are areas that require further R+D.
• Currently, TARQUIN and the DSS can be used for research studies.
• However, since this software can be classified as a “medical device” it requires regulatory approval (directive 93/68/EEC) before it can be used for clinical purposes in Europe.
• This requires:
• A company with ISO 13485 compliance.
• CE marking procedure.
• Currently exploring CE marking procedure with an industrial collaborator with the aim to produce an MRS analysis product for clinical use.
Translation from clinical research to clinical practice
Conclusion• MRS is a useful and widely available technique for the
non-invasive measurement of tissue metabolism.
• Automated quantitation and pattern recognition methods aid:
• 1) Clinical interpretation.
• 2) Disease biomarker development.
• The translation of these methods into clinical practice requires regulatory approval (CE marking) and therefore industrial collaboration.