Embed Size (px)
Citation preview

Magnetic Resonance Imaging
BCMB/CHEM 8190
"for their discoveries concerning magnetic resonance imaging"
Paul C. Lauterbur Sir Peter Mansfield
The Nobel Prize in Physiology or Medicine 2003

Imaging System: 7T-210 mm
Imaging methods include
1. Relaxometric measurements (T1, T2
and T2* mapping)
2. Quantitative diffusion mapping (DWI)
and diffusion tensor imaging (DTI)
3. Quantization of vascular leakiness
and permeability of tumor tissue
4. Spectroscopic imaging of 1H
metabolites to monitor cellular
response to therapy
5. Blood flow measurements using ASL
(arterial spin labeling)
6. BOLD (blood oxygen level
dependent contrast) for fMRI
studies

RF coils are quite varied
• Transmit coils and gradient coils are often fixed
in the bore much like a high resolution system
• Observe coils may be localized on animal like
these surface coils
From Doty Scientific

Human MRI 3T: 60cm
UGA 3 Tesla magnet
Surface or volume coil
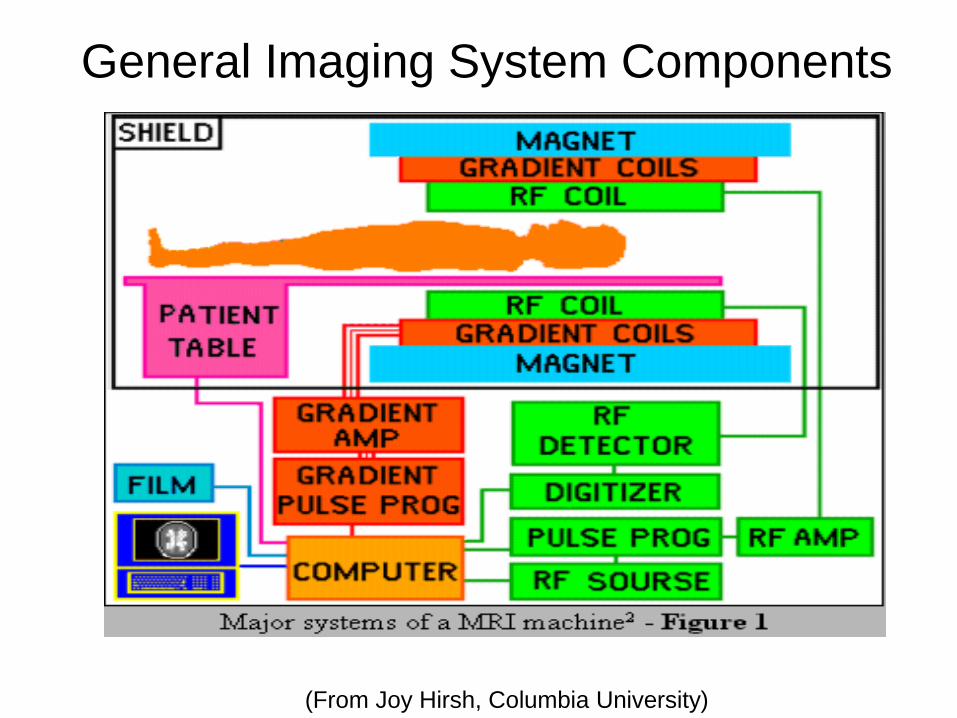
General Imaging System Components
(From Joy Hirsh, Columbia University)
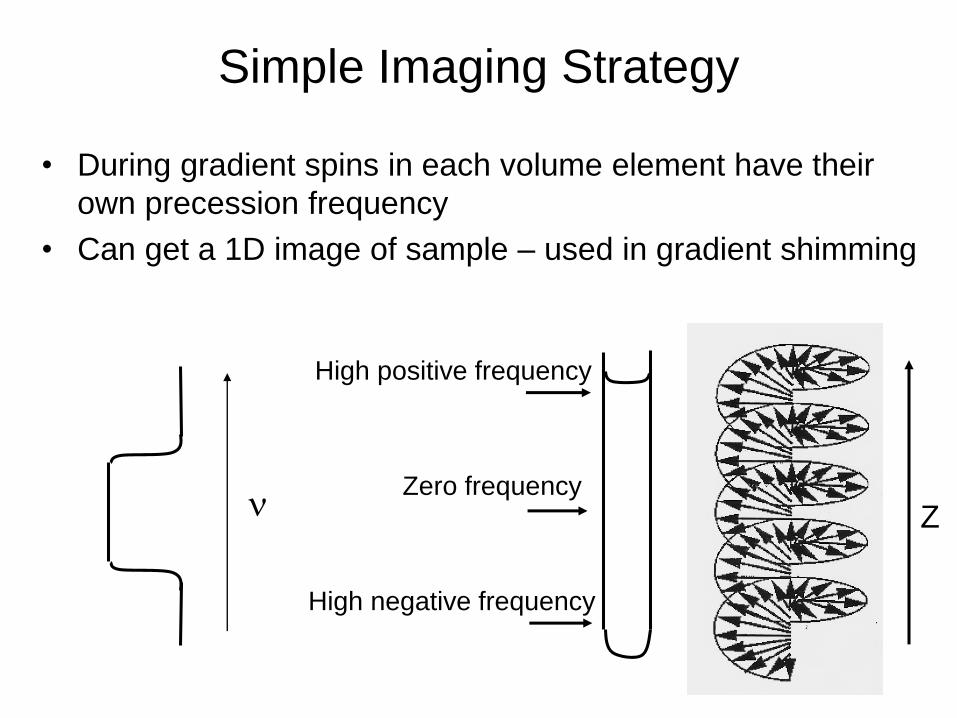
Simple Imaging Strategy
• During gradient spins in each volume element have their
own precession frequency
• Can get a 1D image of sample – used in gradient shimming
High positive frequency
Zero frequency
High negative frequency
Z
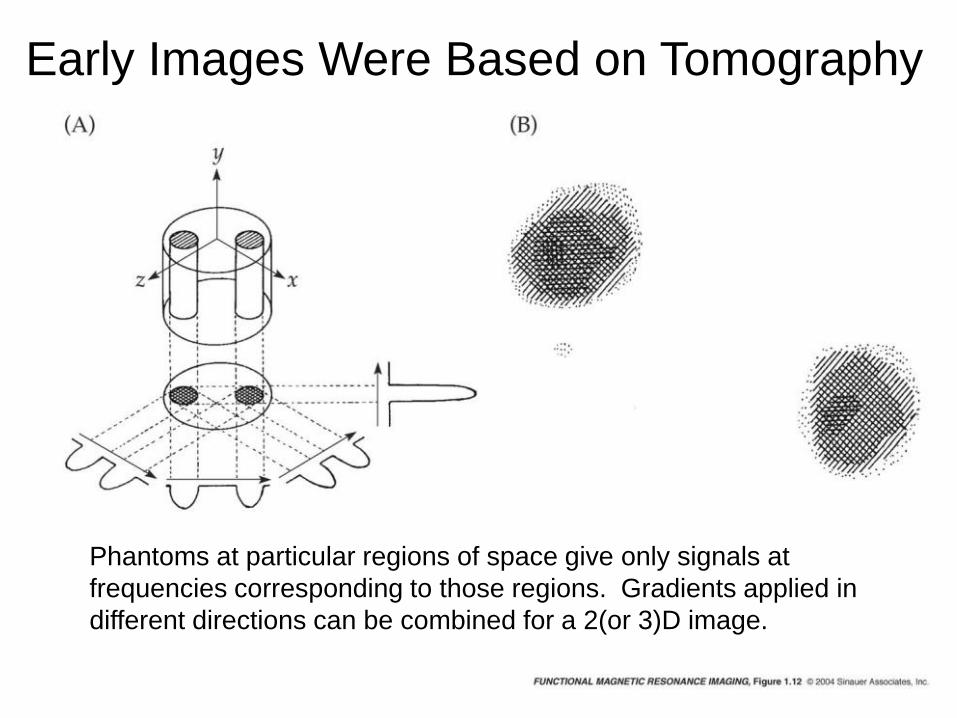
Early Images Were Based on Tomography
Phantoms at particular regions of space give only signals at
frequencies corresponding to those regions. Gradients applied in
different directions can be combined for a 2(or 3)D image.
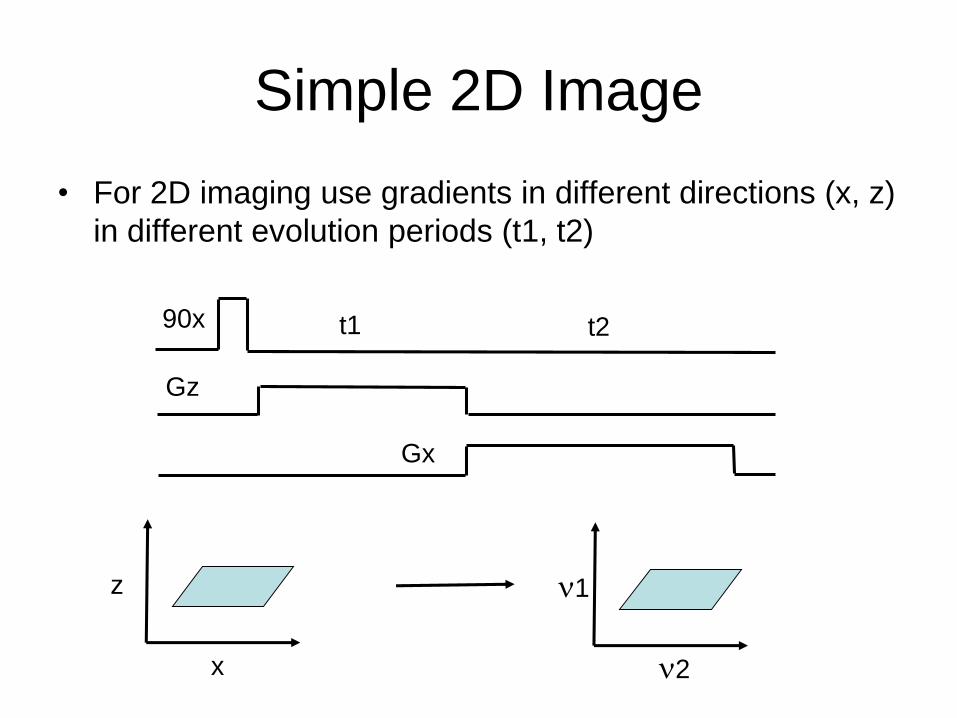
Simple 2D Image
• For 2D imaging use gradients in different directions (x, z)
in different evolution periods (t1, t2)
90x
Gz
Gx
t1 t2
z
x
1
2
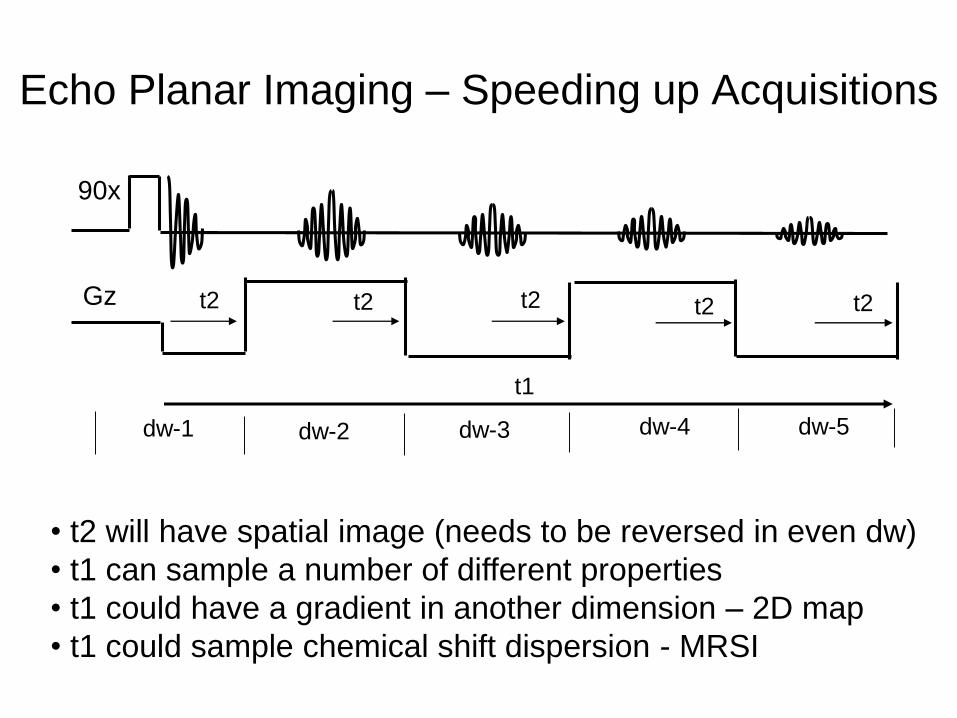
Echo Planar Imaging – Speeding up Acquisitions
90x
Gz t2 t2 t2 t2 t2
t1
dw-1 dw-2 dw-3 dw-4 dw-5
• t2 will have spatial image (needs to be reversed in even dw)
• t1 can sample a number of different properties
• t1 could have a gradient in another dimension – 2D map
• t1 could sample chemical shift dispersion - MRSI
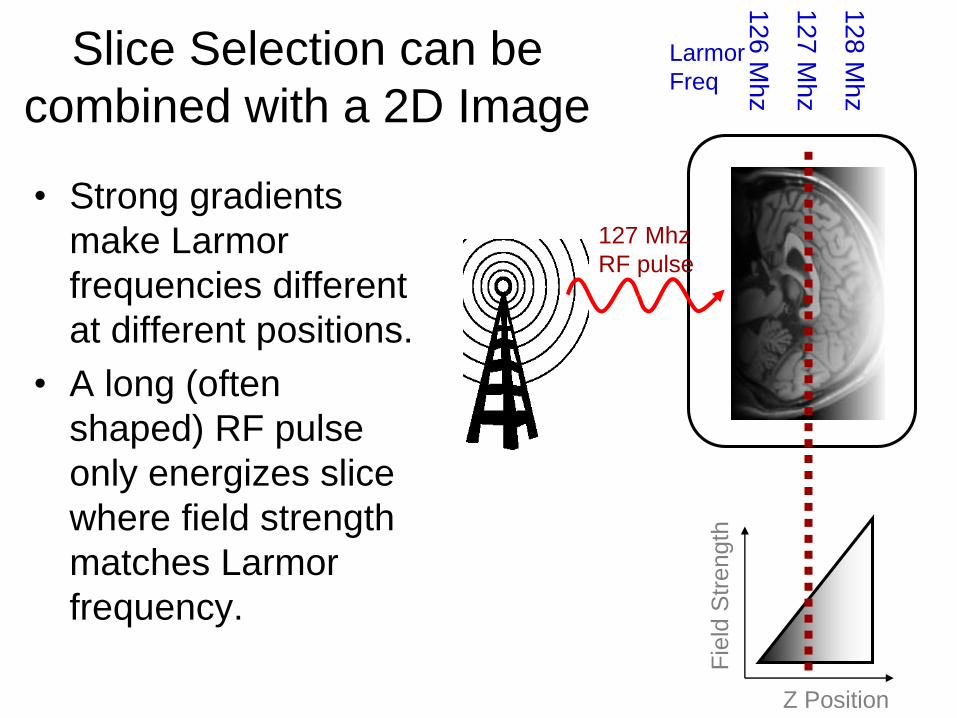
Slice Selection can be
combined with a 2D Image
• Strong gradients
make Larmor
frequencies different
at different positions.
• A long (often
shaped) RF pulse
only energizes slice
where field strength
matches Larmor
frequency.
Fie
ld S
trength
Z Position
12
8 M
hz
12
7 M
hz
12
6 M
hz
127 Mhz
RF pulse
Larmor
Freq
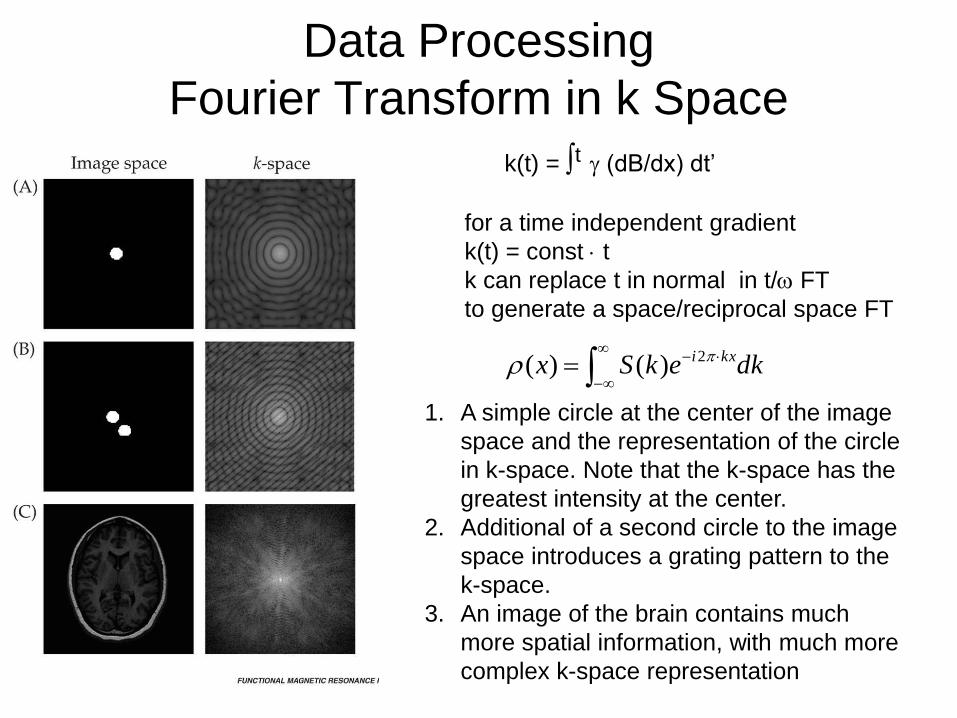
Data Processing
Fourier Transform in k Space
dkekSx kxi
2)()(
1. A simple circle at the center of the image
space and the representation of the circle
in k-space. Note that the k-space has the
greatest intensity at the center.
2. Additional of a second circle to the image
space introduces a grating pattern to the
k-space.
3. An image of the brain contains much
more spatial information, with much more
complex k-space representation
k(t) = t (dB/dx) dt’
for a time independent gradient
k(t) = const t
k can replace t in normal in t/ FT
to generate a space/reciprocal space FT
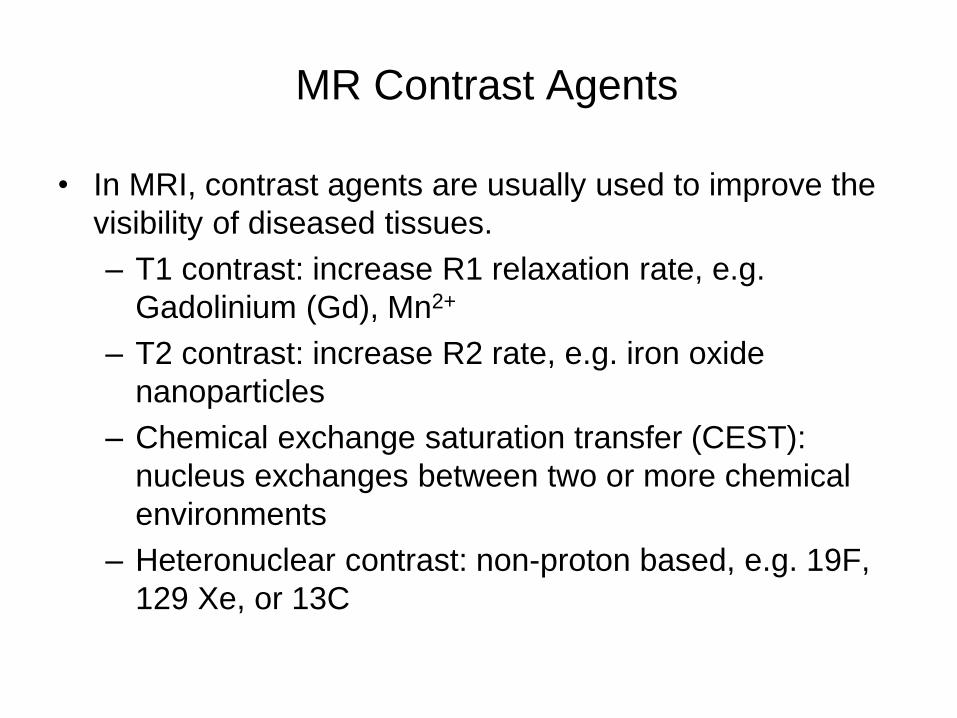
MR Contrast Agents
• In MRI, contrast agents are usually used to improve the
visibility of diseased tissues.
– T1 contrast: increase R1 relaxation rate, e.g.
Gadolinium (Gd), Mn2+
– T2 contrast: increase R2 rate, e.g. iron oxide
nanoparticles
– Chemical exchange saturation transfer (CEST):
nucleus exchanges between two or more chemical
environments
– Heteronuclear contrast: non-proton based, e.g. 19F,
129 Xe, or 13C
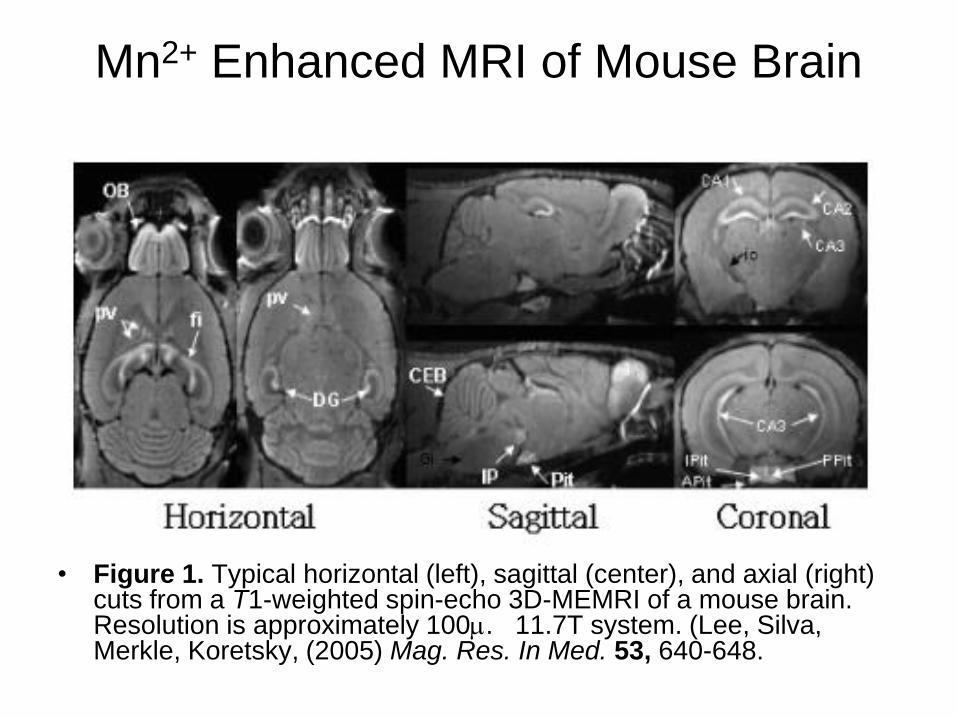
Mn2+ Enhanced MRI of Mouse Brain
• Figure 1. Typical horizontal (left), sagittal (center), and axial (right) cuts from a T1-weighted spin-echo 3D-MEMRI of a mouse brain. Resolution is approximately 100. 11.7T system. (Lee, Silva, Merkle, Koretsky, (2005) Mag. Res. In Med. 53, 640-648.
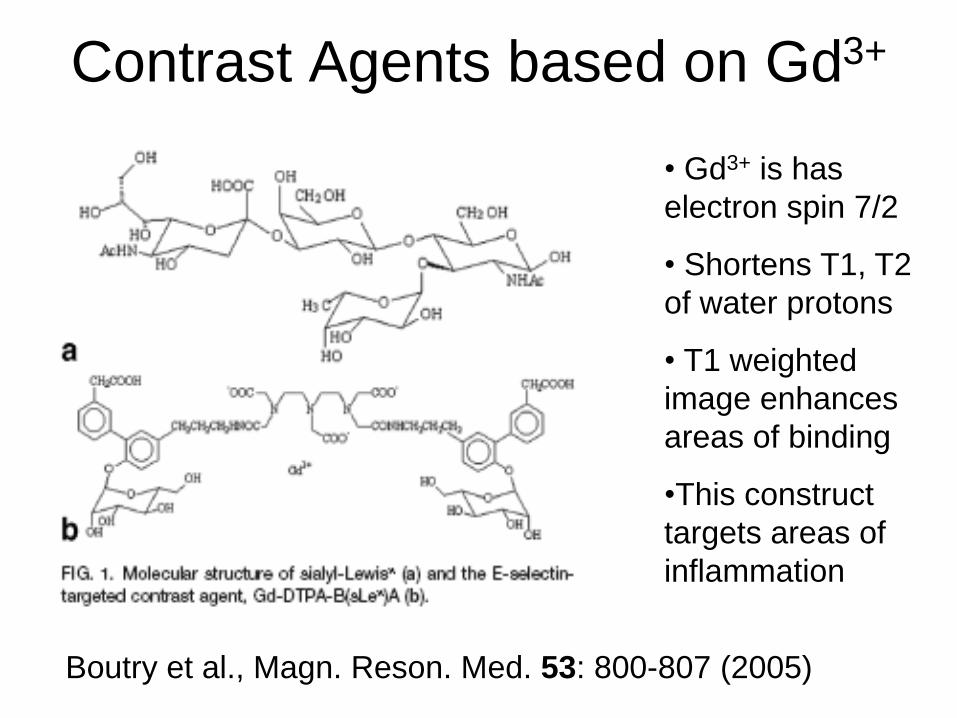
Contrast Agents based on Gd3+
Boutry et al., Magn. Reson. Med. 53: 800-807 (2005)
• Gd3+ is has
electron spin 7/2
• Shortens T1, T2
of water protons
• T1 weighted
image enhances
areas of binding
•This construct
targets areas of
inflammation

“Magnetic resonance imaging of cell surface receptors using targeted
contrast agents, D. Artemov, Z.M. Bhujwalla, J.W.M. Bulte, Current
Pharm. Biotech. 5:485-494.
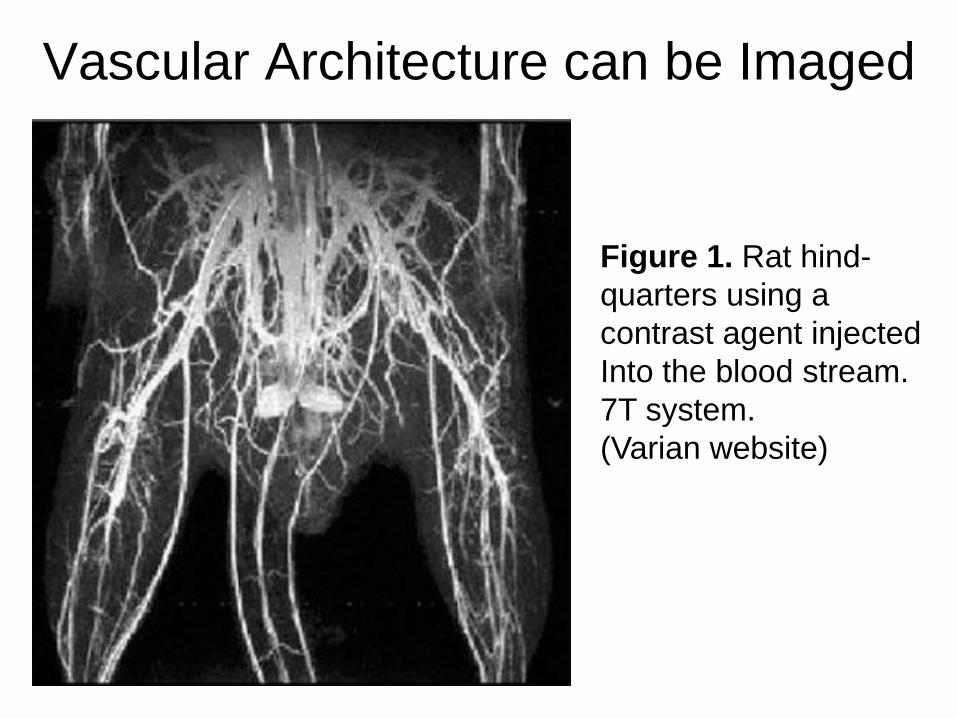
Vascular Architecture can be Imaged
Figure 1. Rat hind-
quarters using a
contrast agent injected
Into the blood stream.
7T system.
(Varian website)

T2 Contrast agents
T2 contrast agent: increase R2 rate, e.g. iron oxide nanoparticles.
TEM images of Fe3O4, CoFe2O4, and MnFe2O4
Category
Nano-particles:
Mono-disperse (non-aggregated) iron oxide core (<20nm)
Ultra-small iron oxide:
Mono-disperse (<50nm)
Super-Paramagnetic Iron Oxide (SPIO)
Aggregated iron oxide core (>50nm)
Properties
Highly susceptible to magnetic fields and therefore easily magnetized
Applications: tracking/monitoring of labeled stem/tumor cells
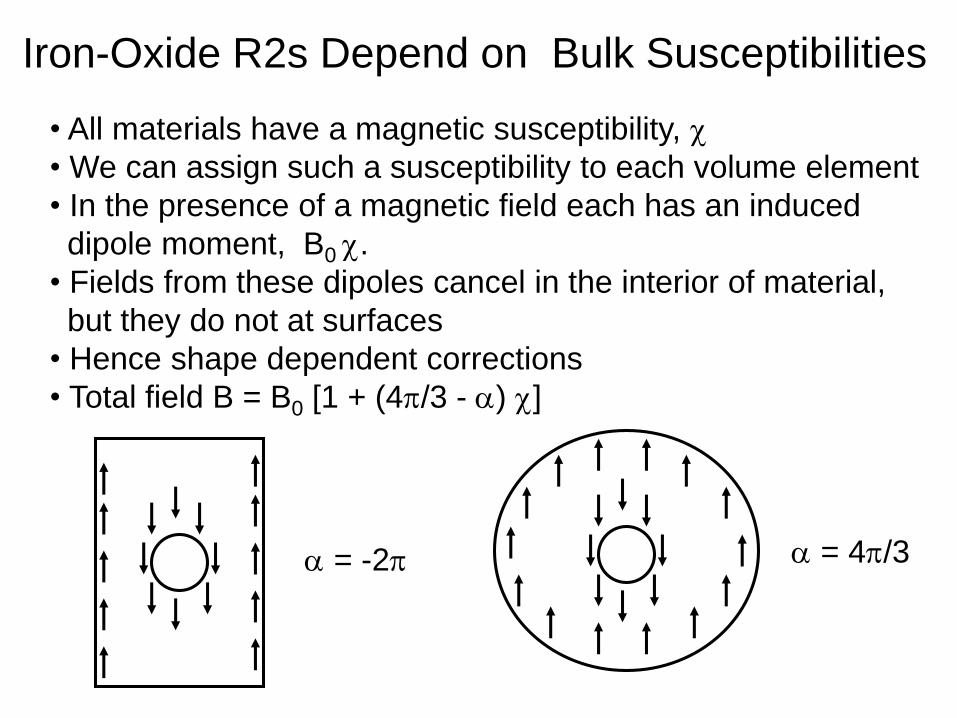
Iron-Oxide R2s Depend on Bulk Susceptibilities
• All materials have a magnetic susceptibility,
• We can assign such a susceptibility to each volume element
• In the presence of a magnetic field each has an induced
dipole moment, B0 .
• Fields from these dipoles cancel in the interior of material,
but they do not at surfaces
• Hence shape dependent corrections
• Total field B = B0 [1 + (4/3 - ) ]
= -2 = 4/3

Quantification of iron concentration: T2* Relaxometry
• Can infer agent concentration from relaxation rates
• Basic premise is to observe the increase in relaxation rate with the Fe-based agent relaxivity known.
• Applies to T2 or T2*
• Experimental evidence shows relaxation rate is approximately linear at low concentration
CrRR Fe *
20
*
2
Picture adapted from Liu et al Magn Reson Med. 2009 Apr;61(4):761-6

Visualizing Implanted Stem Cells
These cells are labeled
with iron oxide nano-
particles and cells have
been injected into a mouse
heart. Data are from a 7T
MRI system.
(Kustermann et al. (2005)
NMRIn Biomedicine, 18,
362-370)
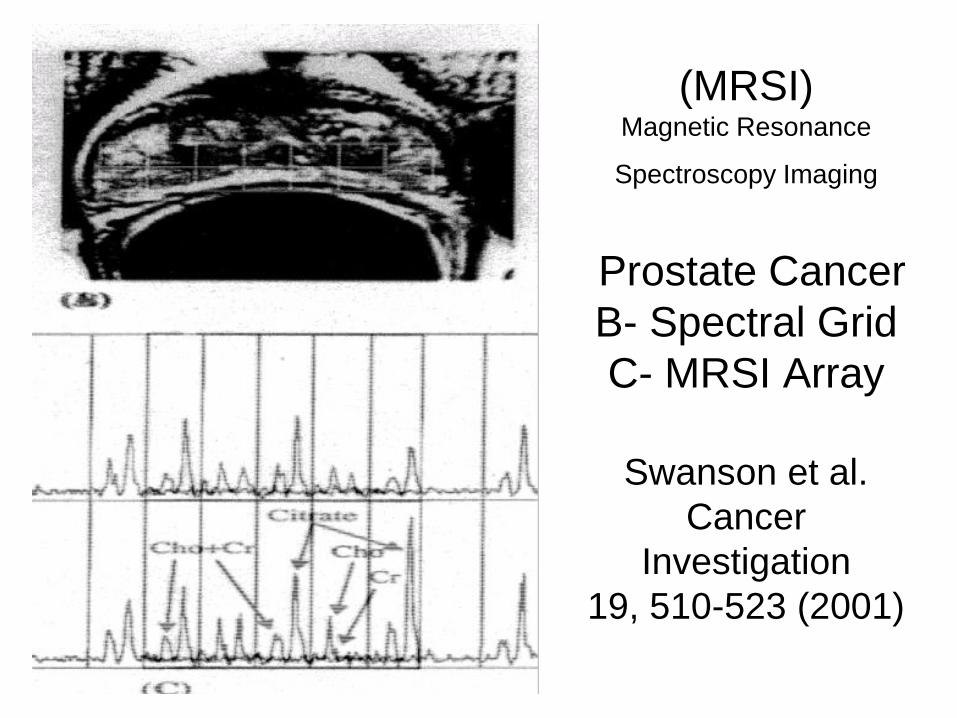
(MRSI)Magnetic Resonance
Spectroscopy Imaging
Prostate Cancer
B- Spectral Grid
C- MRSI Array
Swanson et al.
Cancer
Investigation
19, 510-523 (2001)
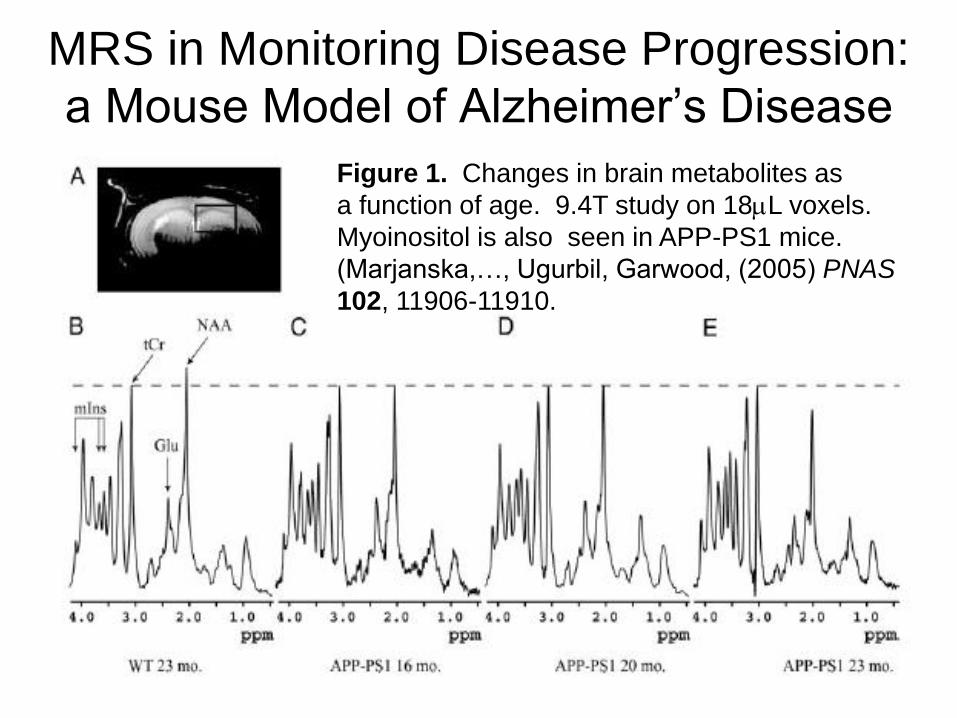
MRS in Monitoring Disease Progression:
a Mouse Model of Alzheimer’s Disease
Figure 1. Changes in brain metabolites as
a function of age. 9.4T study on 18L voxels.
Myoinositol is also seen in APP-PS1 mice.
(Marjanska,…, Ugurbil, Garwood, (2005) PNAS
102, 11906-11910.