Embed Size (px)
Citation preview

The Astrophysical Journal, 732:97 (12pp), 2011 May 10 doi:10.1088/0004-637X/732/2/97C© 2011. The American Astronomical Society. All rights reserved. Printed in the U.S.A.
MAGNETIC FIELD STRUCTURE AROUND LOW-MASS CLASS 0 PROTOSTARS:B335, L1527, AND IC348-SMM2
J. A. Davidson1, G. Novak
2, T. G. Matthews
2, B. Matthews
3,4, P. F. Goldsmith
5, N. Chapman
5,
N. H. Volgenau6, J. E. Vaillancourt
7, and M. Attard
81 School of Physics, University of Western Australia, 35 Stirling Hwy, Crawley, WA 6009, Australia
2 Department of Physics and Astronomy, Northwestern University, 2131 Tech Dr., Evanston, IL 60208, USA3 Herzberg Institute of Astrophysics, National Research Council of Canada, 5071 West Saanich Road, Victoria, BC, V9E 2E7, Canada
4 Department of Physics and Astronomy, University of Victoria, 3800 Finnerty Road, Victoria, BC, V8P 1A1, Canada5 Jet Propulsion Laboratory, California Institute of Technology, 4800 Oak Grove Dr., Ms 264-782, Pasadena, CA 91109, USA
6 California Institute of Technology, Owens Valley Radio Observatory, Big Pine, CA 93513, USA7 Universities Space Research Association, SOFIA, NASA Ames Research Center, MS 211-3, Moffett Field, CA 94035-0001, USA8 Laboratoire AIM, CEA/DSM-CNRS-Universite Paris Diderot, IRFU/Service d’Astrophysique, CEA Saclay, Orme des Merisiers,
91191 Gif-sur-Yvette, FranceReceived 2010 September 27; accepted 2011 March 7; published 2011 April 21
ABSTRACT
We report new 350 μm polarization observations of the thermal dust emission from the cores surrounding the low-mass, Class 0 young stellar objects L1527, IC348-SMM2, and B335. We have inferred magnetic field directionsfrom these observations and have used them together with results in the literature to determine whether magneticallyregulated core-collapse and star formation models are consistent with the observations. These models predict apseudo-disk with its symmetry axis aligned with the core magnetic field. The models also predict a magnetic fieldpinch structure on a scale less than or comparable to the infall radii for these sources. In addition, if the coremagnetic field aligns (or nearly aligns) the core rotation axis with the magnetic field before core collapse, thenthe models predict the alignment (or near alignment) of the overall pinch field structure with the bipolar outflowsin these sources. We show that if one includes the distorting effects of bipolar outflows on magnetic fields, thenin general the observational results for L1527 and IC348-SMM2 are consistent with these magnetically regulatedmodels. We can say the same for B335 only if we assume that the distorting effects of the bipolar outflow onthe magnetic fields within the B335 core are much greater than for L1527 and IC348-SMM2. We show that theenergy densities of the outflows in all three sources are large enough to distort the magnetic fields predicted bymagnetically regulated models.
Key words: ISM: jets and outflows – ISM: magnetic fields – stars: formation – techniques: polarimetric
Online-only material: color figures
1. INTRODUCTION
Only a few percent of the mass of a molecular cloud istypically converted into stars (McKee & Ostriker 2007;Goldsmith et al. 2008). The rate of star formation inferredfor molecular clouds in general is significantly less than thatexpected from free-fall gravitational collapse of the gravita-tionally bound mass in these regions. Consequently, there mustbe some mechanism which regulates the rate of star formationwithin molecular clouds. Two mechanisms have been proposed;magnetic support (e.g., Shu et al. 1987; Mouschovias & Ciolek1999) and super-Alfvenic turbulence (e.g., Mac Low & Klessen2004). In addition, observations (Goldsmith & Arquilla 1985;Goodman et al. 1993) show that the rotation rates of cores(density � 104 cm−3; size ∼ 0.1 pc) are less than expected forcores condensed from their less dense background clouds. In themodels favoring magnetic support, this slow core rotation is theresult of magnetic braking (Mestel 1985; Basu & Mouschovias1994). Mouschovias & Paleologou (1979, 1980) showed ana-lytically that the braking timescale for a cloud rotating with itsrotation axis perpendicular to the magnetic field is typically anorder of magnitude smaller than for a cloud rotating with itsaxis of rotation parallel to the magnetic field. This results incore rotation rates reduced in amplitude and core rotation axestending to align with the cloud magnetic field immediately inthe vicinity of cores. In this paper, we use our submillimeterpolarimetry results to test gross features of the magnetically
regulated core-collapse and star formation models in theliterature.
A key feature of many such magnetically regulated dynamicalcollapse models (Shu et al. 1987; Allen et al. 2003a, 2003b;Galli & Shu 1993a, 1993b; Shu et al. 2004; Tomisaka 1998)is the formation of a flattened inner core (or “pseudo-disk”) ofseveral thousand AU in extent with its symmetry axis parallelto the core magnetic field. This pseudo-disk is the inner part ofthe infall region of the core surrounding a young stellar object(YSO); it is not formed by rotation, but by the geometry ofthe magnetic field. The pseudo-disk is a dynamically collapsingentity, accreting onto the protostar and its associated Kepleriandisk (size ∼100 AU). Signatures of magnetic regulation includea fairly uniform magnetic field outside the infall region of acore, a pinched magnetic field line structure within this region,and the overall direction of the magnetic field parallel to theaxis of symmetry of the pseudo-disk. The level of uniformityof the field outside the infall region depends on the quasi-staticevolution prior to the dynamical collapse of the core. In theGalli & Shu (1993a, 1993b) models, the field lines outside theinfall region are uniform, but in the Allen et al. (2003b, hereafterASL03b) and Allen et al. (2003a, hereafter ALS03a) models,they are already inclined toward a gentle pinch configurationthrough quasi-static contraction of the core as a whole beforethe onset of the dynamical inside-out collapse of the inner core.
Various mechanisms have been proposed to remove angu-lar momentum from the gas falling onto a protostar through
1

The Astrophysical Journal, 732:97 (12pp), 2011 May 10 Davidson et al.
Figure 1. Schematic summarizing the magnetically regulated core-collapsescenario outlined in Section 1. Typically, the diameter of the infall region is∼10,000 AU, the diameter of a pseudo-disk is ∼2000 AU, and the diameterof a Keplerian disk is ∼100 AU. In the magnetically regulated core-collapsescenario: the pseudo-disk symmetry axis is aligned with the core magnetic field;and magnetic braking tends to align the core rotation axis with the magneticfield, but this alignment may not be exact. The pseudo-disk is a dynamicallycollapsing object formed by the magnetic fields, not rotation. The Kepleriandisk is an object formed by rotation and so its symmetry axis is aligned withthe core’s rotation axis, as too is the outflow axis if the outflow is driven byrotation.
a Keplerian disk within the inner core; many use the ob-served, ubiquitous, bipolar outflows which turn on during theClass 0 phase of star formation (Konigl & Pudritz 2000; Shuet al. 2000; Tomisaka 1998). The general expectation from theabove magnetically regulated collapse and outflow models isthat the outflow axis will be parallel or nearly so to the coremagnetic field, since in these models the core rotation axis isaligned or nearly aligned with the core magnetic field, and sothe Keplerian disk and bipolar outflow axes are also parallel ornearly parallel to the core magnetic field lines. The schematicand caption in Figure 1 summarize the above magnetically reg-ulated scenario.
The basic scenario depicted in Figure 1 has not been observa-tionally verified; so far observations tailored to test parts of thisscenario have not provided irrefutable evidence for the generalexistence of pseudo-disks, let alone the alignment of the meanmagnetic fields with respect to the symmetry axis of these disks.Recent polarimetry studies by Ward-Thompson et al. (2009) andTassis et al. (2009) imply mean magnetic field directions morealigned with the short axis of observed flattened cores than not(consistent with Figure 1), but by no means aligned. The sta-tistical analysis of Tassis et al. (2009) of their 24 high-massstar-forming regions assumed random line-of-sight angles forthe cores and magnetic fields, resulting in a best-fit model con-sisting of a thick oblate core with a magnetic field on averagehaving an angle of 24◦ to the short axis of the core. Tassiset al. (2009) state that more observations are required in order toreduce the inaccuracies caused by unknown line-of-sight pro-jection effects, but their results do provide some validity to the
pseudo-disk scenario, albeit with slightly misaligned magneticfield configurations.
In regards to the near alignment of the outflow to the magneticfield shown in Figure 1, Menard & Duchene (2004) usedpolarization measurements of background stars to study therelative orientations of the jets from Classical T Tauri stars(CTTS) embedded in the Taurus-Auriga molecular cloud andthe magnetic field in their vicinity. Typically the backgroundstars used in this study were separated by about 0.◦5 or morefrom the evolved CTTS being examined, so the magnetic fieldbeing probed in this way is not that of the field of a remnant coresurrounding the CTTS, but the magnetic field of the molecularcloud in the vicinity of the CTTS. This study concluded thatthe jets of embedded CTTS in the molecular cloud Taurus-Auriga are not aligned with the large-scale molecular cloudmagnetic fields. Indeed the jets within this one molecular cloudare not aligned with each other. Large-scale turbulence may playa role—possibly producing angular momentum and magneticstructures within the cores which are not aligned with themajor axis of symmetry or the large-scale magnetic field ofthe much larger parent molecular cloud. Possible evidence forthis can be seen in Taurus-Auriga in the two pre-stellar coresobserved by Kirk et al. (2006), for which the polarized 850 μmemission indicates changes in magnetic field directions in thecores relative to the large-scale magnetic field in the cloud. It isthe magnetic field in these cores, not the large-scale magneticfield, that may align the direction of future outflows from thatcore if magnetic regulation occurs within the cores. Hence, theresults of Menard & Duchene (2004) do not necessarily disprovethe magnetically regulated scenario.
Vallee et al. (2000), Henning et al. (2001), Matthews &Wilson (2002), Vallee et al. (2003), Wolf et al. (2003), Girartet al. (2006), Kwon et al. (2006), and Attard et al. (2009),among others, undertook observational studies of magnetic fieldstructures within cores containing low-mass, embedded YSOswith bipolar outflows using polarized submillimeter continuumemission. Low-mass YSOs are good objects to study becausethey tend to be embedded in simple, relatively isolated regions.The results of the above studies taken as a whole do not showa clear case for the alignment of outflows with core magneticfields. However, most of the YSOs in this combined sample arebinaries, are very distant, are not Class 0, or do not have theiroutflow axis lying close to the plane of the sky. The last criterionis an important one because a pinched magnetic field structure,which is symmetric about an axis of an outflow with a large line-of-sight component, would produce polarization vectors with alarge variation in position angles. To minimize projection effectswhen testing the theory of alignment between outflows and coremagnetic fields, the axis of the outflow should lie close to theplane of the sky.
We have begun a survey of low-mass, isolated (single),nearby (� 400 pc), Class 0 YSOs that have well-defined bipolaroutflows which lie nearly in the plane of the sky. Our studywill provide maps of the 350 μm polarization vectors within a10,000 AU radius around each embedded YSO in our survey.We will also provide interferometric maps of the outflows withinthe cores for each of our survey YSOs where such maps do notalready exist. This is so we can better determine the orientationof the outflow and its interaction with the core gas. We are using350 μm rather than longer wavelength polarization because wewant to obtain the best spatial resolution using SHARP (seeSection 2), and because 350 μm emission is weighted towardthe warmer emission of the cores immediately surrounding a
2

The Astrophysical Journal, 732:97 (12pp), 2011 May 10 Davidson et al.
YSO rather than toward the extended cooler core envelope. Thispaper gives a summary of our results on three of the YSOs in ourstudy, L1527, B335, and IC348-SMM2. Section 2 outlines ourobservations and summarizes our results, Section 3 comparesthese results to magnetically regulated models, and Section 4gives our conclusions.
2. OBSERVATIONS AND RESULTS
2.1. Polarimetry Observations and Data Analysis
The observations presented here were carried out at the Cal-tech Submillimeter Observatory (CSO) using the SHARP po-larimeter. SHARP is a fore-optics module that provides po-larimetric capability to SHARC-II, the CSO’s 32 × 12 pixelsubmillimeter camera. SHARP divides the incident submillime-ter radiation into two orthogonally polarized beams that are thenreimaged onto the two ends of the “long and skinny” SHARC-IIdetector. A half-wave plate upstream of the polarization-splittingoptics is rotated every few minutes during data collection, andthe two orthogonally polarized 12 × 12 pixel “sub-images” ac-quired for four different half-wave plate angles are combined insoftware to determine the total flux as well as the linear polariza-tion state of the radiation. SHARC-II and SHARP are described,respectively, by Dowell et al. (2003) and Li et al. (2008). The350 μm observations described here were made with a beamsize of 10′′ (FWHM).
The data were collected in chop-nod mode. This involvesrapidly modulating the tilt of the CSO secondary mirror in cross-elevation (“chopping”) while more slowly “nodding” the entiretelescope back and forth, thereby making near simultaneousmeasurements of the source and two nearby sky referencepositions. A chop-nod observation is carried out at each of thefour half-wave plate angles (0◦, 22.◦5, 45◦, and 67.◦5) therebyforming a “half-wave plate cycle.” As described by Dowell et al.(1998) and Kirby et al. (2005), the net effect is that the totalsource flux and a component of the linearly polarized flux aremeasured for each half-wave plate position in a cycle, whileremoving the spatially extended “background” that includesatmospheric and telescope emission as well as any Galacticemission covering a sky area large compared to the chopperthrow. For the observations described here, the chopper throwranged from 120′′ (for B335 and L1527) to 300′′ (for IC348-SMM2) and the chopping frequency was ∼1 Hz. Because ofsky rotation, the reference beams rotate about the main beamon the sky as the source is tracked. Our three targets do haveextended flux, so it was necessary to avoid making observationsat hour angles for which significant source flux contaminatesthe reference beams.
Each SHARP half-wave plate cycle requires about 7 minutesof elapsed time. In between successive half-wave plate cycles,the pointing position is dithered by about 10′′–20′′. Data wereobtained for B335 during the nights of 2007 April 28–30(∼80 cycles; zenith submillimeter opacity τ350 μm ∼1.0–1.8),for IC348-SMM2 on the night of 2007 November 10 (∼20cycles; τ350 μm ∼1.0), and for L1527 during the nights of 2007November 9 and 10 and 2008 September 6 and 10 (∼85 cycles,τ350 μm ∼ 0.8–1.2).
SHARP data analysis is carried out in two steps. In thefirst step, each individual half-wave plate cycle is processedto obtain three 12 × 12 pixel maps, one for each of the Stokesparameters I, Q, and U. (Parameter I corresponds to the total fluxwhile Q and U fully characterize the linearly polarized flux.) Adetailed discussion of the techniques used during this first step
can be found in Section 3.4 of Hildebrand et al. (2000) andEquations (2)–(4) of Attard et al. (2008). Corresponding errormaps are also obtained for each of the three Stokes parameters.This is done by first using the variance in the individual total andpolarized flux measurements to estimate the uncertainties in thistime stream (as in Section 4.1 of Dowell et al. 1998) and thenpropagating these uncertainties to the Stokes parameter maps.At this point, we remove from the Stokes parameter maps anypixels that have abnormally high errors.
The second step of the analysis involves combining thesesingle-cycle 12 × 12 pixel maps of I, Q, and U, to form fi-nal maps of I, Q, and U. We account for the dithering and thesky rotation by interpolating the single-cycle maps onto a reg-ular equatorial-coordinate grid, which causes a modest loss ofangular resolution (Houde & Vaillancourt 2007). Errors in thefinal maps are propagated from the corresponding errors in thesingle-cycle maps. Corrections for changing atmospheric opac-ity (Kirby et al. 2005) as well as for instrumental polarizationand polarimetric efficiency (Li et al. 2008) are also made duringthis second analysis step.
An important question that we can ask during the second stepof the analysis is whether the single-cycle Q and U maps areconsistent with one another within their nominal errors. Recallthat these nominal errors are computed during the first step of theanalysis. A quantitative answer to this question is provided bythe reduced chi-squared, χ2
r . Averaging together the χ2r values
found over the Q and U maps of each source, we obtain meanχ2
r values of 1.7 for L1527, 1.5 for IC348-SMM2, and 2.1 forB335. We do not know the origin of the extra errors that causethese elevated χ2
r values. However, for each of our three datasets (one for each source), we were able to verify that theseerrors occur mainly on timescales that are short compared tothe total duration of the data set. (This duration is several hoursfor IC348-SMM2, and several days or even longer for the othertwo sources.) Thus, it seems reasonable to treat the extra errorsas if they are statistical in nature. Accordingly, we inflate ournominal errors by the square root of χ2
r .Finally, the degree P and angle φ of polarization and their
associated errors σP and σφ are computed for each sky positionvia standard techniques (see Section 3.4 of Hildebrand et al.2000). The uncertainties σP and σφ are affected by both thepolarized flux errors (σQ, σU ) and the total flux errors (σI ). Thelatter have a negligible effect, however, because P � 100%.We consider sky positions for which P � 2σP to be polarizationdetections and sky positions for which P + 2σP < 1.0% to below upper limits on P. P is then corrected downward to accountfor polarization bias (as described in Section 4.2 of Hildebrandet al. 2000 and in Vaillancourt 2006). We keep track of the skypositions where the polarimetric significance drops below 2σafter this bias correction, as discussed below.
Note that we have chosen to set our detection threshold atP � 2σP rather than applying the more conservative criterionP � 3σP used for previous SHARP observations (e.g., Attardet al. 2009). When using the latter, more conservative threshold,the 1σ uncertainties σφ in the angles of polarization (whichtranslate into 1σ uncertainties in the magnetic field angles) arebelow ∼9.◦5 (Serkowski 1962). With our more lenient threshold,these 1σ error bars range up to almost 15◦ (see Table 1).Because our goal in this paper is to test the gross predictions ofthe magnetically regulated collapse models rather than its finedetails, we believe that this degree of uncertainty is acceptable.However, it should be kept in mind when interpreting ourpolarimetry results.
3

The Astrophysical Journal, 732:97 (12pp), 2011 May 10 Davidson et al.
(a) (b)
Figure 2. (a) 350 μm polarization vectors for L1527. The thickness of each vector indicates the significance, with all vectors having significance greater than 2σ
before bias correction (see Section 2.2). Note the very low polarization (� 0.9%) marked by a small open circle near the flux peak (see Section 2.2). The contoursindicate the total intensity, I, measured by SHARP. The highest contour level corresponds to 90% of the peak flux, and each subsequent contour represents a decrementof 10% of the peak flux. (b) Inferred magnetic field directions superimposed on a section of a figure from Hogerheijde et al. (1998) showing 12CO 3–2 observationsof the bipolar outflow (contours) and an HCO+ map tracing gas on the cavity walls surrounding the outflow (gray area). B-vectors in regions having 350 μm flux lessthan 25% of the peak are shown as dashed lines. The full Hogerheijde et al. figure shows the blueshifted outflow (solid contours) extending 2′ east and the redshiftedoutflow (dashed contours) extending 2′ west from the YSO in L1527. The large dashed circles in (a) and (b) show the extent of the measured infall region for thisobject (Myers et al. 1995; Zhou et al. 1996).
(A color version of this figure is available in the online journal.)
Table 1SHARP 350 μm Polarimetry Results
Source Δαa Δδa P σp φb σφ
(arcsec) (arcsec) (%) (%) (deg) (deg)
L1527 38.0 9.5 5.6 2.1 −51.0 9.528.5 19.0 3.3 1.6 −56.1 12.019.0 9.5 2.5 0.9 −63.7 9.719.0 19.0 3.5 1.1 −41.7 10.19.5 −28.5 5.8 1.8 18.2 9.09.5 0.0 1.0 0.5 −66.4 12.39.5 9.5 1.6 0.5 −36.5 9.6
−9.5 −19.0 2.8 1.3 3.1 10.0−9.5 −9.5 1.8 0.7 −13.2 10.3
−19.0 −9.5 2.2 1.2 −28.4 14.5IC348-SMM2 9.5 19.0 5.7 2.1 84.8 10.5
0.0 19.0 6.3 2.4 81.6 9.4−9.5 −28.5 9.2 3.7 −9.8 10.0−9.5 19.0 5.1 2.8 61.9 12.8
−19.0 −28.5 9.5 4.4 −4.7 11.0−19.0 −19.0 5.8 3.0 4.0 11.8−19.0 19.0 7.9 3.4 54.4 13.3−28.5 −9.5 5.9 2.9 33.7 11.4−28.5 0.0 9.4 3.1 32.3 8.2−28.5 9.5 8.0 4.1 26.3 12.0
B335 9.5 −19.0 3.2 1.5 56.5 11.99.5 −9.5 1.3 0.7 58.8 14.6
Notes.a Offsets from YSO positions given in Table 2.b Position angle of the polarization E-vector, measured east of north.
2.2. Polarimetry Results
Our polarization detections for L1527, IC348-SMM2, andB335 are presented in Table 1. Figures 2(a), 3(a), and 4(a)illustrate the results listed in Table 1. Contours indicate thetotal intensity, I, measured by SHARP. The highest contourlevel corresponds to 90% of the peak flux, and each subsequentcontour represents a decrement of 10% of the peak flux. Ex-cept for very narrow strips at the map edges, all sky positions
mapped have total flux errors well below 10% of the peakflux. The morphologies seen in our total intensity contour mapsthus represent real structures, with the exception of a few verysmall flux peaks and flux holes seen at the map edges (e.g.,southwest edge of Figure 3(a), and northeast and northwestedges of Figure 4(a)). All three sources have been mapped at850 μm (Chandler & Richer 2000; Hatchell et al. 2005;Jørgensen et al. 2007), and the morphologies seen at this longerwavelength are similar to those seen in our SHARP maps.
The bars in Figures 2(a), 3(a), and 4(a) indicate polarizationdetections. The length of each bar is proportional to P (seekey at bottom left of each figure) and its orientation indicatesthe direction of the E-vector of the polarized radiation. Thethickness of each bar shows its significance: sky points havinggreater than 3σ significance after bias correction are thickest,points with greater than 2σ post-correction significance but lessthan 3σ have intermediate thickness, and sky points for whichthe significance drops below 2σ after bias correction are shownusing the thinnest bars. For two sky positions, we obtained 2σupper limits below 1.0%. These correspond to the peak of B335,where we find a 2σ limit of 0.6% and a position offset from thepeak of L1527 by (Δα, Δδ) = (+9.′′5, −9.′′5), where our 2σ limitis 0.9%. Although we do not make use of these upper limits inthis paper, we include them in our figures since they representsensitive measurements that may one day be useful. The twolimits are indicated with open circles in Figures 2(a) and 4(a).
Comparing our polarization results for B335 with the 850 μmpolarimetry of this source presented by Wolf et al. (2003,hereafter WLH03), we find reasonable agreement. The WLH03map is discussed further in Section 3.2.2 below. Similarly, the850 μm polarization map of L1527 that is presented with nointerpretation in the SCUPOL archive paper (Matthews et al.2009) agrees with our 350 μm polarization map of this source.In making these comparisons, we refer only to the measuredangles of polarization since the degree of polarization ofthermal dust emission is known to generally have considerablewavelength dependence (Vaillancourt et al. 2008 and referencestherein).
4

The Astrophysical Journal, 732:97 (12pp), 2011 May 10 Davidson et al.
(a) (b)
Figure 3. (a) 350 μm polarization vectors for IC348-SMM2. The thickness of each vector indicates the significance, with all vectors having significance greater than2σ before bias correction (see Section 2.2). The contours indicate the total intensity, I, measured by SHARP. The highest contour level corresponds to 90% of the peakflux, and each subsequent contour represents a decrement of 10% of the peak flux. The dashed lines crossing at (0,0) represent the major and minor axes of the 65%contour, which after background subtraction best represents the FWHM of the compact inner core. (b) Inferred magnetic field directions superimposed on a sectionof a figure from Tafalla et al. (2006) which includes a 12CO 2–1 outflow map (contours) and the 1.2 mm continuum map tracing the dust (gray scale). B-vectors inregions having 350 μm flux less than 25% of the peak are shown as dashed lines. The full Tafalla et al. figure shows the blueshifted outflow (solid contours) extending1.′5 NW and the redshifted outflow (dashed contours) extending 1.′5 SE from IC348-SMM2. The white dash-dotted contour and the black dash-dotted straight linessuperimposed on this image represent the 65% intensity contour in (a) and the projection of the major and minor axes of this contour. The large dashed circles in (a)and (b) show the extent of the infall region assumed in this paper for comparison with theory (see Section 3.2).
(A color version of this figure is available in the online journal.)
(a)
(b)
Figure 4. (a) 350 μm polarimetry vectors for B335. The thickness of each vector indicates the significance, with both vectors having significance greater than 2σ
before bias correction (see Section 2.2). Note the very low polarization (� 0.6%) marked by a small open circle on the flux peak (see Section 2.2). The contoursindicate the total intensity, I, measured by SHARP. The highest contour level corresponds to 90% of the peak flux, and each subsequent contour represents a decrementof 10% of the peak flux. (b) Inferred magnetic field directions superimposed on our new interferometric outflow measurements of the 12CO 1–0 line (contours) usingCARMA with a beam size of 4.′′4 × 3.′′8. The B-vectors in regions having 350 μm flux less than 25% of the peak are shown as dashed lines. The full extent of theoutflow as measured by Hirano et al. (1988) in 12CO 1–0 is 4′ east (blue lobe) to 4′ west (red lobe) from the YSO in B335. The large dashed circles in (a) and (b) showthe extent of the measured infall region for this object (Zhou et al. 1993).
(A color version of this figure is available in the online journal.)
2.3. B335 Outflow Observations and Data Analysis
The B335 350 μm emission is very compact (see Figure 4(a)).To date, outflow maps for B335 have not been made withsufficient spatial resolution to determine the structure andkinematics of the outflow within the compact core region ofB335. As part of our survey, we measured the outflow withinthe B335 core using the CARMA interferometer.
The CARMA observations of B335 were made with the 15-element array in the D configuration in 2008 July. The totalduration of the observations was 8.4 hr. The QSO 1925+211was the phase calibrator; its flux was determined to be 1.2 Jy,
using both Uranus and Neptune as flux calibrators. Observationsof 3C454.3 were used to calibrate the passband structure. Thecorrelator was configured to place the CO 1–0 line in the uppersideband; with 63 channels across a 7.6 MHz bandwidth, the ve-locity resolution at 115.271 GHz is approximately 0.32 km s−1.Phase calibration was carried out on observations of the 2.7 mmcontinuum emission in two 500 MHz bands. The gains deter-mined for these wide (continuum) bands were then applied tothe narrow (line) bands.
The data were calibrated and mapped using the MIRIADsoftware package. The Fourier transform of u, v visibilities wastaken, constrained by an image cell size of 1′′ and a natural
5
The Astrophysical Journal, 732:97 (12pp), 2011 May 10 Davidson et al.
(a) (b)
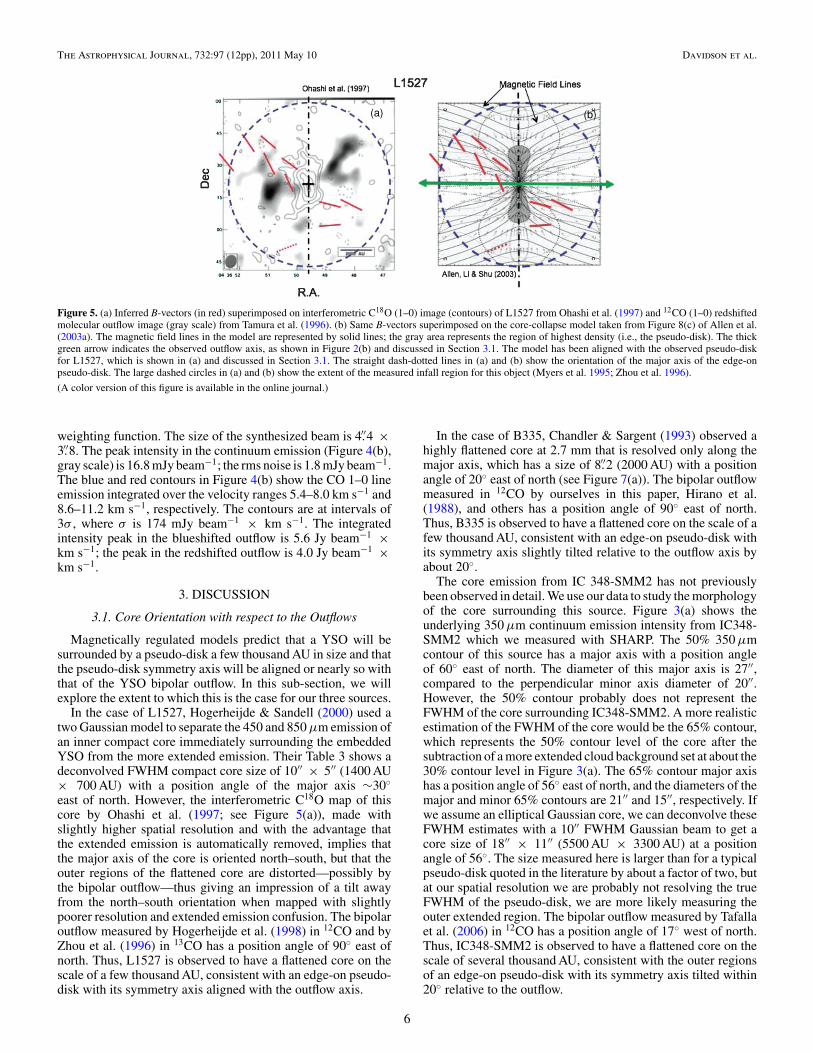
Figure 5. (a) Inferred B-vectors (in red) superimposed on interferometric C18O (1–0) image (contours) of L1527 from Ohashi et al. (1997) and 12CO (1–0) redshiftedmolecular outflow image (gray scale) from Tamura et al. (1996). (b) Same B-vectors superimposed on the core-collapse model taken from Figure 8(c) of Allen et al.(2003a). The magnetic field lines in the model are represented by solid lines; the gray area represents the region of highest density (i.e., the pseudo-disk). The thickgreen arrow indicates the observed outflow axis, as shown in Figure 2(b) and discussed in Section 3.1. The model has been aligned with the observed pseudo-diskfor L1527, which is shown in (a) and discussed in Section 3.1. The straight dash-dotted lines in (a) and (b) show the orientation of the major axis of the edge-onpseudo-disk. The large dashed circles in (a) and (b) show the extent of the measured infall region for this object (Myers et al. 1995; Zhou et al. 1996).
(A color version of this figure is available in the online journal.)
weighting function. The size of the synthesized beam is 4.′′4 ×3.′′8. The peak intensity in the continuum emission (Figure 4(b),gray scale) is 16.8 mJy beam−1; the rms noise is 1.8 mJy beam−1.The blue and red contours in Figure 4(b) show the CO 1–0 lineemission integrated over the velocity ranges 5.4–8.0 km s−1 and8.6–11.2 km s−1, respectively. The contours are at intervals of3σ , where σ is 174 mJy beam−1 × km s−1. The integratedintensity peak in the blueshifted outflow is 5.6 Jy beam−1 ×km s−1; the peak in the redshifted outflow is 4.0 Jy beam−1 ×km s−1.
3. DISCUSSION
3.1. Core Orientation with respect to the Outflows
Magnetically regulated models predict that a YSO will besurrounded by a pseudo-disk a few thousand AU in size and thatthe pseudo-disk symmetry axis will be aligned or nearly so withthat of the YSO bipolar outflow. In this sub-section, we willexplore the extent to which this is the case for our three sources.
In the case of L1527, Hogerheijde & Sandell (2000) used atwo Gaussian model to separate the 450 and 850 μm emission ofan inner compact core immediately surrounding the embeddedYSO from the more extended emission. Their Table 3 shows adeconvolved FWHM compact core size of 10′′ × 5′′ (1400 AU× 700 AU) with a position angle of the major axis ∼30◦east of north. However, the interferometric C18O map of thiscore by Ohashi et al. (1997; see Figure 5(a)), made withslightly higher spatial resolution and with the advantage thatthe extended emission is automatically removed, implies thatthe major axis of the core is oriented north–south, but that theouter regions of the flattened core are distorted—possibly bythe bipolar outflow—thus giving an impression of a tilt awayfrom the north–south orientation when mapped with slightlypoorer resolution and extended emission confusion. The bipolaroutflow measured by Hogerheijde et al. (1998) in 12CO and byZhou et al. (1996) in 13CO has a position angle of 90◦ east ofnorth. Thus, L1527 is observed to have a flattened core on thescale of a few thousand AU, consistent with an edge-on pseudo-disk with its symmetry axis aligned with the outflow axis.
In the case of B335, Chandler & Sargent (1993) observed ahighly flattened core at 2.7 mm that is resolved only along themajor axis, which has a size of 8.′′2 (2000 AU) with a positionangle of 20◦ east of north (see Figure 7(a)). The bipolar outflowmeasured in 12CO by ourselves in this paper, Hirano et al.(1988), and others has a position angle of 90◦ east of north.Thus, B335 is observed to have a flattened core on the scale of afew thousand AU, consistent with an edge-on pseudo-disk withits symmetry axis slightly tilted relative to the outflow axis byabout 20◦.
The core emission from IC 348-SMM2 has not previouslybeen observed in detail. We use our data to study the morphologyof the core surrounding this source. Figure 3(a) shows theunderlying 350 μm continuum emission intensity from IC348-SMM2 which we measured with SHARP. The 50% 350 μmcontour of this source has a major axis with a position angleof 60◦ east of north. The diameter of this major axis is 27′′,compared to the perpendicular minor axis diameter of 20′′.However, the 50% contour probably does not represent theFWHM of the core surrounding IC348-SMM2. A more realisticestimation of the FWHM of the core would be the 65% contour,which represents the 50% contour level of the core after thesubtraction of a more extended cloud background set at about the30% contour level in Figure 3(a). The 65% contour major axishas a position angle of 56◦ east of north, and the diameters of themajor and minor 65% contours are 21′′ and 15′′, respectively. Ifwe assume an elliptical Gaussian core, we can deconvolve theseFWHM estimates with a 10′′ FWHM Gaussian beam to get acore size of 18′′ × 11′′ (5500 AU × 3300 AU) at a positionangle of 56◦. The size measured here is larger than for a typicalpseudo-disk quoted in the literature by about a factor of two, butat our spatial resolution we are probably not resolving the trueFWHM of the pseudo-disk, we are more likely measuring theouter extended region. The bipolar outflow measured by Tafallaet al. (2006) in 12CO has a position angle of 17◦ west of north.Thus, IC348-SMM2 is observed to have a flattened core on thescale of several thousand AU, consistent with the outer regionsof an edge-on pseudo-disk with its symmetry axis tilted within20◦ relative to the outflow.
6

The Astrophysical Journal, 732:97 (12pp), 2011 May 10 Davidson et al.
In summary, we do see evidence for pseudo-disks and atendency for alignment, within 20◦, of the pseudo-disk sym-metry axis and the outflow axis for each of the YSOs in oursample.
3.2. Inferred Magnetic Field Structures
Our submillimeter polarization measurements displayed inFigures 2(a), 3(a), and 4(a) do not give a measure of the strengthof the magnetic field, but they do give an indication of thenet magnetic field direction (Lazarian 2007) and the level ofuniformity (Hildebrand et al. 2009) along a given line of sight.The net magnetic field direction along a given line of sight isperpendicular to the submillimeter polarization vector measuredfor that line of sight (Lazarian 2007). Figures 2(b), 3(b), and 4(b)display the direction of the magnetic fields surrounding L1527,IC348-SMM2, and B335, respectively, as determined by thepolarimetry E-vectors rotated by 90◦. We compare these fielddirections with our observations of the cores’ density structure(i.e., pseudo-disk) and velocity structure (i.e., outflows, infallradii). We note, however, that our polarization data for the threecores likely contain contributions from both the magnetic fieldassociated with the core under study as well as that associatedwith the larger surrounding cloud. To see this, recall (Section 1)that the maps shown by Kirk et al. (2006) reveal large changesin field direction as one moves away from the center of a coreinto the surrounding cloud material; and note that these changesoccur at positions located about 1 arcmin (∼8000 AU) from thecenters of the Kirk et al. (2006) cores, while our own mapsextend out to distances of 7000–15,000 AU from the centralYSO. Thus, a significant fraction of the emission we haveobserved may originate from the cloud at large, not the coreunder study.
One way to account for such contamination is to flagpolarization measurements made at positions having lower fluxdensity. Such measurements could be contaminated to a largedegree by line-of-sight emission associated with the largerparent cloud. The fluxes we measure at the edges of our threemaps range from ∼5% to ∼40% of the respective peak flux(see contours in Figures 2(a), 3(a), and 4(a)). We have chosento set a “contamination threshold” at 25% of peak flux; wewill consider polarization measurements obtained at positionshaving flux below this threshold to be at risk of large amountsof contamination by polarized signals originating in the largercloud. This choice is somewhat arbitrary, but it has the benefitof flagging polarization measurements coming from regions ofvery low flux while preserving most of our measurements; weflag as unreliable just four measurements out of 22. All of ourB-vectors shown in Figures 2(b), 3(b), and 4(b) are drawn withthe same length and thickness, and those associated with totalintensity levels below our contamination threshold are shownusing dashed lines. Figures 2(b) and 4(b) each contain one suchsuspect B-vector, and Figure 3(b) contains two.
Also shown in Figures 2(b), 3(b), and 4(b) are the bipolaroutflow morphologies in these sources (see the figure captionsfor references). In addition, these figures show circles depictingthe measured outer limits of the infall regions in L1527 andB335 based on inverse P Cygni line profiles (see captions forreferences). No measurement of the infall radius for IC348-SMM2 has been made to date, but such an infall region is likelyto have a radius range of 20′′–30′′ for an infall age similar to theages of L1527 and B335 (see Table 2). Below we will assume aninfall radius of 25′′ when we compare our observational resultsto models.
Table 2Source Information
Information L1527a IC348-SMM2b B335c
R.A. (2000) 04:39:53.9 03:43:56.9 19:37:01.03Decl. (2000) 26:03:11 32:03:06 07:34:11
Distance (pc) 140 300 250
Infall radius, rinf (pc) 0.026 (38′′) · · · 0.04 (33′′)
Sound speed, cs (km s−1) 0.25 · · · 0.23
Infall age (∼rinf /cs ) (yr) ∼ 1 × 10⁵ · · · ∼1.5 × 10⁵
12CO outflow extent, RL (pc) 0.095 (140′′) 0.14 (95′′) 0.3 (250′′)
P.A. of outflow axis E from N 90◦ −17◦ 90◦
Outflow mass, ML (M�)d 0.18 0.033 0.44
Characteristic outflow velocity,VL (km s−1)e 20 54 13
Outflow age (∼RL/VL) (yr) ∼5 × 10³ ∼2 × 10³ ∼2 × 10⁴
Notes.a Zhou et al. (1996) for infall and Hogerheijde et al. (1998) for outflowinformation.b Tafalla et al. (2006) for outflow information.c Zhou et al. (1993) for infall information and Hirano et al. (1988) for outflowinformation.d Outflow mass for both lobes combined.e Mass-weighted outflow velocities corrected for low inclination with respectto the plane of the sky: 7◦ (L1527), 10◦ (IC348-SMM2), 10◦ (B335).
The models we will compare our data to are those ofASL03b and ALS03a. These models consist of self-similar, self-gravitating, singular, isothermal toroids with various amounts ofrotation and magnetization. The rotation speeds of the coresrange from 0 to 0.5 times their thermal sound speeds andthe magnetic-flux-to-mass ratios of the cores range from 0to 0.5. All models are supercritical in order for collapse tooccur without external pressure. Presumably the collapse phaseoccurs after ambipolar diffusion has occurred, producing thesupercritical state in the core. ALS03a note, however, that evenin the relatively weakened state of the fields, these fields areresponsible for the formation of pseudo-disks, considerabletransport of angular momentum, and the resulting size ofthe centrifugally supported Keplerian disk during the collapsephase, and so cannot be ignored. In Figures 5, 6, and 7,we compare our data on L1527, IC348-SMM2, and B335,respectively, to the model displayed in Figure 8(c) of ALS03a, amodel with intermediate rotation and magnetic field strengths.It should be noted here that, except for the case where there isno magnetic field to flatten the core and provide polarization,the spatial resolution of our data precludes us from discerningbetween the various models presented in ASL03b and ALS03a(see Figures 7 and 8 in ALS03a). ALS03a show (their Figure 7)that rotation has only a minor effect on the gas and magnetic fieldgeometry at the spatial scales we are measuring here. However,the aim of our current study is not to test the finer points ofmagnetic regulated collapse models, but the gross predictionsrepresented in Figure 1 and evidence for magnetic field pinches.
In addition to our spatial resolution constraints, it is importantto bear in mind that our results represent an integration of
7

The Astrophysical Journal, 732:97 (12pp), 2011 May 10 Davidson et al.
(a)(b)
Figure 6. (a) Inferred B-vectors (in red) superimposed on our 350 μm intensity image of IC348-SMM2. (b) Same B-vectors superimposed on the core-collapse modeltaken from Figure 8(c) of Allen et al. (2003a). The magnetic field lines in the model are represented by solid lines; the gray area represents the region of highest density(i.e., the pseudo-disk). The thick green arrow indicates the observed outflow axis, as shown in Figure 3(b). The model has been aligned with the observed pseudo-diskfor IC348-SMM2 (see discussion in Section 3.1). The straight dash-dotted lines in (a) and (b) show the orientation of the major axis of the edge-on pseudo-disk. Asin Figure 3, the large dashed circles in (a) and (b) show the extent of the assumed infall region for this object.
(A color version of this figure is available in the online journal.)
(a) (b)
Figure 7. (a) Inferred B-vectors superimposed on the interferometric 2.7 mm continuum image of B335 from Chandler & Sargent (1993). The larger (red) vectors arebased on our 350 μm polarimetry results reported in this paper, the smaller (green) vectors are based on the 850 μm polarimetry results of Wolf et al. (2003). (b) SameB-vectors superimposed on the core-collapse model taken from Figure 8(c) of Allen et al. (2003a). The magnetic field lines in the model are represented by solid lines;the gray area represents the region of highest density (i.e., the pseudo-disk). The thick green arrow indicates the observed outflow axis, as shown in Figure 4(b). Themodel has been aligned with the observed pseudo-disk for B335, which is shown in (a) and discussed in Section 3.1. The straight dash-dotted lines in (a) and (b) showthe orientation of the major axis of the edge-on pseudo-disk. The large dashed circles in (a) and (b) show the extent of the measured infall region for this object (Zhouet al. 1993).
(A color version of this figure is available in the online journal.)
polarizations along each line of sight, whereas the magneticfield given in Figure 8(c) of ALS03a represents only the cross-section of the poloidal field on the plane of the sky for anedge-on pseudo-disk. If this cross-section were rotated roundthe symmetry axis of the pseudo-disk, an integration along aline of sight would result in a weakening of the pinch geometryto a more uniform field aligned with the symmetry axis.
3.2.1. Magnetic Field Structure around L1527 and IC348-SMM2
Scrutiny of the results displayed in Figures 2 and 3 revealsthat the field structures in L1527 and IC348-SMM2 are generallyconsistent with the magnetically regulated dynamical collapsemodels cited in the introduction in that they show: (1) pinchedfield line vectors on the scale of the measured or inferred infallregions for these cores and (2) field line vectors (with a fewexceptions discussed below) that are basically aligned with thebipolar outflows (once the distortion of a pinch is subtracted byeye using Figures 5 and 6). The exceptions mentioned in (2) are
the three polarization vectors in the low-flux region to the southof IC348-SMM2, which imply an east–west magnetic field, anda vector immediately east of the emission peak of L1527. Apossible explanation for this latter vector is given later in thissection. However, the east–west field lines in IC348-SMM2cannot be explained in the context of a magnetically regulatedmodel. It is possible that these vectors may not be associatedwith the core of IC348-SMM2, since two of the three reside in aregion which has emission less than 25% of the peak emissionfor the source, and the third resides in a region with emissionthat is 25.5% of the peak.
Although in general the polarization results agree withmagnetically regulated models, in detail we see significantdiscrepancies beyond the exceptions mentioned above. Thescale of the pinched structure in magnetically regulated modelsdepends on the size (i.e., age) of the infall region. Outsidethe infall region, the magnetic fields should be uniform ornearly uniform, depending on the details of the pre-collapse,
8

The Astrophysical Journal, 732:97 (12pp), 2011 May 10 Davidson et al.
quasi-static contraction of the core. Only within the infallregions should pinches of the field lines be significant.
Figure 6 shows how our B-vectors in IC348-SMM2 (with ourassumed infall radius and ignoring the three B-vector exceptionsto the south) show a remarkable agreement with Figure 8(c) fromALS03a if the symmetry axis of the pseudo-disk has a 17◦ tiltwith respect to the outflow as we measure for this source. Theagreement of the predicted field geometry from the ALS03amodel with our measured vector position angles is somewhatsurprising since ALS03a’s Figure 8(c) gives a cross-section ofthe poloidal field on the plane of the sky for an edge-on pseudo-disk, while our measurements are an integration along the lineof sight. Such an integration should smooth out the pinchedstructure to some degree. The fit by eye between the model andour measurements is not as good if the pseudo-disk symmetryaxis in the model is instead aligned with the outflow axis. Thefact that the magnetic field fit is better when the model is alignedto the measured pseudo-disk axis, rather than the outflow axis,is consistent with the hypothesis that the pinched magnetic fieldstructure and the pseudo-disk are both products of magnetizedcontraction and collapse, whereas the outflow is probably aproduct of rotation. In IC348-SMM2, the rotation axis may notbe exactly aligned with the overall magnetic field axis for thecore.
Figure 5 shows that in L1527 our B-vectors broadly agree witha pinched magnetic field structure aligned with the pseudo-diskaxis as shown in Figure 8(c) of ALS03a, but the figure also showsthat there are significant distortions beyond the uncertainties(±11◦) in the angles of the vectors. We see these distortionsclose to the edge and in one case beyond the infall boundary.A possible explanation for this additional distortion could bethe bipolar outflow in this source which overlaps a significantportion of the region containing our measured vectors (seeFigure 2). The effects of bipolar outflows are not included inthe models to which we are comparing our results (ASL03b;ALS03a; Galli & Shu 1993a, 1993b). The bipolar outflowin L1527 may also be responsible for the exceptional vectoridentified previously, which lies immediately east of the L1527emission peak. This vector implies a magnetic field directionthat is almost perpendicular to the outflow. In this scenario, theoutflow pushes core material, and therefore also core magneticfield lines, into two polar cones surrounding the bipolar outflownear the emission peak in L1527, thereby giving rise to boththe additional distortions near the edge of the infall boundaryas well as the exceptional vector just east of the peak. Evidencefor conical cavities such as would be required in this scenariohas been obtained via mid-IR scattered light observations byTobin et al. (2008) as well as interferometric measurementsof HCO+ by Hogerheijde et al. (1998). The latter is shown inFigure 2(b). In addition, the submillimeter maps of Hogerheijde& Sandell (2000) and our 350 μm map (Figure 2(a)) showevidence of an X-like structure in the extended backgroundemission about L1527 that overlaps the observed outflow in thatregion, implying that significant submillimeter emission (andany polarization of such emission) must be coming from thesurface of the outflow conical cavities.
Could the bipolar outflow observed in L1527 have enoughenergy to distort the magnetic field structure linked to the gas itentrains? The diagrams in Figure 8 in ALS03a show the pinchedmagnetic field structures for a number of rotating, dynamicallycollapsing toroids of different initial cloud magnetic fieldstrengths. These diagrams also show the contours of β (the ratioof the thermal to magnetic energy density). Close to the axis of
symmetry β is much less than one (∼0.1), further from the axisof symmetry β increases to values above one. These values of βcan be used together with estimates of the thermal energy withina core to determine the energy density required of an outflowto distort the magnetic field within that core. The core thermalenergy density for L1527 can be approximated by 3
2ρc2s , where
ρ is given by the mass density of the 106 cm−3 molecular gasmeasured for the L1527 core about 10′′ away from the center(Hogerheijde & Sandell 2000) and cs is the sound speed whichis approximately 0.25 km s−1 (Zhou et al. 1996). The lower limitto the outflow energy density in L1527 is expressed as 1
2MLV 2
L
divided by the observed volume of the outflow lobes, where themeasured values for M
L(the mass entrained in the outflows) and
VL
(the velocity of the entrained gas in the outflows) are givenin Table 2 from Hogerheijde et al. (1998). The volume of bothoutflow lobes can be approximated by 2
3 ΩLR3
L, where R
L, the
extent of one lobe in L1527, is given in Table 2 and ΩL
≈ 0.14sr based on Figure 6 in Hogerheijde et al. (1998) showing theextent of the 12CO outflow in L1527. The above imply that theenergy density in the outflow is greater than the thermal energydensity in the region 10′′ from the peak of L1527 by about afactor of 100. Since in the ALS03a models the magnetic energydensity is less than the thermal energy density away from theaxis of symmetry, this implies that the outflow does have theenergy required to distort the magnetic field where it disturbsthe gas in the core away from the axis of symmetry. Indeed, withthe energy density of the outflow observed, even the magneticfield very close to the axis of symmetry could be distorted.
The ratio of the outflow energy density to core thermal energydensity in IC348-SMM2 is similar to the ratio in L1527, ifone assumes similar gas densities and sound speeds for IC348-SMM2 as measured for L1527 and the outflow parameters inTable 2 for IC348-SMM2. But the outflow in IC348-SMM2does not overlap with our measured polarization vectors to avery great degree, so the outflow cannot affect the alignmentof the magnetic fields which are inferred by these polarizationmeasurements. Where there is overlap, the distortion would beminimal for field lines already parallel to the axis of the outflowif the opening angle of the outflow at that location is small—asit is for IC348-SMM2 (±15◦; see Figure 3).
In summary, if one assumes that the low-flux exceptionsin IC348-SMM2 are not part of the core and one includesthe effects of bipolar outflows on field alignment, then ourobservations of L1527 and IC348-SMM2 are consistent withmagnetically regulated models.
3.2.2. Magnetic Field Structure around B335
At first glance, our two polarization vectors in B335 imply amagnetic field more perpendicular than parallel to the outflowaxis. However, our two inferred B-vectors are not too differentfrom what would be expected in the region just southeast of theB335 center based on Figure 8(c) of ALS03a when this figureis aligned with the minor axis of the flattened core as measuredby Chandler & Sargent (1993; i.e., the symmetry axis of theinferred pseudo-disk). In this region of the model, the field linesare pinched toward the axis of symmetry (see Figure 7).
Figure 7 also shows the B-vectors inferred from the 850 μmpolarimetry measurements of WLH03 as well as those inferredfrom our 350 μm polarimetry measurements. Our results arebroadly consistent with the results of WLH03, in that they agreewith four of the six vectors in the southeast quadrant regionof the B335 core, but not, however, with the one vector with
9

The Astrophysical Journal, 732:97 (12pp), 2011 May 10 Davidson et al.
which our measurements most nearly overlap. The 20 B-vectorsof WLH03 and our two all lie inside the infall region outlinedin Figures 4 and 7. The WLH03 results imply on average amore NS magnetic field structure within B335, but there isconsiderable distortion evident in the field lines implied by the20 vectors, since the standard deviation of the position anglesof the B-vectors is about three times the average measurementerror for each vector. WLH03 concluded that the average fieldthey measure in B335 is the direction of the field in the corewhen it collapsed, and that the flattened core seen in B335 isprolate (rather than oblate) with its symmetry axis parallel to themagnetic field. If this is the case, then B335 presents a counterexample to the results obtained by Tassis et al. (2009), whoconcluded the core model that best fits their sample of 24 high-mass cloud cores is an oblate core with the mean magnetic fieldmore aligned with the short axis than the long axis.
Alternatively, the WLH03 data and ours could imply a moretoroidal field in B335 than poloidal. But if this were the case thenthis is inconsistent with the model of ALS03a which includesrotation. In this model, only a small volume of a dynamicallycollapsing core contains twisted (i.e., toroidal) magnetic fields.Outside this small region the collapsing flow has yet to be spunup, and inside this region β � 1 so the field lines are rigid.If B335 does contain a toroidal field configuration, then theALS03a model fails to describe it; there appears to be moretwisting of the original poloidal magnetic field lines than can beexplained in their model.
Yet another interpretation of the data, and the one we advocatein this paper, is that B335 is an extreme example of what ishappening in L1527; the outflow in B335 has distorted the fieldlines in the core of B335, either directly or indirectly by excitingmore turbulence within the core, so the magnetic field seems toalign NS on average. Could the outflow in B335 cause largefield distortions in the core? If we use the same analysis weused for L1527, but with a core thermal speed of 0.23 km s−1
(Zhou et al. 1993), a core density at about 10′′ from the center of∼105 cm−3 (Zhou et al. 1990; Harvey et al. 2003), the B335values for the outflow parameters given in Table 2, and Ω
L= 0.6
sr (Figure 2 in Hirano et al. 1988), then we find that the outflowenergy density is about a factor of six higher than the corethermal energy density (10′′ from the peak) in B335. Our ownoutflow data shown in Figure 4(b) give a total kinetic energy forthe outflow within the region mapped (i.e., 1
2MchanV2
chan, summed
over the velocity channels in the ranges 5.4–8.0 km s−1 and8.6–11.2 km s−1) of 1.8 × 1042 erg, once a correction for the10◦ inclination of the outflow to the plane of the sky has beenmade. Dividing this by the volume of the outflow as defined inFigure 4(b), we get a kinetic energy density of ∼10−9 erg cm−3,which is a factor of three higher than the core thermal energydensity. This outflow energy density although not enough todistort the magnetic field close to the axis of symmetry of thepseudo-disk in B335 is enough to distort the field further out.
The outflow cavity outlined by the CO observations inFigure 4(b) is coincident with the region within the B335 corethat most likely would have a magnetic field energy density thatis greater than the outflow energy density; beyond this outflowcavity the reverse is likely to be true. The outflow cavity is aregion in which the gas and dust densities are low, and so itis a region of low 350 μm emission along our line of sight.Our polarization measurements are thus weighted away fromthe outflow cavity region toward those regions along our line ofsight where the energy density of the outflow could distort themagnetic field structure.
But why is this distortion observed to be so large in B335compared to the distortion in L1527? The difference betweenB335 and the other two YSOs presented here is that the bipolaroutflow in B335 is much larger in length, width, and apparentage than the outflows in L1527 and IC348-SMM2 (Table 2).Therefore, the field lines within the B335 core could be highlydistorted because the outflow has had time to plow through agreater portion of the core or excite greater gas turbulence in thecore.
3.2.3. χ 2r Tests of Various Magnetic Field Geometries
In order to give some quantitative assessment of the magneticfield scenarios discussed above, and how they compare to otherpossible configurations, we carried out reduced χ2 tests ofour data using a number of different theoretical magnetic fieldconfigurations for each source. For each source we comparedthe B-vectors implied by our data to (1) a uniform magneticfield model where the angle of the field is aligned with the meanB-vector angle implied by our data for that source, (2) a uniformmagnetic field model where the angle of the field is aligned withthe outflow, (3) a uniform magnetic field model where the angleof the field is aligned with the symmetry axis of the observedpseudo-disk for that source, (4) a uniform magnetic field modelwhere the angle of the field is aligned with the major axis ofthe observed flattened core (or pseudo-disk) for that source,and (5) a pinched magnetic field aligned with the symmetryaxis of the observed pseudo-disk as presented in Figure 8(c)of ALS03a. Note that model (4) also corresponds to the casewhere the magnetic field is toroidal. Table 3 summarizes ourresults. Each number in the table represents the reduced chi-squared value, χ2
r , for the data specified for that column againstthe model for that row. The reduced chi-squared is calculated asχ2
r = 1νΣi((θi − θMi)2/σ 2
i ), where θi are the data representingthe angles of the B-vector at various locations, i; σi is theuncertainty in each data angle; θMi is the angle of the magneticfield at the location of each data point for a particular model;and ν is the number of degrees of freedom for the data set. Forthese calculations, the values of |(θi − θMi)| were constrainedto be �90◦ since our B-vectors have been derived from ourpolarization E-vectors which are invariant under 180◦ rotations.For cases where |(θi − θMi)| > 90◦, a value of |[(θi − θMi ±180)]| � 90◦ was substituted. For B335, we carried out thesame calculations using the data of WLH03 based on theirFigure 1.
χ2r should be close to 1 for a good fit. An inspection of Table 3
shows that χ2r is close to this value only for the ALS03a model
for IC348-SMM2 and B335 when we consider only our dataminus the exceptions discussed in Section 3.2.1. However, thefits are not good for this model if we include the exceptions forIC348-SMM2, and if we include the WLH03 data for B335.This is in agreement with our qualitative assessment above. ForL1527, although no model gives a good fit to our data, thetwo most favored are the ALS03a model and the uniform fieldaligned with the mean B-vector of our data for L1527 (i.e., 60◦east of north). Our data do not differentiate between these twomodels, since our vectors lie mostly in two diagonal quadrants.If we had more data in the other two quadrants, a χ2
r test wouldbe able to differentiate between these two models. As it is, the χ2
r
results reenforce our qualitative assessment above that althoughour data agree with the ALS03a model in a broad sense, thereare enough deviations to it to require an explanation; possibly adisturbance to the magnetic field structure due to the outflow inL1527.
10

The Astrophysical Journal, 732:97 (12pp), 2011 May 10 Davidson et al.
Table 3Reduced χ2 Values for Various Modelsa
Models for θB L1527 IC348-SMM2 B335
(θMi ) All Vectorsb m/Exceptb All Vectors m/Except All Vectors WLH03b
(ν = 10) (ν = 9) (ν = 10) (ν = 7) (ν = 2) (ν = 20)
θMi = Mean θic 8.3 8.2 10.4 5.5 0.02 13.7
θMi= θoutflowd 16.4 15.0 20.9 8.1 19.4 36.9
θMi= θPDSAd 16.4 15.0 12.7 4.8 8.2 38.5
θMi= θPDMAd 30.3 33.2 31.7 42.0 16.2 14.2
ALS03a modeld 9.9 7.8 14.0 0.4 0.8 31.5
Notes.a χ2
r = 1ν
Σi ((θi − θMi )2/σ 2i ), where θi are the data representing the angles of the B-vector at various locations, i; σi is the
uncertainty in each angle; θMi is the angle of the B field at the location of each data point for a particular model; and ν is thenumber of degrees of freedom for the data set. χ2
r ∼ 1 for a good fit to the data.b “All Vectors” means all vectors listed in Table 1 for each source. “m/Except” means all vectors listed in Table 1 minus theexceptions discussed in Section 3.2.1. “WLH03” means the data shown in Figure 1 of Wolf et al. (2003).c For this model comparison with the data, the ν is one less than the value quoted at the top of each column.d θoutflow is the angle of the bipolar outflow axis in each source, θPDSA is the angle of the symmetry axis of the pseudo-diskin each source, and θPDMA is the angle of the major axis of the pseudo-disk in each source. The ALS03a model is that modelshown in Figure 8(c) of Allen et al. (2003a).
Further, based on Table 3, our data for L1527, IC348-SMM2,and B335 clearly favor the ALS03a model over the “toroidal”models, and the ALS03a model is slightly more favored thanthe models with a uniform field aligned with the outflow anda uniform field aligned with the pseudo-disk symmetry axis.This implies that there is some evidence for a pinch in themagnetic field configuration for these sources. However, thedata of WLH03 for B335, in contradiction, favor the modelwith a uniform field aligned with the major axis of the flattenedcore over all the other models, although the fit is not goodfor this model, thus implying some other underlying magneticfield configuration must be present—possibly a configurationdisrupted by the outflow in B335.
In summary, the chi-squared results in Table 3 support thequalitative discussions we presented in Sections 3.2.1 and 3.2.2.
We also compared our data to a random magnetic field modelfor each source. We did this by calculating the root mean square(rms) of the differences between the directions of the B-vectorsat points lying spatially adjacent to one another in each of oursources. For L1527, we obtained 11 pairs of measurementsseparated by 10′′ or
√2 × 10′′ (see Figure 2) and for IC348-
SMM2 we obtained 10 such pairs (see Figure 3) for our rmscalculations. Points separated by ∼10′′ (i.e., one beam diameter)or greater represent independent measurements. For L1527, wecalculated an rms value for these differences in adjacent B-vectordirections to be 19◦ and for IC348-SMM2 a value of 15◦. Wethen carried out the same calculation on 10 randomly generatednumbers ranging between −90 and 90 and did this 50 times. Theresulting rms values formed a peaked Gaussian distribution witha mean of 51 and a dispersion σ = 6. (This mean is close to thetheoretical rms of ∼52 for randomly selected numbers between−90 and 90.) Thus, our rms values for L1527 and IC348-SMM2 lie 5.5σ and 6σ , respectively, below the expected rmsfor randomly distributed B-vectors, implying that the magneticfields in L1527 and in IC348-SMM2 are not random in nature.We carried out the same rms calculation on two different sets of13 pairs of adjacent B-vector measurements made by WLH03 inB335 (see Figure 7), resulting in rms values of 42◦ and 34◦. Bothvalues are much larger than the average uncertainties (�10◦) forthe measurements reported in WLH03. These rms values implythat the magnetic field is possibly more randomized in B335
than in the other sources. This latter point is consistent with oursuggestion that the magnetic field in B335 is more distorted byits outflow than are the magnetic fields in L1527 and IC348-SMM2.
4. CONCLUSIONS
We have used the SHARP polarimeter on the CSO toobtain 350 μm intensity maps and polarization measurementson L1527, IC348-SMM2, and B335 to test whether or notmagnetically regulated models for low-mass star formation areconsistent with observations of sources which should have littledistortions in their various geometries due to projection effects(i.e., sources with bipolar outflows which lie close to the planeof the sky).
1. Our data for IC348-SMM2 combined with the data of othersfor L1527 and B335 show flattened cores consistent withedge-on pseudo-disks having symmetry axes that are nearly,but in two cases not exactly, parallel to the bipolar outflowsin these sources.
2. There is evidence that the sources L1527 and IC348-SMM2each contains a pinched magnetic field structure with itssymmetry axis approximately aligned with the symmetryaxis of the inferred embedded pseudo-disk in each. Theevidence is strong (i.e., the goodness-of-fit to the data isgood) for IC348-SMM2, if certain low-flux polarimetrymeasurements, which could be associated more with thebackground cloud than the core, are ignored. In IC348-SMM2, where the outflow and pseudo-disk axes are notexactly aligned, the pinched magnetic field structure fitsthe data better when it is aligned with the symmetry axisof the pseudo-disk rather than with the outflow axis. Thisis consistent with the hypothesis that the pinched magneticfield structure and the pseudo-disk are both products ofmagnetized contraction and collapse, whereas the outflowis only indirectly related to the core magnetic field structurein as much as that magnetic field structure has influencedthe orientation of the rotation axis of the core.
3. In L1527, however, the magnetic field structure showsconsiderable distortion from an ideal pinched field linestructure given the measured infall radius of this source.
11

The Astrophysical Journal, 732:97 (12pp), 2011 May 10 Davidson et al.
Our hypothesis is that this distortion is caused by the bipolaroutflow in L1527. We show that the outflow has sufficientenergy density to distort the magnetic field structure in thecore of this source. This distortion is not seen in IC348-SMM2, because the only inferred B-vectors that overlapwith the outflow in this source are vectors that would nothave been altered by the outflow.
4. The magnetic field structure observed in the B335 core isnot aligned with the outflow axis of this source, but our twoB-vectors are consistent with models with pinched fieldlines through a pseudo-disk, if the pseudo-disk is tiltedwith respect to the outflow axis by 20◦ (i.e., consistentwith the pseudo-disk observed for B335 by Chandler &Sargent 1993). However, if we combine our data with thoseof WLH03, the fit to these pinched field line models is notgood. Our explanation is that B335 is an extreme exampleof the bipolar outflow driven field distortion that we areseeing in L1527. The main difference between L1527 andB335 is that the outflow in B335 is much larger in extentthan the one in L1527, is assumed therefore to be mucholder, and so has had time to cause a greater degree ofdistortion of the core magnetic field lines. This is not theinterpretation given by WLH03 of their B335 observations.They interpreted their results to imply a near uniformfield lying perpendicular to the outflow in this source—incontradiction to the predictions of magnetically regulatedcollapse as summarized in Figure 1.
5. More core magnetic field structures need to be mappedto elucidate the overall dynamical collapse story, giventhe considerable variation in core structures observed inour sample of just three. In short, the gross predictions ofthe magnetically regulated models (i.e., as summarized inFigure 1) need to be tested further.
We are grateful to the Caltech Submillimeter ObservatoryTAC, management, and staff for making this study possible overthe many observing runs that it has consumed. We thank DarrenDowell, Megan Krejny, Woojin Kwon, and Hiroko Shinnagafor help with the observations, and Ron Taam for valuablediscussions. We are grateful to the National Science Foundationfor supporting the Caltech Submillimeter Observatory via grantAST-0838261, and for supporting the operation of SHARP viagrant AST-0909030 to Northwestern University. AstronomicalResearch by P.F.G. and N.L.C. is supported by the Jet PropulsionLaboratory, California Institute of Technology.
REFERENCES
Allen, A., Li, Z.-Y., & Shu, F. H. 2003a, ApJ, 599, 363 (ALS03a)Allen, A., Shu, F. H., & Li, Z.-Y. 2003b, ApJ, 599, 351 (ASL03b)Attard, M., Houde, M., Novak, G., & Vaillancourt, J. E. 2008, PASP, 120,
805Attard, M., Houde, M., Novak, G., Vaillancourt, J. E., Li, H., Dowell, C. D.,
Davidson, J. A., & Shinnaga, H. 2009, ApJ, 702, 1584Basu, S., & Mouschovias, T. C. 1994, ApJ, 432, 720Chandler, C. J., & Richer, J. S. 2000, ApJ, 530, 851Chandler, C. J., & Sargent, A. I. 1993, ApJ, 414, L29Dowell, C. D., Hildebrand, R. H., Schleuning, D. A., Vaillancourt, J. E., Dotson,
J. L., Novak, G., Renbarger, T., & Houde, M. 1998, ApJ, 504, 588Dowell, C. D., et al. 2003, Proc. SPIE, 4855, 73Galli, D., & Shu, F. H. 1993a, ApJ, 417, 220
Galli, D., & Shu, F. H. 1993b, ApJ, 417, 243Girart, J. M., Rao, R., & Marrone, D. P. 2006, Science, 313, 812Goldsmith, P. F., & Arquilla, R. 1985, in Protostars and Planets II, ed. M. S.
Matthews (Tucson, AZ: Univ. Arizona Press), 137Goldsmith, P. F., Heyer, M., Narayanan, G., Snell, R., Li, D., & Brunt, C.
2008, ApJ, 680, 428Goodman, A. A., Benson, P. J., Fuller, G. A., & Myers, P. C. 1993, ApJ, 406,
528Harvey, D. W. A., Wilner, D. J., Myers, P., & Tafalla, M. 2003, ApJ, 596, 383Hatchell, J., Richer, J. S., Fuller, G. A., Qualtrough, C. J., Ladd, E. F., &
Chandler, C. J. 2005, A&A, 440, 151Henning, T., Wolf, S., Launhardt, R., & Waters, R. 2001, ApJ, 561, 871Hildebrand, R. H., Davidson, J. A., Dotson, J. L., Dowell, C. D., Novak, G., &
Vaillancourt, J. E. 2000, PASP, 112, 1215Hildebrand, R. H., Kirby, L., Dotson, J. L., Houde, M., & Vaillancourt, J. E.
2009, ApJ, 696, 567Hirano, N., Kameya, O., Nayayama, M., & Takakubo, K. 1988, ApJ, 327, L69Hogerheijde, M. R., & Sandell, G. 2000, ApJ, 534, 880Hogerheijde, M. R., van Dishoeck, E. F., Blake, G. A., & van Langevelde, H. J.
1998, ApJ, 502, 315Houde, M., & Vaillancourt, J. E. 2007, PASP, 119, 871Jørgensen, J. K., et al. 2007, ApJ, 659, 479Kirby, L., Davidson, J. A., Dotson, J. L., Dowell, C. D., & Hildebrand, R. H.
2005, PASP, 117, 991Kirk, J. M., Ward-Thompson, D., & Crutcher, R. M. 2006, MNRAS, 369,
1445Konigl, A., & Pudritz, R. E. 2000, in Protostars and Planets IV, ed. V. Mannings,
A. Boss, & S. S. Russell (Tucson, AZ: Univ. Arizona Press), 759Kwon, W., Looney, L. W., Crutcher, R. M., & Kirk, J. M. 2006, ApJ, 653, 1358Lazarian, A. 2007, J. Quant. Spectrosc. Radiat. Transfer, 106, 225Li, H., Dowell, C. D., Kirby, L., Novak, G., & Vaillancourt, J. E. 2008, Appl.
Opt., 47, 422Mac Low, M.-M., & Klessen, R. S. 2004, Rev. Mod. Phys., 76, 125Matthews, B. C., McPhee, C. A., Fissel, L. M., & Curran, R. L. 2009, ApJS,
182, 143Matthews, B. C., & Wilson, C. D. 2002, ApJ, 574, 822McKee, C. F., & Ostriker, E. C. 2007, ARA&A, 45, 565Menard, F., & Duchene, G. 2004, A&A, 425, 973Mestel, L. 1985, in Protostars and Planets II, ed. M. S. Matthews (Tucson, AZ:
Univ. Arizona Press), 320Mouschovias, T. C., & Ciolek, G. E. 1999, in The Origin of Stars and Planetary
Systems, ed. C. J. Lada & N. D. Kylafis (Dordrecht: Kluwer), 305Mouschovias, T. C., & Paleologou, E. V. 1979, ApJ, 230, 204Mouschovias, T. C., & Paleologou, E. V. 1980, ApJ, 237, 877Myers, P. C., Bachiller, R., Caselli, P., Fuller, G. A., Mardones, D., Tafalla, M.,
& Wilner, D. J. 1995, ApJ, 449, L65Ohashi, N., Hayashi, M., Ho, P. T. P., & Momose, M. 1997, ApJ, 475, 211Serkowski, K. 1962, in Advances in Astronomy and Astrophysics, ed. Z. Kopal
(New York: Academic), 290Shu, F. H., Adams, F. C., & Lizano, S. 1987, ARA&A, 25, 23Shu, F. H., Li, Z.-Y., & Allen, A. 2004, ApJ, 601, 930Shu, F. H., Najita, J. R., Shang, H., & Li, Z-Y. 2000, in Protostars and Planets
IV, ed. V. Mannings, A. Boss, & S. S. Russell (Tucson, AZ: Univ. ArizonaPress), 789
Tafalla, M., Kumar, M. S. N., & Bachiller, R. 2006, A&A, 456, 179Tamura, M., Ohashi, N., Hirano, N., Itoh, Y., & Moriarty-Schieven, G. H.
1996, AJ, 112, 2076Tassis, K., Dowell, C. D., Hildebrand, R. H., Kirby, L., & Vaillancourt, J. E.
2009, MNRAS, 399, 168Tobin, J. J., Hartmann, L., Calvet, N., & D’Alessio, P. 2008, ApJ, 679, 1364Tomisaka, K. 1998, ApJ, 502, L163Vaillancourt, J. E. 2006, PASP, 118, 1340Vaillancourt, J. E., et al. 2008, ApJ, 679, L25Vallee, J. P., Bastien, P., & Greaves, J. S. 2000, ApJ, 542, 352Vallee, J. P., Greaves, J. S., & Fiege, J. D. 2003, ApJ, 588, 910Ward-Thompson, D., Sen, A. K., Kirk, J. M., & Nutter, D. 2009, MNRAS, 398,
394Wolf, S., Launhardt, R., & Henning, T. 2003, ApJ, 592, 233 (WLH03)Zhou, S., Evans, N. J., Butner, H. M., Kutner, M. L., Leung, C. M., & Mundy,
L. G. 1990, ApJ, 363, 168Zhou, S., Evans, N. J., II, Carsten, K., & Walmsley, C. M. 1993, ApJ, 404, 232Zhou, S., Evans, N. J., II, & Wang, Y. 1996, ApJ, 466, 296
12