Embed Size (px)
Citation preview

1 | P a g e * Name was changed from the original “Meredith Engagement Dividend” in line with the guarantee Meredith
launched for advertisers.
PRINT AND DIGITAL RESEARCH FORUM: OCTOBER 2013, NICE MAGAZINES DRIVE EFFICIENT SALES…GUARANTEED. Britta Cleveland – SVP, Research Solutions, Meredith Corporation ([email protected]) Jeff Bickel – VP, Delivery & Analytics, Nielsen Catalina Solutions ([email protected])
I. OBJECTIVE
This provides an update on the evolution of the “Meredith Sales Guarantee”*, a unique and bold sales
approach based on a research methodology which quantifies the impact of magazine advertising investment
on actual brand sales. And guarantees it.
The paper will 1) summarize the results from additional brand measurement studies and guarantees
completed since the original fourteen “pilot” brands, and 2) focus on the results of a unique study which
illustrates the positive impact of magazine advertising alone on sales for an established brand, not only in a
test vs. control environment, but compared to prior year brand sales.
II. BACKGROUND/CONTEXT
Over the past several years the industry has seen an increased demand for quantifying marketing returns as
media options continue to expand and budgets are increasingly scrutinized. In the new media landscape,
marketers are increasingly challenging magazines to prove their value and more specifically, to provide
empirical evidence that magazines are driving new and repeat sales. To address this challenge, Meredith
developed the “Meredith Engagement Dividend”* with analytics by Nielsen. The methodology and
findings summary for the first fourteen “pilot” cases was presented in detail at the 2011 PDRF in San
Francisco, CA.
A lot has happened since that time, including the decision by Tom Harty, Meredith’s President of the
National Media Group to guarantee advertisers an increase in sales and a positive ROI in exchange for
meeting minimum levels of spend and/or impressions. Eleven more brands have been included in the
Meredith Sales Guarantee, and more detailed analysis has been added to understand the impact of specific
variables on the volumetric impact of advertising in Meredith titles.
In addition, to further validate the strength of the methodology – specifically the ability to isolate the
impact of magazines alone – we identified an established brand which heretofore had relied solely on trade
promotion and FSI’s for marketing. Working with this brand, we completed a comparative analysis of the
volumetric impact of the historical efforts and a new print oriented campaign, determining the impact of
magazine advertising on driving sales, not only among test households vs. a matched control group, but
actual national brand sales as well.

2 | Page
III. SYNOPSIS
This research provided additional proof that magazine advertising – at sufficient media levels – drives sales
by either increasing household brand penetration and/or increasing the buying rate among current
households compared to a matched control group. In other words, based on the 25 brand studies completed
by Meredith and Nielsen Catalina Solutions (NCS) using an ANCOVA methodology (where the only
difference between matched test and the control groups is exposure to advertising as a result of being a
subscriber), sales increased on average by +9% and the average return on investment (ROI = Annual Sales
Impact/Media Investment) was $7.81. To further illuminate this point, this research illustrates that in the
absence of any other media, magazines alone can drive sales for an established brand, not only vs. a
matched control group (+18%) , but also vs. the same period in the year prior (+11.5%), while delivering a
positive sales ROI of $4.59.
IV. METHODOLOGY OVERVIEW
The measurement analysis behind Meredith’s Sales Guarantee is Nielsen Catalina Solutions Print Effect.
Overlaying Meredith’s subscriber database with Nielsen’s Homescan panel and capturing both subscription
(exposure) and CPG consumption at the household level enables direct measurement of advertising impact.
This technique isolates and compares measured purchase behaviors of two distinct groups: Meredith
exposed households vs. matching non-exposed households. The two groups are matched according to
demographic, geographic and offline purchase variables during a fifty-two week pre period, and any
differences are controlled by the use of covariates. With the groups thus matched, during the analysis
period the only difference between the two is that one group subscribes to a Meredith magazine where the
campaign ad was placed.
The test vs. control design employed is a well accepted, and long used analysis tool for the CPG industry
and other industries such as the Health Care/Pharma industry, where precision of measurement is
particularly important. One of the main characteristics of this type of analysis design is its focus on most
accurately answering one question (rather than answering multiple questions at once). The question in our
case is whether or not the campaign changed consumer purchasing behavior. Thinly distributed national
media, such as Magazine Advertising, particularly benefit in measurement accuracy from this type of
analysis because of its ability to create a concentrated exposed test group. This analysis has the particular
advantage of benefiting from a robust sample size due to the Nielsen Homescan Panel.
There are three main components that contribute to NCS’ Sales Effect measurement design:
1. Matching: Also known as blocking in design of experiments statistics, is a powerful technique that
allows us to create very similar test and control groups. Doing this allows us to naturally observe a

3 | P a g e
clean view of the test impact free from non test related phenomena, and minimizing the need to make
adjustments by models.
Specifically we used a hybridized paired/pooled matching method. This allows us to create similar
pairs of households (test vs. control) and at the same time minimize overall test vs. control panel
differences.
Matching Variables: Hundreds of measures exist for each household in the panel. From this total a
match is created using those variables from the three subsets below that are most associated with the
measured brand’s volume over the analysis period.
Purchase Based Behavior (brand purchase metrics-penetration/volume/occasions,
competitors, category, trip metrics, customer/account-level, reported causal)
Demo-based (age, household size, income)
Geographic (region, DMA, state, longitude/latitude, postal code, etc)
Matching geographically and within account balances the effects of the marketing mix vehicles (media
and in-store promotion).
2. Stepwise Regression Analysis of Matching Variable: This allows us to customize variable matching
importance on a per project basis. Typically pre period Brand, Competitor and Category purchase
behavior of the most important followed by retailers.
3. ANCOVA Model and Covariate Adjustments: While matching does a great job of controlling for
non-test related effects, since we are conducting an in market experiment, uncontrollable events can
still occur. Covariates for any remaining non-test related differences controls for these remaining
effects, giving us a clean and focused read of the test impact.
Making the jump from Control Store Testing to households based analysis: Store based test vs. control
design has been utilized for decades and is the foundation for the household based approach.
Fundamentally stores are simply aggregations of households; so store data points are aggregations of
household data points. For people familiar with store based testing approaches this can be a helpful way to
understand household test vs. control analysis.
The Sales Effect matching and modeling methodology is focused on accurately addressing the single
question of media effectiveness and is founded on years of test vs. control analysis experience. While the
complexities of our dynamic CPG marketplace pose challenges for analysis, this product is the most
accurate measurement tool available for quantifying the value of a discrete media campaign, such as the
value of magazine advertising.

4 | P a g e
Methodology Summary
NCS’ Print Effect solution combines custom analysis that leverages their parent company, Nielsen’s,
insights into audiences and advertising with its ability to measure offline consumer purchase behavior. Print
Effect identifies households exposed to print ad campaigns and compares their offline purchasing behavior
with those who were not exposed to the campaign.
This Methodology provides two key insights for marketing initiatives:
Illustrating the sales difference between exposed and non-exposed magazine households as well as
determine the underlying components driving this sales difference
Quantifying ROI for magazine advertising on offline sales
Detail of NCS/Meredith Sales Guarantee Analysis Procedure
Following is an overview and details of the seven step procedure for the Sales Guarantee Analysis, which
combines the work of NCS and Meredith to determine volumetric and financial impact of advertiser
campaigns executed in Meredith titles.
NCS 1. Actual Household sales derived from Nielsen’s 100K HomeScan consumer panel
NCS 2. Database match (name, address) between unique active Subscribers and Nielsen
Homescan Panel to determine Test (Exposed) Group
NCS 3. Control (Unexposed) Group developed based on matching product/category
purchase behavior, demographics and geography with Test Group.
NCS 4. NCS applied its ‘gold standard’ ANCOVA analysis methodology to determine
average sales difference between households in Test and Control Groups.
Meredith 5. Unique HH universe is calculated for the magazines in the campaign period using
MRI data.
Meredith 6. Multiply number of Unique HH’s reached by campaign by the average sales lift
per household (Test vs. Control) to determine annual incremental sales.
Meredith 7. ROI is calculated based on annual incremental sales generated per media dollar
spent (no margin applied).

5 | P a g e
Detailed Procedure:
Actual Household sales derived from Nielsen’s 100K HomeScan consumer panel
The Print Effect sample is composed of ~100k Homescan households that provide their offline
purchase behavior and demographics as part of their responsibility as Homescan panelists. To ensure
projectable results, the Nielsen Homescan Panel is carefully balanced for the demographic
characteristics of the universe being measured. In the U.S. the Nielsen Homescan Panel is the largest
longitudinal panel representing all-outlet purchases including both Spanish- and English-speaking
Hispanics. Shopper data is collected via handheld scanners that transmit data directly to Nielsen. This
data can be used to identify key shopper behavior across stores, TV, online and social media outlets.
Database match between unique active Subscribers and Nielsen Homescan Panel to
determine Test (Exposed) Group
Through a database match with the Magazine Publisher (using a third party, such as Experian), NCS
determines which Homescan households are subscribers to specific magazines to identify opportunity
to see advertising on a household basis.
Magazine database file include first and last name and address
Subscribers qualify for the match if they are active subscribers during the match period
Control (Unexposed) Group developed based on matching product/category purchase
behavior, demographics and geography with Test Group.
As noted in the methodology section above, NCS employs a hybridized paired/pooled matching
method, enabling creation of identical pairs of households (test vs. control) and at the same time
minimize overall test vs. control panel differences.
Matching variables include:
Purchase Based Behavior (brand purchase metrics-penetration/volume/occasions,
competitors, category, trip metrics, customer/account-level, reported causal)
Demo-based (age, household size, income)
Geographic (region, DMA, state, longitude/latitude, postal code, etc)
While other media are not expressly controlled for, the matching of Test and Control HH’s on
brand/category purchasing dynamics and demographics for a 52 week pre period controls for
other marketing elements. If other media are consumed by the Test and Control HH’s in
differing levels, the effect must be minimal, as their packaged good consumption is equal.
NCS applied its ‘gold standard’ ANCOVA analysis methodology to determine average
sales difference between households in Test and Control Groups.

6 | P a g e
The offline purchasing behavior of those households exposed to the magazine ad campaigns for a
particular brand (or group of brands) are compared with those who were not exposed to the campaign.
The Print Effect analysis uses the aforementioned test vs. control design and ANCOVA analysis which
resulting in the ability to isolate the true impact of the print campaign.
Sample data for illustrative purposes
Unique HH universe is calculated for the magazines in the campaign period using MRI data
The Unique HH Universe is calculated by combining net “buyers” of all titles included in the
campaign --- MRI’s best estimate of newsstand + subscriber --- with net secondary HH universe by
assuming the same number of adults/HH in as in primary audience and decreasing the secondary
readership proportionally
GfK MRI Approval (Julian Baim, PhD, 8/2011): “I have reviewed their procedures and believe their
computations to be quite reasonable. The calculation of average number of readers in primary households is
taken directly from our estimate of primary readers and divided by the concurrently reported published buyer
(circulation) estimate. Their assumption of a similar relationship between the number of readers and households
among secondary readers is consistent with the direct measurement and probably reflects a very conservative
estimate of the household reach. In sum, this estimation procedure is logical and defensible”.
Unique HH Audience Calculation Example
Total Adult 18+ Audience (000) 68,987
Primary Audience 28,530
# of “Magazine Buyers” 18,625
ADULTS PER PRIMARY HOUSEHOLD 1.53
Secondary Audience 40,457
# of Unique Secondary Households
(Divided by number of Adults/Primary HH: 1.53)
26,411
TOTAL UNIQUE HOUSEHOLDS (PRIMARY + SECONDARY) 45,036
7 | P a g e
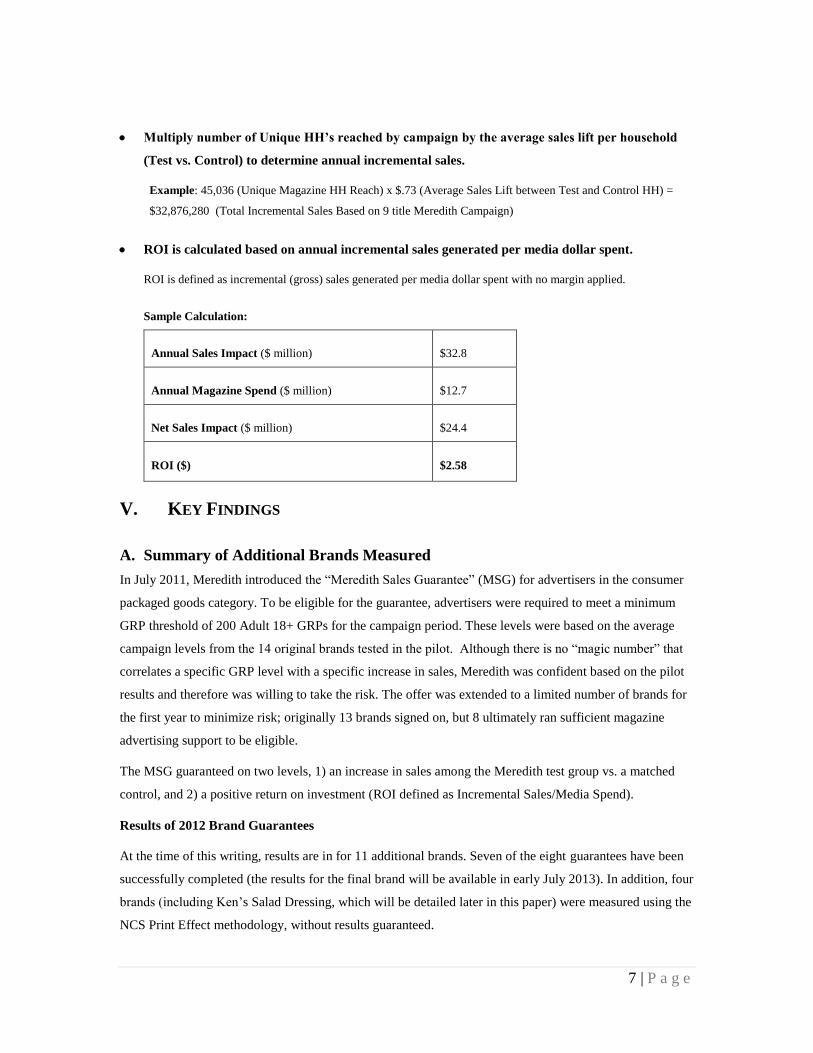
Multiply number of Unique HH’s reached by campaign by the average sales lift per household
(Test vs. Control) to determine annual incremental sales.
Example: 45,036 (Unique Magazine HH Reach) x $.73 (Average Sales Lift between Test and Control HH) =
$32,876,280 (Total Incremental Sales Based on 9 title Meredith Campaign)
ROI is calculated based on annual incremental sales generated per media dollar spent.
ROI is defined as incremental (gross) sales generated per media dollar spent with no margin applied.
Sample Calculation:
Annual Sales Impact ($ million) $32.8
Annual Magazine Spend ($ million) $12.7
Net Sales Impact ($ million) $24.4
ROI ($) $2.58
V. KEY FINDINGS
A. Summary of Additional Brands Measured
In July 2011, Meredith introduced the “Meredith Sales Guarantee” (MSG) for advertisers in the consumer
packaged goods category. To be eligible for the guarantee, advertisers were required to meet a minimum
GRP threshold of 200 Adult 18+ GRPs for the campaign period. These levels were based on the average
campaign levels from the 14 original brands tested in the pilot. Although there is no “magic number” that
correlates a specific GRP level with a specific increase in sales, Meredith was confident based on the pilot
results and therefore was willing to take the risk. The offer was extended to a limited number of brands for
the first year to minimize risk; originally 13 brands signed on, but 8 ultimately ran sufficient magazine
advertising support to be eligible.
The MSG guaranteed on two levels, 1) an increase in sales among the Meredith test group vs. a matched
control, and 2) a positive return on investment (ROI defined as Incremental Sales/Media Spend).
Results of 2012 Brand Guarantees
At the time of this writing, results are in for 11 additional brands. Seven of the eight guarantees have been
successfully completed (the results for the final brand will be available in early July 2013). In addition, four
brands (including Ken’s Salad Dressing, which will be detailed later in this paper) were measured using the
NCS Print Effect methodology, without results guaranteed.

8 | P a g e
Exposure to brand advertising in the Meredith titles resulted in sales lifts for each of the additional eleven
brands measured, ranging from +3% to +18%, compared to the control group. Each of the advertising
campaigns realized an increase in brand sales vs. the control, and the analysis indicated a positive ROI
ranging from $3.19 to $13.44 in incremental sales for every dollar spent in magazine advertising.

9 | P a g e
Sales increases were based on a combination of increased household penetration (5 brands) and increased
buying rate, which is a combination of shopping occasions and spending per trip (6 brands).

10 | P a g e
In summary, each of the 25 brands that ran campaigns in Meredith magazines between 2009 and 2012 and
were measured using the Nielsen Print Effect methodology, registered positive results, both in sales
increase vs. a matched control and with a positive ROI.
B. Magazine Only Case Study
Background
Although each brand has its unique story, one of the most interesting is that of Ken’s Steakhouse Salad
Dressing. Ken’s Salad Dressing got its start as the “star of the show” at Ken’s Steakhouse in Massachusetts
in the 1940’s. “Discovered”, and later marketed by a couple who were regular patrons of the restaurant,
since the 1940’s Ken’s has expanded from the east coast of the United States out to the west and continues
to introduce new flavors, packaging and recipe options. Currently, Ken’s boasts $100 million in annual
revenue and rivals salad dressing category leaders for share in many regions. Prior to 2012 however, Ken’s
marketing included no consumer advertising. The brand was supported exclusively by trade, free standing
inserts (coupons) and promotional support for its broad range of salad dressing flavors and sizes. Meredith
recognized Ken’s as ideal partner to test the impact of magazine advertising on brand sales, absent any
other national media. In other words, to prove unequivocally that magazines alone have brand building
power.

11 | P a g e
Brand management at Ken’s was eager to work with Meredith. In fact, Ken’s was starting to see signs of
weakness, especially on the west coast where the brand’s heritage was virtually unknown. And, as a
premium priced brand in a commodity category, Ken’s customers were getting wise to the price promotions
and starting to wait for their favorite brand to go on sale, rather than purchasing a Ken’s brand on every
salad dressing purchase occasion.
Ken’s agreed to invest in a magazine advertising campaign with Meredith, running six times in four of
Meredith’s titles (meeting the 200 A18+ minimum for the Meredith Sales Guarantee). The goal was to test
the impact of magazine advertising on Ken’s overall salad dressing sales and by key regions. At this time,
Ken’s marketing team also agreed to heavy up in five west coast DMA’s with spot TV and pre-roll online
advertising. This campaign strategy provided additional data points for analysis and impact of magazines
with and without other media.
Results Summary
Results for Ken’s were impressive. Not only did Meredith households (test group) purchase +18% more
Ken’s Salad Dressing than the matched control group during the campaign period, but sales increased
compared to sales among same households during the same time period year ago (+11.5%).

12 | P a g e
Tracking analysis indicates that sales reaction to advertising began immediately the week the magazines
went on sale and continued throughout the sales period.
In addition, total sales for Ken’s Salad Dressing increased by +6.9% based on national sales data from
Nielsen (outside of the matched test and control groups) compared to the same period year ago, and unit
sales increased +6.0% , indicating profitable sales (higher than average price per unit).

13 | P a g e
Sales were based primarily on the increasing Ken’s share of wallet in this commodity category (at the
expense of the #1 share brand), however, importantly to their retail partners, the salad dressing category
also increased sales by + .6%. In fact, results show that without the increase in Ken’s sales, salad dressing
category sales would have declined.
VI. ADDITIONAL LEARNING
A. Sales Drivers
In addition to the volumetrics for each of the analyzed campaigns, we have a number of other data points
on both brand dynamics and campaign details:
Brand Dynamics Campaign Execution Copy Reaction
Product penetration (%)
Price per Volume
Purchase cycle (days)
Average trips per year
Total Insertions
Cost ($)
Gross Impressions (000)
Net Reach (000)
Net Reach (%)
Net Reach CPM ($)
Average Frequency
Noted (%)
Any action taken by Noters (%)
To assess the impact of the variables on the volumetric results, models were built with the following
guidelines:
• Only two independent variables (given the number of observations)
• One variable must be brand, the other can be either execution or copy oriented.
For the first series of campaigns (discussed in the 2011 research), these models showed a relationship
between the copy reaction “% Noted” and “Price per Volume” on Annualized Incremental Volume. This
model showed that with Price per Volume held constant, once % Noted exceeds 40%, for every further 5%
increase in that variable, Annualized Incremental Volume increased by $1.64.
A similar set of correlation analyses were run using the full set of campaigns (25) analyzed, including the
eleven additional from 2012, and similar models developed using the same guidelines as for the 2011. The
addition of the newer campaign information reduced the strength of the model that held Annualized
Volume as a function of Price per Volume and % Noted (high p values and low r2). The updated models
showed that “Purchase Cycle” was the brand dynamic variable, regardless of copy or execution variables
used. “Any action taken by Noters” as a copy reaction variable yielded better models than “% Noted”, but
its best p-value of 0.18 was too high to be considered a strong predictor of the dependent variable. The best
two variable model for Annualized Incremental Volume was “Purchase Cycle” and “% Reach”. In the new
models, when purchase cycle was held constant, each additional 5% of Reach added $0.73 in Annualized
Incremental Volume.

14 | P a g e
B. Comparison to digital
Nielsen Catalina Solutions has measured over 850 digital campaigns using the Digital Sales Effect
methodology over the past five years. This approach is identical to the Print Effect methodology with two
exceptions:
1. Exposure to Ad vs. Exposure to Issue
Digital ads are tagged and matched to the Homescan (or NCS Frequent Shopper) panels,
providing opportunity for the respondent to see the specific advertisement.
Subscribers to magazine issues are matched with these same panels, providing opportunity to
read the issue, but not direct exposure to the specific advertisement.
2. Reach/Universe Projections - NCS’s “Sales Effect” product (regardless of media channel)
compares the sales in the average household – based on the match to Homescan or NCS database.
The next step is to project the reach of the campaign. Based on the difference in media
consumption and audience tracking, this is where Print and Digital differ.
Digital Reach/Universe is calculated using reach estimates from either digital platform
providers (total subscribers/members) or via Nielsen’s estimates of total US digital reach for
campaigns placed with multiple sites/platforms.
The Reach/Universe of a Magazine Campaign is calculated as total subscribers plus news-
stand purchasers. Further, and most significantly different than the estimates of digital reach,
magazine reach/universe calculations also include pass-along (secondary) readership.
In both cases, universe estimates are adjusted to reflect unique household vs. individual readers
(see detailed methodology in Section IV Methodology Overview for details on Unique HH
Calculation).
While these differences are not insignificant, they do reflect the best application of the Sales Effect
methodology into different media channels, each with a unique manner of communicating with consumers.
They reflect consumer behavior, and industry accepted definitions of audience.
Meredith’s $7.81 ROI, incorporating the impact of both annualized consumer response and secondary
readership, was far better than the average $2.79 ROI for the 864 behaviorally targeted campaigns which
ran on digital portals/ad networks over the last five years, as measured by Nielsen Catalina Solutions.
It is worth mentioning at this point that there is universal agreement that magazine advertising is effective
beyond the recipient of the subscriber copy. Numerous studies have evaluated the effectiveness of
advertising among primary vs. secondary readers and found them to be comparable (see footnote #3). In
sum, few would argue that there is zero benefit to advertisers beyond the subscriber copy. However, if zero
credit was given to the newsstand and pass-along readership, the average ROI for the 25 brands measured
is still positive at $2.20, i.e., for every dollar spent on Meredith advertising, the subscribers to the
magazines increased sales for the average brand by $2.20. In other words, with no credit given to ad

15 | P a g e
exposure beyond the subscriber copy, ROI for magazines is still consistently positive. No one will argue
with an ROI at the low end being $2.20, but more realistically $7.81, taking into account the proven value
of secondary readership (including newsstand).
VII. NEXT STEPS
Continue to guarantee sales results to advertisers and provide proof of performance
Extend measurement and guarantee beyond CPG to other categories such as retail, pharma, auto -
using broader and more precise behavioral databases (including Crossix, Argus and Polk)
Expand ROI measurement beyond Magazine to Digital & Cross Media
Demonstrate opportunity to link results with MMM data, providing level of publisher data not
currently available
Finalize investigation of primary sales drivers, including role of creative

16 | P a g e
VIII. APPENDIX
1. Client Feedback
“We were excited to be among those first to market with this program, and have always been strong
believers in the connection that magazine brands have with their readers,” says Mark Kaline, Global
Director-Media, Licensing & Consumer Services, Kimberly-Clark. “These initial results have been above
our expectations and the Meredith Sales Guarantee has helped us demonstrate sales return tied closely to
the media investment made for our brands who participated.” Kaline adds, “Meredith has created a
highly innovative program that leverages its deep assets and insights to benefit its marketing partners.
They deserve enormous credit for reaching out and working with partners to help them understand not only
the value of this program but how to maximize their investment in magazine media. We believe it is
essential that other magazine media as well as all media partners continue to find creative and effective
solutions to proving ROI for their clients. ”
According to Bob Galietti, SVP, Group Account Director at Havas Media, “gaining insight into shoppers,
and what helps stimulate a purchase is extremely valuable, and the Sales Guarantee program proved itself
to be an extremely worthwhile investment for Tyson Foods.”
“We generated a sales lift across all regions nationwide, particularly in areas where consumers were the
least familiar with the Ken’s brand,” says Tim Cahalane, Senior Brand Manager, Ken’s.” Our ads in
Meredith magazines helped to introduce consumers to the Ken’s brand heritage; differentiate our products
on a crowded shelf; and grow our sales above the category trend.”
2. Readers respond to magazine advertising regardless of how they acquire a magazine.
Secondary readers are just as likely as primary readers to notice ads and take action on them
Meredith Net
PRIMARY Readers
Meredith Net
SECONDARY/PASSALONG
Readers
Readers who Noted an Ad 32% 31%
Readers who Noted an Ad and Took
Action
17% 17%
Source: GFK MRI Fall 2012 Report

17 | P a g e


![Which Media Channels do Smart B2B Marketers Use to Drive Leads? [INFOGRAPHIC]](https://img.dokumen.tips/doc/110x75/58a287a01a28ab891a8b74cd/which-media-channels-do-smart-b2b-marketers-use-to-drive-leads-infographic.jpg)