Embed Size (px)
Citation preview
Madden–Julian Oscillation: Its Discovery, Dynamics, and Impact on East Asia
Tim LI1,2*, Jian LING3, and Pang-Chi HSU1
1 Key Laboratory of Meteorological Disaster, Ministry of Education (KLME)/Joint International Research Laboratory ofClimate and Environmental Change (ILCEC)/Collaborative Innovation Center on Forecast and Evaluation of Meteorological
Disasters (CIC-FEMD), Nanjing University of Information Science &Technology, Nanjing 210044, China2 International Pacific Research Center and Department of Atmospheric Sciences, School of Ocean and Earth Science
and Technology, University of Hawaii at Manoa, Honolulu, HI 96822, USA3 State Key Laboratory of Numerical Modeling for Atmospheric Sciences and Geophysical Fluid Dynamics,
Institute of Atmospheric Physics, Chinese Academy of Sciences, Beijing 100029, China
(Received September 9, 2019; in final form December 20, 2019)
ABSTRACT
In this review article, we pay primary attention to innovative works in the Madden–Julian Oscillation (MJO) fielddone by Chinese scientists. The historical aspect of discovery of the MJO and earlier studies of its dynamics byChinese scientists are first described. It is followed by the description of recent advances in MJO propagation and ini-tiation dynamics. For MJO eastward propagation, two types of the moisture mode theory are introduced. The first oneemphasizes the effect of zonal asymmetry of perturbation moisture in the atmospheric boundary layer and the secondone emphasizes the zonal asymmetry of column integrated moisture static energy (MSE) tendency. The mechanismsfor MJO initiation over the western Indian Ocean include three distinctive processes: lower tropospheric moisteningdue to horizontal advection caused by preceding suppressed-phase MJO, midlatitude Rossby wave activity flux con-vergence in the upper troposphere originated from the Southern Hemisphere, and a delayed sea surface temperaturefeedback in association with a preceding opposite-phase MJO. The impacts of MJO on low-frequency variability ofprecipitation and temperature and associated extreme events in East Asia are also discussed.Key words: Madden–Julian Oscillation (MJO), propagation and initiation, lower tropospheric moistening, Rossby
wave activity flux, delayed sea surface temperature feedbackCitation: Li, T., J. Ling, and P.-C. Hsu, 2020: Madden–Julian Oscillation: Its discovery, dynamics, and impact on
East Asia. J. Meteor. Res., 34(1), 20–42, doi: 10.1007/s13351-020-9153-3.
1. Introduction
The tropical atmosphere exhibits rich spectrum ofmultiple temporal and spatial scales. Among them is amarked intraseasonal oscillation (ISO). This sub-seaso-nal scale variability was originally discovered by Mad-den and Julian (1971) based on the power spectrum ana-lysis of surface pressure and low- and upper-level zonalwind fields at an island station over central equatorial Pa-cific. Later, Madden and Julian (1972) further illustratedthat this variability appears over the large domain of thetropics and has a coherent dynamic structure, propagat-
ing slowly eastward. The originally identified ISO signalby Madden and Julian (1971, 1972) was confined in the40–50-day period with typical zonal wavenumber oneand eastward-propagating characteristics, which wereconfirmed by later studies using modern observationaldata (e.g., Krishnamurti and Subrahmanyam, 1982;Weickmann, 1983; Murakami and Nakazawa, 1985; Lauand Chan, 1986; Knutson and Weickmann, 1987; Chenand Murakami, 1988; Hartmann and Michelsen, 1989).The later studies with multiple data sources and multiplevariables showed that this oscillation is of more broad-band (20–90 days) than the original 40–50-day period
Supported by the National Key Research and Development Program of China (2018YFC1505804), National Natural Science Founda-
tion of China (41875069, 41575043, 41575052, 41922035, 41520104, and 41575062), US NSF AGS-1643297, and NOAANA18OAR4310298. This is SOEST contribution number 10900 and IPRC contribution number 1428.
*Corresponding author: [email protected].©The Chinese Meteorological Society and Springer-Verlag Berlin Heidelberg 2020
Volume 34Advances in Meteorological Research and Operation Since the Found-
ing of The People’s Republic of China FEBRUARY 2020
(e.g., Krishnamurti and Subrahmanyam, 1982; Wang andRui, 1990; Hendon and Salby, 1994; Sperber et al., 1997;Annamalai and Slingo, 2001; Zhang, 2005).
The ISO signals exhibit pronounced seasonality inpropagation (Madden, 1986; Wang and Rui, 1990; Mad-den and Julian, 1994; Jones et al., 2004; Zhang andDong, 2004; Kikuchi et al., 2012; Lu and Hsu, 2017) andinitiation (Jiang and Li, 2005; Wang et al., 2006; Zhao etal., 2013; Li et al., 2015). In boreal winter, ISO is charac-terized by pronounced eastward propagation along theseasonal mean convective zones over tropical IndianOcean and Maritime Continent regions (Hendon andSalby, 1994; Salby and Hendon, 1994; Hsu and Li, 2012;Zhao et al., 2013). This eastward-propagating mode is of-ten referred to as the MJO mode. The boreal summer ISO(hereafter BSISO) is characterized by pronounced north-ward propagation over the tropical Indian Ocean andSouth China Sea (Yasunari, 1979; Jiang et al., 2004; Li etal., 2018) and northwestward propagation over westernNorth Pacific (Li and Wang, 2005).
The distinctive propagation characteristics betweenboreal winter and summer are caused by the backgroundannual cycle mean state, as demonstrated by a linear sta-bility analysis (Li, 2014). Under a northern winter meanstate in which the thermal equator shifts slightly south-ward within one Rossby radius of deformation, convect-ively coupled Kelvin waves are unstable while Rossbywaves are stable. As a result, the MJO perturbationmoves eastward along the mean convective zone. Undera boreal summer mean state in which the thermal equa-tor shifts far away from one Rossby radius of deforma-tion and there is subsidence over the equatorial region,Kelvin waves are damped while Rossby waves becomeunstable. This promotes the northward jump of ISO con-vection away from the equator.
The initiation of ISO convection is also quite differentbetween boreal winter and summer over tropical IndianOcean (IO). In boreal winter ISO convection often initi-ates over southwestern IO (Zhao et al., 2013), while inboreal summer ISO convection is often triggered overcentral equatorial IO (Wang et al., 2006; Zhang et al.,2019). The difference is possibly caused by the seasonalchange of the mean SST over the tropical IO (Zhang etal., 2019).
MJO/ISO has been identified to have far reaching im-pacts on global weather and climate. For example, dur-ing its eastward propagating journey, MJO may triggerthe monsoon onset (Li et al., 2013) and affect the mon-soon active and break periods (Jiang et al., 2004; Qi etal., 2008; Hsu and Yang, 2016). It may help trigger theEl Niño–Southern Oscillation (ENSO) events through in-
duced westerly wind burst (Lengaigne et al., 2004; Chenet al., 2017) and interact with diurnal cycles (Lu et al.,2019) and high-frequency disturbances (Zhu et al., 2019)over Maritime Continent. The tropical IO and westernNorth Pacific (WNP) are regions of strong ISO variabil-ity. These regions, not by coincidence, are also regionswith most active synoptic-scale variability (SSV) includ-ing synoptic wave train and TC activity (Lau and Lau,1990; Liebmann et al., 1994; Hartmann and Maloney,2001; Maloney and Dickinson, 2003; Straub and Kiladis,2003; Batstone et al., 2005). It is well known that ISOexerts a large-scale control on SSV (Hendon and Lieb-mann, 1994; Maloney and Hartmann, 1998, 2000a, b;Straub and Kiladis, 2003). SSV, on the other hand, mayexert an upscale feedback to MJO through nonlinear rec-tification of diabatic heating (Hsu and Li, 2011; Zhu etal., 2019) and surface latent heat flux (Zhou and Li,2010), eddy momentum transport (Hsu and Li, 2011; Zhuet al., 2019), and barotropic energy conversion (Hsu etal., 2011).
MJO is the major predictability source for extended-range weather–climate forecast. Through 100-yr efforts,short-range weather forecast is now quite mature. Under-standing ENSO dynamics and improved simulation ofENSO in coupled atmosphere–ocean models make it pos-sible for seasonal prediction. Currently, the most diffi-cult part in operational centers is extended range (10–30-day) forecast. Because of that, the World MeteorologicalOrganization (WMO) called for grand challenging to fillin the large forecast skill gap between short-range wea-ther and long-range seasonal prediction. Accurate predic-tion of MJO/ISO is crucial for bridging the gap.
Most of state-of-the-art global models, however, havelow skills in simulating MJO eastward propagation(Wang et al., 2017). Our current knowledge in under-standing MJO/ISO dynamics is limited. Thus, revealingthe MJO fundamental dynamics including its propaga-tion and initiation mechanisms is critical for advancingtropical climate dynamics, improving model capability inpredicting intraseasonal variations of the global atmo-sphere and ocean, and bridging the current gap betweenshort-range weather and seasonal climate prediction.
Different from previous MJO review literatures(Zhang, 2005; Waliser, 2006), this article pays more at-tention to the innovative works in the MJO field done byChinese scientists. The objective of this paper is to re-view the historical aspect of MJO discovery and someearlier studies of MJO by Chinese scientists, introducesome latest advancement in understanding MJO propaga-tion and initiation dynamics in international researchcommunity, and describe the impact of MJO on extreme
FEBRUARY 2020 Li, T., J. Ling, and P.-C. Hsu 21
weather events in China and East Asia. The remainingpart of this paper is organized as follows. In Section 2,we describe the discovery of MJO and some theoreticalstudies by Chinese scientists in earlier days. In particular,Xie et al. (1963) discovered a 40–50-day oscillation inthe Asian monsoon region, and this paper was publishedin a Chinese journal eight years before Madden and Ju-lian (1971). In Section 3, we introduce various theoriesfor MJO eastward propagation, with an emphasis on therecently developed moisture mode theory. In addition,physical processes relevant to MJO initiation are alsodiscussed. In Section 4, we pay special attention toMJO/ISO impacts on the East Asian climate. Finally, asummary and concluding remark are given in the lastsection.
2. Historical perspective of discovery andstudy of MJO by Chinese scientists
Madden and Julian (1971) unveiled a 40–50-day oscil-lation in the tropospheric zonal wind using radiosondeobservation at Canton Island in the central Pacific. Thisoscillation was later found connected to a broad globaltropical circulation based on observations from multiplestations across the tropics (Madden and Julian, 1972).The intraseasonal signal is now referred to as the Mad-den–Julian Oscillation (MJO). The discovery of MJOmay be regarded as one of the most important discover-ies on tropical atmosphere in the 20th century. Papers byMadden and Julian (1971, 1972) are among the most in-fluential and most cited studies in modern meteorology.
One important effect of MJO is its impact on tropicalcyclone (TC) genesis. Liebmann et al. (1994) indicatedthat the frequency of TC genesis during the active phaseof MJO is twice as large as that during the inactive phaseof MJO. Maloney and Hartmann (1998, 2000a, b) sug-gested that MJO westerlies may set up favorable environ-mental conditions for TC development by inducing low-level cyclonic vorticity and weak vertical wind shear.Small-scale eddies may grow through barotropic eddykinetic energy (EKE) conversion from the MJO back-ground mean flow, serving as the energy source for TCdevelopment (Hartmann and Maloney, 2001; Maloneyand Hartmann, 2001; Hsu et al., 2011). Sensitivity mo-del experiments showed that both MJO-scale circulationand moisture anomalies contribute to TC development(Cao et al., 2014) and such a forcing effect is basin de-pendent (Zhao and Li, 2019).
Li et al. (2018) published an article in Bulletin of theAmerican Meteorological Society (BAMS) and informedthe community that the 40–50-day oscillation was first
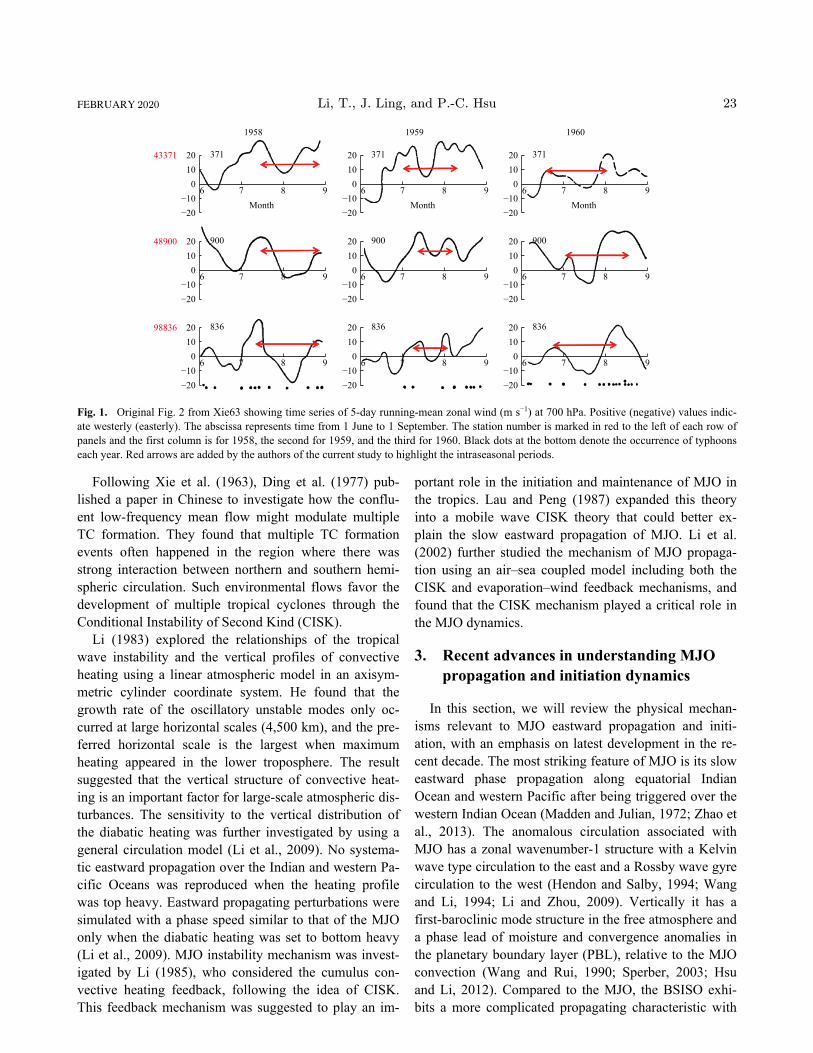
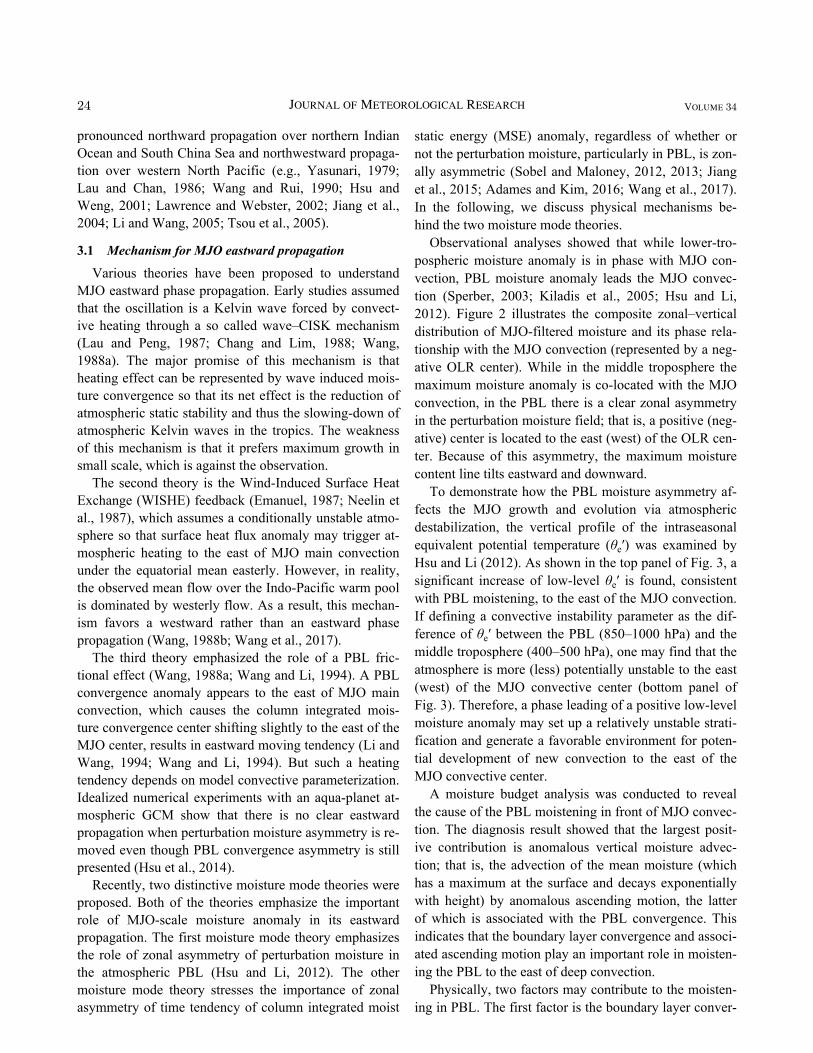
discovered by Chinese scientists (Xie et al., 1963, abbre-viated as Xie63 hereafter) in a Chinese journal “ActaMeteorologica Sinica,” eight years before Madden andJulian’s seminal work. Xie et al. (1963) documented anoscillatory signal of 40–50-day period using raw radio-sonde data from several stations in the tropics extendedfrom 70°E all the way to central Pacific. Their analysisdata covered three years from 1958 to 1960 for themonths of June to September. The 40–50-day signal dis-covered by Xie63 is strikingly strong as revealed by thetotal zonal wind component at 700 hPa over these sta-tions without any filtering (Fig. 1). In addition, Xie63also documented a relation between the low-frequencyzonal wind oscillation and the occurrence of typhoons inthe western Pacific. They noted that typhoons often ap-peared in the confluence region where the monsoonwesterly meets the trade easterly.
Here is a direct quote, with its English translation, ofthe abstract of Xie63:
“The relationship between the basic flows of the lowlatitudes and the occurrence of typhoons was investig-ated statistically and synoptically by means of recentthree-year radiosonde data. It was found that about 80%of typhoons developed in the eastern flank of the tropicalconfluence zone between the monsoon westerlies and theeasterly trade winds. The westerlies are a large-scaleand quasi-steady phenomenon. Thus it is probably reas-onable to be called the “basic flow” while the typhoonsare considered as vortices of smaller scale. There is aquite definite relationship between the time, location andfrequency of typhoon genesis and the location andstrength of the basic flow in the low latitudes. There wasa quasi-periodical oscillation of strength and position ofthe basic zonal flow with a period longer than onemonth. Such an oscillation might be helpful for the exten-ded-range forecast of initiation and development oftyphoons.”
Irrespective of the importance of these findings morethan 50 years ago, the original paper by Xie63 was pub-lished in Chinese and remains mostly unknown to the in-ternational research community. Li et al. (2018) broughtattention of the study by Xie63 and its originality to MJOcommunity worldwide. Using modern satellite and reana-lysis data, Li et al. (2018) verified the results of Xie63and compared the results of Xie63 and Madden and Ju-lian (1971) using a longer period of data (1958–1970), tohave a better comparison of ISO signals found by Xie63and Madden and Julian (1971). In addition, the origin ofthe oscillation in the monsoon westerly was discussedand its relationship with the occurrence of TCs was con-firmed.
22 Journal of Meteorological Research Volume 34
Following Xie et al. (1963), Ding et al. (1977) pub-lished a paper in Chinese to investigate how the conflu-ent low-frequency mean flow might modulate multipleTC formation. They found that multiple TC formationevents often happened in the region where there wasstrong interaction between northern and southern hemi-spheric circulation. Such environmental flows favor thedevelopment of multiple tropical cyclones through theConditional Instability of Second Kind (CISK).
Li (1983) explored the relationships of the tropicalwave instability and the vertical profiles of convectiveheating using a linear atmospheric model in an axisym-metric cylinder coordinate system. He found that thegrowth rate of the oscillatory unstable modes only oc-curred at large horizontal scales (4,500 km), and the pre-ferred horizontal scale is the largest when maximumheating appeared in the lower troposphere. The resultsuggested that the vertical structure of convective heat-ing is an important factor for large-scale atmospheric dis-turbances. The sensitivity to the vertical distribution ofthe diabatic heating was further investigated by using ageneral circulation model (Li et al., 2009). No systema-tic eastward propagation over the Indian and western Pa-cific Oceans was reproduced when the heating profilewas top heavy. Eastward propagating perturbations weresimulated with a phase speed similar to that of the MJOonly when the diabatic heating was set to bottom heavy(Li et al., 2009). MJO instability mechanism was invest-igated by Li (1985), who considered the cumulus con-vective heating feedback, following the idea of CISK.This feedback mechanism was suggested to play an im-
portant role in the initiation and maintenance of MJO inthe tropics. Lau and Peng (1987) expanded this theoryinto a mobile wave CISK theory that could better ex-plain the slow eastward propagation of MJO. Li et al.(2002) further studied the mechanism of MJO propaga-tion using an air–sea coupled model including both theCISK and evaporation–wind feedback mechanisms, andfound that the CISK mechanism played a critical role inthe MJO dynamics.
3. Recent advances in understanding MJOpropagation and initiation dynamics
In this section, we will review the physical mechan-isms relevant to MJO eastward propagation and initi-ation, with an emphasis on latest development in the re-cent decade. The most striking feature of MJO is its sloweastward phase propagation along equatorial IndianOcean and western Pacific after being triggered over thewestern Indian Ocean (Madden and Julian, 1972; Zhao etal., 2013). The anomalous circulation associated withMJO has a zonal wavenumber-1 structure with a Kelvinwave type circulation to the east and a Rossby wave gyrecirculation to the west (Hendon and Salby, 1994; Wangand Li, 1994; Li and Zhou, 2009). Vertically it has afirst-baroclinic mode structure in the free atmosphere anda phase lead of moisture and convergence anomalies inthe planetary boundary layer (PBL), relative to the MJOconvection (Wang and Rui, 1990; Sperber, 2003; Hsuand Li, 2012). Compared to the MJO, the BSISO exhi-bits a more complicated propagating characteristic with
20100
6 7
371
8 9−10−20
20100
6 7
371
8 9−10−20
20100
6 7
371
1958 1959 1960
8 9−10−20
20100
6 7
900
8 9−10−20
20100
6 7
900
8 9−10−20
20100
6 7
900
8 9−10−20
20100
6 7
836
43371
48900
98836
8 9−10−20
20100
6 7
836
8 9−10−20
20100
6 7
836
8
Month Month Month
9−10−20
Fig. 1. Original Fig. 2 from Xie63 showing time series of 5-day running-mean zonal wind (m s−1) at 700 hPa. Positive (negative) values indic-ate westerly (easterly). The abscissa represents time from 1 June to 1 September. The station number is marked in red to the left of each row ofpanels and the first column is for 1958, the second for 1959, and the third for 1960. Black dots at the bottom denote the occurrence of typhoonseach year. Red arrows are added by the authors of the current study to highlight the intraseasonal periods.
FEBRUARY 2020 Li, T., J. Ling, and P.-C. Hsu 23
pronounced northward propagation over northern IndianOcean and South China Sea and northwestward propaga-tion over western North Pacific (e.g., Yasunari, 1979;Lau and Chan, 1986; Wang and Rui, 1990; Hsu andWeng, 2001; Lawrence and Webster, 2002; Jiang et al.,2004; Li and Wang, 2005; Tsou et al., 2005).
3.1 Mechanism for MJO eastward propagation
Various theories have been proposed to understandMJO eastward phase propagation. Early studies assumedthat the oscillation is a Kelvin wave forced by convect-ive heating through a so called wave–CISK mechanism(Lau and Peng, 1987; Chang and Lim, 1988; Wang,1988a). The major promise of this mechanism is thatheating effect can be represented by wave induced mois-ture convergence so that its net effect is the reduction ofatmospheric static stability and thus the slowing-down ofatmospheric Kelvin waves in the tropics. The weaknessof this mechanism is that it prefers maximum growth insmall scale, which is against the observation.
The second theory is the Wind-Induced Surface HeatExchange (WISHE) feedback (Emanuel, 1987; Neelin etal., 1987), which assumes a conditionally unstable atmo-sphere so that surface heat flux anomaly may trigger at-mospheric heating to the east of MJO main convectionunder the equatorial mean easterly. However, in reality,the observed mean flow over the Indo-Pacific warm poolis dominated by westerly flow. As a result, this mechan-ism favors a westward rather than an eastward phasepropagation (Wang, 1988b; Wang et al., 2017).
The third theory emphasized the role of a PBL fric-tional effect (Wang, 1988a; Wang and Li, 1994). A PBLconvergence anomaly appears to the east of MJO mainconvection, which causes the column integrated mois-ture convergence center shifting slightly to the east of theMJO center, results in eastward moving tendency (Li andWang, 1994; Wang and Li, 1994). But such a heatingtendency depends on model convective parameterization.Idealized numerical experiments with an aqua-planet at-mospheric GCM show that there is no clear eastwardpropagation when perturbation moisture asymmetry is re-moved even though PBL convergence asymmetry is stillpresented (Hsu et al., 2014).
Recently, two distinctive moisture mode theories wereproposed. Both of the theories emphasize the importantrole of MJO-scale moisture anomaly in its eastwardpropagation. The first moisture mode theory emphasizesthe role of zonal asymmetry of perturbation moisture inthe atmospheric PBL (Hsu and Li, 2012). The othermoisture mode theory stresses the importance of zonalasymmetry of time tendency of column integrated moist
static energy (MSE) anomaly, regardless of whether ornot the perturbation moisture, particularly in PBL, is zon-ally asymmetric (Sobel and Maloney, 2012, 2013; Jianget al., 2015; Adames and Kim, 2016; Wang et al., 2017).In the following, we discuss physical mechanisms be-hind the two moisture mode theories.
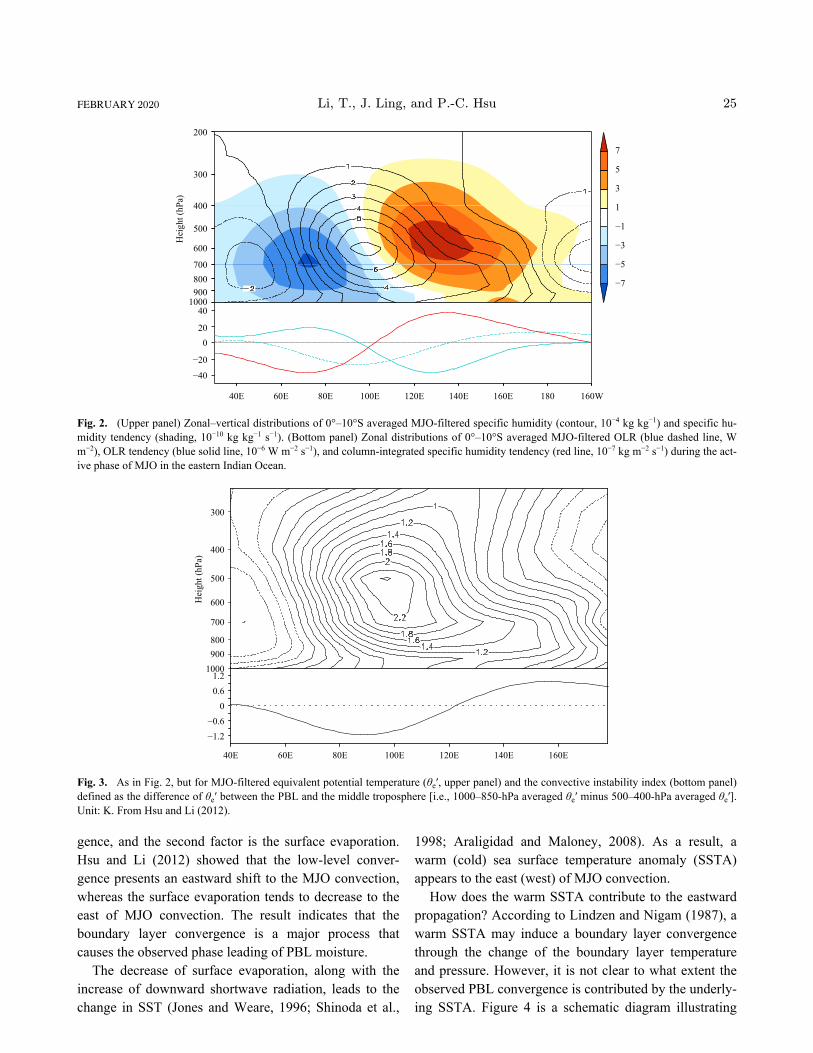
Observational analyses showed that while lower-tro-pospheric moisture anomaly is in phase with MJO con-vection, PBL moisture anomaly leads the MJO convec-tion (Sperber, 2003; Kiladis et al., 2005; Hsu and Li,2012). Figure 2 illustrates the composite zonal–verticaldistribution of MJO-filtered moisture and its phase rela-tionship with the MJO convection (represented by a neg-ative OLR center). While in the middle troposphere themaximum moisture anomaly is co-located with the MJOconvection, in the PBL there is a clear zonal asymmetryin the perturbation moisture field; that is, a positive (neg-ative) center is located to the east (west) of the OLR cen-ter. Because of this asymmetry, the maximum moisturecontent line tilts eastward and downward.
To demonstrate how the PBL moisture asymmetry af-fects the MJO growth and evolution via atmosphericdestabilization, the vertical profile of the intraseasonalequivalent potential temperature (θe′) was examined byHsu and Li (2012). As shown in the top panel of Fig. 3, asignificant increase of low-level θe′ is found, consistentwith PBL moistening, to the east of the MJO convection.If defining a convective instability parameter as the dif-ference of θe′ between the PBL (850–1000 hPa) and themiddle troposphere (400–500 hPa), one may find that theatmosphere is more (less) potentially unstable to the east(west) of the MJO convective center (bottom panel ofFig. 3). Therefore, a phase leading of a positive low-levelmoisture anomaly may set up a relatively unstable strati-fication and generate a favorable environment for poten-tial development of new convection to the east of theMJO convective center.
A moisture budget analysis was conducted to revealthe cause of the PBL moistening in front of MJO convec-tion. The diagnosis result showed that the largest posit-ive contribution is anomalous vertical moisture advec-tion; that is, the advection of the mean moisture (whichhas a maximum at the surface and decays exponentiallywith height) by anomalous ascending motion, the latterof which is associated with the PBL convergence. Thisindicates that the boundary layer convergence and associ-ated ascending motion play an important role in moisten-ing the PBL to the east of deep convection.
Physically, two factors may contribute to the moisten-ing in PBL. The first factor is the boundary layer conver-
24 Journal of Meteorological Research Volume 34
gence, and the second factor is the surface evaporation.Hsu and Li (2012) showed that the low-level conver-gence presents an eastward shift to the MJO convection,whereas the surface evaporation tends to decrease to theeast of MJO convection. The result indicates that theboundary layer convergence is a major process thatcauses the observed phase leading of PBL moisture.
The decrease of surface evaporation, along with theincrease of downward shortwave radiation, leads to thechange in SST (Jones and Weare, 1996; Shinoda et al.,
1998; Araligidad and Maloney, 2008). As a result, awarm (cold) sea surface temperature anomaly (SSTA)appears to the east (west) of MJO convection.
How does the warm SSTA contribute to the eastwardpropagation? According to Lindzen and Nigam (1987), awarm SSTA may induce a boundary layer convergencethrough the change of the boundary layer temperatureand pressure. However, it is not clear to what extent theobserved PBL convergence is contributed by the underly-ing SSTA. Figure 4 is a schematic diagram illustrating
200
300
400
500
600
700800900
100040
200
−20
−40
40E 60E 80E
Hei
ght (
hPa)
100E 120E 140E 160E 180 160W
7
5
3
1
−1
−3
−5
−7
Fig. 2. (Upper panel) Zonal–vertical distributions of 0°–10°S averaged MJO-filtered specific humidity (contour, 10−4 kg kg−1) and specific hu-midity tendency (shading, 10−10 kg kg−1 s−1). (Bottom panel) Zonal distributions of 0°–10°S averaged MJO-filtered OLR (blue dashed line, Wm−2), OLR tendency (blue solid line, 10−6 W m−2 s−1), and column-integrated specific humidity tendency (red line, 10−7 kg m−2 s−1) during the act-ive phase of MJO in the eastern Indian Ocean.
300
400
500
600
700
800900
10001.20.6
0−0.6−1.2
40E 60E 80E 100E 120E 140E 160E
Hei
ght (
hPa)
Fig. 3. As in Fig. 2, but for MJO-filtered equivalent potential temperature (θe′, upper panel) and the convective instability index (bottom panel)defined as the difference of θe′ between the PBL and the middle troposphere [i.e., 1000–850-hPa averaged θe′ minus 500–400-hPa averaged θe′].Unit: K. From Hsu and Li (2012).
FEBRUARY 2020 Li, T., J. Ling, and P.-C. Hsu 25
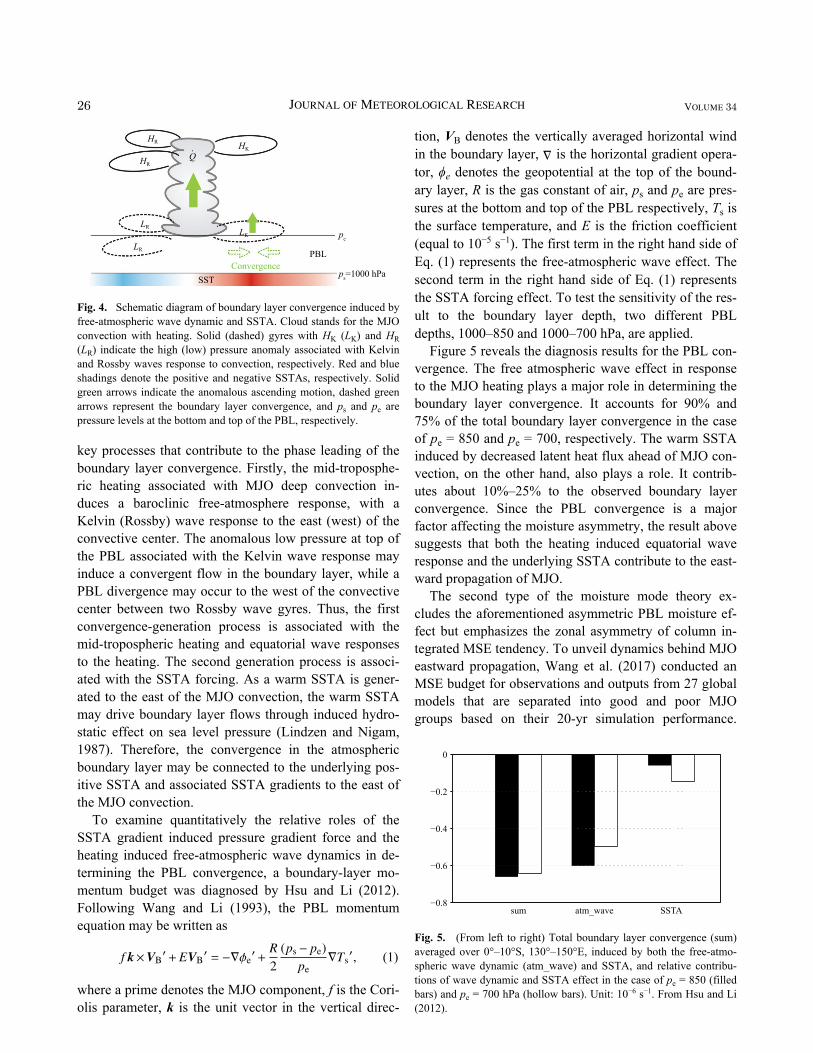
key processes that contribute to the phase leading of theboundary layer convergence. Firstly, the mid-troposphe-ric heating associated with MJO deep convection in-duces a baroclinic free-atmosphere response, with aKelvin (Rossby) wave response to the east (west) of theconvective center. The anomalous low pressure at top ofthe PBL associated with the Kelvin wave response mayinduce a convergent flow in the boundary layer, while aPBL divergence may occur to the west of the convectivecenter between two Rossby wave gyres. Thus, the firstconvergence-generation process is associated with themid-tropospheric heating and equatorial wave responsesto the heating. The second generation process is associ-ated with the SSTA forcing. As a warm SSTA is gener-ated to the east of the MJO convection, the warm SSTAmay drive boundary layer flows through induced hydro-static effect on sea level pressure (Lindzen and Nigam,1987). Therefore, the convergence in the atmosphericboundary layer may be connected to the underlying pos-itive SSTA and associated SSTA gradients to the east ofthe MJO convection.
To examine quantitatively the relative roles of theSSTA gradient induced pressure gradient force and theheating induced free-atmospheric wave dynamics in de-termining the PBL convergence, a boundary-layer mo-mentum budget was diagnosed by Hsu and Li (2012).Following Wang and Li (1993), the PBL momentumequation may be written as
f k×VB′+EVB
′ = −∇ϕe′+
R2
(ps− pe)pe
∇Ts′, (1)
where a prime denotes the MJO component, f is the Cori-olis parameter, k is the unit vector in the vertical direc-
∇tion, VB denotes the vertically averaged horizontal windin the boundary layer, is the horizontal gradient opera-tor, ϕe denotes the geopotential at the top of the bound-ary layer, R is the gas constant of air, ps and pe are pres-sures at the bottom and top of the PBL respectively, Ts isthe surface temperature, and E is the friction coefficient(equal to 10−5 s−1). The first term in the right hand side ofEq. (1) represents the free-atmospheric wave effect. Thesecond term in the right hand side of Eq. (1) representsthe SSTA forcing effect. To test the sensitivity of the res-ult to the boundary layer depth, two different PBLdepths, 1000–850 and 1000–700 hPa, are applied.
Figure 5 reveals the diagnosis results for the PBL con-vergence. The free atmospheric wave effect in responseto the MJO heating plays a major role in determining theboundary layer convergence. It accounts for 90% and75% of the total boundary layer convergence in the caseof pe = 850 and pe = 700, respectively. The warm SSTAinduced by decreased latent heat flux ahead of MJO con-vection, on the other hand, also plays a role. It contrib-utes about 10%–25% to the observed boundary layerconvergence. Since the PBL convergence is a majorfactor affecting the moisture asymmetry, the result abovesuggests that both the heating induced equatorial waveresponse and the underlying SSTA contribute to the east-ward propagation of MJO.
The second type of the moisture mode theory ex-cludes the aforementioned asymmetric PBL moisture ef-fect but emphasizes the zonal asymmetry of column in-tegrated MSE tendency. To unveil dynamics behind MJOeastward propagation, Wang et al. (2017) conducted anMSE budget for observations and outputs from 27 globalmodels that are separated into good and poor MJOgroups based on their 20-yr simulation performance.
pe
PBL
SST
Q.
LR
LR
HR
HR HK
LK
Convergenceps=1000 hPa
Fig. 4. Schematic diagram of boundary layer convergence induced byfree-atmospheric wave dynamic and SSTA. Cloud stands for the MJOconvection with heating. Solid (dashed) gyres with HK (LK) and HR(LR) indicate the high (low) pressure anomaly associated with Kelvinand Rossby waves response to convection, respectively. Red and blueshadings denote the positive and negative SSTAs, respectively. Solidgreen arrows indicate the anomalous ascending motion, dashed greenarrows represent the boundary layer convergence, and ps and pe arepressure levels at the bottom and top of the PBL, respectively.
−0.2
0
−0.4
−0.6
−0.8sum atm_wave SSTA
Fig. 5. (From left to right) Total boundary layer convergence (sum)averaged over 0°–10°S, 130°–150°E, induced by both the free-atmo-spheric wave dynamic (atm_wave) and SSTA, and relative contribu-tions of wave dynamic and SSTA effect in the case of pe = 850 (filledbars) and pe = 700 hPa (hollow bars). Unit: 10−6 s−1. From Hsu and Li(2012).
26 Journal of Meteorological Research Volume 34
m = cpT +gz+LvqMSE (m) is defined as , where T istemperature, z is height, q is specific humidity, cp is thespecific heat at constant pressure (1004 J K−1 kg−1), g isthe gravitational acceleration (9.8 m s−2), and Lv is thelatent heat of vaporization (2.5 × 10⁶ J kg−1). Thecolumn-integrated MSE budget can be written followingNeelin and Held (1987) as
⟨∂tm⟩ = −⟨ω∂pm
⟩−⟨V · ∇m⟩+Qt+Qr, (2)
V ω
where the angle bracket represents a mass-weighted ver-tical integral from the surface to 100 hPa, p is pressure,
is horizontal wind vector, and is pressure velocity.The left-hand-side term represents MSE tendency, thefirst and second terms on the right-hand-side representthe vertical and horizontal advection, respectively. Qtrepresents the sum of surface latent and sensible heatfluxes, and Qr represents the sum of vertically integratedshortwave and longwave heating rates. For the observa-tional diagnosis, Qr is calculated from MERRA (ModernEra Retrospective Analysis for Research and Applica-tions) and the other terms are derived from ERA_I
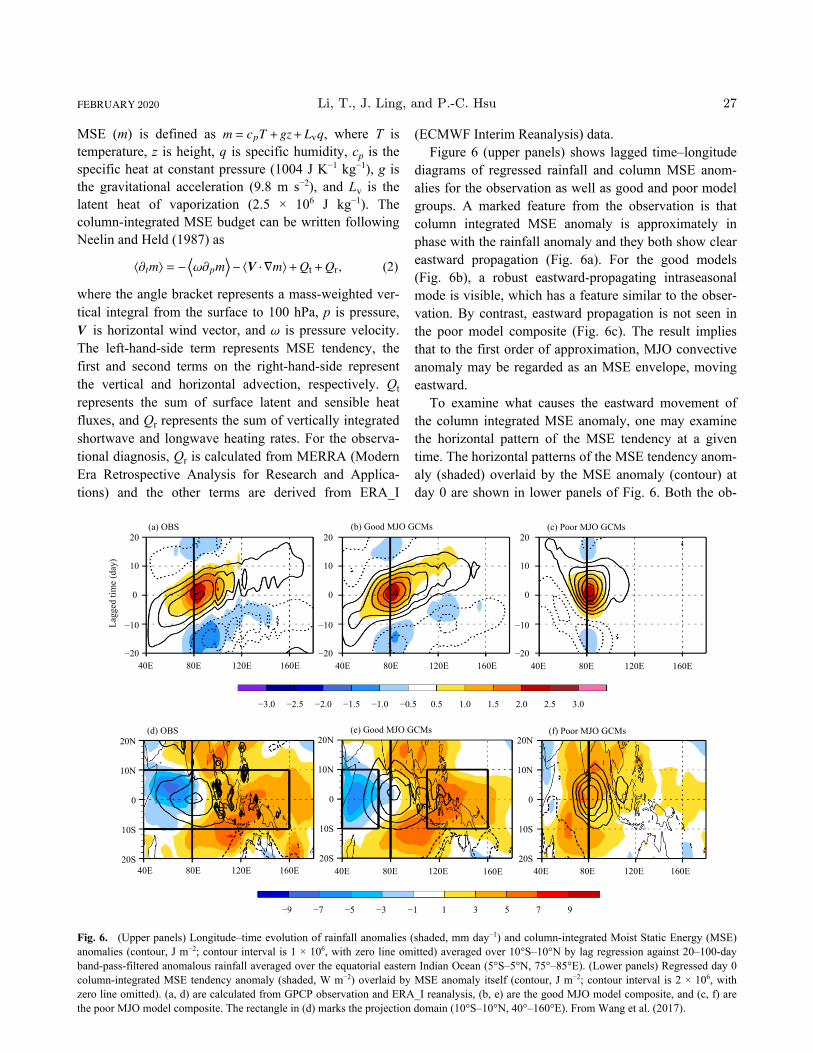
(ECMWF Interim Reanalysis) data.Figure 6 (upper panels) shows lagged time–longitude
diagrams of regressed rainfall and column MSE anom-alies for the observation as well as good and poor modelgroups. A marked feature from the observation is thatcolumn integrated MSE anomaly is approximately inphase with the rainfall anomaly and they both show cleareastward propagation (Fig. 6a). For the good models(Fig. 6b), a robust eastward-propagating intraseasonalmode is visible, which has a feature similar to the obser-vation. By contrast, eastward propagation is not seen inthe poor model composite (Fig. 6c). The result impliesthat to the first order of approximation, MJO convectiveanomaly may be regarded as an MSE envelope, movingeastward.
To examine what causes the eastward movement ofthe column integrated MSE anomaly, one may examinethe horizontal pattern of the MSE tendency at a giventime. The horizontal patterns of the MSE tendency anom-aly (shaded) overlaid by the MSE anomaly (contour) atday 0 are shown in lower panels of Fig. 6. Both the ob-
40E 80E 120E 160E
20
10
−10
0
−20
(b) Good MJO GCMs
40E 80E 120E 160E
20
10
−10
0
−20
(c) Poor MJO GCMs20
10
−10
0
−2040E 80E 120E 160E
(a) OBS
Lagg
ed ti
me
(day
)
40E 80E 120E 160E
(d) OBS20N
10N
0
10S
20S40E 80E 120E 160E
(e) Good MJO GCMs20N
10N
0
10S
20S40E 80E 120E 160E
(f) Poor MJO GCMs20N
10N
0
10S
20S
−9
−3.0 −2.5 −2.0 −1.5 −1.0 −0.5 0.5 1.0 1.5 2.0 2.5 3.0
−7 −5 −3 −1 1 3 5 7 9 Fig. 6. (Upper panels) Longitude–time evolution of rainfall anomalies (shaded, mm day−1) and column-integrated Moist Static Energy (MSE)anomalies (contour, J m−2; contour interval is 1 × 10⁶, with zero line omitted) averaged over 10°S–10°N by lag regression against 20–100-dayband-pass-filtered anomalous rainfall averaged over the equatorial eastern Indian Ocean (5°S–5°N, 75°–85°E). (Lower panels) Regressed day 0column-integrated MSE tendency anomaly (shaded, W m−2) overlaid by MSE anomaly itself (contour, J m−2; contour interval is 2 × 10⁶, withzero line omitted). (a, d) are calculated from GPCP observation and ERA_I reanalysis, (b, e) are the good MJO model composite, and (c, f) arethe poor MJO model composite. The rectangle in (d) marks the projection domain (10°S–10°N, 40°–160°E). From Wang et al. (2017).
FEBRUARY 2020 Li, T., J. Ling, and P.-C. Hsu 27
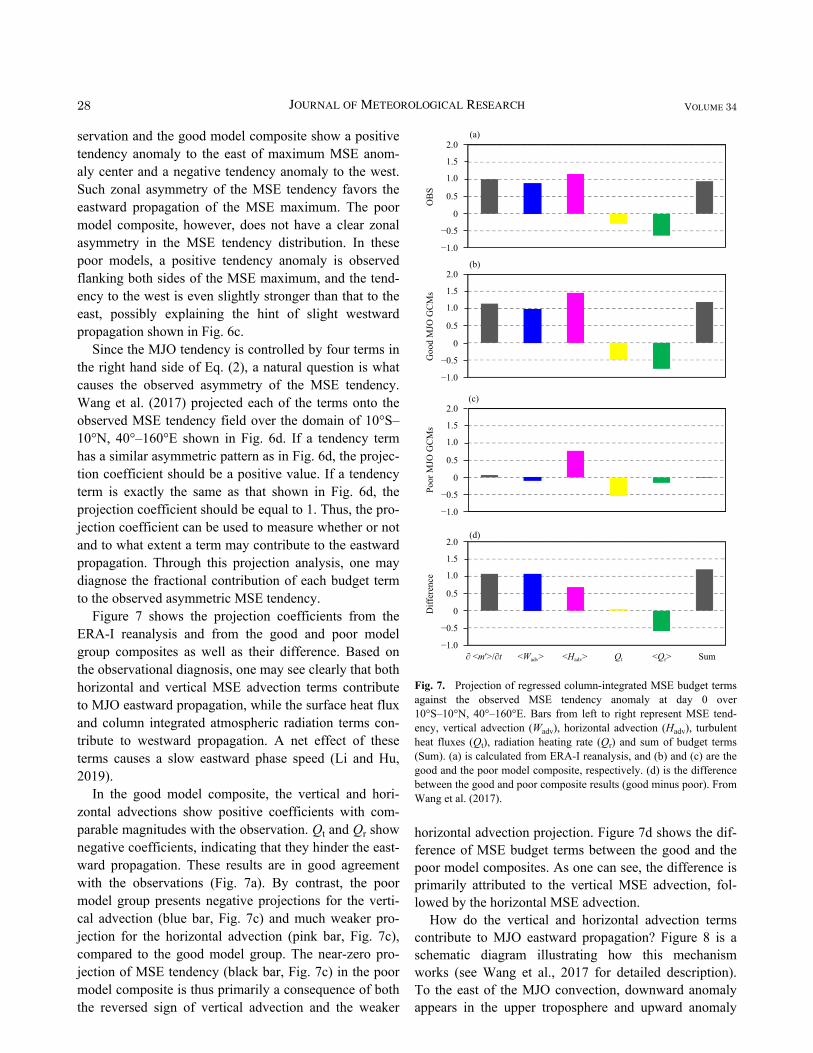
servation and the good model composite show a positivetendency anomaly to the east of maximum MSE anom-aly center and a negative tendency anomaly to the west.Such zonal asymmetry of the MSE tendency favors theeastward propagation of the MSE maximum. The poormodel composite, however, does not have a clear zonalasymmetry in the MSE tendency distribution. In thesepoor models, a positive tendency anomaly is observedflanking both sides of the MSE maximum, and the tend-ency to the west is even slightly stronger than that to theeast, possibly explaining the hint of slight westwardpropagation shown in Fig. 6c.
Since the MJO tendency is controlled by four terms inthe right hand side of Eq. (2), a natural question is whatcauses the observed asymmetry of the MSE tendency.Wang et al. (2017) projected each of the terms onto theobserved MSE tendency field over the domain of 10°S–10°N, 40°–160°E shown in Fig. 6d. If a tendency termhas a similar asymmetric pattern as in Fig. 6d, the projec-tion coefficient should be a positive value. If a tendencyterm is exactly the same as that shown in Fig. 6d, theprojection coefficient should be equal to 1. Thus, the pro-jection coefficient can be used to measure whether or notand to what extent a term may contribute to the eastwardpropagation. Through this projection analysis, one maydiagnose the fractional contribution of each budget termto the observed asymmetric MSE tendency.
Figure 7 shows the projection coefficients from theERA-I reanalysis and from the good and poor modelgroup composites as well as their difference. Based onthe observational diagnosis, one may see clearly that bothhorizontal and vertical MSE advection terms contributeto MJO eastward propagation, while the surface heat fluxand column integrated atmospheric radiation terms con-tribute to westward propagation. A net effect of theseterms causes a slow eastward phase speed (Li and Hu,2019).
In the good model composite, the vertical and hori-zontal advections show positive coefficients with com-parable magnitudes with the observation. Qt and Qr shownegative coefficients, indicating that they hinder the east-ward propagation. These results are in good agreementwith the observations (Fig. 7a). By contrast, the poormodel group presents negative projections for the verti-cal advection (blue bar, Fig. 7c) and much weaker pro-jection for the horizontal advection (pink bar, Fig. 7c),compared to the good model group. The near-zero pro-jection of MSE tendency (black bar, Fig. 7c) in the poormodel composite is thus primarily a consequence of boththe reversed sign of vertical advection and the weaker
horizontal advection projection. Figure 7d shows the dif-ference of MSE budget terms between the good and thepoor model composites. As one can see, the difference isprimarily attributed to the vertical MSE advection, fol-lowed by the horizontal MSE advection.
How do the vertical and horizontal advection termscontribute to MJO eastward propagation? Figure 8 is aschematic diagram illustrating how this mechanismworks (see Wang et al., 2017 for detailed description).To the east of the MJO convection, downward anomalyappears in the upper troposphere and upward anomaly
2.0
1.5
1.0
0.5
0
−0.5
−1.0
2.0
1.5
1.0
0.5
0
−0.5
−1.0
2.0
1.5
1.0
0.5
0
−0.5
−1.0
2.0
1.5
1.0
0.5
0
−0.5
−1.0
OB
SG
ood
MJO
GC
Ms
Poor
MJO
GC
Ms
Diff
eren
ce
∂ <m′>/∂t <Wadv> <Hadv> Qt <Qr> Sum
(a)
(b)
(c)
(d)
Fig. 7. Projection of regressed column-integrated MSE budget termsagainst the observed MSE tendency anomaly at day 0 over10°S–10°N, 40°–160°E. Bars from left to right represent MSE tend-ency, vertical advection (Wadv), horizontal advection (Hadv), turbulentheat fluxes (Qt), radiation heating rate (Qr) and sum of budget terms(Sum). (a) is calculated from ERA-I reanalysis, and (b) and (c) are thegood and the poor model composite, respectively. (d) is the differencebetween the good and poor composite results (good minus poor). FromWang et al. (2017).
28 Journal of Meteorological Research Volume 34
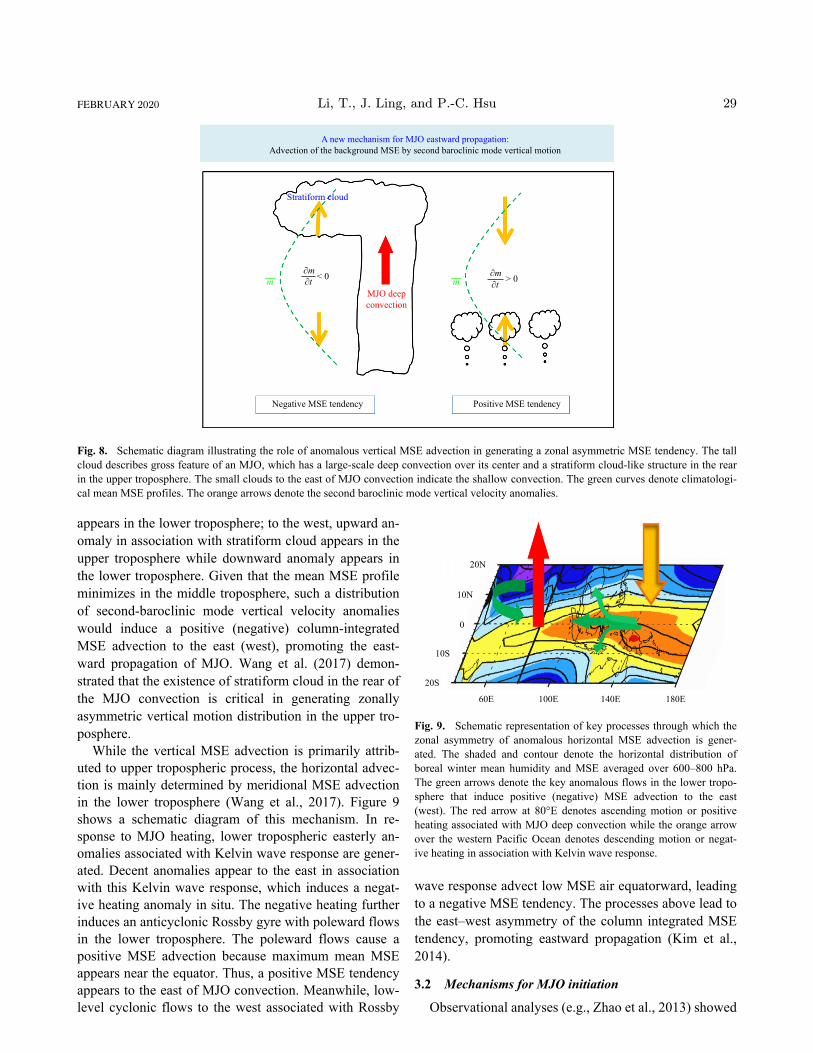
appears in the lower troposphere; to the west, upward an-omaly in association with stratiform cloud appears in theupper troposphere while downward anomaly appears inthe lower troposphere. Given that the mean MSE profileminimizes in the middle troposphere, such a distributionof second-baroclinic mode vertical velocity anomalieswould induce a positive (negative) column-integratedMSE advection to the east (west), promoting the east-ward propagation of MJO. Wang et al. (2017) demon-strated that the existence of stratiform cloud in the rear ofthe MJO convection is critical in generating zonallyasymmetric vertical motion distribution in the upper tro-posphere.
While the vertical MSE advection is primarily attrib-uted to upper tropospheric process, the horizontal advec-tion is mainly determined by meridional MSE advectionin the lower troposphere (Wang et al., 2017). Figure 9shows a schematic diagram of this mechanism. In re-sponse to MJO heating, lower tropospheric easterly an-omalies associated with Kelvin wave response are gener-ated. Decent anomalies appear to the east in associationwith this Kelvin wave response, which induces a negat-ive heating anomaly in situ. The negative heating furtherinduces an anticyclonic Rossby gyre with poleward flowsin the lower troposphere. The poleward flows cause apositive MSE advection because maximum mean MSEappears near the equator. Thus, a positive MSE tendencyappears to the east of MJO convection. Meanwhile, low-level cyclonic flows to the west associated with Rossby
wave response advect low MSE air equatorward, leadingto a negative MSE tendency. The processes above lead tothe east–west asymmetry of the column integrated MSEtendency, promoting eastward propagation (Kim et al.,2014).
3.2 Mechanisms for MJO initiation
Observational analyses (e.g., Zhao et al., 2013) showed
A new mechanism for MJO eastward propagation:Advection of the background MSE by second baroclinic mode vertical motion
Stratiform cloud
Negative MSE tendency Positive MSE tendency
MJO deepconvection
mm ∂m ∂t < 0 ∂m
∂t > 0
Fig. 8. Schematic diagram illustrating the role of anomalous vertical MSE advection in generating a zonal asymmetric MSE tendency. The tallcloud describes gross feature of an MJO, which has a large-scale deep convection over its center and a stratiform cloud-like structure in the rearin the upper troposphere. The small clouds to the east of MJO convection indicate the shallow convection. The green curves denote climatologi-cal mean MSE profiles. The orange arrows denote the second baroclinic mode vertical velocity anomalies.
20N
10N
0
10S
20S
60E 100E 140E 180E Fig. 9. Schematic representation of key processes through which thezonal asymmetry of anomalous horizontal MSE advection is gener-ated. The shaded and contour denote the horizontal distribution ofboreal winter mean humidity and MSE averaged over 600–800 hPa.The green arrows denote the key anomalous flows in the lower tropo-sphere that induce positive (negative) MSE advection to the east(west). The red arrow at 80°E denotes ascending motion or positiveheating associated with MJO deep convection while the orange arrowover the western Pacific Ocean denotes descending motion or negat-ive heating in association with Kelvin wave response.
FEBRUARY 2020 Li, T., J. Ling, and P.-C. Hsu 29
that MJO convection is often initiated over the westernequatorial Indian Ocean (WIO). A long-term hypothesisis that MJO initiation arises from the circumnavigation ofa preceding MJO event that travels around the globaltropics (e.g., Lau and Peng, 1987; Wang and Li, 1994;Matthews, 2000, 2008; Seo and Kim, 2003). The prom-ise behind the circumnavigating hypothesis is that theeastward-propagating upper-tropospheric divergence sig-nal associated with MJO may trigger deep convectionover relatively moist and warm Indian Ocean after itpasses the African continent. As demonstrated by ideal-ized numerical model experiments (Zhao et al., 2013)and observational analyses (Li et al., 2015), this circum-navigating process is not crucial for MJO initiation.
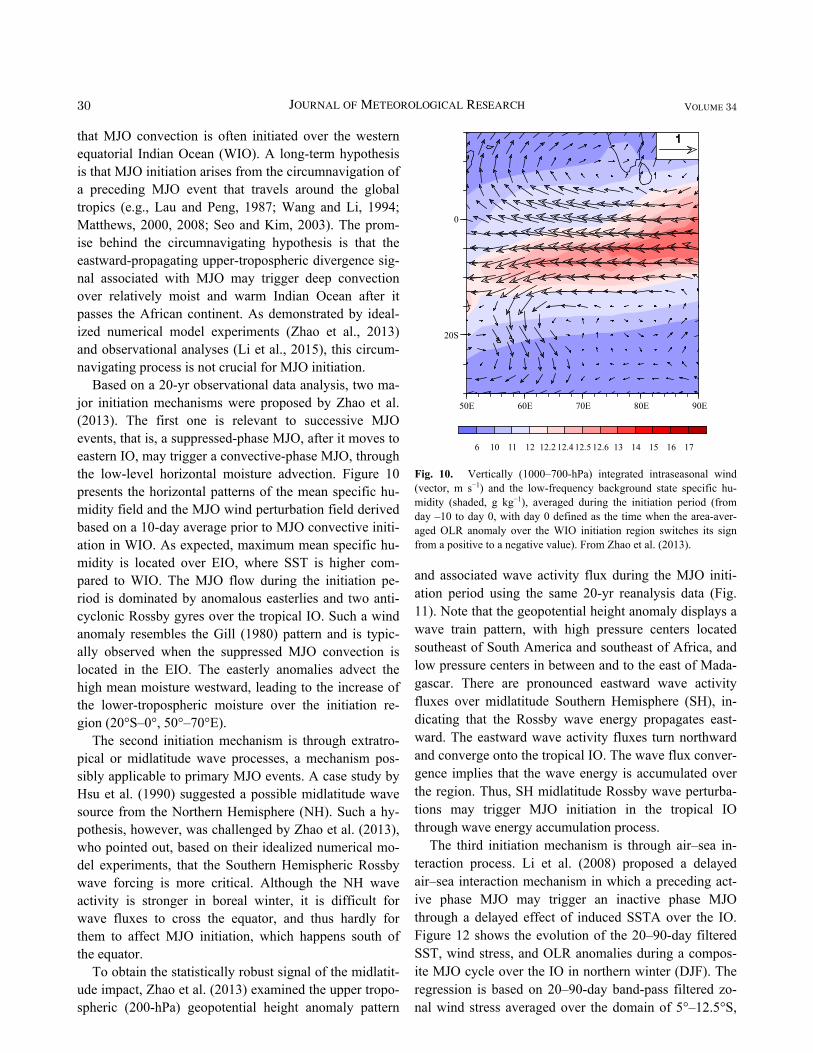
Based on a 20-yr observational data analysis, two ma-jor initiation mechanisms were proposed by Zhao et al.(2013). The first one is relevant to successive MJOevents, that is, a suppressed-phase MJO, after it moves toeastern IO, may trigger a convective-phase MJO, throughthe low-level horizontal moisture advection. Figure 10presents the horizontal patterns of the mean specific hu-midity field and the MJO wind perturbation field derivedbased on a 10-day average prior to MJO convective initi-ation in WIO. As expected, maximum mean specific hu-midity is located over EIO, where SST is higher com-pared to WIO. The MJO flow during the initiation pe-riod is dominated by anomalous easterlies and two anti-cyclonic Rossby gyres over the tropical IO. Such a windanomaly resembles the Gill (1980) pattern and is typic-ally observed when the suppressed MJO convection islocated in the EIO. The easterly anomalies advect thehigh mean moisture westward, leading to the increase ofthe lower-tropospheric moisture over the initiation re-gion (20°S–0°, 50°–70°E).
The second initiation mechanism is through extratro-pical or midlatitude wave processes, a mechanism pos-sibly applicable to primary MJO events. A case study byHsu et al. (1990) suggested a possible midlatitude wavesource from the Northern Hemisphere (NH). Such a hy-pothesis, however, was challenged by Zhao et al. (2013),who pointed out, based on their idealized numerical mo-del experiments, that the Southern Hemispheric Rossbywave forcing is more critical. Although the NH waveactivity is stronger in boreal winter, it is difficult forwave fluxes to cross the equator, and thus hardly forthem to affect MJO initiation, which happens south ofthe equator.
To obtain the statistically robust signal of the midlatit-ude impact, Zhao et al. (2013) examined the upper tropo-spheric (200-hPa) geopotential height anomaly pattern
and associated wave activity flux during the MJO initi-ation period using the same 20-yr reanalysis data (Fig.11). Note that the geopotential height anomaly displays awave train pattern, with high pressure centers locatedsoutheast of South America and southeast of Africa, andlow pressure centers in between and to the east of Mada-gascar. There are pronounced eastward wave activityfluxes over midlatitude Southern Hemisphere (SH), in-dicating that the Rossby wave energy propagates east-ward. The eastward wave activity fluxes turn northwardand converge onto the tropical IO. The wave flux conver-gence implies that the wave energy is accumulated overthe region. Thus, SH midlatitude Rossby wave perturba-tions may trigger MJO initiation in the tropical IOthrough wave energy accumulation process.
The third initiation mechanism is through air–sea in-teraction process. Li et al. (2008) proposed a delayedair–sea interaction mechanism in which a preceding act-ive phase MJO may trigger an inactive phase MJOthrough a delayed effect of induced SSTA over the IO.Figure 12 shows the evolution of the 20–90-day filteredSST, wind stress, and OLR anomalies during a compos-ite MJO cycle over the IO in northern winter (DJF). Theregression is based on 20–90-day band-pass filtered zo-nal wind stress averaged over the domain of 5°–12.5°S,
6 10 11 12 12.2 12.4 12.5 171615141312.6
50E
20S
0
60E 70E 80E 90E
Fig. 10. Vertically (1000–700-hPa) integrated intraseasonal wind(vector, m s−1) and the low-frequency background state specific hu-midity (shaded, g kg−1), averaged during the initiation period (fromday –10 to day 0, with day 0 defined as the time when the area-aver-aged OLR anomaly over the WIO initiation region switches its signfrom a positive to a negative value). From Zhao et al. (2013).
30 Journal of Meteorological Research Volume 34
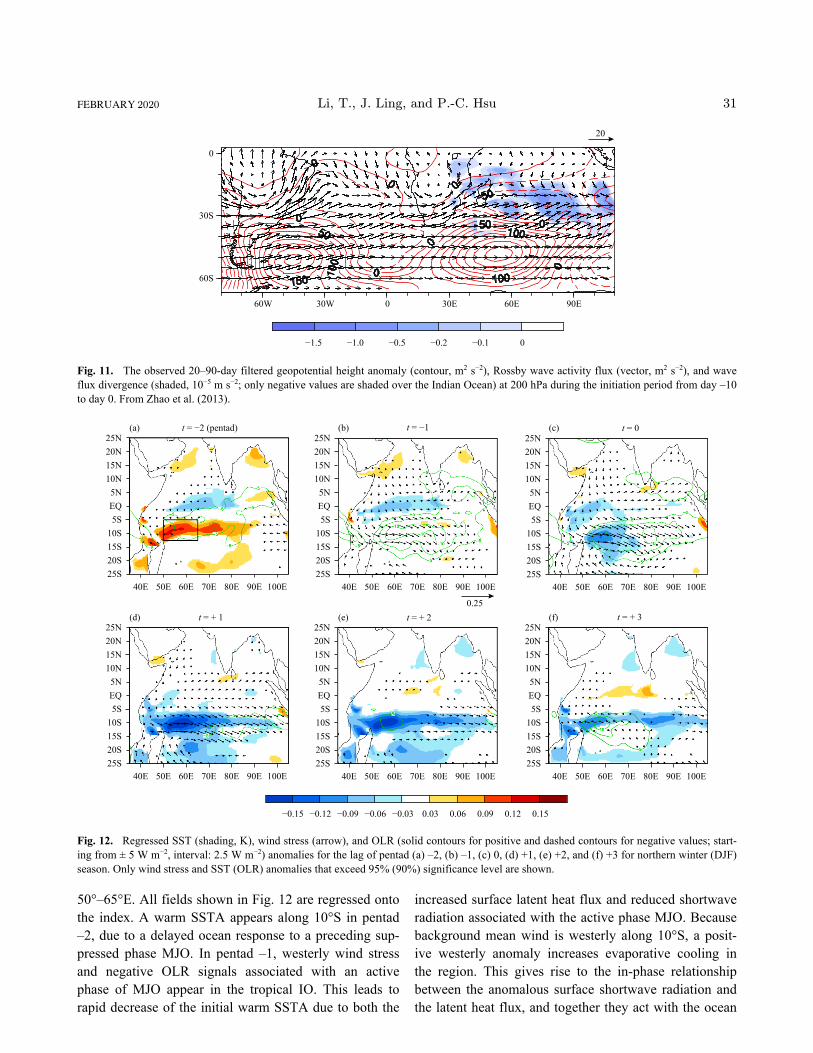
50°–65°E. All fields shown in Fig. 12 are regressed ontothe index. A warm SSTA appears along 10°S in pentad–2, due to a delayed ocean response to a preceding sup-pressed phase MJO. In pentad –1, westerly wind stressand negative OLR signals associated with an activephase of MJO appear in the tropical IO. This leads torapid decrease of the initial warm SSTA due to both the
increased surface latent heat flux and reduced shortwaveradiation associated with the active phase MJO. Becausebackground mean wind is westerly along 10°S, a posit-ive westerly anomaly increases evaporative cooling inthe region. This gives rise to the in-phase relationshipbetween the anomalous surface shortwave radiation andthe latent heat flux, and together they act with the ocean
0
30S
60S
60W 30W 0 30E 60E 90E
−1.5 −1.0 −0.5 −0.2 −0.1 0
20
Fig. 11. The observed 20–90-day filtered geopotential height anomaly (contour, m2 s−2), Rossby wave activity flux (vector, m2 s−2), and waveflux divergence (shaded, 10−5 m s−2; only negative values are shaded over the Indian Ocean) at 200 hPa during the initiation period from day –10to day 0. From Zhao et al. (2013).
t = −2 (pentad)
t = + 1 t = + 2 t = + 3
t = −1 t = 025N20N15N10N5NEQ5S
10S15S20S25S
40E 50E 60E 70E 80E 90E 100E
25N20N15N10N5NEQ5S
10S15S20S25S
40E 50E 60E 70E 80E 90E 100E
25N20N15N10N5NEQ5S
10S15S20S25S
40E 50E 60E 70E 80E 90E 100E
25N20N15N10N5NEQ5S
10S15S20S25S
40E 50E 60E 70E 80E 90E 100E
25N20N15N10N5NEQ5S
10S15S20S25S
40E 50E 60E 70E 80E 90E 100E
25N20N15N10N5NEQ5S
10S15S20S25S
40E 50E 60E 70E 80E 90E 100E
−0.15 −0.12 −0.09 −0.06 −0.03 0.03 0.06 0.09 0.12 0.15
0.25
(a) (b) (c)
(d) (e) (f)
Fig. 12. Regressed SST (shading, K), wind stress (arrow), and OLR (solid contours for positive and dashed contours for negative values; start-ing from ± 5 W m−2, interval: 2.5 W m−2) anomalies for the lag of pentad (a) –2, (b) –1, (c) 0, (d) +1, (e) +2, and (f) +3 for northern winter (DJF)season. Only wind stress and SST (OLR) anomalies that exceed 95% (90%) significance level are shown.
FEBRUARY 2020 Li, T., J. Ling, and P.-C. Hsu 31
entrainment to strongly cool the SST. As a result, a coldSSTA appears along 10°S in pentad 0. In pentad +1, thecold SSTA is enhanced over the western to central IOalong approximately 10°S (see Fig. 12). One pentad later,a positive OLR anomaly appears at about 55°E, colloc-ated with the cold SSTA there. The positive OLR anom-aly subsequently expands eastward and grows. It is note-worthy that suppressed convection tends to develop overthe location where cold SSTA is already present for 5 to10 days, as inferred from the sequence of charts frompentad +1 to +3. This phase relationship between theSST and convection implies a delayed air–sea interac-tion scenario for MJO initiation; that is, on the one hand,an ocean cooling is induced by the wet phase of the MJOthrough combined cloud radiative forcing and surfaceevaporation/ocean vertical mixing, and on the other hand,the so-induced WIO cold SSTA in turn initiates a sub-sequent dry phase of the MJO. Thus, air–sea interactionsplay an important role in the re-initiation of the MJOover the WIO in boreal winter.
This ocean feedback mechanism was recently con-firmed with a long-term integration of a coupled generalcirculation model (Chang et al., 2019). The ocean feed-back process becomes less effective in boreal summerwhen the mean SST is low in western IO and in-traseasonal SST variability in the IO is weaker (Zhang etal., 2019).
4. Impact of MJO on East Asian climate
A great example of MJO impact on East Asian ex-treme weather is the continuous occurrence of four icestorms in South China during a 23-day period (from 10January to 2 February 2008). The storms led to thebroken of electronic cable lines and collapse of highspeed train transportation systems, causing millions ofpeople stranded in train stations. The total economic lossis more than 100 billion Chinese Yuan.
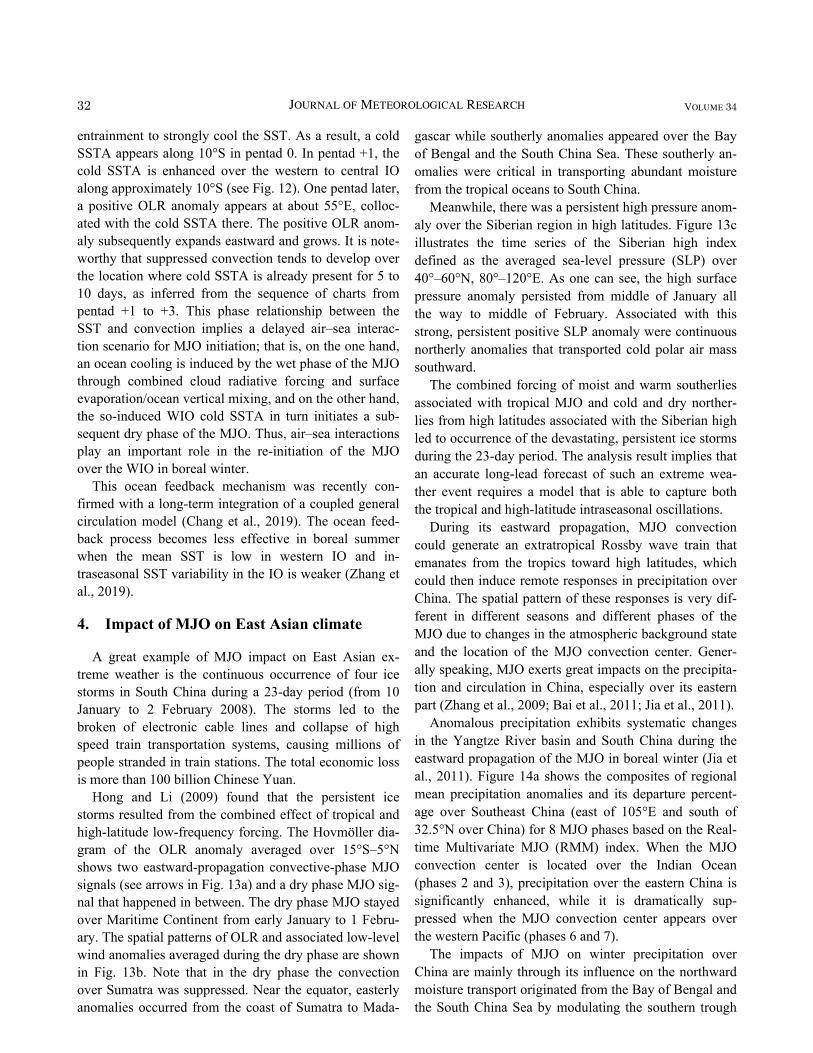
Hong and Li (2009) found that the persistent icestorms resulted from the combined effect of tropical andhigh-latitude low-frequency forcing. The Hovmöller dia-gram of the OLR anomaly averaged over 15°S–5°Nshows two eastward-propagation convective-phase MJOsignals (see arrows in Fig. 13a) and a dry phase MJO sig-nal that happened in between. The dry phase MJO stayedover Maritime Continent from early January to 1 Febru-ary. The spatial patterns of OLR and associated low-levelwind anomalies averaged during the dry phase are shownin Fig. 13b. Note that in the dry phase the convectionover Sumatra was suppressed. Near the equator, easterlyanomalies occurred from the coast of Sumatra to Mada-
gascar while southerly anomalies appeared over the Bayof Bengal and the South China Sea. These southerly an-omalies were critical in transporting abundant moisturefrom the tropical oceans to South China.
Meanwhile, there was a persistent high pressure anom-aly over the Siberian region in high latitudes. Figure 13cillustrates the time series of the Siberian high indexdefined as the averaged sea-level pressure (SLP) over40°–60°N, 80°–120°E. As one can see, the high surfacepressure anomaly persisted from middle of January allthe way to middle of February. Associated with thisstrong, persistent positive SLP anomaly were continuousnortherly anomalies that transported cold polar air masssouthward.
The combined forcing of moist and warm southerliesassociated with tropical MJO and cold and dry norther-lies from high latitudes associated with the Siberian highled to occurrence of the devastating, persistent ice stormsduring the 23-day period. The analysis result implies thatan accurate long-lead forecast of such an extreme wea-ther event requires a model that is able to capture boththe tropical and high-latitude intraseasonal oscillations.
During its eastward propagation, MJO convectioncould generate an extratropical Rossby wave train thatemanates from the tropics toward high latitudes, whichcould then induce remote responses in precipitation overChina. The spatial pattern of these responses is very dif-ferent in different seasons and different phases of theMJO due to changes in the atmospheric background stateand the location of the MJO convection center. Gener-ally speaking, MJO exerts great impacts on the precipita-tion and circulation in China, especially over its easternpart (Zhang et al., 2009; Bai et al., 2011; Jia et al., 2011).
Anomalous precipitation exhibits systematic changesin the Yangtze River basin and South China during theeastward propagation of the MJO in boreal winter (Jia etal., 2011). Figure 14a shows the composites of regionalmean precipitation anomalies and its departure percent-age over Southeast China (east of 105°E and south of32.5°N over China) for 8 MJO phases based on the Real-time Multivariate MJO (RMM) index. When the MJOconvection center is located over the Indian Ocean(phases 2 and 3), precipitation over the eastern China issignificantly enhanced, while it is dramatically sup-pressed when the MJO convection center appears overthe western Pacific (phases 6 and 7).
The impacts of MJO on winter precipitation overChina are mainly through its influence on the northwardmoisture transport originated from the Bay of Bengal andthe South China Sea by modulating the southern trough
32 Journal of Meteorological Research Volume 34
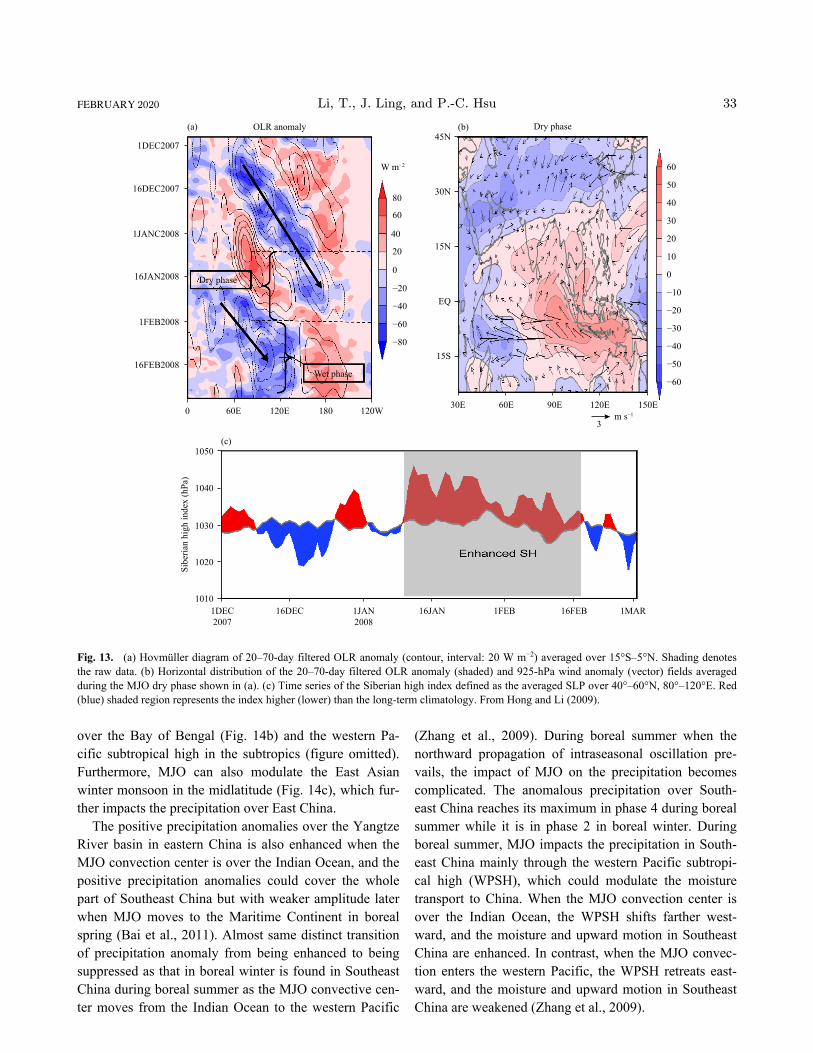
over the Bay of Bengal (Fig. 14b) and the western Pa-cific subtropical high in the subtropics (figure omitted).Furthermore, MJO can also modulate the East Asianwinter monsoon in the midlatitude (Fig. 14c), which fur-ther impacts the precipitation over East China.
The positive precipitation anomalies over the YangtzeRiver basin in eastern China is also enhanced when theMJO convection center is over the Indian Ocean, and thepositive precipitation anomalies could cover the wholepart of Southeast China but with weaker amplitude laterwhen MJO moves to the Maritime Continent in borealspring (Bai et al., 2011). Almost same distinct transitionof precipitation anomaly from being enhanced to beingsuppressed as that in boreal winter is found in SoutheastChina during boreal summer as the MJO convective cen-ter moves from the Indian Ocean to the western Pacific
(Zhang et al., 2009). During boreal summer when thenorthward propagation of intraseasonal oscillation pre-vails, the impact of MJO on the precipitation becomescomplicated. The anomalous precipitation over South-east China reaches its maximum in phase 4 during borealsummer while it is in phase 2 in boreal winter. Duringboreal summer, MJO impacts the precipitation in South-east China mainly through the western Pacific subtropi-cal high (WPSH), which could modulate the moisturetransport to China. When the MJO convection center isover the Indian Ocean, the WPSH shifts farther west-ward, and the moisture and upward motion in SoutheastChina are enhanced. In contrast, when the MJO convec-tion enters the western Pacific, the WPSH retreats east-ward, and the moisture and upward motion in SoutheastChina are weakened (Zhang et al., 2009).
1DEC2007
16DEC2007
1JANC2008
16JAN2008
1FEB2008
16FEB2008
1050
1040
1030
1020
1010
0 60E 120E 180 120W
45N
30N
15N
EQ
15S
30E 60E 90E 120E
3
150E
(b)(a) OLR anomaly Dry phase
1DEC2007
16DEC 1JAN2008
16JAN 1FEB 16FEB 1MAR
60
50
40
30
20
10
0
−10
−20
−30
−40
−50
−60
−80
−60
−40
−20
0
20
40
60
80
W m−2
m s−1
(c)
Sibe
rian
high
inde
x (h
Pa)
Dry phase
Wet phase
Fig. 13. (a) Hovmüller diagram of 20–70-day filtered OLR anomaly (contour, interval: 20 W m−2) averaged over 15°S–5°N. Shading denotesthe raw data. (b) Horizontal distribution of the 20–70-day filtered OLR anomaly (shaded) and 925-hPa wind anomaly (vector) fields averagedduring the MJO dry phase shown in (a). (c) Time series of the Siberian high index defined as the averaged SLP over 40°–60°N, 80°–120°E. Red(blue) shaded region represents the index higher (lower) than the long-term climatology. From Hong and Li (2009).
FEBRUARY 2020 Li, T., J. Ling, and P.-C. Hsu 33
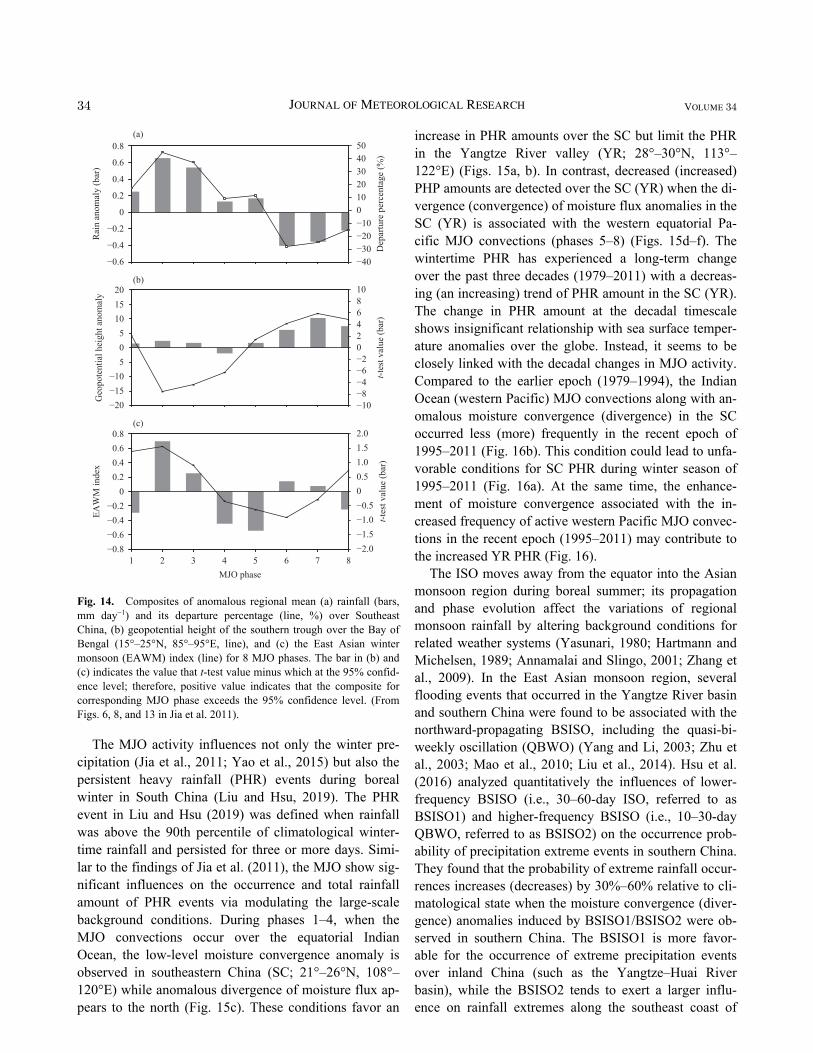
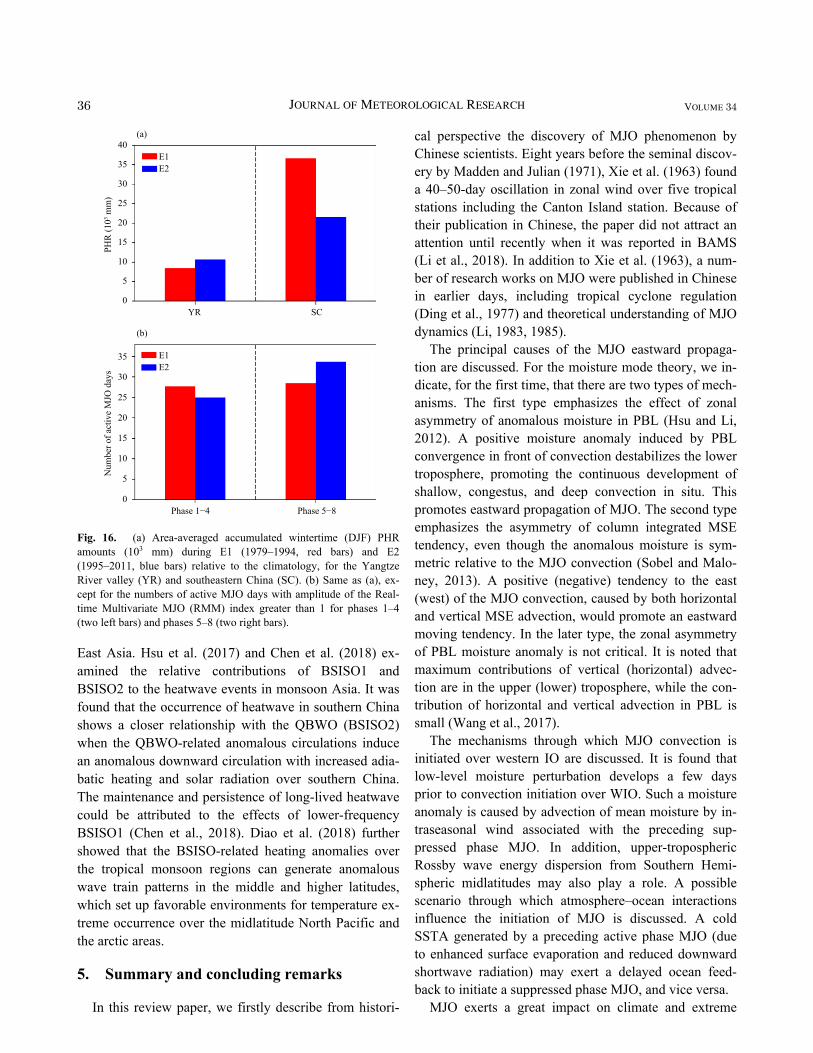
The MJO activity influences not only the winter pre-cipitation (Jia et al., 2011; Yao et al., 2015) but also thepersistent heavy rainfall (PHR) events during borealwinter in South China (Liu and Hsu, 2019). The PHRevent in Liu and Hsu (2019) was defined when rainfallwas above the 90th percentile of climatological winter-time rainfall and persisted for three or more days. Simi-lar to the findings of Jia et al. (2011), the MJO show sig-nificant influences on the occurrence and total rainfallamount of PHR events via modulating the large-scalebackground conditions. During phases 1–4, when theMJO convections occur over the equatorial IndianOcean, the low-level moisture convergence anomaly isobserved in southeastern China (SC; 21°–26°N, 108°–120°E) while anomalous divergence of moisture flux ap-pears to the north (Fig. 15c). These conditions favor an
increase in PHR amounts over the SC but limit the PHRin the Yangtze River valley (YR; 28°–30°N, 113°–122°E) (Figs. 15a, b). In contrast, decreased (increased)PHP amounts are detected over the SC (YR) when the di-vergence (convergence) of moisture flux anomalies in theSC (YR) is associated with the western equatorial Pa-cific MJO convections (phases 5–8) (Figs. 15d–f). Thewintertime PHR has experienced a long-term changeover the past three decades (1979–2011) with a decreas-ing (an increasing) trend of PHR amount in the SC (YR).The change in PHR amount at the decadal timescaleshows insignificant relationship with sea surface temper-ature anomalies over the globe. Instead, it seems to beclosely linked with the decadal changes in MJO activity.Compared to the earlier epoch (1979–1994), the IndianOcean (western Pacific) MJO convections along with an-omalous moisture convergence (divergence) in the SCoccurred less (more) frequently in the recent epoch of1995–2011 (Fig. 16b). This condition could lead to unfa-vorable conditions for SC PHR during winter season of1995–2011 (Fig. 16a). At the same time, the enhance-ment of moisture convergence associated with the in-creased frequency of active western Pacific MJO convec-tions in the recent epoch (1995–2011) may contribute tothe increased YR PHR (Fig. 16).
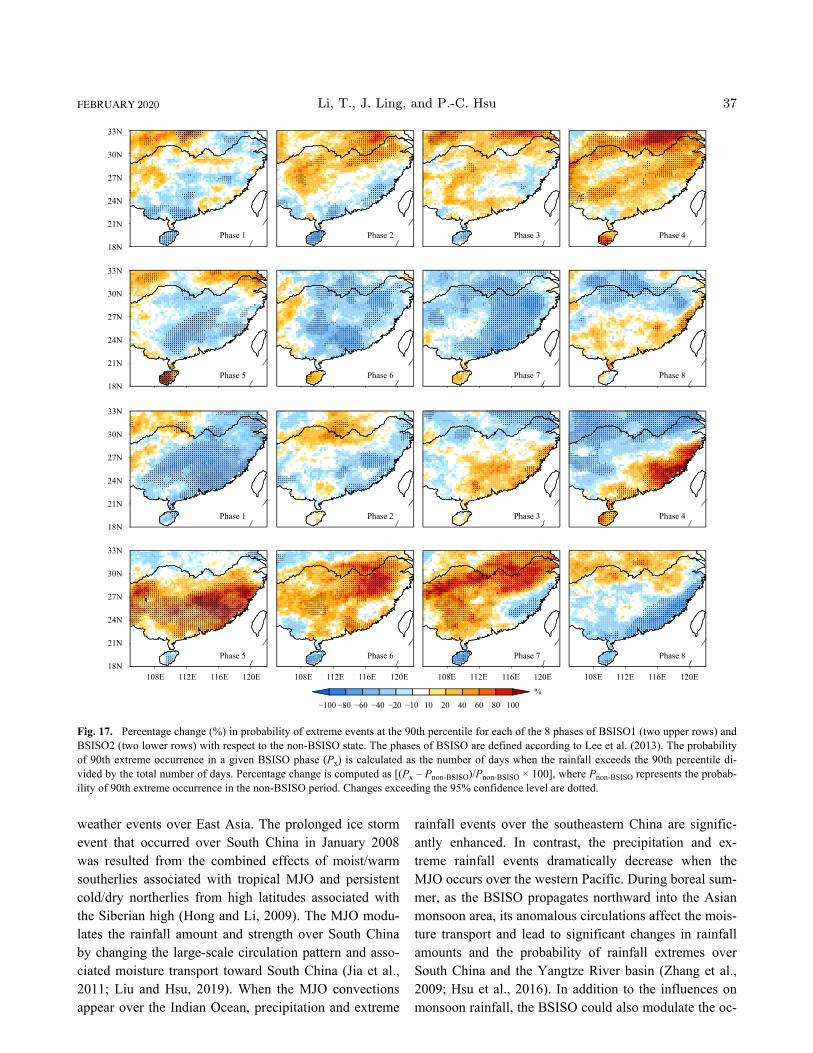
The ISO moves away from the equator into the Asianmonsoon region during boreal summer; its propagationand phase evolution affect the variations of regionalmonsoon rainfall by altering background conditions forrelated weather systems (Yasunari, 1980; Hartmann andMichelsen, 1989; Annamalai and Slingo, 2001; Zhang etal., 2009). In the East Asian monsoon region, severalflooding events that occurred in the Yangtze River basinand southern China were found to be associated with thenorthward-propagating BSISO, including the quasi-bi-weekly oscillation (QBWO) (Yang and Li, 2003; Zhu etal., 2003; Mao et al., 2010; Liu et al., 2014). Hsu et al.(2016) analyzed quantitatively the influences of lower-frequency BSISO (i.e., 30–60-day ISO, referred to asBSISO1) and higher-frequency BSISO (i.e., 10–30-dayQBWO, referred to as BSISO2) on the occurrence prob-ability of precipitation extreme events in southern China.They found that the probability of extreme rainfall occur-rences increases (decreases) by 30%–60% relative to cli-matological state when the moisture convergence (diver-gence) anomalies induced by BSISO1/BSISO2 were ob-served in southern China. The BSISO1 is more favor-able for the occurrence of extreme precipitation eventsover inland China (such as the Yangtze–Huai Riverbasin), while the BSISO2 tends to exert a larger influ-ence on rainfall extremes along the southeast coast of
1 2 3 4 5 6 7 8MJO phase
0.8
0.6
0.4
0.2
0
−0.2
−0.4
−0.6
Rai
n an
omal
y (b
ar)
0.80.60.40.2
0−0.2−0.4−0.6−0.8
EAW
M in
dex
201510505
−10−15−20
Geo
pote
ntia
l hei
ght a
nom
aly
50403020100−10−20−30−40
Dep
artu
re p
erce
ntag
e (%
)
2.01.51.00.50−0.5−1.0−1.5−2.0
1086420−2
−4−6
−8−10
t-tes
t val
ue (b
ar)
t-tes
t val
ue (b
ar)
(a)
(b)
(c)
Fig. 14. Composites of anomalous regional mean (a) rainfall (bars,mm day−1) and its departure percentage (line, %) over SoutheastChina, (b) geopotential height of the southern trough over the Bay ofBengal (15°–25°N, 85°–95°E, line), and (c) the East Asian wintermonsoon (EAWM) index (line) for 8 MJO phases. The bar in (b) and(c) indicates the value that t-test value minus which at the 95% confid-ence level; therefore, positive value indicates that the composite forcorresponding MJO phase exceeds the 95% confidence level. (FromFigs. 6, 8, and 13 in Jia et al. 2011).
34 Journal of Meteorological Research Volume 34
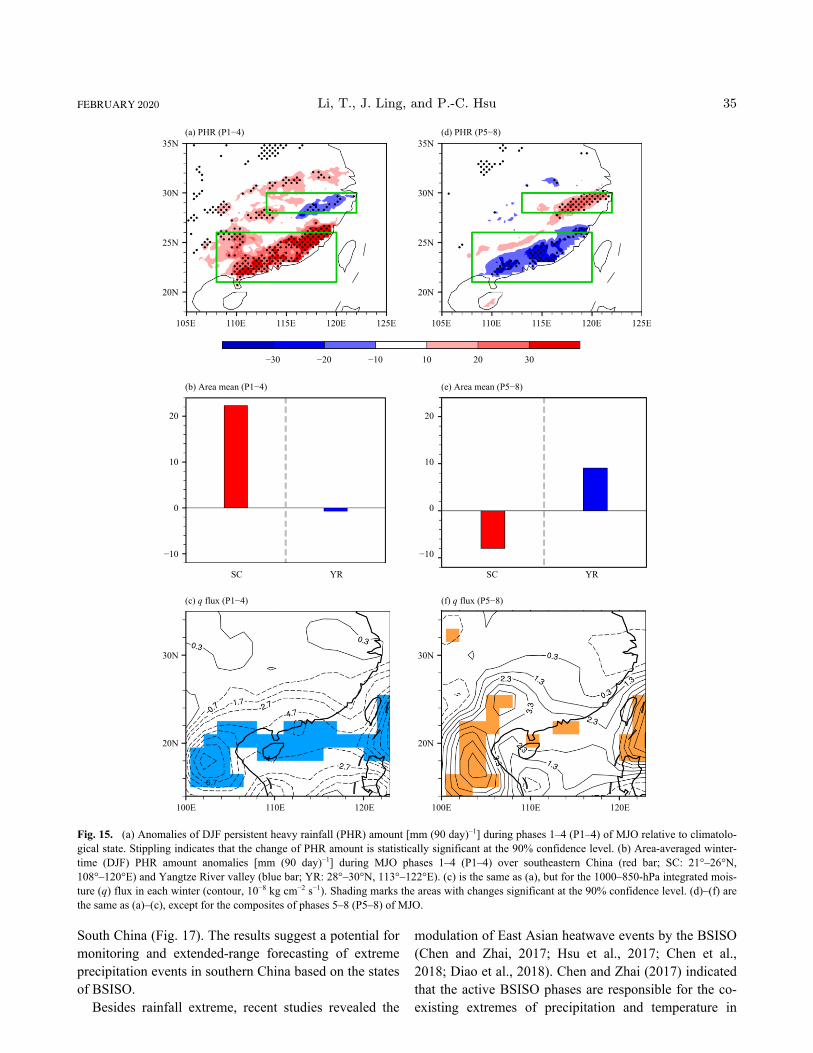
South China (Fig. 17). The results suggest a potential formonitoring and extended-range forecasting of extremeprecipitation events in southern China based on the statesof BSISO.
Besides rainfall extreme, recent studies revealed the
modulation of East Asian heatwave events by the BSISO(Chen and Zhai, 2017; Hsu et al., 2017; Chen et al.,2018; Diao et al., 2018). Chen and Zhai (2017) indicatedthat the active BSISO phases are responsible for the co-existing extremes of precipitation and temperature in
(a) PHR (P1−4)
(b) Area mean (P1−4) (e) Area mean (P5−8)
(c) q flux (P1−4) (f) q flux (P5−8)
(d) PHR (P5−8)35N
30N
25N
20N
105E 110E 115E 120E 125E
20
10
0
−10
SC YR
30N
20N
100E 110E 120E
35N
30N
25N
20N
105E 110E 115E 120E 125E
20
10
0
−10
SC YR
30N
20N
100E 110E 120E
−30 −20 −10 10 20 30
Fig. 15. (a) Anomalies of DJF persistent heavy rainfall (PHR) amount [mm (90 day)−1] during phases 1–4 (P1–4) of MJO relative to climatolo-gical state. Stippling indicates that the change of PHR amount is statistically significant at the 90% confidence level. (b) Area-averaged winter-time (DJF) PHR amount anomalies [mm (90 day)−1] during MJO phases 1–4 (P1–4) over southeastern China (red bar; SC: 21°–26°N,108°–120°E) and Yangtze River valley (blue bar; YR: 28°–30°N, 113°–122°E). (c) is the same as (a), but for the 1000–850-hPa integrated mois-ture (q) flux in each winter (contour, 10−8 kg cm−2 s−1). Shading marks the areas with changes significant at the 90% confidence level. (d)–(f) arethe same as (a)–(c), except for the composites of phases 5–8 (P5–8) of MJO.
FEBRUARY 2020 Li, T., J. Ling, and P.-C. Hsu 35
East Asia. Hsu et al. (2017) and Chen et al. (2018) ex-amined the relative contributions of BSISO1 andBSISO2 to the heatwave events in monsoon Asia. It wasfound that the occurrence of heatwave in southern Chinashows a closer relationship with the QBWO (BSISO2)when the QBWO-related anomalous circulations inducean anomalous downward circulation with increased adia-batic heating and solar radiation over southern China.The maintenance and persistence of long-lived heatwavecould be attributed to the effects of lower-frequencyBSISO1 (Chen et al., 2018). Diao et al. (2018) furthershowed that the BSISO-related heating anomalies overthe tropical monsoon regions can generate anomalouswave train patterns in the middle and higher latitudes,which set up favorable environments for temperature ex-treme occurrence over the midlatitude North Pacific andthe arctic areas.
5. Summary and concluding remarks
In this review paper, we firstly describe from histori-
cal perspective the discovery of MJO phenomenon byChinese scientists. Eight years before the seminal discov-ery by Madden and Julian (1971), Xie et al. (1963) founda 40–50-day oscillation in zonal wind over five tropicalstations including the Canton Island station. Because oftheir publication in Chinese, the paper did not attract anattention until recently when it was reported in BAMS(Li et al., 2018). In addition to Xie et al. (1963), a num-ber of research works on MJO were published in Chinesein earlier days, including tropical cyclone regulation(Ding et al., 1977) and theoretical understanding of MJOdynamics (Li, 1983, 1985).
The principal causes of the MJO eastward propaga-tion are discussed. For the moisture mode theory, we in-dicate, for the first time, that there are two types of mech-anisms. The first type emphasizes the effect of zonalasymmetry of anomalous moisture in PBL (Hsu and Li,2012). A positive moisture anomaly induced by PBLconvergence in front of convection destabilizes the lowertroposphere, promoting the continuous development ofshallow, congestus, and deep convection in situ. Thispromotes eastward propagation of MJO. The second typeemphasizes the asymmetry of column integrated MSEtendency, even though the anomalous moisture is sym-metric relative to the MJO convection (Sobel and Malo-ney, 2013). A positive (negative) tendency to the east(west) of the MJO convection, caused by both horizontaland vertical MSE advection, would promote an eastwardmoving tendency. In the later type, the zonal asymmetryof PBL moisture anomaly is not critical. It is noted thatmaximum contributions of vertical (horizontal) advec-tion are in the upper (lower) troposphere, while the con-tribution of horizontal and vertical advection in PBL issmall (Wang et al., 2017).
The mechanisms through which MJO convection isinitiated over western IO are discussed. It is found thatlow-level moisture perturbation develops a few daysprior to convection initiation over WIO. Such a moistureanomaly is caused by advection of mean moisture by in-traseasonal wind associated with the preceding sup-pressed phase MJO. In addition, upper-troposphericRossby wave energy dispersion from Southern Hemi-spheric midlatitudes may also play a role. A possiblescenario through which atmosphere–ocean interactionsinfluence the initiation of MJO is discussed. A coldSSTA generated by a preceding active phase MJO (dueto enhanced surface evaporation and reduced downwardshortwave radiation) may exert a delayed ocean feed-back to initiate a suppressed phase MJO, and vice versa.
MJO exerts a great impact on climate and extreme
40
35
30
25
20
15
10
0
5
35
30
25
20
15
10
0
5
PHR
(103 m
m)
YR SC
Phase 1−4 Phase 5−8
(b)
(a)
E1E2
E1E2
Num
ber o
f act
ive
MJO
day
s
Fig. 16. (a) Area-averaged accumulated wintertime (DJF) PHRamounts (103 mm) during E1 (1979–1994, red bars) and E2(1995–2011, blue bars) relative to the climatology, for the YangtzeRiver valley (YR) and southeastern China (SC). (b) Same as (a), ex-cept for the numbers of active MJO days with amplitude of the Real-time Multivariate MJO (RMM) index greater than 1 for phases 1–4(two left bars) and phases 5–8 (two right bars).
36 Journal of Meteorological Research Volume 34
weather events over East Asia. The prolonged ice stormevent that occurred over South China in January 2008was resulted from the combined effects of moist/warmsoutherlies associated with tropical MJO and persistentcold/dry northerlies from high latitudes associated withthe Siberian high (Hong and Li, 2009). The MJO modu-lates the rainfall amount and strength over South Chinaby changing the large-scale circulation pattern and asso-ciated moisture transport toward South China (Jia et al.,2011; Liu and Hsu, 2019). When the MJO convectionsappear over the Indian Ocean, precipitation and extreme
rainfall events over the southeastern China are signific-antly enhanced. In contrast, the precipitation and ex-treme rainfall events dramatically decrease when theMJO occurs over the western Pacific. During boreal sum-mer, as the BSISO propagates northward into the Asianmonsoon area, its anomalous circulations affect the mois-ture transport and lead to significant changes in rainfallamounts and the probability of rainfall extremes overSouth China and the Yangtze River basin (Zhang et al.,2009; Hsu et al., 2016). In addition to the influences onmonsoon rainfall, the BSISO could also modulate the oc-
Phase 1 Phase 2 Phase 3 Phase 4
Phase 1 Phase 2 Phase 3 Phase 4
Phase 5 Phase 6 Phase 7 Phase 8
Phase 5 Phase 6 Phase 7 Phase 8
33N
30N
27N
24N
21N
18N
33N
30N
27N
24N
21N
18N
33N
30N
27N
24N
21N
18N
33N
30N
27N
24N
21N
18N108E 112E 116E 120E 108E 112E 116E 120E 108E 112E 116E 120E 108E 112E 116E 120E
−100 −80 −60 −40 −20 −10 10 20 40 60 80 100%
Fig. 17. Percentage change (%) in probability of extreme events at the 90th percentile for each of the 8 phases of BSISO1 (two upper rows) andBSISO2 (two lower rows) with respect to the non-BSISO state. The phases of BSISO are defined according to Lee et al. (2013). The probabilityof 90th extreme occurrence in a given BSISO phase (Px) is calculated as the number of days when the rainfall exceeds the 90th percentile di-vided by the total number of days. Percentage change is computed as [(Px – Pnon-BSISO)/Pnon-BSISO × 100], where Pnon-BSISO represents the probab-ility of 90th extreme occurrence in the non-BSISO period. Changes exceeding the 95% confidence level are dotted.
FEBRUARY 2020 Li, T., J. Ling, and P.-C. Hsu 37
currences of heatwave over the Asian monsoon region(Chen and Zhai, 2017; Hsu et al., 2017; Chen et al.,2018) and higher latitudes (e.g., Diao et al., 2018).
Due to limited page number, this review paper is notable to include all MJO related studies. For example, thescale interactions of MJO with high-frequency tropicalconvectively coupled waves (CCWs) and other climatemodes (such as ENSO) have received considerable atten-tion in recent decades. The earlier work of Nakazawa(1988) found that the tropical convections were organ-ized on various spatiotemporal scales, ranging from theshort-lived convective cells of a few kilometers to thelow-frequency planetary-scale convections, like MJO.Subsequent diagnostic and modeling studies showed thatthe smaller-scale CCWs (including mixed Rossby–grav-ity and inertia–gravity waves) within the large-scale MJOenvelope and the multi-cloud convective systems (con-gestus, stratiform, and cumulus clouds) associated withMJO play vital roles in the eastward propagation andmaintenance of MJO convection (e.g., Majda and Stech-mann, 2009; Khouider et al., 2013; Yang and Ingersoll,2013, 2014; Zhu et al., 2019). The ENSO–MJO interac-tion is another important topic. The changes in environ-mental dynamic and thermodynamic conditions associ-ated with ENSO may exert significant influences onMJO initiation (Hsu and Xiao, 2017), intensity (Dengand Li, 2016; Deng et al., 2016; Wang et al., 2018),propagation (Chen et al., 2016), and periodicity (Liu etal., 2016). The higher-frequency wind associated withMJO, on the other hand, may affect ENSO evolution(e.g., Chen et al., 2017). The multi-scale interaction ofMJO is an important topic that is worthy of a more com-prehensive review in the future.
Given the importance of MJO activity on globalweather and climate systems and its close relevance toextended-range weather prediction, we hope that this pa-per can serve as a starting point for graduate students andyoung researchers to know some basics about MJO andto motivate them to read a wider range of literature.Some of the theoretical and modeling results discussed inthis paper are not settled yet, and further in-depth studiesare needed to challenge the current views so that sciencecan move forward.
REFERENCES
Adames, Á. F., and D. Kim, 2016: The MJO as a dispersive, con-vectively coupled moisture wave: Theory and observations. J.Atmos. Sci., 73, 913–941, doi: 10.1175/JAS-D-15-0170.1.
Annamalai, H., and J. M. Slingo, 2001: Active/break cycles: Dia-gnosis of the intraseasonal variability of the Asian summermonsoon. Climate Dyn., 18, 85–102, doi: 10.1007/s00382
0100161.
Araligidad, N. M., and E. D. Maloney, 2008: Wind-driven latentheat flux and the intraseasonal oscillation. Geophys. Res.Lett., 35, L04815, doi: 10.1029/2007GL032746.
Bai, X. X., C. Y. Li, Y. K. Tan, et al., 2011: Analysis of the Mad-den–Julian Oscillation impacts on the spring rainfall in EastChina. J. Trop. Meteor., 27, 814–822, doi: 10.3969/j.issn.1004-4965.2011.06.004. (in Chinese)
Batstone, C. P., A. J. Matthews, and D. P. Stevens, 2005: Coupledocean–atmosphere interactions between the Madden–Julianoscillation and synoptic-scale variability over the warm pool.J. Climate, 18, 2004–2020, doi: 10.1175/JCLI3398.1.
Cao, X., T. Li, M. Peng, et al., 2014: Effects of monsoon troughinterannual variation on tropical cyclogenesis over the west-ern North Pacific. Geophys. Res. Lett., 41, 4332–4339, doi:10.1002/2014GL060307.
Chang, C. P., and H. Lim, 1988: Kelvin wave-CISK: A possiblemechanism for the 30–50 day oscillations. J. Atmos. Sci., 45,1709–1720, doi: 10.1175/1520-0469(1988)045<1709:KW-CAPM>2.0.CO;2.
Chang, M.-Y., T. Li, P.-L. Lin, et al., 2019: Forecasts of MJOevents during DYNAMO with a coupled atmosphere–oceanmodel: Sensitivity to cumulus parameterization scheme. J. Me-teor. Res., 33, 1016–1030, doi: 10.1007/s13351-019-9062-5.
Chen, L., T. Li, B. Wang, et al., 2017: Formation mechanism for2015/16 super El Niño. Sci. Rep., 7, 2975, doi: 10.1038/s41598-017-02926-3.
Chen, R. D., Z. P. Wen, and R. Y. Lu, 2018: Large-scale circula-tion anomalies and intraseasonal oscillations associated withlong-lived extreme heat events in South China. J. Climate, 31,213–232, doi: 10.1175/JCLI-D-17-0232.1.
Chen, T. C., and M. Murakami, 1988: The 30–50 day variation ofconvective activity over the western Pacific Ocean with em-phasis on the northwestern region. Mon. Wea. Rev., 116,892–906, doi: 10.1175/1520-0493(1988)116<0892:TDVOCA>2.0.CO;2.
Chen, X., J. Ling, and C. Y. Li, 2016: Evolution of the Madden–Julian oscillation in two types of El Niño. J. Climate, 29,1919–1934, doi: 10.1175/JCLI-D-15-0486.1.
Chen, Y., and P. M. Zhai, 2017: Simultaneous modulations of pre-cipitation and temperature extremes in southern parts ofChina by the boreal summer intraseasonal oscillation. Cli-mate Dyn., 49, 3363–3381, doi: 10.1007/s00382-016-3518-4.
Deng, L., and T. Li, 2016: Relative roles of background moistureand vertical shear in regulating interannual variability ofboreal summer intraseasonal oscillations. J. Climate, 29,7009–7025, doi: 10.1175/JCLI-D-15-0498.1.
Deng, L., T. Li, J. Liu, et al., 2016: Factors controlling the interan-nual variations of MJO intensity. J. Meteor. Res., 30,328–340, doi: 10.1007/s13351-016-5113-3.
Diao, Y. F., T. Li, and P.-C. Hsu, 2018: Influence of the borealsummer intraseasonal oscillation on extreme temperatureevents in the Northern Hemisphere. J. Meteor. Res., 32,534–547, doi: 10.1007/s13351-018-8031-8.
Ding, Y. H., H. J. Feng, Q. F. Xue, et al., 1977: A preliminarystudy on the simultaneous developments of the multipletyphoons in the intertropical convergence zone. Chinese J. At-mos. Sci., 1, 89–98, doi: 10.3878/j.issn.1006-9895.1977.02.02. (in Chinese)
38 Journal of Meteorological Research Volume 34
Emanuel, K. A., 1987: An air–sea interaction model of intraseaso-nal oscillations in the tropics. J. Atmos. Sci., 44, 2324–2340,doi: 10.1175/1520-0469(1987)044<2324:AASIMO>2.0.CO;2.
Gill, A. E., 1980: Some simple solutions for heat-induced tropicalcirculation. Quart. J. Roy. Meteor. Soc., 106, 447–462, doi:10.1002/qj.49710644905.
Hartmann, D. L., and M. L. Michelsen, 1989: Intraseasonal period-icities in Indian rainfall. J. Atmos. Sci., 46, 2838–2862, doi:10.1175/1520-0469(1989)046<2838:IPIIR>2.0.CO;2.
Hartmann, D. L., and E. D. Maloney, 2001: The Madden–Julianoscillation, barotropic dynamics, and North Pacific tropicalcyclone formation. Part II: Stochastic barotropic modeling. J.Atmos. Sci., 58, 2559–2570, doi: 10.1175/1520-0469(2001)058<2559:TMJOBD>2.0.CO;2.
Hendon, H. H., and B. Liebmann, 1994: Organization of convec-tion within the Madden–Julian oscillation. J. Geophys. Res.Atmos., 99, 8073–8083, doi: 10.1029/94JD00045.
Hendon, H. H., and M. L. Salby, 1994: The life cycle of the Mad-den–Julian Oscillation. J. Atmos. Sci., 51, 2225–2237, doi:10.1175/1520-0469(1994)051<2225:TLCOTM>2.0.CO;2.
Hong, C. C., and T. Li, 2009: The extreme cold anomaly oversoutheast Asia in February 2008: Roles of ISO and ENSO. J.Climate, 22, 3786–3801, doi: 10.1175/2009JCLI2864.1.
Hsu, H. H., and C. H. Weng, 2001: Northwestward propagation ofthe intraseasonal oscillation in the western North Pacific dur-ing the boreal summer: Structure and mechanism. J. Climate,14, 3834–3850, doi: 10.1175/1520-0442(2001)014<3834:NPOTIO>2.0.CO;2.
Hsu, H. H., B. J. Hoskins, and F. F. Jin, 1990: The 1985/86 in-traseasonal oscillation and the role of the extratropics. J. At-mos. Sci., 47, 823–839, doi: 10.1175/1520-0469(1990)047<0823:TIOATR>2.0.CO;2.
Hsu, P. C., and T. Li, 2011: Interactions between boreal summerintraseasonal oscillations and synoptic-scale disturbancesover the western North Pacific. Part II: Apparent heat andmoisture sources and eddy momentum transport. J. Climate,24, 942–961, doi: 10.1175/2010JCLI3834.1.
Hsu, P. C., and T. Li, 2012: Role of the boundary layer moistureasymmetry in causing the eastward propagation of the Mad-den–Julian Oscillation. J. Climate, 25, 4914–4931, doi:10.1175/JCLI-D-11-00310.1.
Hsu, P. C., and Y. Yang, 2016: Contribution of atmospheric in-ternal processes to the interannual variability of the SouthAsian summer monsoon. Int. J. Climatol., 36, 2917–2930,doi: 10.1002/joc.4528.
Hsu, P. C., and T. Xiao, 2017: Differences in the initiation and de-velopment of the Madden–Julian Oscillation over the IndianOcean associated with two types of El Niño. J. Climate, 30,1397–1415, doi: 10.1175/JCLI-D-16-0336.1.
Hsu, P. C., T. Li, and C. H. Tsou, 2011: Interactions betweenboreal summer intraseasonal oscillations and synoptic-scaledisturbances over the western North Pacific. Part I: Energet-ics diagnosis. J. Climate, 24, 927–941, doi: 10.1175/2010JCLI3833.1.
Hsu, P. C., T. Li, and H. Murakami, 2014: Moisture asymmetryand MJO eastward propagation in an aquaplanet general cir-culation model. J. Climate, 27, 8747–8760, doi: 10.1175/JCLI-D-14-00148.1.
Hsu, P. C., J.-Y. Lee, and K.-J. Ha, 2016: Influence of boreal sum-
mer intraseasonal oscillation on rainfall extremes in southernChina. Int. J. Climatol., 36, 1403–1412, doi: 10.1002/joc.4433.
Hsu, P. C., J.-Y. Lee, K.-J. Ha, et al., 2017: Influences of borealsummer intraseasonal oscillation on heat waves in monsoonAsia. J. Climate, 30, 7191–7211, doi: 10.1175/JCLI-D-16-0505.1.
Jia, X., L. J. Chen, F. M. Ren, et al., 2011: Impacts of the MJO onwinter rainfall and circulation in China. Adv. Atmos. Sci., 28,521–533, doi: 10.1007/s00376-010-9118-z.
Jiang, X. A., and T. Li, 2005: Reinitiation of the boreal summer in-traseasonal oscillation in the tropical Indian Ocean. J. Cli-mate, 18, 3777–3795, doi: 10.1175/JCLI3516.1.
Jiang, X. A., D. E. Waliser, P. K. Xavier, et al., 2015: Verticalstructure and physical processes of the Madden–Julian oscil-lation: Exploring key model physics in climate simulations. J.Geophys. Res. Atmos., 120, 4718–4748, doi: 10.1002/2014JD022375.
Jiang, X. A., T. Li, and B. Wang, 2004: Structures and mechan-isms of the northward propagating boreal summer in-traseasonal oscillation. J. Climate, 17, 1022–1039, doi:10.1175/1520-0442(2004)017<1022:SAMOTN>2.0.CO;2.
Jones, C., and B. C. Weare, 1996: The role of low-level moistureconvergence and ocean latent heat fluxes in the Madden andJulian Oscillation: An observational analysis using ISCCPdata and ECMWF analyses. J. Climate, 9, 3086–3104, doi:10.1175/1520-0442(1996)009<3086:TROLLM>2.0.CO;2.
Jones, C., L. M. V. Carvalho, R. Wayne Higgins, et al., 2004: Cli-matology of tropical intraseasonal convective anomalies:1979–2002. J. Climate, 17, 523–539, doi: 10.1175/1520-0442(2004)017<0523:COTICA>2.0.CO;2.
Khouider, B., A. J. Majda, and S. N. Stechmann, 2013: Climatescience in the tropics: Waves, vortices and PDEs. Nonlinear-ity, 26, R1, doi: 10.1088/0951-7715/26/1/R1.
Kikuchi, K., B. Wang, and Y. Kajikawa, 2012: Bimodal represent-ation of the tropical intraseasonal oscillation. Climate Dyn.,38, 1989–2000, doi: 10.1007/s00382-011-1159-1.
Kiladis, G. N., K. H. Straub, and P. T. Haertel, 2005: Zonal andvertical structure of the Madden–Julian Oscillation. J. Atmos.Sci., 62, 2790–2809, doi: 10.1175/JAS3520.1.
Kim, D., J. S. Kug, and A. H. Sobel, 2014: Propagating versusnonpropagating Madden–Julian Oscillation events. J. Cli-mate, 27, 111–125, doi: 10.1175/JCLI-D-13-00084.1.
Knutson, T. R., and K. M. Weickmann, 1987: 30–60 day atmo-spheric oscillations: Composite life cycles of convection andcirculation anomalies. Mon. Wea. Rev., 115, 1407–1436, doi:10.1175/1520-0493(1987)115<1407:DAOCLC>2.0.CO;2.
Krishnamurti, T. N., and D. Subrahmanyam, 1982: The 30–50 daymode at 850 mb during MONEX. J. Atmos. Sci., 39,2088–2095, doi: 10.1175/1520-0469(1982)039<2088:TDMAMD>2.0.CO;2.
Lau, K., and P. H. Chan, 1986: Aspects of the 40–50 day oscilla-tion during the northern summer as inferred from outgoinglongwave radiation. Mon. Wea. Rev., 114, 1354–1367, doi:10.1175/1520-0493(1986)114<1354:AOTDOD>2.0.CO;2.
Lau, K. H., and N. C. Lau, 1990: Observed structure and propaga-tion characteristics of tropical summertime synoptic scale dis-turbances. Mon. Wea. Rev., 118, 1888–1913, doi: 10.1175/1520-0493(1990)118<1888:OSAPCO>2.0.CO;2.
FEBRUARY 2020 Li, T., J. Ling, and P.-C. Hsu 39
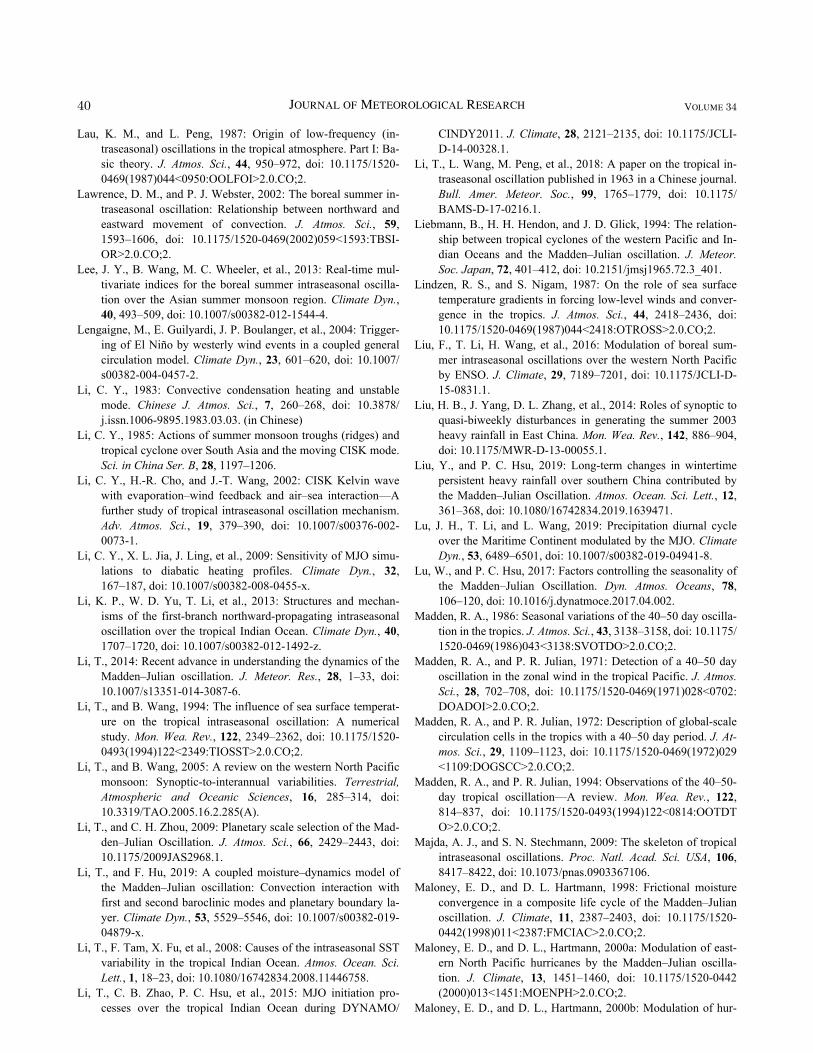
Lau, K. M., and L. Peng, 1987: Origin of low-frequency (in-traseasonal) oscillations in the tropical atmosphere. Part I: Ba-sic theory. J. Atmos. Sci., 44, 950–972, doi: 10.1175/1520-0469(1987)044<0950:OOLFOI>2.0.CO;2.
Lawrence, D. M., and P. J. Webster, 2002: The boreal summer in-traseasonal oscillation: Relationship between northward andeastward movement of convection. J. Atmos. Sci., 59,1593–1606, doi: 10.1175/1520-0469(2002)059<1593:TBSI-OR>2.0.CO;2.
Lee, J. Y., B. Wang, M. C. Wheeler, et al., 2013: Real-time mul-tivariate indices for the boreal summer intraseasonal oscilla-tion over the Asian summer monsoon region. Climate Dyn.,40, 493–509, doi: 10.1007/s00382-012-1544-4.
Lengaigne, M., E. Guilyardi, J. P. Boulanger, et al., 2004: Trigger-ing of El Niño by westerly wind events in a coupled generalcirculation model. Climate Dyn., 23, 601–620, doi: 10.1007/s00382-004-0457-2.
Li, C. Y., 1983: Convective condensation heating and unstablemode. Chinese J. Atmos. Sci., 7, 260–268, doi: 10.3878/j.issn.1006-9895.1983.03.03. (in Chinese)
Li, C. Y., 1985: Actions of summer monsoon troughs (ridges) andtropical cyclone over South Asia and the moving CISK mode.Sci. in China Ser. B, 28, 1197–1206.
Li, C. Y., H.-R. Cho, and J.-T. Wang, 2002: CISK Kelvin wavewith evaporation–wind feedback and air–sea interaction—Afurther study of tropical intraseasonal oscillation mechanism.Adv. Atmos. Sci., 19, 379–390, doi: 10.1007/s00376-002-0073-1.
Li, C. Y., X. L. Jia, J. Ling, et al., 2009: Sensitivity of MJO simu-lations to diabatic heating profiles. Climate Dyn., 32,167–187, doi: 10.1007/s00382-008-0455-x.
Li, K. P., W. D. Yu, T. Li, et al., 2013: Structures and mechan-isms of the first-branch northward-propagating intraseasonaloscillation over the tropical Indian Ocean. Climate Dyn., 40,1707–1720, doi: 10.1007/s00382-012-1492-z.
Li, T., 2014: Recent advance in understanding the dynamics of theMadden–Julian oscillation. J. Meteor. Res., 28, 1–33, doi:10.1007/s13351-014-3087-6.
Li, T., and B. Wang, 1994: The influence of sea surface temperat-ure on the tropical intraseasonal oscillation: A numericalstudy. Mon. Wea. Rev., 122, 2349–2362, doi: 10.1175/1520-0493(1994)122<2349:TIOSST>2.0.CO;2.
Li, T., and B. Wang, 2005: A review on the western North Pacificmonsoon: Synoptic-to-interannual variabilities. Terrestrial,Atmospheric and Oceanic Sciences, 16, 285–314, doi:10.3319/TAO.2005.16.2.285(A).
Li, T., and C. H. Zhou, 2009: Planetary scale selection of the Mad-den–Julian Oscillation. J. Atmos. Sci., 66, 2429–2443, doi:10.1175/2009JAS2968.1.
Li, T., and F. Hu, 2019: A coupled moisture–dynamics model ofthe Madden–Julian oscillation: Convection interaction withfirst and second baroclinic modes and planetary boundary la-yer. Climate Dyn., 53, 5529–5546, doi: 10.1007/s00382-019-04879-x.
Li, T., F. Tam, X. Fu, et al., 2008: Causes of the intraseasonal SSTvariability in the tropical Indian Ocean. Atmos. Ocean. Sci.Lett., 1, 18–23, doi: 10.1080/16742834.2008.11446758.
Li, T., C. B. Zhao, P. C. Hsu, et al., 2015: MJO initiation pro-cesses over the tropical Indian Ocean during DYNAMO/
CINDY2011. J. Climate, 28, 2121–2135, doi: 10.1175/JCLI-D-14-00328.1.
Li, T., L. Wang, M. Peng, et al., 2018: A paper on the tropical in-traseasonal oscillation published in 1963 in a Chinese journal.Bull. Amer. Meteor. Soc., 99, 1765–1779, doi: 10.1175/BAMS-D-17-0216.1.
Liebmann, B., H. H. Hendon, and J. D. Glick, 1994: The relation-ship between tropical cyclones of the western Pacific and In-dian Oceans and the Madden–Julian oscillation. J. Meteor.Soc. Japan, 72, 401–412, doi: 10.2151/jmsj1965.72.3_401.
Lindzen, R. S., and S. Nigam, 1987: On the role of sea surfacetemperature gradients in forcing low-level winds and conver-gence in the tropics. J. Atmos. Sci., 44, 2418–2436, doi:10.1175/1520-0469(1987)044<2418:OTROSS>2.0.CO;2.
Liu, F., T. Li, H. Wang, et al., 2016: Modulation of boreal sum-mer intraseasonal oscillations over the western North Pacificby ENSO. J. Climate, 29, 7189–7201, doi: 10.1175/JCLI-D-15-0831.1.
Liu, H. B., J. Yang, D. L. Zhang, et al., 2014: Roles of synoptic toquasi-biweekly disturbances in generating the summer 2003heavy rainfall in East China. Mon. Wea. Rev., 142, 886–904,doi: 10.1175/MWR-D-13-00055.1.
Liu, Y., and P. C. Hsu, 2019: Long-term changes in wintertimepersistent heavy rainfall over southern China contributed bythe Madden–Julian Oscillation. Atmos. Ocean. Sci. Lett., 12,361–368, doi: 10.1080/16742834.2019.1639471.
Lu, J. H., T. Li, and L. Wang, 2019: Precipitation diurnal cycleover the Maritime Continent modulated by the MJO. ClimateDyn., 53, 6489–6501, doi: 10.1007/s00382-019-04941-8.
Lu, W., and P. C. Hsu, 2017: Factors controlling the seasonality ofthe Madden–Julian Oscillation. Dyn. Atmos. Oceans, 78,106–120, doi: 10.1016/j.dynatmoce.2017.04.002.
Madden, R. A., 1986: Seasonal variations of the 40–50 day oscilla-tion in the tropics. J. Atmos. Sci., 43, 3138–3158, doi: 10.1175/1520-0469(1986)043<3138:SVOTDO>2.0.CO;2.
Madden, R. A., and P. R. Julian, 1971: Detection of a 40–50 dayoscillation in the zonal wind in the tropical Pacific. J. Atmos.Sci., 28, 702–708, doi: 10.1175/1520-0469(1971)028<0702:DOADOI>2.0.CO;2.
Madden, R. A., and P. R. Julian, 1972: Description of global-scalecirculation cells in the tropics with a 40–50 day period. J. At-mos. Sci., 29, 1109–1123, doi: 10.1175/1520-0469(1972)029<1109:DOGSCC>2.0.CO;2.
Madden, R. A., and P. R. Julian, 1994: Observations of the 40–50-day tropical oscillation—A review. Mon. Wea. Rev., 122,814–837, doi: 10.1175/1520-0493(1994)122<0814:OOTDTO>2.0.CO;2.
Majda, A. J., and S. N. Stechmann, 2009: The skeleton of tropicalintraseasonal oscillations. Proc. Natl. Acad. Sci. USA, 106,8417–8422, doi: 10.1073/pnas.0903367106.
Maloney, E. D., and D. L. Hartmann, 1998: Frictional moistureconvergence in a composite life cycle of the Madden–Julianoscillation. J. Climate, 11, 2387–2403, doi: 10.1175/1520-0442(1998)011<2387:FMCIAC>2.0.CO;2.
Maloney, E. D., and D. L., Hartmann, 2000a: Modulation of east-ern North Pacific hurricanes by the Madden–Julian oscilla-tion. J. Climate, 13, 1451–1460, doi: 10.1175/1520-0442(2000)013<1451:MOENPH>2.0.CO;2.
Maloney, E. D., and D. L., Hartmann, 2000b: Modulation of hur-
40 Journal of Meteorological Research Volume 34
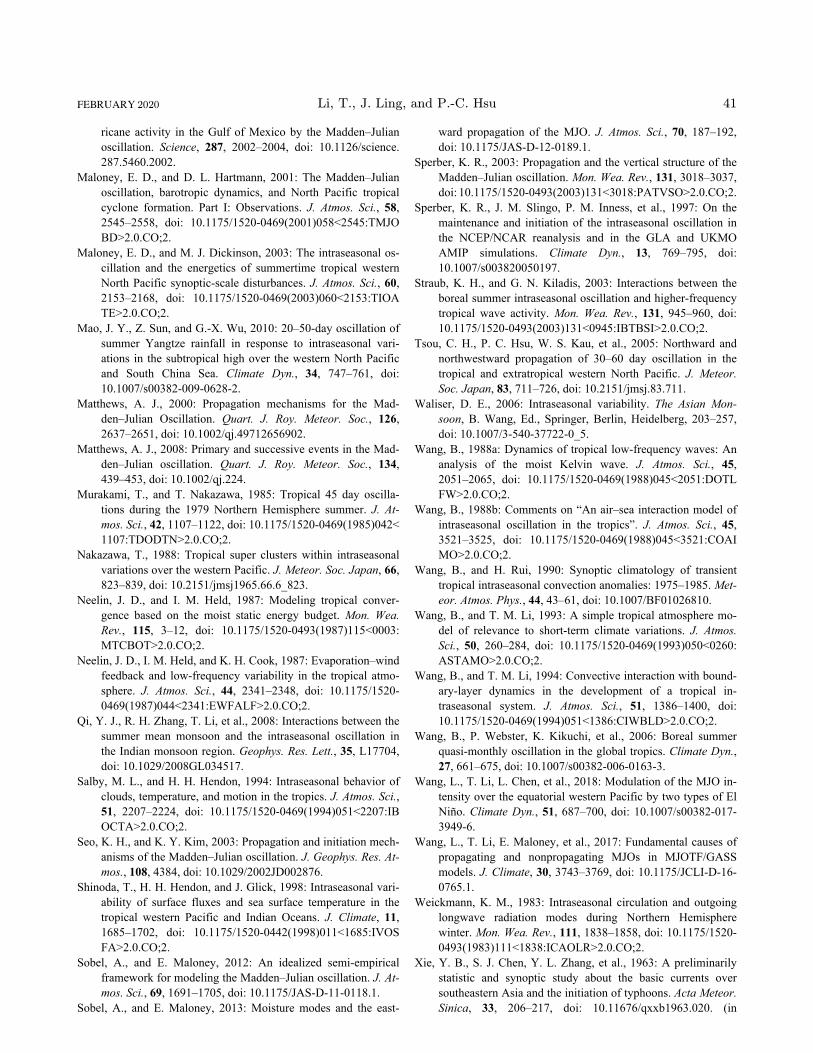
ricane activity in the Gulf of Mexico by the Madden–Julianoscillation. Science, 287, 2002–2004, doi: 10.1126/science.287.5460.2002.
Maloney, E. D., and D. L. Hartmann, 2001: The Madden–Julianoscillation, barotropic dynamics, and North Pacific tropicalcyclone formation. Part I: Observations. J. Atmos. Sci., 58,2545–2558, doi: 10.1175/1520-0469(2001)058<2545:TMJOBD>2.0.CO;2.
Maloney, E. D., and M. J. Dickinson, 2003: The intraseasonal os-cillation and the energetics of summertime tropical westernNorth Pacific synoptic-scale disturbances. J. Atmos. Sci., 60,2153–2168, doi: 10.1175/1520-0469(2003)060<2153:TIOATE>2.0.CO;2.
Mao, J. Y., Z. Sun, and G.-X. Wu, 2010: 20–50-day oscillation ofsummer Yangtze rainfall in response to intraseasonal vari-ations in the subtropical high over the western North Pacificand South China Sea. Climate Dyn., 34, 747–761, doi:10.1007/s00382-009-0628-2.
Matthews, A. J., 2000: Propagation mechanisms for the Mad-den–Julian Oscillation. Quart. J. Roy. Meteor. Soc., 126,2637–2651, doi: 10.1002/qj.49712656902.
Matthews, A. J., 2008: Primary and successive events in the Mad-den–Julian oscillation. Quart. J. Roy. Meteor. Soc., 134,439–453, doi: 10.1002/qj.224.
Murakami, T., and T. Nakazawa, 1985: Tropical 45 day oscilla-tions during the 1979 Northern Hemisphere summer. J. At-mos. Sci., 42, 1107–1122, doi: 10.1175/1520-0469(1985)042<1107:TDODTN>2.0.CO;2.
Nakazawa, T., 1988: Tropical super clusters within intraseasonalvariations over the western Pacific. J. Meteor. Soc. Japan, 66,823–839, doi: 10.2151/jmsj1965.66.6_823.
Neelin, J. D., and I. M. Held, 1987: Modeling tropical conver-gence based on the moist static energy budget. Mon. Wea.Rev., 115, 3–12, doi: 10.1175/1520-0493(1987)115<0003:MTCBOT>2.0.CO;2.
Neelin, J. D., I. M. Held, and K. H. Cook, 1987: Evaporation–windfeedback and low-frequency variability in the tropical atmo-sphere. J. Atmos. Sci., 44, 2341–2348, doi: 10.1175/1520-0469(1987)044<2341:EWFALF>2.0.CO;2.
Qi, Y. J., R. H. Zhang, T. Li, et al., 2008: Interactions between thesummer mean monsoon and the intraseasonal oscillation inthe Indian monsoon region. Geophys. Res. Lett., 35, L17704,doi: 10.1029/2008GL034517.
Salby, M. L., and H. H. Hendon, 1994: Intraseasonal behavior ofclouds, temperature, and motion in the tropics. J. Atmos. Sci.,51, 2207–2224, doi: 10.1175/1520-0469(1994)051<2207:IBOCTA>2.0.CO;2.
Seo, K. H., and K. Y. Kim, 2003: Propagation and initiation mech-anisms of the Madden–Julian oscillation. J. Geophys. Res. At-mos., 108, 4384, doi: 10.1029/2002JD002876.
Shinoda, T., H. H. Hendon, and J. Glick, 1998: Intraseasonal vari-ability of surface fluxes and sea surface temperature in thetropical western Pacific and Indian Oceans. J. Climate, 11,1685–1702, doi: 10.1175/1520-0442(1998)011<1685:IVOSFA>2.0.CO;2.
Sobel, A., and E. Maloney, 2012: An idealized semi-empiricalframework for modeling the Madden–Julian oscillation. J. At-mos. Sci., 69, 1691–1705, doi: 10.1175/JAS-D-11-0118.1.
Sobel, A., and E. Maloney, 2013: Moisture modes and the east-
ward propagation of the MJO. J. Atmos. Sci., 70, 187–192,doi: 10.1175/JAS-D-12-0189.1.
Sperber, K. R., 2003: Propagation and the vertical structure of theMadden–Julian oscillation. Mon. Wea. Rev., 131, 3018–3037,doi: 10.1175/1520-0493(2003)131<3018:PATVSO>2.0.CO;2.
Sperber, K. R., J. M. Slingo, P. M. Inness, et al., 1997: On themaintenance and initiation of the intraseasonal oscillation inthe NCEP/NCAR reanalysis and in the GLA and UKMOAMIP simulations. Climate Dyn., 13, 769–795, doi:10.1007/s003820050197.
Straub, K. H., and G. N. Kiladis, 2003: Interactions between theboreal summer intraseasonal oscillation and higher-frequencytropical wave activity. Mon. Wea. Rev., 131, 945–960, doi:10.1175/1520-0493(2003)131<0945:IBTBSI>2.0.CO;2.
Tsou, C. H., P. C. Hsu, W. S. Kau, et al., 2005: Northward andnorthwestward propagation of 30–60 day oscillation in thetropical and extratropical western North Pacific. J. Meteor.Soc. Japan, 83, 711–726, doi: 10.2151/jmsj.83.711.
Waliser, D. E., 2006: Intraseasonal variability. The Asian Mon-soon, B. Wang, Ed., Springer, Berlin, Heidelberg, 203–257,doi: 10.1007/3-540-37722-0_5.
Wang, B., 1988a: Dynamics of tropical low-frequency waves: Ananalysis of the moist Kelvin wave. J. Atmos. Sci., 45,2051–2065, doi: 10.1175/1520-0469(1988)045<2051:DOTLFW>2.0.CO;2.
Wang, B., 1988b: Comments on “An air–sea interaction model ofintraseasonal oscillation in the tropics”. J. Atmos. Sci., 45,3521–3525, doi: 10.1175/1520-0469(1988)045<3521:COAIMO>2.0.CO;2.
Wang, B., and H. Rui, 1990: Synoptic climatology of transienttropical intraseasonal convection anomalies: 1975–1985. Met-eor. Atmos. Phys., 44, 43–61, doi: 10.1007/BF01026810.
Wang, B., and T. M. Li, 1993: A simple tropical atmosphere mo-del of relevance to short-term climate variations. J. Atmos.Sci., 50, 260–284, doi: 10.1175/1520-0469(1993)050<0260:ASTAMO>2.0.CO;2.
Wang, B., and T. M. Li, 1994: Convective interaction with bound-ary-layer dynamics in the development of a tropical in-traseasonal system. J. Atmos. Sci., 51, 1386–1400, doi:10.1175/1520-0469(1994)051<1386:CIWBLD>2.0.CO;2.
Wang, B., P. Webster, K. Kikuchi, et al., 2006: Boreal summerquasi-monthly oscillation in the global tropics. Climate Dyn.,27, 661–675, doi: 10.1007/s00382-006-0163-3.
Wang, L., T. Li, L. Chen, et al., 2018: Modulation of the MJO in-tensity over the equatorial western Pacific by two types of ElNiño. Climate Dyn., 51, 687–700, doi: 10.1007/s00382-017-3949-6.
Wang, L., T. Li, E. Maloney, et al., 2017: Fundamental causes ofpropagating and nonpropagating MJOs in MJOTF/GASSmodels. J. Climate, 30, 3743–3769, doi: 10.1175/JCLI-D-16-0765.1.
Weickmann, K. M., 1983: Intraseasonal circulation and outgoinglongwave radiation modes during Northern Hemispherewinter. Mon. Wea. Rev., 111, 1838–1858, doi: 10.1175/1520-0493(1983)111<1838:ICAOLR>2.0.CO;2.
Xie, Y. B., S. J. Chen, Y. L. Zhang, et al., 1963: A preliminarilystatistic and synoptic study about the basic currents oversoutheastern Asia and the initiation of typhoons. Acta Meteor.Sinica, 33, 206–217, doi: 10.11676/qxxb1963.020. (in
FEBRUARY 2020 Li, T., J. Ling, and P.-C. Hsu 41
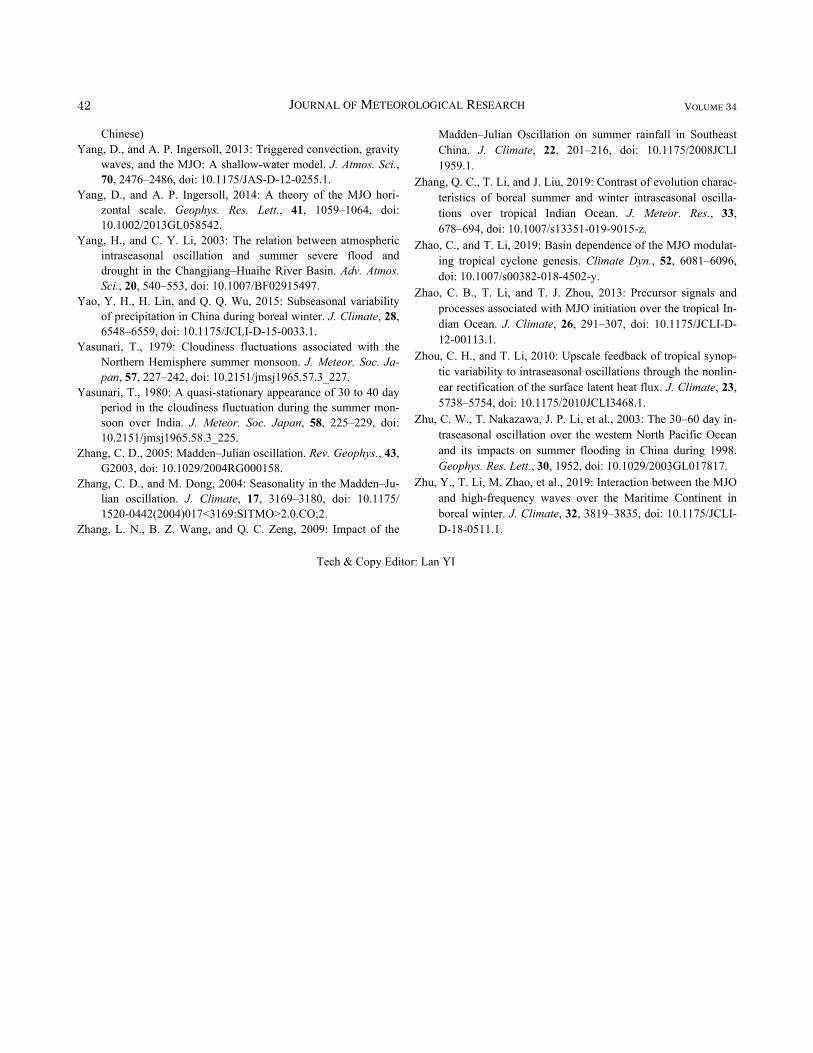
Chinese)
Yang, D., and A. P. Ingersoll, 2013: Triggered convection, gravitywaves, and the MJO: A shallow-water model. J. Atmos. Sci.,70, 2476–2486, doi: 10.1175/JAS-D-12-0255.1.
Yang, D., and A. P. Ingersoll, 2014: A theory of the MJO hori-zontal scale. Geophys. Res. Lett., 41, 1059–1064, doi:10.1002/2013GL058542.
Yang, H., and C. Y. Li, 2003: The relation between atmosphericintraseasonal oscillation and summer severe flood anddrought in the Changjiang–Huaihe River Basin. Adv. Atmos.Sci., 20, 540–553, doi: 10.1007/BF02915497.
Yao, Y. H., H. Lin, and Q. Q. Wu, 2015: Subseasonal variabilityof precipitation in China during boreal winter. J. Climate, 28,6548–6559, doi: 10.1175/JCLI-D-15-0033.1.
Yasunari, T., 1979: Cloudiness fluctuations associated with theNorthern Hemisphere summer monsoon. J. Meteor. Soc. Ja-pan, 57, 227–242, doi: 10.2151/jmsj1965.57.3_227.
Yasunari, T., 1980: A quasi-stationary appearance of 30 to 40 dayperiod in the cloudiness fluctuation during the summer mon-soon over India. J. Meteor. Soc. Japan, 58, 225–229, doi:10.2151/jmsj1965.58.3_225.
Zhang, C. D., 2005: Madden–Julian oscillation. Rev. Geophys., 43,G2003, doi: 10.1029/2004RG000158.
Zhang, C. D., and M. Dong, 2004: Seasonality in the Madden–Ju-lian oscillation. J. Climate, 17, 3169–3180, doi: 10.1175/1520-0442(2004)017<3169:SITMO>2.0.CO;2.
Zhang, L. N., B. Z. Wang, and Q. C. Zeng, 2009: Impact of the
Madden–Julian Oscillation on summer rainfall in SoutheastChina. J. Climate, 22, 201–216, doi: 10.1175/2008JCLI1959.1.
Zhang, Q. C., T. Li, and J. Liu, 2019: Contrast of evolution charac-teristics of boreal summer and winter intraseasonal oscilla-tions over tropical Indian Ocean. J. Meteor. Res., 33,678–694, doi: 10.1007/s13351-019-9015-z.
Zhao, C., and T. Li, 2019: Basin dependence of the MJO modulat-ing tropical cyclone genesis. Climate Dyn., 52, 6081–6096,doi: 10.1007/s00382-018-4502-y.
Zhao, C. B., T. Li, and T. J. Zhou, 2013: Precursor signals andprocesses associated with MJO initiation over the tropical In-dian Ocean. J. Climate, 26, 291–307, doi: 10.1175/JCLI-D-12-00113.1.
Zhou, C. H., and T. Li, 2010: Upscale feedback of tropical synop-tic variability to intraseasonal oscillations through the nonlin-ear rectification of the surface latent heat flux. J. Climate, 23,5738–5754, doi: 10.1175/2010JCLI3468.1.
Zhu, C. W., T. Nakazawa, J. P. Li, et al., 2003: The 30–60 day in-traseasonal oscillation over the western North Pacific Oceanand its impacts on summer flooding in China during 1998.Geophys. Res. Lett., 30, 1952, doi: 10.1029/2003GL017817.
Zhu, Y., T. Li, M. Zhao, et al., 2019: Interaction between the MJOand high-frequency waves over the Maritime Continent inboreal winter. J. Climate, 32, 3819–3835, doi: 10.1175/JCLI-D-18-0511.1.
Tech & Copy Editor: Lan YI
42 Journal of Meteorological Research Volume 34