Embed Size (px)
Citation preview

Mitg
lied
der H
elm
holtz
-Gem
eins
chaf
t
Macroscopic modelling of degradationphenomena in fuel cells
Andrei Kulikovsky
Research Centre JuelichInstitute of Energy and Climate Research, IEK-3
2nd European Summer School, Iraklion, September 2012

Institute of Energy and Climate Research (IEK-3) 1
Outline
• Introduction
• Poisoning wave along the feed channel
• Carbon corrosion in PEM fuel cells
• Ruthenium corrosion in DMFCs
• Poisoning wave in the catalyst layer: Cr deposition in SOFC
• Conclusions
0 0.2 0.4 0.6 0.8 10
50
100
150
200
OR
R ra
te /
A cm
-3
1 2 3Degradation wave
4
5l*
Gas
-diff
usio
n la
yer
/ tx l

Institute of Energy and Climate Research (IEK-3) 2
What is wrong with our cells?
Key aging problems are in catalyst layers (agglomeration, dissolution, corrosion etc)

Institute of Energy and Climate Research (IEK-3) 3
General aging models?
Can we develop general models of cell aging,not specifying microscopic mechanisms?
Yes, we can!

Institute of Energy and Climate Research (IEK-3) 4
Quasi-2D cell modeling
x
zcathode channel
cathode GDL
CCLmembrane
inle
t
outle
t
inle
t
outle
t
anode channel
anode GDL
ACL
air
fuel
In the MEA, the dominant transport is through-plane; in the channels, it is along the channel.
Quasi-2D models.
Institute of Energy and Climate Research (IEK-3) 5
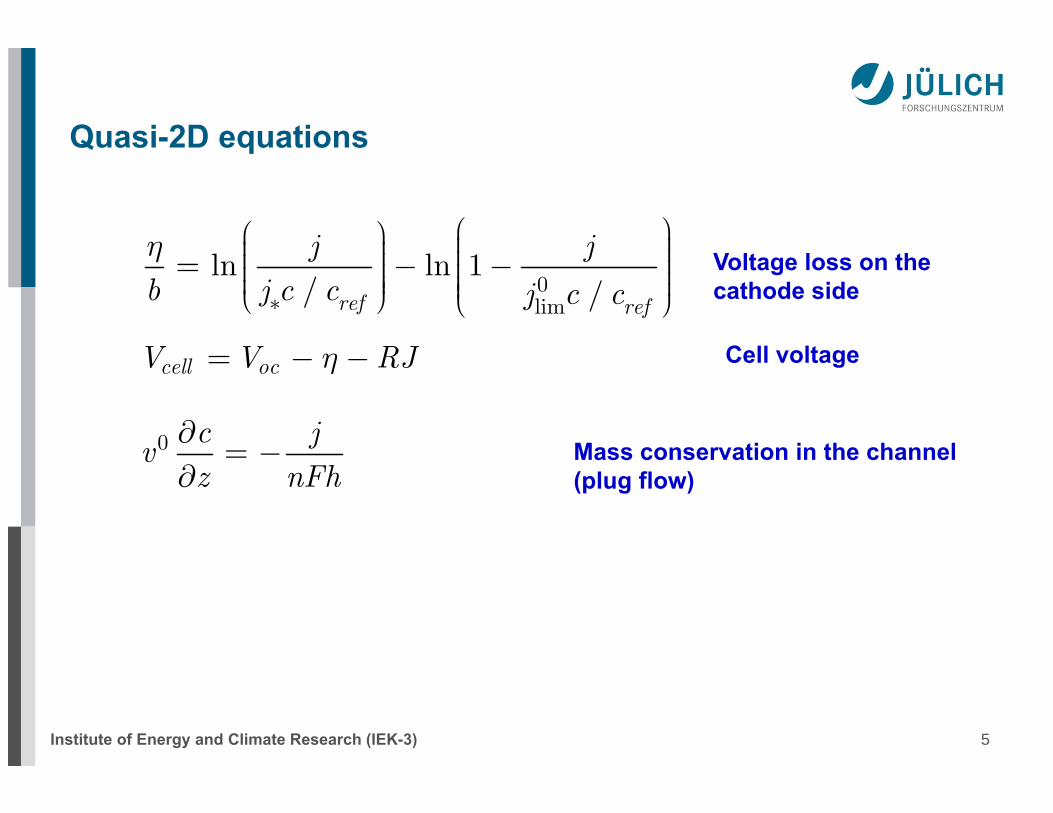
Quasi-2D equations
0lim
ln ln 1/ /ref ref
j jb j c c j c c
h
*
æ öæ ö ÷ç÷ç ÷÷ çç= - - ÷÷ çç ÷÷ ç÷ç ÷çè ø è ø
0 c jvz nFh
¶= -
cell ocV V RJh= - -
Voltage loss on the cathode side
Mass conservation in the channel(plug flow)
Cell voltage

Institute of Energy and Climate Research (IEK-3) 6
Solutions:
/1 1
ln 1 1z L
jJ
ll l
æ öæ ö÷ ÷ç ç= - - -÷ ÷ç ç÷ ÷÷ ÷ç çè øè ø
/
0
11
z Lc
c l
æ ö÷ç= - ÷ç ÷÷çè ø
Normalized distance along the channel0.0 0.2 0.4 0.6 0.8 1.0
0.0
0.2
0.4
0.6
0.8
1.0
0
c
c
Normalized distance along the channel0.0 0.2 0.4 0.6 0.8 1.0
0
1
2
3
jJ
The lower stoich, the larger local current at the inlet

Institute of Energy and Climate Research (IEK-3) 7
Model and experiment of Kućernak’s group
0 0.2 0.4 0.6 0.8 10
0.1
0.2
0.3
Cur
rent
/ A
0 0.2 0.4 0.6 0.8 1
0
1
2
3
4
5
2.0691.2021.0114
Lambda
502010 sccm
Inlet Outlet
Raw data
Model (lines) and experiment
A.A.Kulikovsky, A.Kucernak and A.A.KornyshevElectrochim. Acta 50 (2005) 1323.
( )( )/
0 1 1ln 1 1
z LjJ
ll l
= - - -

Institute of Energy and Climate Research (IEK-3) 8
Suppose that there exists a critical current density
0 0.2 0.4 0.6 0.8 10
1
2
3
4
5
critj
wl
0t 1t
nt
/z LInlet Outlet
11
w
w
z z
L z
w
j Lf
J L z l l
--æ ö æ ö÷ ÷ç ç÷= ⋅ - ÷ç ç÷ ÷ç ÷ç÷ç - è øè ø
11 11
1
w
w
z z
z
w
jf
J z l l
--æ ö æ ö÷ ÷ç ç÷= ⋅ - ÷ç ç÷ ÷ç ÷ç÷ç - è øè ø
The length of the domain subject to degradation is obtained from
( )w w critj z l j+ =
Institute of Energy and Climate Research (IEK-3) 9
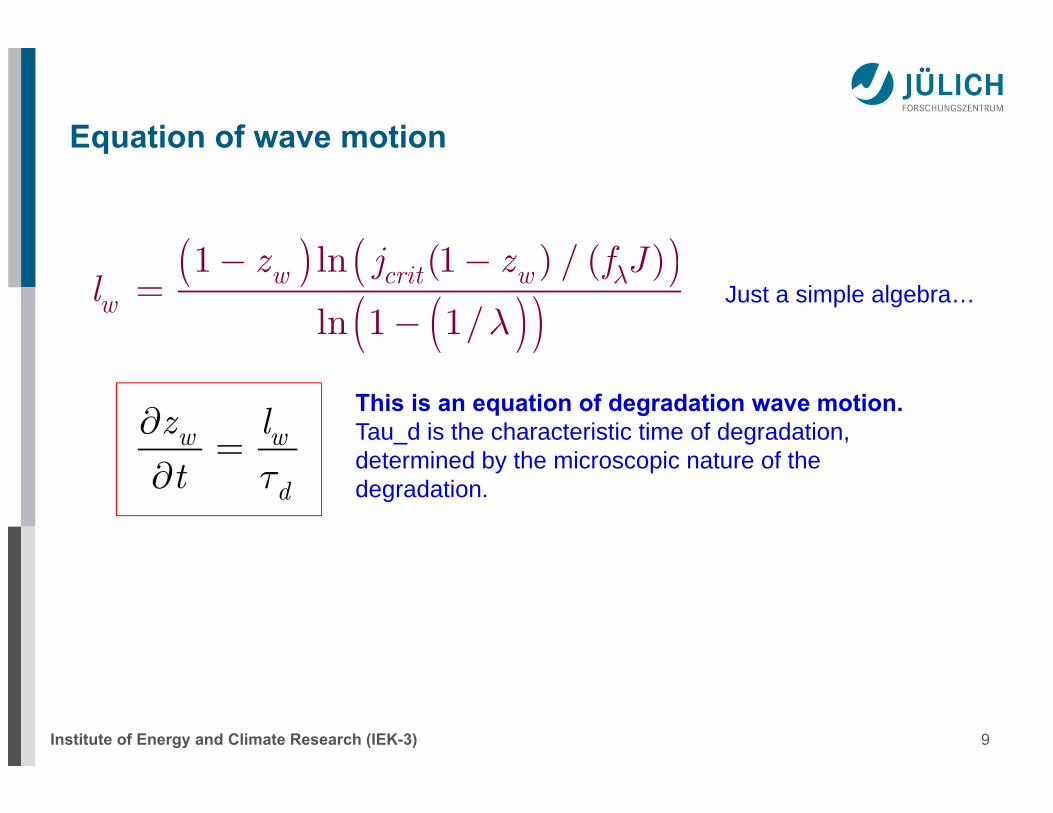
Equation of wave motion
( ) ( )( )( )
1 ln (1 ) / ( )
ln 1 1/w crit w
w
z j z f Jl l
l
- -=
-
w w
d
z l
t t
=
This is an equation of degradation wave motion. Tau_d is the characteristic time of degradation, determined by the microscopic nature of the degradation.
Just a simple algebra…
Institute of Energy and Climate Research (IEK-3) 10
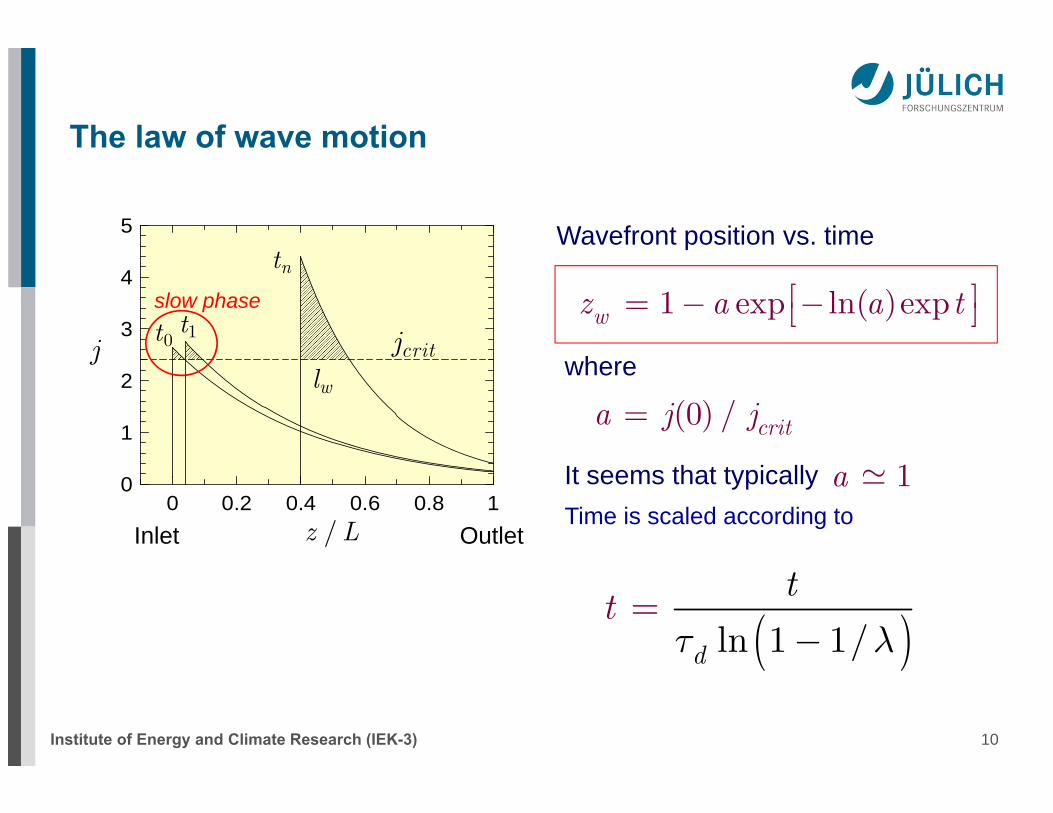
The law of wave motion
1 exp ln( )expwz a a té ù= - -ë û
0 0.2 0.4 0.6 0.8 10
1
2
3
4
5
critj
wl
0t 1t
nt
j
/z L
slow phase
Wavefront position vs. time
Inlet Outlet
It seems that typically 1a
(0) / crita j j=
where
( )ln 1 1/d
tt
t l-=
Time is scaled according to
Institute of Energy and Climate Research (IEK-3) 11
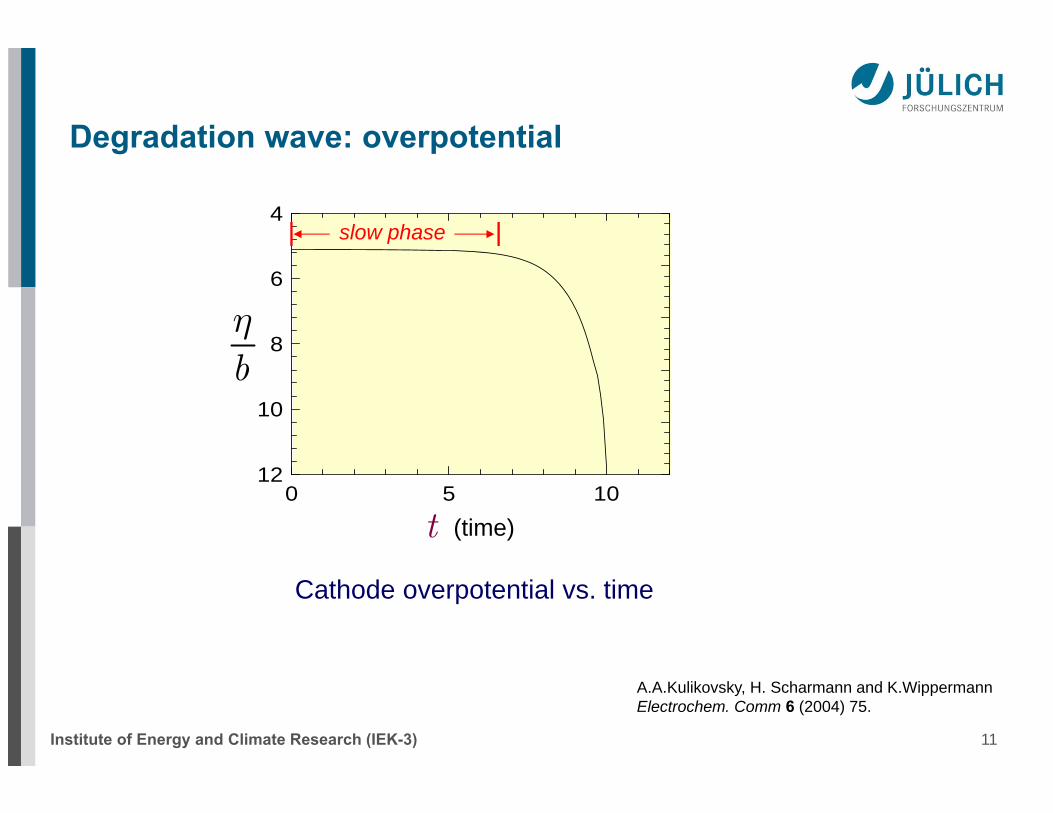
Degradation wave: overpotential
0 5 1012
10
8
6
4
bh
t
slow phase
(time)
A.A.Kulikovsky, H. Scharmann and K.Wippermann Electrochem. Comm 6 (2004) 75.
Cathode overpotential vs. time

Institute of Energy and Climate Research (IEK-3) 12
PEFC lifetime experiment from PSI

Institute of Energy and Climate Research (IEK-3) 13
PEFC flooding (ZSW and Fraunhofer ISE)
Scholta, Lehnert, Grünerbel, Jörissen
Air inlet
Outlet

Institute of Energy and Climate Research (IEK-3) 14
Some lessons
It seems that fuel cell never dies uniformly: some areas are more stressed and they die first. Then, the “stressing spot” shifts to a new position and it starts killing a new domain. In the stack, the process is facilitated by the fixed total current.
Stressing factors: (i) high local current, (ii) high local temperature, (iii) high local overpotential. These factors induce numerous microscopic aging processes.
We could imagine radial waves propagating from the circular spot, or 2D waves. However, the mechanism of propagation remains the same.
0 0.2 0.4 0.6 0.8 10
1
2
3
4
5

Institute of Energy and Climate Research (IEK-3) 15
C.A.Reiser, L.Bregoli, T.W.Patterson, J.S.Yi, J.D.Yang, M.L.Perry, T.D.Jarvi. ESSL 8 (2005) A273
Anode inlet Anode outlet
Cell “reversal”
0.5eqcrE V=1.23eq
oxE V=
eqc Eh j= -F -
metal electrolyte OCV
Institute of Energy and Climate Research (IEK-3) 16
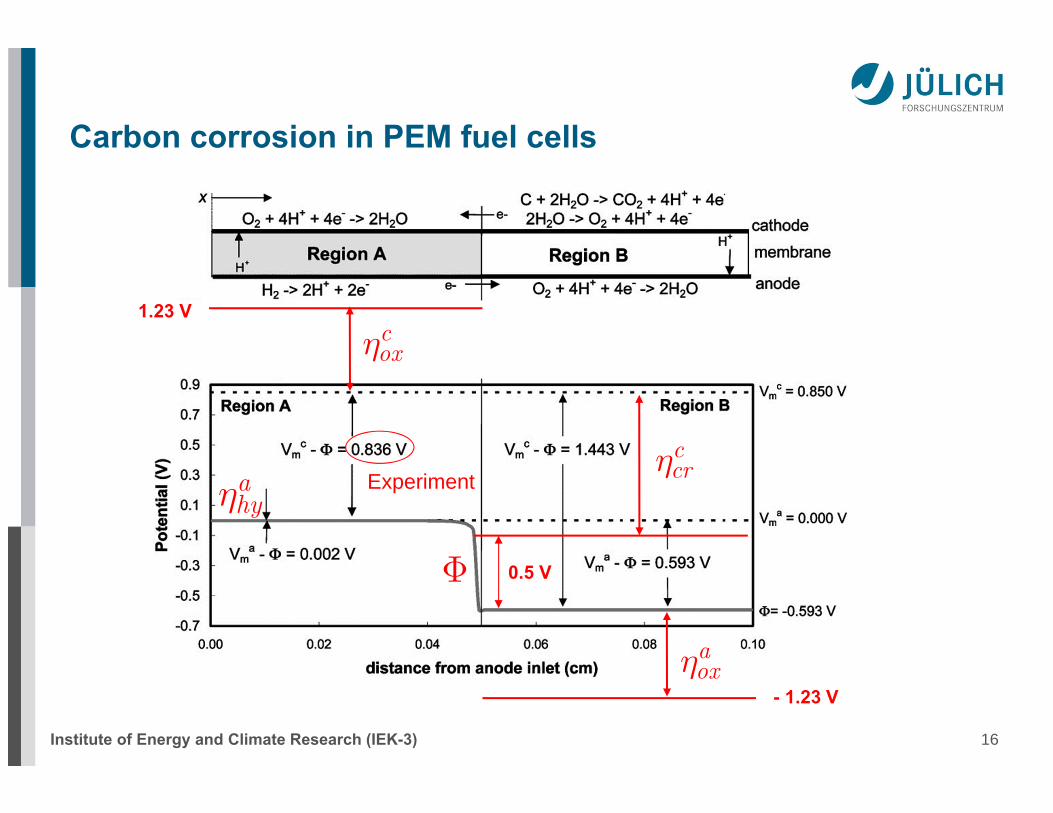
Carbon corrosion in PEM fuel cells
Experiment
F
coxh
1.23 V
- 1.23 V
aoxh
ccrh
0.5 V
ahyh

Institute of Energy and Climate Research (IEK-3) 17
Model
A
CN-domain R-domain
Hydrogen oxidation Oxygen reduction
Oxygen reduction Carbon corrosion
x
y
Institute of Energy and Climate Research (IEK-3) 18
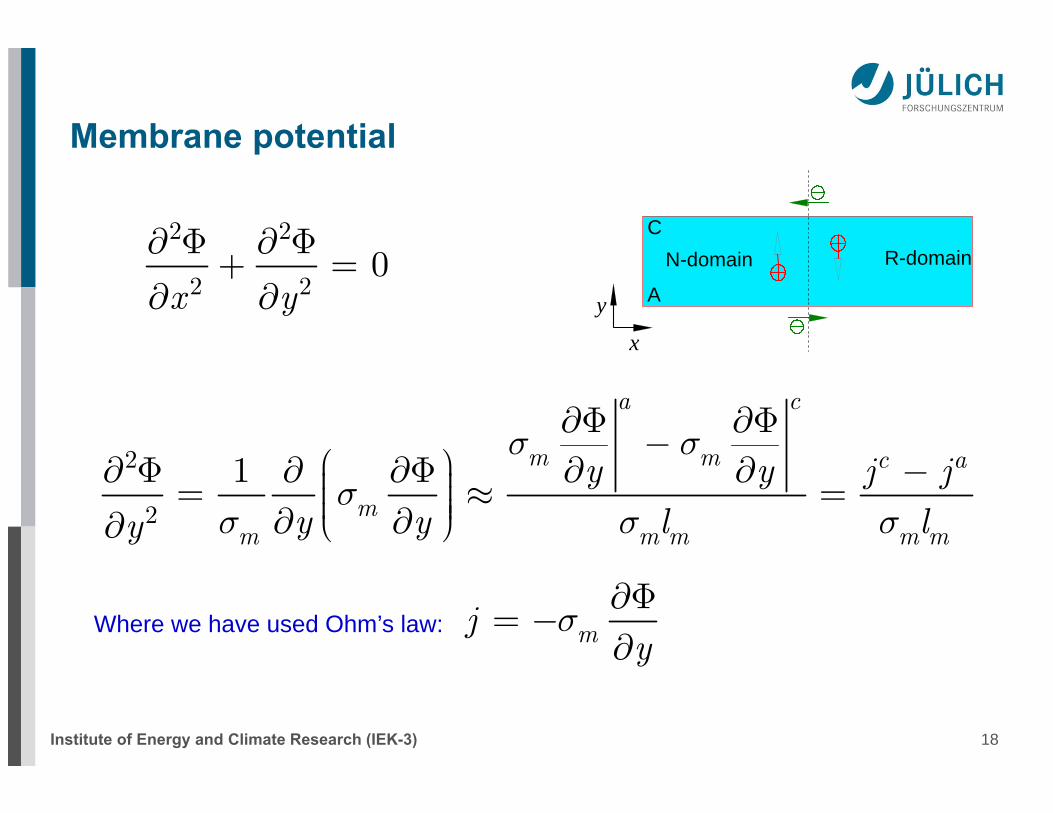
Membrane potential
2 2
2 20
x y
¶ F ¶ F+ =
¶ ¶x
y A
CN-domain R-domain
2
2
1
a c
m m c a
mm m m m m
y y j jy y l ly
s ss
s s s
¶F ¶F-
æ ö¶ F ¶ ¶F ¶ ¶ -÷ç= » =÷ç ÷÷ç¶ ¶è ø
Where we have used Ohm’s law: mjy
s¶F
= -
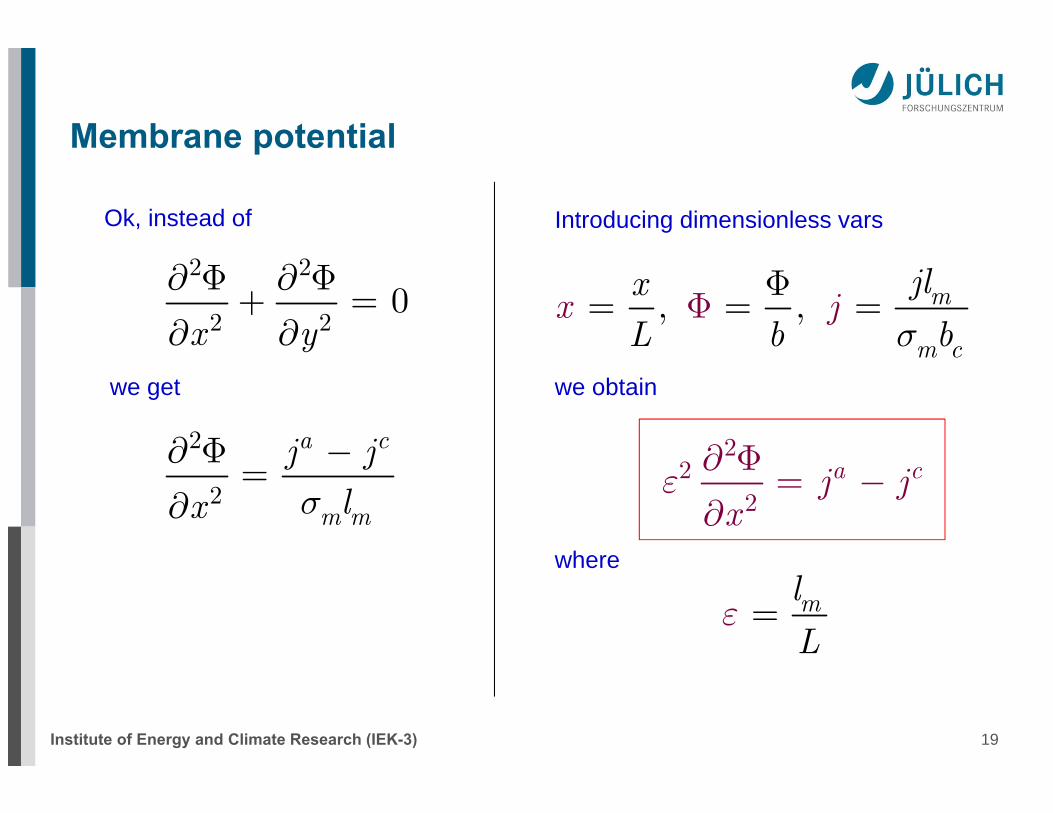
Institute of Energy and Climate Research (IEK-3) 19
Membrane potential
2 2
2 20
x y
¶ F ¶ F+ =
¶ 
2
2
a c
m m
j jlx s
¶ F -=
Ok, instead of
we get
22
2a cj j
xe
¶ F= -
, , m
m c
x jjlx
L b bsF
F= = =
Introducing dimensionless vars
we obtain
where
ml
Le =

Institute of Energy and Climate Research (IEK-3) 20
What is epsilon?
22
2372.5 10
1010
ml
Le
--
æ öæ ö ⋅ ÷÷ çç ÷÷= = çç ÷÷ çç ÷ ÷ç çè ø è ø
Thus, at leading order we can set epsilon = 0 and the Poisson equation
simplifies to
a cj j=
2D Laplace equation is reduced to a much simpler algebraic equation!
For j^a and j^c we can write Butler-Volmer-like equations. For concen-trations we take a step function.
2 2
2 20
x y
¶ F ¶ F+ =
¶ 
22
2a cj j
xe
¶ F= -
a cj j=

Institute of Energy and Climate Research (IEK-3) 21
Currents
( ) ( ) 0a a c chy ox ox crj j j j- - - =
No current in the external circuit

Institute of Energy and Climate Research (IEK-3) 22
An example: HOR current
2 sinh hyBVhy hy
hy
j jb
h*æ ö÷ç ÷ç= ÷ç ÷÷çè ø
lim
1 1na BVhy hy hy
f
j j j= +
lim2 ref
hy hy
b reh
fy
FD c
l jj =
011 tanh
2nx x
fs
æ æ öö- ÷÷ç ç ÷÷= -ç ç ÷÷ç ç ÷÷ç çè è øø
a eqhy c hyEh j= -F -
(Crude approximation for HOR…)

Institute of Energy and Climate Research (IEK-3) 23
Concentrations and currents
0 1 2 3 4 5 6 7 8 9 10Distance along the channel / cm
-0.6
-0.4
-0.2
0
Phi
/ V
0
0.2
0.4
0.6
0.8
1
Con
cent
ratio
n / c
ref
oxc
hyc
0 1 2 3 4 5 6 7 8 9 10Distance along the channel / cm
0
0.5
1
1.5
2
j cat
hode
/ A
cm
-2
coxj
ccrj
Anode concentrations and Phi “Cathode” currents
F
Prescribed step functions for hydrogen and oxygen concentrations and the solution for Phi. Our approximation fails in a narrow yellow zone.
ORR and CCR current densities on the cathode side.
Institute of Energy and Climate Research (IEK-3) 24
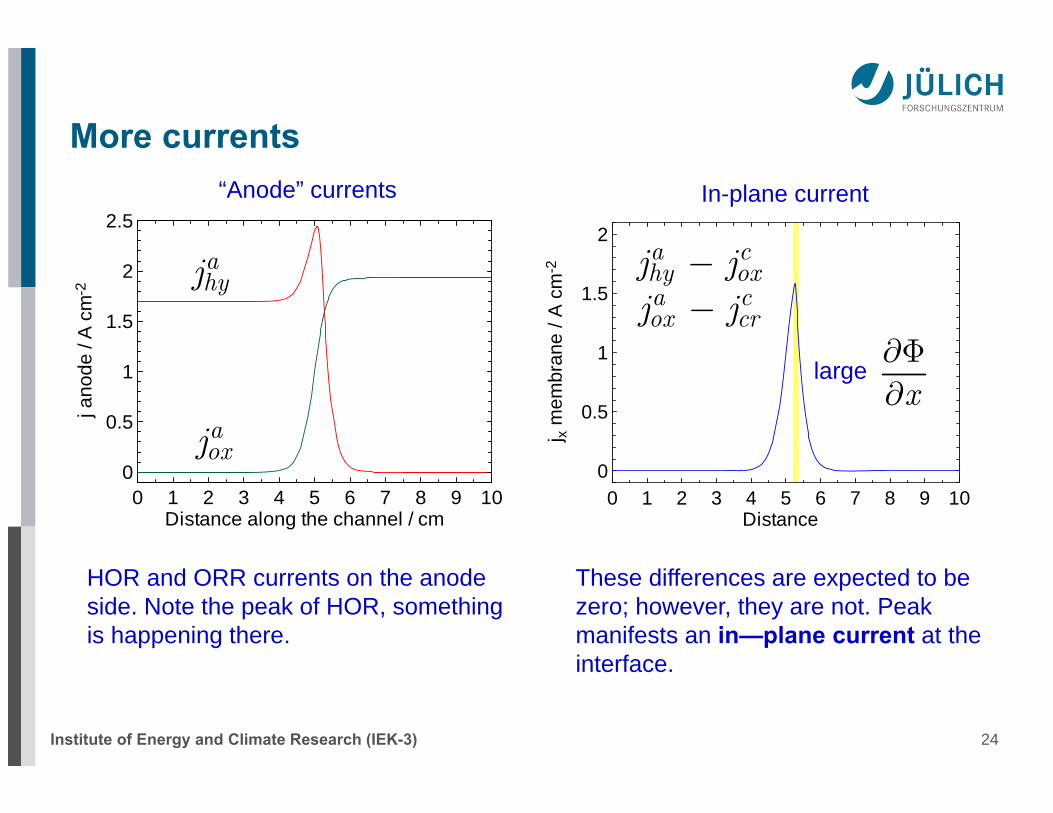
More currents
0 1 2 3 4 5 6 7 8 9 10Distance along the channel / cm
0
0.5
1
1.5
2
2.5
j ano
de /
A c
m-2
“Anode” currents
ahyj
aoxj
0 1 2 3 4 5 6 7 8 9 10Distance
0
0.5
1
1.5
2
j x m
embr
ane
/ A c
m-2
a chy oxj j-a cox crj j-
In-plane current
x¶F
large
HOR and ORR currents on the anode side. Note the peak of HOR, something is happening there.
These differences are expected to be zero; however, they are not. Peak manifests an in—plane current at the interface.
Institute of Energy and Climate Research (IEK-3) 25
0 1 2 3 4 5 6 7 8 9 10
0
0.01
0.02
j cat
hode
/ A
cm
-2
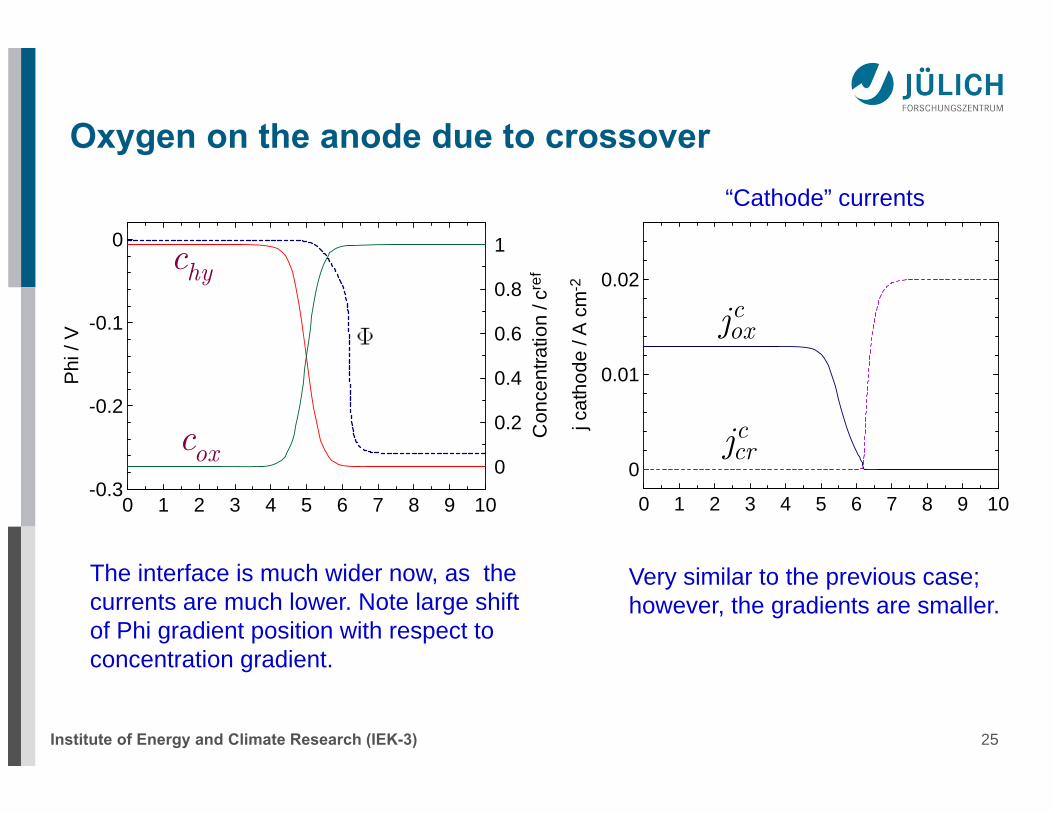
Oxygen on the anode due to crossover
0 1 2 3 4 5 6 7 8 9 10-0.3
-0.2
-0.1
0
Phi
/ V
0
0.2
0.4
0.6
0.8
1
Con
cent
ratio
n / c
ref
oxc
hyccoxj
ccrj
“Cathode” currents
The interface is much wider now, as the currents are much lower. Note large shift of Phi gradient position with respect to concentration gradient.
Very similar to the previous case; however, the gradients are smaller.

Institute of Energy and Climate Research (IEK-3) 26
Currents
0 1 2 3 4 5 6 7 8 9 100
0.01
0.02
0.03
j ano
de /
A c
m-2
ahyj
aoxj
0 1 2 3 4 5 6 7 8 9 100
0.01
0.02
0.03
j x m
embr
ane
/ A c
m-2
a chy oxj j-a cox crj j-
“Anode” currents “In-plane” current
Peak of in—plane current at the interface gets wider.
Institute of Energy and Climate Research (IEK-3) 27
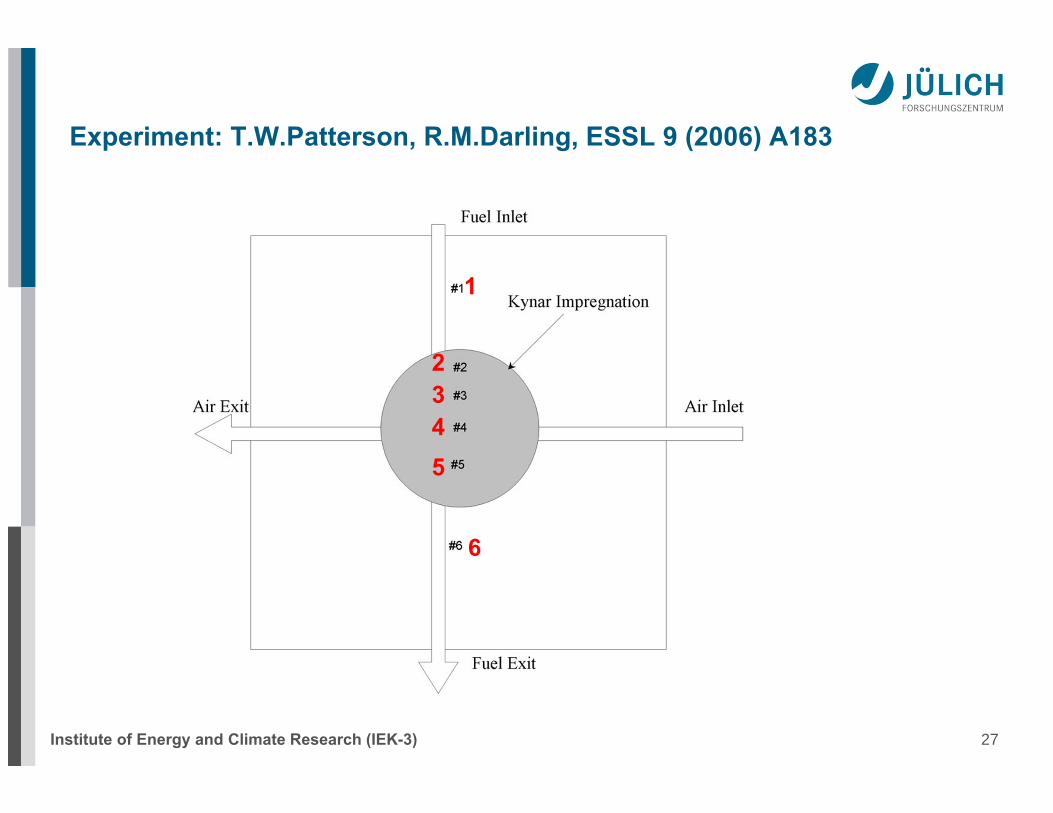
Experiment: T.W.Patterson, R.M.Darling, ESSL 9 (2006) A183
1
2345
6

Institute of Energy and Climate Research (IEK-3) 28
Experiment 2anode
cath1
2345
6

Institute of Energy and Climate Research (IEK-3) 29
N/R interface: Virtual fuel cell
A.A.Kulikovsky J. Electrochem. Soc. (2011)
0 1 2 3 4 5 6 7 8 9 100
0.01
0.02
0.03
j x membrane / A cm-2
Institute of Energy and Climate Research (IEK-3) 30
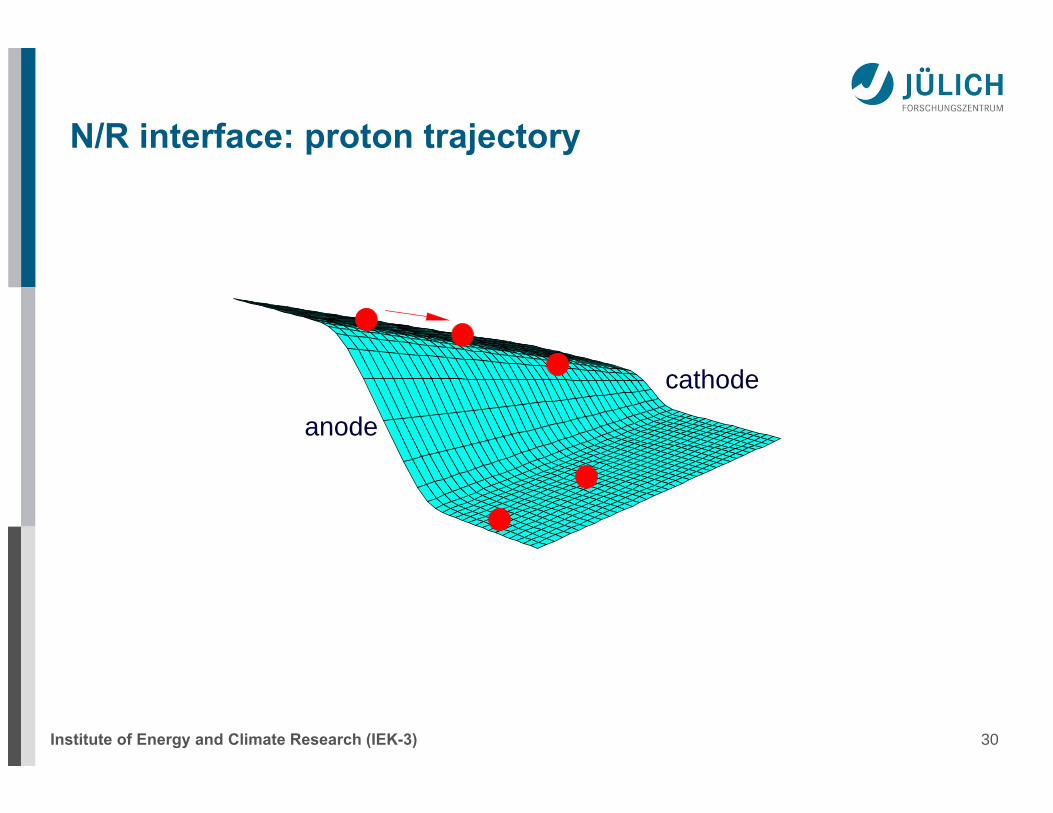
N/R interface: proton trajectory
cathode
anode

Institute of Energy and Climate Research (IEK-3) 31
How could we block reversal?
• Simple solution is to apply external potential to the cell; this is what companies are doing.
• More exotic solution is the membrane with anisotropic conductivity. If proton conductivity along the y—axis is small, the virtual fuel cell cannot form and no reversal could happen.

Institute of Energy and Climate Research (IEK-3) 32
DMFC with methanol starvation
0
0.5
1
Met
h. c
once
ntra
tion
0 1 2 3 4 5 6 7 8 9 10Distance along the channel / cm
-0.8
-0.6
-0.4
-0.2
0
0.2
0.4
0.6
Pot
entia
ls /
V
inle
t
outle
t
O2
CH3OH
cell voltage
xy
MOR CCR
ORR ORR
ccj
acj
Mc
F
Institute of Energy and Climate Research (IEK-3) 33
Methanol starvation: Environment for Ru corrosion
Distance along the channel / cm0 2 4 6 8 10
-0.2
0.0
0.2
0.4
0.6
0.8
Ove
rpot
entia
l / V
Oxygen
Methanol
Carbon
Ruthenium
(a)
(a)
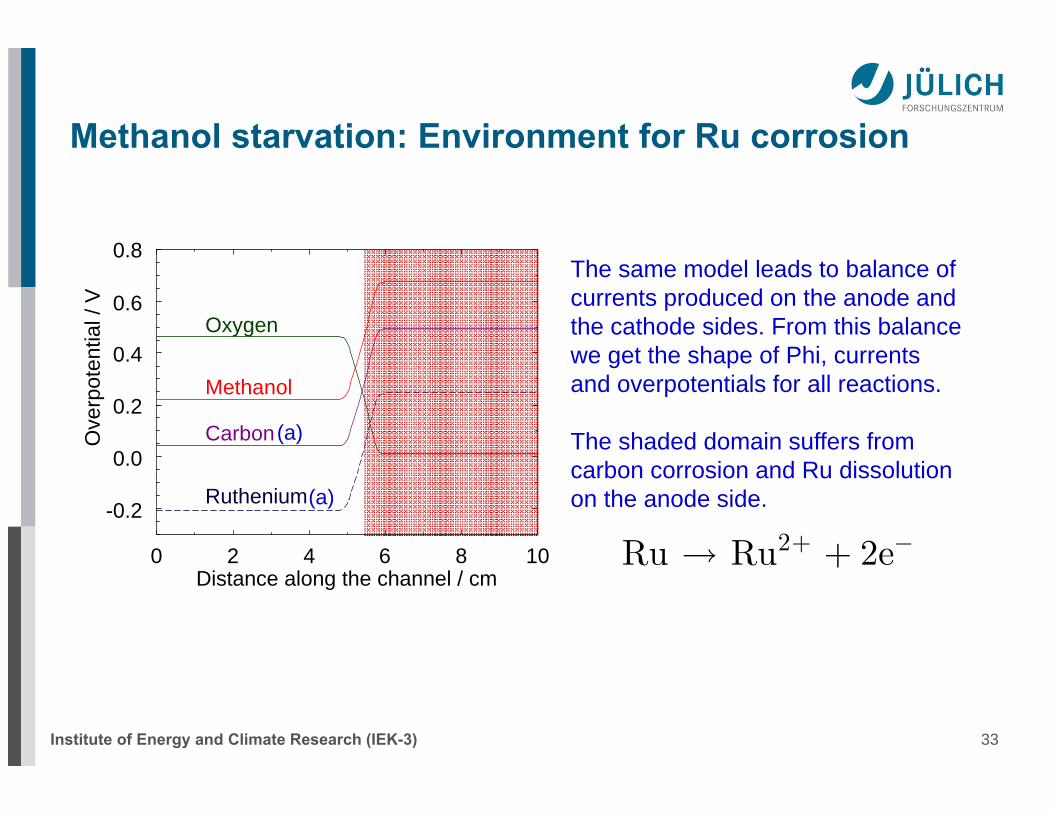
The same model leads to balance of currents produced on the anode and the cathode sides. From this balance we get the shape of Phi, currents and overpotentials for all reactions.
The shaded domain suffers from carbon corrosion and Ru dissolution on the anode side.
2Ru Ru 2e+ - +

Institute of Energy and Climate Research (IEK-3) 34
The effect of depleted domain length
Fraction of methanol-depleted domain0.0 0.2 0.4 0.6 0.8 1.0
0.0
0.1
0.2
0.3
0.4
0.5
Pot
entia
l / V
0.6
0.7
100 mA cm-2
Ru
CarbonVcell

Institute of Energy and Climate Research (IEK-3) 35
Degradation wave in the catalyst layer
2 sinhj
cx
e h
= -
jxh
= -
Charge
Ohm’s law
0c
D j jx
¶= -
¶Mass transport
Institute of Energy and Climate Research (IEK-3) 36
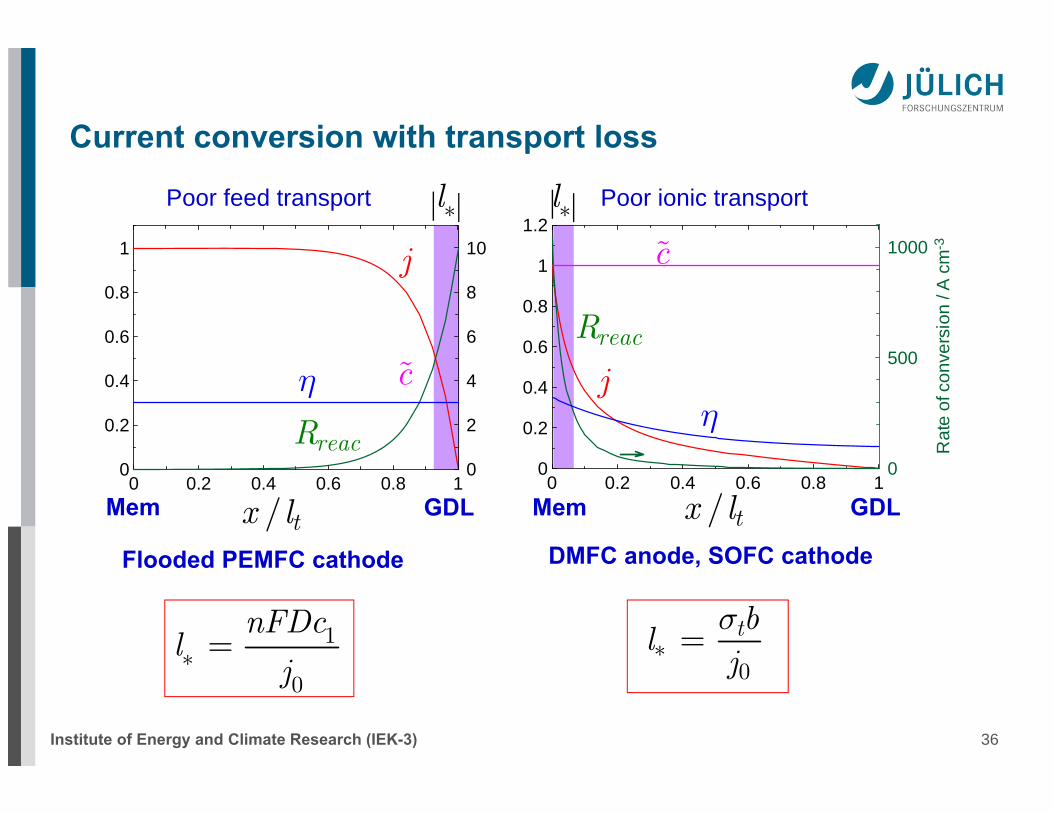
Current conversion with transport loss
0 0.2 0.4 0.6 0.8 10
0.2
0.4
0.6
0.8
1
0
2
4
6
8
10
/ tx l GDLMem
j
reacR
Poor feed transport Poor ionic transport
h c
0 0.2 0.4 0.6 0.8 10
0.2
0.4
0.6
0.8
1
1.2
0
500
1000
Rat
e of
con
vers
ion
/ A c
m-3
reacR
j
/ tx lMem GDL
h
c
Flooded PEMFC cathode DMFC anode, SOFC cathode
1
0
nFDcl
j* =0
tbljs
* =
l* l*

Institute of Energy and Climate Research (IEK-3) 37
Polarization curves
0 0.2 0.4 0.6 0.8 10
0.2
0.4
0.6
0.8
1
0
2
4
6
8
10
00 2 ln
D
jb
jh
æ ö÷ç= ÷ç ÷çè ø
21 /D refj i nFDc c*=
0 0.2 0.4 0.6 0.8 10
0.2
0.4
0.6
0.8
1
1.2
0
500
1000
Rat
e of
con
vers
ion
/ A c
m-3
00 2 ln
jb
jsh
æ ö÷ç= ÷ç ÷çè ø
12 /t refj i bc cs s*=
This case is of largest interest for DMFC, SOFC and HT-PEMFC

Institute of Energy and Climate Research (IEK-3) 38
Cr poisoning of the CCL in SOFC
( )2 3 2 2 2 23
Cr O (s) + O (g) + 2H O 2CrO OH (g)2
( ) - 2-2 2 3 22CrO OH (g) + 6e 3O + Cr O (s) + 2H O(g)
On the BP surface
In the FL, electro-chemical process!
Ele
ctro
lyte
Gas
-diff
usio
n la
yer
(cur
rent
col
lect
or)
Functional layer
0 10
Bipo
lar p
late
Institute of Energy and Climate Research (IEK-3) 39
0 0.2 0.4 0.6 0.8 10
0.2
0.4
0.6
0.8
1
1.2
0
500
1000
Rat
e of
con
vers
ion
/ A c
m-3
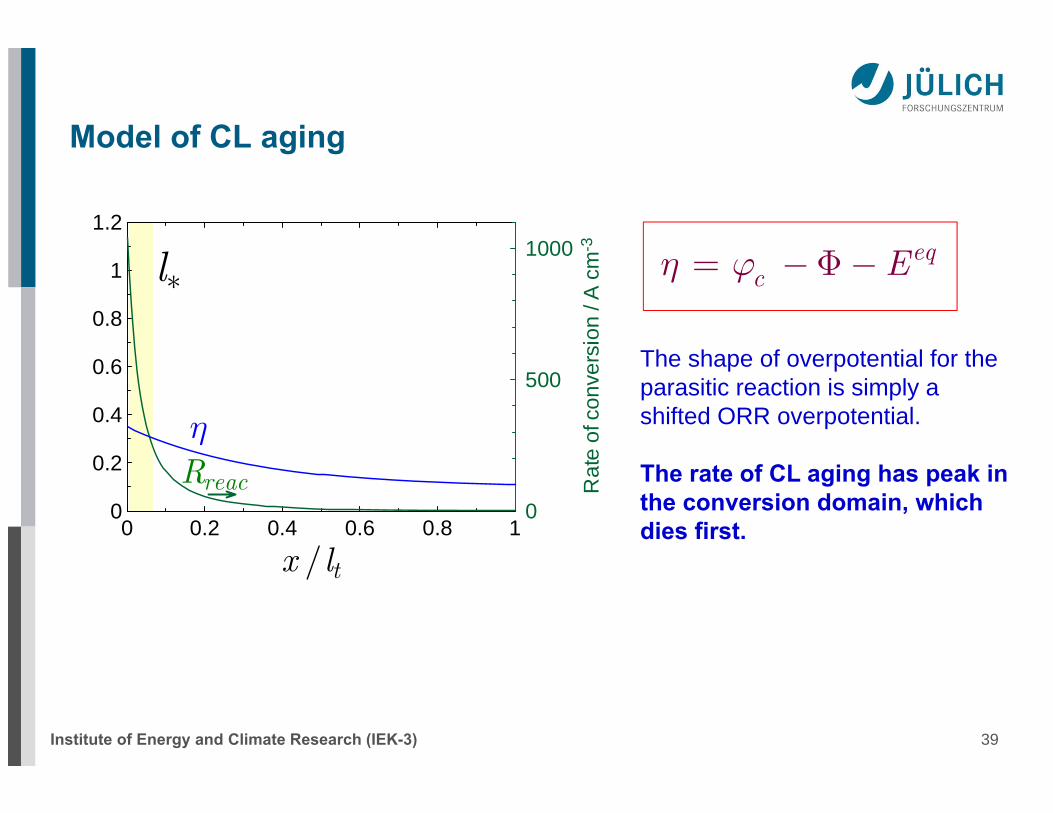
Model of CL aging
reacR
/ tx l
l*
The shape of overpotential for the parasitic reaction is simply a shifted ORR overpotential.
The rate of CL aging has peak in the conversion domain, which dies first.
h
eqc Eh j= -F -

Institute of Energy and Climate Research (IEK-3) 40
Degradation wave
0 0.2 0.4 0.6 0.8 10
50
100
150
200
OR
R ra
te /
A c
m-3
1 2 3Degradation wave
4
5l*
Gas
-diff
usio
n la
yer
/ tx l
When the conversion domain is dead, the ORR/poisoning peak shifts toward the GDL and a new domain is subject to aging.
Institute of Energy and Climate Research (IEK-3) 41
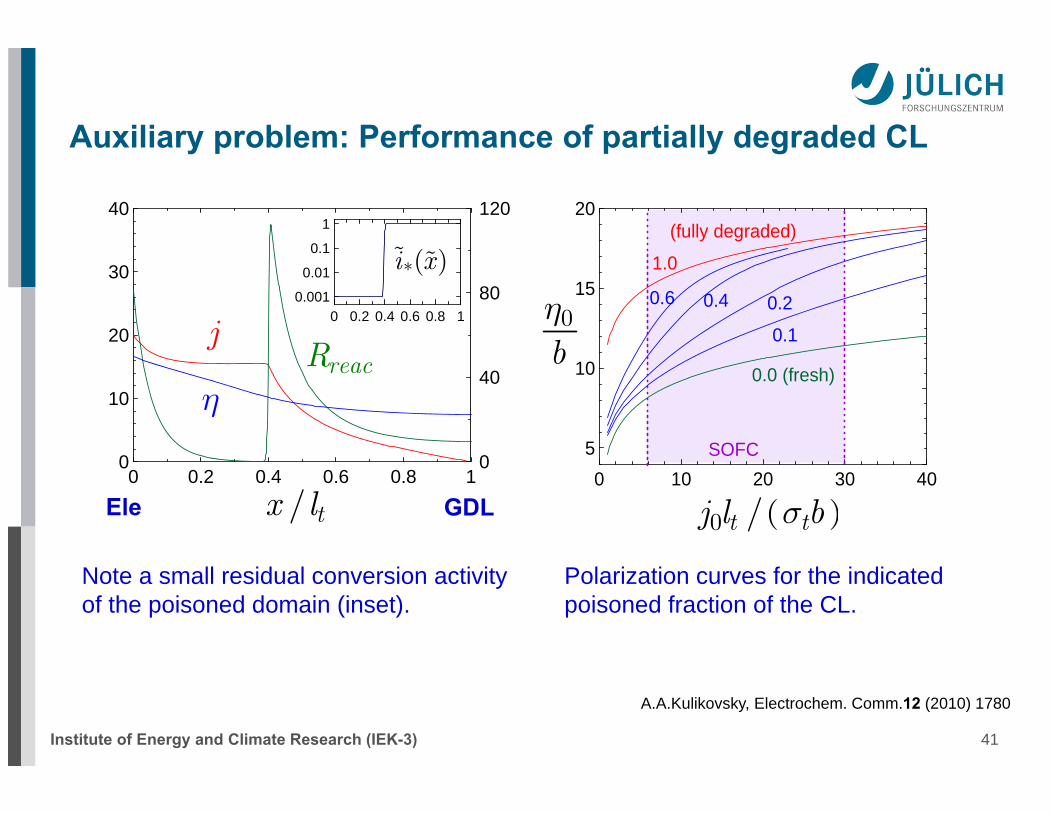
Auxiliary problem: Performance of partially degraded CL
Note a small residual conversion activity of the poisoned domain (inset).
0 0.2 0.4 0.6 0.8 10
10
20
30
40
0
40
80
120
0 0.2 0.4 0.6 0.8 10.001
0.01
0.1
1
jreacR
h
( )i x*
/ tx l
A.A.Kulikovsky, Electrochem. Comm.12 (2010) 1780
0 10 20 30 405
10
15
20
0.20.40.6
0.0 (fresh)
(fully degraded)
0.1
1.0
SOFC
( )0 /t tj l bs
0
bh
Polarization curves for the indicated poisoned fraction of the CL.
GDLEle

Institute of Energy and Climate Research (IEK-3) 42
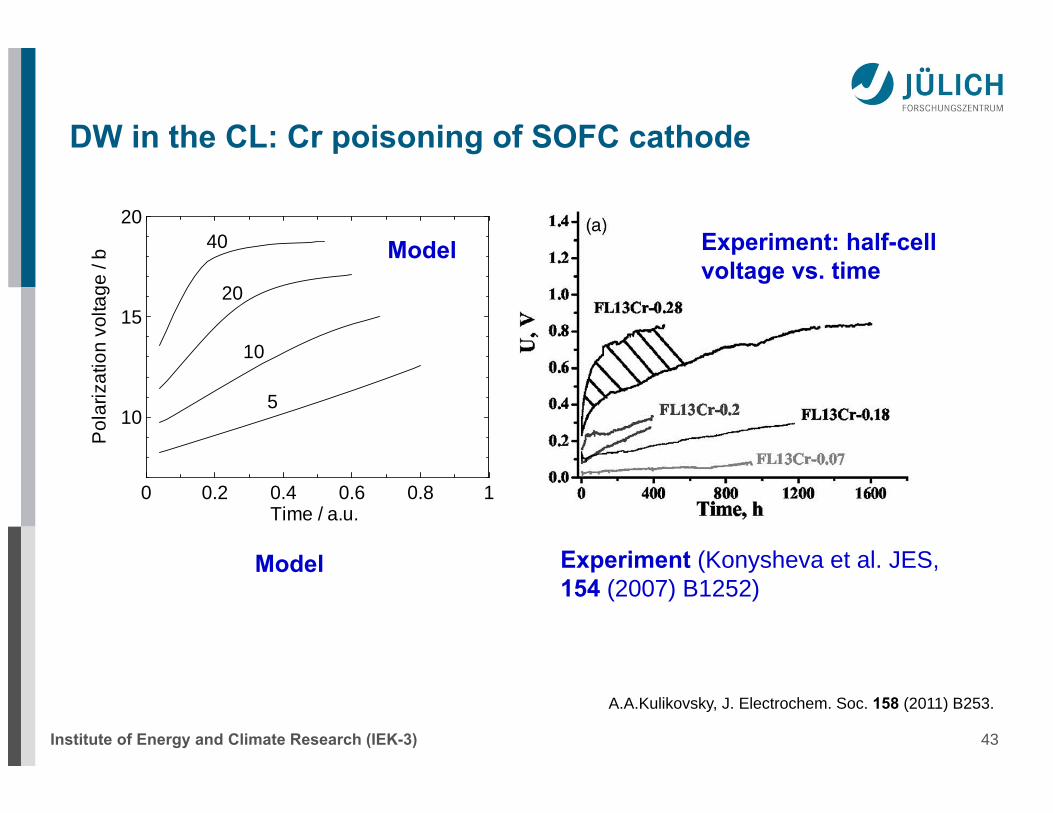
DW in the CL: Cr poisoning of SOFC cathode
A.A.Kulikovsky, J. Electrochem. Soc. 158 (2011) B253.
Cathode polarization voltage vs. time for different cell currents, model
0 0.2 0.4 0.6 0.8 1Time / a.u.
10
15
20
Pol
ariz
atio
n vo
ltage
/ b
10
20
40
5
Model
0 10 20 30 405
10
15
20
0.20.40.6
0.0 (fresh)
(fully degraded)
0.1
1.0
SOFC
( )0 /t tj l bs
0
bh
Institute of Energy and Climate Research (IEK-3) 43
DW in the CL: Cr poisoning of SOFC cathode
A.A.Kulikovsky, J. Electrochem. Soc. 158 (2011) B253.
Model
0 0.2 0.4 0.6 0.8 1Time / a.u.
10
15
20
Pol
ariz
atio
n vo
ltage
/ b
10
20
40
5
Experiment (Konysheva et al. JES, 154 (2007) B1252)
Model Experiment: half-cell voltage vs. time
Institute of Energy and Climate Research (IEK-3) 44
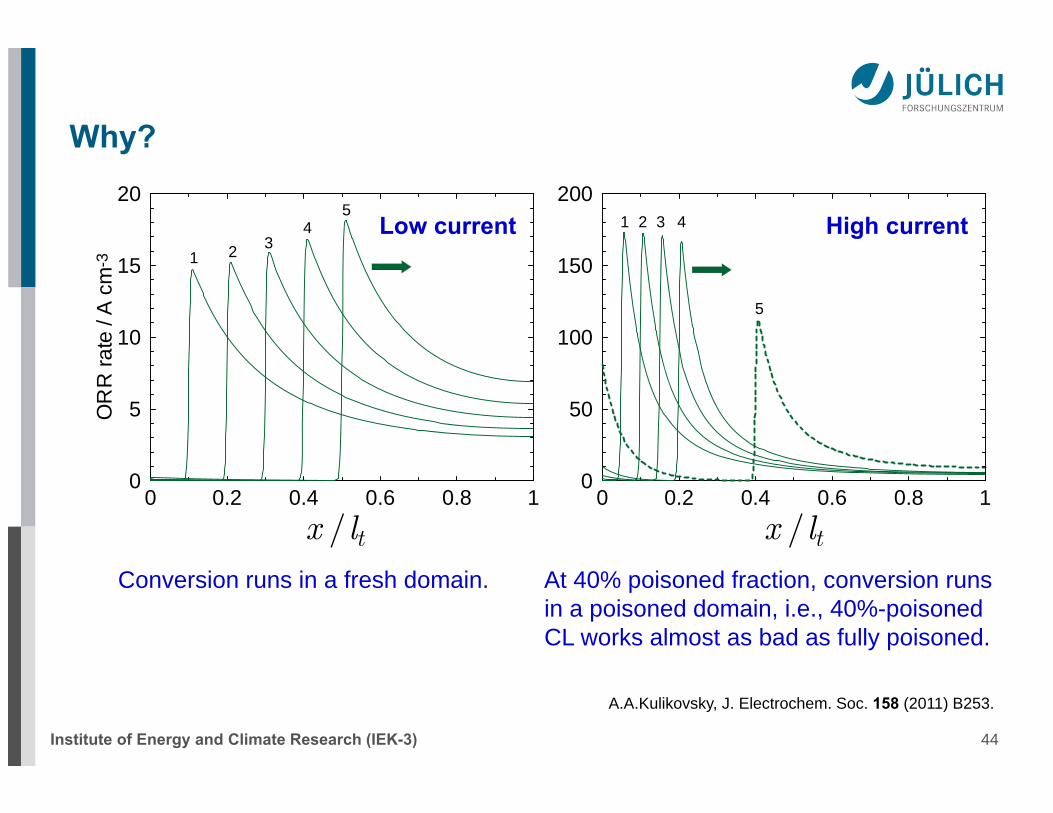
Why?
A.A.Kulikovsky, J. Electrochem. Soc. 158 (2011) B253.
0 0.2 0.4 0.6 0.8 10
50
100
150
2001 2 3 4
5
0 0.2 0.4 0.6 0.8 10
5
10
15
20
OR
R ra
te /
A c
m-3 1 2 3
45
/ tx l / tx l
Low current High current
Conversion runs in a fresh domain. At 40% poisoned fraction, conversion runs in a poisoned domain, i.e., 40%-poisoned CL works almost as bad as fully poisoned.

Institute of Energy and Climate Research (IEK-3) 45
Cr distribution in the FL
J.A.Schuler, P.Tanasini, A.Hessler-Wyser, C.Comninellis, J. Van herleEleComm, 12 (2010) 1682–1685

Institute of Energy and Climate Research (IEK-3) 46
Experimental cell voltage vs. time (A.Schuler and J. van Herle, Lausanne Univ.)
Time / hours
Cel
l vol
tage
/ V
450 mA/cm2
600 mA/cm2
750 mA/cm2
300 mA/cm2
0
1lifet j
Model:

Institute of Energy and Climate Research (IEK-3) 47
0.01 0.1 1 10 100 10000.1
1
10
doub
le T
afel
trans
ition
Tafel
linear
0.01 0.1 1 10 100 10000.01
0.1
1
10
linear double Tafeltrans
ition
Polarization curves
0je0je
0h
10e = 0.1e =
( )02 ln je
( )20ln 2 je
( )02 ln je
0je
A.A.Kulikovsky, Electrochim. Acta 55 (2010) 6391.
20je
To prevent fast Cr deposition, the ionic conductivity of the FL should be large.

Institute of Energy and Climate Research (IEK-3) 48
Conclusions
• Macroscopic equations suggest the general scenarios of cell performance degradation
• Fuel cell never die uniformly. Some domains of the cell are stressed more and they die first. This simple idea leads to various aging waves in cells.
• In a stack environment, more degradation waves are possible…
0 0.2 0.4 0.6 0.8 10
50
100
150
200
OR
R ra
te /
A cm
-3
1 2 3Degradation wave
4
5l*
Gas
-diff
usio
n la
yer
/ tx l