Embed Size (px)
Citation preview

WUSTL DBBS - Bio 5357 VMD: molecular visualization and analysis
Macromolecular Visualization: VMDAuthor: Alex Holehouse ([email protected])
This document is an accompaniment to the one created by Dr. Henzler-Wildman (the previous course master forBio5357) for the first discussion section of the course. It is meant to act as a quickstart guide to VMD, giving youenough background to understand how the program works works and how to use it for a range of visual and functionaluses, without being a 200 page handbook. If anything is unclear or you have any questions feel free to email me [email protected], or check out the end of this document for links to some other relevant resources.
During the VMD tutorial session, this guide is not going to be covered page-by-page, but it will serve as a standalone reference for the tutorial contents. Check the version number in the bottom left corner - updates will lead tothe version number being incremented, so you can ensure you have the most up-to-date version.
This is version 1.3 of this document, last updated in August 2015.
Introduction
Molecular viewers allow you to visualize and analyze protein structures - such as those downloadable from the pro-tein data bank (PDB) and trajectory information from molecular simulations. There are several different viewersavailable, such as PyMol, rasmol, and VMD.
Given the various options, what makes VMD stand out from the rest?
• VMD has a sensible interface
• VMD is flexible
• VMD makes things pretty
• VMD can do analysis as well as visualization
• VMD can deal with a wide range of file types
• VMD is super easy to install on basically any operating system (OSX/Windows/Linux/FreeBSD)
In this guide I’m going to give an initial overview of the things VMD can do. No background in computing or usingvisualizers is going to be assumed. The idea is that this document will act as a general guide for future work, and helppoint you in relevant and useful directions. I wrote this introduction because the VMD documentation is (generallyspeaking) either very verbose or too terse. There’s lots of information available online, and given VMD’s flexibilitythere are definitely resources to help you achieve basically any kind of analysis or visualization style. However, oftenyou don’t want to read a whole user guide just to get the basics, so this document should get you to a stage whereyou can create nice images for publication, and should, hopefully, be self contained.
Contact
If you have further questions, spot a mistake or wish something else were included, drop me an email [email protected]. This material will be hosted at http://pappulab.wustl.edu/~alex/vmdguide.html
for as long as I’m with in the Pappu lab.
Getting VMD
To download and install VMD please go to the following website;
http://www.ks.uiuc.edu/Development/Download/download.cgi?PackageName=VMD
As of the date of writing, the most recent and recommend version of VMD available is 1.9.2. To install on OSX orWindows, select the OpenGL 32-bit binaries. If you’re graphics card can support CUDA (many recent NVIDIA cards)then I’d recommend trying the CUDA version. CUDA is a programming language specific to Nvidia graphics cardsand provides superior performance for graphics-intensive processes (among other things). If you’re unsure whether ornot your computer supports CUDA you can always try - worst case scenario is it doesn’t work! If you want to check,take a look at the following information provided by Nvidia (https://developer.nvidia.com/cuda-gpus)
v1.3 Page 1 of 17

WUSTL DBBS - Bio 5357 VMD: molecular visualization and analysis
IMPORTANT: DON’T install two different versions of VMD at the same time! If you try the CUDA versionand it doesn’t work uninstall it before installing the non-CUDA version.
To be explicit - Windows users should install one of the two following versions;
• Windows OpenGL, CUDA (Windows XP/Vista/7/8 (32-bit) with OpenGL and CUDA)
• Windows OpenGL (Microsoft Windows XP/Vista/7/8 (32-bit) using OpenGL)
While OSX users should try one of the following;
• MacOS X OpenGL, CUDA (32-bit Intel x86) (Apple MacOS-X 10.5.x or later with CUDA)
• MacOS X OpenGL (32-bit Intel x86) (Apple MacOS-X (10.4.7 or later) with hardware OpenGL (native bundle))
If you have an older version of OSX you’ll need to try an older version of VMD.
If you’re a Linux user you get the 64-bit version! I’m going to assume that if you’re running Linux you can figurehow to install VMD...
Once you have VMD installed you can move on to the next section.
Types of data
Before we get started, it’s worth thinking about the two main types of data you can use a molecular viewer to look at.
The first is a static structure, such as a protein conformation from a PBD file which has a single crystal structurein it. Unless you’re working with NMR data or in computational biophysics, it’s likely this will be the only way youinteract with VMD. Such structures are a 3D representation, and it’s possible to carry out a many different types ofanalysis on such a structure, as well as a represent it in a wide range of visualization styles. For example, say youwant to determine where in a protein’s structure a specific amino acid is, you could load up a PDB file an get a senseof the 3D context associated with that amino acid. There are also many different ways you could visualize a protein- some of which are shown in the figure below).
Examples of possible styles which can be used to render a protein structure. In all four cases we’re showing theprotein lysozyme
The second type of data is a dynamic dataset, which basically can be thought of as a bunch of PDB files made intoa video, flip-book style. Each frame in this flip-book acts as a separate set of coordinates, and you can ”play” thisflipbook to watch how those coordinates change in time. The way you visualize this dynamic structure is identicalto how you look at a static structure. Dynamic data often comes from the output of molecular simulations (e.g.Molecular Dynamics or Monte Carlo simulations), or from structural ensembles derived from NMR data. As well asthe visualization of a dynamic dataset (e.g. see below), VMD can be used to carry out analysis of trajectory files,either using built in tools, or by writing stand alone analysis scripts which can be executed by VMD. It’s this flexibilitythat makes VMD such a powerful software package.
v1.3 Page 2 of 17
WUSTL DBBS - Bio 5357 VMD: molecular visualization and analysis
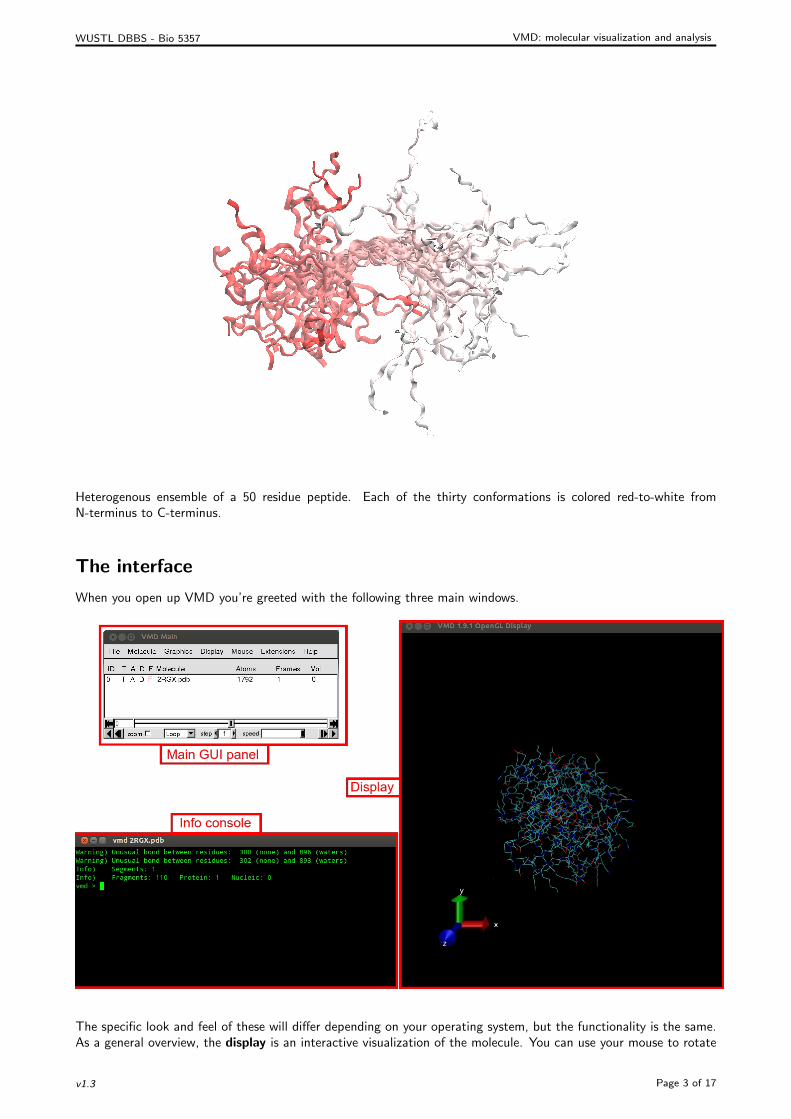
Heterogenous ensemble of a 50 residue peptide. Each of the thirty conformations is colored red-to-white fromN-terminus to C-terminus.
The interface
When you open up VMD you’re greeted with the following three main windows.
The specific look and feel of these will differ depending on your operating system, but the functionality is the same.As a general overview, the display is an interactive visualization of the molecule. You can use your mouse to rotate
v1.3 Page 3 of 17

WUSTL DBBS - Bio 5357 VMD: molecular visualization and analysis
and translate (move) the molecule around, as well as zoom in and out. The main GUI panel gives access to how themolecule looks and behaves. You can alter the representation, change colours, show only specific regions, highlightspecific residues and so on. You can also perform structural analysis, with plugins which are integrated directly intoVMD, although we won’t focus too much on that in this guide. Finally, the info console provides textual outputwhich can be extremely useful when you’re trying to understand a structure or find a specific residue.
Main GUI panel
This is the primary control panel - it provides the GUI (graphical user interface) for visualization and analysis. The topmenus (File, Molecule, etc.) provide access to all the functionality you need. Any functionality in these GUI menuscan be replicated on the command line through the info console in some way, although its often more complicatedto use the command line than the GUI (we won’t cover command-line manipulation in this guide).
The summary window contains information about each PDB you’ve loaded. Generally speaking, you only load onePDB file at a time. You could load multiple proteins, perhaps to think about how they might interact, but again thatis outside the scope of this introduction. The four highlighted boxes are really only relevant when there are multipleproteins, but I’ve included their definitions for completeness;
• TOP - this essentially defines the ’default’ molecule - there can only be one TOP molecule
• ACTIVE - this defines which molecules undergo animations (animations are beyond the scope of this intro)
• DRAWN - defines which molecules are actually being displayed (makes hiding a single molecule very easy)
• FIXED - defines if a molecule should stay fixed and not undergo any rotation or translation - i.e. if this becomesactive (black) and you try and rotate the molecule it’ll just stay fixed
As for the other columns, Molecule gives the name of the molecule, which defaults to the PDB file name, althoughyou can rename it by double clicking on the field. Atoms gives the number of atoms in the PDB file. Frames isthe number of frames - for a static PDF this is just 1, but for dynamic data-sets this will be greater than 1. Thebottom section actually provides control over how you move through a dynamic dataset. There is a ”play” buttonin the bottom right, as well as in the bottom left (for reverse playing). You can also define the speed at which thetrajectory frames are moved through, or step through each frame one at a time.
v1.3 Page 4 of 17

WUSTL DBBS - Bio 5357 VMD: molecular visualization and analysis
File menu
The file menu lets you open PDB files, load previously saved visualizations, and generated publication quality images.
• New Molecule lets you open a new PDB (or any other ap-propriate file)
• Load Data Into Molecule lets you load a trajectory into aPDB file (not covered here)
• Save coordinates is useful for dynamic data-sets, as it letsyou make a PDB out of a specific frame. This can be veryuseful when working with long trajectories
• Load Visualization State and Save Visualization State
let you load and save the nice visual representations you’vecreated
• Render lets you create (high quality) images for publicationor talks (we’ll cover this in some detail in just a second)
• The logging commands are beyond the scope of this introduc-tion
• Save coordinates is useful for dynamic data-sets, as it letsyou make a PDB out of a specific frame. This can be veryuseful when working with long trajectories
• Quit will quit the program
File menu → Render
Rendering is the process of generating a nice, composite image from the main display. VMD comes with some externalprograms for rendering (notably Tachyon), so when you render you’re actually calling these programs - they’re notreally part of VMD, but they’re bundled with VMD. When you click render the following screen is brought up
Despite the range of renderers, you only really need two of the renderers (click on “Render the current scene using”)for a list. Snapshot is quick and generates smaller, lower quality images, while Tachyon creates larger, high resolutionimages. Tachyon is an external rendering engine, so when you select it VMD automatically generates the commandneeded to call this external program. You can leave these commands as is, but you may want to add -res xxx yyy
to Tachyon the resolution of the image you’re creating. On a Linux system, the full command then becomes;
"/usr/local/lib/vmd/tachyon_LINUXAMD64" -aasamples 12 %s -res 2800 1500 -format TARGA -o %s.tga
While when using OSX it’s;
"/Applications/VMD 1.9.1.app/Contents/vmd/tachyon_MACOSXX86" -aasamples 12 %s -res 2800 1500
-format TARGA -o %s.tga
Note here the linebreak is only so the command fits on the page of this guide!.
v1.3 Page 5 of 17

WUSTL DBBS - Bio 5357 VMD: molecular visualization and analysis
Finally, on a Windows machine this command is
"C:\Program Files (x86)\U o I\VMD\\tachyon_WIN32.exe" -aasamples 12 %s -res 2800 1500 -format BMP -o %s.bmp
To be clear - the majority of this command in all three cases is auto-generated when you select "Tachyon". All I’vedone here is type out the contents of this auto-generated command (which appears in the Render Command box inthe image above), and added "-res 2800 1500" to define the resolution.
I’ve done this to explains why there’s no "Image resolution" button or similar in VMD - the renderer (Tachyon) isexternal, so you have to pass Tachyon additional options if you want to set things like resolution. The big differencebetween Linux/OSX and Windows here is that windows uses the BMP file format, while Linux uses TGA .There are a bunch of other things you can do to make your images look nice (like lighting, depth cueing, ambientocclusion etc.) which I’m not going to get into here. Basically, experiment, try different things and use the greatGoogle.
Step-by-step guide for making high resolution figures
In previous years this has been the section that people have struggled with the most, so in the interest of clarity I’veadded an explicit step-by-step guide for creating high resolution figures.
1. Create a visually pleasing representation of your protein (covered in the next section)
2. Once the display shows your protein in the arrangement you want, select File menu → Render
3. Select ’Tachyon’ as the renderer to use
4. At this point the render box should look like this (note the auto generated text in the Render Command field
v1.3 Page 6 of 17
WUSTL DBBS - Bio 5357 VMD: molecular visualization and analysis
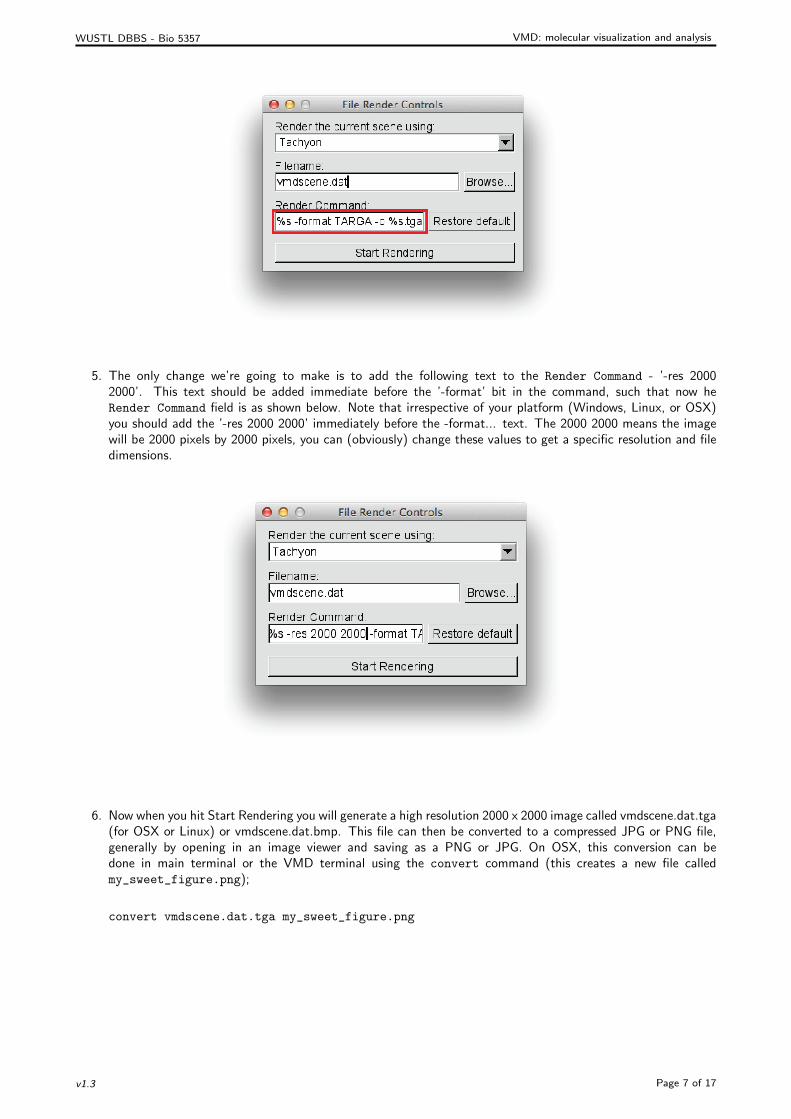
5. The only change we’re going to make is to add the following text to the Render Command - ’-res 20002000’. This text should be added immediate before the ’-format’ bit in the command, such that now heRender Command field is as shown below. Note that irrespective of your platform (Windows, Linux, or OSX)you should add the ’-res 2000 2000’ immediately before the -format... text. The 2000 2000 means the imagewill be 2000 pixels by 2000 pixels, you can (obviously) change these values to get a specific resolution and filedimensions.
6. Now when you hit Start Rendering you will generate a high resolution 2000 x 2000 image called vmdscene.dat.tga(for OSX or Linux) or vmdscene.dat.bmp. This file can then be converted to a compressed JPG or PNG file,generally by opening in an image viewer and saving as a PNG or JPG. On OSX, this conversion can bedone in main terminal or the VMD terminal using the convert command (this creates a new file calledmy_sweet_figure.png);
convert vmdscene.dat.tga my_sweet_figure.png
v1.3 Page 7 of 17

WUSTL DBBS - Bio 5357 VMD: molecular visualization and analysis
Molecule menu
I’m not going to go into detail, but this menu provides ways to control the parameters I discussed in summary window
(Top, Active, Draw etc.). If you have multiple molecules, highlight one (by clicking on it in the summary window),and then any changes you make here will be applied to that highlighted molecule. You can also make these changesby right clicking on the molecule row in the summary window.
Graphics menu
This is the menu which lets you define the visual representation of your protein - i.e. highlight specific regions, definehow secondary structure is shown, etc.
We’re not going to worry about Colors, Materials, Lables or Tools right now.
Colors and Materials let you create and customize certain aspects of the visualization defaults, but VMD comeswith a more than plentiful selection of defaults to get started with. The one thing you may want to do is change thebackground color, which can be achieved through Graphics → Colors... → Display → Background and thenselecting the color of interest.
Tools lets you create tools for manipulating molecules, and Labels lets you customize protein labels (which can bevery useful). However, Representations is really the main tool used in VMD for controlling how an image looks.
Graphics menu → Representations
Representations are basically a drawing style (or drawing method) applied to some selection of atoms in your molecule.By default when you load a PDB, the representation of lines is applied to all the atoms (as shown in the displaywindow on page 3). However, to create nice images you do three main things
• Create multiple representations (i.e. define which atoms are selected)
• Apply representations to different groups of atoms
• Apply different drawing properties (color and texture) to each representation
The representation is as follows;This should be pretty self explanatory - a couple of things worth elaborating on
• Atom selection is done through a pretty complete logical language - we’ll cover the intro to what this meansin the next section
• General properties are those which apply to every drawing method
– Coloring method defines how the drawing method is colored. Color by type? By residue ID? By atom?
– Material defines what type of material the drawing method is made from - is it shiny? Diffuse? Trans-parent?
– The drawing method is a list of different representations such as VDW (Van Der Wall spheres), Cartoon(secondary structure cartoons), surf (accessible surface area) etc.
• Custom properties are those which apply to a specific drawing method - for example with lines you can controlline thickness but not a whole lot more
Rather than going through the drawing styles here, it’s better to just have you play with styles applied to "all atoms"
to get a feel of what they behave like.
v1.3 Page 8 of 17

WUSTL DBBS - Bio 5357 VMD: molecular visualization and analysis
Atom selection language
The selection language allows you to define which atoms or residues are selected for a given representation. Themain VMD guide gives the following examples, to which I’ve added some comments to help explain
• name CA
– name defines an atoms name
– Side chain carbon atoms are CA (alpha) CB (beta) and so on
– So this selects all the alpha carbon atoms in your molecule
• resid 35
– resid refers to the residue position as numbered in the PDB file
– This does not necessarily guarentee uniqueness - i.e. if you had two chains, both of which has a 35thresidue, resid would select both of these amino acids
– resid numbering is soely determined by the PDB structure information (i.e. what the number in thePDB file actually says, not it’s position). For example, say our crystal structure started from residue 20 inthe protein sequence (the crystallographer had to cut off the N-terminus, as is common), then the PDBfile may start its resid number at 20. So a selection of resid 14 would not select anything.
• residue 35
– residue refers to the residue number as generated when the PDB was read in
– This does guarentee uniqueness.
– Note that residue numbers from 0, and there will not be gaps
• index 301
– Index is to atoms as residue is to amino acids
– The index is a unique number for each atom in your PDB file
v1.3 Page 9 of 17

WUSTL DBBS - Bio 5357 VMD: molecular visualization and analysis
• residue 35 to 45
– The to operator defines a range
– So this will select all the residues with residue between 35 and 45
• name CA and resname ALA
– Now things get interesting - here we’re using a boolean operator (and) to seect from atoms which haveboth name CA and also have a resname of ALA
– resname defines the residue names, and uses three letter codes for amino acids
– So this command is selecting for all the alpha carbons in Alanine residues only
• backbone
– VMD has a bunch of smart keywords, like backbone, protein, water and nucleic are some commonexamples
• not protein
– Now we add another boolean operator, not
– So this selects everything which is not part of a protein molecule
– This is often a good sanity check to make sure there’s nothing weird in your PDB, and find water molecules
• protein (backbone or name H)
– Parenthesis provide a means to execute some inner selection, from which you then make an additionselection
– So here we first select atoms which are either backbone or have the name H. From this subsection, we selectonly the atoms which also match the protein keyword - i.e. we get backbone and all the protein-boundhydrogen atoms
• name "C*"
– Double quotes are powerful because they let us introduce patterning matching expressions
– In the context of double quotes (” ”) an asterisk means ”match any character which comes after”. So inthis example we’re saying, ”let’s match every atom which has a name beginning with the letter C followedby one or more characters of any type”
• name "C."
– Like the asterisk in double quotes, the period here also has a special meaning (again, because it’s indouble quotes).
– A little like the asterisk, it means, ”let’s match between 0 and 1 occurrences of any character after theC”. For example, this would match ”C” and ”CA” and ”CZ” but would not match ”CE2”.
– In contrast, ”C*” would match ”CE2” and ”CE” but would not match ”C”
• name ’A *’
– Unlike double quotes single quotes literally mean to match what’s contained in the quotes
– So here we select the atoms which have the name ’A *’ - i.e. explicitly an A followed by an asterisk. Thiswould be an extremely weird name for an atom...
• mass < 5
– You can also carry out dynamic calculations for your selection rules
– This selects all atoms with a mass less than 5
• numbonds = 2
– This selects atoms which have exactly 2 bonds coming out of them
• abs(charge) > 1
– This selects atoms where the absolute charge is greater than 1
v1.3 Page 10 of 17

WUSTL DBBS - Bio 5357 VMD: molecular visualization and analysis
• x < 6 and x > 3
– x, y and z are keywords referring to coordinates
– So this selects for a specific region of space
– You can imagine selecting for a box using a combination of all three geometric vectors
• sqr(x-5)+sqr(y+4)+sqr(z) > sqr(5)
– VMD even has some mathematical functions built in
• within 5 of resname TYR
– within is a supercool keyword
– It defines any residues within some number of Angstroms in any direction of a selection
– This can be super useful for showing structural regions
• same resname as (protein within 5 of nucleic)
– Now we get really fancy
– So same allows you to match some other selection
– So here we first do the stuff in parenthesis, which generates a selection
– Then we say, “OK, let’s select all the residues which have the same resname as anything in our initialinner selection”
• protein sequence ”C..C”
– Finally, the sequence keyword allows you to select a specific protein motif, where ’.’ acts as a wildcard
– Note that here the double quotes means this is actually a regular expression (so ’.’ is evaluated to a wildcard
– If we’d used single quotes we’d be looking for a sequence with residue names of ’.’ which doesn’t reallymake sense
The most informative way to get a sense of the VMD graphical styles is by playing around with a PDB file andcreating a range of different representations. Be aware that once graphic styles are rendered they can look subtlydifferent (generally better) to how they look in the VMD display.
v1.3 Page 11 of 17

WUSTL DBBS - Bio 5357 VMD: molecular visualization and analysis
Display
This menu contains a bunch of options which define how the protein is displayed in a global sense, as opposed tothe drawing style of the protein itself. The range of different options are summarized below;
From this, things you might actually use are as follows;
• To turn off the ugly 3D arrow you do Axes → Off
• Two important modifiers for how the molecule looks are Perspective vs Orthographic viewing modes andDepth Cueing. Try messing around with these to get a sense of what they do
• Reset view resets the position, rotation, and a bunch of other things to their default. Useful if you want totry something new after creating one image.
Mouse
The mouse menu (shockingly) allows you to define the behaviour of the mouse. There are three main modeswhich define how the mouse affects your molecule’s geometric representation (rotate, translate and scale (AKAzoom). There are an additional number modes which define what the act of selecting a specific atom or residue does.Center sets the center of mass for rotation operations, and Query allows you to get information about a residue inthe Console simply by clicking on it. The Console is the text based black box which appears when you start VMD- and querying can often be extremely useful.
Mouse → Query
When you’re in query mode, clicking on an atom prints out a bunch of information about it in the console. As anexample of what this information may look like - see below;Info) molecule id: 0
Info) trajectory frame: 0
Info) name: CA
Info) type: CA
Info) index: 1434
Info) residue: 180
Info) resname: ILE
Info) resid: 181
Info) chain: A
Info) segname:
Info) x: 3.855000
Info) y: -12.595000
Info) z: 25.479000
v1.3 Page 12 of 17

WUSTL DBBS - Bio 5357 VMD: molecular visualization and analysis
Mouse → Label
Allows you add labels onto atoms, bonds and residues. To manipulate labels further, and to delete them Graphics
→ Labels option can be used. Note that ”bonds” refers to the straight line between any two residues, so can beused to measure distances.
Mouse → Move/Force
These options let you manipulate the actual atomic coordinates. It’s pretty rare that you’d want to do this, and ifyou changed the coordinates and then created and published an image you could be accused of fraud, so it’s bestnot to mess with these options. However, they can provide useful insight when playing thought experiments (i.e. “Ifresidue X were over here how would this affect the backbone”). Of course, when you move atoms or residues, youdon’t then find the lowest energy configuration, so this could be highly misleading.
Extensions
I’m not even going into the extensions menu, but this is really where the analytical power of VMD comes in. Thereare a bunch of extensions to do various things. For each one, your best bet is to read the specific documentation.Examples I’ve actually used include
• Analysis → Sequence viewer - view the protein sequence
• Analysis → Salt Bridges - find all salt bridges in your protein (and get their length)
• Analysis → RMSD calculator - calculate the minimal RMSD between two molecules
• Analysis → RMSD Trajectory Tool - for simulations, this lets you calculate the RMSD of some region ofyour protein accross the simulation, or align regions of the protein across all frames (this is especially as itremoves translational/rotational movement, letting you focus on the protein’s conformational changes)
It’s definitely worth your time to go through and try and figure out what some of these do, even just by guessingbased on the name. I’ve included a list of the built-in extensions and a brief description at the end of this documentfor quick reference/review.
v1.3 Page 13 of 17
WUSTL DBBS - Bio 5357 VMD: molecular visualization and analysis
Learning by example
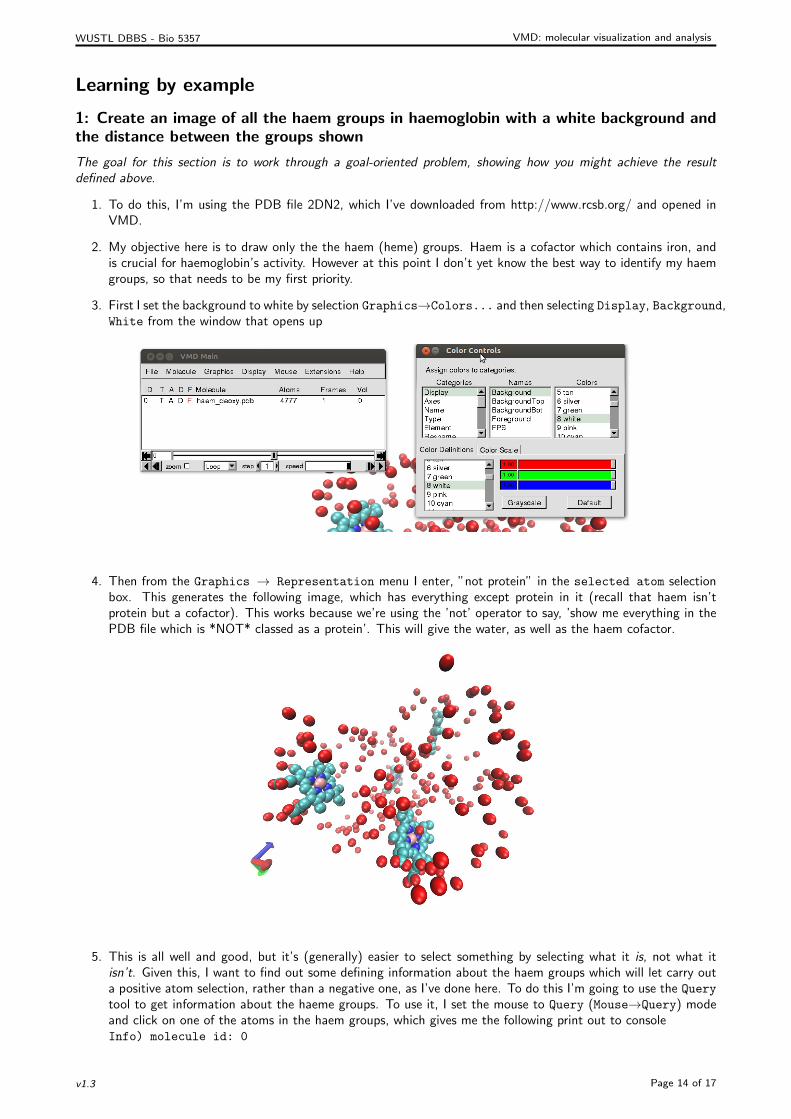
1: Create an image of all the haem groups in haemoglobin with a white background andthe distance between the groups shown
The goal for this section is to work through a goal-oriented problem, showing how you might achieve the resultdefined above.
1. To do this, I’m using the PDB file 2DN2, which I’ve downloaded from http://www.rcsb.org/ and opened inVMD.
2. My objective here is to draw only the the haem (heme) groups. Haem is a cofactor which contains iron, andis crucial for haemoglobin’s activity. However at this point I don’t yet know the best way to identify my haemgroups, so that needs to be my first priority.
3. First I set the background to white by selection Graphics→Colors... and then selecting Display, Background,White from the window that opens up
4. Then from the Graphics → Representation menu I enter, ”not protein” in the selected atom selectionbox. This generates the following image, which has everything except protein in it (recall that haem isn’tprotein but a cofactor). This works because we’re using the ’not’ operator to say, ’show me everything in thePDB file which is *NOT* classed as a protein’. This will give the water, as well as the haem cofactor.
5. This is all well and good, but it’s (generally) easier to select something by selecting what it is, not what itisn’t. Given this, I want to find out some defining information about the haem groups which will let carry outa positive atom selection, rather than a negative one, as I’ve done here. To do this I’m going to use the Query
tool to get information about the haeme groups. To use it, I set the mouse to Query (Mouse→Query) modeand click on one of the atoms in the haem groups, which gives me the following print out to consoleInfo) molecule id: 0
v1.3 Page 14 of 17
WUSTL DBBS - Bio 5357 VMD: molecular visualization and analysis
Info) trajectory frame: 0
Info) name: CHD
Info) type: CHD
Info) index: 4517
Info) residue: 577
Info) resname: HEM
Info) resid: 147
Info) chain: D
Info) segname:
Info) x: 0.008000
Info) y: 7.624000
Info) z: 22.747000
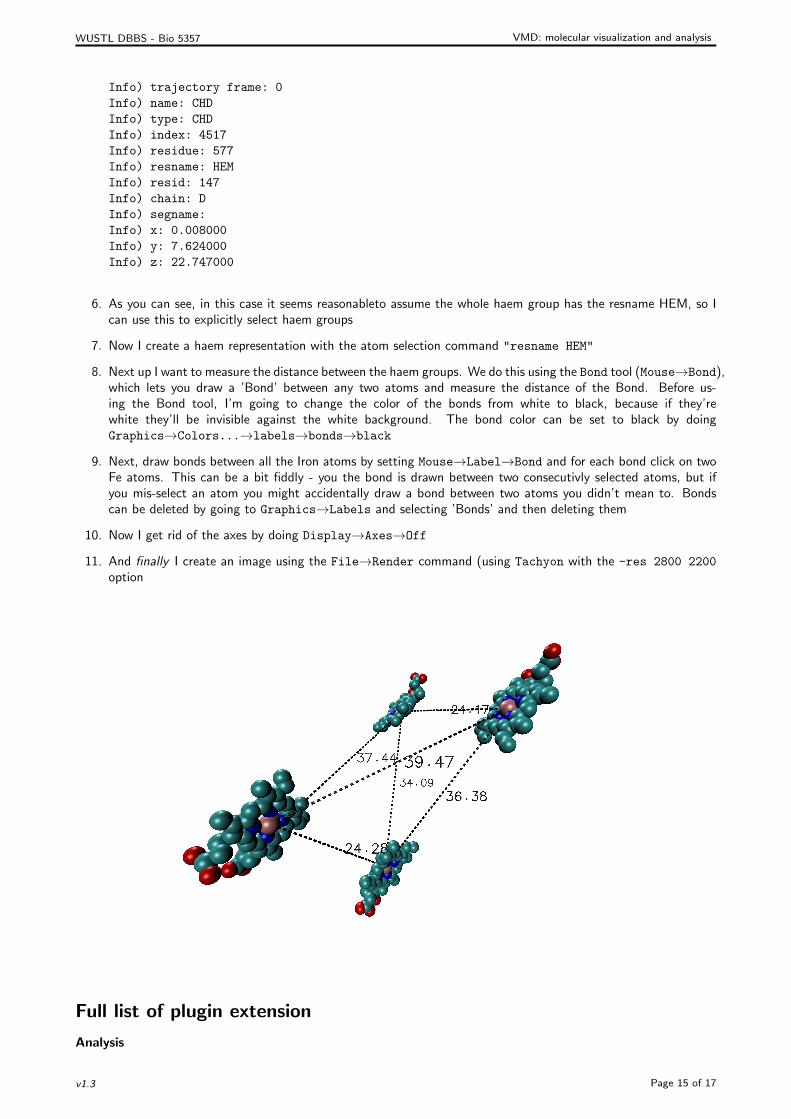
6. As you can see, in this case it seems reasonableto assume the whole haem group has the resname HEM, so Ican use this to explicitly select haem groups
7. Now I create a haem representation with the atom selection command "resname HEM"
8. Next up I want to measure the distance between the haem groups. We do this using the Bond tool (Mouse→Bond),which lets you draw a ’Bond’ between any two atoms and measure the distance of the Bond. Before us-ing the Bond tool, I’m going to change the color of the bonds from white to black, because if they’rewhite they’ll be invisible against the white background. The bond color can be set to black by doingGraphics→Colors...→labels→bonds→black
9. Next, draw bonds between all the Iron atoms by setting Mouse→Label→Bond and for each bond click on twoFe atoms. This can be a bit fiddly - you the bond is drawn between two consecutivly selected atoms, but ifyou mis-select an atom you might accidentally draw a bond between two atoms you didn’t mean to. Bondscan be deleted by going to Graphics→Labels and selecting ’Bonds’ and then deleting them
10. Now I get rid of the axes by doing Display→Axes→Off
11. And finally I create an image using the File→Render command (using Tachyon with the -res 2800 2200
option
Full list of plugin extension
Analysis
v1.3 Page 15 of 17

WUSTL DBBS - Bio 5357 VMD: molecular visualization and analysis
• APBSRun Calculate electrostatic potentials using APBS
• CatDCD - Standalone trajectory processing program
• Contact Map - Plot a 2-d residue-residue distance map
• GofRGUI - Calculate and plot radial pair distribution functions g(r)
• HBonds - Counts the number of hydrogen bonds formed over a trajectory
• HeatMapper - Plot 2-D heat maps of 3-D values with a color scale bar
• ILSTools - Prepare and run Implicit Ligand Sampling (ILS) calculations
• IRSpecGUI - IR spectral density calculator
• MultiSeq - Perform multiple sequence and multiple structure alignments, display sequence data, phylogenetictrees, and much more.
• NAMD Energy - Evaluate interaction energies with NAMD
• NAMD Plot - Plot NAMD log files (energy/volume/...)
• NetworkView - View protein interaction networks
• NMWiz - Normal mode visualization and comparative analysis
• ParseFEP - Analyze NAMD free-energy purturbation (FEP) Simulations
• PMEpot - Particle Mesh Ewald potential map calculator
• PropKa GUI - graphical interface for PROPKA
• RamaPlot - Ramachandran plots for selected atoms
• RMSD Tool - Calculate RMSD values
• RMSD Trajectory Tool - Extended version of RMSD plugin for trajectories
• RMSD Visualizer Tool - Tool for aligning selections and measuring and plotting RMSD and RMSF values overtrajectories
• Salt Bridges - Find salt bridges throughout a trajectory
• Sequence Viewer - Browse sequences of loaded molecules
• Symmetry Tool - Determine the symmetry pointgroup of an atom selection and display the symmetry elements
• Timeline - Plot time-varying secondary structure
• VolMap - Graphical front-end for the VMD VolMap command
BioCoRE Collaboration Tools
• Chat - Chat with other BioCoRE users from within VMD
• Login - Login to BioCoRE from within VMD
• Shared VMD Views - Publish and view VMD states to/from other BioCoRE users
Data Importing and Plotting
• Data Import - Load per-residue values into the ”beta” column of a PDB file
Modelling
• AutoIonize - Add sodium or chlorine ions to a structure for simulation
• AutoPSF - Automatic PSF structure building tool
• Chirality - Detect and fix chirality errors in protein and nucleic acid structures
• Cispeptide - Detect, visualize, and fix cis peptide bonds in protein structures
v1.3 Page 16 of 17
WUSTL DBBS - Bio 5357 VMD: molecular visualization and analysis
• CGTools - Transform structures between coarse-grain and all-atom representations
• Dowser - Add water to a structure for simulation, using Dowser
• FFTK - Tool to aid users in the development of CHARMM-compatible force field parameters
• Inorganic Builder - Build inorganic structures
• MDFF - Flexibly fit atomic structures into density maps
• Membrane - Build POPC or POPE membranes
• MergeStructs - Merge multiple structures
• Molefacture - structure builder (used by paratool/autopsf/etc)
• Mutator - Mutate residues
• Nanotube - Build single-wall carbon nanotubes
• Paratool - Calculation of force field parameters
• Psfgen - Build structures for use with NAMD
• Solvate - Add water to a structure for simulation
• SSRestraints - Generate secondary structure restraints for use with NAMD
• Topotools - Manipulate topology related properties
Simulation
• AutoIMD - Setup and run Interactive Molecular Dynamics simulations
• IMDMenu - Monitor status of running Interactive Molecular Dynamics simulaions
• NAMD GUI - graphical interface for setting up and running NAMD jobs
• NAMD Server - an programming interface for starting NAMD in ”server mode”
• QMTool - Graphical interface for setting up QM jobs
Visualization
• Clipping Plane Tool - Clipping plane controls
• Clone Rep - Clone sets of representations
• Dipole Watcher - Animate selected dipole moments
• Intersurf - Display interaction surfaces between two groups of atoms
• Navigate - Keyboard camera navigation
• NavFly - Mouse-based flying camera navigation
• MultiMolAnim - Animation of multiple molcules or time-varying topologies
• Color Scale Bar - Draw a bar for the current color scale
• Remote - VMD phone/tablet remote control management interface
• Palette Tool - Display active colors and materials, for test rendering and printing
• ViewChangeRender - Easy-to-use camera flight movies
• Viewmaster - Manage sets of structure views within VMD
• Virtual DNA Viewer - Draw DNA representation from helical parameters
• VMDMovie - Create MPEG and AVI movies for presentations
v1.3 Page 17 of 17

![VMD Quantum Chemistry Visualization · PDF fileVMD quantum chemistry visualization 3 1. Introduction VMD [1] can be used to load files that contain quantum mechanics (QM) data such](https://img.dokumen.tips/doc/110x75/5a918b0f7f8b9a78648e7eb0/vmd-quantum-chemistry-visualization-quantum-chemistry-visualization-3-1-introduction.jpg)