Embed Size (px)
Citation preview

Estonian Journal of Ecology, 2008, 57, 1, 37�57 doi: 10.3176/eco.2008.1.03
37
Macroinvertebrates in Estonian streams: the
effects of habitat, season, and sampling effort on some common metrics of biological quality
Henn Timm!, Kristiina Mardi, and Tõnu Möls
Centre for Limnology, Institute of Agricultural and Environmental Sciences, Estonian University of Life Sciences, 61101 Rannu, Tartumaa, Estonia ! Corresponding author, [email protected] Received 5 April 2007 Abstract. According to the EU Water Framework Directive, benthic macroinvertebrates are considered a biological quality element required for typology and classification of the ecological status of fresh-waters. The effects of habitat, season, and sampling effort on three common quality metrics were studied in Estonian streams. More than 900 macroinvertebrate samples from minimally disturbed sites, collected in 1985�2002, were analysed. All metrics were significantly influenced by stream size, bottom substrate, flow velocity, and geographical location. The biological quality was the best 30�50 km from the stream source. The geographical distribution of the values of ASPT (mean sensitivity of a taxon) and DSFI (level of organic pollution) was markedly different from the geographical distribution of the values of NTAXA (taxa richness). All metrics also revealed lower quality for sandy than for stony bottom, and for low than for high flow velocity (except NTAXA). Unlike the other two metrics, ASPT did not depend on sampling season and depended much less on sampling method. Hence it could be recommended as a tool for transforming the biological quality derived from historical non-standard samples into modern terms. Key words: macroinvertebrates, streams, Estonia, biological quality.
INTRODUCTION
The Water Framework Directive (2002) established a framework for the European Community�s action in the field of water policy. The benthic macroinvertebrate fauna is considered a biological quality element required for typology and classifi-cation of the ecological status of surface waterbodies. According to the Directive, the obligatory typological factors for streams are ecoregion, altitude, latitude, longitude, size (based on the catchment area), and geology, to which several optional factors may be added (e.g. velocity and bottom substrate).
The effect of the catchment or the ecoregion on macroinvertebrate characteristics usually complements local habitat features (Feminella, 2000; Newall & Wells, 2000; Parsons et al., 2003; Weigel et al., 2003). Rabeni & Doisy (2000) found that sub-regionalization reduces unexplained variability and can therefore be recommended

H. Timm et al.
38
for use. Presumably, a tiered classification based on both reach-level and larger-scale landscape features is needed to accurately predict the composition of the freshwater fauna (Hawkins et al., 2000).
As altitude in the wide sense is not a significant factor for macroinvertebrates in Estonia (most of the territory belongs to the lowest altitude class, < 200 m a.s.l.), we will not discuss its influence in detail.
Stream size has a high classification strength for habitat and water chemistry classifications (Waite et al., 2000). The highest species richness on stony bottom was observed for mid-order streams, while lower species richness was recorded for headwaters and for high-order streams (Minshall et al., 1985; Crunkilton & Duchrow, 1991; Grubaugh et al., 1996; Reyjol et al., 2003), or species richness was found to increase with increasing watershed size (Klemm et al., 2002; Heino et al., 2003). Furse (2000) reported significantly lower richness values for headwaters compared with larger streams, the mean sensitivity of their taxa being approximately similar.
The geological factor is seldom primary and exerts influence in combination with ecoregion, stream size, etc. (Feld, 2004; Moog et al., 2004). The effect of bed-rock on macroinvertebrates usually depends on its alkalinity.
Significant variation in the macroinvertebrate community is attributable to local physical conditions (Rabeni, 2000; Dovciak & Perry, 2002). Likewise, the number of substrate types found in a reach is an important variable (Olsen & Friberg, 1999). Although the riffle habitat (having high velocity) is usually considered a standard biotope for biological quality studies, the margin habitat in slow-flowing streams (where riffles do not occur) proved a representative substrate for the entire macroinvertebrate diversity at a site (Turak et al., 1999; Newall & Wells, 2000; Linke & Norris, 2003). Sampling of submerged wood or plant roots has a far higher influence on the estimation of biological quality in slow-flowing than in fast-flowing reaches (Speth & Boettger, 1994; Rader & McArthur, 1995).
Although summer is a favourable time for many macroinvertebrate taxa (particularly phytophiles), several heterotopic insects (most Plecoptera, many Ephemeroptera and Trichoptera) leave waterbodies in this period or occur as unidentified forms (eggs, very young larvae). Hence spring and/or autumn are considered the most advantageous seasons to estimate biological quality (Johnson, 1999; Turak et al., 1999; Hewlett, 2000; Heino et al., 2003).
In Estonia the influence of none of the above factors, recommended by the Directive, on the estimation of stream quality has been sufficiently studied.
Recently, several macroinvertebrate projects for intercalibration of different geographical areas and assessment methods, such as AQEM and STAR, were executed in Europe (Hering et al., 2003; Furse et al., 2006). Consequently, a modern, acceptable sampling technique should (1) be standardized, (2) include a wide variety of taxa at the studied site, and (3) incorporate a measure of abundance. Non-standardized or only qualitative samples cannot be intercalibrated with the corresponding material from other European areas. If only a single taxon or a few taxa are considered as indicators, spatio-temporal variability of macroinvertebrate
Macroinvertebrates in Estonian streams
39
assemblages may significantly diminish opportunities to estimate any relevant metric of biological quality. Moreover, a representative sample from lowland streams must contain at least 300 specimens (Lorenz et al., 2004).
In 2000 we introduced a standard semi-quantitative handnet sampling technique (European Committee for Standardization, 1994) sensu Johnson (1999) and Medin et al. (2001) for routine monitoring of Estonian freshwaters. To apply this method, a provisional table of reference values for six common macroinvertebrate metrics (total taxa richness, EPT taxa richness, Shannon diversity, British ASPT-score, Danish Stream Fauna Index, Swedish Acidity Index) in different habitats for spring or autumn samples was drawn up (Timm, 2003). However, the historical data of quality estimation on the basis of stream macroinvertebrates, collected in Estonia during 1985�1999, include far more measurements compared with the data collected with the above-described method. In addition, the data are based on a much wider range of physico-geographic conditions. At the same time, older data derive from poorly standardized or non-standardized qualitative samples that allow calculation of only a rather limited number of quality metrics. Even if relevant metrics were derived in the past, the results from the two periods would not be directly comparable. Until now the historical samples have been applied for the estimation of long-term changes in organic pollution in some Estonian streams (Timm et al., 2001).
We tested (1) the influence of stream size, bottom substrate type, velocity, geographical location, and season on some metrics of biological quality in Estonian streams and (2) comparability of the metrics derived from historical samples to those derived from standard samples.
STUDY AREA
Estonia belongs to the area of mixed forests of the temperate zone bordering on taiga. In comparison with the other European areas, Estonia has a large proportion of raised bogs and forests (Raukas, 1995). In a zoogeographical regionalization of Europe, Illies (1967) considered the Baltic area (including Estonia) a separate unit (province No. 15). In a recent intercalibration of hydrobiological quality, Estonia as a relatively small and geographically homogeneous area was joined to the European Central Plains region (No. 14) (Buffagni et al., 2005). Altogether, 25 local landscape regions are distinguished in Estonia (Arold, 2001), among them 6 uplands and 19 lowlands.
The bedrock of northern, western, and central Estonia consists mainly of Ordo-vician and Silurian carbonates. Almost the whole of southern Estonia is a region of Devonian sandstone (Raukas, 1995). Like in Sweden, it is probably the soil rather than the bedrock that defines the chemistry of runoff, because the soil material covering the bedrock was transported from distant locations during the last glaciation (Fölster et al., 2004). The altitude of most of the territory is lower than
H. Timm et al.
40
200 m a.s.l., i.e. it belongs to lowlands in the sense of the Directive. Only a few higher areas can be found in south-eastern Estonia. About half of the country is covered by woodlands and semi-natural areas, and one-third is used for agriculture, including pastures. Urban and industrial areas are mainly concentrated in the north-eastern part of the country and account for 2% of the territory (Meiner, 1999).
The number of registered bodies of running water is 1755 (Arukaevu, 1986); however, this list does not include most first-order streams. The Narva River on the north-eastern border with Russia, with a total length of about 650 km (together with Lake Peipsi�Pihkva and the Velikaya River in Russia) and with a catchment area of 56 200 km2, is the largest watercourse. As the summer pH of most streams is 7.0�8.5 (Järvekülg, 2001), acidification is of no or little importance. Because of the relatively flat landscape, there are only a few streams with entirely rocky or gravelly bottom. Therefore, a large number of streams completely lack riffles, either because of their naturally low slope or because of man-induced increase in sedimentation. In such cases, the margin vegetation may serve as the only hard sub-strate for invertebrates. The main causes of the impairment of freshwaters outside urban areas are eutrophication and stream channelization (Järvekülg, 2001).
MATERIAL AND METHODS
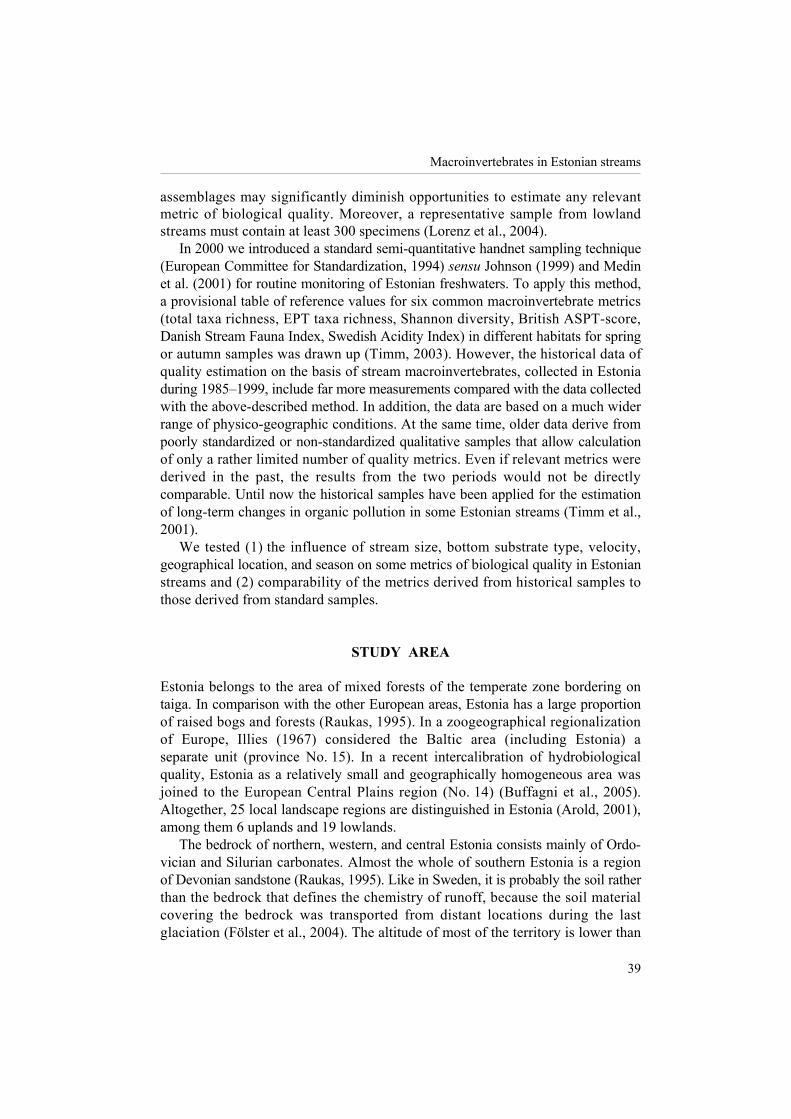
The data were drawn from the database of the Centre for Limnology, Institute of Agricultural and Environmental Siences, Estonian University of Life Sciences. The animals were collected from streams all over the territory of Estonia, mostly in the ice-free period (between March and November), within several monitoring, scientific, and expertise projects in 1985�2002 (Fig. 1a, b). Assessment of the habitat (flow velocity and substrate) was performed in all cases. Hydrochemical samples were taken in certain cases and they were not treated in this study. Altogether, 961 macroinvertebrate samples from 258 streams were extracted for statistical analysis (Table 1, Fig. 1). The samples obviously affected by pollution, channelization, or water regulation as well as those taken directly from lake outflows were not included.
Factors
For convenience, bottom substrates were divided only into two categories: hard (stones and/or gravel) and soft (sand, clay, debris, etc.). However, samples from reaches with hard bottom sometimes included also organisms from the margin vegetation or from parts of soft bottom (if present). Altogether, 742 samples of hard substrate and 219 samples of soft substrate were analysed. Stream sections were considered either fast- (672 samples) or slow-flowing (289 samples), regarding a visually estimated velocity of 0.2 m/s as the cut-off point. Stream size was estimated as the distance of the sampling site from the stream source, relying on

Macroinvertebrates in Estonian streams
41
Fig. 1. Location of the sampling sites. a � the samples collected with Method 3, analysed both in Timm (2003) and in the current study; b � the samples collected with the use of methods 1 and 2.
STUDY AREA
H. Timm et al.
42
Table 1. Non-transformed factors and variables. n � total number of samples; ASPT � Average Score Per Taxon; NTAXA � taxa richness (number of BMWP indicator families) (Armitage et al., 1983); DSFI � Danish Stream Fauna Index (Skriver et al., 2000)
Continuous factor Min Max
Month 3 11 Longitude (E) 21.930 28.176 Latitude (N) 57.251 59.636 Distance of stream site from stream source, km 1 585
Nominal factor Levels
Bottom substrate Hard, soft Flow velocity Slow, fast Season Spring, summer, autumn
Variable n Mean SD Min Max
ASPT 961 5.8 0.9 2.7 8.5 NTAXA 961 11.5 5.6 2 38 DSFI 871 5.0 1.0 1 7
maps and tables providing the basic parameters of the Estonian streams (Arukaevu, 1986). Year was divided into spring (before June; 466 samples), summer (June, July, and August; 272 samples), and autumn (after August; 223 samples). As a rule, no sampling was performed in winter when most streams were frozen. Three sampling methods were compared (Table 2).
Simple qualitative samples (Method 1, collection mainly in 1985�1995) were usually taken from up to 30 m sections of shallow reaches (the distance depended on the accessibility of suitable areas). The whole sampling area and the proportion of different substrates were not standardized. Habitats with the highest taxa richness were preferably examined. The animals were picked directly from hard substrates
Table 2. Comparison of the sampling methods used. Method 1 � simple qualitative samples, Method 2 � the Danish method (Skriver et al., 2000), and Method 3 � the semi-quantative method (Johnson, 1999; Medin et al., 2001)
Property Method 1 Method 2 Method 3
Sampling area Not fixed Standardized, 12 kicks along 3 transects
Standardized, 5 kicks (1.25 m2)
Time spent on sampling Not fixed, 20�40 min
Not fixed, ca 30 min
Not fixed, ca 30 min
Additional qualitative sample No Yes Yes Habitat quality, estimated Yes Yes Yes All important habitats sampled Yes Yes Yes Animals sorted in the field Yes Yes No Abundance estimation No Partly Yes

Macroinvertebrates in Estonian streams
43
such as stones and logs, or were captured with a handnet with a mesh size of 0.5 mm. The animals were fixed in ethanol. Sampling was continued until no new taxa were detected in the field.
The Danish collection method (Method 2, collection mainly in 1996�1999) was originally designed to calculate the Danish Stream Fauna Index. According to Skriver et al. (2000), the samples were taken with a standard handnet with a 25 × 25 cm opening and a tapering netbag with a mesh size of 0.5 mm. Sampling was done along three transects across the stream. Four kick samples were taken at each transect. The kick samples were supplemented by hand-picking from sub-merged stones and large-sized woody debris. We used a version of this method where sorting and preliminary identification of the animals were done immediately on the spot. Compared with Method 1, standardization of the sampling area for the most typical bottom was the most important difference.
According to the standard semi-quantitative technique EN 27828 (European Committee for Standardization, 1994) (Method 3), samples were collected using standardized kick sampling with a handnet similar to that used in the Danish method. Five 1 m kick samples were taken from a uniform (preferably riffle) bottom at each site. In addition, a qualitative search sample was taken from all available substrates (Johnson, 1999; Medin et al., 2001). The sample size was almost the same as in the case of Method 2. Differently from the two previous methods, the collected animals were fixed together with sieving residues (debris, sand, pebbles) and sorted in the laboratory. All specimens were counted for the calculation of the abundance-based metrics. To save time, dominant taxa with very high abundance were subsampled. For Estonian streams this technique has been used regularly in routine monitoring since 2000.
Regarding sampling, several authors have sorted samples in the field (Lenat, 1988; Alba-Tercedor & Pujante, 2000; Newall & Wells, 2000), while others have considered field sorting as a source of systematic error (Friberg & Johnson, 1995; Smith et al., 1999; Humphrey et al., 2000). Additional qualitative search, which was considered an important element of our standard sample, did not affect DSFI or ASPT in Swedish freshwaters. However, it influenced significantly taxa richness, EPT-taxa number, and BMWP score (Goedkoop et al., 2000).
Although the time spent in the field for a single sample was similar in all three cases, the time needed for laboratory work was several times longer in the case of Method 3 compared with the other two techniques. At the same time, this method enables calculation of abundance-based metrics, which is not feasible with the other two techniques. Altogether, 530 samples were collected using Method 1, 290 samples were collected using Method 2, and 141 samples were collected using Method 3.
Variables
Only three indices connected with the current monitoring programme in Estonia could be more or less reliably calculated using all three above-described sampling methods. All they express somewhat different ecological aspects. ASPT and

H. Timm et al.
44
NTAXA originate from the Biological Monitoring Working Party score system (Armitage et al., 1983), where the pollution-tolerant families have low values and the pollution-intolerant families have high values. The total sum of the scores of individual families present in a sample yields the site score. To diminish the effects of sampling size and taxa richness on the site scores, the scores are divided by the total number of the scoring families (NTAXA) to yield the Average Score Per Taxon (ASPT), with values ranging from one to ten. In the current study, NTAXA was chosen to indicate taxa richness (biodiversity). ASPT characterizes general ecological quality and/or organic pollution (Armitage et al., 1983; Wright, 2000). Both ASPT and NTAXA were calculated for all samples (Table 1).
The Danish Stream Fauna Index (DSFI), a modification of the Trent Biotic Index (Woodiwiss, 1964), served as the metric to estimate the level of organic pollution. It takes into account not only the sensitivity of the indicator taxa to organic pollution but also the diversity of the community. The recently modified version (Skriver et al., 2000) includes seven quality classes in which pollution-tolerant organisms receive low scores and sensitive taxa receive high scores. Calculation of DSFI for simple qualitative samples was sometimes impossible when the exact number of certain taxa was required (Table 1). We decided not to include taxa richness (taxa identified mostly further than to the family level), EPT-index (the number of Ephemeropera, Plecoptera, and Trichopera species per sample), and other similar indices in the current analysis because of the occurrence of too many doubtful cases in older samples.
ASPT and NTAXA belong to the ordinary biological quality monitoring system in Great Britain (Wright, 2000), while DSFI is used in Denmark (Skriver et al., 2000). In Sweden, ASPT and DSFI are recommended as reliable indicators of biological quality (Johnson & Goedkoop, 2006). In the monitoring of Estonian streams, ASPT and DSFI have both been regularly used since 1997. Taxa richness has been used instead of NTAXA since 2000 (Timm, 2003).
Identification
The material was mostly identified to the species or to the genus level, according to Johnson�s (1999) list (with small modifications for Estonian freshwaters). Chironomids, oligochaetes, and the other groups requiring high magnification were not examined further. For the calculation of DSFI, the identification level of the genus, family, or class is required, while ASPT and NTAXA are based on the family level. The reliability of identification to the family level in estimations of biological quality has been confirmed recently by many studies (Feminella 2000; Hewlett, 2000; Gayraud et al., 2003; Linke & Norris, 2003; Waite et al., 2004). Some loss of information compared with identification to the species or the genus level is compensated for by involving young or damaged specimens that are difficult to identify further than the family level.
Macroinvertebrates in Estonian streams
45
Data analysis
Statistical conclusions were made with a general linear model (GLM), using the SAS software Release 8.1 (SAS Institute Inc., 1996). The core of the underlying statistical model is given in the Appendix. The results of analysis are valid only for the variables with normally distributed residuals. ASPT and DSFI satisfied this condition but the residual distribution of NTAXA was close to a normal distribution only after logarithmic transformation. The corresponding logarithmic index is denoted below by LNTAXA. Stream size was square rooted to obtain a suitable scale for regression analysis, and presented by a cubic polynomial. The other continuous factors included were sampling season and geographical coordinates of the sampling site (presented by a two-dimensional second-order polynomial). In the model the index value depends on the combination of bottom substrate and flow velocity, as well as on the sampling method. The effect of the sampling method was considered different for different combinations of substrate and flow velocity. Most of the statistical results were inferred by the tailored ESTIMATE and CONTRAST statements of the GLM procedure.
RESULTS Stream size
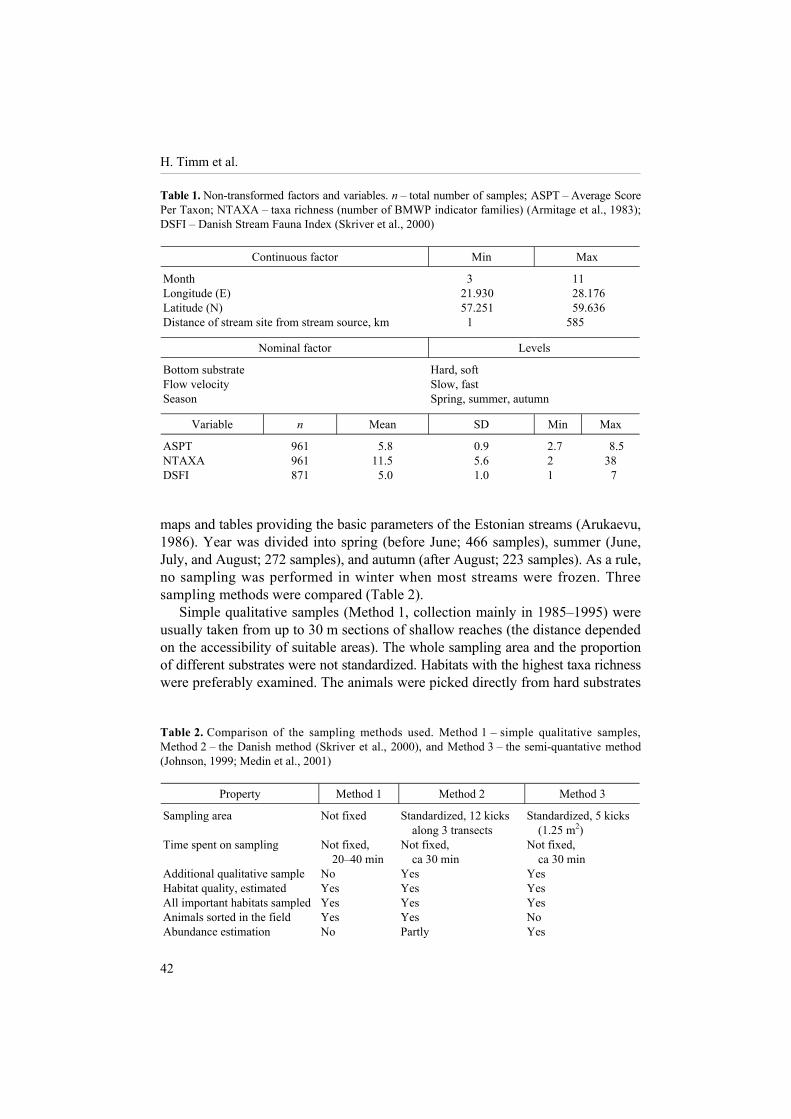
To specify the influence of stream size on ASPT, NTAXA, and DSFI, four distance points (4, 25, 64, and 169 km from the stream source) were compared using tailored parametric functions. These points correspond approximately to Strahler�s stream orders 1�2, 3, 4, and 5�6, respectively. All three metrics depended significantly on stream size (Table 3). The values of ASPT and DSFI for small streams increased with stream size, reaching a maximum at about 30�40 km from the source (Fig. 2). During subsequent increase in stream size, the values of ASPT and DSFI decreased gradually. DSFI became even lower for the largest stream sizes than for the smallest sizes. Similarly to the other metrics, NTAXA revealed a gradual increase with stream size up to a length of ca 50 km, after which it remained almost constant for the larger streams.
Bottom substrate and flow velocity
All three metrics revealed lower biological quality for soft than for hard substrates, indicating that this difference should be taken into consideration when establishing quality classes for them. Like bottom substrate, higher flow velocity revealed higher natural quality for ASPT and DSFI. Paradoxically, NTAXA was even some-what higher for slower than for faster flow, although the difference was not significant in the sense of Bonferroni (Table 3). In a previous analysis, based on the samples of Method 3 only (Timm, 2003), the number of Ephemeroptera, Plecoptera, and Trichopera (EPT), but not the ASPT or DSFI values, were markedly influenced by substrate and velocity.

H. Timm et al.
46
Table 3. The effect of several factors on the metrics of biological quality. Stream size is estimated as the distance (km) from the sampling site to the stream source. Bottom is hard or soft; flow velocity is fast or slow; and season is spring, summer, or autumn. Comparisons like �25 km � 4 km� indicate the differences between the expected values of the metrics. DF � degree of freedom, SE � standard error of difference. Only significant (P < 0.05) comparisons and contrasts are given. Asterisk indicates the P-values not significant in the sense of Bonferroni (P > 0.0025)
Metric Comparison or contrast DF Difference SE P-value
STREAM SIZE ASPT Distance from the source 3 � � < 0.0000 ASPT 25 km � 4 km 1 0.616 0.069 < 0.0000 ASPT 64 km � 4 km 1 0.701 0.084 < 0.0000 ASPT 64 km � 25 km 1 0.085 0.035 0.0164* ASPT 169 km � 25 km 1 � 0.419 0.13 0.0013 ASPT 169 km � 64 km 1 � 0.505 0.105 < 0.0000 DSFI Distance from the source 3 � � < 0.0000 DSFI 25 km � 4 km 1 0.719 0.081 < 0.0000 DSFI 64 km � 4 km 1 0.632 0.098 < 0.0000 DSFI 169 km � 4 km 1 � 0.389 0.16 0.0155* DSFI 169 km � 25 km 1 � 1.108 0.178 < 0.0000 DSFI 169 km � 64 km 1 � 1.021 0.141 < 0.0000 LNTAXA Distance from the source 3 � � < 0.0000 LNTAXA 25 km � 4 km 1 0.417 0.048 < 0.0000 LNTAXA 64 km � 4 km 1 0.596 0.058 < 0.0000 LNTAXA 169 km � 4 km 1 0.577 0.083 < 0.0000 LNTAXA 64 km � 25 km 1 0.179 0.025 < 0.0000 BOTTOM SUBSTRATE ASPT Mean for soft � mean for hard 1 � 0.283 0.074 0.0002 ASPT Any effect of substrate 2 � � 0.0004 DSFI Mean for soft � mean for hard 1 � 0.349 0.085 < 0.0000 DSFI Any effect of substrate 2 � � < 0.0000 LNTAXA Mean for soft � mean for hard 1 � 0.246 0.052 <0.0000 LNTAXA Any effect of substrate 2 � � <0.0000 LNTAXA Dependence of substrate effect on flow velocity 1 � � 0.0094* FLOW VELOCITY ASPT Mean for slow � mean for fast 1 � 0.252 0.077 0.0011 ASPT Any effect of velocity 2 � � 0.0038* DSFI Mean for slow � mean for fast 1 � 0.247 0.087 0.0045* DSFI Any effect of velocity 2 � � 0.0006 LNTAXA Mean for slow � mean for fast 1 0.130 0.054 0.0170* LNTAXA Any effect of velocity 2 � � 0.0077* GEOGRAPHICAL LOCATION ASPT Latitude 3 � � < 0.0000 ASPT Longitude 3 � � < 0.0000 DSFI Latitude 3 � � < 0.0000 DSFI Longitude 3 � � 0.0003 SEASON DSFI Mean for spring � mean for autumn 1 0.212 0.075 0.0048* DSFI Mean for autumn � mean for summer 1 � 0.222 0.085 0.0094* DSFI Season 2 � � 0.0091* LNTAXA Mean for spring � mean for autumn 1 0.108 0.046 0.0194* LNTAXA Mean for autumn � mean for summer 1 � 0.157 0.049 0.0015 LNTAXA Mean for (spring + autumn) � mean for summer 1 � 0.103 0.041 0.0117* LNTAXA Season 2 � � 0.0053*

Macroinvertebrates in Estonian streams
47
Fig. 2. Dependence of the studied metrics on stream size. The vertical axis shows the change in the index value related to stream size; the horizontal axis shows the square root of the distance (in km) from the stream source.
Geographical coordinates
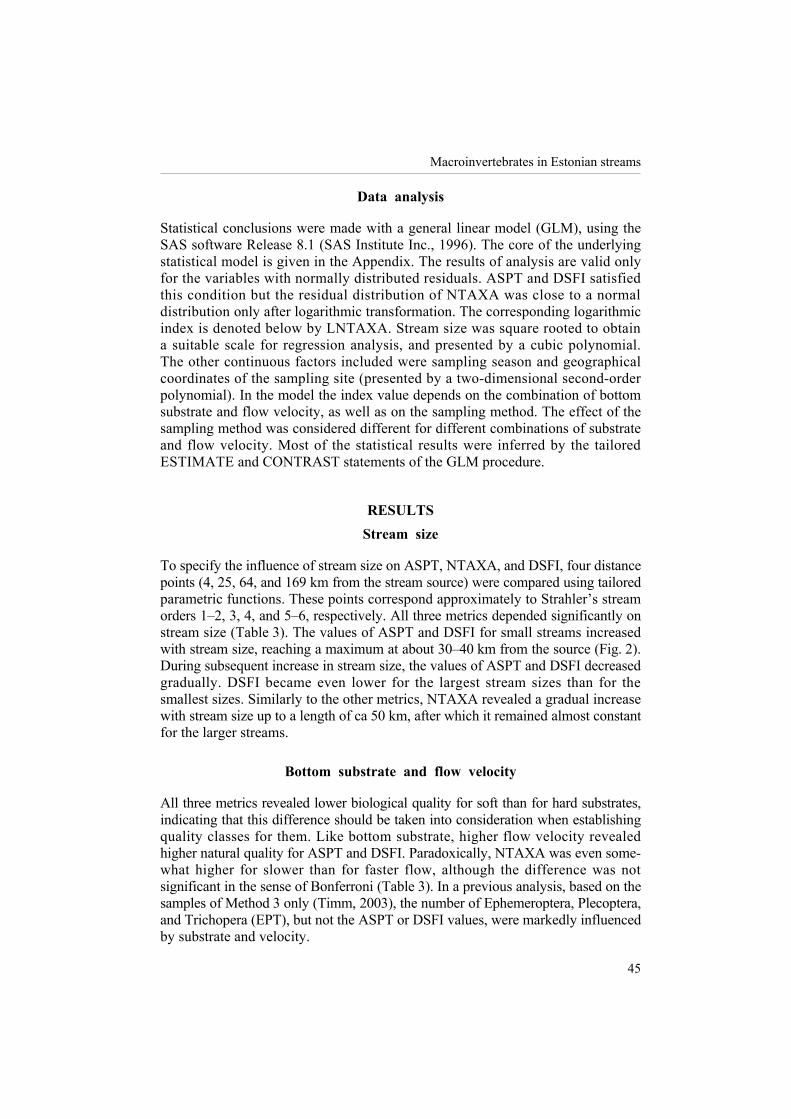
The biological quality according to ASPT and DSFI was significantly influenced both by latitude and longitude (Table 3). The values of these indices were predicted using the main statistical model for different geographical points and are presented as isographs on the map of Estonia (Fig. 3). The areas of the highest biological quality occurred both in the upland region of the southern part (sandstone) of the country and along the large cliff in the midnorthern part (limestone). Unlike the other metrics, NTAXA showed maximum values for the south-western areas of Estonia where streams have a low slope and a relatively wide channel, although the difference in the values was statistically nonsignificant. Another study, based on independent data, showed that the streams richest in invertebrate species were situated near the region with the highest NTAXA in our study (Järvekülg, 2001).
A S P T D S F I
N T A X A
S Q R T , k m S Q R T , k m
Estimate + SE
Estimate � SE
S Q R T , k m

H. Timm et al.
48
Season
Season was not a determining factor for ASPT (Table 3). In contrast, the mean value of DSFI was significantly lower in autumn than in spring or summer. NTAXA was significantly higher in summer than in the other seasons.
Sampling method
On stony or gravelly bottom (riffles), no influence of the sampling method on ASPT was observed. As the riffle biotope is an area mostly recommended for sampling macroinvertebrates, ASPT might prove a promising tool for comparison of the results obtained with different sampling strategies. However, for slow current and/or soft bottom, the ASPT values derived from the simple qualitative samples (Method 1) were significantly lower than those obtained with the other two sampling methods (Table 4). At the same time, Methods 2 and 3 yielded statistically similar results. DSFI and NTAXA, on the contrary, were highly dependent on the sampling method, revealing lower values both for Method 1 and Method 2 compared with Method 3 (Table 4). However, the differences between Method 1
Fig. 3. Variation of the studied metricsvs latitude (vertical axis) and longitude(horizontal axis) in Estonia. The graphsare calculated for Method 1, fast current,hard bottom, spring season, and streamlength of 25 km.

Macroinvertebrates in Estonian streams
49
Table 4. The effect of sampling method on the metrics. Method 1 � simple qualitative samples, Method 2 � the Danish method, and Method 3 � the semi-quantative method. Comparisons like �Method 1 � Method 2: soft, slow� indicate the differences between the expected values of the metrics. DF � degree of freedom, Estimate � estimate of difference, SE � standard error of difference. Only significant (P < 0.05) comparisons and contrasts are given. Asterisk indicates the P-values not significant in the sense of Bonferroni (P > 0.0025)
Index Parameter or source DF Estimate SE P-value
ASPT Method 1 � Method 2: soft, slow 1 0.201 0.077 0.0094* ASPT Method 1 � Method 3: soft, slow 1 0.201 0.101 0.0469* ASPT Method 1 � Method 2: in any conditions 4 � � 0.0147* ASPT Method 8 � � 0.0293* DSFI Method 1 � Method 2: in any conditions 4 � � 0.0414* DSFI Method 1 � Method 3: hard, fast 1 � 0.526 0.256 0.0405* DSFI Method 1 � Method 3: hard, slow 1 � 0.752 0.207 0.0003 DSFI Method 1 � Method 3: soft, fast 1 � 0.847 0.231 0.0003 DSFI Method 1 � Method 3: soft, slow 1 � 1.072 0.112 < 0.0000 DSFI Method 2 � Method 3: hard, slow 1 � 1.025 0.211 < 0.0000 DSFI Method 2 � Method 3: soft, fast 1 � 0.554 0.256 0.0309* DSFI Method 2 � Method 3: soft, slow 1 � 0.943 0.123 < 0.0000 DSFI Method 1 � Method 3 1 � 0.799 0.107 < 0.0000 DSFI Method 1 � Method 3: in any conditions 4 � � < 0.0000 DSFI Method 2 � Method 3 1 � 0.664 0.113 < 0.0000 DSFI Method 2 � Method 3: in any conditions 4 � � < 0.0000 DSFI Method 8 � � < 0.0000 LNTAXA Method 1 � Method 2: soft, slow 1 � 0.183 0.054 0.0006 LNTAXA Method 1 � Method 2: in any conditions 4 � � 0.0035* LNTAXA Method 1 � Method 3: hard, fast 1 � 0.977 0.157 < 0.0000 LNTAXA Method 1 � Method 3: hard, slow 1 � 1.1 0.132 < 0.0000 LNTAXA Method 1 � Method 3: soft, fast 1 � 1.239 0.145 < 0.0000 LNTAXA Method 1 � Method 3: soft, slow 1 � 1.132 0.072 < 0.0000 LNTAXA Method 1 � Method 3: in any conditions 4 � � < 0.0000 LNTAXA Method 2 � Method 3: hard, fast 1 � 1.028 0.175 < 0.0000 LNTAXA Method 2 � Method 3: hard, slow 1 � 1.055 0.126 < 0.0000 LNTAXA Method 2 � Method 3: soft, fast 1 � 1.04 0.16 < 0.0000 LNTAXA Method 2 � Method 3: soft, slow 1 � 0.948 0.077 < 0.0000 LNTAXA Method 1 � Method 3 1 � 1.112 0.067 < 0.0000 LNTAXA Method 2 � Method 3 1 � 1.018 0.071 < 0.0000 LNTAXA Method 2 � Method 3: in any conditions 4 � � < 0.0000 LNTAXA Method 8 � � < 0.0000
and Method 2 were mostly not significant. In other words, the biological quality according to taxa richness or its analogues (note that DSFI is highly dependent on taxa richness) estimated from the field-sorted samples was significantly lower than that estimated from the laboratory-sorted samples.

H. Timm et al.
50
DISCUSSION Stream size
In a previous analysis (Timm, 2003), catchment area was found to exert a significant effect on all six studied metrics in Estonian streams. Its category < 100 km2 affected almost all metrics (except DSFI), indicating a particular nature of the smallest streams. In the current study, stream size had a somewhat different effect on the quality metrics. When the values of both ASPT and DSFI reached a maximum at about 30�40 km from the source and decreased then with a subsequent growth of stream size, NTAXA revealed a gradual increase with stream size up to a length of ca 50 km after which its value remained almost constant for the larger streams. The decrease in ASPT for the smallest stream sizes and the decrease in DSFI for the largest stream sizes (Timm, 2003) were confirmed. We also ascertained a concurrent decline in ASPT for the highest stream orders, which has not been pointed out before.
The observed relationships between stream size and the quality indices were in fair concordance with the River Continuum Concept (Vannote et al., 1980), which states that the zone through which the stream shifts from heterotrophic to autotrophic in forest zones is probably of order 3 (approximately 25 km from the stream source in our example). In such a transition area from headwaters to medium-sized streams, the number of species rises rapidly, which affects also the indices of biological quality depending on species richness. In Finnish streams distinct differences attributable to stream size were observed for several metrics, particularly for total number of taxa and abundance of algae-scraping invertebrates (Mykrä et al., 2004). Heino et al. (2006) also found obvious differences in assemblage structure among the stream size classes, with a gradual increase of species richness as stream size increased. Paller et al. (2006) noted that in South Carolina streams stream width is positively related to total number of taxa; number of Ephemeroptera, Plecoptera, and Trichoptera (EPT) taxa; and total number of organisms.
Bottom and flow velocity
According to Timm (2003), the taxa richness of Ephemeroptera, Plecoptera and Trichopera (EPT), but not the ASPT or DSFI values, are significantly influenced by substrate and flow velocity in Estonian streams. In the current study, involving a larger number of measurements, all three metrics revealed lower biological quality for sandy than for harder substrates. Likewise, higher flow velocity indicated higher natural quality for ASPT and DSFI. Paradoxically, NTAXA was even somewhat higher for slower than for faster current, although the difference was not significant in the sense of Bonferroni (Table 3).
Sites in lowland stream sections are usually characterized by lower taxonomic richness and are distinct from other sites (Turak et al., 1999; Maxted et al., 2000). Soft-bottomed reference sites have only 50% of all taxa of hard-bottomed reference sites and only 33% of the Ephemeroptera, Plecoptera, and Trichoptera (EPT) taxa

Macroinvertebrates in Estonian streams
51
(Maxted et al., 2003). The highest species richness in sandy streams was found not on sand but on dead leaves, wood, and alder roots (Speth & Boettger, 1994; Rader & McArthur, 1995), which confirms that the patchy structure in sandy versus rocky streams is characterized by isolated snags that can only be colonized by drifting.
Subregions
We observed significant subregional dissimilarities for all studied metrics. How-ever, biological quality was probably limited by flow velocity rather than by the bedrock type. The lower values of ASPT and DSFI in the western part (Fig. 3) may be related to the interaction of the young geological age, low slope, and small size of many streams. For example, the order Plecoptera as an indicator of the highest quality is only represented by the widespread species Nemoura cinerea in the streams of Estonian islands (Timm, 2000). We assumed that the eastward decrease in ASPT and DSFI might be caused both by the relatively low slope and by the high level of humic substances in the catchment areas. Peatlands may have a stronger influence on local streams in eastern Estonia than elsewhere (Järvekülg, 2001). Still, the macroinvertebrates of genuine peatland streams in Estonia require further detailed research. In a previous study (Timm, 2003) in which peaty areas were not analysed, the difference between limestone and sandstone bedrocks was significant for the acidity index but not for ASPT or DSFI. The high NTAXA in the south-western areas of Estonia (Fig. 3), where streams have a low slope and a relatively wide channel, can be explained by comparatively good light conditions, which favour extensive occurrence of aquatic macrophytes with phytophilous invertebrate species.
Johnson (1999) established region-specific reference values for selected indicator metrics for six major ecoregions in Sweden (from the arctic-alpine to the nemoral zone). However, Sandin (2003) concluded that a gradual rather than a discrete change occurs in the taxonomic composition both among the ecoregions and among the assemblage groups. In Finland the arctic-alpine and the northern boreal ecoregions support the most distinct benthic assemblages. However, no clear latitudinal gradients were detected in local species richness (Heino et al., 2002).
Season
While in our study ASPT did not depend and NTAXA depended on the season (spring, summer, or autumn), independence of both these metrics of the season was reported for British streams (Clarke, 2000). The relatively high value of NTAXA in summer in our study can be explained by the occurrence of warm-water phyto-philous taxa. The best results are achieved when separate quality estimation models are developed for each sampling season (Linke et al., 1999; Reece et al., 2001). In case the season is related to a large variability in discharge, it can mask differences in water quality (Coimbra & Graça, 1998; Davies, 2000).
H. Timm et al.
52
Biological quality
To sum up, we confirmed the significance of several main typological factors noted in the Water Framework Directive for some routine quality metrics on the basis of the taxonomic composition of macroinvertebrates in Estonian streams. We also found that one of the metrics � British ASPT-index � depended non-significantly on taxa richness, sampling method, and season in fast-flowing stream sections. This finding helps transform biological quality derived from non-standard samples into standard terms. The other indices, which expressed taxa richness more directly (NTAXA, DSFI), are less suitable for this purpose. The �ASPT approach� is popular also elsewhere outside the UK where it belongs to standard tools. In Southern Europe, a Spanish version (ASPT´) has been successfully put into practice (Alba-Tercedor & Pujante, 2000; Solimini et al., 2000). Although the Austrian index of saprobity, based on identification to the species level, is considered more accurate for Austrian conditions compared with ASPT, a significant correlation occurred between them (Strubauer & Moog, 2001). Collier et al. (1998) found that several indices of biological quality (percentage of Ephemeroptera, Plecoptera, and Trichoptera; Macroinvertebrate Community Index � similar to ASPT � developed for New Zealand), derived from rapid bioassessment sampling, are not significantly different from those derived from intensive sampling. Such indices appear to be particularly useful for rapid bioassessment of lowland stream environments.
Nevertheless, estimation of biological quality on the basis of only one index can be accepted merely as a provisional rapid method to be used in geographically uniform areas affected by single-type impairment (Skriver et al., 2000). To illustrate different aspects of quality, simultaneous use of several metrics (including abundance-based metrics) is highly recommended (Fore et al., 1996; Johnson, 1999; Barbour & Yoder, 2000; Feld, 2004). Thus, a multimetric system was developed in which five indices, characterizing biodiversity (taxa richness), general degradation (ASPT, EPT, Shannon diversity), and/or organic pollution level (DSFI), are included in the present list of metrics of biological quality in Estonian streams. As channelization and damming have nowadays far more importance for the biota of Estonian streams than organic pollution, we propose completing the estimation scale with the metric(s) that could directly express hydromorphological stress. In addition, the natural value of streams (occurrence of rare and endangered taxa, percentage of non-native species and specimens) should be an integral component of biological quality in the nearest future.
ACKNOWLEDGEMENTS
The study was supported by the Estonian Ministry of Agriculture (1990�1998), the Information Centre of the Estonian Ministry of the Environment (1997�2002), the Estonian Science Foundation (1999), the Estonian Environmental Investment Centre (2001�2002), and the international programme NATURA 2000 (2002) and the National programme for Humanitary and Natural Collections (Estonian Ministry

Macroinvertebrates in Estonian streams
53
of Education and Research, 2005�2007). The work was also partly financed by research projects of the Estonian University of Life Sciences No. 0362482s03 (2003�2007) and No. 0170011s08 (starting in 2008). Margo Hurt (Environmental Department, Võru County) kindly permitted access to his macroinvertebrate data. We are obliged to Dr Mari Ivask (Institute of Environmental Protection, Estonian University of Life Sciences) for help in fieldwork. We also thank Mrs Ester Jaigma for linguistic corrections.
APPENDIX
The core of the SAS GLM procedure used in analysis. sm - sampling method, vel - velocity of current, lat - geographical latitude, long - geographical longitude, LL - square rooted size of current, �Method 1 Method 3:hard, slow� - comparison of Method 1 and Method 2 for hard substrate and slow current (an example of a tailored estimate clause used in the procedure)
proc GLM data=streams; class sm substrate vel season; model ASPT LNTAXA DSFI =
substrate|vel sm(substrate*vel) lat|lat|long|long@2 LL|LL|LL season / e3 ss3 solution; output out=ResAndPreds r=rASPT rLNTAXA rDSFI
p=pASPT pLNTAXA pDSFI; . . . estimate �Method 1-Method 3:hard, slow� sm(substrate*vel) 0 0 0 0 0 0 1 -1 ; . . .
REFERENCES
Alba-Tercedor, J. & Pujante, A. M. 2000. Running-water biomonitoring in Spain: opportunities for a predictive approach. In Assessing the Biological Quality of Fresh Waters: RIVPACS and Other Techniques (Wright, J. F., Sutcliffe, D. W. & Furse, M. T., eds), pp. 207�216. Fresh-water Biological Association, Ambleside, Cumbria, UK.
Armitage, P. D., Moss, D., Wright, J. F. & Furse, M. T. 1983. The performance of a new biological water quality score system based on a wide range of unpolluted running-water sites. Water Res., 17, 333�347.
Arold, I. 2001. Eesti maastikuline liigestatus. Tartu Ülikooli Kirjastus, Tartu. Arukaevu, K. (comp.) 1986. Eesti NSV jõgede, ojade ja kraavide nimestik. Valgus, Tallinn. Barbour, M. T. & Yoder, C. O. 2000. The multimetric approach to bioassessment, as used in the
United States of America. In Assessing the Biological Quality of Fresh Waters: RIVPACS and Other Techniques (Wright, J. F., Sutcliffe, D. W. & Furse, M. T., eds), pp. 281�292. Freshwater Biological Association, Ambleside, Cumbria, UK.
Buffagni, A., Erba, S., Birk, S., Cazzola, M., Feld, C., Ofenböck, T., Murray-Bligh, J., Furse, M. T., Clarke, R., Hering, D., Sozska, H. & van de Bund, W. 2005. Towards European inter-calibration for the Water Framework Directive: Procedures and examples for different river types from the E.C. project STAR. Quaderni, 123.
Clarke, R. 2000. Uncertainty in estimates of biological quality based on RIVPACS. In Assessing the Biological Quality of Fresh Waters: RIVPACS and Other Techniques (Wright, J. F., Sutcliffe, D. W. & Furse, M. T., eds), pp. 39�54. Freshwater Biological Association, Ambleside, Cumbria, UK.

H. Timm et al.
54
Coimbra, C. N. & Graça, M. A. S. 1998. Water quality assessment based on macroinvertebrate community structure: a comparison between methods. Verh. Internat. Verein. theor. angew. Limnol., 26, 2362�2366.
Collier, K. J., Wilcock, R. J. & Meredith, A. S. 1998. Influence of substrate type and physico-chemical conditions on macroinvertebrate faunas and biotic indices of some Lowland Waikato, New Zealand, streams. New Zealand J. Mar. Freshwater Res., 32, 1�19.
Crunkilton, R. L. & Duchrow, R. L. 1991. Use of stream order and biological indices to assess water quality in the Osage and Black River basins of Missouri. Hydrobiologia, 244, 155�166.
Davies, P. E. 2000. Development of a national river bioassessment system (AUSRIVAS) in Australia. In Assessing the Biological Quality of Fresh Waters: RIVPACS and Other Techniques (Wright, J. F., Sutcliffe, D. W. & Furse, M. T., eds), pp. 113�124. Freshwater Biological Association, Ambleside, Cumbria, UK.
Dovciak, A. L. & Perry, J. A. 2002. In search of effective scales for stream management: Does agroecoregion, watershed, or their intersection best explain the variance in stream macro-invertebrate communities? Environ. Manage., 30, 365�377.
European Committee for Standardization 1994. Water Quality � Methods for Biological Sampling � Guidance on Handnet Sampling of Aquatic Benthic Macro-invertebrates. EN 27828. European Committee for Standardization, Brussels, Belgium.
Feld, C. K. 2004. Identification and measure of hydromorphological degradation in Central European lowland streams. Hydrobiologia, 516, 69�90.
Feminella, J. W. 2000. Correspondence between stream macroinvertebrate assemblages and 4 eco-regions of the southeastern USA. J. North Am. Benthol. Soc., 19, 442�461.
Fölster, J., Sandin, L. & Wallin, M. 2004. A Suggestion to a Typology for Swedish Inland Surface Waters According to the EU Water Framework Directive. Report 2004:13. Department of Environmental Assessment, Swedish University of Agricultural Sciences; Uppsala, Sweden.
Fore, L. S., Karr, J. R. & Wisseman, R. W. 1996. Assessing invertebrate responses to human activities: Evaluating alternative approaches. J. North Am. Benthol. Soc., 15, 212�231.
Friberg, N. & Johnson, R. K. (eds) 1995. Biological Monitoring of Streams. Methods Used in the Nordic Countries Based on Macroinvertebrates. TemaNord, 640.
Furse, M. T. 2000. The application of RIVPACS procedure in headwater streams � an extensive and important national resource. In Assessing the Biological Quality of Fresh Waters: RIVPACS and Other Techniques (Wright, J. F., Sutcliffe, D. W. & Furse, M. T., eds), pp. 79�92. Fresh-water Biological Association, Ambleside, Cumbria, UK.
Furse, M., Hering, D., Moog, O., Verdonschot, P., Johnson, R. K., Brabec, K., Gritzalis, K., Buffagni, A., Pinto, P., Friberg, N., Murray-Bligh, J., Koke�, J., Alber, R., Usseglio-Polatera, P., Haase, P., Sweeting, R., Bis, B., Szoszkiewicz, K., Soszka, H., Springe, G., �porka, F. & Krno, I. 2006. The STAR project: context, objectives and approaches. Hydrobiologia, 566, 3�29.
Gayraud, S., Statzner, B., Bady, P., Haybach, A., Schöll, F., Usseglio-Polatera, P. & Bacchi, M. 2003. Invertebrate traits for the biomonitoring of large European rivers: an initial assessment of alternative metrics. Freshwater Biol., 48, 2045�2064.
Goedkoop, W., Johnson, R. & Spånberg, E. 2000. The importance of sampling effort for the assessment of ecological quality using macroinvertebrates. Verh. Intern. Verein. theor. angew. Limnol., 27, 326�332.
Grubaugh, J. W., Wallace, J. B. & Houston, E. S. 1996. Longitudinal changes of macroinvertebrate communities along an Appalachian stream continuum. Can. J. Fish. Aquat. Sci., 53, 896�909.
Hawkins, C. P., Norris, R. H., Gerritsen, J., Hughes, R. M., Jackson, S. K., Johnson, R. K. & Stevenson, R. J. 2000. Evaluation of the use of landscape classifications for the prediction of freshwater biota: synthesis and recommendations. J. North Am. Benthol. Soc., 19, 541�556.
Heino, J., Muotka, T., Paavola, R., Hämäläinen, H. & Koskenniemi, E. 2002. Correspondence between regional delineations and spatial patterns in macroinvertebrate assemblages of boreal headwater streams. J. North Am. Benthol. Soc., 21, 397�413.

Macroinvertebrates in Estonian streams
55
Heino, J., Muotka, T. & Paavola, R. 2003. Determinants of macroinvertebrate diversity in headwater streams: regional and local influences. J. Animal Ecol., 72, 425�434.
Heino, J., Parviainen, J., Paavola, R., Jehle, M., Louhi, P. & Muotka, T. 2006. Characterizing macroinvertebrate assemblage structure in relation to stream size and tributary position. Hydrobiologia, 539, 121�130.
Hering, D., Buffagni, A., Moog, O., Sandin, L., Sommerhäuser, M., Stubauer, I., Feld, C., Johnson, R., Pinto, P., Skoulikidis, N., Verdonschot, P. & Zahradkova, S. 2003. The development of a system to assess the ecological quality of streams based on macroinvertebrates � design of the sampling programme within the AQEM project. Int. Rev. Hydrobiol., 88, 345�361.
Hewlett, R. 2000. Implications of taxonomic resolution and sample habitat for stream classification at a broad geographic scale. J. North Am. Benthol. Soc., 19, 352�361.
Humphrey, C. L., Storey, A. W. & Thurtell, L. 2000. AUSRIVAS: operator sample processing errors and temporal variability � implications for model sensitivity. In Assessing the Biological Quality of Fresh Waters: RIVPACS and Other Techniques (Wright, J. F., Sutcliffe, D. W. & Furse, M. T., eds), pp. 143�164. Freshwater Biological Association, Ambleside, Cumbria, UK.
Illies, J. 1967. Limnofauna Europea. VEB Gustav Fisher Verlag, Jena. Järvekülg, A. (ed.) 2001. Eesti jõed. Tartu Ülikooli Kirjastus, Tartu. Johnson, R. K. 1999. Benthic macroinvertebrates. In Bedömningsgrunder för miljökvalitet. Sjöar
och vattendrag. Bakgrundsrapport 2. Biologiska parametrar (Wiederholm, T., ed.), pp. 85�166. Naturvårdsverket Förlag.
Johnson, R. K. & Goedkoop, W. 2006. Revidering av bedömningsgrunder för bottenfauna i sjöar och vattendrag � Projekt 502 0510. Institutionen för miljöanalys, Uppsala.
Klemm, D. J., Blocksom, K. A., Thoeny, W. T., Fulk, F. A., Herlihy, A. T., Kaufmann, P. R. & Cormier, S. M. 2002. Methods development and use of macroinvertebrates as indicators of ecological conditions for streams in the Mid-Atlantic Highlands Region. Environ. Monit. Assess., 78, 169�212.
Lenat, D. R. 1988. Water quality assessment of streams using a qualitative collection method for benthic macroinvertebrates. J. North Am. Benthol. Soc., 7, 222�233.
Linke, S. & Norris, R. 2003. Biodiversity: bridging the gap between condition and conservation. Hydrobiologia, 500, 203�211.
Linke, S., Bailey, R. C. & Schwindt, J. 1999. Temporal variability of stream bioassessments using benthic macroinvertebrates. Freshwater Biol., 42, 575�584.
Lorenz, A., Kirchner, L. & Hering, D. 2004. �Electronic subsampling� of macrobenthic samples: how many individuals are needed for a valid assessment result? Hydrobiologia, 516, 299�312.
Maxted, J. R., Barbour, M. T., Gerritsen, J., Poretti, V., Primrose, N., Silvia, A., Penrose, D. & Renfrow, R. 2000. Assessment framework for mid-Atlantic coastal plain streams using benthic macroinvertebrates. J. North Am. Benthol. Soc., 19, 128�144.
Maxted, J. R., Evans, B. F. & Scarsbrook, M. R. 2003. Development of standard protocols for macroinvertebrate assessment of soft-bottomed streams in New Zealand. New Zealand J. Mar. Freshwater Res., 37, 793�807.
Medin, M., Ericsson, U., Nilsson, C., Sundberg, I. & Nilsson, P.-A. 2001. Bedömningsgrunder för bottenfaunaundersökningar. Medins Sjö- och Åbiologi AB, Mölnlycke.
Meiner, A. (ed.) 1999. Land Cover of Estonia. Implementation of CORINE Land Cover Project in Estonia. EEIC, Tallinn.
Minshall, G. W., Petersen, R. C. & Nimz, C. F. 1985. Species richness in streams of different size from the same drainage basin. Am. Nat., 125, 16�38.
Moog, O., Schmidt-Kloibe, A., Ofenböck, T. & Gerritsen, J. 2004. Does the ecoregion approach support the typological demands of the EU �Water Framework Directive�? Hydrobiologia, 516, 21�33.
Mykrä, H., Heino, J. & Muotka, T. 2004. Variability of lotic macroinvertebrate assemblages and stream habitat characteristics across hierarchical landscape classifications. Environ. Manage., 34, 341�352.

H. Timm et al.
56
Newall, P. & Wells, F. 2000. Potential for delineating indicator-defined regions for streams in Victoria, Australia. J. North Am. Benthol. Soc., 19, 557�571.
Olsen, H.-M. & Friberg, N. 1999. Biological stream assessment in Denmark: The importance of physical factors. In Biodiversity in Benthic Ecology. Proceedings from Nordic Benthological Meeting in Silkeborg, Denmark, 13�14 November 1997 (Sand-Jensen, K. & Pedersen, O., eds), pp. 89�95. NERI Technical Report No. 266, Silkeborg.
Paller, M. H., Specht, W. L. & Dyer, S. A. 2006. Effects of stream size on taxa richness and other commonly used benthic bioassessment metrics. Hydrobiologia, 568, 309�316.
Parsons, M., Thoms, M. C. & Norris, R. H. 2003. Scales of macroinvertebrate distribution in relation to the hierarchical organization of river systems. J. North Am. Benthol. Soc., 22, 105�122.
Rabeni, C. F. 2000. Evaluating physical habitat integrity in relation to the biological potential of streams. Hydrobiologia, 422, 245�256.
Rabeni, C. F. & Doisy, K. E. 2000. Correspondence of stream benthic invertebrate assemblages to regional classification schemes in Missouri. J. North Am. Benthol. Soc., 19, 419�428.
Rader, R. B. & McArthur, J. V. 1995. The relative importance of refugia in determining the drift and habitat selection of predaceous stoneflies in a sandy-bottomed stream. Oecologia (Berlin), 103, 1�9.
Raukas, A. (ed.) 1995. Eesti loodus. Valgus/Eesti Entsüklopeediakirjastus, Tallinn. Reece, P. F., Reynoldson, T. B., Richardson, J. S. & Rosenberg, D. M. 2001. Implications of seasonal
variation for biomonitoring with predictive models in the Fraser River catchment, British Columbia. Can. J. Fish. Aquat. Sci., 58, 1411�1418.
Reyjol, Y., Compin, A., A-Ibarra, A. & Lim, P. 2003. Longitudinal diversity patterns in streams: comparing invertebrates and fish communities. Arch. Hydrobiol., 157, 525�533.
Sandin, L. 2003. Benthic macroinvertebrates in Swedish streams: community structure, taxon richness, and environmental relations. Ecography, 26, 269�282.
SAS Institute Inc. 1996. SAS/STAT Software: Changes and Enhancements Through Release 6.11. Cary, NC.
Skriver, J., Friberg, N. & Kirkegaard, J. 2000. Biological assessment of watercourse quality in Denmark: introduction of the Danish Stream Fauna Index (DSFI) as the official biomonitoring method. Verh. Intern. Verein. theor. angew. Limnol., 27, 1822�1830.
Smith, M. J., Kay, W. R., Edward, D. H. D., Papas, P. J., Richardson, K. St. J., Simpson, J. C., Pinder, A. M., Cale, D. J., Horwitz, P. H. J., Davis, J. A., Young, F. H., Norris, R. H. & Halse, S. A. 1999. AusRivAS: using macroinvertebrates to assess ecological condition of rivers in Western Australia. Freshwater Biol., 41, 269�282.
Solimini, A. G., Gulia, P., Monfrinotti, M. & Carchini, G. 2000. Effect of different sampling methods on the biotic indices values of the water quality in the lower part of the mediterranean River Tiber. Ann. Limnol. Int. J. Limnol., 36, 135�143.
Speth, S. & Boettger, K. 1994. The substrate-specific distribution of Ephemeroptera, Plecoptera and Trichoptera (Insecta) in a sandy stream of the North German Lowland (Osterau, Schleswig-Holstein). Limnologica, 23, 369�380.
Strubauer, I. & Moog, O. 2001. Taxonomic sufficiency versus need for information � comments based on Austrian experience in biological water quality monitoring. Verh. Intern. Verein. theor. angew. Limnol., 27, 2562�2566.
Timm, H. 2000. Distribution of stoneflies (Insecta: Plecoptera) in Estonia. Proc. Estonian Acad. Sci. Biol. Ecol., 49, 277�288.
Timm, H. 2003. Typology and classification of freshwaters in Estonia: preliminary results using shallow-water macroinvertebrates. In How to Assess and Monitor Ecological Quality in Fresh-waters (Ruoppa, M., Heinonen, P., Pilke, A., Rekolainen, S., Toivonen, H. & Vuoristo, H., eds), pp. 164�169. TemaNord, 547.
Timm, H., Ivask, M. & Möls, T. 2001. Response of macroinvertebrates and water quality to long-term decrease in organic pollution in some Estonian streams during 1990�1998. Hydro-biologia, 464, 153�164.

Macroinvertebrates in Estonian streams
57
Turak, E., Flack, L. K., Norris, R. H., Simpson, J. & Waddell, N. 1999. Assessment of river condition at a large spatial scale using predictive models. Freshwater Biol., 41, 283�298.
Vannote, R. L., Minshall, G. W., Cummins, K. W., Sedell, J. R. & Cushing, C. E. 1980. The river continuum consept. Can. J. Fish. Aquat. Sci., 37, 130�137.
Waite, I. R., Herlihy, A. T., Larsen, D. P. & Klemm, D. J. 2000. Comparing strengths of geographic and nongeographic classifications of stream benthic macroinvertebrates in the Mid-Atlantic Highlands, USA. J. North Am. Benthol. Soc., 19, 429�441.
Waite, I. R., Herlihy, A. T., Larsen, D. P., Urquhart, N. S. & Klemm, D. J. 2004. The effects of macro-invertebrate taxonomic resolution in large landscape bioassessments: an example from the Mid-Atlantic Highlands, U.S.A. Freshwater Biol., 49, 474�489.
Water Framework Directive. 2002. The European Parliament and the Council of the European Union. Directive 2000/60/EC.
Weigel, B. M., Wang, L., Rasmussen, P. W., Butcher, J. T., Stewart, P. M., Simon, T. P. & Wiley, M. J. 2003. Relative influence of variables at multiple spatial scales on stream macroinvertebrates in the Northern Lakes and Forest ecoregion, U.S.A. Freshwater Biol., 48, 1440�1461.
Woodiwiss, F. S. 1964. The biological system of stream classifiation used by the Trent River Board. Chem. Ind., 11, 443�447.
Wright, J. 2000. An introduction to RIVPACS. In Assessing the Biological Quality of Fresh Waters: RIVPACS and Other Techniques (Wright, J. F., Sutcliffe, D. W. & Furse, M. T., eds), pp. 1�24. Freshwater Biological Association, Ambleside, Cumbria, UK.
Elupaiga, aastaaja ja proovimeetodi mõju bioloogilise
kvaliteedi kolmele tavalisele hindamistunnusele suurselgrootute järgi Eesti vooluvetes
Henn Timm, Kristiina Mardi ja Tõnu Möls
Euroopa Parlamendi ja Euroopa Nõukogu veepoliitika raamdirektiivi järgi on suurselgrootud põhjaloomad vajalik kvaliteedielement siseveekogude tüpiseeri-miseks ning nende ökoloogilise seisundi klassifitseerimiseks. On uuritud elupaiga, aastaaja ja proovimeetodi mõju kolmele tavalisele kvaliteeditunnusele Eesti voolu-vetes. Töö põhineb 961 proovil, mis koguti 258 jõe või oja eeldatavalt väheolulise inimmõjuga paikadest aastail 1985�2002. Kõik kolm tunnust sõltusid oluliselt jõe suurusest, põhja iseloomust, voolukiirusest ja geograafilisest asukohast. Loodus-likult parim kvaliteet oli jões keskmiselt 30�50 km kaugusel lähtmest alates. Taksoni keskmise tundlikkuse (ASPT) ja orgaanilist reostust näitava indeksi (DSFI) väärtuste geograafiline muutlikkus olid sarnased, kuid erinesid oluliselt taksoni-rikkuse (NTAXA) geograafilisest muutlikkusest. Kõigi kolme tunnuse järgi osutus liivase põhja kvaliteet looduslikult kehvemaks kui kivise põhja oma; samuti aeglasevoolulise jõeosa kvaliteet viletsamaks kui kiirevoolulisel osal (välja arvatud NTAXA puhul). Erinevalt muudest tunnustest ei sõltunud ASPT väärtus oluliselt aastaajast, samuti sõltus see palju vähem proovimeetodist. See võimaldab ASPT-indeksit kasutada vanemate, mittestandardsete proovide bioloogilise kvaliteedi usaldusväärseks hindamiseks.