Embed Size (px)
Citation preview

Permission to reprint or distribute any content from this presentation requires the prior written approval of Standard & Poor’s. Copyright © 2013 by Standard & Poor’s Financial Services LLC. All rights reserved.
Macroeconomic, Sovereign Outlook And The Australian Securitisation Market
12 November, 2013

Australia’s Macro Environment & Sovereign Rating Outlook Craig Michaels S&P Sovereign Ratings

Base case: subdued near-term economic growth
Sources: ABS;; Standard & Poor’s

Business conditions are weak, but may have bottomed
Source: NAB

Mining investment falling… what will drive growth?
Sources: ABS;; Standard & Poor’s

Rising resource export capacity should boost growth Export volumes, quarterly (2010-11 prices)
Source: ABS

Rising unemployment and debt-aversion will limit spending
Source: ABS

Lower interest rates and $A should gradually help investment
Sources: ABS; RBA

Residential investment improving but is not stellar Residential building approvals, monthly
Source: ABS

Outlook for non-mining investment is still subdued
Source: RBA
Capex survey, nominal

Stable outlook on the ‘AAA’ rating supported by: • A sound economic outlook • Expected gradual improvement in fiscal performance • Low government debt • Capacity of exchange rate and monetary policy to cushion shocks These offset a very weak external position Main (downside) risk to the rating is from: • Significant increase in external imbalances
Australia’s sovereign rating

Securitisation Market Outlook Vera Chaplin S&P Structured Finance Ratings

13
RMBS Issuance Has Strengthened
$-
$5,000.00
$10,000.00
$15,000.00
$20,000.00
$25,000.00
$30,000.00
$35,000.00
$40,000.00
$45,000.00
$50,000.00
1 2 3 4 5 6 7 8 9 10 11 12
A$(m
il)
Month
Australian RMBS & Covered Bond New Issurance Cumulative Volume 2012 and 2013 Comparison
2012 RMBS 2013 RMBS 2012 Covered Bond 2013 Covered Bond
Source: Dealogic, Standard &Poor's Copyright: Standard & Poor's
14
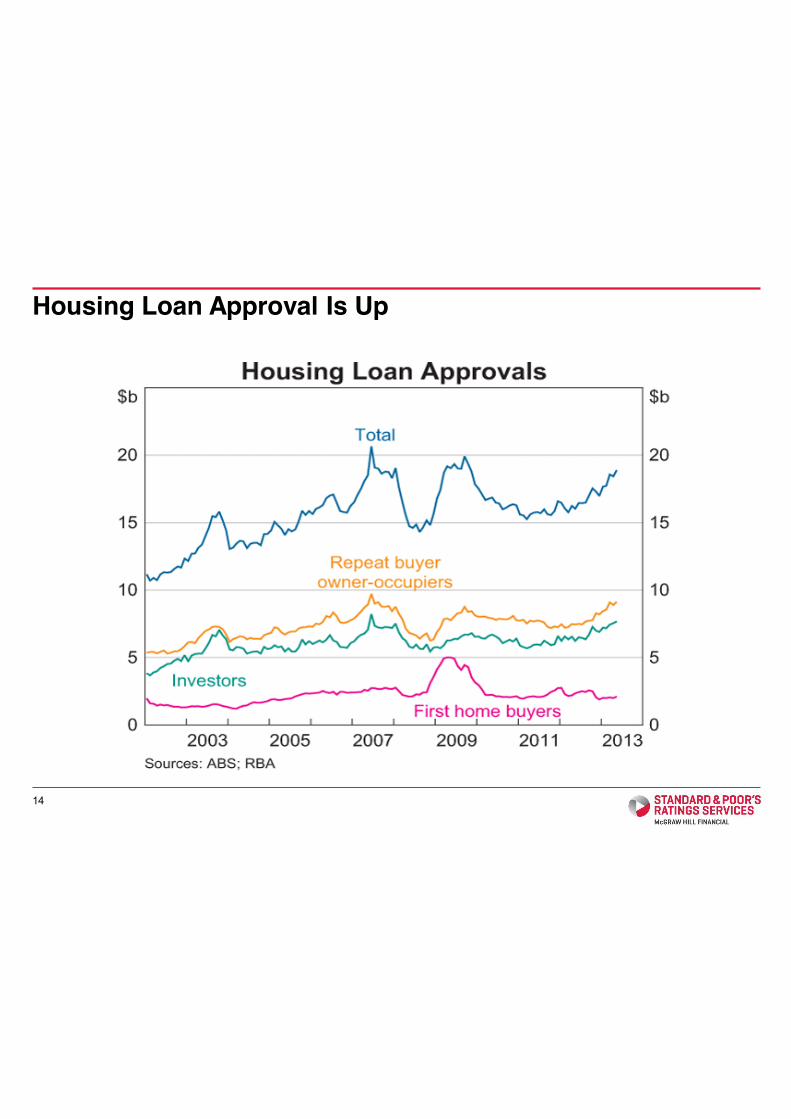
Housing Loan Approval Is Up

15
Credit Growth Have Slowed But Reached Turning Point
0.0
5.0
10.0
15.0
20.0
25.0
1983 1986 1989 1992 1995 1998 2001 2004 2007 2010 2013
% (a
nnua
l rat
e - s
easo
nally
adj
uste
d)
Housing Credit Growth
Source: The Reserve Bank of Australia (Table D1) Copy right: Standard & Poor’s

16
Household Debt to Disposable Income Stablised
60.0
80.0
100.0
120.0
140.0
160.0
180.0
1995 1996 1997 1998 1999 2000 2001 2002 2003 2004 2005 2006 2007 2008 2009 2010 2011 2012
Household Debt As A %of Household Income Comparisons
Australia Canada United Kingdom United States
Source: Reserve Bank of Australia, Australian Bureau of Statistics, National Statistics - Financial Statistics, statistics Canada Copyright: Standard & Poor's 2013

17
Lower Interest Rate Contributes to House Price Growth
0
2
4
6
8
10
12
14
16
18
20
-
50
100
150
200
250
300
350
400
Australian Established House Price Index
Price Index of Established Homes Weighted Average of 8 State Capital Cities (left axis)
Bank housing loan lending rate (%) (right axis)
Source: Standard & Poor's, Australian Bureau of Statistics and the Reserve Bank of Australia Base year for Australian House Price Index 1989/90=100 Copy right: Standard & Poor's 2013

18
Higher Debt Means Higher Interest Paid Even At Lower Rate

19
Australian Household Saving Ratio Indicate Household Caution (Percentage Of Disposable Income)
-5.0
0.0
5.0
10.0
15.0
20.0
25.0
1963 1968 1973 1978 1983 1988 1993 1998 2003 2008 2013
% (s
easo
nally
adj
uste
d)
Household Savings
Household Savings Ratio Average
Source: Australian Bureau of Statistics Catalogue No: 5206, Table1 Copyright: Standard & Poor’s

20
Arrears Are Low But More Sensitive
0.00%
0.20%
0.40%
0.60%
0.80%
1.00%
1.20%
1.40%
1.60%
1.80%
2.00%
1/04
/200
5
1/07
/200
5
1/10
/200
5
1/01
/200
6
1/04
/200
6
1/07
/200
6
1/10
/200
6
1/01
/200
7
1/04
/200
7
1/07
/200
7
1/10
/200
7
1/01
/200
8
1/04
/200
8
1/07
/200
8
1/10
/200
8
1/01
/200
9
1/04
/200
9
1/07
/200
9
1/10
/200
9
1/01
/201
0
1/04
/201
0
1/07
/201
0
1/10
/201
0
1/01
/201
1
1/04
/201
1
1/07
/201
1
1/10
/201
1
1/01
/201
2
1/04
/201
2
1/07
/201
2
1/10
/201
2
1/01
/201
3
1/04
/201
3
1/07
/201
3
Australian RMBS Arrears Comparison
Prime Arrears: > 30days Fulldoc Arrears: > 30days
Source: Standard & Poor's Copyright: Standard & Poor's

21
Performance Responses Are Similar Though By Different Degrees
0.00%
2.00%
4.00%
6.00%
8.00%
10.00%
12.00%
14.00%
16.00%
18.00%
0.00%
0.20%
0.40%
0.60%
0.80%
1.00%
1.20%
1.40%
1.60%
1.80%
1/04
/20
05
1/07
/20
05
1/10
/200
5
1/01
/20
06
1/04
/20
06
1/07
/20
06
1/10
/20
06
1/01
/20
07
1/04
/20
07
1/07
/200
7
1/10
/20
07
1/01
/20
08
1/04
/20
08
1/07
/20
08
1/10
/20
08
1/01
/20
09
1/04
/20
09
1/07
/20
09
1/10
/20
09
1/01
/20
10
1/04
/20
10
1/07
/201
0
1/10
/20
10
1/01
/20
11
1/04
/20
11
1/07
/20
11
1/10
/20
11
1/01
/20
12
1/04
/201
2
1/07
/20
12
1/10
/20
12
1/01
/20
13
1/04
/20
13
1/07
/20
13
Australian RMBS Arrears Comparison
Fulldoc Arrears: > 30days (left axis) Suprime Arrears: > 30days (right axis)
Source: Standard & Poor's Copyright: Standard & Poor's

22
Performance Divergence Is Magnified
0.00%
2.00%
4.00%
6.00%
8.00%
10.00%
12.00%
14.00%
16.00%
18.00%
1/04
/200
5
1/07
/200
5
1/10
/200
5
1/01
/200
6
1/04
/200
6
1/07
/200
6
1/10
/200
6
1/01
/200
7
1/04
/200
7
1/07
/200
7
1/10
/200
7
1/01
/200
8
1/04
/200
8
1/07
/200
8
1/10
/200
8
1/01
/200
9
1/04
/200
9
1/07
/200
9
1/10
/200
9
1/01
/201
0
1/04
/201
0
1/07
/201
0
1/10
/201
0
1/01
/201
1
1/04
/201
1
1/07
/201
1
1/10
/201
1
1/01
/201
2
1/04
/201
2
1/07
/201
2
1/10
/201
2
1/01
/201
3
1/04
/201
3
1/07
/201
3
Australian RMBS Arrears Comparison
Prime Arrears: > 30days Subprime Arrears: > 30days
Fulldoc Arrears: > 30days Lowdoc Arrears: > 30days
Source: Standard & Poor's Copyright: Standard & Poor's

Factors under monitoring: • Macroeconomic trends
• Lending and servicing practices
• Trends by product type
• Lenders’ mortgage insurance performance
Structured finance ratings expect to remain largely stable: • Asset performance remain stable
• Structural enhancement remain robust
• Counterparty rating is likely to be the main cause of impact
Australian Structured Finance Ratings Performance Outlook
23

Copyright © 2013 by Standard & Poor’s Financial Services LLC. All rights reserved.
No content (including ratings, credit-related analyses and data, valuations, model, software or other application or output therefrom) or any part thereof (Content) may be modified, reverse engineered, reproduced or distributed in any form by any means, or stored in a database or retrieval system, without the prior written permission of Standard & Poor’s Financial Services LLC or its affiliates (collectively, S&P). The Content shall not be used for any unlawful or unauthorized purposes. S&P and any third-party providers, as well as their directors, officers, shareholders, employees or agents (collectively S&P Parties) do not guarantee the accuracy, completeness, timeliness or availability of the Content. S&P Parties are not responsible for any errors or omissions (negligent or otherwise), regardless of the cause, for the results obtained from the use of the Content, or for the security or maintenance of any data input by the user. The Content is provided on an “as is” basis. S&P PARTIES DISCLAIM ANY AND ALL EXPRESS OR IMPLIED WARRANTIES, INCLUDING, BUT NOT LIMITED TO, ANY WARRANTIES OF MERCHANTABILITY OR FITNESS FOR A PARTICULAR PURPOSE OR USE, FREEDOM FROM BUGS, SOFTWARE ERRORS OR DEFECTS, THAT THE CONTENT’S FUNCTIONING WILL BE UNINTERRUPTED OR THAT THE CONTENT WILL OPERATE WITH ANY SOFTWARE OR HARDWARE CONFIGURATION. In no event shall S&P Parties be liable to any party for any direct, indirect, incidental, exemplary, compensatory, punitive, special or consequential damages, costs, expenses, legal fees, or losses (including, without limitation, lost income or lost profits and opportunity costs or losses caused by negligence) in connection with any use of the Content even if advised of the possibility of such damages.
Credit-related and other analyses, including ratings, and statements in the Content are statements of opinion as of the date they are expressed and not statements of fact. S&P’s opinions, analyses and rating acknowledgment decisions (described below) are not recommendations to purchase, hold, or sell any securities or to make any investment decisions, and do not address the suitability of any security. S&P assumes no obligation to update the Content following publication in any form or format. The Content should not be relied on and is not a substitute for the skill, judgment and experience of the user, its management, employees, advisors and/or clients when making investment and other business decisions. S&P does not act as a fiduciary or an investment advisor except where registered as such. While S&P has obtained information from sources it believes to be reliable, S&P does not perform an audit and undertakes no duty of due diligence or independent verification of any information it receives.
To the extent that regulatory authorities allow a rating agency to acknowledge in one jurisdiction a rating issued in another jurisdiction for certain regulatory purposes, S&P reserves the right to assign, withdraw or suspend such acknowledgement at any time and in its sole discretion. S&P Parties disclaim any duty whatsoever arising out of the assignment, withdrawal or suspension of an acknowledgment as well as any liability for any damage alleged to have been suffered on account thereof.
S&P keeps certain activities of its business units separate from each other in order to preserve the independence and objectivity of their respective activities. As a result, certain business units of S&P may have information that is not available to other S&P business units. S&P has established policies and procedures to maintain the confidentiality of certain non-public information received in connection with each analytical process.
S&P may receive compensation for its ratings and certain analyses, normally from issuers or underwriters of securities or from obligors. S&P reserves the right to disseminate its opinions and analyses. S&P's public ratings and analyses are made available on its Web sites, www.standardandpoors.com (free of charge), and www.ratingsdirect.com and www.globalcreditportal.com (subscription), and may be distributed through other means, including via S&P publications and third-party redistributors. Additional information about our ratings fees is available at www.standardandpoors.com/usratingsfees.
STANDARD & POOR’S, S&P, GLOBAL CREDIT PORTAL and RATINGSDIRECT are registered trademarks of Standard & Poor’s Financial Services LLC.
Australia
Standard & Poor’s (Australia) Pty. Ltd. holds Australian financial services license number 337565 under the Corporations Act 2001. Standard & Poor’s credit ratings and related research are not intended for and must not be distributed to any person in Australia other than a wholesale client (as defined in Chapter 7 of the Corporations Act).