Embed Size (px)
Citation preview
MACROECONOMICPROJECTIONSFOR SLOVENIA
JUNE 2021

MACROECONOMIC PROJECTIONS FOR SLOVENIA
June 2021
The Macroeconomic Projections for Slovenia are based on figures and information available on 26 May 2021. The figures and text herein may only be used or published if the source is cited. This publication is also available in Slovene.
Title: Macroeconomic Projections for Slovenia Issue: June 2021 Published by: BANKA SLOVENIJE Slovenska 35 1505 Ljubljana Tel: +386 1 4719000 Fax: +386 1 2515516 email: [email protected]
http://www.bsi.si/
ISSN 2463-9990
2
MACROECONOMIC PROJECTIONS FOR SLOVENIA
June 2021
Table of contents
Executive Summary 6
1 International Environment and External Assumptions 9
2 Projections 11
2.1 Economic Activity 12
2.2 Labour Market 22
2.3 Inflation 24
3 The Covid-19 Epidemic and Alternative Scenarios 32
3.1 The Relationship between Containment Measures and Economic Activity 33
3.2 Alternative Epidemiological Scenarios 36
3.3 Methodological Approach 38
3.4 Alternative Scenarios for Economic Activity 38
4 Comparison between Institutions 43
4.1 Comparison of Projections between Institutions 43
4.2 Comparison of Projection Accuracy between Institutions 44
3
MACROECONOMIC PROJECTIONS FOR SLOVENIA
June 2021
Tables:
Table 1 Macroeconomic projections for Slovenia, 2021-2023 8
Table 2 Assumptions for factors from the international environment 10
Table 3 Inflation projections 27
Table 4 Regression results based on POS and online payment data 34
Table 5 Regression results based on Google mobility data 35
Table 6 Underlying assumptions of the baseline projection and alternative scenarios for economic activity 39
Table 7 Real GDP growth across alternative scenarios 41
Figures, tables and boxes:
Figures:
Figure 1 Projection of expenditure components' contributions to GDP growth 12
Figure 2 Projection of growth in private consumption, growth in disposable income and household savings ratio 13
Figure 3 Projection of components' contributions to private consumption growth 13
Figure 4 Projection of components' contributions to gross fixed capital formation growth 14
Figure 5 Contribution of investments co-financed by NGEU funds in 2021-2023 to total projected investment growth 15
Figure 6 Projections of government components' contribution to GDP growth 15
Figure 7 Projections of export and import growth and the current account balance 16
Figure 8 Revision to GDP growth projection by components 17
Figure 9 Employment and unemployment 22
Figure 10 Short-term employment growth prospects 22
Figure 11 Model estimates of employment growth 23
Figure 12 Nominal growth of compensation per employee 23
Figure 13 Wage Phillips curve model estimate of compensation per employee growth in private sector 23
Figure 14 Projection of contributions to inflation by components 24
Figure 15 Projection of contributions to core inflation by components 25
Figure 16 Decomposition of core inflation 25
Figure 17 Contribution of base effects to the change in year-on-year growth in energy prices 26
Figure 18 Revision of inflation projections 27
Figure 19 Containment measures and online payments 33
Figure 20 Containment measures and industrial production 35
Figure 21 Static VAR model estimates of the impact of containment measures on value added loss by sectors 36
Figure 22 Time-varying-parameter VAR model estimates of the impact of containment measures on value added loss by 36
sectors
Figure 23 Number of vaccinations across scenarios 37
Figure 24 Number of new confirmed cases across scenarios 38
Figure 25 Number of hospitalisations across scenarios 38
Figure 26 Oxford Stringency Index across scenarios 40
Figure 27 Decomposition of GDP growth over the projection horizon by scenarios 40
Figure 28 Level of GDP over the projection horizon by scenario 41
Figure 29 Level of value added from industry and construction over the projection horizon by scenario 41
Figure 30 Level of value added from contact-intensive services sectors over the projection horizon by scenario 42
Figure 31 Comparison of GDP projections between institutions 43
Figure 32 Comparison of inflation projections between institutions 44
4
MACROECONOMIC PROJECTIONS FOR SLOVENIA
June 2021
Table 8 Basic accuracy measures of GDP growth projections, based on first available data 46
Table 9 RMSE and SRMSE of GDP growth projections, based on first available data 47
Table 10 Basic accuracy measures of inflation projections, based on first available data 48
Table 11 RMSE and SRMSE of inflation projections, based on first available data 49
Boxes:
Box 1 Explanation of deviations in Banka Slovenije’s projection for 2020 from realisations and assessment of the carry-over 18
effect to annual growth in 2021
Box 2 Projections of the general government balance and debt, and assessment of the effect of fiscal policy measures on 26
economic activity
Box 3 Impact of the change in HICP weights on the inflation projection 28
5

MACROECONOMIC PROJECTIONS FOR SLOVENIA
June 2021
The current macroeconomic projections are more favourable than the previous ones on account of the improvement in the
health situation. Economic growth is expected to reach 5.2% this year, 4.8% next year and 3.1% in 2023. According to current
estimates, the pre-crisis level of GDP from 2019 will be reached at the beginning of next year.
Following the outbreak of the Covid-19 pandemic, the health situation has become one of the key drivers of global economic
developments. With the availability of effective vaccines towards the end of last year and the steadily increasing share of vac-
cinated population, the spread of infections has started to slow down, at least in Slovenia and its main trading partners. Never-
theless, a great deal of uncertainty remains regarding the ongoing evolution of the pandemic. To address this, the baseline
projection is accompanied with alternative scenarios that reflect the possible deterioration of the health situation. The latter
could be influenced by several factors such as an insufficient share of vaccinated population and the emergence of new
strains of the virus against which currently available vaccines and the immune protection of persons who have already recov-
ered would be ineffective.
The baseline macroeconomic projection is based on an epidemiological scenario without major waves of infections that would
require non-pharmaceutical containment measures such as a broader and more protracted lockdown. We also assess eco-
nomic growth will continue to be supported by monetary and fiscal policy measures. Already last year, they significantly miti-
gated the adverse effects of the pandemic and the associated containment measures, which while helping maintain the stabil-
ity of the healthcare system, simultaneously inflicted adverse economic effects. We estimate that, in the absence of economic
policy measures, economic activity would have contracted by close to one-tenth last year. Economic policy measures continue
to remain supportive this year as well, mitigating the adverse consequences of the crisis on both firms and households.
Economic growth will be driven by both domestic and foreign demand. Namely, we expect a recovery in household spending
and higher private-sector and government investment activity, underpinned by investment co-financed with sources from the
Next Generation EU fund. Over the entire projection horizon, growth will also be supported by government spending. With the
recovery in the economic activity of trading partners, encouraging growth in exports of goods and services is also expected.
The favourable developments on the labour market will strengthen household spending on account of improving epidemiologi-
cal situation and the gradual dissipation of economic uncertainty. We expect that the revival in economic activity will lead to
additional hiring by firms as early as this year. This will be reflected in the unemployment rate, which will remain similar to that
of last year. With the continued economic recovery, a relatively favourable employment growth and a gradual decline in the
unemployment rate are also expected in the coming years, with the latter expected to fall to a historically low level at the end
of the projection horizon. Consequently, the pre-crisis challenges related to shortages of qualified labour will once again be-
come more pronounced. As a result, wage pressures are expected to intensify towards the end of the projection horizon. Tem-
porary emergency measures will have a significant impact on wage developments, particularly this year and the next. During
the epidemic, these measures were mainly aimed at preserving jobs and the purchasing power of households, especially the
most vulnerable groups of the population.
Growth in consumer prices will strengthen over the projection horizon. In addition to external factors linked to growth in the
prices of oil and other commodities on the global markets, domestic inflation factors will also strengthen. With the recovery in
domestic demand, supported by targeted economic policy measures, and rising cost pressures in the context of favourable
conditions on the labour market, we expect a considerable rise in core inflation. Due to the technical effect of the change in
weights as a result of altered consumer purchasing habits during the epidemic last year, average core inflation will be relative-
ly low this year, but will rise to 1.6% next year and 1.7% in 2023. Following last year’s drop in consumer prices, we expect
Executive Summary
6

MACROECONOMIC PROJECTIONS FOR SLOVENIA
June 2021
inflation to reach 1.3% already this year, driven primarily by energy prices. The latter will be higher this year on account of
base effects, underlining the sharp drop in global oil prices following the outbreak of the epidemic last year. In Slovenia, the
decline in energy price inflation last year was also driven by the government’s excise duty policy and the measure aimed at
reducing electricity prices during the first wave of the epidemic. Over the remainder of the projection horizon, we expect the
growth in the prices of services and non-energy industrial goods to strengthen, and together with the rising food prices to drive
up headline inflation.
Uncertainty associated with the epidemic is accompanied by other risks that are still prominent and the materialization of
which could have a significant impact on economic growth and inflation. In addition to geopolitical tensions in the Middle East,
risks stemming from challenges in global supply chains are increasing. For now, the shortage of certain raw materials and
intermediate products, reflected in the high growth in their prices underlining the rapid growth in demand following the lifting of
containment measures and the launch of the investment cycle, is assessed as a temporary challenge expected to subside in a
few months. Should the challenges persist, they could be reflected in slower growth in economic activity and faster growth in
prices. The latter could also increase should households’ marginal propensity to consume rise more significantly following the
epidemic, which would at the same time further accelerate growth in GDP. This would also be facilitated by the historically
high savings accumulated by households during the period of stringent containment measures. On account of the latter, con-
sumption patterns also changed significantly last year, which represents an additional (technical) challenge related to the
measurement and projection of inflation in the current juncture.
7
MACROECONOMIC PROJECTIONS FOR SLOVENIA
June 2021
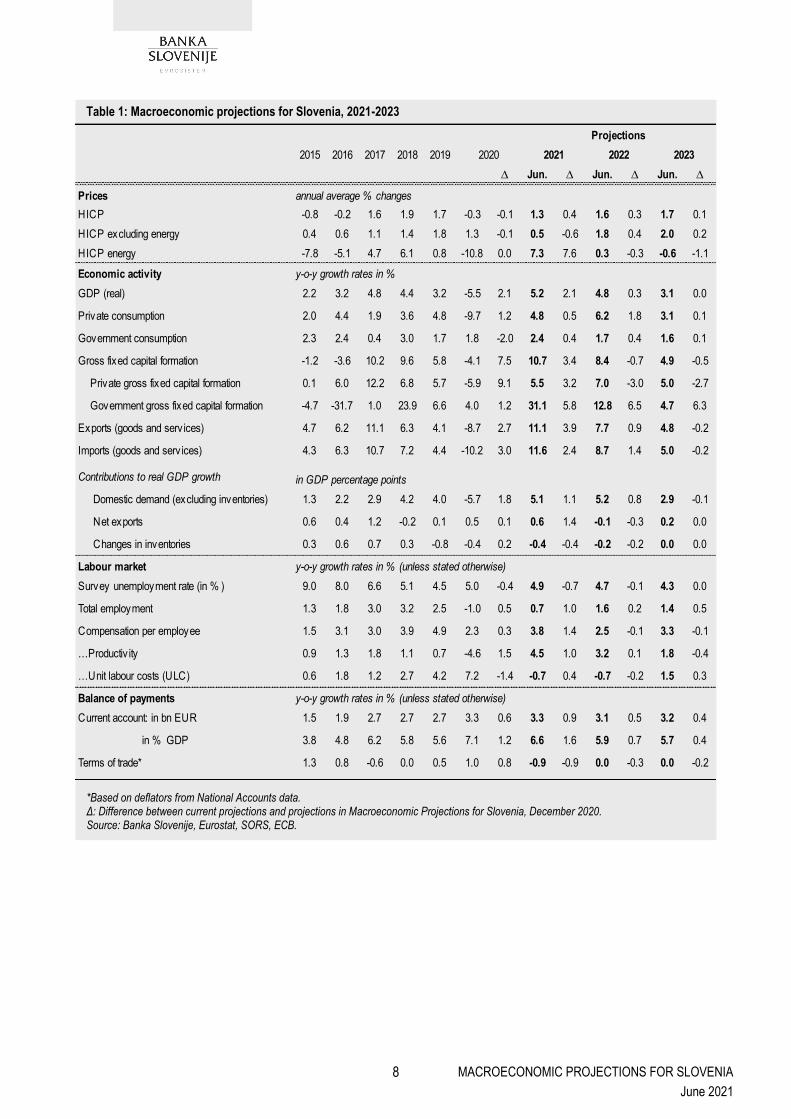
Table 1: Macroeconomic projections for Slovenia, 2021-2023
*Based on deflators from National Accounts data. Δ: Difference between current projections and projections in Macroeconomic Projections for Slovenia, December 2020. Source: Banka Slovenije, Eurostat, SORS, ECB.
2015 2016 2017 2018 2019
∆ Jun. ∆ Jun. ∆ Jun. ∆
Prices annual average % changes
HICP -0.8 -0.2 1.6 1.9 1.7 -0.3 -0.1 1.3 0.4 1.6 0.3 1.7 0.1
HICP excluding energy 0.4 0.6 1.1 1.4 1.8 1.3 -0.1 0.5 -0.6 1.8 0.4 2.0 0.2
HICP energy -7.8 -5.1 4.7 6.1 0.8 -10.8 0.0 7.3 7.6 0.3 -0.3 -0.6 -1.1
Economic activity y-o-y growth rates in %
GDP (real) 2.2 3.2 4.8 4.4 3.2 -5.5 2.1 5.2 2.1 4.8 0.3 3.1 0.0
Private consumption 2.0 4.4 1.9 3.6 4.8 -9.7 1.2 4.8 0.5 6.2 1.8 3.1 0.1
Government consumption 2.3 2.4 0.4 3.0 1.7 1.8 -2.0 2.4 0.4 1.7 0.4 1.6 0.1
Gross fixed capital formation -1.2 -3.6 10.2 9.6 5.8 -4.1 7.5 10.7 3.4 8.4 -0.7 4.9 -0.5
Private gross fixed capital formation 0.1 6.0 12.2 6.8 5.7 -5.9 9.1 5.5 3.2 7.0 -3.0 5.0 -2.7
Government gross fixed capital formation -4.7 -31.7 1.0 23.9 6.6 4.0 1.2 31.1 5.8 12.8 6.5 4.7 6.3
Exports (goods and serv ices) 4.7 6.2 11.1 6.3 4.1 -8.7 2.7 11.1 3.9 7.7 0.9 4.8 -0.2
Imports (goods and serv ices) 4.3 6.3 10.7 7.2 4.4 -10.2 3.0 11.6 2.4 8.7 1.4 5.0 -0.2
Contributions to real GDP growth in GDP percentage points
Domestic demand (excluding inventories) 1.3 2.2 2.9 4.2 4.0 -5.7 1.8 5.1 1.1 5.2 0.8 2.9 -0.1
Net exports 0.6 0.4 1.2 -0.2 0.1 0.5 0.1 0.6 1.4 -0.1 -0.3 0.2 0.0
Changes in inventories 0.3 0.6 0.7 0.3 -0.8 -0.4 0.2 -0.4 -0.4 -0.2 -0.2 0.0 0.0
Labour market y-o-y growth rates in % (unless stated otherwise)
Survey unemployment rate (in % ) 9.0 8.0 6.6 5.1 4.5 5.0 -0.4 4.9 -0.7 4.7 -0.1 4.3 0.0
Total employment 1.3 1.8 3.0 3.2 2.5 -1.0 0.5 0.7 1.0 1.6 0.2 1.4 0.5
Compensation per employee 1.5 3.1 3.0 3.9 4.9 2.3 0.3 3.8 1.4 2.5 -0.1 3.3 -0.1
…Productiv ity 0.9 1.3 1.8 1.1 0.7 -4.6 1.5 4.5 1.0 3.2 0.1 1.8 -0.4
…Unit labour costs (ULC) 0.6 1.8 1.2 2.7 4.2 7.2 -1.4 -0.7 0.4 -0.7 -0.2 1.5 0.3
Balance of payments y-o-y growth rates in % (unless stated otherwise)
Current account: in bn EUR 1.5 1.9 2.7 2.7 2.7 3.3 0.6 3.3 0.9 3.1 0.5 3.2 0.4
in % GDP 3.8 4.8 6.2 5.8 5.6 7.1 1.2 6.6 1.6 5.9 0.7 5.7 0.4
Terms of trade* 1.3 0.8 -0.6 0.0 0.5 1.0 0.8 -0.9 -0.9 0.0 -0.3 0.0 -0.2
2022 202320212020
Projections
8

MACROECONOMIC PROJECTIONS FOR SLOVENIA
June 2021
Global economic activity is expected to recover rela-
tively strongly already this year, with encouraging
GDP growth expected to be maintained over the me-
dium term. The development of global economic activity
over the projection horizon will depend primarily on how
well the pandemic is managed, the scope of international
trade and additional fiscal stimuli, at this time especially in
the US. Outlooks for global economic growth remain en-
couraging until the end of projection horizon, despite the
risks associated with the pandemic and the potential
longer-term consequences of disrupted international sup-
ply chains. The gradual stabilisation of conditions is also
reflected in economic activity in the euro area, which en-
tered this year in relatively weak conditions. The recovery
in private consumption, together with a stronger external
environment, and a revival in investment activity, support-
ed by fiscal measures and sources from the Next Gener-
ation EU (NGEU) fund are going to be the primary factors
strengthening the economic growth. According to the
current baseline Eurosystem/ECB Staff projections for the
euro area, real GDP growth is projected to reach 4.6%
this year, before slowing to 2.1% by the end of the projec-
tion horizon. This means that real GDP should reach its
pre-epidemic level from 2019 already at the beginning of
next year. Improved conditions in the external environ-
ment are also reflected in the higher assumption for Slo-
venia's foreign demand growth, which is expected to
strengthen relatively quickly already this year and support
growth in Slovenia's exports of goods and services over
the entire projection horizon.
As the epidemiological situation remains uncertain,
two alternative scenarios (mild and severe) were pre-
pared in the current projections of economic activity
in the euro area. The scenarios differ from the baseline
projection mainly in terms of epidemiological assump-
tions. The mild scenario envisages the lifting of stringent
measures to contain the virus by the end of this year,
resulting in the more rapid and broad-based economic
recovery. The severe scenario, on the other hand, as-
sumes a less successful implementation of the medical
solution due to potential problems related to the supply of
vaccines and their effectiveness against new strains of
the virus, and the diminishing willingness of people to get
vaccinated. Certain restrictive measures could thus re-
main in place throughout the first half of 2023, which
would result in more sustained economic losses. Should
Following last year’s sharp drop due to the pandemic, global economic activity is expected to make a relatively
strong recovery already this year, while encouraging GDP growth is expected over the medium term. Econom-
ic growth in the euro area is expected to reach 4.6% this year, which is slightly higher than in the December
projections. With the successful implementation of the medical solution, especially the distribution of effective
vaccines, which will facilitate a faster recovery in economic activity as early as the second half of this year,
GDP growth is expected to reach 4.7% in 2022 and 2.1% in 2023. The baseline projection for the euro area is
accompanied with two alternative scenarios, which reflect different epidemiological assumptions. Under the
severe scenario, this year's growth in GDP is expected to reach 2.9%, compared with 6.2% under the mild
scenario. The technical assumptions for the projection horizon suggest an average Brent crude oil price of
around USD 64.1 per barrel and an appreciation of the euro exchange rate, and are based on information
available by the cut-off date of 18 May 2021.
1 International Environment and External Assumptions
9

MACROECONOMIC PROJECTIONS FOR SLOVENIA
June 2021
the severe scenario be realised, the pre-crisis level of
euro area economic activity from 2019 would not be
reached until the end of the projection horizon. In accord-
ance with the alternative scenarios, this year’s euro area
GDP is expected to strengthen between 2.9% (severe
scenario) and 6.2% (mild scenario).
The technical assumptions over the projection hori-
zon reflect a sharp increase in US dollar prices of
Brent crude and a somewhat stronger euro exchange
rate. The assumptions for developments in commodity
prices are based on market expectations on futures mar-
kets over a two-week period ending on the cut-off date.1
After falling by more than 30% last year, the price of
crude oil is expected to rise to USD 65.8 per barrel this
year and fall slightly in 2022 and 2023 (to USD 64.6 and
USD 61.9 per barrel, respectively). In line with the ECB
methodology, which takes into account futures contract
prices, growth of non-energy commodities’ prices is ex-
pected to reach 39% this year. The latter is expected to
slow noticeably next year, before falling by 8.0% in 2023.
The technical assumption for the euro exchange rate
against the US dollar remains unchanged over the projec-
tion horizon and stands at the average levels prevailing in
the two-week period ending on the cut-off date. This en-
tails an average exchange rate of USD 1.21 to the euro.
Table 2: Assumptions for factors from the international environment
Source: ECB, Banka Slovenije calculations.
1 The technical assumptions are based on information available on the cut-off date of 18 May 2021. The assumptions for Slovenia's foreign de-mand and the external technical assumptions of medium-term projections that serve as the basis for Banka Slovenije’s projections are prepared within the scope of the joint Eurosystem/ECB Staff projection exercise. For more on the methodology, see the latest release of the Eurosystem/
ECB Staff projections, available on the ECB’s website (link).
2015 2016 2017 2018 2019 2020 2021 2022 2023
World (excluding Euro Area) real GDP growth (in % ) 3.6 3.3 3.8 3.8 2.9 -2.4 6.2 4.2 3.7
Real GDP growth in Euro Area (in % ) – baseline projection 2.0 1.9 2.8 1.9 1.3 -6.8 4.6 4.7 2.1
Real GDP growth in Euro Area (in % ) – mild scenario 6.2 5.5 2.2
Real GDP growth in Euro Area (in % ) – severe scenario 2.9 2.3 2.2
Foreign demand for Slovenia (growth in % ) – baseline projection 3.2 3.7 6.4 4.4 2.7 -9.8 9.3 6.4 3.7
Oil price (in USD/barrel) 52.4 44.0 54.4 71.1 64.0 42.3 65.8 64.6 61.9
Oil price (in EUR/barrel) 47.2 39.8 48.2 60.2 57.2 37.0 54.5 53.3 51.1
Oil price (in USD/barrel, growth in % ) -47.0 -15.9 23.5 30.7 -9.9 -33.9 55.6 -1.9 -4.1
Exchange rate (EUR/USD) 1.11 1.11 1.13 1.18 1.12 1.14 1.21 1.21 1.21
Non-energy commodity prices (growth in % ) -15.8 -2.3 7.7 3.8 -3.6 3.2 39.0 0.1 -8.0
Assumptions
10
MACROECONOMIC PROJECTIONS FOR SLOVENIA
June 2021
2 Projections
The latest projections of economic growth in Slovenia reflect the improvement in the epidemiological picture at
home and in the main trading partners. The expected recovery will continue to depend on the health situation
also in the future. The main epidemiological scenario on which current projections are based does not envis-
age any major new waves of infections that would require the reinstatement of stringent containment
measures or another broader lockdown. On the contrary, with the gradual easing of containment measures,
we expect that alongside the rebound in foreign demand, GDP growth will be supported also by a recovery in
domestic demand. The latter will be driven in particular by private consumption, while gross fixed capital for-
mation will also be a major factor. Investment activity by the government and the private sector will be boosted
by co-financing with sources from the Next Generation EU (NGEU) fund. In addition to domestic demand, the
activity of the Slovenian export sector will also be encouraging.
The labour market will see a significant recovery already this year, as observed in the favourable development
in registered unemployment during the first five months of this year and the optimistic expectations of firms
regarding future employment. Following last year’s 1% drop, we expect employment to rise by 0.7% in the
context of a rapid recovery in economic activity, while the surveyed unemployment rate will be similar to that of
last year, standing at 4.9%. A broader-based recovery during the summer months will reduce firms’ needs for
job retention schemes, albeit, the premature withdrawal of these measures poses downside risks to projec-
tions. Wages will rise by almost 4% this year, largely on account of one-off effects linked to the epidemic and
the increase in the minimum wage. In the coming years, we can expect significant growth in employment to
continue, with the unemployment rate falling to a historically low level at the end of the projection horizon. Pre-
crisis limiting factors will again return to centre stage, as firms will increasingly face a shortage of qualified la-
bour, similar to the pre-crisis period. As a result, wage pressures will intensify gradually towards the end of the
projection horizon. However, the effects of the lifting of emergency measures will partially mask those pres-
sures in 2022.
Inflation will increase this year and stand at 1.3%. Despite rising domestic inflationary pressures, a more signif-
icant rise will be mitigated by relatively weak growth in the prices of domestic components. Following deflation
during the first quarter of the year, core inflation will rise until the end of the year in the context of higher wage
growth, a recovery in private consumption and challenges in supply and production chains, but will average
just 0.2%. The weaker growth in prices will stem also from a significant change in HICP weights. As a result of
the latter, this year, core inflation and headline inflation will be lower by 0.3 and 0.4 percentage points respec-
tively. Underlining base effects and a sharp rise in global oil prices, this year’s headline inflation will be driven
by rising energy prices, and by rising food prices in the context of growth in food commodity prices and higher
production costs. The structure of consumer price growth will change as early as next year in line with the re-
covery in the domestic economy and rising domestic price pressures. In particular, the contribution of services
price inflation will increase, while the prices of non-energy industrial goods will also rise slightly underlining the
11

MACROECONOMIC PROJECTIONS FOR SLOVENIA
June 2021
2.1 Economic activity
The latest projections of economic growth in Slove-
nia reflect the improvement in the epidemiological
picture at home and in the main trading partners. This
underlines primarily the availability of effective vaccines,
which led to the initial lifting of enacted containment
measures, which have had a significant impact on eco-
nomic activity since the outbreak of the virus at the begin-
ning of 2020. According to the latest estimates, the Slo-
venian economy will reach the pre-crisis level of GDP
from 2019 at the beginning of next year. Economic
growth will reach 5.2% this year, 4.8% next year and
3.1% in 2023.
Economic activity will continue to hinge upon the
evolution of the health situation and the duration of
containment measures enacted to limit the spread of
infections. While these measures remain crucial to main-
tain the stability of the healthcare system, they simultane-
ously inflict adverse effects on the economy, which have
nevertheless been mitigated by fiscal support and mone-
tary policy measures at both the national and European
levels. Due to prevailing uncertainty, alongside the base-
line scenario we have prepared alternative scenarios for
the evolution of the epidemic2 based on various assump-
tions (number of persons vaccinated, the virulence of the
virus, non-pharmaceutical measures, etc.), mainly in
terms of the number of infections, hospitalisations and
deaths. Epidemiological developments remain an im-
portant element for the projections of macroeconomic
developments.
The epidemiological scenario on which the current
baseline projection is based does not envisage any
major waves of new infections. This scenario is based
on the assumption of a sufficient share of the population
vaccinated as early as the beginning of the summer and
the maintenance of that share in the months that follow
when the effectiveness of vaccines will gradually diminish
and additional doses will be required. In this scenario, we
expect the gradual lifting of containment measures in
accordance with the government plan,3 aimed primarily at
tourism, arts and entertainment activities. Notwithstand-
ing the improved epidemiological picture, we expect
some containment measures (e.g. social distancing) to
remain in place even in the coming years, and to partially
curtail the activity of those services where direct contact
between the service provider and customer is crucial. The
latter is also envisaged in the government plan for the
lifting of containment measures.
With the easing of containment measures, domestic
demand factors will serve as the main drivers in
5.24.8
3.1
-5.5
-12
-10
-8
-6
-4
-2
0
2
4
6
8
-12
-10
-8
-6
-4
-2
0
2
4
6
8
09 10 11 12 13 14 15 16 17 18 19 20 21 22 23changes in inventories gross fixed capital formation
net exports government consumption
private consumption GDP, growth
Figure 1: Projection of expenditure components' contributions to GDP growth
annual growth in %, contributions in p.p.
Note: Due to rounding, sums of components may differ from aggregate values. Source: SORS, Banka Slovenije projections.
2 The general epidemiological assumptions are harmonised within the scope of the joint Eurosystem/ECB Staff macroeconomic projection exer-cise. Additional detailed simulations for Slovenia have been prepared in cooperation with Professor Janez Žibert from the Faculty of Health Sci-ences at the University of Ljubljana and a member of the Covid-19 Tracker team, using an extended SEIR C19SI epidemiological model (V2.0) based on data from the Covid-19 Tracker. The prepared alternative scenarios for Slovenia are not part of the joint Eurosystem/ECB Staff macroe-
conomic projections. Details on the alternative scenarios are presented in Chapter 3 of this publication.
3 Details regarding the government plan to lift measures to contain the Covid-19 epidemic are available on the Slovenian government website.
growth in import prices. Thus, both headline and core inflation will reach 1.7% by the end of the projection hori-
zon. In addition to risks related to the evolution of the epidemic, the current projections are subject to risks
stemming from a faster unwinding of accumulated household savings and more sustained challenges on the
supply side.
12

MACROECONOMIC PROJECTIONS FOR SLOVENIA
June 2021
strengthening economic growth. Following last year’s
sharp drop in household consumption, which was largely
due to enacted containment measures and the conse-
quent limited activity of numerous economic sectors,
growth in private consumption is expected to be tempo-
rarily higher over the projection horizon, particularly this
year and the next. Growth in investment will also be rela-
tively strong and will be further enhanced by investments
co-financed with sources from the NGEU fund. Addition-
ally, economic activity will be supported by government
consumption over the entire projection horizon. With the
improving health situation and the recovery in demand of
the main export markets during the next three years, we
expect exports to strengthen and the contribution of net
trade to GDP growth to be relatively small, as growth in
imports will also strengthen significantly due to the large
import-intensity of exports and domestic demand compo-
nents (Figure 1).
Private consumption will be the most important driv-
er of economic growth. Following last year’s sharp
drop, primarily on account of enacted containment
measures and higher level of uncertainty, the recovery in
private consumption is expected to accelerate, albeit tem-
porarily, underlining the stabilization of the health situa-
tion and the easing of containment measures. The recov-
ery will be further supported by relatively favourable la-
bour market developments reflected in a historically low
unemployment rate, further growth in gross disposable
household income enhanced by growth in both wages
and employment, and higher consumer confidence on
account of dissipating economic uncertainty. In the con-
text of a recovery in hardest-hit economic sectors, we
also expect an increase in the purchasing power of
households that are dependent on those sectors, given
that the compensation received by workers on temporary
lay-offs and those on short-time work was smaller than
their regular earnings. Growth in private consumption,
which is expected to average 4.7% over the projection
horizon, will be further supported by favourable financing
conditions on account of enacted monetary policy
measures.
The household saving’s ratio will fall gradually in the
coming years, but remain somewhat above the pre-
crisis level. The inability to spend during last year’s lock-
down was reflected in a sharp rise in the household sav-
ing’s ratio (Figure 2). That rate rose by more than 11 per-
centage points to nearly 25% of disposable income. The
main driver of the unprecedented increase in the house-
hold’s savings ratio is attributed to forced savings, while
precautionary savings by households also played a role
underlining the elevated economic uncertainty caused by
the outbreak of the epidemic.4 According to Eurostat sur-
vey figures,5 the increase in savings was driven primarily
4 More details on the drivers of the household savings ratio and heterogeneity amongst households following the outbreak of the Covid-19 epi-
demic are presented in Boxes 1 and 2 in the December 2020 issue of Macroeconomic Projections for Slovenia.
5 DG-ECFIN Consumer survey.
-9.7
4.8
6.2
3.1
-12-10-8-6-4-20246810
-12-10-8-6-4-202468
10
09 10 11 12 13 14 15 16 17 18 19 20 21 22 23food and beveraged clothing and footwearhousing transportrecreation and culture restaurants and hotelsother private consumption
annual growth in %, contributions in p.p.
Note: Due to rounding, sums of components may differ from aggregate values. The "housing" component includes rents, running/utility costs and maintenance, and purchases of household equipment and furniture. Source: SORS, Banka Slovenije calculations and projections.
Figure 3: Projection of components' contributions to private consumption growth
-30
-25
-20
-15
-10
-5
0
5
10
15
20
25
30
09 11 13 15 17 19 21 23
change in savings ratio
savings ratio, in %
private consumption
disposable income
Note: Data on the right graph is presented in deviation from the long-term average (13.2%). *Based on mobility index. **Based on expected unemployment.Source: SORS, Google Mobility, Banka Slovenije estimations and projections.
Figure 2: Projection of growth in private consumption, growth in disposable income and household savings ratio
annual growth in %, diff. in p.p.
-16
-12
-8
-4
0
4
8
12
16
2020
forced savings*
precationary savings**
other factors
residual
contributions in p.p.
13
MACROECONOMIC PROJECTIONS FOR SLOVENIA
June 2021
by households with higher income, where the proportion
of expenditure on goods and services that were not avail-
able during the lockdown is highest on average. On the
other hand, individuals employed in the hardest-hit sec-
tors, which pay below-average wages, recorded a drop in
income. The household saving’s ratio was, in fact, nega-
tive for some of these households, despite numerous
fiscal measures that greatly mitigated the consequences
of the epidemic. With the stabilisation of the situation, we
expect the main drivers behind the increase in savings to
gradually fade, which will be seen over the projection
horizon in higher growth in household consumption rela-
tive to disposable income and thus a lower household
saving’s ratio, which will remain somewhat higher than
the pre-crisis level.
The structure of household consumption will gradu-
ally return to that of the pre-crisis over the projection
horizon. The consumption decisions of households
changed on account of measures to contain the spread of
the virus. The reduced mobility of the population, work
from home, the limited functioning of a large fraction of
services activities, in particular accommodation, catering,
recreation, culture and personal care, were all reflected in
a different structure of consumption (Figure 3). With the
normalisation of the health situation, we expect the struc-
ture of consumption to gradually return to that of the pre-
crisis. Relatively high growth in consumption is expected
this year and the next, primarily in those categories of
consumption that were precluded last year and deferred
due to increased uncertainty. We expect stronger growth
in the consumption of non-essential durables and semi-
durables, such as cars, and strong demand for accommo-
dation and food services. Contributing to the latter will be
the utilisation of holiday vouchers. We estimate that con-
sumers will utilise close to one-half of previously unused
holiday vouchers.
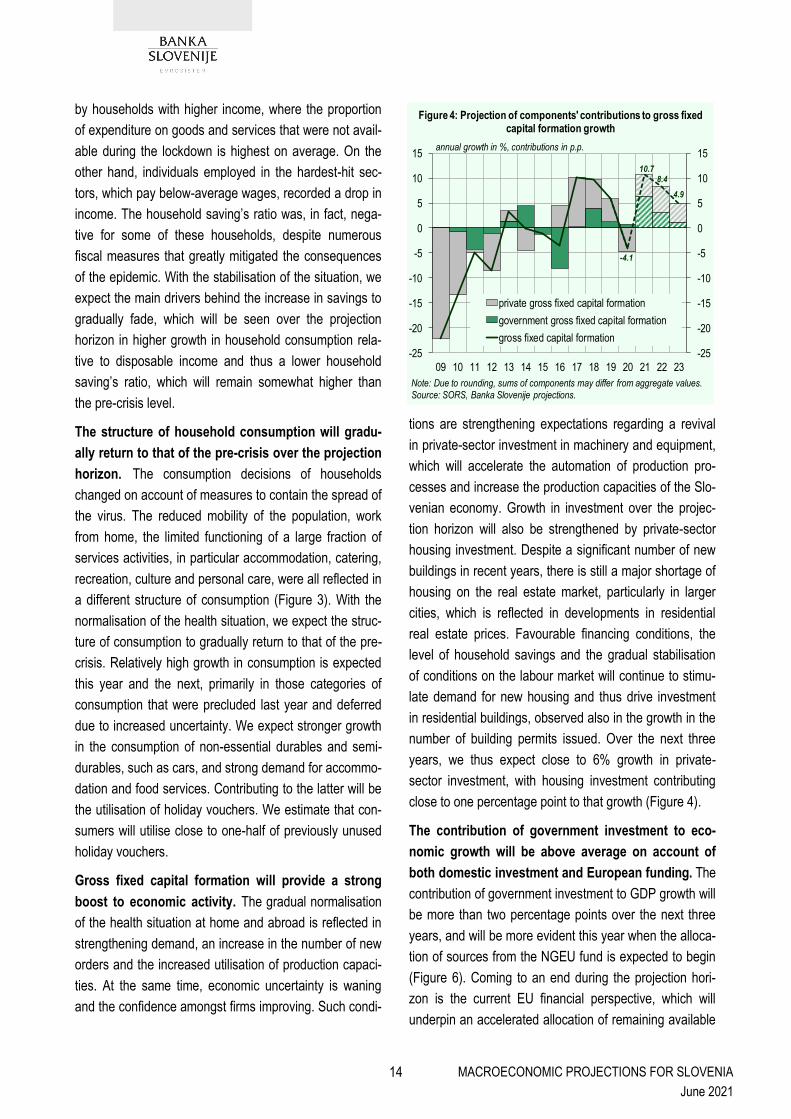
Gross fixed capital formation will provide a strong
boost to economic activity. The gradual normalisation
of the health situation at home and abroad is reflected in
strengthening demand, an increase in the number of new
orders and the increased utilisation of production capaci-
ties. At the same time, economic uncertainty is waning
and the confidence amongst firms improving. Such condi-
tions are strengthening expectations regarding a revival
in private-sector investment in machinery and equipment,
which will accelerate the automation of production pro-
cesses and increase the production capacities of the Slo-
venian economy. Growth in investment over the projec-
tion horizon will also be strengthened by private-sector
housing investment. Despite a significant number of new
buildings in recent years, there is still a major shortage of
housing on the real estate market, particularly in larger
cities, which is reflected in developments in residential
real estate prices. Favourable financing conditions, the
level of household savings and the gradual stabilisation
of conditions on the labour market will continue to stimu-
late demand for new housing and thus drive investment
in residential buildings, observed also in the growth in the
number of building permits issued. Over the next three
years, we thus expect close to 6% growth in private-
sector investment, with housing investment contributing
close to one percentage point to that growth (Figure 4).
The contribution of government investment to eco-
nomic growth will be above average on account of
both domestic investment and European funding. The
contribution of government investment to GDP growth will
be more than two percentage points over the next three
years, and will be more evident this year when the alloca-
tion of sources from the NGEU fund is expected to begin
(Figure 6). Coming to an end during the projection hori-
zon is the current EU financial perspective, which will
underpin an accelerated allocation of remaining available
-4.1
10.78.4
4.9
-25
-20
-15
-10
-5
0
5
10
15
-25
-20
-15
-10
-5
0
5
10
15
09 10 11 12 13 14 15 16 17 18 19 20 21 22 23
private gross fixed capital formation
government gross fixed capital formation
gross fixed capital formation
Figure 4: Projection of components' contributions to gross fixed capital formation growth
annual growth in %, contributions in p.p.
Note: Due to rounding, sums of components may differ from aggregate values. Source: SORS, Banka Slovenije projections.
14

MACROECONOMIC PROJECTIONS FOR SLOVENIA
June 2021
funds, while certain major infrastructure projects that are
being financed primarily from domestic funds (e.g. the
second track of the Divača-Koper line and the purchase
of new multiple train units) are also being implemented.
Projected growth in government investment is higher than
in the December projection, while its share to total invest-
ment is also higher. This stems primarily from the national
recovery and resilience plan approved at the end of April,
with a major share of the funds from that plan earmarked
for the government sector. Estimates surrounding invest-
ment are extremely uncertain, as their implementation
depends not only on the provision of domestic sources of
funding and the allocation of EU funds, but also on other
factors (e.g. the protracted process of obtaining authori-
sations, the selection of contractors, etc.).
Government and private-sector investment activity
will be stimulated by the use of available sources
from the NGEU fund.6 Available European funds will be
an important source for the financing of corporate invest-
ment in the digitalisation of production processes, the
modernisation of technological equipment, the introduc-
tion of new technologies and the gradual transition to a
more energy efficient economy. The fund also facilitates
development investment in more carbon-friendly technol-
ogies in the area of transport, in particular the railway
infrastructure, and the improvement of the energy effi-
ciency of buildings, the introduction of new public admin-
istration e-services, and other social areas, including
healthcare. A major fraction of these funds will be ear-
marked for government investment. Based on govern-
ment plans, we estimate that investment co-financed with
the aforementioned funds will contribute between 0.3 and
0.4 percentage points to overall GDP growth, and an
average of around two percentage points to growth in
gross fixed capital formation per year (Figure 5).
Growth in final government consumption over the
projection horizon will be similar to the average
growth of the last five years, albeit slightly higher
than envisaged in the previous projections (Figure 6).
Real growth in government consumption over the projec-
tion horizon has been revised slightly upwards, to 2.4%
this year. In the context of the continuing adverse epide-
miological situation during the first half of the year, the
official state of the epidemic was extended until the mid-
dle of June, which led to an increase in epidemic-related
expenditure. Growth in compensation of employees, in
particular, is higher than in the previous projections. The
main factor in the latter pertain to bonuses paid to public-
sector employees in connection with the epidemic. This
year’s bonuses are expected to exceed last year’s
amount slightly.7 Another factor affecting growth in aver-
0.5
1.7
1.0
0.5
-2.4
-2.0
-1.6
-1.2
-0.8
-0.4
0.0
0.4
0.8
1.2
1.6
2.0
-2.4
-2.0
-1.6
-1.2
-0.8
-0.4
0.0
0.4
0.8
1.2
1.6
2.0
09 10 11 12 13 14 15 16 17 18 19 20 21 22 23
government consumptiongovernment gross fixed capital formationtotal government contribution
Figure 6: Projections of government components' contribution to GDP growth
contribution to annual GDP growth in p.p.
Note: Due to rounding, sums of components may differ from aggregate values. Source: SORS, Banka Slovenije projections.
6 Details regarding the use of sources from the NGEU funds are presented in Box 2.
7 The bonus for work in high-risk conditions in accordance with Article 39 of the collective agreement for the public sector in the amount of 65% of the hourly base wage for a public servant and various other bonuses (e.g. a bonus for temporary reassignment due to urgent work tasks and a
bonus for direct work with patients and/or users infected with Covid-19, both in the amount of 30% of the hourly base wage for an employee).
0
2
4
6
8
10
12
14
16
0
2
4
6
8
10
12
14
16
2021 2022 2023
other investments
investments co-financed by NGEU funds
gross fixed capital formation
Figure 5: Contribution of investments co-financed by NGEU funds in 2021-2023 to total projected investment growth
annual growth in %, contributions in p.p.
Note: Due to rounding, sums of components may differ from aggregate values. Source: SORS, MF, SVRK, Banka Slovenije estimations and projections.
15
MACROECONOMIC PROJECTIONS FOR SLOVENIA
June 2021
age wages this year is the implementation of the agree-
ment on wages and other labour costs in the public sec-
tor reached at the end of 2018.8 Rising employment con-
tinued in the government sector at the beginning of the
year, with human health and social work activities record-
ing the highest growth. This year’s growth in government
sector employment is expected to be similar to that of last
year and slightly lower over the next two years. Certain
epidemic-related payments for goods and services, in
particular in human health and social work activities
(protective equipment, vaccines, microbiological tests,
etc.) will continue over the projection horizon. The upward
revision in government consumption reflects also the
inclusion of sources from the NGEU fund in projections,
in the part earmarked primarily for intermediate consump-
tion.
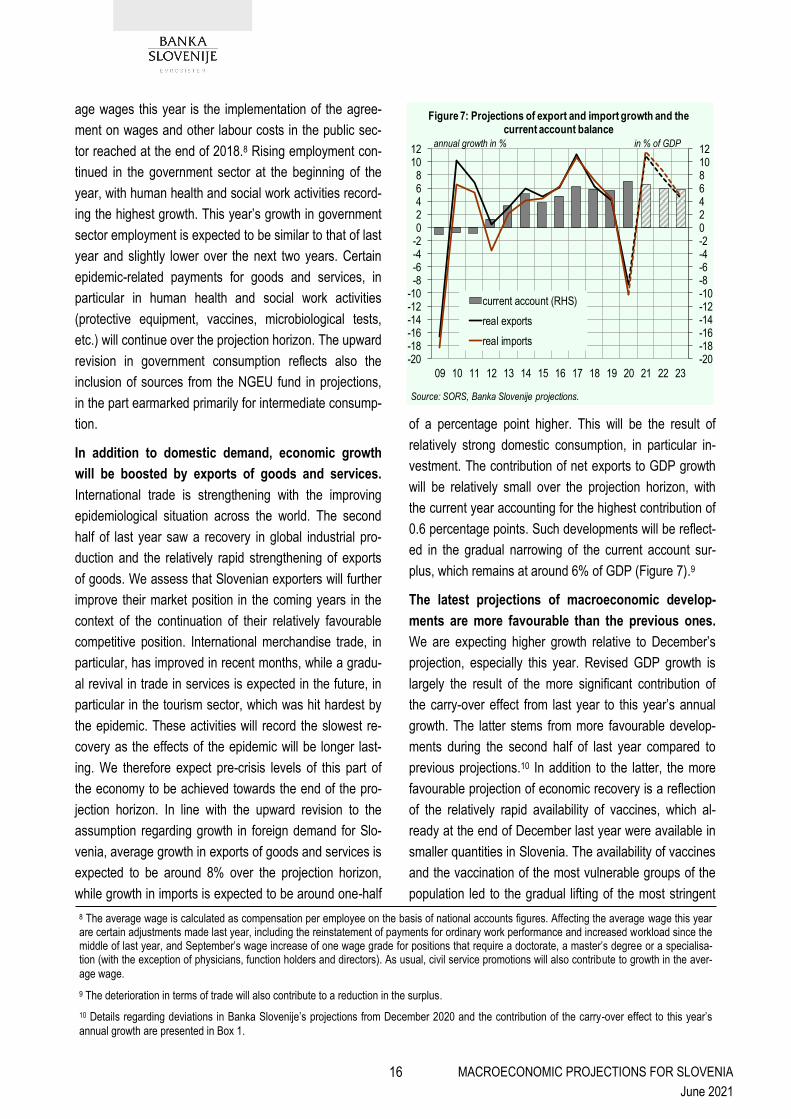
In addition to domestic demand, economic growth
will be boosted by exports of goods and services.
International trade is strengthening with the improving
epidemiological situation across the world. The second
half of last year saw a recovery in global industrial pro-
duction and the relatively rapid strengthening of exports
of goods. We assess that Slovenian exporters will further
improve their market position in the coming years in the
context of the continuation of their relatively favourable
competitive position. International merchandise trade, in
particular, has improved in recent months, while a gradu-
al revival in trade in services is expected in the future, in
particular in the tourism sector, which was hit hardest by
the epidemic. These activities will record the slowest re-
covery as the effects of the epidemic will be longer last-
ing. We therefore expect pre-crisis levels of this part of
the economy to be achieved towards the end of the pro-
jection horizon. In line with the upward revision to the
assumption regarding growth in foreign demand for Slo-
venia, average growth in exports of goods and services is
expected to be around 8% over the projection horizon,
while growth in imports is expected to be around one-half
of a percentage point higher. This will be the result of
relatively strong domestic consumption, in particular in-
vestment. The contribution of net exports to GDP growth
will be relatively small over the projection horizon, with
the current year accounting for the highest contribution of
0.6 percentage points. Such developments will be reflect-
ed in the gradual narrowing of the current account sur-
plus, which remains at around 6% of GDP (Figure 7).9
The latest projections of macroeconomic develop-
ments are more favourable than the previous ones.
We are expecting higher growth relative to December’s
projection, especially this year. Revised GDP growth is
largely the result of the more significant contribution of
the carry-over effect from last year to this year’s annual
growth. The latter stems from more favourable develop-
ments during the second half of last year compared to
previous projections.10 In addition to the latter, the more
favourable projection of economic recovery is a reflection
of the relatively rapid availability of vaccines, which al-
ready at the end of December last year were available in
smaller quantities in Slovenia. The availability of vaccines
and the vaccination of the most vulnerable groups of the
population led to the gradual lifting of the most stringent
8 The average wage is calculated as compensation per employee on the basis of national accounts figures. Affecting the average wage this year are certain adjustments made last year, including the reinstatement of payments for ordinary work performance and increased workload since the middle of last year, and September’s wage increase of one wage grade for positions that require a doctorate, a master’s degree or a specialisa-tion (with the exception of physicians, function holders and directors). As usual, civil service promotions will also contribute to growth in the aver-
age wage.
9 The deterioration in terms of trade will also contribute to a reduction in the surplus.
10 Details regarding deviations in Banka Slovenije’s projections from December 2020 and the contribution of the carry-over effect to this year’s
annual growth are presented in Box 1.
-20-18-16-14-12-10-8-6-4-2024681012
-20-18-16-14-12-10-8-6-4-202468
1012
09 10 11 12 13 14 15 16 17 18 19 20 21 22 23
current account (RHS)
real exports
real imports
Source: SORS, Banka Slovenije projections.
Figure 7: Projections of export and import growth and the current account balance
annual growth in % in % of GDP
16

MACROECONOMIC PROJECTIONS FOR SLOVENIA
June 2021
containment measures and the reopening of a large num-
ber of economic activities, at least to a limited extent,
during the first months of this year, which is largely in line
with the assumptions of the mild scenario from last De-
cember. The new growth projection remains lower than
the alternative mild scenario prepared in December,
which envisaged 7.1% growth in economic activity this
year. The slightly revised projection of growth in invest-
ment and the structure thereof over the projection horizon
reflects the government plan to use sources from the
NGEU fund, while the revision to the projection of trade in
goods and services is primarily the result of a change in
the assumption regarding growth in foreign demand for
Slovenia. Compared to December’s projection, the pro-
jection of GDP growth is 2.1 percentage points higher this
year and 0.3 percentage points higher next year, while
the projection for 2023 remains unchanged (Figure 8).
The projections are surrounded with a great deal of
uncertainty and more pronounced risks that could
have a significant impact on macroeconomic devel-
opments at home and abroad. In addition to the epide-
miological situation, which represents the most prominent
risk to current projections of economic activity and infla-
tion, geopolitical tensions have intensified recently in the
Middle East and in oil-producing countries, posing a con-
siderable impact on developments in the prices of oil and
other primary commodities on the global markets should
the situation deteriorate further. At the same time, firms
have been facing significant challenges in recent months
with global production and supply chains, in which the
Slovenian economy is strongly integrated. Such problems
can be observed in the large gap between demand and
the availability of certain raw materials and components,
such as semiconductors, which has lead to supply delays
and even the halting of production, particularly in the au-
tomotive industry. This is also being seen in the high
growth in the prices of such commodities and intermedi-
ate products. Currently, these challenges are expected to
be temporary and conditions are expected to stabilise in
a few months.
-1.0
-0.5
0.0
0.5
1.0
1.5
2.0
2.5
3.0
-1.0
-0.5
0.0
0.5
1.0
1.5
2.0
2.5
3.0
2020 2021 2022 2023private consumption government consumption
gross fixed capital formation net expots
changes in inventories GDP
diff. in growth and contributions in p.p.
Figure 8: Revision to GDP growth projection by components
Note: Due to rounding, sums of components may differ from aggregate values. Source: SORS, Banka Slovenije projections.
17

MACROECONOMIC PROJECTIONS FOR SLOVENIA
June 2021
The year 2020 was characterised by the Covid-19 epidemic.
The majority of countries, including Slovenia, adopted strin-
gent measures to contain the spread of infections. These
measures, while maintaining the stability of the healthcare
system, adversely affected economic activity. Consequently,
economic growth last year depended primarily on the severity
of containment measures, which were tightened and loos-
ened depending on the epidemiological picture.
The Covid-19 epidemic was declared in Slovenia on
12 March 2020. During the first months of the spread of the
SARS-CoV-2 virus, which was accompanied by a great deal
of uncertainty because of a lack of knowledge about the new
virus, stringent measures were adopted to contain the spread
of infections, including a general lockdown of several eco-
nomic sectors. These stringent measures significantly mitigat-
ed the consequences of the first wave of the epidemic in Slo-
venia. The drop in economic activity was the most severe
during the second quarter when the quarterly decline exceed-
ed 10%.
Containment measures were eased during the summer in the
context of an improved epidemiological picture and the slower
spread of infections. At the same time, the economy experi-
enced a revival, including the tourism sector. Contributing
significantly to this were weather-related factors, as during the
summer numerous service activities are provided outdoors
where somewhat milder containment measures were in place,
particularly in the areas of catering and recreation. The re-
bound in the third quarter was extremely strong and outpaced
the short-term assessments of GDP developments that were
taken into account in Banka Slovenije’s December projection.
Quarterly growth exceeded 12%, while Banka Slovenije’s
projection for growth in the third quarter was 9.5% (Figure 1).1
The epidemiological situation deteriorated at the end of the
summer. Despite the re-declaration of the epidemic and re-
strictions on the functioning of mostly services activities in the
autumn, economic activity slowed to a lesser degree than in
the second quarter. The decline in the final quarter of last
year was thus less severe than previous assessments that
were based primarily on experience from the spring when the
nature of the lockdown was considerably different: measures
were more targeted in the autumn, while firms and house-
holds adapted well to the new situation. According to current
estimates from the Statistical Office of the Republic of Slove-
nia (SORS), the Slovenian economy recorded a 1% decline
during the final quarter of last year, while Banka Slovenije
short-term projections envisaged a fall of 2.2%.
The availability of data during the preparation of projections
has a significant impact on their accuracy. This is even more
important during periods of elevated uncertainty when eco-
nomic fluctuations are higher. In the case of Banka Sloveni-
je’s December projection, the deviation from realisation was
more marked (Figure 2). According to figures from the SORS,
last year’s drop in economic activity was 2.1 percentage
points lower than projected by Banka Slovenije, with a signifi-
cant fraction of that deviation accounted for by the markedly
lower estimate of the economic recovery during the third
-12
-8
-4
0
4
8
12
16
20
-12
-8
-4
0
4
8
12
16
20
2019 Q4 2020 Q1 2020 Q2 2020 Q3 2020 Q4
range of model estimates
real GDP – actual
average of model estimates
BS projection, December 2020
Note: Model estimates are based on a short-term forecasting infrastructure that includes approximately 70 different models. Source: SORS, Banka Slovenije estimations.
q-o-q growth in %, seasonally adjusted data
Figure 1: Short-term model estimates, projections and realization
0.0
0.5
1.0
1.5
2.0
2.5
data revisionfor 2019
data revisionfor 2020 Q1
data revisionfor 2020 Q2
data for 2020Q3
data for 2020Q4
statisticaldeviation
Figure 2: Deviations of Banka Slovenije's December projectionfrom the realized GDP growth in 2020
contributions in p.p.
Note: Due to rounding, the sum of individual contributions may differ from the aggregate deviation of the projection from the realized growth. Source: SORS, Banka Slovenije calculations.
0.4 -0.1
1.4
0.3
0.3
-0.1
Box 1: Explanation of deviations in Banka Slovenije’s projection for 2020 from realisations and assessment of the carry-over effect to annual growth in 2021
18

MACROECONOMIC PROJECTIONS FOR SLOVENIA
June 2021
quarter of last year (around 1.4 percentage points). The devi-
ation was also influenced, albeit to a lesser degree, by the
SORS data revisions to figures for 2019 and the first half of
2020 (around 0.2 percentage points) and a less severe than
expected drop in activity in the final quarter (around 0.3 per-
centage points).
The approach2 that provides an estimate of annual GDP
based on quarterly (current) growth is used to break down the
deviation in the projection from realisations, according to the
following formula:
where yt represents annual growth in year t (2020 in the case
in question), and qi,t-1 and qi,t represent quarterly growth dur-
ing quarter i in year t (2020 in the case in question) and year
t-1 (2019 in the case in question).
We can simplify the equation as follows:
where COt-1 represents the carry-over effect from the previ-
ous year3 (2019 in the case in question). Such an estimated
breakdown results in a statistical deviation that amounts to
around 0.3 percentage points in this case.
From a technical point of view, a higher than previously esti-
mated quarterly growth towards the end of last year will have a
significant impact on annual growth in macroeconomic aggre-
gates in 2021. The carry-over effect from the previous year to
annual growth in GDP and individual components, such as
private consumption, investment, and exports and imports of
goods and services, will be significant this year (Figure 3). In
the case of GDP, exports and imports, the effect will be
strongly positive. It will contribute 2.8 percentage points to
annual GDP growth, which is just 0.2 percentage points less
than the highest-recorded value from 2007, while the contri-
bution by exports of goods and services of 8.8 percentage
points will be the highest to date. The carry-over effect will
contribute 7.2 percentage points to growth in imports, which is
only slightly less than in 2006 and 2007. The aforementioned
effect will contribute slightly more than 4 percentage points to
annual growth in investment, which is around the mean of
historical values. On the contrary, the carry-over effect on pri-
vate consumption will be strongly negative, at -3.3 percentage
points, the lowest value recorded in the period 1997 to 2021,
due to a significant fall in household spending in the autumn
when more stringent containment measures were in place.
Due to historically strong carry-over effects from the previous
year, potential subsequent revisions of figures for 2020 could
result in significant changes in estimates and projections of
annual growth in GDP and individual components thereof for
2021. Potential, more significant revisions to figures for 2020
are expected this autumn when the first estimate of GDP for
2020 will be published based on annual data sources.
References:
Cross, P., & Wyman, D. (2011). The relationship between monthly,
quarterly, and annual growth rates. Catalogue no. 11-010-X. Statis-
tics Canada. Accessible at: The relationship between monthly, quar-
terly, and annual growth rates (statcan.gc.ca).
Tödter, K.-H. (2010). How useful is the carry-over effect for short-
term economic forecasting? Discussion Paper Series 1: Economic
Studies. No. 21/2010. Deutsche Bundesbank. Accessible at: How
useful is the carry-over effect for short-term economic forecasting?
(bundesbank.de).
-12
-10
-8
-6
-4
-2
0
2
4
6
8
10
-12
-10
-8
-6
-4
-2
0
2
4
6
8
10
privateconsumption
investments exports imports GDP
Figure 3: Contribution of carry-over effect to annual growth in GDP and individual components
contributions in p.p.
Note: The interval shows the maximum and minimum contribution of the carry-over effect to the annual growth over the period 1997-2021. The gray colored part shows values between the 25th and 75th percentile, and the black line highlights the carry-over effect to the annual growth in 2021. Source: SORS, Banka Slovenije calculations.
1 The cut-off date for the preparation of Banka Slovenije December projections was 25 November 2020, when figures regarding national accounts for the third quarter of 2020 were not available. Those figures were published on 30 November 2020. The cut-off date is set
within the joint Eurosystem/ECB Staff macroeconomic projections.
2 See Cross & Wyman (2011) and Tödter (2010).
3 The concept of the carry-over effect was presented in detail in Box 1 in the June 2018 issue of Macroeconomic Projections for Slo-
venia.
19
MACROECONOMIC PROJECTIONS FOR SLOVENIA
June 2021
The government deficit will remain high this year, but will be
lower than last year. According to available information and
estimates, the deficit will amount to 7.3% of GDP. One key
reason for the lower deficit relative to last year will be the
lower costs of measures in connection with the Covid-19 epi-
demic. In the context of the expected strengthening of eco-
nomic activity, to which household spending will contribute
significantly, and favourable conditions on the labour market,
the revenue will increase in cyclical terms. The narrowing of
the deficit will continue in the coming years as economic growth
strengthens and temporary measures in connection with the
Covid-19 epidemic are lifted. According to current estimates,
the deficit will amount to 3.3% of GDP at the end of the projec-
tion horizon, and thus exceed the reference value slightly.
The estimated general government deficit is worse relative to
previous projections for this year, while we expect a more
favourable than previously estimated position for the next two
years The deterioration in the position this year relative to the
projections from December 2020 is one percentage point of
GDP, despite the favourable result last year (by 0.5 percent-
age points of GDP) and an improved economic situation. The
main factor in the revised estimate for this year is a higher
level of anti-coronavirus measures than previously expected,
as the seventh package of anti-coronavirus measures was
adopted at the end of last year following the completion of the
December projections, while the eighth package was adopted
this February. The validity of certain measures was extended
as well. Also contributing to the deteriorating position relative to
previous projections were changes in pension legislation adopt-
ed in March of this year, which relate to an increase in the mini-
mum and guaranteed pension and the guaranteed amount of
disability pension. In contrast to the temporary effects of anti-
coronavirus measures, the aforementioned changes have a
longer-lasting impact on public finance developments.
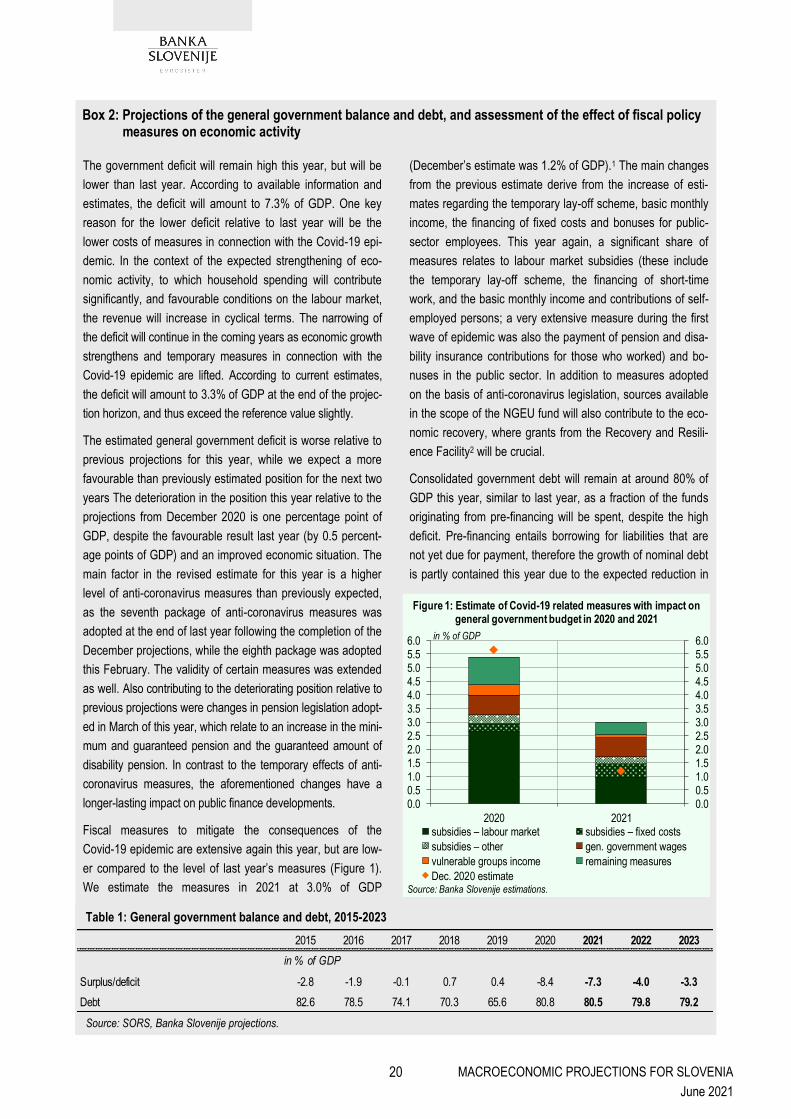
Fiscal measures to mitigate the consequences of the
Covid-19 epidemic are extensive again this year, but are low-
er compared to the level of last year’s measures (Figure 1).
We estimate the measures in 2021 at 3.0% of GDP
(December’s estimate was 1.2% of GDP).1 The main changes
from the previous estimate derive from the increase of esti-
mates regarding the temporary lay-off scheme, basic monthly
income, the financing of fixed costs and bonuses for public-
sector employees. This year again, a significant share of
measures relates to labour market subsidies (these include
the temporary lay-off scheme, the financing of short-time
work, and the basic monthly income and contributions of self-
employed persons; a very extensive measure during the first
wave of epidemic was also the payment of pension and disa-
bility insurance contributions for those who worked) and bo-
nuses in the public sector. In addition to measures adopted
on the basis of anti-coronavirus legislation, sources available
in the scope of the NGEU fund will also contribute to the eco-
nomic recovery, where grants from the Recovery and Resili-
ence Facility2 will be crucial.
Consolidated government debt will remain at around 80% of
GDP this year, similar to last year, as a fraction of the funds
originating from pre-financing will be spent, despite the high
deficit. Pre-financing entails borrowing for liabilities that are
not yet due for payment, therefore the growth of nominal debt
is partly contained this year due to the expected reduction in
0.00.51.01.52.02.53.03.54.04.55.05.56.0
0.00.51.01.52.02.53.03.54.04.55.05.56.0
2020 2021subsidies – labour market subsidies – fixed costs
subsidies – other gen. government wages
vulnerable groups income remaining measures
Dec. 2020 estimate
Figure 1: Estimate of Covid-19 related measures with impact on general government budget in 2020 and 2021
Source: Banka Slovenije estimations.
in % of GDP
Table 1: General government balance and debt, 2015-2023
Source: SORS, Banka Slovenije projections.
Box 2: Projections of the general government balance and debt, and assessment of the effect of fiscal policy measures on economic activity
2015 2016 2017 2018 2019 2020 2021 2022 2023
Surplus/deficit -2.8 -1.9 -0.1 0.7 0.4 -8.4 -7.3 -4.0 -3.3
Debt 82.6 78.5 74.1 70.3 65.6 80.8 80.5 79.8 79.2
in % of GDP
20

MACROECONOMIC PROJECTIONS FOR SLOVENIA
June 2021
accumulated pre-financing funds. On the contrary, the stock
of those funds rose last year due to favourable borrowing
terms and uncertainty regarding the amount of funds required
to finance measures aimed at containing the spread of the
virus. The government can also use accumulated funds grad-
ually over several years. Nominal debt will continue to rise in
the future due to high deficits. However, the debt to GDP ratio
will gradually fall due to higher growth in nominal GDP than
debt. Interest expenditure will continue to contribute to the
consolidation of public finances due to low interest rates.
Estimates of the general government position are more fa-
vourable than the estimates in the April Stability Programme
and the estimates of other institutions (e.g. the EC, OECD
and IMF), while the majority of available estimates of general
government debt from other institutions indicate falling debt
and a level close to 80% of GDP. The more gradual strength-
ening of government investment relative to government plans
has a significant impact on the lower estimated general gov-
ernment deficit in 2021.3 Developments in key macroeconom-
ic categories for general government revenue (e.g. household
consumption and labour market indicators) are also more
favourable in Banka Slovenije’s projections. Despite the as-
sumption of higher economic growth, debt as a share of GDP
will fluctuate over the projection horizon at the levels present-
ed in the Stability Programme as we are assuming lower use
of pre-financing as a way to reduce debt. This year’s deficit in
Slovenia will be slightly higher than in the euro area, where
the deficit will be 7.1% of GDP according to the ECB’s June
projections, while general government debt will remain well
below the level of the euro area.
Projections of the general government deficit and debt are
exposed to numerous risks. In addition to the macroeconomic
situation, the epidemiological picture and the associated
needs for further fiscal support, estimates are also subject to
the potential adoption of other legislative changes that are not
linked to the crisis. The current projections do not yet include
the ninth anti-coronavirus law that was announced prior to the
cut-off date for the completion of projections, as no detailed
information regarding planned measures was available. The
projections also do not take into account proposed changes
to tax legislation (personal and corporate income tax and
VAT) or the draft act on de-bureaucratisation (the introduction
of social security cap), which could undergo significant chang-
es during the adoption of legislation by the National Assem-
bly. Also in the process of adoption is the arrangement of the
long-term care, while an extraordinary pension increase is
also possible at the end of the year. On the other hand, strict
fiscal rules will gradually be reapplied following the end of the
coronavirus crisis, which will mean the need for fiscal consoli-
dation. There is also uncertainty as to what extent and how
fast the government and private sector will implement invest-
ments from the recovery and resilience plan, albeit some
delay in implementation was already taken into account in the
baseline scenario. Risks related to the projection of debt pri-
marily relate to the potentially more extensive and faster use
of the considerable liquid assets that the government has
accumulated via pre-financing, meaning that the debt could
be lower than projected.
Fiscal measures have significantly mitigated the economic
consequences of the epidemic and the associated measures
to contain the spread of infections.4 In the absence of these
measures, the drop in economic activity would have been
close to 10% last year. Fiscal policy will continue to support
economic activity. We estimate that the emergency measures
in force in 2021 will contribute close to 2 percentage points to
this year’s economic growth.5 Investments co-financed with
sources from the NGEU fund will further boost economic ac-
tivity over the projection horizon, and will contribute in cumu-
lative terms one percentage point to GDP growth during that
period.
1 In the April Stability Programme, the Ministry of Finance estimated last year’s discretionary measures on the expenditure side at 5.2% of GDP. Taking into account measures on the revenue side that relate primarily to unsettled and unpaid tax prepayments and to deferrals and instalment payments of taxes, the Ministry of Finance estimated last year’s discretionary measures at 6% of GDP. The Ministry of Finance estimates this year’s measures in response to the Covid-19 epidemic at 2.7% of GDP. Those measures are primarily financed by
domestic funds and only to a lesser degree by EU funds.
2 More information regarding sources from the NGEU fund is present-ed at: https://www.eu-skladi.si/en/post-2020-1/recovery-and-resilience-plan. In the current projections, we assumed the use of grants and loans from the NGEU fund in the amount of EUR 1.6 billion for the period until 2023, with close to 80% of that amount earmarked for the government sector (primarily for invest-ment purposes) and the remainder earmarked for private-sector
investment.
3 While the government expects government investment to be by more than one-half higher this year relative to last year, our projec-tions assume more moderate growth of slightly more than one-third. Annual nominal growth would thus be higher than ever before, while government investment is also expected to increase in the coming
years.
4 A more detailed presentation of the methodology for estimating the impact of the fiscal measures on economic activity was given in Box 3 of the June 2020 issue of Macroeconomic Projections for Slovenia. The estimate of measures does account for any major losses in economic capacity, as emergency measures are maintain-ing it at levels that will allow for the rapid recovery of the economy
when the epidemiological situation improves.
5 The estimated contribution of fiscal measures to GDP growth does not include the negative technical base effect due to the lower
amount of measures relative to last year.
21

MACROECONOMIC PROJECTIONS FOR SLOVENIA
June 2021
2.2 Labour market
In the context of a more rapid recovery in economic
activity, conditions on the labour market will improve
significantly as early as this year, as employment will
rise by 0.7% this year after last year’s 1% decline
(Figure 9). The improved outlook for the first half of the
year is supported by a rapid decline in registered unem-
ployment, which was down by 15 thousand people at the
end of May in year-on-year terms.11 A rapid recovery in
employment is also expected during the second half of
the year, as the May value of the aggregate employment
expectations indicator was well above the long-term aver-
age and higher than almost 90% of past values since
2004 (Figure 10).12 With the lifting of the majority of con-
tainment measures and the reopening of activities, we
expect the recovery on the labour market to be broader-
based during the second half of the year, which will re-
duce firms’ demand for job retention schemes.13 To date,
these measures have successfully attenuated the need of
firms to lay off workers in response to the drop in eco-
nomic activity. In the context of the recent extension of
the temporary lay-off scheme until the end of June, we
expect that the majority of employees participating in job
retention schemes will gradually return to the workplace
during the second half of the year, and that there will be
no major longer-term inflow into unemployment. The sur-
veyed unemployment rate will thus fall slightly this year
and stand at 4.9%. To that end, targeted support
measures will likely be required during the second half of
the year as well, due to the expected slower recovery of
certain services activities hit hardest by the epidemic (e.g.
tourism and catering). Therefore, we associate the poten-
tial rapid withdrawal of the aforementioned measures with
the risk of an increase in the unemployment rate this
year. Due to a decrease in the number of employees
participating in job retention schemes relative to last year,
the growth in the number of hours worked at 5.4% will
significantly outpace growth in employment this year.
Favourable developments on the labour market will
continue in the coming years, when limiting factors
from the pre-epidemic period will re-emerge. In the
context of rapid economic growth, employment is ex-
pected to increase by 1.6% and 1.4% in 2022 and 2023
respectively. Consequently, at the end of the projection
horizon, the number of persons in employment will be up
by almost 30 thousand relative to the pre-crisis year of
2019. With strong growth in economic activity, accelerat-
11 According to unofficial daily figures, there were 75,454 unemployed persons registered with the Employment Service of Slovenia on 26 May
this year, compared with 90,415 at the end of May last year.
12 Positive outlook for employment growth can also be seen in the results of the Employment Service’s Employment Preview survey and in the
results of the survey conducted by the ManpowerGroup HR agency.
13 According to figures from the Employment Service on 16 May, there were 44 thousand temporarily laid-off workers in February, while 19 thou-
sand persons were included in the measure to subsidise short-time work.
-1.0
0.7 1.6 1.4
5.0 4.9 4.74.3
-8
-6
-4
-2
0
2
4
6
8
10
12
-8
-6
-4
-2
0
2
4
6
8
10
12
09 10 11 12 13 14 15 16 17 18 19 20 21 22 23
employment (private sector)employment (government sector)employment (total)survey unemployment rate
annual growth in %, unemployment rate in %
Figure 9: Employment and unemployment
Source: SORS, Banka Slovenije projections.
-60
-50
-40
-30
-20
-10
0
10
20
30
40
-3.0
-2.5
-2.0
-1.5
-1.0
-0.5
0.0
0.5
1.0
1.5
2.0
05 06 07 08 09 10 11 12 13 14 15 16 17 18 19 20 21
employment in private sector
employment expectations (RHS)
q-o-q growth in %
Note: The aggregate indicator of expected employment is calculated using shares in value added, with the horizontal line showing the value of the long-term average. Data are seasonally adjusted. Source: SORS, Banka Slovenije calculations.
Figure 10: Short-term employment growth prospects
balance of answers in p.p.
22

MACROECONOMIC PROJECTIONS FOR SLOVENIA
June 2021
ed growth in labour demand is also implied by models
based on the historical correlation between developments
in employment and GDP (Figure 11). Although growth in
employment will remain higher in the public sector than in
the private sector this year, private-sector firms are ex-
pected to become the drivers of employment growth in
2022 and 2023. Similar to the period before the epidemic,
employers will increasingly face shortages of qualified
labour.14 As full employment is approached and underlin-
ing unfavourable demographic developments and struc-
tural imbalances on the labour market, rising employment
will be largely based on the employment of foreign la-
bour, similar to the period prior to the epidemic. Accord-
ingly, the decline in unemployment will be slower than
employment growth. At 4.3% at the end of the projection
horizon, the surveyed unemployment rate is expected to
approach historically low levels.
While wage growth will be high this year, at close to
4%, it will largely result from one-off effects in con-
nection with the epidemic (Figure 12).15 Key to the con-
tinuation of high growth in the government sector will be
the still-present official epidemic and the associated pay-
ment of crisis bonuses to public-sector employees, partic-
ularly in human health and social work activities.16 Mean-
while, wage growth in the private sector reflects the lifting
of job retention schemes and the increase in the mini-
mum wage. Due to the reduced number of employees
included in temporary lay-offs and short-time work
schemes, average employee earnings will rise mechani-
cally, as the employees who are included in these
measures receive lower earnings while they are absent
from the work process. We estimate that the aforemen-
tioned effect will increase this year’s growth in private-
14 In some sectors, in particular in human health and social work activities, firms are already facing a shortage of qualified labour.
15 The projection for wage growth relates to average compensation per employee based on the national accounts definition.
16 According to national accounts figures (published on 31 March 2021), compensation per employee rose by 5.6% in the government sector, while growth in OPQ activities (public administration and defence, compulsory social security, education, human health and social work activities) was 11.1%. Such a discrepancy in wage growth according to both series deviates from the historically close correlation between those series,
and indicates the possibility of major future revisions in the sectoral breakdown of wage growth for 2020.
2.3
3.82.5 3.3
-4
-2
0
2
4
6
8
10
-4
-2
0
2
4
6
8
10
09 10 11 12 13 14 15 16 17 18 19 20 21 22 23
compensation per employee (private sector)
compensation per employee (government sector)
compensation per employee (total)
Figure 12: Nominal growth of compensation per employee
annual growth in %
Source: SORS, Banka Slovenije projections.
-1
0
1
2
3
4
5
6
-1
0
1
2
3
4
5
6
09 10 11 12 13 14 15 16 17 18 19 20 21 22 23
range of model estimates
average of model estimates
BS projection (Jun. 2021)
annual growth in %
Note: Conditional model estimates are based on a suite of econometric models of the wage Phillips curve, where the unemployment rate, inflation rate, GDP growth rate and past wage growth are used as explanatory variables. Model estimates do not include the mechanical effect of job retention schemes that stems from lower compensation that workers receive while not working. Source: SORS, Banka Slovenije estimations and projections.
Figure 13: Wage Phillips curve model estimate of compensation per employee growth in private sector
-3
-2
-1
0
1
2
3
4
-3
-2
-1
0
1
2
3
4
09 10 11 12 13 14 15 16 17 18 19 20 21 22 23
range of model estimates
average of model estimates
BS projection (Jun. 2021)
annual growth in %
Note: Conditional model estimates are based on a suite of dynamic econometric models of employment growth, where GDP growth, world demand growth and past employment growth are used as explanatory variables. Source: SORS, Banka Slovenije estimations and projections.
Figure 11: Model estimates of employment growth
23

MACROECONOMIC PROJECTIONS FOR SLOVENIA
June 2021
sector wages by slightly more than one percentage
point.17 A somewhat less positive effect in wage growth is
also expected in connection with this year’s 8.9% in-
crease in the minimum wage, although temporary govern-
ment wage subsidies will significantly mitigate, by nearly
one-half, the pass-through of that increase to growth in
labour costs.18 Overall wage growth will slow down con-
siderably in 2022 due to a drop in government sector
wages that will derive primarily from the termination of the
payment of epidemic-related bonuses. In the context of
relatively rapid growth in employment, the growing chal-
lenge of labour shortages in certain sectors, and rising
inflation, we expect underlying wage pressure to strength-
en gradually in 2022 and 2023, which is also evident from
model estimates based on the wage Phillips curve
(Figure 13). Wage growth will thus stabilise at over 3% at
the end of projection horizon.
2.3 Inflation
Despite strong external price pressures, inflation will
be relatively weak this year and highly volatile due to
technical effects. Following a year of deflation as a re-
sult of the outbreak of the epidemic, price growth will
strengthen this year and reach 1.3% (Figure 14). Due to
the base effects of last year’s fall in fuel and electricity
prices and this year’s growth in global oil prices, inflation
will be driven primarily by energy prices, while growing
external inflationary pressures will also contribute to high-
er growth in food prices. Despite recovering demand and
cost pressures, annual growth in domestic components of
inflation will remain relatively weak this year, in part due
to the slowdown at the beginning of the year when more
stringent measures to contain the spread of the virus
were still in place. Core inflation, i.e. growth in prices ex-
cluding energy and food, will thus average just 0.2% this
year (Figure 15). The change in weights for calculating
the price index also contributes to relatively low inflation.
Weights for products and services in the consumer price
basket changed more than usual due to last year’s
change in consumption patterns. We therefore expect for
this year’s inflation and core inflation to be 0.4 and
0.3 percentage points lower respectively.19 The impact of
the change in weights, which is presented in more detail
in Box 3, will also be reflected in the increased volatility of
year-on-year inflation this year. Due to a lower weight of
package holidays, the strongest effect of the change in
weights is expected in the third quarter when headline
inflation is expected to be as much as 0.8 percentage
points lower than if the change had not occurred.
17 The lifting of job retention schemes will have a positive effect on private-sector wage growth also next year.
18 Since January this year, the calculation of the minimum wage is based on a formula whereby the minimum net remuneration for full-time work will have to be 20% higher than the minimum costs of living. In accordance with that provision, the gross minimum wage increased by 8.9% in January this year, to stand at EUR 1,024.24. In order to mitigate growth in labour costs, the government stipulated in the eighth package of measures to mitigate the consequences of the epidemic (ZDUOP) that employers will be entitled to a monthly subsidy of EUR 50 during the first half of the year for every worker whose wages excluding bonuses are lower than the minimum wage. During the second half of the year, employ-ers’ burden in terms of the payment of social security contributions will be partly reduced, as the lowest basis for the calculation of contributions from wages will be lowered from 60% of the average wage to the level of the minimum wage. We estimate that the aforementioned measures will mitigate the increase in labour costs for workers on minimum wage by one-half during the first half of the year, and by just over one-third during the second half of the year. On account of the national accounts methodology, we also expect that only the reduction of the lowest basis for the calculation of contributions will have a limiting effect on growth in compensation per employee. According to our estimates, raising the minimum
wage could contribute close to one percentage point to growth in compensation per employee in the private sector.
19 The impact of updated weights on the year-on-year growth in consumer prices is expressed as the difference between the official year-on-year growth in the HICP calculated using 2021 weights and the hypothetical year-on-year growth in the HICP as proceeds from the calculation of the
index with no change in weights, i.e. the 2020 weights.
-0.3
1.31.6 1.7
-2
-1
0
1
2
3
4
5
-2
-1
0
1
2
3
4
5
09 10 11 12 13 14 15 16 17 18 19 20 21 22 23
servicesnon-energy industrial goodsprocessed foodunprocessed foodenergyHICP
Figure 14: Projection of contributions to inflation by components
average y-o-y growth in %, contributions in p.p.
Source: SORS, Eurostat, Banka Slovenije projections.
24
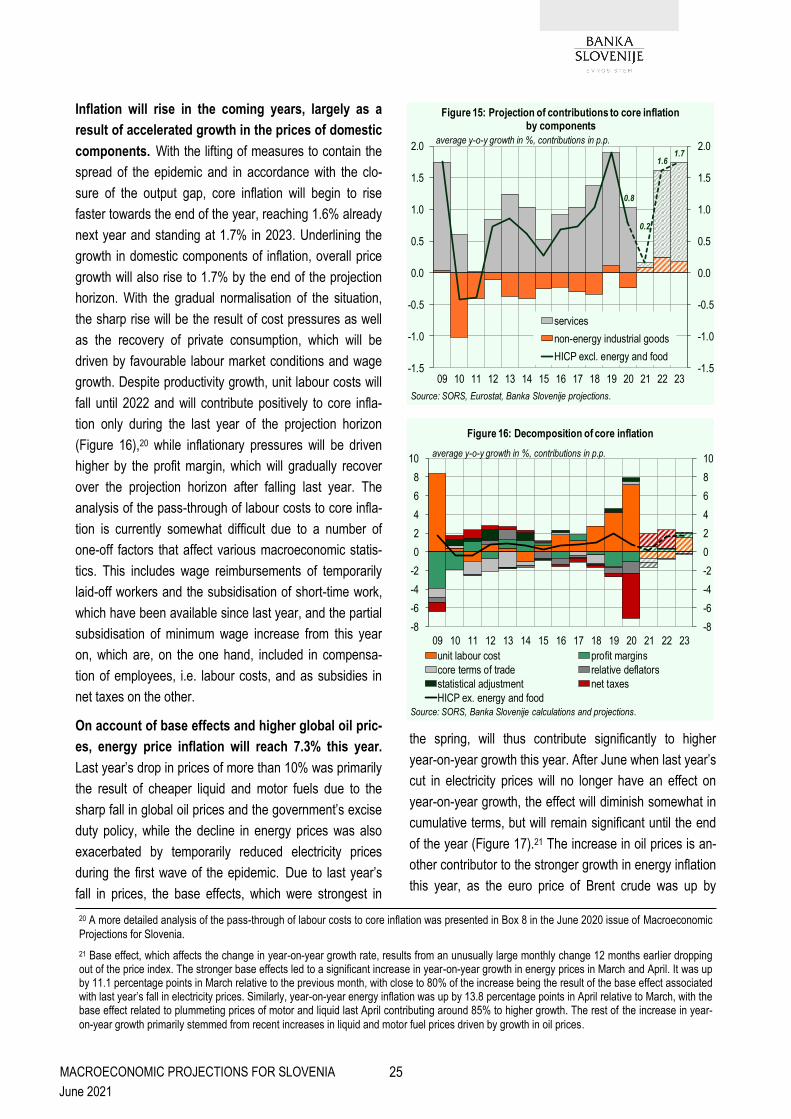
MACROECONOMIC PROJECTIONS FOR SLOVENIA
June 2021
Inflation will rise in the coming years, largely as a
result of accelerated growth in the prices of domestic
components. With the lifting of measures to contain the
spread of the epidemic and in accordance with the clo-
sure of the output gap, core inflation will begin to rise
faster towards the end of the year, reaching 1.6% already
next year and standing at 1.7% in 2023. Underlining the
growth in domestic components of inflation, overall price
growth will also rise to 1.7% by the end of the projection
horizon. With the gradual normalisation of the situation,
the sharp rise will be the result of cost pressures as well
as the recovery of private consumption, which will be
driven by favourable labour market conditions and wage
growth. Despite productivity growth, unit labour costs will
fall until 2022 and will contribute positively to core infla-
tion only during the last year of the projection horizon
(Figure 16),20 while inflationary pressures will be driven
higher by the profit margin, which will gradually recover
over the projection horizon after falling last year. The
analysis of the pass-through of labour costs to core infla-
tion is currently somewhat difficult due to a number of
one-off factors that affect various macroeconomic statis-
tics. This includes wage reimbursements of temporarily
laid-off workers and the subsidisation of short-time work,
which have been available since last year, and the partial
subsidisation of minimum wage increase from this year
on, which are, on the one hand, included in compensa-
tion of employees, i.e. labour costs, and as subsidies in
net taxes on the other.
On account of base effects and higher global oil pric-
es, energy price inflation will reach 7.3% this year.
Last year’s drop in prices of more than 10% was primarily
the result of cheaper liquid and motor fuels due to the
sharp fall in global oil prices and the government’s excise
duty policy, while the decline in energy prices was also
exacerbated by temporarily reduced electricity prices
during the first wave of the epidemic. Due to last year’s
fall in prices, the base effects, which were strongest in
the spring, will thus contribute significantly to higher
year-on-year growth this year. After June when last year’s
cut in electricity prices will no longer have an effect on
year-on-year growth, the effect will diminish somewhat in
cumulative terms, but will remain significant until the end
of the year (Figure 17).21 The increase in oil prices is an-
other contributor to the stronger growth in energy inflation
this year, as the euro price of Brent crude was up by
-8
-6
-4
-2
0
2
4
6
8
10
-8
-6
-4
-2
0
2
4
6
8
10
09 10 11 12 13 14 15 16 17 18 19 20 21 22 23
unit labour cost profit margins
core terms of trade relative deflators
statistical adjustment net taxes
HICP ex. energy and food
Figure 16: Decomposition of core inflation
Source: SORS, Banka Slovenije calculations and projections.
average y-o-y growth in %, contributions in p.p.
0.8
0.2
1.61.7
-1.5
-1.0
-0.5
0.0
0.5
1.0
1.5
2.0
-1.5
-1.0
-0.5
0.0
0.5
1.0
1.5
2.0
09 10 11 12 13 14 15 16 17 18 19 20 21 22 23
services
non-energy industrial goods
HICP excl. energy and food
Figure 15: Projection of contributions to core inflation by components
average y-o-y growth in %, contributions in p.p.
Source: SORS, Eurostat, Banka Slovenije projections.
20 A more detailed analysis of the pass-through of labour costs to core inflation was presented in Box 8 in the June 2020 issue of Macroeconomic
Projections for Slovenia.
21 Base effect, which affects the change in year-on-year growth rate, results from an unusually large monthly change 12 months earlier dropping out of the price index. The stronger base effects led to a significant increase in year-on-year growth in energy prices in March and April. It was up by 11.1 percentage points in March relative to the previous month, with close to 80% of the increase being the result of the base effect associated with last year’s fall in electricity prices. Similarly, year-on-year energy inflation was up by 13.8 percentage points in April relative to March, with the base effect related to plummeting prices of motor and liquid last April contributing around 85% to higher growth. The rest of the increase in year-
on-year growth primarily stemmed from recent increases in liquid and motor fuel prices driven by growth in oil prices.
25
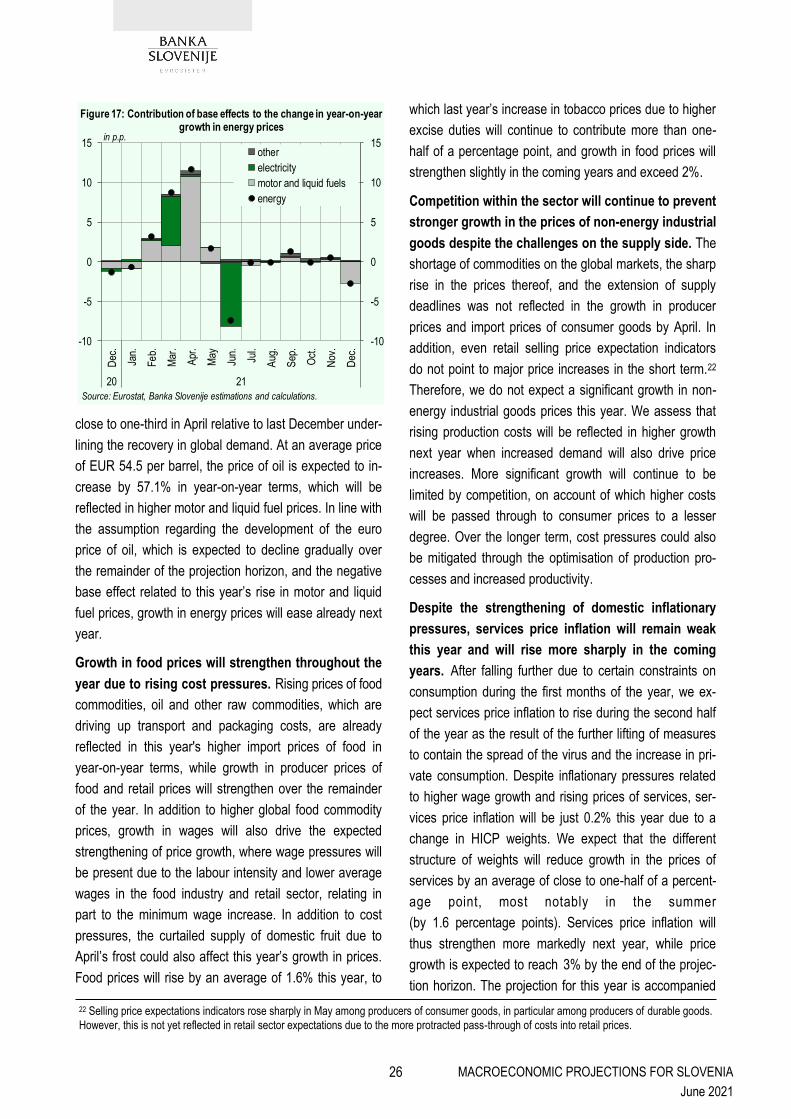
MACROECONOMIC PROJECTIONS FOR SLOVENIA
June 2021
close to one-third in April relative to last December under-
lining the recovery in global demand. At an average price
of EUR 54.5 per barrel, the price of oil is expected to in-
crease by 57.1% in year-on-year terms, which will be
reflected in higher motor and liquid fuel prices. In line with
the assumption regarding the development of the euro
price of oil, which is expected to decline gradually over
the remainder of the projection horizon, and the negative
base effect related to this year’s rise in motor and liquid
fuel prices, growth in energy prices will ease already next
year.
Growth in food prices will strengthen throughout the
year due to rising cost pressures. Rising prices of food
commodities, oil and other raw commodities, which are
driving up transport and packaging costs, are already
reflected in this year's higher import prices of food in
year-on-year terms, while growth in producer prices of
food and retail prices will strengthen over the remainder
of the year. In addition to higher global food commodity
prices, growth in wages will also drive the expected
strengthening of price growth, where wage pressures will
be present due to the labour intensity and lower average
wages in the food industry and retail sector, relating in
part to the minimum wage increase. In addition to cost
pressures, the curtailed supply of domestic fruit due to
April’s frost could also affect this year’s growth in prices.
Food prices will rise by an average of 1.6% this year, to
which last year’s increase in tobacco prices due to higher
excise duties will continue to contribute more than one-
half of a percentage point, and growth in food prices will
strengthen slightly in the coming years and exceed 2%.
Competition within the sector will continue to prevent
stronger growth in the prices of non-energy industrial
goods despite the challenges on the supply side. The
shortage of commodities on the global markets, the sharp
rise in the prices thereof, and the extension of supply
deadlines was not reflected in the growth in producer
prices and import prices of consumer goods by April. In
addition, even retail selling price expectation indicators
do not point to major price increases in the short term.22
Therefore, we do not expect a significant growth in non-
energy industrial goods prices this year. We assess that
rising production costs will be reflected in higher growth
next year when increased demand will also drive price
increases. More significant growth will continue to be
limited by competition, on account of which higher costs
will be passed through to consumer prices to a lesser
degree. Over the longer term, cost pressures could also
be mitigated through the optimisation of production pro-
cesses and increased productivity.
Despite the strengthening of domestic inflationary
pressures, services price inflation will remain weak
this year and will rise more sharply in the coming
years. After falling further due to certain constraints on
consumption during the first months of the year, we ex-
pect services price inflation to rise during the second half
of the year as the result of the further lifting of measures
to contain the spread of the virus and the increase in pri-
vate consumption. Despite inflationary pressures related
to higher wage growth and rising prices of services, ser-
vices price inflation will be just 0.2% this year due to a
change in HICP weights. We expect that the different
structure of weights will reduce growth in the prices of
services by an average of close to one-half of a percent-
age point, most notably in the summer
(by 1.6 percentage points). Services price inflation will
thus strengthen more markedly next year, while price
growth is expected to reach 3% by the end of the projec-
tion horizon. The projection for this year is accompanied
-10
-5
0
5
10
15
-10
-5
0
5
10
15
Dec
.
Jan.
Fe
b.
Mar
.
Apr
.
May
Jun.
Jul.
Aug
.
Sep
.
Oct
.
Nov
.
Dec
.
20 21
other
electricity
motor and liquid fuels
energy
Figure 17: Contribution of base effects to the change in year-on-year growth in energy prices
Source: Eurostat, Banka Slovenije estimations and calculations.
in p.p.
22 Selling price expectations indicators rose sharply in May among producers of consumer goods, in particular among producers of durable goods.
However, this is not yet reflected in retail sector expectations due to the more protracted pass-through of costs into retail prices.
26

MACROECONOMIC PROJECTIONS FOR SLOVENIA
June 2021
by significant risks, as the deterioration of the epidemio-
logical situation would again limit the functioning of cer-
tain services, difficulties in price collection would continue
or increase, and higher price increases would be limited
by weaker demand.
The upward revision to the projection of price growth
this year is offset by the negative impact of the
change in weights. Compared with the December pro-
jections, the inflation projection is slightly higher this year
(0.4 percentage point) due to the assumption of higher
global prices of oil and commodities and stronger domes-
tic inflationary pressures. However, the revision is offset
by the impact of the change in weights in the amount of
-0.4 percentage points (Figure 18). The change in
weights also reduces the projection of core inflation,
which in the context of the extension of certain contain-
ment measures is lower this time also due to a stronger
drop in prices in the first quarter. In line with a more rapid
recovery in private consumption and more favourable
conditions on the labour market, core inflation is slightly
higher over the remainder of the projection horizon than
in previous projections, meaning headline inflation is also
higher (by 0.3 percentage points in 2022 and by
0.1 percentage points in 2023).
The risks surrounding the inflation projection are on
the upside. In addition to risks associated with the evolu-
tion of the epidemic and uncertainty regarding the impact
of the change in weights, the current inflation projection is
also subject to risks regarding the duration of limitations
in production and supply chains, and the pace of unwind-
ing of household savings accumulated last year. In the
event of more sustained difficulties on the supply side,
which are reflected this year in a shortage of input materi-
als and an increase in the prices thereof, rising produc-
tion costs could pass through to final prices to a greater
extent. On the other hand, the increased marginal pro-
pensity of households to consume following the end of
epidemic, in particular due to the considerable stock of
savings that households accumulated last year due to the
limited functioning of numerous activities, could result in
stronger price increases.
-1.0
-0.8
-0.6
-0.4
-0.2
0.0
0.2
0.4
0.6
0.8
1.0
1.2
1.4
-1.0
-0.8
-0.6
-0.4
-0.2
0.0
0.2
0.4
0.6
0.8
1.0
1.2
1.4
2020 2021 2022 2023
impact of weights
services*
non-energy industrial goods*
energy*
food*
HICP
diff. in growth and contributions in p.p.
Note: *Contribution without the impact of updated HICP weights.Source: SORS, Eurostat, Banka Slovenije projections.
Figure 18: Revision of inflation projections
Table 3: Inflation projections
Δ: Difference between current projections and projections in Macroeconomic Projections for Slovenia, December 2020. Source: SORS, Eurostat, Banka Slovenije calculations.
June Δ June Δ June Δ
Consumer prices (HICP) -0.2 1.6 1.9 1.7 -0.3 1.3 0.4 1.6 0.3 1.7 0.1
food 0.5 2.2 2.4 1.6 2.8 1.6 -0.4 2.3 0.2 2.6 0.0
energy -5.1 4.7 6.1 0.8 -10.8 7.3 7.6 0.3 -0.3 -0.6 -1.1
non-energy industrial goods -0.5 -0.7 -0.8 0.3 -0.5 0.2 0.3 0.5 0.2 0.4 0.0
serv ices 1.6 1.8 2.4 3.1 1.8 0.2 -1.3 2.6 0.7 3.0 0.7
Core inflation indicators (HICP)
excluding energy 0.6 1.1 1.4 1.8 1.3 0.5 -0.6 1.8 0.4 2.0 0.2
excl. energy and unprocessed food 0.6 0.9 1.1 1.8 1.0 0.4 -0.7 1.7 0.4 1.9 0.2
excl. energy, food, alcohol and tobacco 0.7 0.7 1.0 1.9 0.8 0.2 -0.6 1.6 0.4 1.7 0.2
2021 2022 2023
average y-o-y growth in %
2016 2017 2018 2019 2020
27
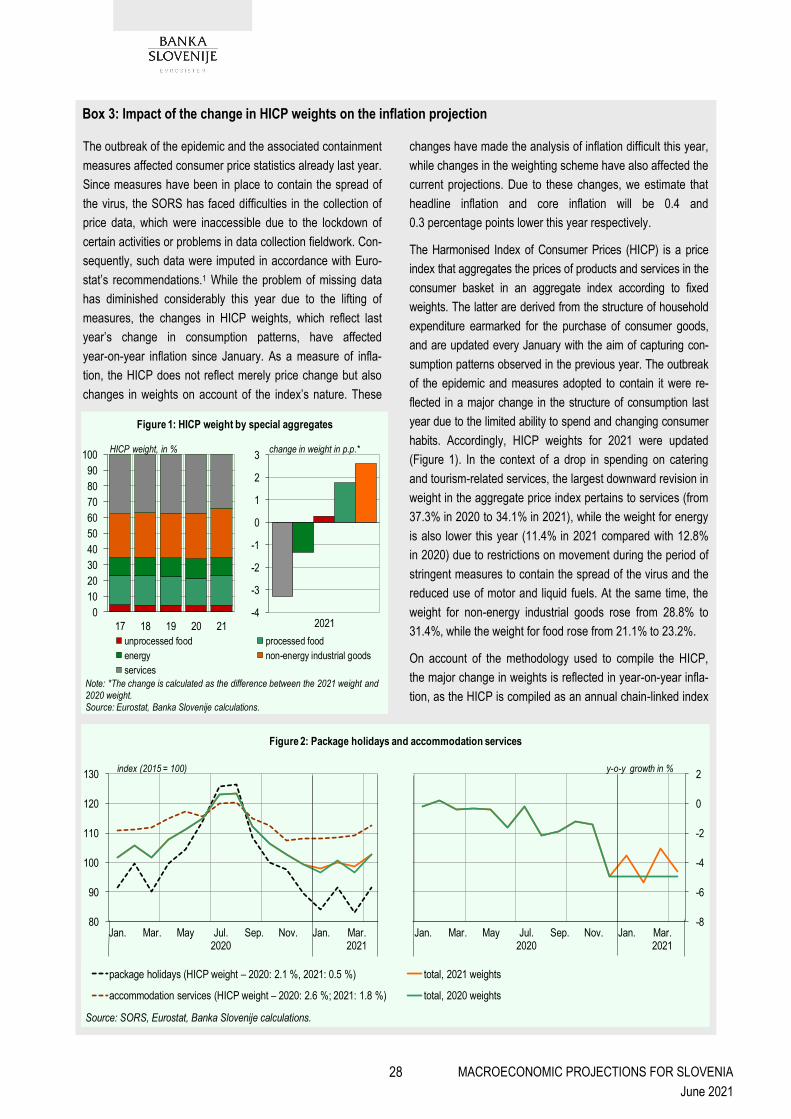
MACROECONOMIC PROJECTIONS FOR SLOVENIA
June 2021
The outbreak of the epidemic and the associated containment
measures affected consumer price statistics already last year.
Since measures have been in place to contain the spread of
the virus, the SORS has faced difficulties in the collection of
price data, which were inaccessible due to the lockdown of
certain activities or problems in data collection fieldwork. Con-
sequently, such data were imputed in accordance with Euro-
stat’s recommendations.1 While the problem of missing data
has diminished considerably this year due to the lifting of
measures, the changes in HICP weights, which reflect last
year’s change in consumption patterns, have affected
year-on-year inflation since January. As a measure of infla-
tion, the HICP does not reflect merely price change but also
changes in weights on account of the index’s nature. These
changes have made the analysis of inflation difficult this year,
while changes in the weighting scheme have also affected the
current projections. Due to these changes, we estimate that
headline inflation and core inflation will be 0.4 and
0.3 percentage points lower this year respectively.
The Harmonised Index of Consumer Prices (HICP) is a price
index that aggregates the prices of products and services in the
consumer basket in an aggregate index according to fixed
weights. The latter are derived from the structure of household
expenditure earmarked for the purchase of consumer goods,
and are updated every January with the aim of capturing con-
sumption patterns observed in the previous year. The outbreak
of the epidemic and measures adopted to contain it were re-
flected in a major change in the structure of consumption last
year due to the limited ability to spend and changing consumer
habits. Accordingly, HICP weights for 2021 were updated
(Figure 1). In the context of a drop in spending on catering
and tourism-related services, the largest downward revision in
weight in the aggregate price index pertains to services (from
37.3% in 2020 to 34.1% in 2021), while the weight for energy
is also lower this year (11.4% in 2021 compared with 12.8%
in 2020) due to restrictions on movement during the period of
stringent measures to contain the spread of the virus and the
reduced use of motor and liquid fuels. At the same time, the
weight for non-energy industrial goods rose from 28.8% to
31.4%, while the weight for food rose from 21.1% to 23.2%.
On account of the methodology used to compile the HICP,
the major change in weights is reflected in year-on-year infla-
tion, as the HICP is compiled as an annual chain-linked index
Box 3: Impact of the change in HICP weights on the inflation projection
-8
-6
-4
-2
0
2
80
90
100
110
120
130
Jan. Mar. May Jul.2020
Sep. Nov. Jan. Mar.2021
Jan. Mar. May Jul.2020
Sep. Nov. Jan. Mar.2021
package holidays (HICP weight – 2020: 2.1 %, 2021: 0.5 %) total, 2021 weights
accommodation services (HICP weight – 2020: 2.6 %; 2021: 1.8 %) total, 2020 weights
Figure 2: Package holidays and accommodation services
index (2015 = 100) y-o-y growth in %
Source: SORS, Eurostat, Banka Slovenije calculations.
0
10
20
30
40
50
60
70
80
90
100
17 18 19 20 21
unprocessed food processed food
energy non-energy industrial goods
services
-4
-3
-2
-1
0
1
2
3
2021
Figure 1: HICP weight by special aggregates
Note: *The change is calculated as the difference between the 2021 weight and 2020 weight. Source: Eurostat, Banka Slovenije calculations.
HICP weight, in % change in weight in p.p.*
28

MACROECONOMIC PROJECTIONS FOR SLOVENIA
June 2021
due to the annual updating of weights. This means that the
calculation of year-on-year price growth always compares the
values of the index calculated using different weights.
Year-on-year inflation therefore reflects the change in weights
in addition to price changes.2 Thus, both relative changes in
the weights of categories of products and services with differ-
ing price trends and the change in the seasonality of the ag-
gregate index affect measured growth. Seasonality changed
considerably this year, as particularly weights for tourism-
related services with a strong seasonal pattern (package
holidays, international flights, etc.) were lower. Due to the
redistribution of weight in favour of categories of products and
services with a lower seasonal pattern, the seasonality of the
overall price index is less-pronounced this year than last year,
which is reflected in the increased volatility of the measured
year-on-year growth rate.3 The impact in the case of the pack-
age holidays and accommodation aggregate price index is
illustrated in Figure 2. This year, the weight of components
with a strong seasonal pattern was halved (domestic and
international package holidays accounted for 44.8% of the
aggregate last year compared with 22.1% this year) while the
weight of less seasonal components rose (the proportion of
hotels, camps and other accommodation services was 55.2%
last year and is 77.9% this year). Consequently, the seasonal
fluctuation of the aggregate price index is less pronounced
this year than it would have been had the weights not
changed. Due to the change in the seasonal pattern, aggre-
gate year-on-year growth was more volatile during the first
four months of this year; in the context of fixed weights,
growth would have been unchanged at -5.0%.
The significant change in HICP weights has already had an
impact on the measured growth in consumer prices this year.
The impact can be expressed as the difference between the
official year-on-year growth in the HICP calculated using the
2021 weights and the hypothetical year-on-year growth in the
HICP resulting from the calculation of the index with no
change in weights, i.e. the 2020 weights. A comparison of
both year-on-year growth rates indicates that average head-
line inflation was 0.1 percentage points lower during the first
quarter of this year and 0.4 percentage points lower in April
due to the change in weights (Figure 3). Contributing in partic-
ular to the negative effect of the change in weights were ser-
vices and energy products, where growth in the prices of
motor fuels contributed less to headline inflation than it would
have due to a lower weight. While the change in weights for
energy products resulted in increasingly lower inflation, the
impact of services inflation was highly volatile due to the
change in seasonality.
The change in weights is also reflected in the inflation projec-
tion. The impact of weights, which depends on the already
known change in weights and on future growth in the prices of
individual categories of products and services, will continue to
deepen until August.4 Due to the update of weights, we ex-
pect that headline and core inflation will be 0.4 and 0.3 per-
centage points lower this year respectively (Table 1). Taking
into account the assumed euro price of oil, which is expected
to fluctuate at around EUR 56 per barrel, energy products will
continue to contribute to the negative effect. Due to a lower
weight for motor and liquid fuels, energy inflation will be one
percentage point lower than it would have been had the
weights not changed. Services inflation will also be one-half
of one percentage point lower on average this year, reaching
its peak in the summer when it will be 1.6 percentage points
lower. The pronounced impact in the summer is linked to the
2020 2021-1.5
-1.0
-0.5
0.0
0.5
1.0
1.5
2.0
2.5
3.0HICP – 2020 weights
HICP – 2021 weights
-0.4
-0.3
-0.2
-0.1
0.0
0.1
0.2
Jan. Feb. Mar. Apr.
2021
energy non-energy industrial goods
services processed food
unprocessed food impact of changes in weights
Figure 3: Impact of changes in weights on inflation
Source: Eurostat, Banka Slovenije calculations.
y-o-y growth in % contributions to diff. in p.p.
-1.0
-0.8
-0.6
-0.4
-0.2
0.0
0.2
-1.0
-0.8
-0.6
-0.4
-0.2
0.0
0.2
Jan. Feb. Mar. Apr. May Jun. Jul. Aug. Sep. Oct. Nov. Dec.
services non-energy industrial goods
energy processed food
unprocessed food HICP
Figure 4: Assessment of the impact of change in weights on inflation in 2021
Source: Eurostat, Banka Slovenije estimations and calculations.
impact of updated weights on y-o-y growth in HICP, in p.p.
29
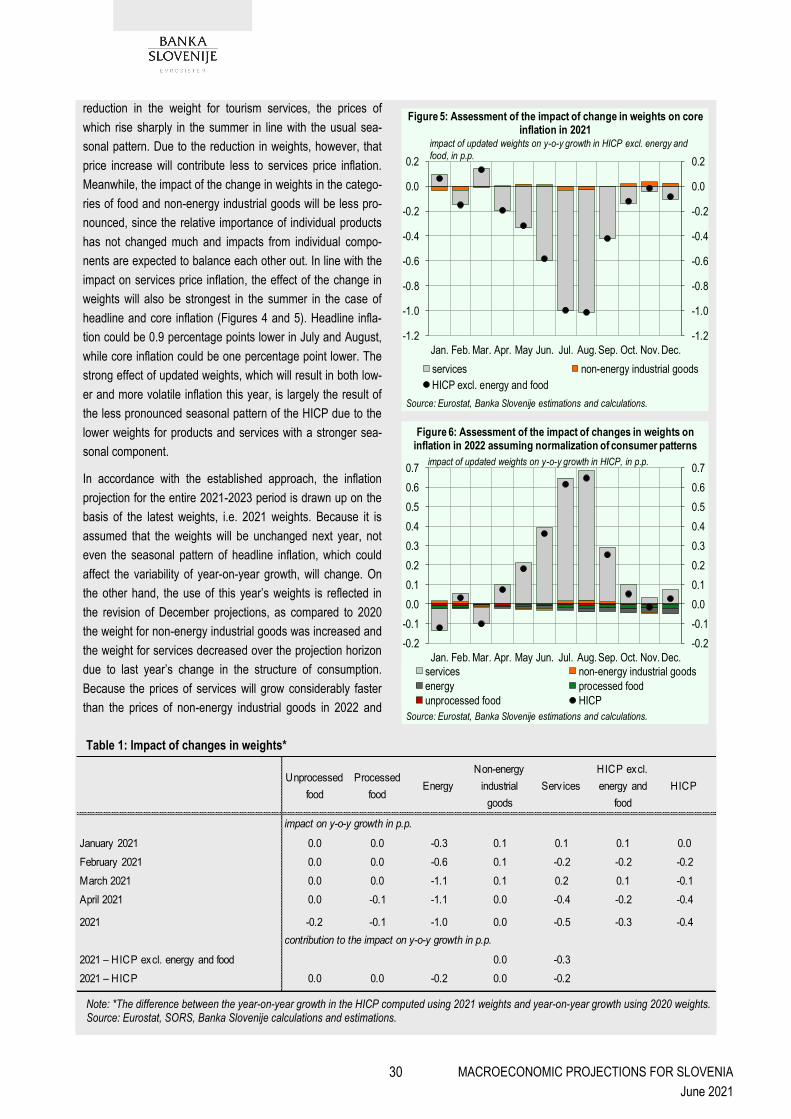
MACROECONOMIC PROJECTIONS FOR SLOVENIA
June 2021
reduction in the weight for tourism services, the prices of
which rise sharply in the summer in line with the usual sea-
sonal pattern. Due to the reduction in weights, however, that
price increase will contribute less to services price inflation.
Meanwhile, the impact of the change in weights in the catego-
ries of food and non-energy industrial goods will be less pro-
nounced, since the relative importance of individual products
has not changed much and impacts from individual compo-
nents are expected to balance each other out. In line with the
impact on services price inflation, the effect of the change in
weights will also be strongest in the summer in the case of
headline and core inflation (Figures 4 and 5). Headline infla-
tion could be 0.9 percentage points lower in July and August,
while core inflation could be one percentage point lower. The
strong effect of updated weights, which will result in both low-
er and more volatile inflation this year, is largely the result of
the less pronounced seasonal pattern of the HICP due to the
lower weights for products and services with a stronger sea-
sonal component.
In accordance with the established approach, the inflation
projection for the entire 2021-2023 period is drawn up on the
basis of the latest weights, i.e. 2021 weights. Because it is
assumed that the weights will be unchanged next year, not
even the seasonal pattern of headline inflation, which could
affect the variability of year-on-year growth, will change. On
the other hand, the use of this year’s weights is reflected in
the revision of December projections, as compared to 2020
the weight for non-energy industrial goods was increased and
the weight for services decreased over the projection horizon
due to last year’s change in the structure of consumption.
Because the prices of services will grow considerably faster
than the prices of non-energy industrial goods in 2022 and
Table 1: Impact of changes in weights*
Note: *The difference between the year-on-year growth in the HICP computed using 2021 weights and year-on-year growth using 2020 weights. Source: Eurostat, SORS, Banka Slovenije calculations and estimations.
-1.2
-1.0
-0.8
-0.6
-0.4
-0.2
0.0
0.2
-1.2
-1.0
-0.8
-0.6
-0.4
-0.2
0.0
0.2
Jan. Feb. Mar. Apr. May Jun. Jul. Aug. Sep. Oct. Nov. Dec.
services non-energy industrial goods
HICP excl. energy and food
Figure 5: Assessment of the impact of change in weights on core inflation in 2021
Source: Eurostat, Banka Slovenije estimations and calculations.
impact of updated weights on y-o-y growth in HICP excl. energy and food, in p.p.
Unprocessed
food
Processed
foodEnergy
Non-energy
industrial
goods
Serv ices
HICP excl.
energy and
food
HICP
January 2021 0.0 0.0 -0.3 0.1 0.1 0.1 0.0
February 2021 0.0 0.0 -0.6 0.1 -0.2 -0.2 -0.2
March 2021 0.0 0.0 -1.1 0.1 0.2 0.1 -0.1
April 2021 0.0 -0.1 -1.1 0.0 -0.4 -0.2 -0.4
2021 -0.2 -0.1 -1.0 0.0 -0.5 -0.3 -0.4
2021 – HICP excl. energy and food 0.0 -0.3
2021 – HICP 0.0 0.0 -0.2 0.0 -0.2
impact on y-o-y growth in p.p.
contribution to the impact on y-o-y growth in p.p.
-0.2
-0.1
0.0
0.1
0.2
0.3
0.4
0.5
0.6
0.7
-0.2
-0.1
0.0
0.1
0.2
0.3
0.4
0.5
0.6
0.7
Jan. Feb. Mar. Apr. May Jun. Jul. Aug. Sep. Oct. Nov. Dec.
services non-energy industrial goods
energy processed food
unprocessed food HICP
Figure 6: Assessment of the impact of changes in weights on inflation in 2022 assuming normalization of consumer patterns
Source: Eurostat, Banka Slovenije estimations and calculations.
impact of updated weights on y-o-y growth in HICP, in p.p.
30

MACROECONOMIC PROJECTIONS FOR SLOVENIA
June 2021
2023, the projection of core inflation is 0.1 percentage points
lower in both years than if last year’s weights had been used.
In the current situation, the approach of using the latest avail-
able weights over the entire projection horizon represents an
additional challenge, in particular when taking into account
the expected normalisation of consumption patterns. Despite
stringent measures to contain the spread of the virus at the
beginning of the year, purchasing habits could gradually re-
turn to their pre-crisis framework as early as this year, which
would lead to additional changes to weights for calculating the
HICP in 2022. Since those weights will be known at the be-
ginning of next year, the current projections could only be
revised with the June 2022 projections. Due to the significant
risk that accompanies the current inflation projection, we pre-
sent the assessed impact of weights in 2022 assuming the
complete normalisation of the structure of consumption al-
ready this year. If this year’s consumption patterns are the
same as those in the year prior to the crisis, seasonal fluctua-
tions in the aggregate price index would become more pro-
nounced again in 2022. This would affect the year-on-year
price growth, which would be higher by around 0.2 percent-
age points, on average, due to a change in weights
(Figure 6). In the context of a change in the seasonal pattern,
the prices of services would again affect headline inflation.
This effect would be positive and most pronounced in the
summer due to the normalisation of the seasonal pattern. The
estimates are however very uncertain due to their depend-
ence on both weight changes and growth in the prices of
individual components. Likewise, the hypothetical scenario of
the complete normalisation of consumption patterns merely
presents a borderline case, the realisation of which is very
unlikely due to the inability to spend during the period of strin-
gent measures at the beginning of the year and restrictions
that are still in place for the consumption of certain services.
The normalisation of consumer habits will be conditional on
the evolution of the epidemic and will likely be protracted. We
can thus expect a less pronounced effect in measured
year-on-year inflation, at least in terms of the impact of the
change in weights via modified seasonal patterns.
1 In line with the scope and stringency of measures, the problem of missing data was most evident in April last year, when imputed data accounted for 22.7% of all data included in the calculation of the HICP. That proportion averaged less than 4% over the first four
months of this year.
2 The impact of this year’s change in weights on growth in the con-sumer price index was addressed in detail in the Economic and Fi-
nancial Developments publication issued in April 2021.
3 The technical impact of weighting and aggregation, which is not related to changes in the seasonality of components at the lowest, five-digit level of the European Classification of Individual Consump-
tion According to Purpose (ECOICOP).
4 Because the assessment of the impact of weights over the projec-tion horizon requires a projection of components of inflation at a minimum at the fourth level of the ECOICOP, the impact of weights is assessed using simulations for the main aggregates of inflation where projections are drawn up at a higher level. To that end, we assume that monthly growth in the prices of individual categories of products and services is the same over the projection horizon as the average monthly growth between 2017 and 2019. In doing so, we preserve the pattern of price movements in seasonal products, and exclude from the computation the atypical price developments seen last year as a result of the crisis conditions. The impact of weights is represented by the difference between simulated price growth for the aggregate price index, compiled with the help of this year’s weights,
and simulated growth in that index assuming unchanged weights.
31
MACROECONOMIC PROJECTIONS FOR SLOVENIA
June 2021
Uncertainty regarding the evolution of the epidemic
is linked in particular to the effectiveness of the vac-
cination process in the coming months and the po-
tential outbreak of new strains of the virus, against
which existing vaccines and the immune protection
of persons who have already recovered might not be
effective. Similar to last year, the current baseline projec-
tion and alternative scenarios are based on epidemiologi-
cal assumptions that differ in terms of the success of the
vaccination process, the emergence of new strains of the
virus, the need for additional non-pharmaceutical
measures with adverse effects on the economy, and the
ability of households and firms to adapt to new circum-
stances. Should an insufficient share of the population be
vaccinated or a new strain of the virus emerge, strict non-
pharmaceutical measures, including a partial lockdown,
would have to be reintroduced to contain the spread of
the virus. The effects of such measures on economic
activity would depend on the ability of firms and house-
holds to adapt to new circumstances and restrictions.
Given the still high level of uncertainty surrounding the
key baseline assumptions, the baseline macroeconomic
projections for Slovenia are complemented with three
alternative scenarios for economic activity. The alterna-
3 The Covid-19 Epidemic and Alternative Scenarios23
The health situation continues to cause considerable uncertainty in the preparation of macroeconomic projec-
tions. The key factors determining the future evolution of the epidemic pertain to the share of the population
vaccinated and the potential outbreak of new strains of the virus, against which existing vaccines and the im-
mune protection of persons who have already recovered might not be effective. Should an insufficient share of
the population be vaccinated or a new strain of the virus emerge, strict non-pharmaceutical measures, includ-
ing a partial lockdown, would have to be reintroduced to contain the spread of the virus. The effects of such
measures on economic activity would depend on the ability of firms and households to adapt to new circum-
stances and restrictions. Given the still high level of uncertainty surrounding the key baseline assumptions, the
baseline macroeconomic projections for Slovenia are complemented with three alternative scenarios for eco-
nomic activity, which vary on the underlying epidemiological assumptions, the stringency and evolution of con-
tainment measures as well as the ability of households and firms to adapt to new circumstances (so-called
learning effects). In the mild scenario, real GDP would reach the pre-crisis level (i.e. from 2019) as early as the
middle of this year underlining strengthening confidence and the more rapid adaptation of the economy to the
new conditions than envisaged in the baseline projection. In the moderate scenario, which assumes that an
insufficient share of the population would be vaccinated in the autumn, it would be necessary to reintroduce
stricter non-pharmaceutical measures towards the end of this year and beginning of next year. This would be
reflected in a slower recovery in real GDP, which would remain 1% below the baseline projection in 2022 and
2023. In the severe scenario, which assumes the outbreak of a new strain of the virus against which currently
available vaccines would be ineffective, a new larger wave of the epidemic would follow in the autumn. This
would have to be contained through more protracted non-pharmaceutical measures, which would further slow
the recovery in economic activity, with the pre-crisis level of GDP reached in early 2023.
23 Alternative scenarios for economic activity in Slovenia were drawn up outside of the scope of the joint Eurosystem/ECB Staff macroeconomic
projection exercise. Only general epidemiological assumptions for the baseline projection were harmonised within the scope of the joint exercise.
32

MACROECONOMIC PROJECTIONS FOR SLOVENIA
June 2021
tive scenarios for economic activity are prepared in three
steps. In the first step, we analyse how firms and house-
holds have responded to containment measures since
the onset of the epidemic and what effect those
measures have had on economic activity. The second
step entails the projection of the Oxford Stringency Index
(OSI) of containment measures24 based on epidemiologi-
cal scenarios prepared for the period until the end of
2021 by Professor Janez Žibert25 from the Faculty of
Health Sciences at the University of Ljubljana using an
extended SEIR epidemiological model (V2.0). Alternative
scenarios of economic activity over the projection horizon
are constructed in the third step by taking into account
the expected evolution of the epidemic and the past re-
sponse of the economy to containment measures.
3.1 The relationship between conta-
inment measures and economic activity
The enacted stringent measures to contain the
spread of the epidemic had a significant impact on
the functioning of the Slovenian economy in the last
year. Analysing the relationship between contain-
ment measures and economic activity is crucial to
better understand how households and firms have
adapted to the changing environment following the
outbreak of the Covid-19 epidemic (so-called learning
effects) and to more precisely assess the impact of
non-pharmaceutical measures (so-called contain-
ment measures) on the economy. Data indicate that
the negative correlation between containment measures
and economic activity weakened during the second half
of 2020. This was particularly notable in the strong re-
bound in GDP in the third quarter, and the small contrac-
tion in the final quarter of the year, despite the persis-
tence of relatively strict containment measures that were
adopted in mid-October when the Covid-19 epidemic was
declared again in Slovenia. These measures prevailed
also at the beginning of this year, and were not lifted until
February when the majority of regions transitioned to the
orange phase of containment measures, which among
others, included full opening of primary schools, opening
of retail stores and some services activities and lifting of
the ban on crossing municipal borders. The process of
easing of containment measures was interrupted by an
eleven-day lockdown at the beginning of April, but there-
after continued with an increasing pace, pointing to the
beginning of a more broad-based post-pandemic recov-
ery. While there exist numerous factors influencing the
relationship between containment measures and devel-
opments in economic activity, the following two stand out:
1) the ability of households and firms to adapt to the
changing environment following the outbreak of the epi-
demic; and 2) the more targeted nature of containment
measures in Slovenia during the second wave of the epi-
demic.26
Consumers adapted to the new situation to a greater
extent during the second wave of the epidemic. The
adaptation of the purchasing habits of households is illus-
trated in Figure 19 and presents the relationship between
the stringency of adopted containment measures and the
value of online card payments. The latter were significant-
0
50
100
150
200
250
300
0
50
100
150
200
250
300
20 30 40 50 60 70 80 90 100
onlin
e pa
ymen
ts(a
vera
ge 2
019W
41-W
52 =
100
)
Oxford Stringency Index (max = 100)
second wave
first wave
Note: Data in weekly frequency. First wave refers to the period 13 March 2020 -18 May 2020, and second wave to the period from the declaration of the epidemic on 18 October 2020 onwards (the cut-off date for the preparation of projections in 26 May 2021), as the epidemic was extended by the Government of Slovenia on 12 May 2021 at least until 15 June 2021.Source: Oxford Economics, Bankart, Banka Slovenije calculations.
Figure 19: Containment measures and online payments
24 Details can be found in subsection 3.3.
25 Professor Janez Žibert is a member of the Covid-19 Tracker team, which developed a tool for the transparent and continuous publication of
information in connection with the Covid-19 epidemic in Slovenia. Additional details can be found on the website.
26 The first wave relates to the period from 13 March 2020 to 18 May 2020, while the second wave relates to the epidemic in the period from 18 October 2020 on (the cut-off date for the preparation of projections is 26 May 2021), as on 12 May 2021 the Slovenian government extended
the epidemic until at least 15 June 2021. This coincides with the period of more stringent measures, which are reflected in the OSI.
33
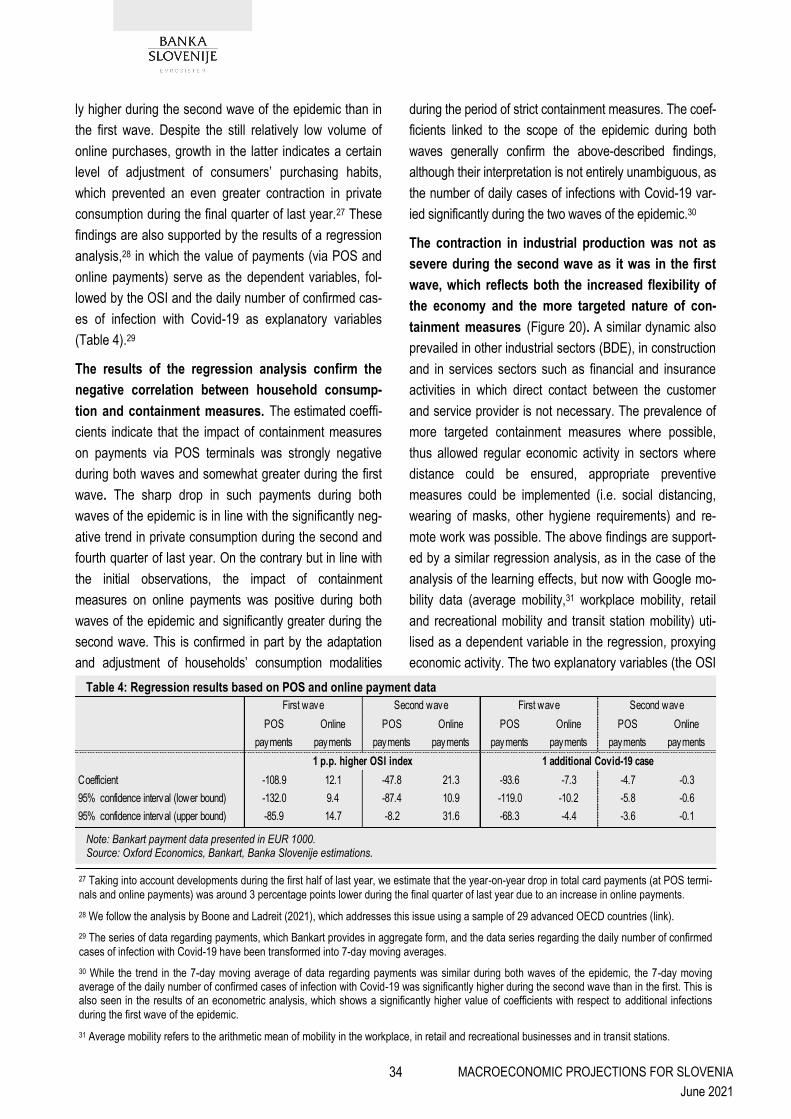
MACROECONOMIC PROJECTIONS FOR SLOVENIA
June 2021
ly higher during the second wave of the epidemic than in
the first wave. Despite the still relatively low volume of
online purchases, growth in the latter indicates a certain
level of adjustment of consumers’ purchasing habits,
which prevented an even greater contraction in private
consumption during the final quarter of last year.27 These
findings are also supported by the results of a regression
analysis,28 in which the value of payments (via POS and
online payments) serve as the dependent variables, fol-
lowed by the OSI and the daily number of confirmed cas-
es of infection with Covid-19 as explanatory variables
(Table 4).29
The results of the regression analysis confirm the
negative correlation between household consump-
tion and containment measures. The estimated coeffi-
cients indicate that the impact of containment measures
on payments via POS terminals was strongly negative
during both waves and somewhat greater during the first
wave. The sharp drop in such payments during both
waves of the epidemic is in line with the significantly neg-
ative trend in private consumption during the second and
fourth quarter of last year. On the contrary but in line with
the initial observations, the impact of containment
measures on online payments was positive during both
waves of the epidemic and significantly greater during the
second wave. This is confirmed in part by the adaptation
and adjustment of households’ consumption modalities
during the period of strict containment measures. The coef-
ficients linked to the scope of the epidemic during both
waves generally confirm the above-described findings,
although their interpretation is not entirely unambiguous, as
the number of daily cases of infections with Covid-19 var-
ied significantly during the two waves of the epidemic.30
The contraction in industrial production was not as
severe during the second wave as it was in the first
wave, which reflects both the increased flexibility of
the economy and the more targeted nature of con-
tainment measures (Figure 20). A similar dynamic also
prevailed in other industrial sectors (BDE), in construction
and in services sectors such as financial and insurance
activities in which direct contact between the customer
and service provider is not necessary. The prevalence of
more targeted containment measures where possible,
thus allowed regular economic activity in sectors where
distance could be ensured, appropriate preventive
measures could be implemented (i.e. social distancing,
wearing of masks, other hygiene requirements) and re-
mote work was possible. The above findings are support-
ed by a similar regression analysis, as in the case of the
analysis of the learning effects, but now with Google mo-
bility data (average mobility,31 workplace mobility, retail
and recreational mobility and transit station mobility) uti-
lised as a dependent variable in the regression, proxying
economic activity. The two explanatory variables (the OSI
Table 4: Regression results based on POS and online payment data
Note: Bankart payment data presented in EUR 1000. Source: Oxford Economics, Bankart, Banka Slovenije estimations.
POS
payments
Online
payments
POS
payments
Online
payments
POS
payments
Online
payments
POS
payments
Online
payments
Coefficient -108.9 12.1 -47.8 21.3 -93.6 -7.3 -4.7 -0.3
95% confidence interval (lower bound) -132.0 9.4 -87.4 10.9 -119.0 -10.2 -5.8 -0.6
95% confidence interval (upper bound) -85.9 14.7 -8.2 31.6 -68.3 -4.4 -3.6 -0.1
First wave Second wave First wave Second wave
1 additional Covid-19 case1 p.p. higher OSI index
27 Taking into account developments during the first half of last year, we estimate that the year-on-year drop in total card payments (at POS termi-
nals and online payments) was around 3 percentage points lower during the final quarter of last year due to an increase in online payments.
28 We follow the analysis by Boone and Ladreit (2021), which addresses this issue using a sample of 29 advanced OECD countries (link).
29 The series of data regarding payments, which Bankart provides in aggregate form, and the data series regarding the daily number of confirmed
cases of infection with Covid-19 have been transformed into 7-day moving averages.
30 While the trend in the 7-day moving average of data regarding payments was similar during both waves of the epidemic, the 7-day moving average of the daily number of confirmed cases of infection with Covid-19 was significantly higher during the second wave than in the first. This is also seen in the results of an econometric analysis, which shows a significantly higher value of coefficients with respect to additional infections
during the first wave of the epidemic.
31 Average mobility refers to the arithmetic mean of mobility in the workplace, in retail and recreational businesses and in transit stations.
34
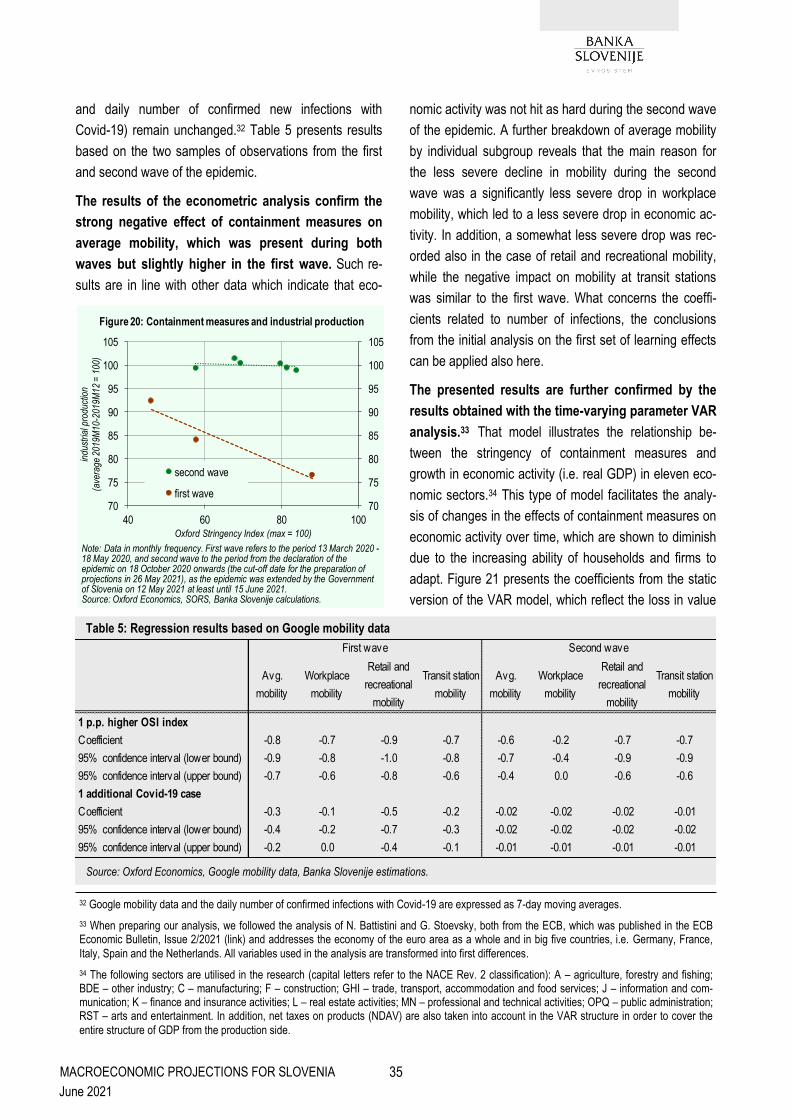
MACROECONOMIC PROJECTIONS FOR SLOVENIA
June 2021
and daily number of confirmed new infections with
Covid-19) remain unchanged.32 Table 5 presents results
based on the two samples of observations from the first
and second wave of the epidemic.
The results of the econometric analysis confirm the
strong negative effect of containment measures on
average mobility, which was present during both
waves but slightly higher in the first wave. Such re-
sults are in line with other data which indicate that eco-
nomic activity was not hit as hard during the second wave
of the epidemic. A further breakdown of average mobility
by individual subgroup reveals that the main reason for
the less severe decline in mobility during the second
wave was a significantly less severe drop in workplace
mobility, which led to a less severe drop in economic ac-
tivity. In addition, a somewhat less severe drop was rec-
orded also in the case of retail and recreational mobility,
while the negative impact on mobility at transit stations
was similar to the first wave. What concerns the coeffi-
cients related to number of infections, the conclusions
from the initial analysis on the first set of learning effects
can be applied also here.
The presented results are further confirmed by the
results obtained with the time-varying parameter VAR
analysis.33 That model illustrates the relationship be-
tween the stringency of containment measures and
growth in economic activity (i.e. real GDP) in eleven eco-
nomic sectors.34 This type of model facilitates the analy-
sis of changes in the effects of containment measures on
economic activity over time, which are shown to diminish
due to the increasing ability of households and firms to
adapt. Figure 21 presents the coefficients from the static
version of the VAR model, which reflect the loss in value
Table 5: Regression results based on Google mobility data
Source: Oxford Economics, Google mobility data, Banka Slovenije estimations.
Avg.
mobility
Workplace
mobility
Retail and
recreational
mobility
Transit station
mobility
Avg.
mobility
Workplace
mobility
Retail and
recreational
mobility
Transit station
mobility
1 p.p. higher OSI index
Coefficient -0.8 -0.7 -0.9 -0.7 -0.6 -0.2 -0.7 -0.7
95% confidence interval (lower bound) -0.9 -0.8 -1.0 -0.8 -0.7 -0.4 -0.9 -0.9
95% confidence interval (upper bound) -0.7 -0.6 -0.8 -0.6 -0.4 0.0 -0.6 -0.6
1 additional Covid-19 case
Coefficient -0.3 -0.1 -0.5 -0.2 -0.02 -0.02 -0.02 -0.01
95% confidence interval (lower bound) -0.4 -0.2 -0.7 -0.3 -0.02 -0.02 -0.02 -0.02
95% confidence interval (upper bound) -0.2 0.0 -0.4 -0.1 -0.01 -0.01 -0.01 -0.01
First wave Second wave
32 Google mobility data and the daily number of confirmed infections with Covid-19 are expressed as 7-day moving averages.
33 When preparing our analysis, we followed the analysis of N. Battistini and G. Stoevsky, both from the ECB, which was published in the ECB Economic Bulletin, Issue 2/2021 (link) and addresses the economy of the euro area as a whole and in big five countries, i.e. Germany, France,
Italy, Spain and the Netherlands. All variables used in the analysis are transformed into first differences.
34 The following sectors are utilised in the research (capital letters refer to the NACE Rev. 2 classification): A – agriculture, forestry and fishing; BDE – other industry; C – manufacturing; F – construction; GHI – trade, transport, accommodation and food services; J – information and com-munication; K – finance and insurance activities; L – real estate activities; MN – professional and technical activities; OPQ – public administration; RST – arts and entertainment. In addition, net taxes on products (NDAV) are also taken into account in the VAR structure in order to cover the
entire structure of GDP from the production side.
70
75
80
85
90
95
100
105
70
75
80
85
90
95
100
105
40 60 80 100
indu
stria
l pro
duct
ion
(ave
rage
201
9M10
-201
9M12
= 1
00)
Oxford Stringency Index (max = 100)
second wave
first wave
Note: Data in monthly frequency. First wave refers to the period 13 March 2020 -18 May 2020, and second wave to the period from the declaration of the epidemic on 18 October 2020 onwards (the cut-off date for the preparation of projections in 26 May 2021), as the epidemic was extended by the Government of Slovenia on 12 May 2021 at least until 15 June 2021.Source: Oxford Economics, SORS, Banka Slovenije calculations.
Figure 20: Containment measures and industrial production
35
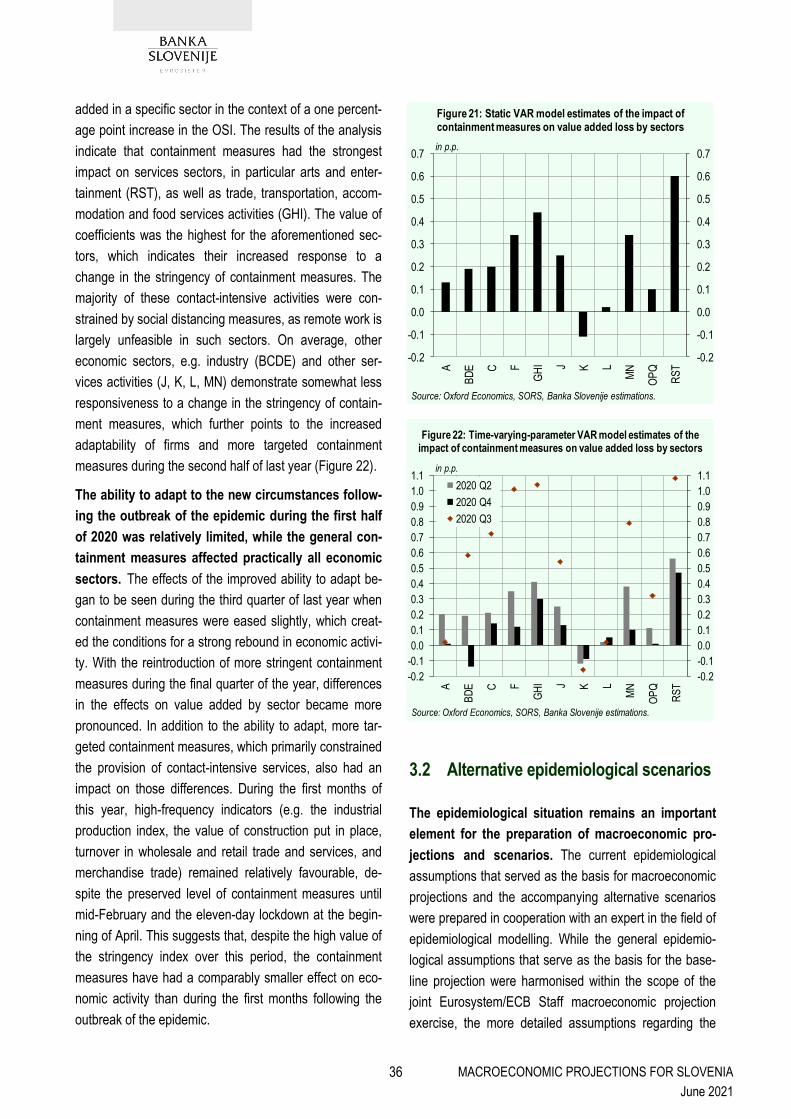
MACROECONOMIC PROJECTIONS FOR SLOVENIA
June 2021
added in a specific sector in the context of a one percent-
age point increase in the OSI. The results of the analysis
indicate that containment measures had the strongest
impact on services sectors, in particular arts and enter-
tainment (RST), as well as trade, transportation, accom-
modation and food services activities (GHI). The value of
coefficients was the highest for the aforementioned sec-
tors, which indicates their increased response to a
change in the stringency of containment measures. The
majority of these contact-intensive activities were con-
strained by social distancing measures, as remote work is
largely unfeasible in such sectors. On average, other
economic sectors, e.g. industry (BCDE) and other ser-
vices activities (J, K, L, MN) demonstrate somewhat less
responsiveness to a change in the stringency of contain-
ment measures, which further points to the increased
adaptability of firms and more targeted containment
measures during the second half of last year (Figure 22).
The ability to adapt to the new circumstances follow-
ing the outbreak of the epidemic during the first half
of 2020 was relatively limited, while the general con-
tainment measures affected practically all economic
sectors. The effects of the improved ability to adapt be-
gan to be seen during the third quarter of last year when
containment measures were eased slightly, which creat-
ed the conditions for a strong rebound in economic activi-
ty. With the reintroduction of more stringent containment
measures during the final quarter of the year, differences
in the effects on value added by sector became more
pronounced. In addition to the ability to adapt, more tar-
geted containment measures, which primarily constrained
the provision of contact-intensive services, also had an
impact on those differences. During the first months of
this year, high-frequency indicators (e.g. the industrial
production index, the value of construction put in place,
turnover in wholesale and retail trade and services, and
merchandise trade) remained relatively favourable, de-
spite the preserved level of containment measures until
mid-February and the eleven-day lockdown at the begin-
ning of April. This suggests that, despite the high value of
the stringency index over this period, the containment
measures have had a comparably smaller effect on eco-
nomic activity than during the first months following the
outbreak of the epidemic.
3.2 Alternative epidemiological scenarios
The epidemiological situation remains an important
element for the preparation of macroeconomic pro-
jections and scenarios. The current epidemiological
assumptions that served as the basis for macroeconomic
projections and the accompanying alternative scenarios
were prepared in cooperation with an expert in the field of
epidemiological modelling. While the general epidemio-
logical assumptions that serve as the basis for the base-
line projection were harmonised within the scope of the
joint Eurosystem/ECB Staff macroeconomic projection
exercise, the more detailed assumptions regarding the
-0.2
-0.1
0.0
0.1
0.2
0.3
0.4
0.5
0.6
0.7
-0.2
-0.1
0.0
0.1
0.2
0.3
0.4
0.5
0.6
0.7
A
BD
E C F
GH
I J K L
MN
OP
Q
RS
T
Source: Oxford Economics, SORS, Banka Slovenije estimations.
in p.p.
Figure 21: Static VAR model estimates of the impact of containment measures on value added loss by sectors
-0.2
-0.1
0.0
0.1
0.2
0.3
0.4
0.5
0.6
0.7
0.8
0.9
1.0
1.1
-0.2
-0.1
0.0
0.1
0.2
0.3
0.4
0.5
0.6
0.7
0.8
0.9
1.0
1.1
A
BD
E C F
GH
I J K L
MN
OP
Q
RS
T
2020 Q2
2020 Q4
2020 Q3
Source: Oxford Economics, SORS, Banka Slovenije estimations.
in p.p.
Figure 22: Time-varying-parameter VAR model estimates of the impact of containment measures on value added loss by sectors
36

MACROECONOMIC PROJECTIONS FOR SLOVENIA
June 2021
evolution of the epidemic in Slovenia, both for the base-
line projection and alternative scenarios, were prepared
in cooperation with Professor Janez Žibert from the Fac-
ulty of Health Sciences at the University of Ljubljana. The
different epidemiological scenarios, on which the current
baseline macroeconomic projection and alternative scenar-
ios are based, differ primarily in terms of assumptions in
connection with the success of the vaccination process
(and thus the share of the population vaccinated or protect-
ed), and in terms of the possible outbreak of a new strain
of the virus, against which currently available vaccines
would not be effective (Figure 23). Two vaccination periods
are assumed in all scenarios. The first period, which is
currently in progress, and a second period in the autumn,
when it is assumed that an additional booster dose will be
required. The calculation of the number of vaccinated per-
sons takes into account the first dose of the vaccination,
where it is assumed that protection is achieved in 70% of
those vaccinated, while the effectiveness of a given vac-
cine (i.e. protection) is estimated to last nine months.35
Epidemiological scenarios have been prepared using
an extended SEIR C19SI epidemiological model
(V2.0), which facilitates the modelling of various
groups of the population and simulations of the tran-
sitions of persons between different levels of the evo-
lution of the disease. The SEIR model is an extended
SIR model which, using differential equations, illustrates
the transition of persons between various subgroups of
the population: Susceptible (S), Exposed (E), Infectious
(I) and Recovered (R). The model is further extended to
facilitate the modelling of different additional subgroups,
such as asymptomatic cases, vaccinated, hospitalised
and persons requiring intensive care, and fatal cases. As
mortality and spreading of disease varies across the age
groups, one key advantage of this models is its ability to
distinguish between five age groups (up to 24 years of
age, 25-44 years of age, 45-64 years of age,
65-74 years of age and more than 75 years of age),
which interact in a predetermined way. Based on scenari-
os that are determined by different assumptions such as
the age structure of the population, the vaccination pro-
cess and the virulence of the virus, such models facilitate
the projection of the number of deaths, the number of
infected persons and the number of those requiring hos-
pitalisation, which is crucial to ensure the stability of the
healthcare system.36
The epidemiological scenario behind the baseline
projection, assumes that the epidemic will be suc-
cessfully contained and that epidemiological tracking
will be re-established. In this scenario, the vaccination
process is assumed to be successful in both periods
(prior to the summer and in the autumn), with around
50% of the entire population vaccinated by the end of
June.37 This share is not expected to fall below the
above-mentioned threshold in the autumn months, which
will ensure the successful containment of the epidemic. In
the context of a drop in the number of new cases of infec-
tion, epidemiological tracking is expected to be re-
established as an important tool for managing the epi-
demic. The success of the aforementioned activities will
be reflected in the reduced number of infections, hospital-
35 Epidemiological scenarios were prepared on the cut-off date of 6 May 2021. Close to 450 thousand people had received the first dose of the
vaccination by that date.
36 Details regarding the SEIR C19SI model (V2.0) are accessible on the website of Professor Janez Žibert.
37 The estimate is drawn up based on the progress of vaccinations until the cut-off date of 6 May 2021. The estimated herd immunity threshold for the coronavirus disease is a population vaccination rate of 60 to 70%. That is also the vaccination target in Slovenia. If that threshold is achieved, the evolution of the epidemic would be slightly more favourable than assumed in this scenario. The main focus of vaccination is the management of more severe cases of the disease that require hospitalisation. For this reason, the share of persons vaccinated in high-risk groups of the popu-
lation is particularly crucial.
0
200
400
600
800
1000
1200
1400
1600
1800
2000
mild scenario
moderate scenario
severe scenario
actual
Note: The cut-off date for the preparation of scenarios is 6 May 2021.Source: Scenarios prepared with an extended epidemiological model SEIR C19SI, V2.0, based on COVID-19-sledilnik.org data by assoc. prof. dr. Janez Žibert, Faculty of Health Sciences, University of Ljubljana, COVID-19-sledilnik.org.
number of persons, in thousands
Figure 23: Number of vaccinations across scenarios
The decrease in the number of vaccinations is due to a decrease in the effectiveness of the vaccine before receiving the booster dose or in the case of a more severe scenario of ineffectiveness of the vaccine against a new version of the virus.
37
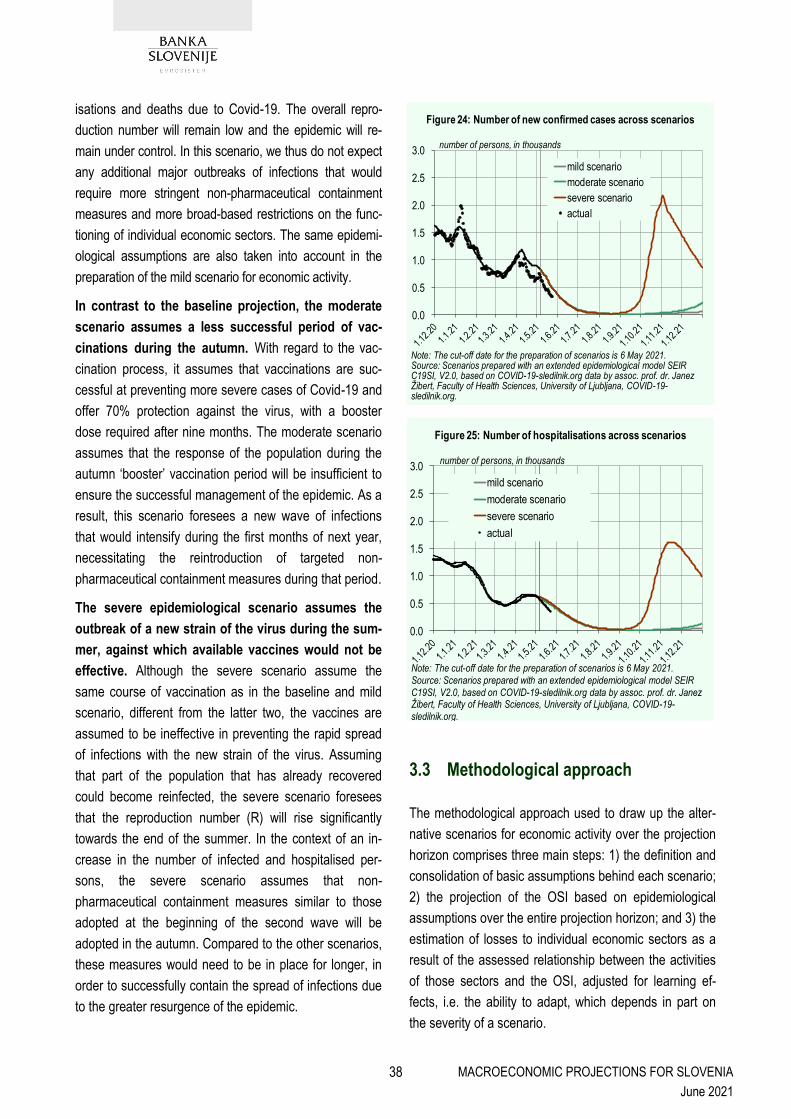
MACROECONOMIC PROJECTIONS FOR SLOVENIA
June 2021
isations and deaths due to Covid-19. The overall repro-
duction number will remain low and the epidemic will re-
main under control. In this scenario, we thus do not expect
any additional major outbreaks of infections that would
require more stringent non-pharmaceutical containment
measures and more broad-based restrictions on the func-
tioning of individual economic sectors. The same epidemi-
ological assumptions are also taken into account in the
preparation of the mild scenario for economic activity.
In contrast to the baseline projection, the moderate
scenario assumes a less successful period of vac-
cinations during the autumn. With regard to the vac-
cination process, it assumes that vaccinations are suc-
cessful at preventing more severe cases of Covid-19 and
offer 70% protection against the virus, with a booster
dose required after nine months. The moderate scenario
assumes that the response of the population during the
autumn ‘booster’ vaccination period will be insufficient to
ensure the successful management of the epidemic. As a
result, this scenario foresees a new wave of infections
that would intensify during the first months of next year,
necessitating the reintroduction of targeted non-
pharmaceutical containment measures during that period.
The severe epidemiological scenario assumes the
outbreak of a new strain of the virus during the sum-
mer, against which available vaccines would not be
effective. Although the severe scenario assume the
same course of vaccination as in the baseline and mild
scenario, different from the latter two, the vaccines are
assumed to be ineffective in preventing the rapid spread
of infections with the new strain of the virus. Assuming
that part of the population that has already recovered
could become reinfected, the severe scenario foresees
that the reproduction number (R) will rise significantly
towards the end of the summer. In the context of an in-
crease in the number of infected and hospitalised per-
sons, the severe scenario assumes that non-
pharmaceutical containment measures similar to those
adopted at the beginning of the second wave will be
adopted in the autumn. Compared to the other scenarios,
these measures would need to be in place for longer, in
order to successfully contain the spread of infections due
to the greater resurgence of the epidemic.
3.3 Methodological approach
The methodological approach used to draw up the alter-
native scenarios for economic activity over the projection
horizon comprises three main steps: 1) the definition and
consolidation of basic assumptions behind each scenario;
2) the projection of the OSI based on epidemiological
assumptions over the entire projection horizon; and 3) the
estimation of losses to individual economic sectors as a
result of the assessed relationship between the activities
of those sectors and the OSI, adjusted for learning ef-
fects, i.e. the ability to adapt, which depends in part on
the severity of a scenario.
0.0
0.5
1.0
1.5
2.0
2.5
3.0
mild scenario
moderate scenario
severe scenario
actual
Note: The cut-off date for the preparation of scenarios is 6 May 2021.Source: Scenarios prepared with an extended epidemiological model SEIR C19SI, V2.0, based on COVID-19-sledilnik.org data by assoc. prof. dr. Janez Žibert, Faculty of Health Sciences, University of Ljubljana, COVID-19-sledilnik.org.
number of persons, in thousands
Figure 25: Number of hospitalisations across scenarios
0.0
0.5
1.0
1.5
2.0
2.5
3.0
mild scenario
moderate scenario
severe scenario
actual
Note: The cut-off date for the preparation of scenarios is 6 May 2021.Source: Scenarios prepared with an extended epidemiological model SEIR C19SI, V2.0, based on COVID-19-sledilnik.org data by assoc. prof. dr. Janez Žibert, Faculty of Health Sciences, University of Ljubljana, COVID-19-sledilnik.org.
number of persons, in thousands
Figure 24: Number of new confirmed cases across scenarios
38

MACROECONOMIC PROJECTIONS FOR SLOVENIA
June 2021
The basic assumptions behind the alternative scenar-
ios for economic activity comprise both epidemiolog-
ical assumptions that are based on the presented
epidemiological scenarios and assumptions regard-
ing the relationship between the stringency of con-
tainment measures and economic activity, as pre-
sented in the aforementioned analysis. The consolidat-
ed assumptions are presented in Table 6. In addition to
uncertainty in connection with the health situation, the
ability of firms and households to adapt to the new situa-
tion will have a significant impact on the recovery in eco-
nomic activity.
Based on the epidemiological assumptions for each
scenario, the indicator of the stringency of contain-
ment measures was assessed for the entire projec-
tion horizon, and adjusted for learning effects of
households and firms. The outbreak of the virus last
year required the adoption of stringent containment
measures to ensure the stability of the healthcare sys-
tem. Nevertheless, these measures simultaneously inflict-
ed severe negative effects on economic activity. The
OSI,38 developed by Hale et al. (2021) for 180 countries,
has served as one of the key indicators to summarize the
prevalence and stringency of containment measures
across countries, allowing for timely assessment and
comparability. For this reason, the OSI is also used in the
preparation of alternative scenarios for economic activity
over the projection horizon. The projection of the short-
term development of the OSI combines the epidemiologi-
cal assumptions regarding the number of confirmed new
infections and hospitalisations as set forth in the epidemi-
ological scenarios, with the plan enforced by the Govern-
ment of Slovenia to lift non-pharmaceutical containment
measures.39 The government’s plan to lift containment
measures comprises five phases (black, red, orange,
yellow and green), where the threshold for transitions
between individual phases is determined by the 7-days
average of the number of confirmed cases and hospitali-
sations. The average value of the OSI is calculated for
Table 6: Underlying assumptions of the baseline projection and alternative scenarios for economic activity
Source: Scenarios prepared with an extended epidemiological model SEIR C19SI, V2.0, based on COVID-19-sledilnik.org data by assoc. prof. dr. Janez Žibert, Faculty of Health Sciences, University of Ljubljana, COVID-19-sledilnik.org, ECB and Banka Slovenije assumptions.
Mild scenario Baseline projection Moderate scenario Severe scenario
Epidemiological
assumptions
– less successful autumn
vaccination period
– only 40% of the population is
vaccinated and protected in
November 2021
– the effective reproduction number
increases in autumn
– vaccination is ineffective due to
the emergence of a new version of
the v irus resistant to available
vaccines
– the recovered part of the
population becomes susceptible to
infection with the new version of the
v irus
Other
assumptions
– some containment measures
prevail until the end of the projection
horizon, but are significantly more
targeted
– strong rebound in economic
sentiment/confidence
– faster adaptation of businesses
and households to new conditions
– some containment measures
prevail until the end of the
projection horizon, but are more
targeted
– rebound in economic
sentiment/confidence
– stricter, but more targeted,
containment measures reinstated
over 2022; some containment
measures prevail until the end of the
projection horizon
– rebound in economic
sentiment/confidence
– stricter, but still targeted,
containment measures reinstated
from 2021Q4; stricter containment
measures prevail until end of
projection horizon
– limited rebound in economic
sentiment/confidence
– both vaccination periods are successful
– close to 50% of the population is vaccinated and protected
– the effective reproduction number remains unchanged
38 OSI is a composite measure computed from nine response indicators including school closures, workplace closures, and travel bans, rescaled to a value from 0 to 100, with 100 reflecting the strictest level of measures. In the cases when containment measures vary across the regions of a given country, than the composite index for the country is shown as the response level of the strictest region (Hale , et al., 2021). While it remains useful, OSI is subject to some caveats. For example, the composite index does not reflect the types of measures enacted, which is important from the perspective of economic activity as different containment measures may have a varying impact on activity. Overall, for more details, see
Covid-19 Government Response Tracker.
39 More information regarding the phases of containment measures is available on the website of the Government of Slovenia.
39

MACROECONOMIC PROJECTIONS FOR SLOVENIA
June 2021
each phase of measures based on available data. The
index is then calculated for the projection horizon in such
a way that the past average value of the index in a given
phase is attributed to the index taking into account the
number of new cases of infections and hospitalisations in
line with the specific epidemiological scenario and the
relevant phase in the government’s plan to lift measures.
As SEIR epidemiological models are primarily suitable for
the reliable preparation of scenarios for the next several
months (i.e. the short-term), in our case, the projected
evolution of the OSI over the remainder of the projection
horizon is determined based on other assumptions de-
pending on the scenario (Table 6 and Figure 26). Overall,
the general assumption foresees that epidemic will gradu-
ally ease over the remainder of the projection horizon.
Economic activity during the epidemic has been
strongly negatively correlated with changes in the
OSI. As such, the assessment of expected losses by eco-
nomic sector for each scenario is prepared on account of
the time variability of that relationship. Similar to Banka
Slovenije’s previous analyses, the alternative scenarios
for economic activity were constructed using the produc-
tion side of GDP.40 Underlining the increasing prevalence
of learning effects on the side of economic agents to-
wards the epidemic and the containment measures, for
the mild scenario, which entails same epidemiological
assumptions as the baseline scenario, the response of
economic sectors to the projected OSI has been adjusted
with a higher level of learning. In other words, compared
to the baseline projection, in the mild scenario, the elas-
ticity of activity across economic sectors to OSI is lower
and diminishes faster over the projection horizon, mean-
ing that the consequences of containment measures on
economic activity are less severe.
3.4 Alternative scenarios for economic
activity
This year, real GDP is expected to strengthen to be-
tween 3.1% in the severe scenario and 6.9% in the
mild scenario. Over the 2020-2023 horizon, the cumula-
tive growth for real GDP is expected to range from 3.6%
in the severe scenario to 9.9% in the mild scenario, as
observed, in Table 7. The current alternative scenarios
for economic activity are more favourable than those in
the December projections, primarily as a result of a less
severe decline in economic activity last year, prevailing
learning effects of households and firms, and somewhat
more favourable expectations regarding the evolution of
the epidemic, associated primarily with the availability of
effective vaccines. To that end and similar to the baseline
projection the presented scenarios include the effect of
economic policy measures which are expected to contin-
ue to be effective in ensuring the stability of the labour
-10123456789101112
-10123456789
101112
mild
base
line
mod
erat
e
seve
re
mild
base
line
mod
erat
e
seve
re
mild
base
line
mod
erat
e
seve
re
2021 2022 2023
other services
contact-intensive services
industry and construction
rest of economy and NDAV
real GDP
growth in %, contributions in p.p.
Figure 27: Decomposition of GDP growth over the projection horizon by scenarios
Note: Due to rounding, sums of components may differ from the aggregate values.Source: SORS, Banka Slovenije estimations and projections.
0
10
20
30
40
50
60
70
80
90
100
2020 2021 2022 2023
actual
mild scenario
moderate scenario
severe scenario
Note: The cut-off date for the preparation of scenarios is 6 May 2021.Source: Scenarios prepared with an extended epidemiological model SEIR C19SI, V2.0, based on COVID-19-sledilnik.org data by assoc. prof. dr. Janez Žibert, Faculty of Health Sciences, University of Ljubljana, COVID-19-sledilnik.org, Oxford Economics, Banka Slovenije estimations and projections.
index
Figure 26: Oxford Stringency Index across scenarios
Estimated based on detailed
epidemiological scenarios
40 The approach was used and presented in the publications Analysis of the impact of Covid-19 on the Slovenian economy, March 2020, and
Macroeconomic Projections for Slovenia, June 2020 and December 2020.
40

MACROECONOMIC PROJECTIONS FOR SLOVENIA
June 2021
market and providing support to firms that face liquidity
problems due to a drop in revenues.
The mild scenario for economic activity assumes that
firms and households will adapt more easily and rap-
idly to new conditions than in the baseline projection.
Underlining the government’s plan to lift measures to
contain the virus, certain targeted containment measures
are expected to remain in place over the remainder of the
projection horizon. A more rapid, albeit still somewhat
uneven recovery amongst sectors in the mild scenario is
supported by a significantly higher level of confidence in
the economy and a higher degree of learning of firms and
households to adapt to new conditions. Services activities
that necessitate direct contact between the service pro-
vider and customer and that were hit hardest during the
crisis (i.e. GHI and RST) would thus recover somewhat
more rapidly this year than in the baseline projection.
Nevertheless, value added in these sectors would still
stand about 6% below the pre-crisis level from 2019
(Figure 30). On the contrary, industry, construction and
other services sectors, underlining the targeted nature of
containment measures and a reviving demand, both do-
mestically and abroad, are expected to continue their
already observed recovery, and exceed pre-crisis levels
of value added already this year (Figure 29). The ex-
pected evolution across sectors would see real GDP
growing by 6.9% this year, and reaching its pre-crisis
level already in the middle of this year. Despite the preva-
lence of some containment measures, in particular pre-
ventative practices such as social distancing, over the
projection horizon, the continuing broad-based recovery
from next year onwards, would see the level of real GDP
standing 9% above what prevailed in 2019 by the end of
the projection horizon (Figure 28).
The moderate scenario assumes that the population
is slightly less responsive to vaccination in the au-
85
90
95
100
105
110
85
90
95
100
105
110
2019 2020 2021 2022 2023
mild scenario
baseline projection
moderate scenario
severe scenario
index (2019 = 100)
Figure 28: Level of GDP over the projection horizon by scenario
Source: SORS, Banka Slovenije estimations and projections.
85
90
95
100
105
110
115
85
90
95
100
105
110
115
2019 2020 2021 2022 2023
mild scenario
baseline projection
moderate scenario
severe scenario
index (2019 = 100)
Figure 29: Level of value added from industry and construction over the projection horizon by scenario
Note: This group of economic sectors includes: C – manufacturing, BDE – mining and quarrying, electricity and water supply, waste management, and F – construction.Source: SORS, Banka Slovenije estimations and projections.
Table 7: Real GDP growth across alternative scenarios
Δ: Difference between current projections and scenarios, and previous ones in Macroeconomic Projections for Slovenia, December 2020. Source: SORS, Banka Slovenije calculations and projections.
Δ June Δ June Δ June Δ June Δ
Real GDP annual growth in %
mild scenario -5.5 1.8 6.9 -0.2 5.4 0.9 3.1 0.1 9.9 2.6
baseline projection -5.5 2.1 5.2 2.1 4.8 0.3 3.1 0.0 7.7 4.5
moderate scenario -5.5 … 5.2 … 3.7 … 3.5 … 6.9 …
severe scenario -5.5 2.5 3.1 6.7 2.3 -1.3 3.7 -0.3 3.6 4.3
Cumulative20212020 2022 2023
41

MACROECONOMIC PROJECTIONS FOR SLOVENIA
June 2021
tumn months than in the baseline epidemiological
scenario. This is expected to result in a deterioration of
the epidemiological picture towards the end of this year
and primarily over the course of the first half of next year.
Such a picture would necessitate the reintroduction of
non-pharmaceutical measures to contain the spread of
infections, which would translate into a lower economic
growth next year. As these containment measures are
expected to primarily affect contact-intensive services
sectors, the lower growth in 2022 relative to the baseline
would stem primarily from a lower contribution to growth
from these sectors (Figure 27). The renewed setback to
the recovery of contact-intensive services sectors would
see them rebounding more gradually over the projection
horizon, with levels remaining about 2% below their pre-
crisis levels of value added by the end of the projection
horizon (Figure 30). As the impact to other sectors of the
economy is expected to be more or less contained on ac-
count of the targeted nature of containment measures, the
path for the level of GDP would be broadly similar to the
baseline projection, albeit about 1% lower. Consequently,
by the end of the projection horizon, real GDP would stand
about 6% above the pre-crisis level from 2019 (Figure 28).
The severe scenario assumes the outbreak of a new
strain of the virus during the second half of this year,
against which currently available vaccines would be
ineffective. This would trigger a major outbreak of new
infections as early as this autumn, which would necessitate
reinstatement of stricter containment measures of a similar
nature and degree as those observed in the last quarter of
last year. This would translate into another strong hit to
contact-intensive services sectors over the course of au-
tumn and winter this year, while the rest of the economy,
on account of more targeted containment measures, would
continue to operate. Consequently, the curtailed activity in
contact-intensive services sectors would constitute the
main drag to economic growth, with real GDP growth ex-
pected to reach about 3.1% in the current year (Figure 27).
As the pandemic developments would continue to remain
unfavourable, containment measures would have to re-
main in place until an effective medical solution becomes
available in order to ensure the stability of the healthcare
system. As a result, the drop in value added would be
more sustained in the hardest-hit contact-intensive ser-
vices sectors, while the recovery would be more modest.
The level of value added generated by contact-intensive
services activities would stand around 8% below the pre-
crisis level at the end of the projection horizon (Figure 30).
The general higher level of uncertainty related to the epi-
demic, relative to the baseline and the previous two alter-
native scenarios, would also affect the rest of the econo-
my, albeit to a smaller extent, implying a somewhat slower
recovery. As the impact of the crisis would persist for long-
er, real GDP would recover more gradually, reaching its
pre-crisis level by early-2023 (Figure 28).
References:
Hale , T., Angrist , N., Goldszmidt, R., Kira, B., Petherick , A.,
Phillips, T., Tatlow, H. (2021). A global panel database of pan-
demic policies (Oxford Covid-19 Government Response Track-
er). Nature Human Behaviour, 5, pp. 529-538.
Battistini, N., & Stoevsky, G. (2021). The impact of containment
measures across sectors and countries during the Covid-19
pandemic. ECB Economic Bulletin, Issue 2/2021.
Boone, L., & Ladreit, C. (2020). Fear of Covid and non-
pharmaceutical interventions: An analysis of their economic
impact among 29 advanced OECD countries. Covid Econom-
ics: Vetted and Real-Time Papers, Issue 73.
Brezigar Masten, A., Breznikar M., Caka P., Lindič M., Petriček
M., Ploj G., Radovan J., Sosič N. and Zorko R. (2020). As-
sessing the impact of the Covid-19 outbreak on the Slovenian
economic outlook. Banka Slovenije staff analysis.
85
90
95
100
105
110
115
85
90
95
100
105
110
115
2019 2020 2021 2022 2023
mild scenario
baseline projection
moderate scenario
severe scenario
index (2019 = 100)
Figure 30: Level of value added from contact-intensive services sectors over the projection horizon by scenario
Note: This group of economic sectors includes: GHI – trade, transportation and storage, accommodation and food service activities and RST – other service activities.Source: SORS, Banka Slovenije estimations and projections.
42
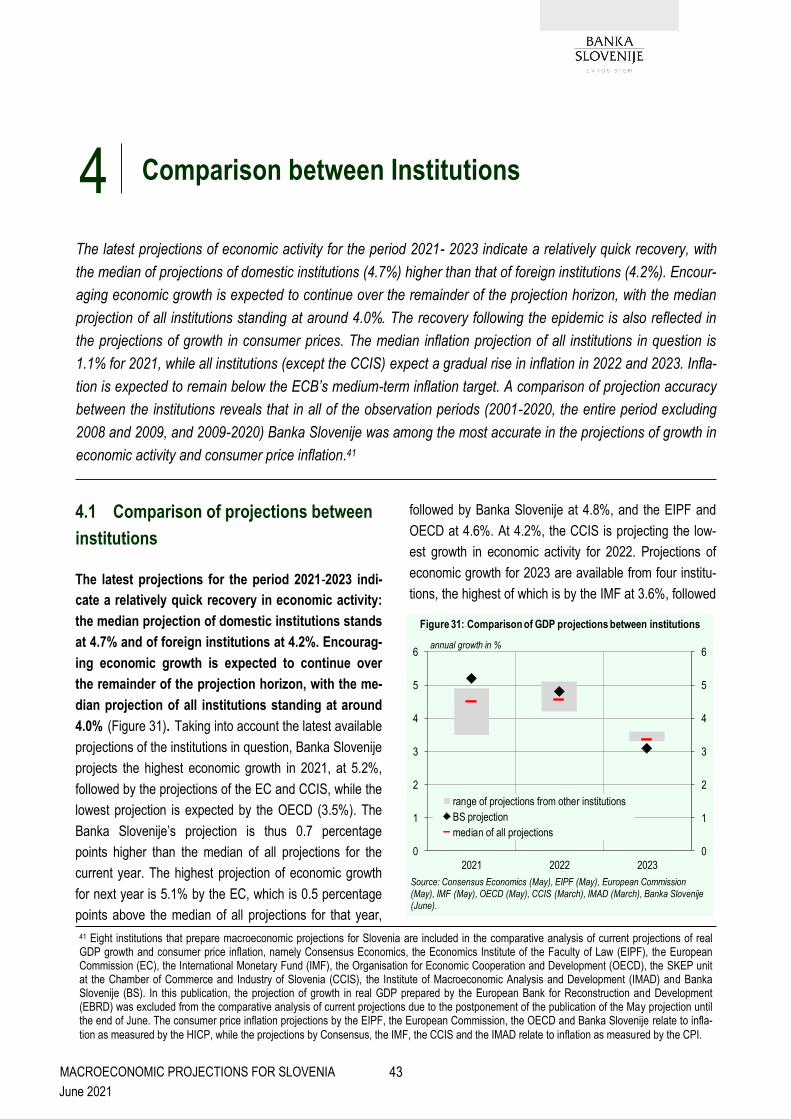
MACROECONOMIC PROJECTIONS FOR SLOVENIA
June 2021
4.1 Comparison of projections between
institutions
The latest projections for the period 2021-2023 indi-
cate a relatively quick recovery in economic activity:
the median projection of domestic institutions stands
at 4.7% and of foreign institutions at 4.2%. Encourag-
ing economic growth is expected to continue over
the remainder of the projection horizon, with the me-
dian projection of all institutions standing at around
4.0% (Figure 31). Taking into account the latest available
projections of the institutions in question, Banka Slovenije
projects the highest economic growth in 2021, at 5.2%,
followed by the projections of the EC and CCIS, while the
lowest projection is expected by the OECD (3.5%). The
Banka Slovenije’s projection is thus 0.7 percentage
points higher than the median of all projections for the
current year. The highest projection of economic growth
for next year is 5.1% by the EC, which is 0.5 percentage
points above the median of all projections for that year,
followed by Banka Slovenije at 4.8%, and the EIPF and
OECD at 4.6%. At 4.2%, the CCIS is projecting the low-
est growth in economic activity for 2022. Projections of
economic growth for 2023 are available from four institu-
tions, the highest of which is by the IMF at 3.6%, followed
4 Comparison between Institutions
The latest projections of economic activity for the period 2021- 2023 indicate a relatively quick recovery, with
the median of projections of domestic institutions (4.7%) higher than that of foreign institutions (4.2%). Encour-
aging economic growth is expected to continue over the remainder of the projection horizon, with the median
projection of all institutions standing at around 4.0%. The recovery following the epidemic is also reflected in
the projections of growth in consumer prices. The median inflation projection of all institutions in question is
1.1% for 2021, while all institutions (except the CCIS) expect a gradual rise in inflation in 2022 and 2023. Infla-
tion is expected to remain below the ECB’s medium-term inflation target. A comparison of projection accuracy
between the institutions reveals that in all of the observation periods (2001-2020, the entire period excluding
2008 and 2009, and 2009-2020) Banka Slovenije was among the most accurate in the projections of growth in
economic activity and consumer price inflation.41
0
1
2
3
4
5
6
0
1
2
3
4
5
6
2021 2022 2023
range of projections from other institutions
BS projection
median of all projections
Source: Consensus Economics (May), EIPF (May), European Commission (May), IMF (May), OECD (May), CCIS (March), IMAD (March), Banka Slovenije(June).
Figure 31: Comparison of GDP projections between institutions
annual growth in %
41 Eight institutions that prepare macroeconomic projections for Slovenia are included in the comparative analysis of current projections of real GDP growth and consumer price inflation, namely Consensus Economics, the Economics Institute of the Faculty of Law (EIPF), the European Commission (EC), the International Monetary Fund (IMF), the Organisation for Economic Cooperation and Development (OECD), the SKEP unit at the Chamber of Commerce and Industry of Slovenia (CCIS), the Institute of Macroeconomic Analysis and Development (IMAD) and Banka Slovenije (BS). In this publication, the projection of growth in real GDP prepared by the European Bank for Reconstruction and Development (EBRD) was excluded from the comparative analysis of current projections due to the postponement of the publication of the May projection until the end of June. The consumer price inflation projections by the EIPF, the European Commission, the OECD and Banka Slovenije relate to infla-
tion as measured by the HICP, while the projections by Consensus, the IMF, the CCIS and the IMAD relate to inflation as measured by the CPI.
43

MACROECONOMIC PROJECTIONS FOR SLOVENIA
June 2021
by the CCIS and IMAD at 3.4% and 3.3% respectively,
while Banka Slovenije projects the lowest GDP growth at
3.1%. The majority of institutions expect the Slovenian
economy to achieve its pre-crisis level from 2019 already
next year.
The median inflation projection of all institutions in
question is 1.1% for 2021, while all institutions
(except the CCIS) expect a gradual rise in inflation in
2022 and 2023. Inflation is expected to remain below
the ECB’s medium-term inflation target (Figure 32).
The highest growth in prices in 2021 of 1.7% is projected
by the CCIS, while the lowest growth (of 0.6%) is project-
ed by the IMF. Banka Slovenije projects 1.3% growth for
this year. The highest inflation projection for next year of
2.0% is issued by the EIPF, and is 0.3 percentage points
higher than the median of all projections, while the OECD
issues the lowest inflation projection of 1.1%. At 1.6%,
Banka Slovenije’s projection of growth in consumer prices
is 0.1 percentage points lower than the median of all pro-
jections for 2022. Inflation projections for 2023 are also
available from four institutions, and all reflect similar ex-
pectations with regard to the year-on-year price growth.
Banka Slovenije and the IMAD project inflation of 1.7%,
while the CCIS expects inflation of 1.6%. The IMF pro-
jects the lowest growth in prices at 1.5%.
4.2 Comparison of projection accuracy
between institutions42
The accuracy of the real GDP growth and consumer
price inflation projections over the 2001-2020 period
is measured by comparing the statistical estimate or
the observed value with the projections for the varia-
bles obtained in past periods.43 In order to assess the
accuracy of projections, the following indicators are calcu-
lated: the mean error (ME), the mean absolute error
(MAE), the standard deviation (STDEV), the root mean
square error (RMSE) and the standardised RMSE
(SRMSE).44 Only three of the institutions in question
(Banka Slovenije, the EC and the IMF) released projec-
tions for the entire observation period. For the majority of
other institutions, projections are only available from 2004
(from 2009 for the OECD, and from 2011 for the EBRD).
Given the great uncertainty around the outbreak of the
crisis, the entire observation period excluding 2008 and
2009, and the period of 2009-2020 have been additional-
ly included in the analysis.
In terms of the MAE and RMSE, the most accurate
economic growth projections for the 2001-2020 peri-
od were from the EC, Banka Slovenije and the IMAD,
while the most accurate inflation projections were
provided by Banka Slovenije and the IMAD. In the
projection of economic growth, MAE ranged from 0.6 to
3.3 over the entire period, while RMSE ranged from 0.7 to
4.7.45 The institutions were slightly more accurate in their
inflation projections: the aforementioned indicators had
narrower ranges, namely 0.2 to 1.5 for MAE and 0.3 to
1.9 for RMSE.
0.0
0.2
0.4
0.6
0.8
1.0
1.2
1.4
1.6
1.8
2.0
2.2
0.0
0.2
0.4
0.6
0.8
1.0
1.2
1.4
1.6
1.8
2.0
2.2
2021 2022 2023
range of projections from other institutions
BS projection
median of all projections
Source: Consensus Economics (May), EIPF (May), European Commission (May), IMF (May), OECD (May), CCIS (March), IMAD (March), Banka Slovenije (June).
Figure 32: Comparison of inflation projections between institutions
annual growth in %
42 In addition to the projections of organisations included in the comparative analysis of current projections, the projections of the EBRD are also
included in the comparative analysis of the accuracy of projections of growth in real GDP between institutions.
43 In the examination of projection accuracy between institutions in the period 2001-2020 and in the various sub-periods, the first observed values and projections of variables are compared, while the projections of other institutions selected are those that correspond most closely in terms of
time to Banka Slovenije’s projections.
44 For a detailed description of the statistical methods, see Cimperman and Savšek (2014): Accuracy of projections of macroeconomic aggregates
for Slovenia.
45 The spring and autumn projections of all the institutions for the current year and the next year are taken into account in the values given.
44

MACROECONOMIC PROJECTIONS FOR SLOVENIA
June 2021
The most accurate economic growth projections over
the entire period excluding 2008 and 2009 were those
of Banka Slovenije, followed by the EC and IMAD,
while Banka Slovenije and the IMAD stood out in
terms of inflation projections. Compared with the entire
period, the economic growth projections during the period
in question were slightly more accurate, as the exclusion
of 2008 and 2009 eliminated the impact of the increased
volatility during the previous economic crisis. In the pro-
jection of economic growth, MAE ranged from 0.6 to 2.8
over the period in question, while RMSE ranged from 0.7
to 3.7. The accuracy of the projection of inflation re-
mained relatively unchanged relative to the entire period
(2001-2020), as both indicators ranged over intervals of
0.2 to 1.4 for MAE and 0.3 to 1.8 for RMSE.
The OECD and the EC produced the most accurate
economic growth projections in the 2009-2020 period,
followed by the CCIS, Banka Slovenije and the IMAD,
while Banka Slovenije, the IMAD and the EC pro-
duced the most accurate inflation projections. The
accuracy of the projection of economic growth was better
compared to the entire observation period (2001-2020):
the intervals in MAE and RMSE narrowed to range from
0.6 to 2.7 for MAE and 0.8 to 3.6 for RMSE. It was a simi-
lar case in the assessment of inflation projection accura-
cy: the intervals in the indicators were narrower than in
the entire observation period, at 0.1 to 1.1 for MAE and
0.2 to 1.4 for RMSE.
The error in the projection of growth in real GDP wid-
ened considerably with last year, while the accuracy
of the inflation projection remained relatively un-
changed. In examining projection accuracy in all periods
in question, including last year, errors in economic growth
projections are more notable than before due to the in-
creased instability following the outbreak of the epidemic.
While the lower limit of the interval for MAE and RMSE in
the case of GDP growth was relatively unchanged, the
upper limits of the values of the aforementioned indica-
tors were higher in all examined periods, including last
year, by between 0.4 and 1.1 percentage points. On the
other hand, the accuracy of projections of consumer price
inflation was similar to the accuracy prior to the outbreak
of the epidemic, as the intervals for MAE and RMSE re-
mained practically unchanged.
45

MACROECONOMIC PROJECTIONS FOR SLOVENIA
June 2021
Table 8: Basic accuracy measures of GDP growth projections, based on first available data
Source: Banka Slovenije, Consensus Economics, EIPF, EBRD, European Commission (EC), IMF, OECD, CCIS, IMAD.
ME MAE STDEV ME MAE STDEV ME MAE STDEV ME MAE STDEV ME MAE STDEV ME MAE STDEV
current year
BS 0.0 1.2 1.8 0.4 0.9 1.1 -0.3 1.4 2.2 -3.4 3.4 3.8 0.4 0.9 1.1 0.0 1.3 1.9
Consensus 0.0 1.4 2.0 0.4 1.1 1.3 -0.2 1.6 2.3 -3.5 3.5 3.3 0.4 1.2 1.5 0.1 1.5 2.1
EBRD 0.5 1.2 1.5
EIPF -0.1 1.6 2.4 0.7 1.1 1.3 -0.4 1.8 2.7 -4.1 4.1 4.4 0.5 1.2 1.6 -0.1 1.6 2.4
EC 0.1 1.2 1.6 0.3 1.1 1.3 -0.1 1.4 1.9 -2.7 2.7 2.8 0.4 1.1 1.2 0.2 1.3 1.7
IMF 0.1 1.4 1.9 0.3 1.0 1.3 0.0 1.7 2.3 -3.0 3.0 3.4 0.5 1.3 1.4 0.3 1.5 2.0
OECD 0.2 1.2 1.5
CCIS 0.2 1.4 1.9 0.8 1.0 1.1 -0.1 1.5 2.1 -3.1 3.1 3.6 0.6 1.2 1.3 0.2 1.4 1.9
IMAD 0.0 1.3 1.6 0.2 1.0 1.2 -0.1 1.5 1.9 -2.5 2.5 2.3 0.3 1.1 1.3 0.1 1.4 1.7
next year
BS -1.1 2.5 3.8 -1.2 2.5 4.6 -1.0 2.5 3.3 -6.3 6.3 8.1 -0.5 2.0 2.8 -1.2 2.8 4.1
Consensus -1.1 2.8 4.0 -1.4 2.9 5.1 -0.9 2.6 3.4 -6.0 6.6 9.3 -0.5 2.3 3.0 -1.1 3.0 4.3
EBRD -0.3 2.7 3.8
EIPF -1.3 3.3 4.6 -1.1 4.4 7.1 -1.4 2.7 3.5 -6.5 6.5 8.6 -0.6 2.8 3.8 -1.3 3.3 4.6
EC -1.0 2.5 3.8 -1.4 2.6 4.5 -0.8 2.5 3.4 -5.6 6.3 8.9 -0.5 2.1 2.9 -1.0 2.8 4.1
IMF -1.0 2.5 3.8 -1.2 2.4 4.4 -0.8 2.5 3.4 -5.8 5.8 8.2 -0.4 2.1 2.9 -1.1 2.8 4.1
OECD -0.8 2.5 3.5
CCIS -1.0 2.8 4.1 -1.7 3.6 6.1 -0.7 2.4 3.2 -6.3 6.3 8.6 -0.2 2.3 3.0 -1.0 2.8 4.1
IMAD -1.1 2.6 3.9 -1.4 2.6 4.6 -0.9 2.7 3.5 -5.9 6.3 8.9 -0.6 2.2 3.0 -1.2 2.9 4.2
current year
BS 0.2 0.7 0.9 0.2 0.6 0.7 0.2 0.8 1.0 -1.2 1.2 0.3 0.4 0.7 0.8 0.2 0.8 1.0
Consensus 0.1 0.8 1.0 0.0 0.7 0.9 0.1 0.8 1.1 -1.6 1.6 0.5 0.3 0.7 0.9 0.2 0.8 1.0
EBRD 0.6 0.9 1.0
EIPF 0.1 0.9 1.3 0.3 0.9 1.2 0.0 1.0 1.4 -2.1 2.1 0.8 0.4 0.8 1.1 0.1 0.9 1.3
EK 0.2 0.6 0.7 0.2 0.6 0.7 0.2 0.6 0.8 -0.8 0.8 0.1 0.3 0.6 0.7 0.2 0.6 0.8
IMF 0.1 0.9 1.3 0.2 0.8 1.0 0.0 1.0 1.4 -2.1 2.1 1.8 0.3 0.8 1.0 0.2 1.0 1.3
OECD 0.3 0.6 0.8
CCIS 0.2 0.7 0.8 0.0 0.8 1.0 0.3 0.7 0.8 -1.3 1.3 0.2 0.4 0.7 0.7 0.2 0.7 0.9
IMAD 0.1 0.6 0.8 0.0 0.6 0.8 0.1 0.7 0.8 -1.1 1.1 0.4 0.2 0.6 0.7 0.1 0.7 0.8
next year
BS -0.8 2.3 3.7 -1.0 2.5 4.5 -0.7 2.2 3.2 -5.9 5.9 8.1 -0.2 1.9 2.7 -1.0 2.6 4.0
Consensus -0.9 2.4 3.7 -1.3 2.6 4.4 -0.6 2.3 3.2 -5.5 6.2 8.7 -0.4 2.0 2.8 -0.9 2.7 4.0
EBRD 0.1 2.7 3.8
EIPF -1.2 2.8 4.1 -2.0 3.5 5.9 -0.9 2.4 3.3 -5.9 6.3 8.8 -0.6 2.3 3.1 -1.2 2.8 4.1
EC -0.7 2.2 3.6 -1.0 2.4 4.3 -0.5 2.1 3.2 -5.5 5.6 7.8 -0.1 1.9 2.7 -0.8 2.5 3.9
IMF -0.7 2.6 3.9 -1.0 2.5 4.5 -0.4 2.7 3.6 -5.5 6.3 8.9 -0.1 2.1 3.0 -0.8 2.9 4.3
OECD -0.6 2.3 3.3
CCIS -0.7 2.5 3.9 -1.3 3.0 5.2 -0.3 2.3 3.3 -5.5 6.2 8.7 0.0 2.0 2.9 -0.8 2.6 4.0
IMAD -0.9 2.3 3.7 -1.1 2.4 4.3 -0.8 2.3 3.3 -5.4 5.9 8.3 -0.4 1.9 2.8 -1.0 2.6 4.0
autumn projections
Real GDP2001-2020 2001-2008 2009-2020 2008 in 2009 Brez 2008-2009 2004-2020
spring projections
46

MACROECONOMIC PROJECTIONS FOR SLOVENIA
June 2021
Table 9: RMSE and SRMSE of GDP growth projections, based on first available data
Source: Banka Slovenije, Consensus Economics, EIPF, EBRD, European Commission (EC), IMF, OECD, CCIS, IMAD.
2001-2020 2001-2008 2009-2020 2008-2009 brez 08-09 2004-2020 2001-2020 2001-2008 2009-2020 2008-2009 brez 08-09 2004-2020
current year
BS 1.8 1.1 2.1 4.3 1.1 1.9 0.5 0.7 0.5 0.5 0.4 0.5
Consensus 1.9 1.3 2.2 4.2 1.5 2.0 0.5 0.9 0.6 0.5 0.5 0.5
EBRD 1.5 0.4
EIPF 2.3 1.3 2.7 5.1 1.7 2.3 0.6 0.9 0.7 0.6 0.6 0.6
EC 1.6 1.3 1.8 3.4 1.3 1.7 0.4 0.8 0.4 0.4 0.4 0.4
IMF 1.9 1.2 2.2 3.8 1.5 2.0 0.5 0.8 0.5 0.5 0.5 0.5
OECD 1.5 0.4
CCIS 1.9 1.3 2.1 4.0 1.4 1.9 0.5 0.9 0.5 0.5 0.5 0.5
IMAD 1.6 1.1 1.8 3.0 1.3 1.7 0.4 0.8 0.5 0.4 0.4 0.4
next year
BS 3.8 4.4 3.3 8.5 2.8 4.1 1.0 3.0 0.8 1.0 0.9 1.0
Consensus 4.1 5.0 3.4 8.8 3.0 4.3 1.1 3.3 0.8 1.1 1.0 1.1
EBRD 3.6 0.9
EIPF 4.7 6.4 3.6 8.8 3.7 4.7 1.3 4.3 0.9 1.1 1.2 1.2
EC 3.8 4.4 3.3 8.4 2.8 4.1 1.0 3.0 0.8 1.0 0.9 1.0
IMF 3.8 4.3 3.4 8.2 2.8 4.1 1.0 2.9 0.8 1.0 0.9 1.0
OECD 3.4 0.8
CCIS 4.1 5.7 3.2 8.7 2.9 4.1 1.1 3.8 0.8 1.1 1.0 1.0
IMAD 4.0 4.5 3.5 8.6 2.9 4.3 1.1 3.1 0.9 1.1 1.0 1.1
current year
BS 0.9 0.7 1.0 1.2 0.9 1.0 0.2 0.5 0.3 0.1 0.3 0.2
Consensus 1.0 0.8 1.0 1.6 0.9 1.0 0.3 0.6 0.3 0.2 0.3 0.3
EBRD 1.1 0.3
EIPF 1.3 1.1 1.4 2.2 1.1 1.3 0.4 0.7 0.3 0.3 0.4 0.3
EC 0.7 0.6 0.8 0.8 0.7 0.8 0.2 0.4 0.2 0.1 0.2 0.2
IMF 1.2 1.0 1.4 2.5 1.0 1.3 0.3 0.7 0.3 0.3 0.3 0.3
OECD 0.8 0.2
CCIS 0.8 0.9 0.8 1.3 0.8 0.9 0.2 0.6 0.2 0.2 0.3 0.2
IMAD 0.8 0.7 0.8 1.1 0.7 0.8 0.2 0.5 0.2 0.1 0.2 0.2
next year
BS 3.7 4.3 3.1 8.2 2.7 4.0 1.0 2.9 0.8 1.0 0.9 1.0
Consensus 3.7 4.3 3.1 8.2 2.7 4.0 1.0 2.9 0.8 1.0 0.9 1.0
EBRD 3.6 0.9
EIPF 4.2 5.6 3.3 8.6 3.1 4.2 1.1 3.8 0.8 1.0 1.0 1.0
EC 3.5 4.1 3.1 7.8 2.6 3.8 1.0 2.8 0.8 0.9 0.9 1.0
IMF 3.9 4.4 3.4 8.4 2.9 4.2 1.0 2.9 0.9 1.0 1.0 1.1
OECD 3.2 0.8
CCIS 3.9 4.9 3.2 8.2 2.8 4.0 1.1 3.3 0.8 1.0 0.9 1.0
IMAD 3.7 4.2 3.3 7.9 2.8 4.0 1.0 2.8 0.8 1.0 0.9 1.0
RMSE SRMSE
autumn projections
Real GDP
spring projections
47
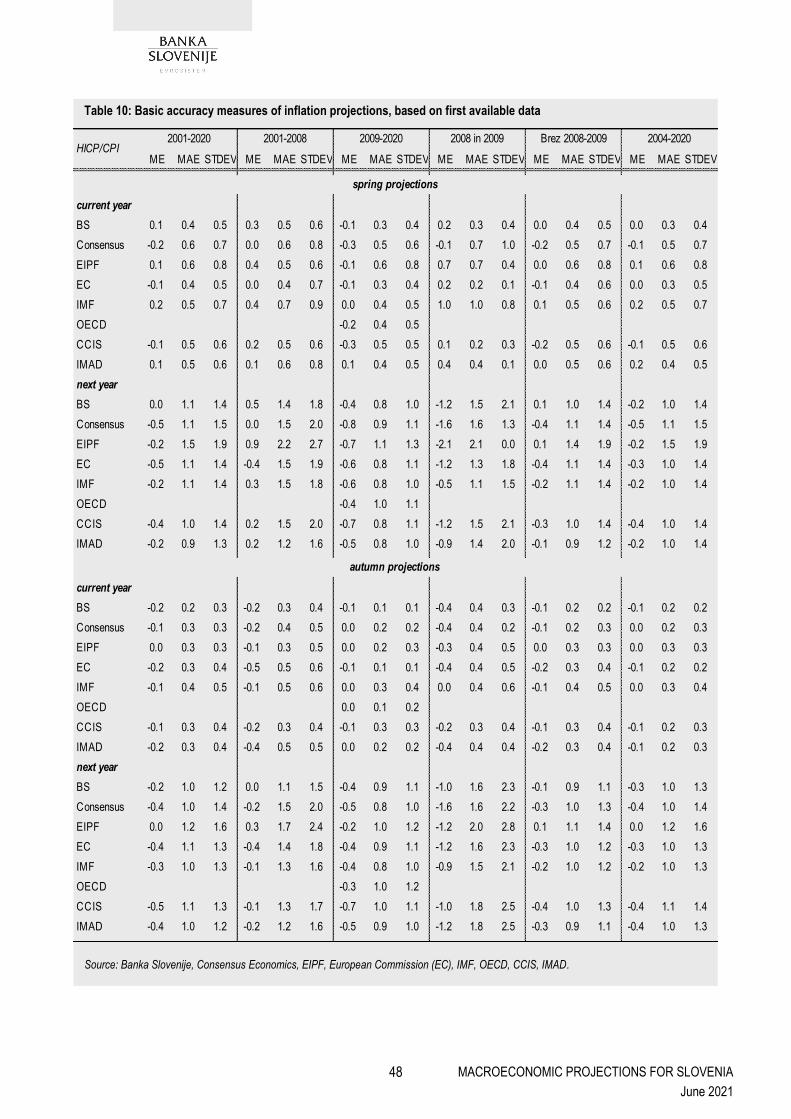
MACROECONOMIC PROJECTIONS FOR SLOVENIA
June 2021
Table 10: Basic accuracy measures of inflation projections, based on first available data
Source: Banka Slovenije, Consensus Economics, EIPF, European Commission (EC), IMF, OECD, CCIS, IMAD.
ME MAE STDEV ME MAE STDEV ME MAE STDEV ME MAE STDEV ME MAE STDEV ME MAE STDEV
current year
BS 0.1 0.4 0.5 0.3 0.5 0.6 -0.1 0.3 0.4 0.2 0.3 0.4 0.0 0.4 0.5 0.0 0.3 0.4
Consensus -0.2 0.6 0.7 0.0 0.6 0.8 -0.3 0.5 0.6 -0.1 0.7 1.0 -0.2 0.5 0.7 -0.1 0.5 0.7
EIPF 0.1 0.6 0.8 0.4 0.5 0.6 -0.1 0.6 0.8 0.7 0.7 0.4 0.0 0.6 0.8 0.1 0.6 0.8
EC -0.1 0.4 0.5 0.0 0.4 0.7 -0.1 0.3 0.4 0.2 0.2 0.1 -0.1 0.4 0.6 0.0 0.3 0.5
IMF 0.2 0.5 0.7 0.4 0.7 0.9 0.0 0.4 0.5 1.0 1.0 0.8 0.1 0.5 0.6 0.2 0.5 0.7
OECD -0.2 0.4 0.5
CCIS -0.1 0.5 0.6 0.2 0.5 0.6 -0.3 0.5 0.5 0.1 0.2 0.3 -0.2 0.5 0.6 -0.1 0.5 0.6
IMAD 0.1 0.5 0.6 0.1 0.6 0.8 0.1 0.4 0.5 0.4 0.4 0.1 0.0 0.5 0.6 0.2 0.4 0.5
next year
BS 0.0 1.1 1.4 0.5 1.4 1.8 -0.4 0.8 1.0 -1.2 1.5 2.1 0.1 1.0 1.4 -0.2 1.0 1.4
Consensus -0.5 1.1 1.5 0.0 1.5 2.0 -0.8 0.9 1.1 -1.6 1.6 1.3 -0.4 1.1 1.4 -0.5 1.1 1.5
EIPF -0.2 1.5 1.9 0.9 2.2 2.7 -0.7 1.1 1.3 -2.1 2.1 0.0 0.1 1.4 1.9 -0.2 1.5 1.9
EC -0.5 1.1 1.4 -0.4 1.5 1.9 -0.6 0.8 1.1 -1.2 1.3 1.8 -0.4 1.1 1.4 -0.3 1.0 1.4
IMF -0.2 1.1 1.4 0.3 1.5 1.8 -0.6 0.8 1.0 -0.5 1.1 1.5 -0.2 1.1 1.4 -0.2 1.0 1.4
OECD -0.4 1.0 1.1
CCIS -0.4 1.0 1.4 0.2 1.5 2.0 -0.7 0.8 1.1 -1.2 1.5 2.1 -0.3 1.0 1.4 -0.4 1.0 1.4
IMAD -0.2 0.9 1.3 0.2 1.2 1.6 -0.5 0.8 1.0 -0.9 1.4 2.0 -0.1 0.9 1.2 -0.2 1.0 1.4
current year
BS -0.2 0.2 0.3 -0.2 0.3 0.4 -0.1 0.1 0.1 -0.4 0.4 0.3 -0.1 0.2 0.2 -0.1 0.2 0.2
Consensus -0.1 0.3 0.3 -0.2 0.4 0.5 0.0 0.2 0.2 -0.4 0.4 0.2 -0.1 0.2 0.3 0.0 0.2 0.3
EIPF 0.0 0.3 0.3 -0.1 0.3 0.5 0.0 0.2 0.3 -0.3 0.4 0.5 0.0 0.3 0.3 0.0 0.3 0.3
EC -0.2 0.3 0.4 -0.5 0.5 0.6 -0.1 0.1 0.1 -0.4 0.4 0.5 -0.2 0.3 0.4 -0.1 0.2 0.2
IMF -0.1 0.4 0.5 -0.1 0.5 0.6 0.0 0.3 0.4 0.0 0.4 0.6 -0.1 0.4 0.5 0.0 0.3 0.4
OECD 0.0 0.1 0.2
CCIS -0.1 0.3 0.4 -0.2 0.3 0.4 -0.1 0.3 0.3 -0.2 0.3 0.4 -0.1 0.3 0.4 -0.1 0.2 0.3
IMAD -0.2 0.3 0.4 -0.4 0.5 0.5 0.0 0.2 0.2 -0.4 0.4 0.4 -0.2 0.3 0.4 -0.1 0.2 0.3
next year
BS -0.2 1.0 1.2 0.0 1.1 1.5 -0.4 0.9 1.1 -1.0 1.6 2.3 -0.1 0.9 1.1 -0.3 1.0 1.3
Consensus -0.4 1.0 1.4 -0.2 1.5 2.0 -0.5 0.8 1.0 -1.6 1.6 2.2 -0.3 1.0 1.3 -0.4 1.0 1.4
EIPF 0.0 1.2 1.6 0.3 1.7 2.4 -0.2 1.0 1.2 -1.2 2.0 2.8 0.1 1.1 1.4 0.0 1.2 1.6
EC -0.4 1.1 1.3 -0.4 1.4 1.8 -0.4 0.9 1.1 -1.2 1.6 2.3 -0.3 1.0 1.2 -0.3 1.0 1.3
IMF -0.3 1.0 1.3 -0.1 1.3 1.6 -0.4 0.8 1.0 -0.9 1.5 2.1 -0.2 1.0 1.2 -0.2 1.0 1.3
OECD -0.3 1.0 1.2
CCIS -0.5 1.1 1.3 -0.1 1.3 1.7 -0.7 1.0 1.1 -1.0 1.8 2.5 -0.4 1.0 1.3 -0.4 1.1 1.4
IMAD -0.4 1.0 1.2 -0.2 1.2 1.6 -0.5 0.9 1.0 -1.2 1.8 2.5 -0.3 0.9 1.1 -0.4 1.0 1.3
autumn projections
HICP/CPI2001-2020 2001-2008 2009-2020 2008 in 2009 Brez 2008-2009 2004-2020
spring projections
48

MACROECONOMIC PROJECTIONS FOR SLOVENIA
June 2021
Table 11: RMSE and SRMSE of inflation projections, based on first available data
Source: Banka Slovenije, Consensus Economics, EIPF, European Commission (EC), IMF, OECD, CCIS, IMAD.
2001-2020 2001-2008 2009-2020 2008-2009 brez 08-09 2004-2020 2001-2020 2001-2008 2009-2020 2008-2009 brez 08-09 2004-2020
current year
BS 0.5 0.6 0.4 0.4 0.5 0.4 0.2 0.3 0.3 0.1 0.2 0.3
Consensus 0.7 0.7 0.7 0.7 0.7 0.7 0.3 0.4 0.6 0.2 0.3 0.4
EIPF 0.8 0.7 0.8 0.8 0.8 0.8 0.3 0.4 0.7 0.2 0.3 0.5
EC 0.5 0.6 0.4 0.2 0.5 0.5 0.2 0.3 0.4 0.0 0.2 0.3
IMF 0.7 1.0 0.4 1.1 0.6 0.7 0.3 0.5 0.4 0.3 0.3 0.4
OECD 0.5 0.5
CCIS 0.6 0.6 0.6 0.2 0.6 0.6 0.3 0.3 0.5 0.1 0.3 0.4
IMAD 0.6 0.7 0.5 0.4 0.6 0.6 0.3 0.4 0.4 0.1 0.3 0.3
next year
BS 1.4 1.8 1.1 1.9 1.3 1.4 0.6 0.9 0.9 0.6 0.6 0.9
Consensus 1.5 1.8 1.3 1.8 1.4 1.5 0.7 1.0 1.1 0.6 0.6 1.0
EIPF 1.9 2.6 1.4 2.1 1.8 1.9 0.8 1.4 1.2 0.6 0.8 1.2
EC 1.4 1.8 1.2 1.7 1.4 1.4 0.6 0.9 1.0 0.5 0.6 0.9
IMF 1.4 1.7 1.1 1.1 1.4 1.3 0.6 0.9 1.0 0.4 0.6 0.8
OECD 1.2 1.0
CCIS 1.4 1.8 1.2 1.9 1.4 1.4 0.6 1.0 1.1 0.6 0.6 0.9
IMAD 1.3 1.5 1.0 1.7 1.2 1.3 0.6 0.8 0.9 0.5 0.5 0.9
current year
BS 0.3 0.4 0.2 0.4 0.3 0.2 0.1 0.2 0.1 0.1 0.1 0.1
Consensus 0.3 0.5 0.2 0.4 0.3 0.3 0.1 0.3 0.2 0.1 0.1 0.2
EIPF 0.3 0.4 0.3 0.4 0.3 0.3 0.2 0.2 0.3 0.1 0.1 0.2
EC 0.4 0.7 0.2 0.5 0.4 0.3 0.2 0.4 0.1 0.2 0.2 0.2
IMF 0.5 0.6 0.4 0.4 0.5 0.4 0.2 0.3 0.4 0.1 0.2 0.2
OECD 0.2 0.2
CCIS 0.4 0.4 0.3 0.3 0.4 0.3 0.2 0.2 0.3 0.1 0.2 0.2
IMAD 0.4 0.6 0.2 0.5 0.4 0.3 0.2 0.3 0.2 0.2 0.2 0.2
next year
BS 1.2 1.4 1.1 1.9 1.1 1.3 0.5 0.7 1.0 0.6 0.5 0.8
Consensus 1.4 1.8 1.1 2.2 1.3 1.4 0.6 1.0 0.9 0.7 0.6 0.9
EIPF 1.5 2.1 1.2 2.3 1.4 1.5 0.7 1.1 1.0 0.7 0.6 1.0
EC 1.3 1.7 1.1 2.0 1.2 1.3 0.6 0.9 1.0 0.6 0.6 0.8
IMF 1.3 1.5 1.1 1.7 1.2 1.3 0.6 0.8 0.9 0.5 0.5 0.8
OECD 1.2 1.0
CCIS 1.4 1.6 1.3 2.0 1.3 1.4 0.6 0.8 1.1 0.6 0.6 0.9
IMAD 1.3 1.5 1.1 2.2 1.1 1.3 0.6 0.8 0.9 0.7 0.5 0.8
RMSE SRMSE
autumn projections
HICP/CPI
spring projections
49