Embed Size (px)
Citation preview
Macroeconomic policy in the EMU: Can inflation be expansionary? The case
of Spain
Authors:
Jesús Ferreiro (Universidad del País Vasco)
Carmen Gómez (Universidad del País Vasco)
Felipe Serrano (Universidad del País Vasco)
Contact Information:
Jesus Ferreiro Departamento Economía Aplicada V Facultad Ciencias Económicas y Empresariales Universidad del País Vasco Avenida Lehendakari Agirre, 83 48015 Bilbao España – Spain
Email: [email protected] Telephone: +34-946013881 Fax: +34-946017087
1. Introduction
During the last decade, the Spanish economy has enjoyed an unparalleled period of sustained
growth since mid-seventies. In the European Union (EU-15) only Finland, Ireland and
Luxembourg (and Greece since 2001) have registered higher real GDP growth rates. As a direct
result of this boom, there has been a pace of strong employment growth, leading unemployment
rates to levels that are one third of those registered in early nineties. Actually, the Spanish rate of
unemployment, that during the decades of the eighties and the nineties was the highest one
among those of developed countries, is quite similar to that of the EU-15.
There is no doubt about the significance of this long phase of economic growth. Thus, the
Spanish GDP per capita in PPS has risen from 79.4% of that of EU-15 in 1996 to 91% in 2005;
the employment in this period has increased in 6 million jobs (+46.5%), leading to a fall of the
rates of unemployment from 22.4% to 9.1% in the first quarter 2006. Actually, since 1994, 27%
1

of new employment in the EU-15 has been created in Spain and the difference between the rate
of unemployment in the EU-15 and Spain has fallen from 9.4 percentage points in 1994 to only
1.4 percentage points in 2005.
The incorporation of Spain to the euro cast some shadows about the capacity of the Spanish
economy to generate a process of sustained high growth that could solve the structural problems
of the huge figures of unemployment and the gap in terms of the GDP per capita with the rest of
partners of the European Monetary Union. It was thought that the entry to the EMU would have
a significant impact in the short-run on the inflation rates. The single monetary policy and the
structural reforms that should be implemented in the labour market and in certain markets of
goods and services would help to slow down the rates of inflation and to reduce the differential
of inflation with the other members of the EMU. In this sense, the foreign constraint arisen from
the foreign deficit that would come from the higher inflation rates would operate as a powerful
stimulus for economic agents to change their decision-making processes when setting the growth
of prices and wages.
The process of slowing down the inflationary process could have a significant impact on the
economic activity, at least in the short-run until the combination of a lower inflation rates and the
consequences of the structural reforms in the goods and services markets and the factors market
had developed all their positive consequences on the supply-side and the long-term rate of
growth. However, the final outcome has not been the expected one. As we mentioned above,
since mid-nineties Spain is enjoying the most stable and sustained phase of economic growth in
the last thirty years but the inflationary process has not been cut, an, actually, the current rates of
inflation are close to those registered before the entry to the euro.
Our explanation to that unexpected situation is that, though it can seem paradoxical, the euro has
involved for Spain the implementation of a expansionary macroeconomic policy, mainly in the
case of monetary policy. Actually, as we will see, the current configuration of the Spanish
economic policy is quite close to the traditional recommendations of Keynesian economics:
- an expansionary monetary policy that reduces real interest rates to stimulate private
investment and consumption,
- a neutral fiscal policy to offset, mainly through the working of built-in stabilizers, the
effects of monetary policy and to restrain the aggregate demand,
2
- a voluntary incomes-wage policy to cut inflationary pressures and to accelerate the
employment creation.
How can we talk of a Keynesian-expansionary economic policy when the current configuration
of the economic policy in the EMU (as defined by the sum of a monetary policy only focused on
price stability ruled by an independent European Central Bank and a tight fiscal policy ruled by
the Stability and Growth Pact only worried by reducing fiscal deficits and generating fiscal
surpluses) is blamed to be restrictive if not deflationary? In our opinion, the answer must be
found, though paradoxically, in the high inflation rates registered in the Spanish economy.
In a provocative way, we could say that inflation is working, in some way, as the engine of the
economic growth in Spain. Put in another words, the current economic situation in Spain can be
described in terms of a classic Philips curve, where the high rates of inflation come with high
levels of economic activity, strong creation of employment and declining rates of
unemployment. But, what makes different the current Spanish economic situation from the
traditional Philips curve are two elements. The first one is the relation of causality, that would be
operating in both ways: the high economic growth is leading to high inflation rates but the high
inflation rates is also leading to high rates of economic growth. A symptom of the first
interpretation is the higher Spanish economic growth compared to that of the rest of EMU
members. The rising aggregate demand would be pushing the aggregate supply, that, besides
being relative stable in the short-run, suffers from certain structural weakness that makes that the
demand-push leads to both higher prices and a external deficit. In this sense, the inflationary
pressures would be the main constraint to the economic growth, and, therefore, the main
economic disequilibria of the Spanish economy (Bank of Spain, 2006; Directorate-General for
Economic and Financial Affairs, 2005; International Monetary Fund, 2006a; OECD, 2005).
But, as mentioned, the higher inflation rates would be favouring the economic growth through
several transmission channels:
- The high inflation rates are reducing the real interest rates, even making them negative,
thus fuelling the expenditures in consumption and investment due to a growth in the
borrowing.
- The high inflation rates are not leading to a tighter monetary policy, since the stance of
the monetary policy in the EMU is not determined by the situation of a single economy
3

but of the whole area, whose rate of inflation is quite below to that of Spain and closer to
the target of the ECB.
- The inflation rates are leading to high gross operating surpluses, mainly in closed sectors,
which in turn are fuelling investment, and even consumption via dividends and the
wealth effect generated by the rise of stock prices.
- Due to the current wage moderation registered by a non-formal wage policy since 1997,
the inflation is reducing the real wages. The negative growth of real wages is specially
important for those sectors open to foreign competition, that is manufacturing sector,
whose price increases can not be significantly different from those registered in the world
markets and that suffer from the pressure of the higher costs of domestic goods and
inputs (mainly from those of the services sector closed to foreign competition).
The second difference is the fact that the inflation problem is not generated in the labour market
through the pressures exerted by the intense process of employment creation on the wage setting
process. Actually, the current phase of economic growth is not coming with rising real wages but
with a fall in real wages. It is the rise of corporate profits and the behaviour of the mark-ups the
main determinants of the current high inflation rates.
The paper structures as follows. First, we will show the main features of the model of economic
growth and economic policy registered in Spain since the beginning of the democracy until mid-
nineties. This is a relevant element to understand the different roots of the current economic
expansion. As we will see below, during the decade of the eighties and the first half of the
nineties, the Spanish economic authorities implemented an orthodox strategy of economic
policy, whose main pillars was a tight monetary policy focused on the inflation and a systematic
policy of flexibilizing the labour market through the extended use of fixed-term employment
contracts. Second, we will focus on the basis of the economic situation and the economic policy
since the incorporation of Spain to the EMU. Next, we will pay special attention to the role
played by inflation in the current phase of economic growth. Last section summarizes and
concludes.
2. The economic policy in Spain before the EMU1
1 This section is based on Ferreiro and Serrano (2001a, 2001b and 2004)
4

Since the beginning of the democracy in Spain in 1977 and until the Spanish incorporation to the
EMU, the economic policy has an orthodox stance. This stance is clearly reflected in the vector
of instruments and objectives that defined the macroeconomic policy, though several phases can
be distinguished along the period.
Since the late seventies, the economic policy was focused on the control of the inflationary
process. In late seventies, the economy suffered a serious problem of inflation, with rates having
peaked 24.5% in 1977 and reaching 15.7% in 1979. Though, inflation was a generalized process
in most developed economies, in Spain it was fuelled by a set of particular determinants: first, a
loose monetary policy implemented by the last governments of the dictatorship, that tried to
offset the negative impact on Spain, an economy strongly dependent of foreign sources of energy
and with a productive structure where the industry most intensive in the consumption of energy
dominated in the manufacturing sector, of the increase of oil prices; and, second, a wage-push
allowed by the late francoist governments that tried to offset the wage moderation registered in
the early seventies at the time that was politically instrumented as a legitimation tool by a
political system in decomposition that tried to silence the generalized dissatisfaction generated
by political and economic elements.
Until mid-eighties, the incomes policy, that is, wage policy, was the main instrument of the
counter-inflationary policy (Ferreiro, 2003; Ferreiro and Serrano, 2004). The implementation of
the incomes policy was justified by both political and economic reasons. Incomes policy was an
(essential) part of a wider social concertation policy, whose ultimate objective was to help to
consolidate the incipient democratic process by generating a climate of (relative) social peace.
But, incomes policy had an economic foundation, since voluntary wage moderation had as a
direct objective the slow-down of the growth of labour costs. The fall of real unit labour costs
was considered as a prerequisite to, first, moderate the inflation rates, and, second, to increase
the corporate profits and, subsequently, to stimulate private investments and to re-organize the
low competitive productive sector.
Moreover, we can not forget that incomes policy worked as a substitute of the traditional
macroeconomic policies, like the monetary and fiscal policies. In the case of the monetary
5
policy, it could not play a significant role until late-eighties2, and, besides, wage moderation
avoided the implementation of a tighter monetary policy that, through the increase in real interest
rates, could have damaged even deeper the private investment. In the case of the fiscal policy, it
faced serious problems for an effective implementation, due, first, to the (relative) small size of
the public sector and, second, to the need of increasing the social expenditures, among other
reasons, to facilitate the implementation of the incomes policy (Ferreiro and Gomez,
forthcoming).
This strategy changes with the first Socialist government. A set of elements help to explain the
break of the model of economic policy implemented during the first years of democracy. Though
paradoxical, one of these elements is the consolidation of the democracy. The election of a
government with a majority of seats at the Parliament and the view of the democracy as a fully
consolidated process3 allowed to the political authorities to implement unpopular measures than
the previous (minority) administrations did not want or dare to do it, like the tax reforms or an
intense manufacturing reconversion process with deep impacts in certain industries and regions.
This new political scene helps also to understand the rising distance between the Socialist
administrations and the trade union movement, mainly with the socialist trade union Union
General de Trabajadores (UGT). This distance led to a nation-wide strike against the Socialist
government in 1988. This situation explains the rejection of the Socialist government to the
implementation of an incomes policy agreed with the unions, whose permanence and
effectiveness depended on the existence of a political and economic exchange with the involved
unions, mainly UGT.
But, behind the change of strategy there also exits a set of economic elements4. The first one was
the problems to slow down the inflation rates and to keep the process of wage moderation. In this
sense, there was the new view according to which the inflationary process was due to an
2 Until 1985, the monetary policy only focused only on the sterilisation of the monetary effects of the public deficit (Marín and Peñalosa, 1997). The funding of the budget deficit via legal investment ratios, joined to the high bank reserves ratios, obstructed the Banco de España to adopt monetary measures via short-term interventions like, for instance, interbank loans or open market interventions using public debt issues in the hands of commercial banks. We must keep in mind that in 1985 nearly 50% of total assets in the banking system were affected in view of the different legal ratios (Marin and Peñalosa, 1997) 3 There is a consensus about the view that the process of transition to the democracy ends with the election of the Socialist government in October 1982 and that the democracy is fully consolidated with the entry to the EEC in 1986. 4 We can not forget the example of the negative consequences of the expansionary policy implemented by the French Socialist governments in 1981-82.
6
excessive wage growth fuelled by an ineffective institutional model of the labour market
(inefficient structure of the collective bargaining, wage bargaining based on an imitation effect,
excessive wage rigidity and excessive rigidity in the labour hiring).
Moreover, it is in the mid eighties when the problem of unemployment is more severe. The
destruction of jobs generated by the economic crises of late seventies and early nineties and by
the intense manufacturing reconversion process implemented since 1983 is joined to a mass
incorporation of new population (youngster but, mainly, women) to the labour market and to a
significant return of emigrants from Western Europe. Though since 1985 employment is rising,
this creation of employment is not enough to offset the employment destroyed in the past (from
1977q1 to 1984q4, more than 1,260,000 salaried jobs were lost) and to employ the new active
population. The outcome was a huge increase in the figures of unemployed and in the rates of
unemployment: from 1977 to 1985 the figure of unemployment rose from 690,000 to 3 million
people, and the rate of unemployment rose from 5.2% to 21.5%.
With the objective of curbing the inflationary process, the monetary policy will get a tight stance.
Once solved the constraints to the discretionary management of the monetary policy, monetary
policy will get a key status in the strategy of monetary policy, with the result of the increase in
real interest rates. In this sense, the previous practices of monetary and privileged funding of the
public deficit was considered as incompatible with the new strategy of monetary policy, and an
orthodox funding of public deficits was implemented. The outcome was the increase in the debt
burden and the rise in the size of public deficits, what made necessary the implementation of
measures to reduce fiscal imbalances by cutting public expenditures.
Furthermore, the problem of mass unemployment began to be explained by the presumed
existence of rigidities in the labour market, mainly in the fields of hiring and firing. This view
put the emphasis in the need of flexibilizing the labour market, acting on the ways of hiring-
firing. Thus, in 1984 the first labour market was passed allowing the hiring of workers with
fixed-term employment contract regardless the permanent of temporary nature of their jobs. The
kind of flexibilization adopted was an external-numerical flexibilization in the margin, because it
only affected to those workers with temporary employment contracts, leaving unaffected those
incumbent permanent workers and leaving unaffected the constraints that prevented a more
intense internal-functional flexibilization. Thus, from 1987q2 to 1990q4 permanent salaried
7

employment fell in 247,000 workers but temporary salaried employment rose in 1,796,000
workers, and the share of temporary salaried workers rose from 15.3% to 31.3%
Therefore, since mid-eighties a new strategy of economic policy was implemented, whose main
features were a tight monetary policy, a fiscal policy focused on the control and reduction of
public deficits and the flexibilization of the labour markets through a set of measures and
reforms that affected to the firing costs, the unrestricted use of fixed-term employment contracts
and the cuts in the unemployment protection scheme approved in 1991-92.
In this strategy, the entry of Spain in the European Monetary System in 1989 made even more
intense the tight stance of the monetary policy. Though the inflation rate was only 4.8% in 1988,
it reached 6.8% in 1989. The entry of the peseta in the EMS involved that the exchange rate
became the main instrument of the counter-inflationary policy. Joined to the gains in terms of
credibility from a policy of currency stability, the Bank of Spain opted by keeping a overvalued
exchange rate, what was reached thanks to the high nominal and real interest rates5. The currency
stability joined to the high real interest rates led to a huge capital inflow that increased
substantially the loanable funds supply. The higher capital supply, joined to the economic
acceleration of the late eighties and the positive expectations led, despite the high interest rates,
to an increase of private investments. Thus, gross fixed capital formation rose from 17.7% GDP
in 1984 to 25.4% GDP in 1990.
Despite the good macroeconomic outcomes (the GDP grew form 1985 to 1990 at an average rate
of 4.5%, employment grew in 1,950,000 people and the rate of unemployment fell from 21.5%
to 16.2%), however, the bases of the model of growth were quite weak. The model was clearly
unsustainable. Firstly, the growth was based on an investment based on the high margins of
profits (thanks to the low wage costs) and on a certain investment bubble, and on a consumption
fuelled by the higher levels of employment, but where all the employment created was
temporary, and, consequently, highly pro-cyclical, as the early nineties crisis shown. Moreover,
the growth came with an acceleration of inflation (reaching 6.8% in 1989 and 6.7% in 1990) and
with a competitiveness problem generated by the inflation gap and the overvalued exchange rate
of the peseta (the current account moved from a surplus of 4.9%GDP in 1984 to a deficit of 6.9%
in 1992).
5 This strategy generated a vicious circle: high interest rates leading to huge capital inflows leading to higher interest rates to sterilize the monetary-inflationary impact of these inflows.
8

The crisis of the years 1991-93 showed the weaknesses of the model of growth and the failure of
the orthodox strategy implemented of economic policy. The most dramatic outcome was the
huge destruction of jobs: from 1991q3 to 1994q1 885,000 salaried jobs were destroyed, the
71.5% of them being permanent jobs. The share of temporary employment kept rising, reaching
35.2% in 1995q3.
The crisis of the EMS, allowed the monetary policy to adopt a looser stance, leading to a
significant fall of interest rates: thus, for instance, the average real interest rate of mortgages fell
from 11.6% in April 1993 to only 5.8% in March 1995. Fiscal policy also adopted a looser
stance: public deficit rose from 4.2% GDP in 1990 to 6.6% in 1995, due exclusively to an
increase in the public expenditures, that rose form 42.6% GDP to 45%GDP.
Despite the loose stance of monetary and fiscal policy, the Spanish economy remained nearly
stagnated: GDP grew at rates of 2.7% in 1995 and 2.4% in 1994. Behind this bad outcome was
the poor performance of private consumption that despite the creation of employment, remained
unchanged6. Both public authorities and social agents agreed that behind the poor performance
of private consumption, was the excessive rate of temporary workers, that was increasing the
precautionary motive saving. Hence, the need to reform the labour market reducing the huge
figures of temporary employment, since it was generating both micro and macroeconomic
problems that made difficult the necessary employment creation to reduce the huge rates of
unemployment (24.1% in 1994) and to ensure a sustained process of economic growth in the
long-term. With that aim, in 1994 a new labour market reform was passed with the explicit
objective of reducing the shares of temporary workers, trying to recover the principle of
causality, that is, setting more stringent conditions to the use of fixed-term contracts, and to
modify the pattern of flexibility, promoting the internal flexibilization of staffs instead of the
external-numerical flexibilization provided by the use of temporary workers.
However, the 1994 reform was a failure. Though it did promote the permanent hiring of workers,
it also increased the problem of the labour rotation of them, since it led to a dramatic fall of the
length of the fixed-term employment contracts (actually the rate of temporary workers was above
39% in the private sector since 1994q2 to 1996q4). Moreover, social agents, both employers
6 From 1993 to 1995, real GDP grew at rates of -1.2%, 2.3% and 2.7, but private consumption grew at lower rates: -2.2%, 0.9% and 1.7%, respectively
9
associations and the main trade unions did not move to the collective bargaining agreements the
necessary measures to promote the internal flexibility of staffs.
3. The Spanish economic policy since the incorporation to EMU
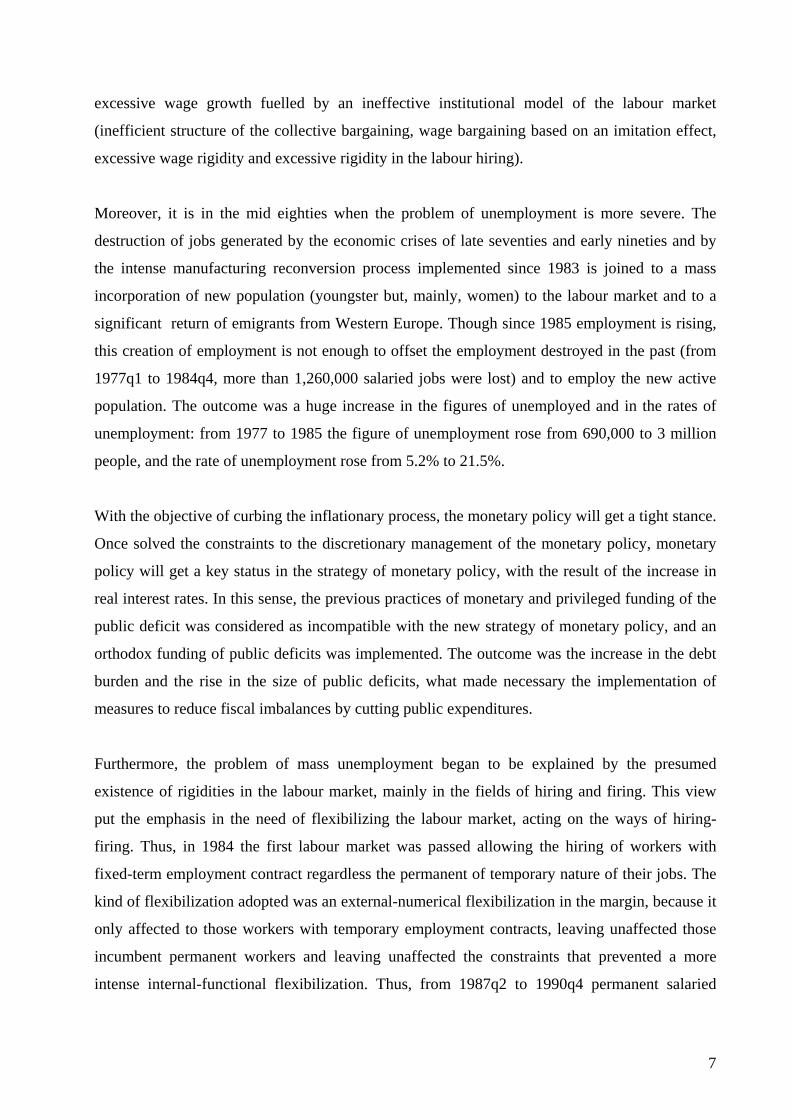
Despite this bad starting point, since 1997 the Spanish economy has enjoyed an unparallel stage
of economic growth. Figure 1 shows the evolution of the GDP, since 1997 Spain has
permanently grown at rates above 3%, and though since the year 2000 the pace of growth has
slowed, it is still registering rates of 3.5% in the last year.
Figure 1. GDP rate of growth, 1996-2006 (%)
0
1
2
3
4
5
6
7
8
Source: Instituto Nacional de Estadística
The economic boom has led to a significant employment creation. Since 1997q1 to 2006q1,
more than 5,900,000 salaried jobs have been created in Spain. As figure 2 shows, this process
has not only affected to temporary employment (+1,960,000 workers) but also, and this one key
difference with previous phases of economic growth, to permanent employment (+4 million
workers).
10

Figure 2. Evolution of salaried employment (000)
0
2000
4000
6000
8000
10000
12000
14000
16000
1800019
87q2
1988
q1
1988
q4
1989
q3
1990
q2
1991
q1
1991
q4
1992
q3
1993
q2
1994
q1
1994
q4
1995
q3
1996
q2
1997
q1
1997
q4
1998
q3
1999
q2
2000
q1
2000
q4
2001
q3
2002
q2
2003
q1
2003
q4
2004
q3
200
5q2
2006
q1
Total salaried employment Permanent Temporary
Source: Instituto Nacional de Estadística
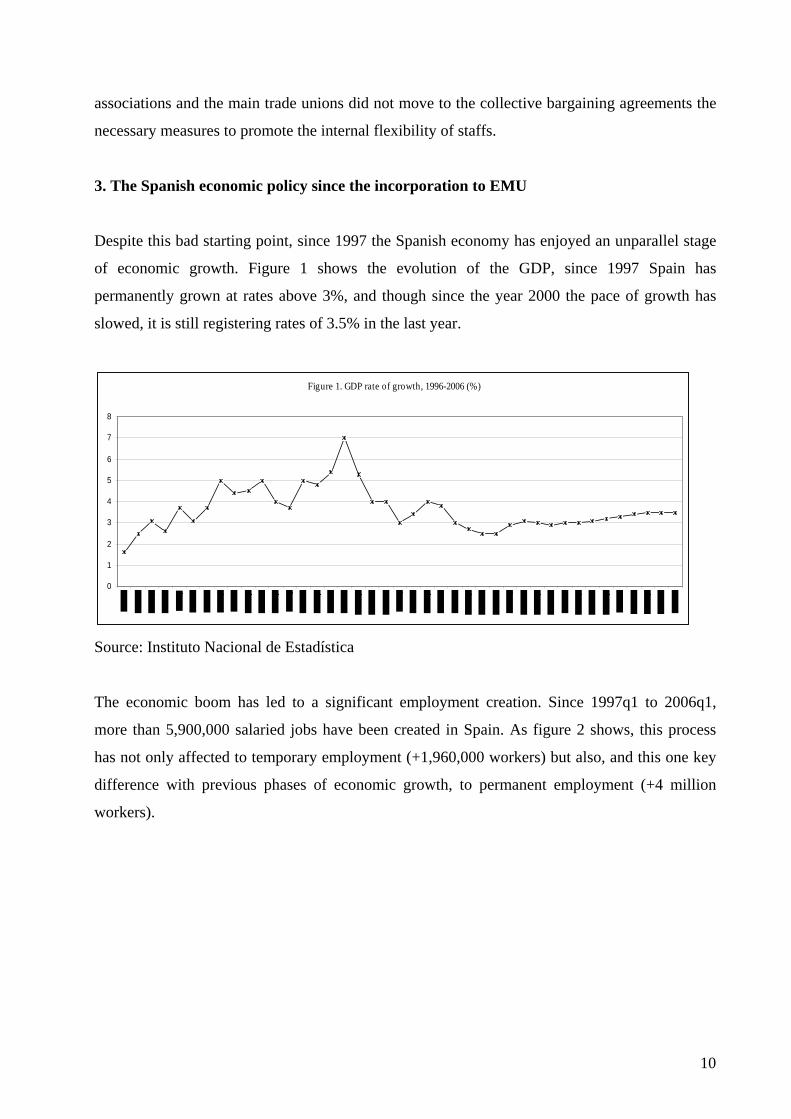
This prolonged expansion has led to a dramatic fall in the rate of unemployment, reaching a
figure of 10% for the unemployment rate in 2006q1, a rate not registered since 1980 (figure 3).
But what is even more significant, is the fact that the employment creation process has not only
allowed to reduce the unemployment rates but also to increase the activity rate of the Spanish
labour market, rising from 51.4% in 1997q1 to 58% in 2006q1. In absolute figures, that process
means that during the last nine years the active population has risen in Spain in 4,657,000
workers (+28%)
11
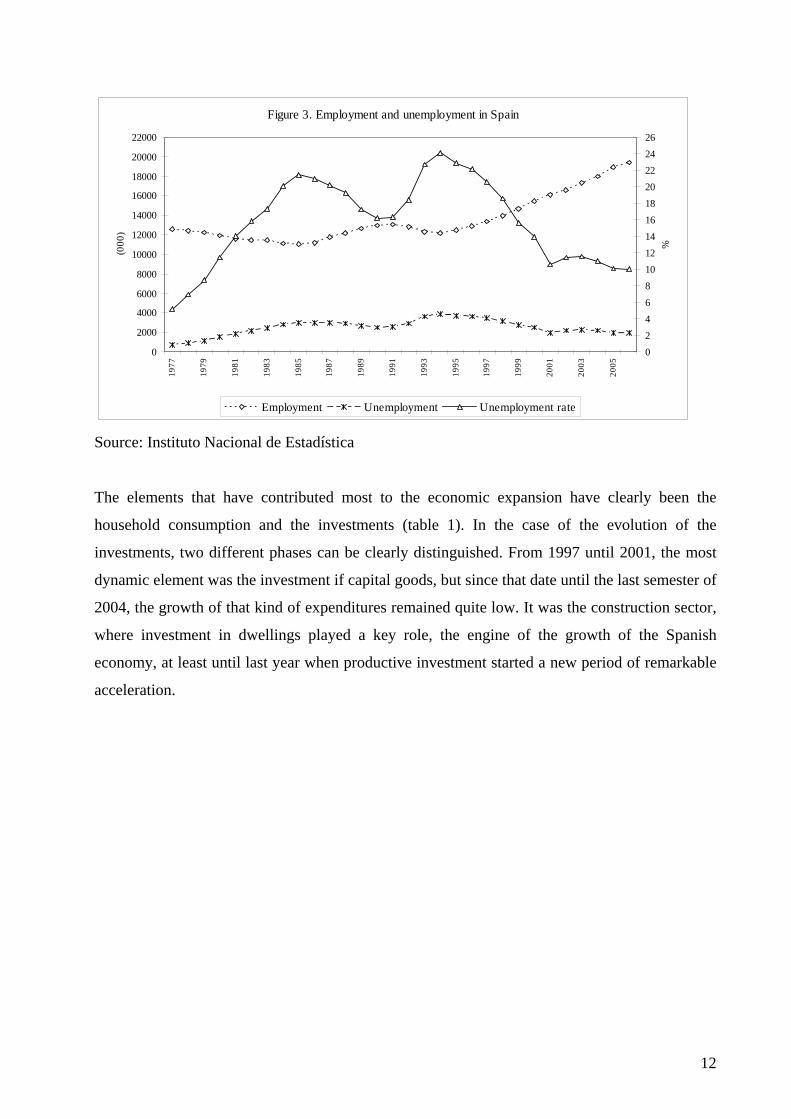
Figure 3. Employment and unemployment in Spain
0
2000
4000
6000
8000
10000
12000
14000
16000
18000
20000
22000
1977
1979
1981
1983
1985
1987
1989
1991
1993
1995
1997
1999
2001
2003
2005
(000
)
02468101214161820222426
%
Employment Unemployment Unemployment rate
Source: Instituto Nacional de Estadística
The elements that have contributed most to the economic expansion have clearly been the
household consumption and the investments (table 1). In the case of the evolution of the
investments, two different phases can be clearly distinguished. From 1997 until 2001, the most
dynamic element was the investment if capital goods, but since that date until the last semester of
2004, the growth of that kind of expenditures remained quite low. It was the construction sector,
where investment in dwellings played a key role, the engine of the growth of the Spanish
economy, at least until last year when productive investment started a new period of remarkable
acceleration.
12

Table 1. Annual variation rate of GDP 1996q1 1996q2 1996q3 1996q4 1997q1 1997q2 1997q3 1997q4 1998q1 1998q2 1998q3 1998q4 1999q1 1999q2 1999q3 1999q4 2000q1 2000q2 2000q3 2000q4 Gross domestic product 1.6 2.5 3.1 2.6 3.7 3.1 3.7 5.0 4.4 4.5 5.0 4.0 3.7 5.0 4.8 5.4 7.0 5.3 4.0 4.0 National final consumption expenditure. Total 2.8 2.3 1.6 1.6 0.7 2.0 4.9 4.5 5.1 4.4 3.7 5.0 4.7 5.3 4.9 5.1 6.2 5.5 4.8 3.6 National final consumption expenditure: general government 0.7 1.4 1.6 1.4 2.4 2.3 2.4 2.9 2.8 3.4 3.8 4.0 3.7 3.7 4.0 4.5 5.8 5.0 6.9 3.5 National final consumption expenditure: households and NPISH 3.4 2.6 1.6 1.7 0.2 1.9 5.7 5.0 5.8 4.7 3.6 5.3 4.9 5.8 5.2 5.3 6.3 5.7 4.2 3.7 Gross capital formation. Total -0.8 3.2 4.0 2.8 15.1 4.7 -7.1 6.9 2.1 9.3 25.0 13.5 6.3 14.5 11.9 11.4 11.9 4.3 3.9 4.7 Gross fixed capital formation. Total 2.7 1.8 3.5 2.4 2.9 4.3 5.2 7.7 10.2 10.4 12.0 12.6 11.2 12.1 10.0 8.7 7.3 5.7 6.4 7.1 Gross fixed capital formation in capital good. Total 10.1 10.5 11.1 8.4 7.2 9.8 11.1 15.8 19.6 17.2 17.2 16.3 12.1 12.9 11.0 7.6 8.5 6.4 5.9 7.5 Gross fixed capital formation in construction. Total -2.1 -3.5 -1.2 -1.1 0.8 1.6 2.4 3.4 5.2 6.8 8.6 10.5 10.3 10.3 9.0 8.7 6.0 5.3 6.1 6.4 Gross fixed capital formation in construction. Dwellings 14.5 13.2 12.9 9.0 4.8 1.3 0.5 2.4 5.8 10.8 13.7 13.2 11.9 10.4 10.4 12.9 12.6 12.2 9.5 7.4 Gross fixed capital formation in construction. Other constructions -10.6 -12.3 -9.2 -7.1 -1.8 1.9 3.7 4.2 4.7 4.1 5.2 8.6 9.2 10.3 8.0 5.7 1.0 0.0 3.5 5.6 Variation in stocks -152.3 417.2 19.6 42.4
-1,016.5 30.5 -321.3 -53.6 -75.0 -45.2 -133.7 163.1 -201.1 246.6 88.1 200.2 -200.6 -38.5 -55.8 -56.1
Exportation of goods and services. Total 6.4 8.8 14.4 11.8 8.6 16.8 18.6 15.4 16.9 9.9 3.2 3.5 7.3 5.3 7.6 9.6 11.6 12.4 8.8 8.4 Importation of goods and services 8.0 9.0 10.0 9.2 9.4 14.7 12.3 16.2 16.8 14.2 14.7 13.9 12.1 14.1 14.3 14.0 13.4 11.8 10.6 7.7 2001q1 2001q2 2001q3 2001q4 2002q1 2002q2 2002q3 2002q4 2003q1 2003q2 2003q3 2003q4 2004q1 2004q2 2004q3 2004q4 2005q1 2005q2 2005q3 2005q4 2006q1 Gross domestic product 3.0 3.4 4.0 3.8 3.0 2.7 2.5 2.5 2.9 3.1 3.0 2.9 3.0 3.0 3.1 3.2 3.3 3.4 3.5 3.5 3.5National final consumption expenditure. Total 3.7 3.4 2.9 3.5 2.9 2.8 3.5 3.7 3.1 2.6 3.2 3.4 3.8 5.1 5.1 5.0 4.7 4.4 4.3 4.2 4.1National final consumption expenditure: general government 3.4 4.8 2.1 5.5 3.4 4.3 5.0 5.3 5.5 4.4 4.5 4.8 5.5 6.0 6.5 6.0 5.2 4.0 4.2 4.6 4.7National final consumption expenditure: households and NPISH 3.8 3.0 3.2 3.0 2.8 2.4 3.1 3.2 2.4 2.0 2.8 3.0 3.3 4.8 4.7 4.7 4.6 4.6 4.3 4.0 3.9Gross capital formation. Total 6.3 6.1 3.2 1.5 2.0 2.1 3.7 6.0 6.1 6.1 5.2 4.4 4.4 4.1 5.1 5.7 6.8 7.2 7.2 6.5 6.3Gross fixed capital formation. Total 6.8 6.4 3.5 1.7 2.2 2.2 3.5 5.5 6.1 6.0 5.3 4.8 4.1 4.1 5.3 5.8 7.0 7.6 7.3 6.8 6.2Gross fixed capital formation in capital good. Total 4.0 2.6 0.2 -6.2 -4.3 -6.5 -3.4 2.7 3.6 3.7 2.1 0.7 -0.7 0.9 6.2 8.4 9.8 10.4 8.9 9.1 8.3Gross fixed capital formation in construction. Total 8.8 9.0 4.7 4.9 4.4 6.0 7.2 7.3 6.9 6.4 6.0 6.0 6.0 5.5 5.3 5.2 6.0 6.2 6.3 5.6 5.8Gross fixed capital formation in construction. Dwellings 8.6 7.4 5.2 2.8 0.4 5.9 7.5 14.1 14.1 9.0 7.8 7.1 5.7 7.4 6.2 4.6 5.9 5.9 7.0 5.1 7.4Gross fixed capital formation in construction. Other constructions 9.0 10.4 4.2 6.7 7.9 6.1 6.9 1.8 0.9 4.1 4.3 4.9 6.3 3.7 4.4 5.9 6.2 6.5 5.6 6.1 4.1Variation in stocks -16.3 -13.9 -12.0 -11.0 -8.0 -1.0 15.9 41.4 5.0 11.2 0.2 -19.5 24.5 0.8 -7.5 -7.5 -7.7 -16.6 -0.4 -18.4 9.7Exportation of goods and services. Total 5.9 3.2 5.2 1.9 -0.9 1.8 1.6 4.6 4.6 3.6 4.1 2.2 4.0 3.0 3.7 2.7 -1.4 1.3 2.1 1.9 9.1Importation of goods and services 10.4 5.3 1.6 -0.4 -1.4 1.9 5.0 10.3 7.8 4.8 6.4 5.1 7.4 9.6 10.5 9.7 6.2 7.9 7.8 6.6 12.4
Source: INE
13

Table 2. Composition of GDP (current prices)
1996q1
1996q2
1996q3
1996q4
1997q1
1997q2
1997q3
1997q4
1998q1
1998q2
1998q3
1998q4
1999q1
1999q2
1999q3
1999q4
2000q1
2000q2
2000q3 2000q4
National final consumption expenditure 78.8 77.8 77.0 77.4 76.4 76.9 77.9 77.0 76.8 76.4 76.5 77.3 76.9 76.4 76.7 76.9 76.9 76.9 77.2 76.5 National final consumption expenditure: households 63.5 62.7 62.1 62.7 61.9 62.5 63.7 63.0 62.9 62.4 62.6 63.4 63.1 62.8 62.9 63.3 63.0 63.2 63.2 63.0 National final consumption expenditure: general government 18.1 18.0 18.0 17.9 17.6 17.6 17.5 17.3 17.3 17.4 17.3 17.3 17.3 17.2 17.1 17.1 17.2 17.1 17.6 16.9
Gross capital formation 21.1 21.9 22.4 21.5 23.1 22.5 20.7 22.1 23.1 23.5 23.7 23.6 23.8 25.6 25.6 25.5 26.3 26.1 26.2 26.4
Gross fixed capital formation 21.4 21.2 21.5 21.5 21.5 21.8 22.0 22.0 22.5 22.6 23.2 23.8 23.8 24.4 24.8 25.2 25.8 25.7 25.8 26.0 Gross fixed capital formation. Dwellings 4.7 4.7 4.8 4.8 4.8 4.7 4.7 4.7 4.8 4.9 5.1 5.2 5.3 5.4 5.6 5.7 5.9 6.1 6.2 6.3 Gross fixed capital formation. Other construction 7.1 6.9 6.9 6.8 6.8 6.8 6.9 6.7 6.7 6.6 6.8 7.0 7.0 7.1 7.1 7.1 6.9 7.0 7.3 7.5
Variation in stocks -0.3 0.7 0.9 0.0 1.6 0.7 -1.3 0.1 0.6 1.0 0.4 -0.3 0.1 1.2 0.7 0.3 0.5 0.5 0.4 0.4 Exportation of goods and services 23.0 23.0 23.7 24.8 24.3 26.2 27.5 27.2 26.9 27.1 26.5 26.1 26.5 26.2 26.7 27.2 28.0 29.1 29.1 29.8 Importation of goods and services 22.8 22.8 23.1 23.8 23.8 25.6 26.0 26.3 26.8 27.1 26.8 27.0 27.2 28.2 29.0 29.7 31.3 32.1 32.5 32.7
2001q1
2001q2
2001q3
2001q4
2002q1
2002q2
2002q3
2002q4
2003q1
2003q2
2003q3
2003q4
2004q1
2004q2
2004q3
2004q4
2005q1
2005q2
2005q3
2005q4
2006q1
National final consumption expenditure 77.2 76.4 75.6 75.3 75.7 75.4 75.2 75.5 75.5 74.2 74.5 74.9 75.2 75.4 75.6 75.7 75.5 75.5 75.4 75.7 75.8National final consumption expenditure: households 63.4 62.6 61.9 61.3 61.9 61.0 60.8 60.8 61.1 59.8 59.9 59.9 60.4 60.1 60.3 60.3 60.3 59.7 60.1 60.1 59.8National final consumption expenditure: general government 17.1 17.2 17.0 17.1 16.8 17.3 17.3 17.4 17.2 17.4 17.4 17.6 17.6 17.8 17.9 17.9 17.7 17.8 17.7 18.0 17.8
Gross capital formation 26.9 26.6 26.3 25.6 26.5 26.6 26.6 26.8 27.3 27.6 27.4 27.4 27.8 28.2 28.4 28.7 29.3 29.8 29.8 29.9 30.5
Gross fixed capital formation 26.5 26.2 25.9 25.3 26.1 26.2 26.2 26.3 27.0 27.3 27.0 27.1 27.4 27.9 28.0 28.3 28.9 29.5 29.5 29.6 30.1Gross fixed capital formation. Dwellings 6.4 6.5 6.5 6.4 6.4 6.9 7.1 7.4 7.4 7.7 7.7 8.0 7.9 8.4 8.3 8.6 8.5 8.9 8.8 9.0 9.1Gross fixed capital formation. Other construction 7.3 7.5 7.4 7.6 7.6 7.8 7.7 7.6 7.6 7.9 7.8 7.7 7.7 8.0 7.9 8.1 8.1 8.4 8.3 8.4 8.3
Variation in stocks 0.4 0.4 0.4 0.4 0.3 0.4 0.4 0.5 0.4 0.4 0.4 0.4 0.4 0.4 0.4 0.3 0.4 0.3 0.3 0.3 0.4Exportation of goods and services 29.2 28.9 28.5 27.7 27.3 27.5 27.2 27.2 26.6 26.5 26.3 26.0 25.8 26.0 26.1 25.7 24.7 25.3 26.0 25.4 26.1Importation of goods and services 33.2 31.9 30.3 28.6 29.5 29.5 29.0 29.4 29.5 28.4 28.3 28.3 28.8 29.6 30.1 30.2 29.6 30.6 31.2 31.0 32.3
Source: INE
14

As a direct consequence of this model of growth, the weight of the domestic
consumption in the GDP has fallen, reaching percentages below 60%. We must stress
that this falling consumption takes place during a process of intense employment
creation (not only of temporary employment but also, and mainly, of permanent
employment) and reduction of unemployment, of intense growth of population mainly
due to the massive inflows of immigrants, and where several cuts in direct taxes have
been passed. All these elements should have led to an increase of consumption in terms
of the percentage of GDP. As we will see later, behind this paradox we will find the
negative growth of real wages that has led to a redistribution of national income against
compensation of employees.
How has influenced the economic policy in this process of sustained expansion?. To
give an answer we must focus in the role played by the labour market policy and the
macroeconomic policy. First, we will focus on the first element, which in turn, leads us
to pay special attention to the reforms of the labour market passed since 1997, whose
aim was to reduce the high rates of temporary employment, and to the implicit wages
policy existing since that year.
In 1997, with the implicit support from the new conservative administration of the
Partido Popular, the main trade unions (Comisiones Obreras, CCOO, and Unión
General de Trabajadores, UGT) signed two interconfederal agreements that, with the
monetary policy adopted by the European Central Bank (ECB) since the
implementation of the euro, are the cornerstones of the current economic policy in
Spain.
The ultimate aim of the first agreement the Interconfederal Agreement on the
Employment Stability (AIEE) was to complete the return to the principle of causation in
the field of permanent-temporary labour hiring. The objective of the AIEE was the
reduction of the share of temporary workers, a percentage that all the social agents
considered as excessive and, this is the most important, at the root of the problems of
competitiveness and growth suffered by the Spanish economy. The AIEE creates a new
modality of permanent employment contract, initially directed to specific groups of
workers, mainly unemployed ones and youngsters, with lower firing costs than the
15

ordinary permanent contract. This new permanent contract helps to understand the rise
in permanent employment contract since 1997 (Ferreiro and Gómez, 2006).
The AIEE had a validity of only four years. The lack of consensus between employers
and trade unions, led the Conservative administration to unilaterally approve a new
reform of the labour market, whose main content was the maintenance of the new
permanent employment contract and the increase in the range of groups of workers that
could sign this contract. In this sense, only a couple of months ago, the new Socialist
administration has approved a new labour market reform agreed with the employers
associations and the unions UGT and CC.OO on the bases of this two previous reforms,
always with the new permanent employment contract at the centre of the reform. This
new reform allows the possibility of using in the future the new permanent contract and
tries to foster the conversion of fixed-term employment contracts into permanent ones
by concentrating the public grants only in the hiring of workers with permanent
contracts and in the conversion of temporary workers into permanent workers (though
in the latter case, the grants only will given for those conversions made during 2006).
The objective of this new reform was the fall in the percentage of temporary workers
and to try to slow down the acceleration in the hiring of temporary workers that had
being taken place since 2005 (Ferreiro, Gómez and Serrano, 2006).
But even more significant in terms of its macroeconomic consequences is the existence
since 1997 of the Interconfederal Agreement on Collective Bargaining (AINC). The
AINC has two main objectives: first, the use of collective bargaining as a key tool to
change the current pattern of numerical-external flexibilization of the staffs for a
internal-functional flexibility, and second, to reach an agreed wage moderation, thus
making the successive new and extended AINCs an implicit wage policy. The AINCs
involve a double trade-off: the first one, between the reduction of temporary
employment and the fostering of permanent hiring and the internal (functional and
geographical) flexibility; the second one, between wage moderation and the creation of
permanent employment. In this sense, the AINCs have an explicit twofold micro and
macroeconomic objectives: the microeconomic objective is the change in the pattern of
competitiveness of the Spanish firms, changing the current dominant one (based on low
wage costs and an intense use of temporary workers) to a new one (based on high
productivity, innovation and R&D activities and an intense use of permanent workers).
16
The macroeconomic objectives are to reach a sustained path of high rates of economic
growth, to increase the investment and the activities related to the innovation of firms
and to reach non-inflationary environment, what involves the implicit acceptance of the
inflation target of 2% of the CPI. In this sense, the guideline adopted since 1997 in the
subsequent AINCs has been the need to bargain real wages below the increases of
productivity, what involves the acceptance of negative real unit labour costs. Actually,
as figure 4 shows, the current policy of voluntary wage moderation has involved the
acceptance of a freeze of real wages in Spain
Figure 4. Annual rates of growth of nominal and real earnings (%)
-6,0
-4,0
-2,0
0,0
2,0
4,0
6,0
8,0
10,0
12,0
14,0
16,0
1982
1983
1984
1985
1986
1987
1988
1989
1990
1991
1992
1993
1994
1995
1996
1997
1998
1999
2000
2001
2002
2003
2004
2005
Nominal earnings CPI Real earnings
Source: Instituto Nacional de Estadística
However, both the reforms of the labour market and that implicit wages policy can not
explain alone the permanence of the high rates of economic growth. At most, they could
help to understand the evolution of the figures of permanent and temporary employment
or the evolution of total employment and of the unemployment rates. In a context of a
fall or real earnings, investment can only expand in case of a pull of exports and a
substitution of (relatively more expensive) imports by (relatively cheaper) domestic
production. However, as we have seen in table 1 and 2, the contribution of current
account to the economic activity has been negative, due to the huge deficit in the current
account (slightly above 7%GDP). Therefore, we must pay special attention to the role
played by the macroeconomic policy.
17

Table 3. Public expenditures and resources (%GDP)
1997 1998 1999 2000 2001 2002 2003 2004 2005Current expenditures 42.2 41.7 39.7 42.4 38.5 38.7 38.3 38.8 38.2Current resources 39.0 39.1 38.4 41.4 38.0 38.4 38.3 38.7 39.3Overall balance -3.2 -2.7 -1.3 -1.0 -0.5 -0.3 0.0 -0.2 1.1
Source: Banco de España
Table 3 shows the basic elements of the Spanish fiscal policy. It is clear that the fiscal
policy stance has not been an expansionary one, but tight. Since 1997, Spanish
authorities have carried out an intense process of fiscal consolidation: the public deficit
of the year 1997 (3.2% GDP), has turned into a surplus of 1.1%GDP in 2005. This
surplus has been reached with a dramatic fall in public expenditures of 4 percentage
points of the GDP. This fiscal consolidation has led to a fall in the weight of public debt
from 65.3% GDP in 1997 to 43.2% GDP in 2005.
It could be argued that through the working of non-Keynesian effects, the Spanish fiscal
policy could have generated the bases for the current sustained expansion. However,
since 2001, the fiscal consolidation has been driven by a rise of public revenues and not
by falling expenditures, something that is contradictory with the postulates of the
defenders of the existence of non-Keynesian effects.
It is in this situation when we must turn to the role played by the monetary policy. In the
EMU there is a single monetary policy ruled by the ECB, a monetary policy that has
been often blamed as one of the main reasons of the stagnation of the European
economies. However, though such a statement might be true for the whole EMU
countries, it is not necessarily true all of them, like, for instance Spain, and the main
reasons is not other than the higher inflation rates of Spain, that have made the ECB
monetary policy an expansionary one for Spain. In other words, the inflation process in
Spain has worked as an engine of the current expansion.
The inflationary process is fuelling the current expansion process through several
transmission channels:
18

i) The higher than the EMU average inflation rate has made the monetary policy of the
ECB to adopt for Spain an expansionary stance. As table 5 shows, since 2002 the
monetary stance of the ECB has been clearly expansionary for Spain. In the last years
the real interest rates have turned into negative ones. If we subtract to the nominal
interest rate of the ECB main refinancing operations the Spanish CPI, the ECB
monetary policy has led to a big fall of real interest rates in Spain. In January 2006, it
meant a real interest rate of -1.95%.
Figure 5. Real interest rate for Spain of the ECB main refinancing operations (%)
-2,5
-2
-1,5
-1
-0,5
0
0,5
1
1,5
2
1999
m1
1999
m5
1999
m9
2000
m1
2000
m5
2000
m9
2001
m1
2001
m5
2001
m9
2002
m1
2002
m5
2002
m9
2003
m1
2003
m5
2003
m9
2004
m1
2004
m5
2004
m9
2005
m1
2005
m5
2005
m9
2006
m1
2006
m5
Source: Banco de España and Instituto Nacional de Estadística
This fall in the ECB real interest rates have moved to the interest rates that banks and
saving banks apply to their operations with their clients. Figure 6 shows the evolution of
the main operations of the banking system in Spain. Real interest rates in mortgages are
negative since 2004 and the real interest rates in the lending to business (proxied by the
prime rate) is currently 1% in the case of banks and 0.5% in the case of saving banks,
19
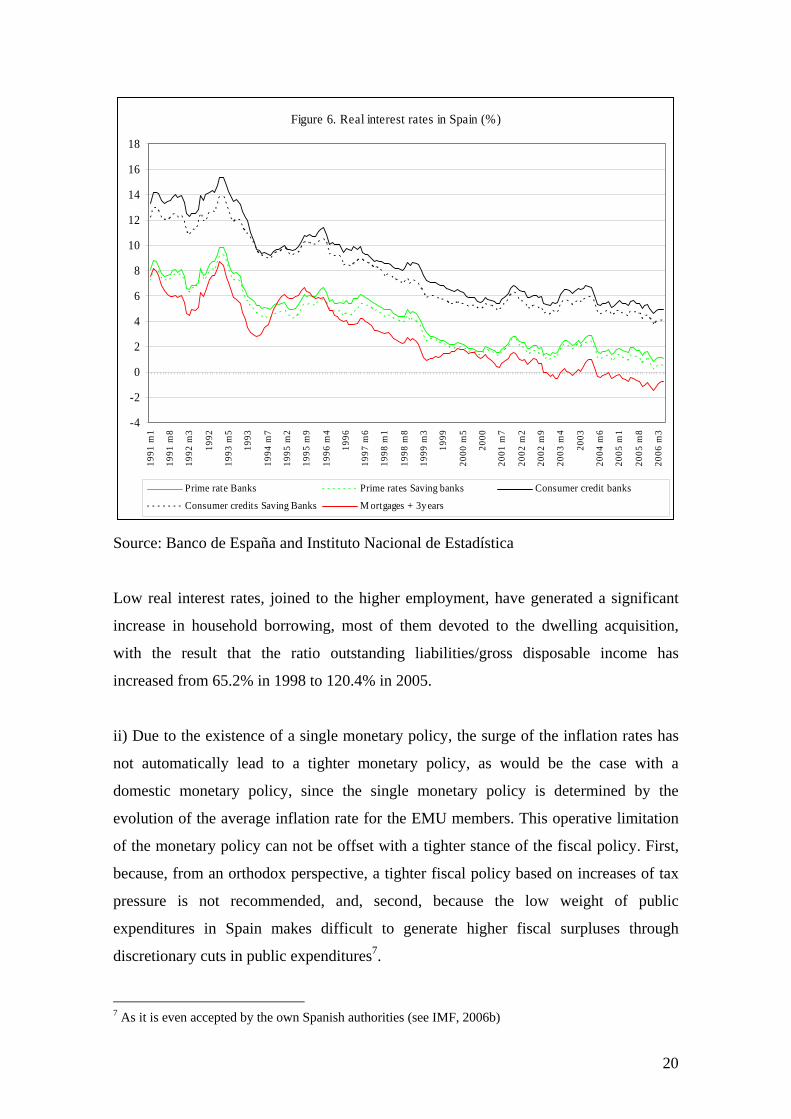
Figure 6. Real interest rates in Spain (%)
-4
-2
0
2
4
6
8
10
12
14
16
1819
91 m
1
1991
m8
1992
m3
1992
1993
m5
1993
1994
m7
1995
m2
1995
m9
1996
m4
1996
1997
m6
1998
m1
1998
m8
1999
m3
1999
2000
m5
2000
2001
m7
2002
m2
2002
m9
2003
m4
2003
2004
m6
2005
m1
2005
m8
2006
m3
Prime rate Banks Prime rates Saving banks Consumer credit banks
Consumer credits Saving Banks M ortgages + 3years
Source: Banco de España and Instituto Nacional de Estadística
Low real interest rates, joined to the higher employment, have generated a significant
increase in household borrowing, most of them devoted to the dwelling acquisition,
with the result that the ratio outstanding liabilities/gross disposable income has
increased from 65.2% in 1998 to 120.4% in 2005.
ii) Due to the existence of a single monetary policy, the surge of the inflation rates has
not automatically lead to a tighter monetary policy, as would be the case with a
domestic monetary policy, since the single monetary policy is determined by the
evolution of the average inflation rate for the EMU members. This operative limitation
of the monetary policy can not be offset with a tighter stance of the fiscal policy. First,
because, from an orthodox perspective, a tighter fiscal policy based on increases of tax
pressure is not recommended, and, second, because the low weight of public
expenditures in Spain makes difficult to generate higher fiscal surpluses through
discretionary cuts in public expenditures7.
7 As it is even accepted by the own Spanish authorities (see IMF, 2006b)
20
In this sense, the budgetary prospects included the Stability Programme Update for the
period 2005-088 show a fall in the net lending of the general government from the 1%
GDP in 2005 to 0.6%GDP in 2008. Total revenues are expected to fall from 39.4%
GDP to 38.9% GDP and total expenditures will move from 38.4%GDP to 38.3% GDP.
Actually, excluded interest payments, primary expenditures are expected to rise from
36.6% GDP to 36.9%.
One of the reasons that explain the problems to implement a tighter fiscal policy in
Spain is, precisely, the past tight stance of fiscal policy. From 1995 to 2005, the net
lending of general government fell from -6.6% GDP to -0.1%9: This fiscal consolidation
has been reached with an increase of total resources of 1.6%GDP, and a fall in total
expenditure of 4.9%GDP, out of which, 3.1%GDP corresponds to the fall in interest
payments and1.2%GDP to the fall in capital expenditure (Directorate-General for
Economic and Financial Affairs, 2005). As a consequence of this fiscal adjustment, in
2005 the ratio public expenditures/GDP for Spain (38.2%GDP) is 9.3 p.p. lower than
for EMU-economies, 9 p.p. lower than that for EU-25 and 9.2. p.p. lower than in the
case of EU-15. Actually only 5 EU members (Ireland, Estonia, Latvia, Lithuania and
Slovakia) have lower public expenditures than Spain (Directorate-General for Economic
and Financial Affairs, 2006).
iii) Another channel of transmission of the inflation to the economic growth is its
impact on the housing wealth and stock gains that are fuelling household consumption
and borrowing. According to the data from the National Accounts, the nominal labour
incomes of Spanish households have risen 48.3% from 1998 to 200510, but the
distributed income of corporations rose at a rate of 95.7%, the outstanding long-term
securities other than shares increased in 91.6%, the value of quoted shares owned by
households rose at 57.7%, the unquoted shares increased in 48.8% and the insurance
technical reserves increased in 118.4%.
8 Available at the website of the Spanish Ministry of Economy and Finance (http://serviciosweb.meh.es/APPS/DGPE/ingles.aspx). 9 The more recent estimations above mention estimate the overall balance of general government in a surplus of 1%GDP in 2005. 10 In that period the number of salaried workers increased in 44.4%.
21

iv) Surely the most important channel is the impact of inflation of investment. The huge
increase in dwellings prices11 and the low interest rates have made that construction
becomes one of the main engines of the Spanish economy, as we saw in tables 1 and 2.
Though in many occasions, it is argued that the Spanish model of growth is excessively
dependant of the construction sector, the investment in capital goods is also quite
dynamic. Figure 7 shows the evolution of the ratio gross fixed capital formation/GDP.
In the first quarter of 2006, the ratio has reached 12.7%, 4.1 percentage points higher
than in the first quarter 1996. This ratio rose dramatically since 1996 until 1999, and it
fell until 2003, starting to rise again since then.
Figure 7. Gross fixed capital formation in capital goods (%GDP)
88.5
99.510
10.511
11.512
12.513
13.5
199
6q1
199
6q3
199
7q1
199
7q3
199
8q1
199
8q3
199
9q1
199
9q3
200
0q1
200
0q3
200
1q1
200
1q3
200
2q1
200
2q3
200
3q1
200
3q3
200
4q1
200
4q3
200
5q1
200
5q3
200
6q1
Source: Instituto Nacional de Estadística
Not surprisingly, this cycle of the investment in capital goods is parallel to the evolution
of real interest rates, as we could saw in figure 6. If we focus on the prime rates, these
interest rates followed a declining trend until 2001, when they remained nearly constant
until 2004, when they began again a new declining trend. Therefore, inflation would
have boosted investment through the impact on real interest rates.
But inflation has also fuelled investment via the impact on real wages and real unit
labour costs and the rising mark-ups that have increased corporate profits.
11 Real housing prices rose around 200% between 1995 and 2004 (International Monetary Fund, 2006c).
22
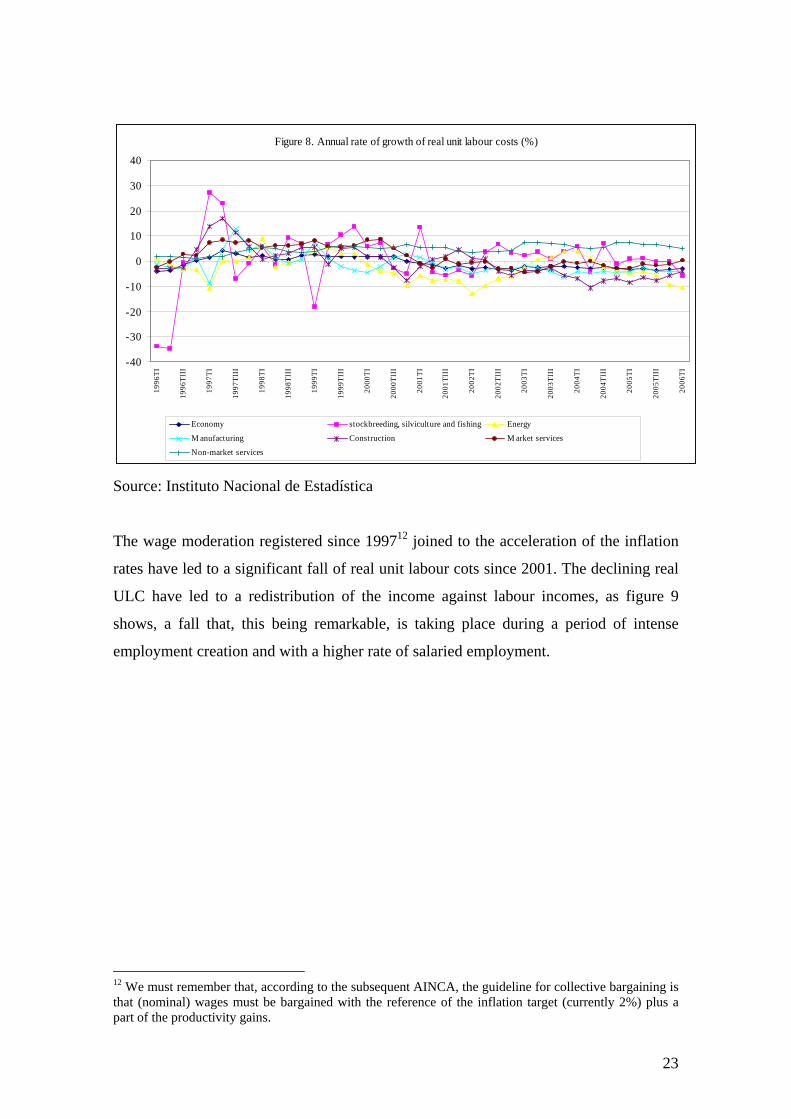
Figure 8. Annual rate of growth of real unit labour costs (%)
-40
-30
-20
-10
0
10
20
30
40 1
996T
I
199
6TII
I
199
7TI
199
7TII
I
199
8TI
199
8TII
I
199
9TI
199
9TII
I
200
0TI
200
0TII
I
200
1TI
200
1TII
I
200
2TI
200
2TII
I
200
3TI
200
3TII
I
200
4TI
200
4TII
I
200
5TI
200
5TII
I
200
6TI
Economy stockbreeding, silviculture and fishing Energy
M anufacturing Construction M arket services
Non-market services
Source: Instituto Nacional de Estadística
The wage moderation registered since 199712 joined to the acceleration of the inflation
rates have led to a significant fall of real unit labour cots since 2001. The declining real
ULC have led to a redistribution of the income against labour incomes, as figure 9
shows, a fall that, this being remarkable, is taking place during a period of intense
employment creation and with a higher rate of salaried employment.
12 We must remember that, according to the subsequent AINCA, the guideline for collective bargaining is that (nominal) wages must be bargained with the reference of the inflation target (currently 2%) plus a part of the productivity gains.
23

Figure 9. Income dis tribution (% GDP)
35,00
37,00
39,00
41,00
43,00
45,00
47,00
49,00
51,00 1
995q
1
199
5q3
199
6q1
199
6q3
199
7q1
199
7q3
199
8q1
199
8q3
199
9q1
199
9q3
200
0q1
200
0q3
200
1q1
200
1q3
200
2q1
200
2q3
200
3q1
200
3q3
200
4q1
200
4q3
200
5q1
200
5q3
200
6q1
Employee wages Gross operating surplus/mixed income
Source: Instituto Nacional de Economía
Declining real unit labour costs have led to a fall in the ratio compensation of
employees/value of production and a rise in the rates of profits. The table 4 shows for
most sectors a clear pattern of rising rates of profits and declining share of wages in the
value of production
24

Table 4. Share of wages and profits in the value of production (%)
2000 2001 2002 2003 2004 profits wages profits wages profits wages profits wages profits wagesExtractive industries and petroleum 4,9 5,6 3,5 5,5 4,2 6,3 4,0 6,3 5,6 5,6Food, beverages and tobacco 2,8 11,8 4,7 11,2 3,3 11,2 3,7 11,4 4,4 11,1Manufacture of textiles, wearing apparel, leather and footwear 3,0 19,8 2,4 21,0 0,2 21,0 2,1 21,3 2,5 21,2Wood and cork 3,9 17,8 1,8 19,2 1,2 18,8 2,2 19,2 3,1 19,1Paper, publishing, graphic arts and reproduction of recorded media 5,1 19,8 5,4 19,9 3,8 19,8 4,0 20,4 5,9 20,4Chemical industry 4,6 13,5 4,1 13,9 4,3 13,4 3,5 13,8 4,2 13,4Rubber and plastic products 3,4 19,8 3,1 19,8 3,5 19,1 1,8 20,4 3,7 19,6Various non-metallic ore products 7,3 18,7 7,6 18,1 6,2 17,9 4,6 18,6 7,3 17,8Metallurgy and manufacture of metallic products 5,0 19,5 4,0 20,7 3,8 20,2 3,6 20,9 5,2 18,9Machinery and mechanical equipment 4,4 22,4 3,9 22,9 3,9 22,6 3,5 23,3 4,5 22,2Electrical, electronic and optical material and equipment 4,0 17,1 2,8 18,0 1,7 18,8 3,5 18,8 3,3 17,7Transport equipment 1,7 11,2 1,0 12,1 0,5 12,5 1,4 11,9 1,5 11,7Various manufacturing industries 3,7 22,6 3,7 22,9 0,3 23,6 2,6 24,1 4,1 22,7Energy and water 11,1 8,2 9,7 8,2 17,5 7,4 12,2 7,9 11,3 7,2Construction 14,6 27,6 13,5 23,9 13,1 20,3 13,3 19,5 n.a. n.a.Wholesale and retail trade; repairs 26,5 32,4 25,8 31,3 24,8 32,7 25,3 33,0 25,4 33,1Hotels and restaurants 18,5 25,8 17,5 26,4 17,3 27,1 16,5 27,4 15,6 28,0Transport, storage and communication 27,9 26,8 28,8 27,0 30,8 26,6 31,7 27,0 31,6 26,5Financial intermediation 25,9 36,5 29,7 34,5 31,2 33,2 31,1 32,7 31,0 31,8Real estate, renting and business activities 31,5 26,3 32,7 27,3 30,1 30,2 29,5 30,6 31,3 28,2
Notes: For industry sector the value of production is equal to total operating income Wages are equivalent to personal expenses. For industry sectors, profits are equal to profits and loss for the year. For construction and services sectors profits are equal to gross operating surplus Source: Instituto Nacional de Estadística
25
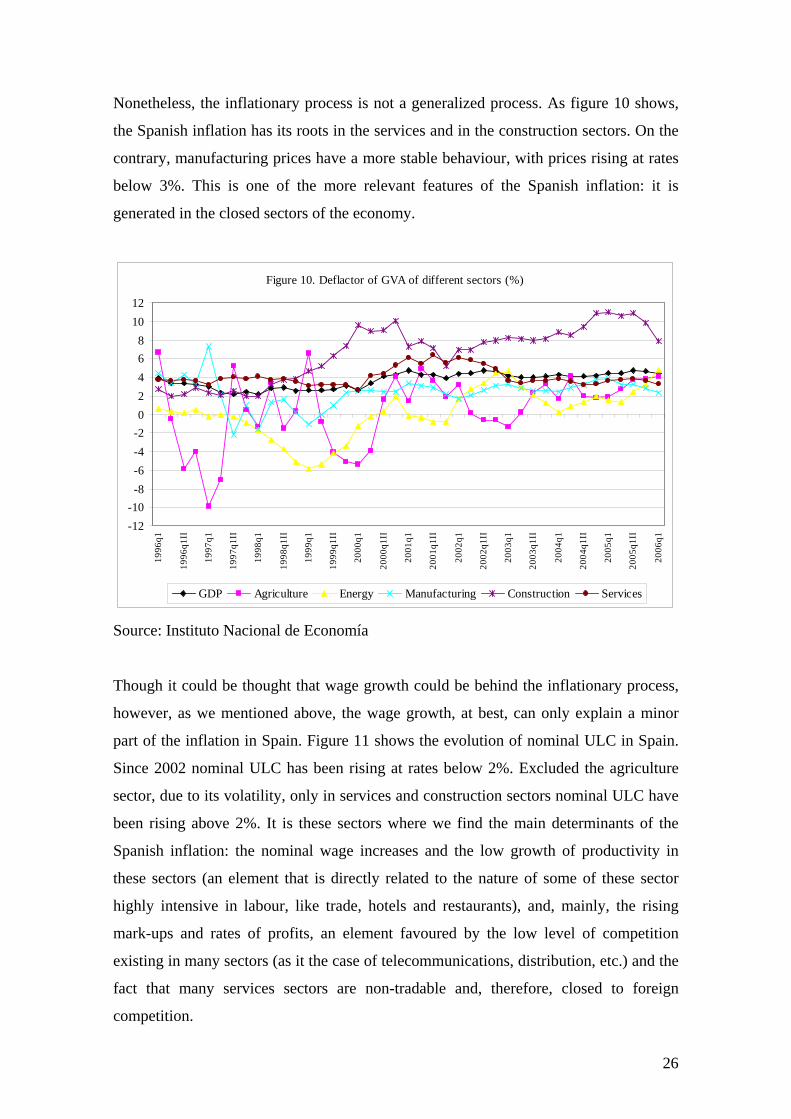
Nonetheless, the inflationary process is not a generalized process. As figure 10 shows,
the Spanish inflation has its roots in the services and in the construction sectors. On the
contrary, manufacturing prices have a more stable behaviour, with prices rising at rates
below 3%. This is one of the more relevant features of the Spanish inflation: it is
generated in the closed sectors of the economy.
Figure 10. Deflactor of GVA of different sectors (%)
-12-10-8-6-4-202468
1012
199
6q1
199
6q1I
I
199
7q1
199
7q1I
I
199
8q1
199
8q1I
I
199
9q1
199
9q1I
I
200
0q1
200
0q1I
I
200
1q1
200
1q1I
I
200
2q1
200
2q1I
I
200
3q1
200
3q1I
I
200
4q1
200
4q1I
I
200
5q1
200
5q1I
I
200
6q1
GDP Agriculture Energy Manufacturing Construction Services
Source: Instituto Nacional de Economía
Though it could be thought that wage growth could be behind the inflationary process,
however, as we mentioned above, the wage growth, at best, can only explain a minor
part of the inflation in Spain. Figure 11 shows the evolution of nominal ULC in Spain.
Since 2002 nominal ULC has been rising at rates below 2%. Excluded the agriculture
sector, due to its volatility, only in services and construction sectors nominal ULC have
been rising above 2%. It is these sectors where we find the main determinants of the
Spanish inflation: the nominal wage increases and the low growth of productivity in
these sectors (an element that is directly related to the nature of some of these sector
highly intensive in labour, like trade, hotels and restaurants), and, mainly, the rising
mark-ups and rates of profits, an element favoured by the low level of competition
existing in many sectors (as it the case of telecommunications, distribution, etc.) and the
fact that many services sectors are non-tradable and, therefore, closed to foreign
competition.
26

Figure 11. Annual rate of growth of nominal unit labour costs (%)
-40-35-30-25-20-15-10
-505
10152025
199
6q1
199
6q1I
I
199
7q1
199
7q1I
I
199
8q1
199
8q1I
I
199
9q1
199
9q1I
I
200
0q1
200
0q1I
I
200
1q1
200
1q1I
I
200
2q1
200
2q1I
I
200
3q1
200
3q1I
I
200
4q1
200
4q1I
I
200
5q1
200
5q1I
I
200
6q1
Economy Agriculture Energy ManufacturingConstruction Market services Non-market services
Source: Instituto Nacional de Estadística
Conclusions
The current expansion of the Spanish economy is a good proof of the validity of the
Keynesian economic recipes. The positive performance in terms of GDP growth and
employment creation can be explained by a policy mix consisting in: an expansionary
monetary policy, a neutral-slightly tight fiscal policy and a voluntary wages policy.
Low, even negative, real interest rates are fuelling consumption and investment. The
high economic growth is generating a significant surplus in the public accounts, what, in
turn, is partially slowing down the economic growth through the operation of built-in
stabilizers. Finally, the voluntary wage moderation operating since 1997 is contributing
to accelerate the employment creation process and, consequently, to reduce the
unemployment rates.
However, this Keynesian-expansionary macroeconomic policy is not working in a
discretionary way. It is the high inflation rates the element that is making expansive a
(monetary) policy initially designed as restrictive or, at best, neutral policy.
27
In our opinion, the Spanish economic situation, therefore, offers to the EMU three
important lessons. The first one is that inflation can actually grease the wheels of the
economic activity. Higher inflation rates, above the target of the 2%, can lead to higher
rates of economic growth. This higher economic growth can be sustainable, since the
main constraint that can come from the higher inflation rates, the loss of
competitiveness and the problems in the balance of payment, is less significant in the
case of a monetary union, mainly if the bulk of the trade flows are with the rest of
members of the monetary union.
The second one is that a discretionary monetary policy can lead to higher rates of
economic growth. The expansionary monetary policy does not necessarily lead to rising
inflation rates if that monetary policy comes with a neutral fiscal policy that generates
fiscal surpluses through built-in stabilizers and with a wage policy that avoids higher
wage claims that could generate a wage-price spiral.
The third lesson is that the inflationary process is not only the result of an ‘inefficient’
or ‘rigid’ labour market that generates excessive wage growth. The Spanish case
illustrates the importance of two elements: first, the price-setting process and the
behaviour of mark-ups and, second, the structural features of working of some markets
closed to foreign and domestic competition. The traditional recipes like the fall of wages
and the tight monetary policy, in as much they do not act against the true causes of
inflation, will not correct the problem. Falling wages, as the current situation shows,
could simply lead to higher profits leaving unaffected the level and growth of prices. In
the case of monetary policy, if we could think of a domestic monetary policy, higher
interest rates could only lead to an adjustment in the level of employment, as a tool to
keep stable the rates of profits, and/or to lower level of activity.
References
Bank of Spain (2006) Annual Report 2005, Bank of Spain, Madrid.
Directorate-General for Economic and Financial Affairs, (2005) “Country study: Spain
in EMU: a virtuous long-lasting cycle?”, European Economy Occasional Papers, 14.
Directorate-General for Economic and Financial Affairs (2006) European Economy.
Public Finances in EMU 2006, (available at the website:
28
http://ec.europa.eu/economy_finance/publications/european_economy/public_finances2
006_en.htm)
Ferreiro, J. (2003) “Políticas de rentas y reformas laborales en España”, Revista del
Ministerio de Trabajo y Asuntos Sociales, Serie Economía y Sociología, nº 46, pp. 15-
40.
Ferreiro, J. and Gómez, C. (2006) “Permanent and temporary workers. The insider-
outsider model applied to the Spanish labour market”, Économie Appliquée, vol. LIX, nº
1, pp. 121-152.
Ferreiro, J. and Gomez, C. “New incomes policy in Spain”, in Hein, E., Heise, A.,
Truger, A. (eds.) European Economic Policies - Alternatives to Orthodox Analysis and
Policy Concepts, Metropolis, Marburg (forthcoming).
Ferreiro, J., Gómez, C. and Serrano,F. (2006) “Can miracles come to an end?.
Limitations of the current model of growth in Spain”, paper presented at the Workshop
on Growth and Employment in Europe, Oxford, 27th January.
Ferreiro, J. y Serrano, F. (2001a) “The economic policy of the Spanish Socialist
Governments 1982-1996”, en Arestis, P. y Sawyer, M. (eds.) The Economics of the
Third Way, Edward Elgar, Cheltenham, pp. 155-169.
Ferreiro, J. y Serrano, F. (2001b) “The economic policy of the Spanish Socialist
Governments 1982-1996”, International Papers in Political Economy, Vol. 8, No. 1.
Ferreiro, J. y Serrano, F. (2004) “The Economic Policy in Spain during the Decades of
the 1980s and the 1990s”, en Arestis, P. y Sawyer, M. (eds.) Neo-Liberal Economic
Policy, Edward Elgar, Cheltenham, pp. 117-157.
International Monetary Fund (2006a) “Spain: selected issues”, IMF Country Report, no.
06/213, June, IMF, Washington D.C.
International Monetary Fund (2006b) “IMF Executive Board concludes 2006 article IV
consultation with Spain”, IMF Public Information Notice, no. 06/65, June 14, 2006,
IMF: Washington D.C.
International Monetary Fund (2006c) “Spain: financial sector assessment program –
technical note – housing prices, housing debt, and financial stability.”, IMF Country
Report, no. 06/210, June, IMF, Washington D.C.
Marín, J. and Peñalosa, J. (1997), “Implicaciones del Marco Institucional y de la política
Presupuestaria para la Política Monetaria en España”, in Servicio de Estudios del Banco
de España, La Política Monetaria y la Inflación en España, pp. 181-221, Alianza
Editorial, Madrid.
29

OECD (2005) OECD Economic Surveys Spain 2005, OECD, Paris.
30