Embed Size (px)
Citation preview

Macroeconomic Outlook
10th Annual Waterways Symposium October 1-3, 2013

2
Synchronous Global Growth:
Lead by Emerged Economiesand Especially the U.S.
ora European Lead Collapse?a Chinese Hard Landing?

3

4
Focus On TheU.S. Economic Prospects
• Slow Growth With Headwinds
• 2014 “Organic Growth” Less Government
• Know the Rules / Not Like the Rules

5

6
Business InvestmentImproving

7

8

9

10
Organic Growth and Jobs:
Housing’s Role

11

12
Housing: Improvements
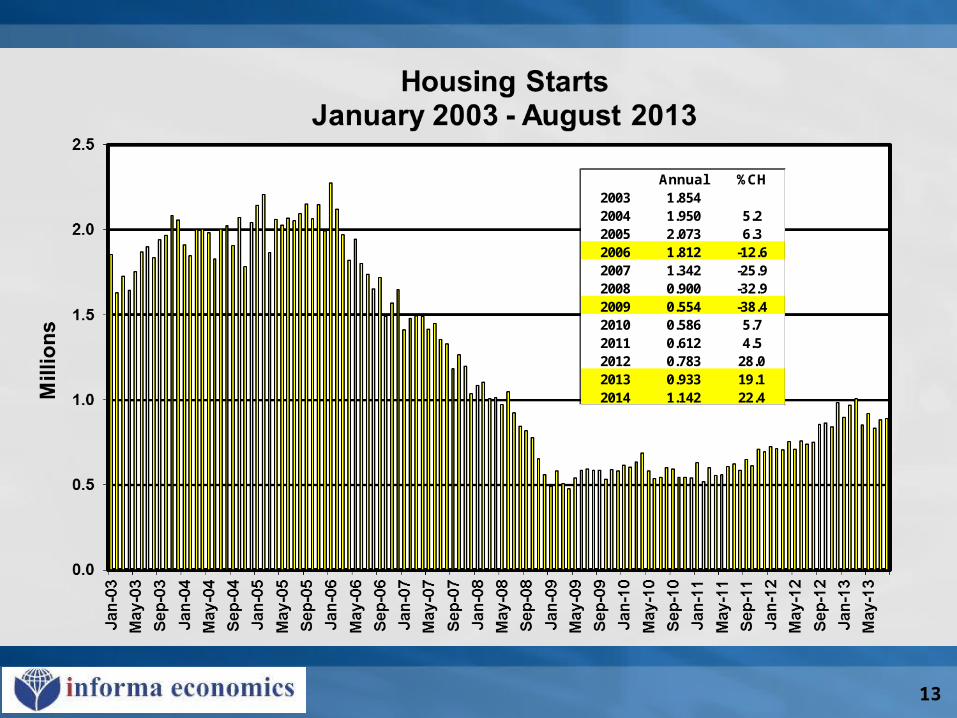
13
Annual %CH2003 1.8542004 1.950 5.22005 2.073 6.32006 1.812 -12.62007 1.342 -25.92008 0.900 -32.92009 0.554 -38.42010 0.586 5.72011 0.612 4.52012 0.783 28.02013 0.933 19.12014 1.142 22.4

14

15

16

17
We Keep Counting
On The Consumer
• Saving Less Now! Why?

18

19

20
%CH2003 16.62004 16.9 1.32005 17.0 0.52006 16.5 -2.62007 16.1 -2.52008 13.2 -18.02009 10.4 -21.22010 11.6 11.12011 12.7 10.22012 14.4 13.12013 15.5 7.62014 15.9 2.6
Vehicle Sales

21

22
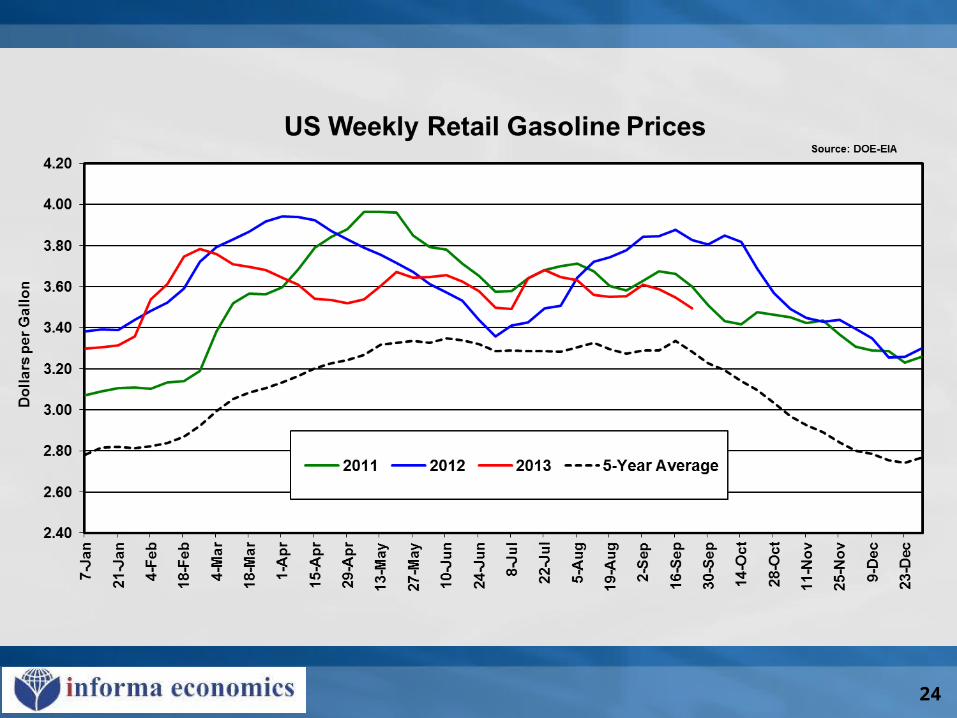
Gas Prices:
Help or Hindrance

23
24

25

26

27
Is Natural Gas America’s
“Ace In The Hole”?

28
Crude Oil and Natural GasPrice Relationships
• Recent Divergence
• Energy Implications
• Implications For Renewable Fuels

29
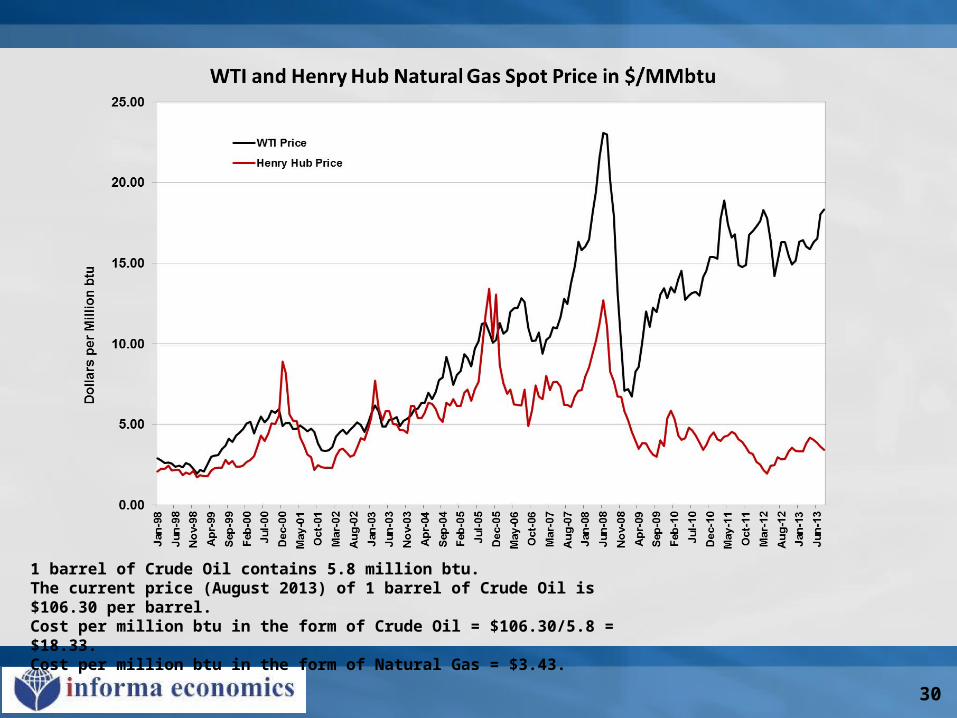
30
1 barrel of Crude Oil contains 5.8 million btu.The current price (August 2013) of 1 barrel of Crude Oil is $106.30 per barrel. Cost per million btu in the form of Crude Oil = $106.30/5.8 = $18.33.Cost per million btu in the form of Natural Gas = $3.43.

31

32
Liquidity Issues
Are Banks in Good Shape?
The Fed’s Policy Role?
The New Fed Chair?

33

34

35
Bernanke’s Watch:
Don’t Blame It On The Fed!
• Central Bank Accommodations
• Driven By The Data

36

37
Maturity
Inte
res
t R
ate
3M 2YR 5YR 10YR 30YR
NormalCurve
Normal Yield Curve
Maturity
Inte
res
t R
ate
3M 2YR 5YR 10YR 30YR
NormalCurve
Flattening Yield Curve
Maturity
Inte
res
t R
ate
3M 2YR 5YR 10YR 30YR
NormalCurve
Inverted Yield Curve
Yield Curve Background
The longer you lendmoney, the moremoney you want back in return.
Short RatesGain On
Long Rates
Long rates arebelow short rates; notpaying a risk premiumfor money lending.
FlatCurve
InvertedCurve

38

39

40

41
Federal Deficit
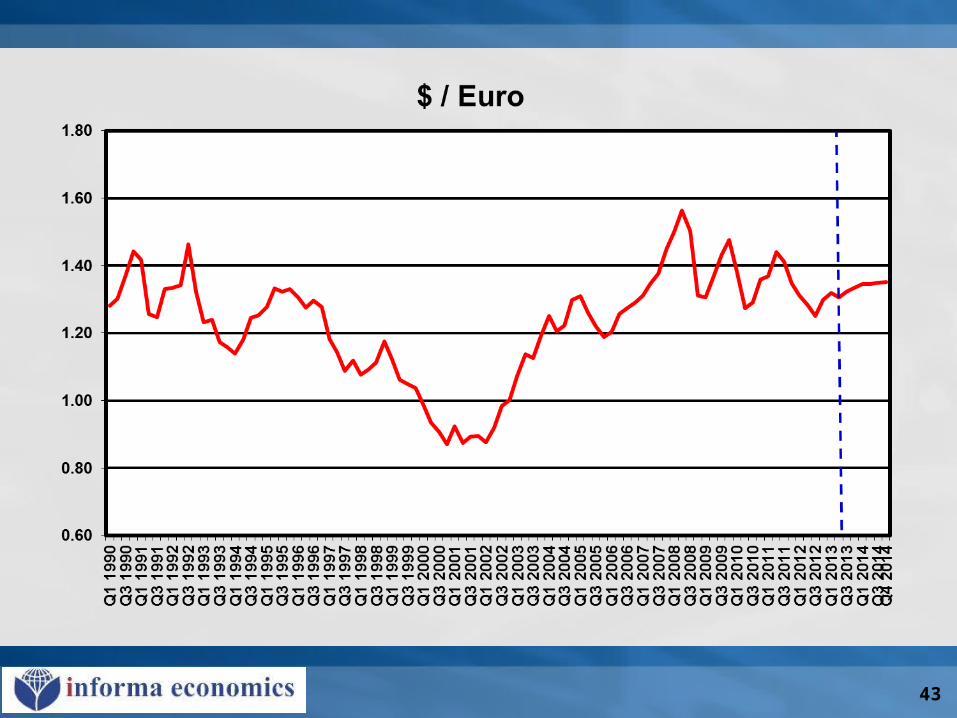
The Dollar and Trade

42
43

44

45
The Macroeconomic
Implications For Commodities
As An Asset Class

46

47
Summary and Questions