Embed Size (px)
DESCRIPTION
Document is also available at the Bangko Sentral ng Pilipinas Website :)
Citation preview
Bangko Sentral ng Pilipinas BSP Working Paper Series
Center for Monetary and Financial Policy Monetary Policy Sub‐Sector
The Macroeconomic Effects of Basel III Implementation in the Philippines: A Preliminary Assessment Hazel C. Parcon‐Santos and Eufrocinio M. Bernabe, Jr.
October 2012
Series No. 2012‐02
The BSP Working Paper Series constitutes studies that are prelimi‐nary and subject to further revisions. They are being circulated in a limited number of copies for the purpose of soliciting comments and suggestions for further refinements. The views and opinions expressed are those of the author(s) and do not necessarily reflect those of the Bangko Sentral ng Pilipinas. Not for quotation without permission from author(s) and the Bangko Sentral ng Pilipinas.

The Macroeconomic Effects of Basel III Implementation in the Philippines: A Preliminary Assessment
Abstract This study gives a general and preliminary assessment of the macroeconomic impact
of implementing Basel III in the Philippines. The new framework seeks to significantly increase the quality and required level of banks’ capital. Hence, it is expected to strengthen banks’ capacity to absorb risks and reduce the probability of future banking crises. Nevertheless, different strategies adopted by banks to meet the new rules—such as increasing lending rates—can impact negatively on the economy.
The cost of implementing Basel III is estimated from the impact of higher capital
requirement on GDP using an unrestricted VAR model, while the benefit is estimated using the expected default probability of banks. Results suggest that the higher capital requirements imposed by Basel III may have an initial negative impact on the Philippine economy. Nevertheless, the new requirements reduce the probability of a crisis. The estimated net effect of Basel III implementation in the Philippines is positive, albeit modest.
BSP Working Paper Series No. 2012‐02 1

The Macroeconomic Effects of Basel III Implementation in the Philippines: A Preliminary Assessment
The Macroeconomic Effects of Basel III Implementation in the Philippines:
A Preliminary Assessment
by Hazel C. Parcon‐Santos and Eufrocinio M. Bernabe, Jr.*
This version: 08 October 2012
1. Introduction
Since its establishment in 1974, the Basel Committee on Banking Supervision (BCBS) has formulated and recommended best practices for banking standards. The Basel Accords, in particular, are recommended banking regulations that put emphasis on capital measurement system.1 The basic principle in the Basel rules is that banks should have capital sufficient to cover for the risks they take.2
The first accord, Basel I, issued in 1988, has initially focused on credit risk, but was
subsequently refined to incorporate market risk. A further improvement was done with the release of the second accord – Basel II, which was released in 2004. The new framework was designed to better address financial innovation and to improve the way regulatory capital requirements reflect underlying risks.3 In addition, it covered operational risk4 and risk‐based supervisory framework.5
On December 16, 2010, the Basel Committee presented a new set of regulatory
framework for banks, the so‐called Basel III. The framework presents new and tougher rules for capital and liquidity in the banking sector and was intended to address problems that were made apparent by the 2008‐2009 financial crisis. Essentially, it aims to address both bank‐specific and systemic risks. The implementation of Basel III is expected to considerably increase the quality and required level of banks’ capital, thus strengthening banks’ capacity to absorb risks and reducing the risk of future banking crises.
The Philippine banking system is set to adopt the new capital requirements of Basel III by January 1, 2014.6 Various studies of the Bank for International Settlements (BIS) claim that the new rules will strengthen banks, making them better prepared against financial crises.7 However, the BIS studies as well as other cross‐country and country‐specific studies
* Hazel C. Parcon‐Santos and Eufrocinio M. Bernabe, Jr. are Bank Officers V at the Center for Monetary and Financial Policy, Bangko Sentral ng Pilipinas. Views expressed herein do not represent the views of the BSP. Errors and omissions are sole responsibilities of the authors. BSP Working Papers describe research in progress by the authors and are published to elicit comments and to further debate. 1 BCBS (2009) 2 Cao (2011) 3 BCBS (2009) 4 Defined as the "risk of loss resulting from inadequate or failed internal processes, people and systems, or from external events (Cao, 2011) 5 Cao (2011) 6 Under Resolution No.33 dated 5 January 2012, the Monetary Board of the BSP approved the Basel III implementation plans. Please refer to Appendix 1 for BSP Memorandum No. M‐2012‐002 (Implementation Plans for Basel III Standards on Minimum Capital Requirements). Basel III covers new rules for capital and liquidity in the banking sector. However, the BSP implementation plan does not cover the liquidity standards of Basel III. 7 BCBS (2010), MAG (2010a, 2010b, 2011)
BSP Working Paper Series No. 2012‐02 2
The Macroeconomic Effects of Basel III Implementation in the Philippines: A Preliminary Assessment
also reveal that as a consequence of higher capital requirements, banks may adopt different strategies that can have negative impacts on the economy.8 For instance, banks may respond by raising their lending spreads, which increases the borrowing costs of the private sector. This in turn may limit debt‐financed consumption and investment.
This study aims to give a general and preliminary assessment of the macroeconomic
impact of implementing Basel III in the Philippines. We consider this important since the banking system comprises about 80 percent of the total financial system in the Philippines.9 While Basel III may better prepare the Philippine banking system against financial crisis as what the BIS suggests, it may have significant macroeconomic effects.
We examine the macroeconomic impact of Basel III implementation by estimating its impact on the country’s GDP. While Basel III covers new rules for capital and liquidity in the banking sector, the BSP implementation plan so far only covers capital standards. Hence, what is being referred to in this study as Basel III standards implemented in the Philippines are only capital standards.
2. How does Basel III affect the macroeconomy? 2.1 Benefits and costs of the new framework The building blocks of Basel III are: (i) higher quality and level of capital, (ii) widened risk coverage, (iii) prevention of excessive leverage, (iv) stronger liquidity, (v) addressing of systemic risk, and (vi) higher standards for risk management and supervision.10 These are expected to enhance capital and liquidity regulations of the banking system and therefore reduce the intensity and frequency of financial crisis. Given that output losses from financial crisis can be substantial, as what past crisis episodes have shown,11 then, the primary benefit that can be derived from the new framework is the mitigation of adverse macroeconomic effects in terms of foregone output.
Based on several studies reviewed by the Macroeconomic Assessment Group12 of the Bank for International Settlements (MAG 2011), the cost of a crisis is 19% of pre‐crisis GDP if effect of a crisis is temporary while the average probability of a systemic crisis is 4.5% per year for any given country.13 Using this information on global systemically important banks (G‐SIB)14 in 14 countries,15 MAG estimated that that the Basel III framework would 8 See for instance IIF (2011), Cosimino and Hakura (2011) and Locarno (2011) 9 Based on total resources of the financial system as of December 2011 (Selected Philippine Economic Indicators) 10 BCBS (2010b) 11 See BCBS (2010a), Table A1.1 and A1.2 for a summary of past episodes of crisis and the estimated output losses. 12 MAG was primarily established to assess the transitional costs in meeting the additional capital and liquidity requirements of Basel III. 13 This is based on the survey of BCBS (2010a) of two articles, namely, Reinhart and Rogoff (2008) and Laeven and Valencia (2008). Both studies were published prior to the failure of Lehman. Countries covered in the study include Argentina, Australia, Belgium, Brazil, Canada, China, France, Germany, Hong Kong, India, Indonesia, Italy, Japan, Korea, Luxemburg, Mexico, Netherlands, Russia, Saudia Arabia, South Africa, Sweden, Switzerland, Turkey, United Kingdom and the United States. 14 The term “G‐SIBs” refers to those global systemically important financial institutions (G‐SIFIs) that are subject to banking regulation and supervision. The Basel Committee’s proposed standards are intended for G‐SIBs alone; other regulatory groupings are developing comparable standards for other categories of G‐SIFIs (MAG 2011).
BSP Working Paper Series No. 2012‐02 3

The Macroeconomic Effects of Basel III Implementation in the Philippines: A Preliminary Assessment
reduce crisis probability by 0.45% to 1.05% per year. Thus, the new guidelines would produce an annual benefit ranging from 0.09% (=0.45%*19%) to 0.20% (=1.05%*19%) of GDP.
Meanwhile, based on various studies examined by the Basel Committee on Banking
Supervision (BCBS 2010a) of the BIS, the median estimate of the cumulative discounted costs of crises is around 60% of pre‐crisis output when banking crises are allowed to have a permanent effect on real activity. Thus, each 1 percentage point reduction in the annual probability of a crisis yields an expected benefit per year equal to 0.6% of output. BCBS estimates of different models and methodologies consistently show significant reduction in the likelihood of a banking crisis at higher levels of capitalization and liquidity.16
Apart from the benefit of reducing the probability of a crisis, Angeline et al. (2011a) argue that tighter regulatory standards may also lead to smaller output fluctuations and, hence, higher welfare even in the absence of banking crises. Based on the various models estimated by Angeline et al. (2011a), a one percentage point increase in the capital‐to‐asset ratio reduces the standard deviation of output by 1.0 percent on average. Meanwhile, Angeline et al. (2011b) estimate that a 1% increase in capital reduces output variability in the range of 0.3‐2.7% relative to baseline.
Despite the benefits, higher capital requirements also come with costs. In banks’
attempt to meet the requirements, they may use a combination of strategies that may have adverse impact on aggregate macroeconomic activity.
In order to meet the new capital requirements, banks can:17
(i) issue new equity; (ii) increase retained earnings, by:
– reducing dividend payments; – increasing operating efficiency, including by reducing compensation and other costs; – raising average margins between borrowing and lending rates; – increasing non‐interest (fee) income;
(iii) reduce risk‐weighted assets, by: – lowering the size of loan portfolios; – tightening loan agreements; – reducing loan maturities; – reducing or selling non‐loan assets; – shifting balance sheet composition towards less risky assets.
15 Australia, Brazil, Canada, France, Germany, Italy, Japan, Korea, Mexico, the Netherlands, Spain, Switzerland, the United Kingdom and the United States 16 Haldane and Madouros (2012) take an extreme view by arguing that Basel III rules are too complex to become useful in averting bank failure. The complexity only encourages banks to reverse‐engineer products or transfer assets from one category to another, which leads to reduced resilience. Kay (2012) supports this by saying that the only value of these regulations is to give politicians and the public a sense that “something is being done”. Likewise, the IMF cautioned that the rules could raise incentives to develop new products to circumvent the framework and could push riskier activities into less regulated parts of the financial system (Jones and Masters, 2012). 17 MAG (2010a)
BSP Working Paper Series No. 2012‐02 4
The Macroeconomic Effects of Basel III Implementation in the Philippines: A Preliminary Assessment
According to MAG (2010a), banks are likely to use a combination of these methods. The choice may in part depend on the length of time over which capital needs to be increased. A longer implementation period will give banks more flexibility as regards the mechanisms they can use to achieve targets. Thus, if Basel III is implemented over longer periods, output effects are expected to be smaller than if implemented over shorter periods. The choice of strategy may likewise depend on the existing capital ratios banks have and the distance from the target. In addition, Cosimano and Hakura (2011) confirm that banks’ responses to higher capital requirements will vary considerably from one economy to another, reflecting cross‐country variations in the tightness of capital constraints, banks’ net cost of raising equity, and elasticities of loan demand with respect to changes in loan rates.
In its interim report, MAG (2010a) assumed that Basel III requirements will be achieved primarily through a combination of increases in lending spreads and a tightening of lending standards, particularly in riskier parts of loan portfolios. These will have an impact on the economy by reducing debt‐financed investment and consumption. In addition, MAG (2010a) expects that once the targets are achieved, lending spreads will gradually retrace some of the widening and lending standards will be relaxed. Averaging results of various empirical estimations from several countries,18 the interim report shows that a 1 percentage point increase in the target capital ratio implemented over four years will lead to a maximum reduction in GDP to a level 0.19% below its baseline level ‐ equivalent to a reduction in the annual growth rate of 0.04 percentage points over the period, followed by a gradual recovery of growth towards the baseline.
In its final report, MAG (2010b) results were presented in terms of the impact of the overall increase in bank capital that will be needed to meet the new Basel III requirements, instead of a generic one percentage point increase in target capital ratios. In addition, the implementation period is assumed to be eight years,19 instead of four years. The report estimated that banks will have to increase their capital by 1.3 percentage points to reach the overall capital ratio prescribed in Basel III.20 Meanwhile, a 1 percentage point increase in capital ratios would cause a shortfall in GDP of 0.17% during the eight‐year implementation scenario lower than the 0.19% estimate for the four‐year implementation period. Thus, the estimated accumulated cost of Basel III impact to GDP is 0.34% (=1.3*0.17%) for an eight‐year implementation scenario and 0.37% (=1.3*0.19%) for a four‐year implementation scenario. These impacts correspond to annual growth reductions of 4 and 9 basis points, respectively. Given these, MAG (2010b) concluded that Basel III accord would have a “relatively modest impact on growth.” 18 There are 13 countries and three multilateral institutions that submitted model estimation output to the Macroeconomic Assessment Group (MAG). The countries generally estimated results for their national economies except for Bank of Italy which produced an estimate for the euro area. The European Commission (EC) submitted a model output for the euro area. The European Central Bank (ECB) model output covered France, Germany, Italy, Netherlands, Spain and the euro area. The International Monetary Fund (IMF) estimated a global model, applying modeling techniques from 15 countries, and a Dynamic Stochastic General Equilibrium (DSGE) model with results for the United States and the euro area. 19 This is in line with the proposed implementation period of the group of Governors and Heads of Supervision (GHOS) of the Basel Committee (MAG 2010b). 20 This is based on the submissions of 13 countries and three multilateral institutions. Refer to footnote 18.
BSP Working Paper Series No. 2012‐02 5
The Macroeconomic Effects of Basel III Implementation in the Philippines: A Preliminary Assessment
A more recent report by the MAG (2011) combined the foregoing results with the increased capital requirements being proposed for G‐SIB. The analysis concluded that all components of the Basel III agreement would only reduce growth by a minor 0.34% in an eight‐year implementation scenario, lowering the annual growth by 0.04 percentage points during the period. The negative impact of higher capital requirements on GDP found by the MAG is supported by findings of other cross‐country and country‐specific studies. For instance, Slovik and Cournède (2011) found that over a five‐year implementation period, a 1 percentage point increase in capital ratios will reduce GDP relative to baseline by 0.19% in the United States, 0.30% in the Euro area and 0.11% in Japan. On average, GDP is estimated to decline by 0.20% relative to baseline, which translates to 0.04 reduction in annual growth for a period of 5 years. Similarly, Locarno (2011) found that for each percentage point increase in the capital ratio implemented over an eight‐year horizon in Italy, the level of GDP would decline by a maximum of 0.33%, corresponding to a reduction of the annual growth rate of output in the transition period of 0.04 percentage points. Likewise, Sy (2011) found that output in France will decline by a maximum of 0.30% relative to baseline. Angelini et al. (2011b) found relatively smaller impact, such that for each percentage point increase in the capital ratio, output declines by 0.09% relative to baseline. Using the case of the United States, Europe and Japan, Santos and Elliott (2012) argue that Basel III implementation will not significantly reduce lending or harm the economy due to banks’ ability to adapt to the regulatory changes without taking actions that would harm the wider economy. This is based on expectations that banks will be willing to absorb part of the higher costs by cutting expenses and that investors will reduce their required rate of return on bank equity modestly as a result of the safety improvements. Santos and Elliot (2012) likewise argue that even without the prospect of regulatory changes, financial institutions often carry significantly higher safety margins than the minimums required by the rules, because of their own desire to operate safely and due to pressure from the markets and rating agencies. In contrast to the foregoing, Basel III costs estimated by IIF (2011) are relatively large. Over a five‐year implementation period, Basel III reforms are estimated to reduce GDP relative to baseline by 2.7% in the United States, 3.0% in the Euro area, 4.0% in Japan, 5.5% in UK and 3.7% in Switzerland. On average, GDP would in five years time be about 3.2% lower than otherwise. United States is seen to be the least adversely affected among the countries in the study since its banking system has the least distance to the new regulatory norms and accounts for a smaller share of debt intermediation. A key difference between other studies and the IIF study that may explain the relatively large divergence in results is that the latter assumed that Basel III requirements will have spillover effects in non‐bank financial intermediaries. The higher lending costs in the banking system will lead to greater demand for credit in non‐bank intermediaries, resulting to higher lending costs in the latter. In addition, the IIF study recognized the jobs that would be lost as a result of the higher borrowing costs faced by the private sector.
BSP Working Paper Series No. 2012‐02 6
The Macroeconomic Effects of Basel III Implementation in the Philippines: A Preliminary Assessment
Studies on the impact of Basel III implementation on emerging economies (EMEs) are scant, but give qualitatively similar results as the studies covering advanced countries. In a study of 47 emerging countries, Abdel‐Baki (2012a) found that implementing Basel III in EMEs would hamper growth by more than 3 percentage points and that the recovery period from the shock would require 3 years and 2 quarters. Among EMEs, advanced EMEs21 are the most adversely affected relative to secondary22 and frontier23 emerging EMEs. Focusing on Egypt and Tunisia, Abdel‐Baki (2012b) found that Egypt is much less negatively impacted by Basel III implementation compared to Tunisia since its banking sector is adequately prepared to meet the new capital adequacy requirements. However, Egypt is slower to recover than Tunisia largely due to the higher borrowing costs in the former.
Though the estimated effects of Basel III on GDP differ across studies, the consistent
message is that higher capital and liquidity standards have both benefits and costs. Benefits come in the form of reduced crisis probability and output loss or variability, while costs come in the form of reduced GDP relative to baseline.24 The common caveat is that the actual benefits and costs could be different from the estimates as the results are sensitive to technical assumptions, including the model choice.25 In addition, the net impact will depend not only on the initial conditions of capital and liquidity, but on other conditioning variables used to estimate the models. Moreover, the difference in prevailing economic conditions across countries will add uncertainties in cost and benefit calculation. Nevertheless, regardless of the assumptions, models and results, majority of the studies argue that costs are still outweighed by benefits as the former will tend to be temporary while the latter are most likely to be permanent.
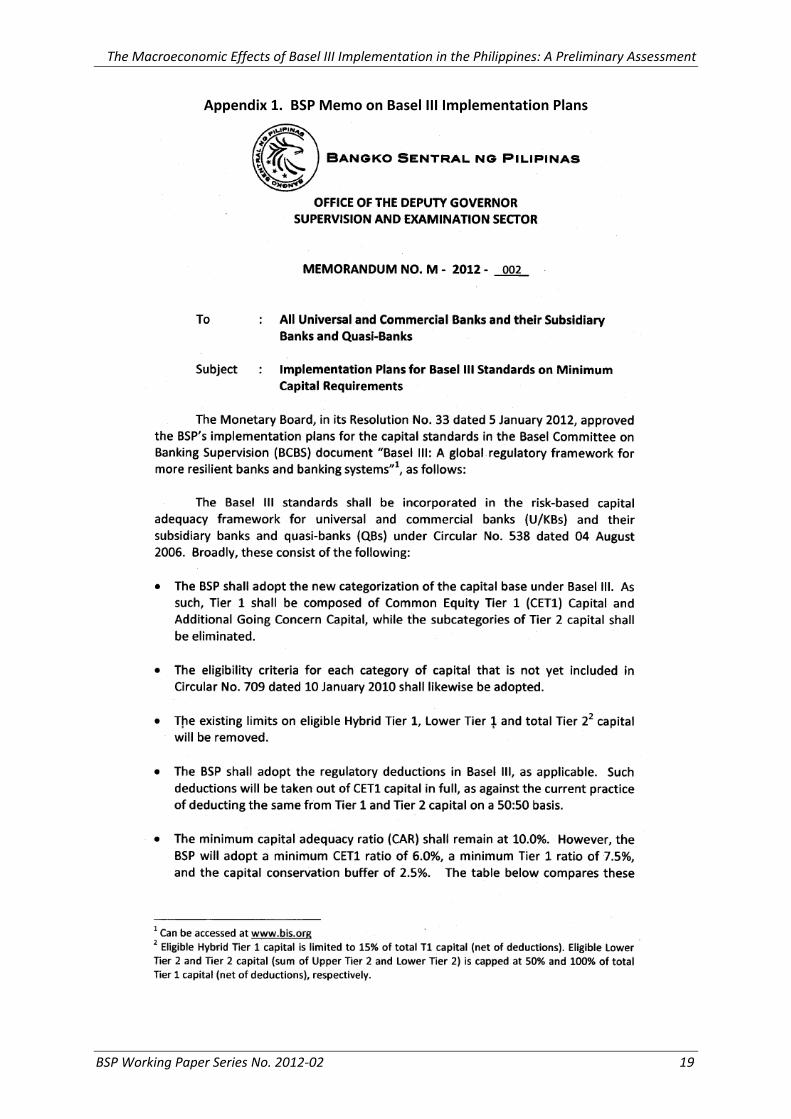
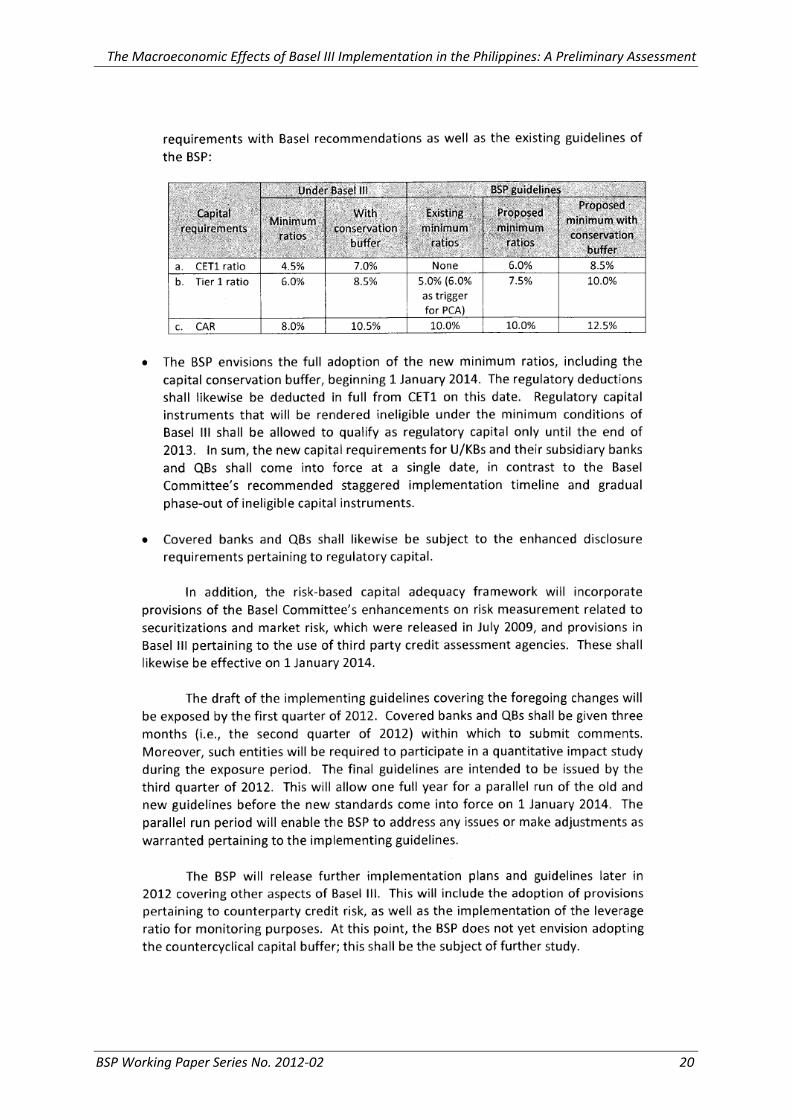
2.2 BSP implementation plans Table 1 displays the Basel III standards that shall be incorporated in the risk‐based capital adequacy framework for universal and commercial banks (U/KBs) and their subsidiary banks and quasi‐banks (QBs) for the Philippines. As approved under Monetary Board Resolution No. 33 dated 5 January 2012, the BSP has instructed concerned banks to fully adopt the new minimum ratios beginning 1 January 2014, which is in contrast to the Basel Committee’s recommended staggered implementation. In addition, while Basel III
21 Brazil, Czech Republic, Hungary, Malaysia, Mexico, Poland, South Africa, Taiwan, Turkey 22 Chile, China, Columbia, Egypt, India, Indonesia, Morocco, Pakistan, Peru, Philippines, Russia, Thailand, UAE 23 Argentina, Bahran, Bangladesh, Botswana, Bulgaria, Cote d’Ivoire, Croatia, Cyprus, Estonia, Jordan, Kenya, Lithuania, Macedonia, Malta, Mauritius, Nigeria, Oman, Qatar, Romania, Serbia, Slovakia, Sri Lanka, Tunisia, Vietnam 24 But not necessarily to initial conditions 25 MAG (2010a) provides several possible methods to quantify the impact of Basel III on the economy. First is through the use of a satellite model. In this approach, the impact of changes to regulatory requirements are modeled by considering the adjustments that banks make to their balance sheets to achieve a desired capital ratio. A key element of this methodology is the need for detailed bank level data. Second is the use of bank‐augmented DSGE models. An advantage of this method is that dynamic relationships among different macroeconomic variables can be captured while being grounded in microeconomic theory. However, DSGE models may be too stylized to fully capture the dynamics of the data and solving them may become challenging. Third is the use of past statistical relationships among capital, growth and other variables to estimate the likely growth effects of tighter capital and liquidity regulation, through the use of reduced‐form VAR models. An advantage of this approach is it does not rely on detailed ex‐ante modeling of the relationships among the variables of interest. However, a disadvantage is that the results are heavily influenced by the market and macroeconomic conditions in place at the time of large past shifts in the modeled variables, so they may not be informative if similar shifts take place under different circumstances.
BSP Working Paper Series No. 2012‐02 7
The Macroeconomic Effects of Basel III Implementation in the Philippines: A Preliminary Assessment
covers new rules for both capital and liquidity in the banking sector, the BSP implementation plan so far does not cover the liquidity standards of Basel III. The changes in the BSP guidelines were introduced to U/KBs in the first quarter of 2012. Simultaneous with the release of the draft guidelines, covered banks were requested to participate in the quantitative impact study during the exposure period. The final guidelines are intended to be issued by the third quarter of 2012.26
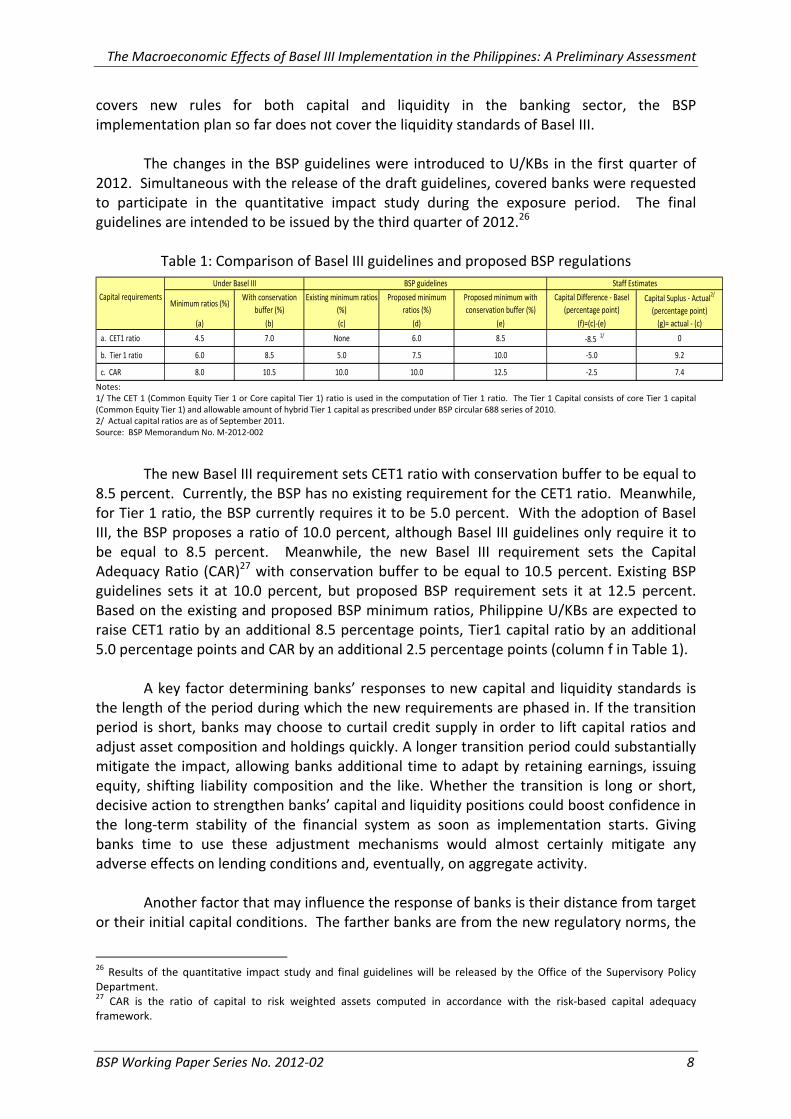
Table 1: Comparison of Basel III guidelines and proposed BSP regulations
Minimum ratios (%)With conservation
buffer (%)Existing minimum ratios
(%)Proposed minimum
ratios (%)Proposed minimum with conservation buffer (%)
Capital Difference ‐ Basel (percentage point)
Capital Suplus ‐ Actual2/
(percentage point)(a) (b) (c) (d) (e) (f)=(c)‐(e) (g)= actual ‐ (c)
a. CET1 ratio 4.5 7.0 None 6.0 8.5 ‐8.5 1/ 0
b. Tier 1 ratio 6.0 8.5 5.0 7.5 10.0 ‐5.0 9.2
c. CAR 8.0 10.5 10.0 10.0 12.5 ‐2.5 7.4
Staff EstimatesCapital requirements
Under Basel III BSP guidelines
Notes: 1/ The CET 1 (Common Equity Tier 1 or Core capital Tier 1) ratio is used in the computation of Tier 1 ratio. The Tier 1 Capital consists of core Tier 1 capital (Common Equity Tier 1) and allowable amount of hybrid Tier 1 capital as prescribed under BSP circular 688 series of 2010. 2/ Actual capital ratios are as of September 2011. Source: BSP Memorandum No. M‐2012‐002
The new Basel III requirement sets CET1 ratio with conservation buffer to be equal to 8.5 percent. Currently, the BSP has no existing requirement for the CET1 ratio. Meanwhile, for Tier 1 ratio, the BSP currently requires it to be 5.0 percent. With the adoption of Basel III, the BSP proposes a ratio of 10.0 percent, although Basel III guidelines only require it to be equal to 8.5 percent. Meanwhile, the new Basel III requirement sets the Capital Adequacy Ratio (CAR)27 with conservation buffer to be equal to 10.5 percent. Existing BSP guidelines sets it at 10.0 percent, but proposed BSP requirement sets it at 12.5 percent. Based on the existing and proposed BSP minimum ratios, Philippine U/KBs are expected to raise CET1 ratio by an additional 8.5 percentage points, Tier1 capital ratio by an additional 5.0 percentage points and CAR by an additional 2.5 percentage points (column f in Table 1). A key factor determining banks’ responses to new capital and liquidity standards is the length of the period during which the new requirements are phased in. If the transition period is short, banks may choose to curtail credit supply in order to lift capital ratios and adjust asset composition and holdings quickly. A longer transition period could substantially mitigate the impact, allowing banks additional time to adapt by retaining earnings, issuing equity, shifting liability composition and the like. Whether the transition is long or short, decisive action to strengthen banks’ capital and liquidity positions could boost confidence in the long‐term stability of the financial system as soon as implementation starts. Giving banks time to use these adjustment mechanisms would almost certainly mitigate any adverse effects on lending conditions and, eventually, on aggregate activity. Another factor that may influence the response of banks is their distance from target or their initial capital conditions. The farther banks are from the new regulatory norms, the
26 Results of the quantitative impact study and final guidelines will be released by the Office of the Supervisory Policy Department. 27 CAR is the ratio of capital to risk weighted assets computed in accordance with the risk‐based capital adequacy framework.
BSP Working Paper Series No. 2012‐02 8
The Macroeconomic Effects of Basel III Implementation in the Philippines: A Preliminary Assessment
greater adjustment that must be done, which can spell the magnitude of the impact on the aggregate economy. Though Basel III framework will not be implemented on a staggered basis in the Philippines, as what is being recommended by the Basel Committee, Philippine banks are considered to be well capitalized.28 In fact, based on the latest data (as of September 2011), Philippine banks’ capital ratios are above international norms.29 This behavior of keeping higher safety margins than what is actually required is considered common in financial institutions, as explained by Santos and Elliot (2012). Tier 1 capital ratio of the entire Philippine banking system is at 14.2 percent on a consolidated basis and CAR is at 17.4 percent. All segments of the banking system remain well capitalized. CAR of U/KBs, thrift banks and rural banks (including cooperatives) is at 17.4 percent, 16.5 percent and 18.6 percent, respectively. However, these ratios are based on Basel II framework. Since Basel III introduces enhanced and stricter definition of capital and risk‐weighted assets, these ratios may not necessarily hold under the new framework. 3. Data and Methodology
We assess the macroeconomic impact of Basel III implementation by estimating its cost and benefit on the real economy. To estimate the cost, we use an unrestricted VAR. As suggested by MAG (2010a), we use measures of bank capital, lending wedge30, aggregate bank loans to consumers and firms and economic output (real GDP). The first three are bank‐level data, while the last is country‐level data. Total capital and loan portfolio for each bank were obtained from their published balance sheets. Thirty three U/KBs were included in the sample, with period coverage of 2006‐2011.31 The use of VAR does not explicitly take into account the Basel III deficit of banks, but only considers how a unit change in capital may affect variables of concern. We consider this methodology useful since we do not have data on the exact capital deficit of individual banks. 32 Nevertheless, as mentioned earlier, based on existing requirements, capital ratios of Philippine banks are well above international norms. Similar to MAG (2010a), we assumed that higher capital funding costs are fully passed on to lending rates, which increases the lending wedge.33 As a result, firms and consumers may decrease their demand for loans, lowering debt‐financed investment and consumption, which eventually will lead to lower GDP growth. Thus, changes in bank capital will have an impact on real GDP growth by changing the lending wedge and/or total loan portfolio of banks. Nevertheless, loan portfolio of banks may increase as a result of bank’s
28 Cao (2011) 29 Based on the most recent media release of the BSP on CARs (27 April 2012), Philippine banks remain healthy as CARs persist above 10 percent. (http://www.bsp.gov.ph/publications/media.asp?id=2860) 30 The lending wedge is the difference between borrowing and lending rates. Data on the lending wedge can be approximated by the difference between central bank rates and lending rates in the market considered (MAG 2010a). This study uses the overnight RRP rate as the central bank rate and the average lending rates of UK/Bs as the lending rate. 31 Though there are 37 U/KBs, 4 banks were dropped from the sample due to too many missing data. 32 In order to estimate the capital deficit for individual banks, we need access to detailed balance sheet and income statement information including notes to financial statements. 33 MAG (2010a) mentions that in practice, banks may follow a combination of strategies to comply with higher capital requirements.
BSP Working Paper Series No. 2012‐02 9
The Macroeconomic Effects of Basel III Implementation in the Philippines: A Preliminary Assessment
efforts to comply with higher capital requirements since higher lending allows banks to earn higher interest income and accumulate retained earnings. The following VAR model of order p is used:
∆Yt = c + ΣAp∆Yt-p + vt (1) where Yt is an n x 1 vector of endogenous variables, Ap is a matrix of coefficients to be estimated, c is the intercept vector of the VAR, and vt is a generalization of a white noise process. The vector of endogenous variables includes changes in capital (DLCAPITAL), lending wedge (DLWEDGE), loan portfolio (DLLOANPORT) and real GDP (RGDPGR).34 VAR ordering is DLCAPITAL DLWEDGE DLLOANPORT RGDPGR. Since our interest is to investigate the impact of an increase in capital to the macroeconomy, DLCAPITAL is placed on top of the VAR ordering, followed by DLWEDGE and DLLOANPORT. RGDPGR is placed last in the ordering to allow DLCAPTIAL to have the maximum opportunity to affect it through several channels.35 A dummy variable, CRISIS, is set equal to 1 for quarters Q12009‐Q42009 (0, otherwise) to control for the impact of the global crisis in 2009.36
According to MAG (2010a), an advantage of using this approach is that many factors that need to be modeled separately by other estimation process are implicitly incorporated. However, since statistical relationships are estimated from historical data, they may not be fully informative about how economic actors will respond to future policy changes (the Lucas critique). Next, we estimate the benefit of strengthened capital through reduced crisis probability. The crisis probability is measured on the basis of individual bank’s expected default frequency. The latter provides an estimate of the probability that a firm will default within a given time horizon, based on equity prices and volatility, and balance sheet data. In this estimation, the crisis risk is specified as a function of a vector of bank‐specific characteristics. Two broad categories of factors are expected to influence crisis risk: a set of variables referring to the bank’s capacity to generate income and accumulate capital and a set of variables referring to the bank’s level of risk in the balance sheet. The benefit of higher capital requirement is estimated using:
∑∑∑=
−−=
−=
− ⋅⋅+⋅+⋅+=r
k
ikt
ikt
XK
q
k
ikt
RISKK
p
k
ikt
INCki
it XRISKRISKINCEDF
111)( ϕθθβα (2)
where EDF = expected default frequency of bank i at time t; INC = indicators referring to bank’s income capacity (return on equity (ROE), return on assets (ROA) and retained 34 Note that (1) is in differenced form. We initially tested for stationarity of the variables in level and found that we cannot reject the null hypothesis of a unit root process in the variables of concern. We next tested for cointegration of the variables using the Pedroni Residual Cointegration Test, but cannot reject the hypothesis of no cointegration. Hence, we transformed the variables by differencing to obtain stationary variables. Difference was calculated year‐on‐year. 35 Using Granger causality test, we confirmed that changes in capital Granger causes real GDP growth, but changes in real GDP growth do not Granger cause changes in capital. Hence, we are justified in placing DLCAPITAL first and RGDPGR last in the ordering. Based on various VAR lag order selection criteria (LR, FPR, AIC, SC and HQ), the optimal lag length is 8. 36 In these quarters, real GDP growth of the Philippines ranged from 0.5‐1.6 percent, way below the average of 4.4 percent for the entire sample period.
BSP Working Paper Series No. 2012‐02 10
The Macroeconomic Effects of Basel III Implementation in the Philippines: A Preliminary Assessment
earnings over total assets (RE)), RISK = indicators of risk from bank’s balance sheet (allowance for losses over net loans, loan write offs over net loans, risk assets over total assets), and X = structural indicators representing size (SIZE = total assets) and capital ratio (RATIO = Tier1 capital over total capital).
The interaction term between RISK and X makes it possible to analyze how the relationship between the perceived risk and bank characteristics changes with the size of the institution and its degree of capitalization. The market perception of risk in the balance sheet is magnified for large institutions if the coefficient Φsize in equation (2) is positive and significant. It is reduced by the degree of capitalization if the coefficient Φratio in equation (2) is negative and significant. Banks’ balance sheets, income statements and schedule of loans and receivables were gathered to obtain the required bank‐level data to estimate equation (2). These were obtained from the Bangko Sentral ng Pilipinas Financial Reporting Package (BSP FRP) database. Implementation of the BSP FRP began in 2008 only, which limited the period covered to 2008‐2011. This approach likewise requires the use of expected default frequencies of each bank to compute for the benefit analysis, which were obtained from Moody’s KMV.37 However, the expected default probabilities from Moody’s KMW are only available for 12 U/KBs in the Philippines.38 In contrast, the cost analysis included 33 U/KBs. Country‐level data were obtained from the National Statistical Coordination Board (NSCB) and the BSP.
MAG (2011) suggests the use of panel least squares to estimate (1). We consider the panel nature of our data and account for the possibility that there may be bank‐specific factors that are not captured by the model; hence, we use fixed effects estimation. Another consideration is that the EDF may affect bank behavior that alters the composition of bank’s balance sheet, leading to the problem of endogeneity. Using Granger causality test, we fail to reject the null hypothesis that EDF does not Granger cause income and risk factors. This provides some evidence that endogeneity is not a problem in the model.39
4. Estimated Macroeconomic Effects of Basel III for the Philippines MAG (2011) reports that higher capital may result to short‐term costs due to the adjustments that banks need to make in order to meet the requirements. Nevertheless, these costs should be weak or non‐existent in the long‐run. For the Philippine case, estimates confirm the possibility of short‐term costs.
37 Moody’s KMV is a wholly owned subsidiary of Moody’s Corporation. We acknowledge Mr. Dennis Botman for letting us use his data. 38 Hence, benefit calculation maybe underestimated. Nevertheless, the 12 banks comprise 62 percent of total assets of the U/K banking system. 39 We initially considered using quantile regression, which models conditional quantiles as functions of predictors (Koenker and Bassett, 1978). However, since our study only attempts to give a general assessment of the impact of Basel III implementation, we consider the use of conditional mean to suffice.
BSP Working Paper Series No. 2012‐02 11
The Macroeconomic Effects of Basel III Implementation in the Philippines: A Preliminary Assessment
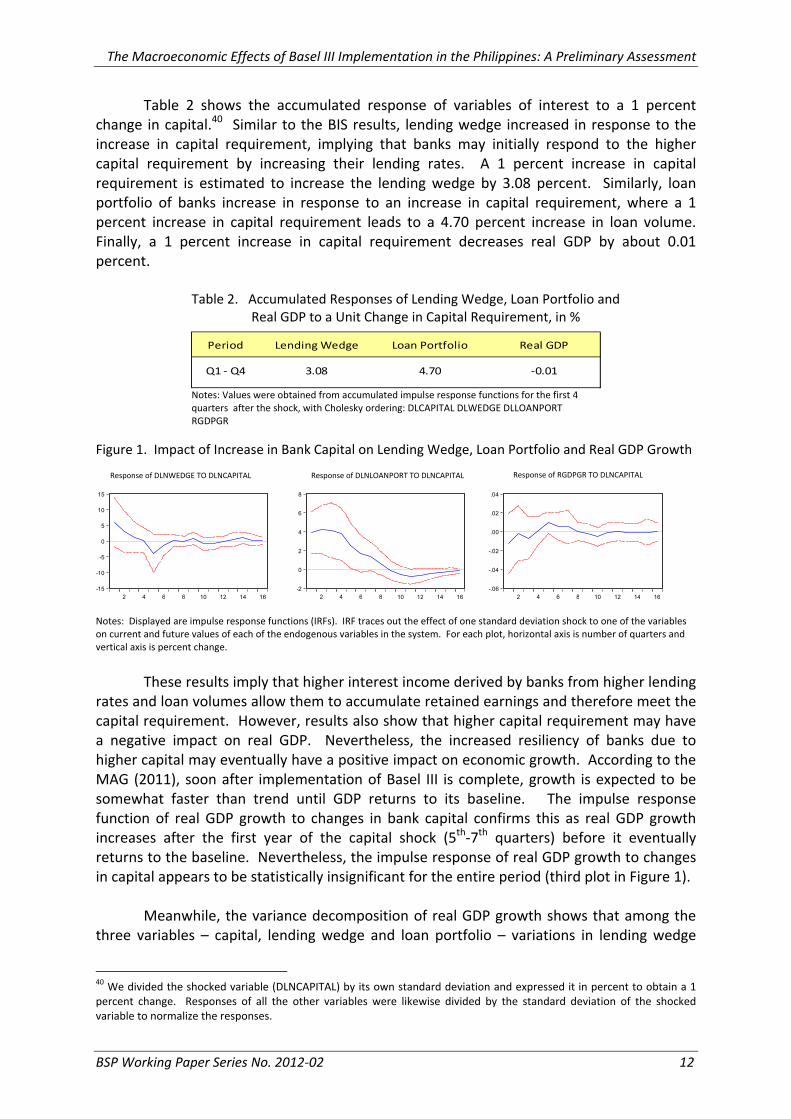
Table 2 shows the accumulated response of variables of interest to a 1 percent change in capital.40 Similar to the BIS results, lending wedge increased in response to the increase in capital requirement, implying that banks may initially respond to the higher capital requirement by increasing their lending rates. A 1 percent increase in capital requirement is estimated to increase the lending wedge by 3.08 percent. Similarly, loan portfolio of banks increase in response to an increase in capital requirement, where a 1 percent increase in capital requirement leads to a 4.70 percent increase in loan volume. Finally, a 1 percent increase in capital requirement decreases real GDP by about 0.01 percent.
Table 2. Accumulated Responses of Lending Wedge, Loan Portfolio and Real GDP to a Unit Change in Capital Requirement, in %
Period Lending Wedge Loan Portfolio Real GDP
Q1 ‐ Q4 3.08 4.70 ‐0.01
Notes: Values were obtained from accumulated impulse response functions for the first 4 quarters after the shock, with Cholesky ordering: DLCAPITAL DLWEDGE DLLOANPORT RGDPGR
Figure 1. Impact of Increase in Bank Capital on Lending Wedge, Loan Portfolio and Real GDP Growth
-15
-10
-5
0
5
10
15
2 4 6 8 10 12 14 16
Response of DLNWEDGE100 to DLNCAPITAL100
-2
0
2
4
6
8
2 4 6 8 10 12 14 16
Response of DLNLOANPORT100 to DLNCAPITAL100
-.06
-.04
-.02
.00
.02
.04
2 4 6 8 10 12 14 16
Response of RGDPGR to DLNCAPITAL100
Response to Cholesky One S.D. Innovations±2 S.E. Response of DLNWEDGE TO DLNCAPITAL Response of DLNLOANPORT TO DLNCAPITAL Response of RGDPGR TO DLNCAPITAL
Notes: Displayed are impulse response functions (IRFs). IRF traces out the effect of one standard deviation shock to one of the variables on current and future values of each of the endogenous variables in the system. For each plot, horizontal axis is number of quarters and vertical axis is percent change.
These results imply that higher interest income derived by banks from higher lending rates and loan volumes allow them to accumulate retained earnings and therefore meet the capital requirement. However, results also show that higher capital requirement may have a negative impact on real GDP. Nevertheless, the increased resiliency of banks due to higher capital may eventually have a positive impact on economic growth. According to the MAG (2011), soon after implementation of Basel III is complete, growth is expected to be somewhat faster than trend until GDP returns to its baseline. The impulse response function of real GDP growth to changes in bank capital confirms this as real GDP growth increases after the first year of the capital shock (5th‐7th quarters) before it eventually returns to the baseline. Nevertheless, the impulse response of real GDP growth to changes in capital appears to be statistically insignificant for the entire period (third plot in Figure 1). Meanwhile, the variance decomposition of real GDP growth shows that among the three variables – capital, lending wedge and loan portfolio – variations in lending wedge
40 We divided the shocked variable (DLNCAPITAL) by its own standard deviation and expressed it in percent to obtain a 1 percent change. Responses of all the other variables were likewise divided by the standard deviation of the shocked variable to normalize the responses.
BSP Working Paper Series No. 2012‐02 12
The Macroeconomic Effects of Basel III Implementation in the Philippines: A Preliminary Assessment
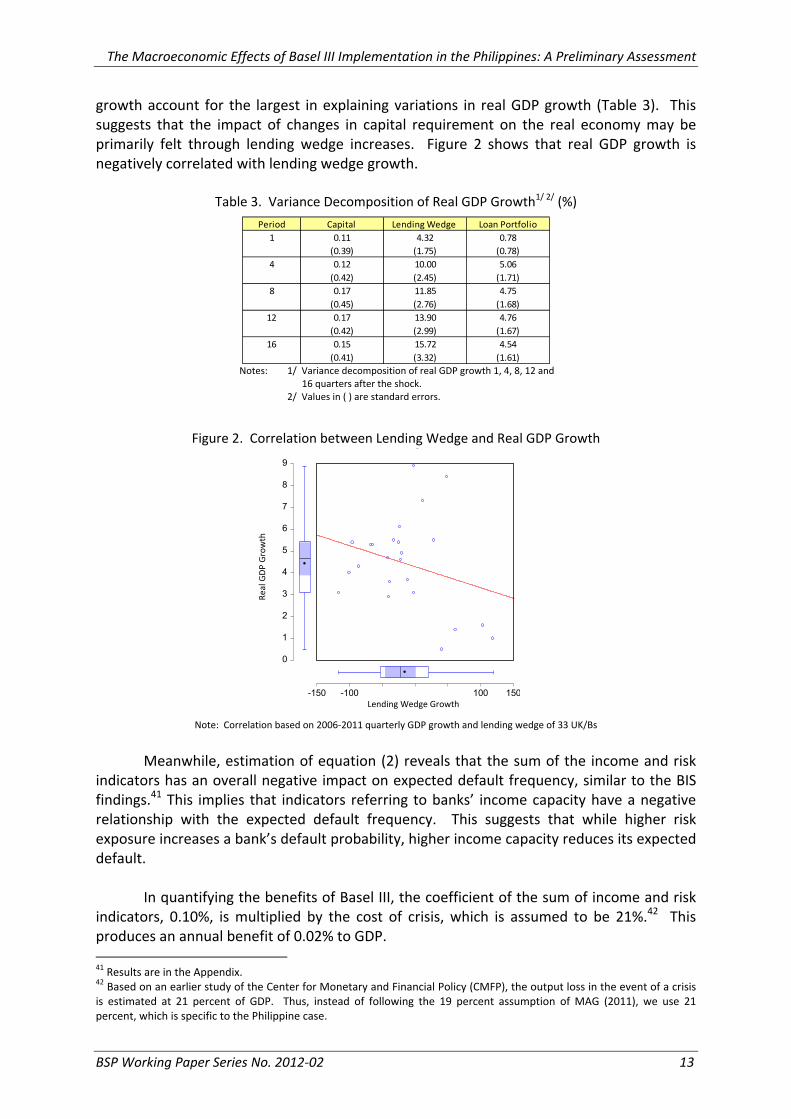
growth account for the largest in explaining variations in real GDP growth (Table 3). This suggests that the impact of changes in capital requirement on the real economy may be primarily felt through lending wedge increases. Figure 2 shows that real GDP growth is negatively correlated with lending wedge growth.
Table 3. Variance Decomposition of Real GDP Growth1/ 2/ (%)
Period Capital Lending Wedge Loan Portfolio1 0.11 4.32 0.78
(0.39) (1.75) (0.78)4 0.12 10.00 5.06
(0.42) (2.45) (1.71)8 0.17 11.85 4.75
(0.45) (2.76) (1.68)12 0.17 13.90 4.76
(0.42) (2.99) (1.67)16 0.15 15.72 4.54
(0.41) (3.32) (1.61) Notes: 1/ Variance decomposition of real GDP growth 1, 4, 8, 12 and 16 quarters after the shock.
2/ Values in ( ) are standard errors.
Figure 2. Correlation between Lending Wedge and Real GDP Growth
0
1
2
3
4
5
6
7
8
9
-150 -100 -50 0 50 100 150DLNWEDGE100
y
Lending Wedge Growth
Real GDP Growth
Note: Correlation based on 2006‐2011 quarterly GDP growth and lending wedge of 33 UK/Bs
Meanwhile, estimation of equation (2) reveals that the sum of the income and risk
indicators has an overall negative impact on expected default frequency, similar to the BIS findings.41 This implies that indicators referring to banks’ income capacity have a negative relationship with the expected default frequency. This suggests that while higher risk exposure increases a bank’s default probability, higher income capacity reduces its expected default.
In quantifying the benefits of Basel III, the coefficient of the sum of income and risk
indicators, 0.10%, is multiplied by the cost of crisis, which is assumed to be 21%.42 This produces an annual benefit of 0.02% to GDP. 41 Results are in the Appendix. 42 Based on an earlier study of the Center for Monetary and Financial Policy (CMFP), the output loss in the event of a crisis is estimated at 21 percent of GDP. Thus, instead of following the 19 percent assumption of MAG (2011), we use 21 percent, which is specific to the Philippine case.
BSP Working Paper Series No. 2012‐02 13

The Macroeconomic Effects of Basel III Implementation in the Philippines: A Preliminary Assessment
Results show that for the Philippines, higher capital requirements may have a negative impact on real GDP upon its implementation. Nevertheless, this may be offset by the benefit of strengthening banks, making them better prepared for financial crises and mitigating the output losses associated with them. Table 4 summarizes the estimated benefit, cost and net impact on GDP of meeting Basel III requirements.
Table 4. Macroeconomic Effect of Basel III in the Philippines
Benefit Cost Net Impact to GDP
0.10%*21% = 0.02% ‐0.01% 0.01%
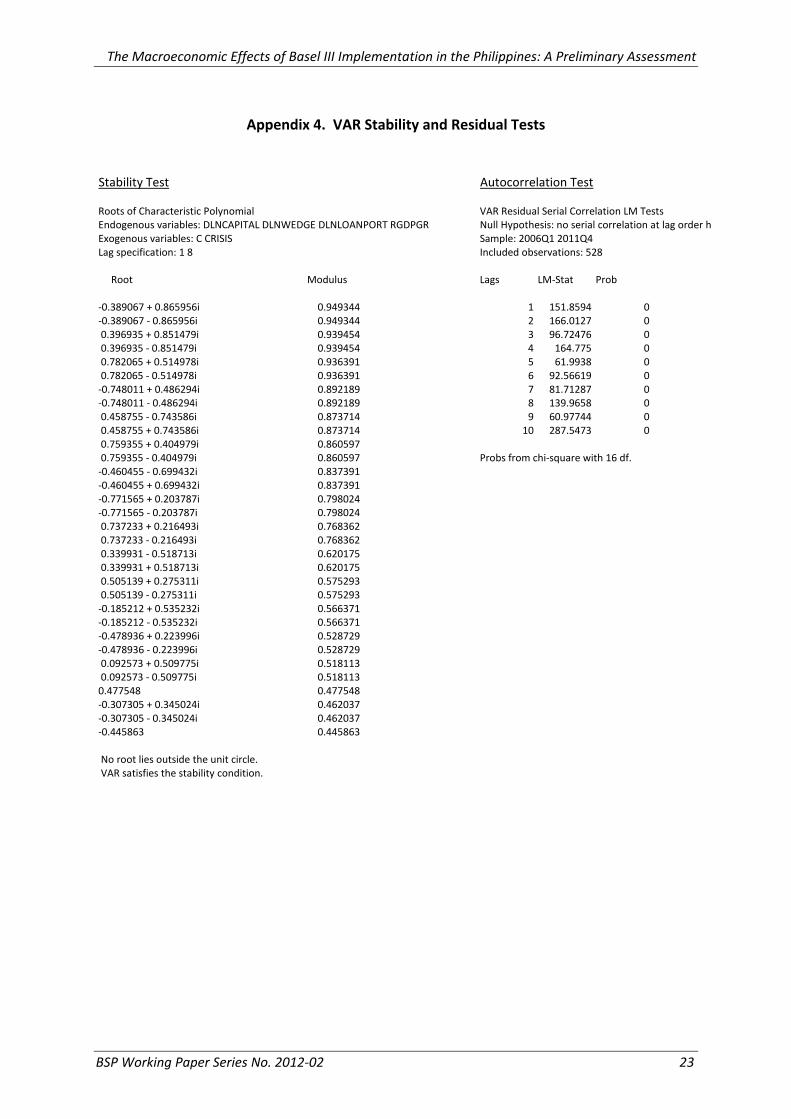
In contrast to other studies (see Appendix Table 3), the impact of Basel III implementation in the Philippines is relatively small and is positive. This may be due to the fact that Philippine U/KBs are already well‐capitalized, as mentioned earlier. Based on existing BSP guidelines, the actual capital ratios of Philippine U/KBs are about 7‐9 percentage points above the existing BSP minimum requirements (column g in Table 1).43 This implies that balance sheet adjustment of banks may not be sizeable in order to meet the new regulations. As a caveat, MAG (2010a) mentions that estimated impact of Basel III may differ from actual results since there may be factors not captured by the models used. For instance, international spillover effects can aggravate the negative impact since banks that lend across‐borders also need to comply with Basel III requirements. Or international spillover effects can possibly mitigate the negative impact of Basel III implementation; for instance, monetary easing by major central banks, such as the US Fed and ECB, could drive capital flows to and increase domestic liquidity in other economies that may temper increases in lending wedge. Likewise, the possibility that domestic monetary policy may be used to dampen any contractionary impact of the reforms on the macroeconomy and the use of other methods to meet capital requirements, apart from increasing lending rates, were not considered. 4.3 How robust are the results? MAG (2011) generally found that the VAR approach in estimating the macroeconomic effects of Basel III produced less stable and less reliable estimates than other approaches. While the AR Roots Table shows that our VAR is stable, the Autocorrelation LM Test reveals the presence of autocorrelation (See Appendix 4), which makes our estimates less precise.44 Nevertheless, we report the results with this caveat in mind.
43 As of September 2011 44 We have explored several means to reduce autocorrelation. Increasing the lag order beyond 10 makes the model unstable and does not eliminate autocorrelation. Adding dummy variables likewise do not significantly reduce the extent of autocorrelation.
BSP Working Paper Series No. 2012‐02 14
The Macroeconomic Effects of Basel III Implementation in the Philippines: A Preliminary Assessment
We exclude from the sample the top 10 U/KBs in terms of assets – these banks comprise 75 percent of the total assets of U/KBs – to eliminate the possibility that these top banks are driving the results of the VAR. Results are qualitatively similar to the results using the entire sample of 33 U/KBs.45
Next, we obtain an alternative measure of lending wedge by using each bank’s
weighted average interest rate on savings deposits instead of the central bank rate (RRP rate) as the borrowing rate. Results of the VAR similarly show that lending wedge and loan portfolio increase following an increase in capital requirement. More importantly, real GDP declined by the same magnitude (‐0.01 percent) as when the central bank rate was used. These results suggest that the findings from VAR are robust to changes in the measure of lending wedge.
Finally, we test whether it is appropriate to use cross‐section fixed effects in
estimating equation (2). Both the F‐test and the Chi‐square test strongly reject the null hypothesis that the cross‐section effects are redundant or unnecessary (See Appendix 2), suggesting that it is appropriate to use fixed effects estimation.
5. Conclusion
Basel III presents a new framework aimed to address both bank‐specific and systemic risks. Its implementation is expected to considerably increase the quality and required level of banks’ capital, as well as, strengthen banks’ capacity to absorb risks and reduce the risk of future banking crises. However, the higher capital requirements of Basel III may be implemented by banks in ways that can have a negative impact on the economy ‐ for instance, an increase in lending rates.
Based on our estimates, the higher capital requirements imposed by Basel III may
have an initial negative impact on the economy similar to results of other studies. Nevertheless, this is expected to be only temporary since once adjustment is done, real GDP is anticipated to return to its baseline. Moreover, the initial decline in GDP may not actually materialize since Philippine U/KBs are already well‐capitalized. On balance, the new Basel III framework is expected to further strengthen Philippine U/KBs and therefore produce the benefit of preventing output losses that are associated with financial crisis. On the policy side, since Basel III implementation is predicted to have a small and temporary negative impact on GDP, then it may be optimal for monetary policy not to respond. Nevertheless, if the actual impact is contrary to predicted and the negative impact is significant and prolonged, then appropriate monetary policy may be used to dampen any contractionary impact of the reforms. For instance, monetary easing could offset the probable negative impact of increase in lending wedge. Nonetheless, the short‐term negative impact on GDP may not actually materialize since banks may use strategies other than increasing lending rates to raise capital; for instance, issue new equity and shift to non‐interest (fee) income generating activities. In addition, though banks are still the primary source of funds in the Philippines, enterprises can shift to the capital market for
45 We likewise see an increase in lending wedge and decline in real GDP.
BSP Working Paper Series No. 2012‐02 15
The Macroeconomic Effects of Basel III Implementation in the Philippines: A Preliminary Assessment
funding needs. In such case, debt‐financed consumption and investment, and hence GDP may not necessarily be negatively affected. The results of our study are limited by the fact that we do not have detailed information on actual capital position of individual banks based on the new Basel III guidelines and the adjustments that they plan to undergo to meet the requirements. Hence, the results of our study may be confirmed by using these bank‐specific data. From thereon, more precise forecasts on the effects of Basel III in the economy can be made. Nevertheless, uncertainties on the reaction of markets and the monetary response remain, which may make the results of any study differ from actual results.
BSP Working Paper Series No. 2012‐02 16

The Macroeconomic Effects of Basel III Implementation in the Philippines: A Preliminary Assessment
References Abdel‐Baki, Monal A. (2012a). “The Impact of Basel III on Emerging Economies,” Global
Economy Journal, Volume 12, Issue 2. Abdel‐Baki, Monal A. (2012b). “Forecasting the Costs and Benefits of Implementing Basel III
for North African Emerging Economies: An Application to Egypt and Tunisia,” AFDB Economic Brief.
Angeline, Paulo, Laurent Clerc, Vasco Cúrdia, Leonardo Gambacorta, Andrea Gerali, Alberto
Locarno, Roberto Motto, Werner Roeger, Skander Van den Heuvel, and Jan Vlček (2011a). “Basel III: Long term impact on economic performance and fluctuations”, BIS Working Paper No. 338, February 2011.
Angeline, Paulo, Laurent Clerc, Vasco Cúrdia, Leonardo Gambacorta, Andrea Gerali, Alberto
Locarno, Roberto Motto, Werner Roeger, Skander Van den Heuvel, and Jan Vlček (2011b). “Basel III: Long term impact on economic performance and fluctuations”, Federal Reserve Bank of New York, No. 485, February 2011.
Basel Committee on Banking Supervision (2009). “History of the Basel Committee and its
Membership”, Bank for International Settlements, August 2009. Basel Committee on Banking Supervision (2010a). “An assessment of the long‐term
economic impact of stronger capital and liquidity requirements”, Bank for International Settlements, August 2010.
Basel Committee on Banking Supervision (2010b). “The Basel Committee's response to the
financial crisis: report to the G20", Bank for International Settlements, October 2010. Cao, Sergio (2011). “Basel III and Risk Mitigation in the Banking Sector,” paper presented in
the 4th Annual BSP‐UP Professorial Chair Lectures, 21–23 February 2011, Bangko Sentral ng Pilipinas Malate, Manila .
Cosimano, Thomas F. and Dalia S. Hakura (2011). “Bank Behavior in Response to Basel III: A
Cross‐Country Analysis,” IMF Working Paper 11/119, May 2011. Francis, William and Matthew Osborne (2009a). “On the Behaviour and Determinants of
Risk‐Based Capital Ratios: Revisiting the Evidence from UK Banking Institutions”, Financial Services Authority. Occasional Paper Series 31, March 2009.
Haldane, Andrew and Vasileios Madouros (2012). “The dog and the frisbee,” Bank of
England, 31 August 2012. Institute of International Finance (2011). “The Cumulative Impact on the Global Economy of
Changes in the Financial Regualtory Framework”. September 2011.
BSP Working Paper Series No. 2012‐02 17
The Macroeconomic Effects of Basel III Implementation in the Philippines: A Preliminary Assessment
Jones, Claire and Brooke Masters (2012). “IMF warns on Basel III rules,” Financial Times, 25 September 2012.
Kay, John (2012). “The law that explains the folly of bank regulation,” Financial Times, 12
September 2012. Koenker, Roger and Glibert Bassett, Jr. (1978). ”Regression Quantiles,” Econometrica,
Vol.46, No.1 (January 1978). Locarno, Alberto (2011). “The macroeconomic impact of Basel III on the Italian
economy”, Banca d’ Italia, No. 88, February 2011. Macroeconomic Assessment Group (2010a). “Interim Report: Assessing the macroeconomic
impact of the transition to stronger capital and liquidity requirements”, Bank for International Settlements, August 2010.
Macroeconomic Assessment Group (2010b). “Final Report: Assessing the macroeconomic
impact of the transition to stronger capital and liquidity requirements”, Bank for International Settlements, December 2010.
Macroeconomic Assessment Group (2011). “Assessment of the macroeconomic impact of
higher loss absorbency for global systemically important banks,” Bank for International Settlements, October 2011.
Santos, André Oliveira and Douglas Elliott (2012). “Estimating the Costs of Financial
Regulation,” IMF Staff Discussion Note, 11 September 2012. Slovik, Patrick and Boris Cournede (2009a). “Macroeconomic impact of Basel III”,
Organizational for Economic Cooperation and Development, February 2011. Slovik, Patrick and Boris Cournede (2009b). “Bank regulation, capital and credit supply:
Measuring the impact of Prudential Standards,” Financial Services Authority Occasional Paper Series 36, September 2009.
Sy, Amadou (2011). “The Macrofinancial Impact of Basel III Capital Requirements,” IMF
Selected Issues, 8 July 2011.
BSP Working Paper Series No. 2012‐02 18
The Macroeconomic Effects of Basel III Implementation in the Philippines: A Preliminary Assessment
Appendix 1. BSP Memo on Basel III Implementation Plans
BSP Working Paper Series No. 2012‐02 19
The Macroeconomic Effects of Basel III Implementation in the Philippines: A Preliminary Assessment
BSP Working Paper Series No. 2012‐02 20
The Macroeconomic Effects of Basel III Implementation in the Philippines: A Preliminary Assessment
BSP Working Paper Series No. 2012‐02 21
The Macroeconomic Effects of Basel III Implementation in the Philippines: A Preliminary Assessment
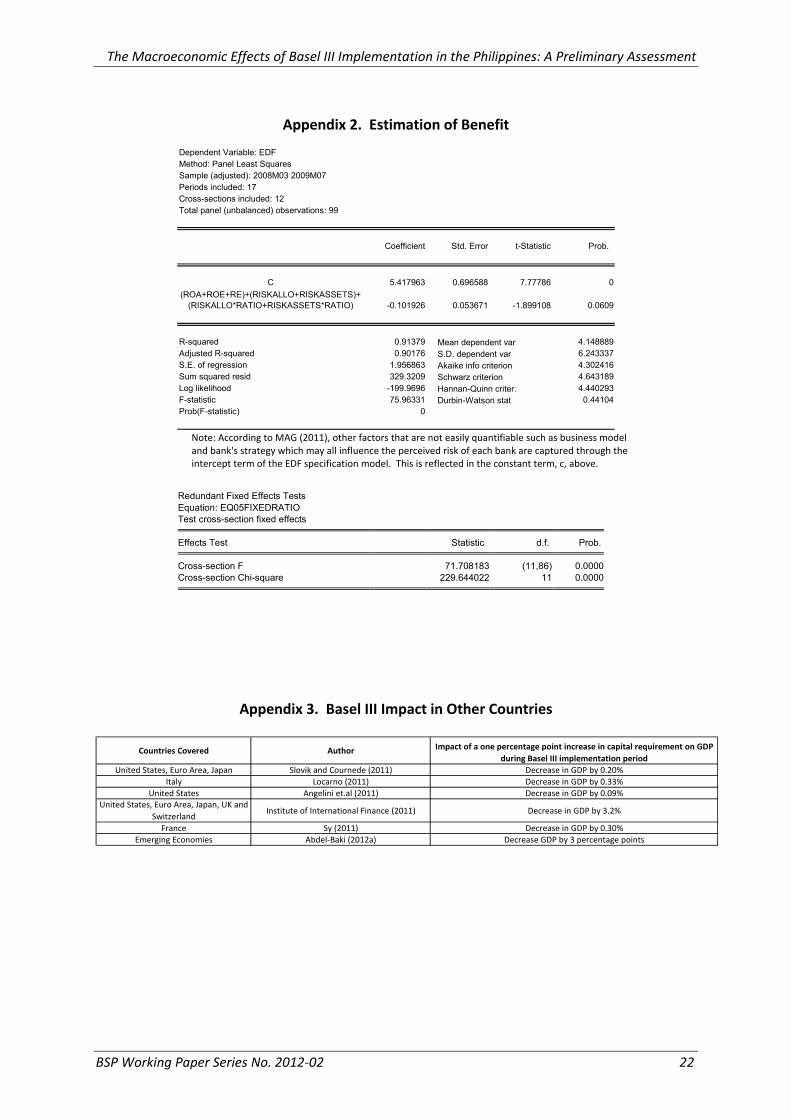
Appendix 2. Estimation of Benefit
Coefficient Std. Error t-Statistic Prob.
C 5.417963 0.696588 7.77786 0(ROA+ROE+RE)+(RISKALLO+RISKASSETS)+
(RISKALLO*RATIO+RISKASSETS*RATIO) -0.101926 0.053671 -1.899108 0.0609
R-squared 0.91379 4.148889Adjusted R-squared 0.90176 6.243337S.E. of regression 1.956863 4.302416Sum squared resid 329.3209 4.643189Log likelihood -199.9696 4.440293F-statistic 75.96331 0.44104Prob(F-statistic) 0
Dependent Variable: EDFMethod: Panel Least SquaresSample (adjusted): 2008M03 2009M07Periods included: 17Cross-sections included: 12Total panel (unbalanced) observations: 99
Mean dependent var S.D. dependent var Akaike info criterion Schwarz criterion Hannan-Quinn criter. Durbin-Watson stat
Note: According to MAG (2011), other factors that are not easily quantifiable such as business model and bank's strategy which may all influence the perceived risk of each bank are captured through the intercept term of the EDF specification model. This is reflected in the constant term, c, above.
Redundant Fixed Effects Tests Equation: EQ05FIXEDRATIO Test cross-section fixed effects
Effects Test Statistic d.f. Prob.
Cross-section F 71.708183 (11,86) 0.0000 Cross-section Chi-square 229.644022 11 0.0000
Appendix 3. Basel III Impact in Other Countries
Countries Covered Author Impact of a one percentage point increase in capital requirement on GDP during Basel III implementation period
United States, Euro Area, Japan Slovik and Cournede (2011) Decrease in GDP by 0.20%Italy Locarno (2011) Decrease in GDP by 0.33%
United States Angelini et.al (2011) Decrease in GDP by 0.09%United States, Euro Area, Japan, UK and
SwitzerlandInstitute of International Finance (2011) Decrease in GDP by 3.2%
France Sy (2011) Decrease in GDP by 0.30%Emerging Economies Abdel‐Baki (2012a) Decrease GDP by 3 percentage points
BSP Working Paper Series No. 2012‐02 22
The Macroeconomic Effects of Basel III Implementation in the Philippines: A Preliminary Assessment
Appendix 4. VAR Stability and Residual Tests
Stability Test Autocorrelation Test
Roots of Characteristic Polynomial VAR Residual Serial Correlation LM TestsEndogenous variables: DLNCAPITAL DLNWEDGE DLNLOANPORT RGDPGR Null Hypothesis: no serial correlation at lag order hExogenous variables: C CRISIS Sample: 2006Q1 2011Q4Lag specification: 1 8 Included observations: 528
Root Modulus Lags LM‐Stat Prob
‐0.389067 + 0.865956i 0.949344 1 151.8594 0‐0.389067 ‐ 0.865956i 0.949344 2 166.0127 0 0.396935 + 0.851479i 0.939454 3 96.72476 0 0.396935 ‐ 0.851479i 0.939454 4 164.775 0 0.782065 + 0.514978i 0.936391 5 61.9938 0 0.782065 ‐ 0.514978i 0.936391 6 92.56619 0‐0.748011 + 0.486294i 0.892189 7 81.71287 0‐0.748011 ‐ 0.486294i 0.892189 8 139.9658 0 0.458755 ‐ 0.743586i 0.873714 9 60.97744 0 0.458755 + 0.743586i 0.873714 10 287.5473 0 0.759355 + 0.404979i 0.860597 0.759355 ‐ 0.404979i 0.860597 Probs from chi‐square with 16 df.‐0.460455 ‐ 0.699432i 0.837391‐0.460455 + 0.699432i 0.837391‐0.771565 + 0.203787i 0.798024‐0.771565 ‐ 0.203787i 0.798024 0.737233 + 0.216493i 0.768362 0.737233 ‐ 0.216493i 0.768362 0.339931 ‐ 0.518713i 0.620175 0.339931 + 0.518713i 0.620175 0.505139 + 0.275311i 0.575293 0.505139 ‐ 0.275311i 0.575293‐0.185212 + 0.535232i 0.566371‐0.185212 ‐ 0.535232i 0.566371‐0.478936 + 0.223996i 0.528729‐0.478936 ‐ 0.223996i 0.528729 0.092573 + 0.509775i 0.518113 0.092573 ‐ 0.509775i 0.5181130.477548 0.477548‐0.307305 + 0.345024i 0.462037‐0.307305 ‐ 0.345024i 0.462037‐0.445863 0.445863
No root lies outside the unit circle. VAR satisfies the stability condition.
BSP Working Paper Series No. 2012‐02 23


![Yes [ / ] No [ ] · Philippines and, accordingly, is well-positioned to capture emerging consumer markets and take advantage of the continuing macroeconomic growth in the Philippines,](https://img.dokumen.tips/doc/110x75/5e8be609360624295a65008a/yes-no-philippines-and-accordingly-is-well-positioned-to-capture-emerging.jpg)