Embed Size (px)
Citation preview

Macroeconomic Determinants of Vietnam’s Inflation 2000-2010: Evidence and Analysis
Nguyen Thi Thu Hang
Nguyen Duc Thanh
© 2010 Vietnam Centre for Economic and Policy Research University of Economics and Business, Vietnam National University Hanoi

Macroeconomic Determinants of Vietnam’s Inflation 2000-2010: Evidence and Analysis
i
Acknowledgements First, we would like to thank Alex Warren-Rodriguez for his continuous guidance and support throughout the work of this report, and also UNDP Vietnam for giving us the opportunity to conduct this study. This study was carried out under the consulting contract between VEPR and UNDP Vietnam. The preparation of this study would not have been possible without the help of many people. We would like to thank Nguyen Ngoc Binh, Pham Tuyet Mai, and our colleagues at VEPR for their support and assistance. Special thanks to Vu Pham Hai Dang, Pham The Anh and Vu Quoc Huy for their critical comments and guidance.
Disclaimer This paper should not be reported as representing the views of VEPR. The views expressed in this report are those of the authors and do not necessarily represent those of VEPR, United Nations, including UNDP, or their Member States.. All errors and mistakes are made by authors only. For comments and suggestions, please contact us at [email protected].
December 12, 2010

Macroeconomic Determinants of Vietnam’s Inflation 2000-2010: Evidence and Analysis
ii
Contents Policy Research Note .............................. ................................................................................. 1
Introduction ...................................... ......................................................................................... 4
Overview of Vietnamese Economy and Inflation Dynami cs, 2000-2010 ................................ 5
Overview of Vietnam’s economy ................................................................................................. 5 Vietnam’s inflation dynamics with key changes in policy and economic environment ................ 11
Literature Review on Macroeconomic Determinants of Inflation ........................................ 17
International Research .............................................................................................................. 17 Previous Studies on Vietnam’s Inflation .................................................................................... 20
Analysis of Key Macroeconomic Determinants of Vietn am’s Inflation ............................... 22
The model ................................................................................................................................. 22 Data .......................................................................................................................................... 26 Conventional data series ........................................................................................................ 26 Less conventional data ........................................................................................................... 27 Tests ......................................................................................................................................... 27 Unit-root Tests ........................................................................................................................ 27 Cointegration Tests ................................................................................................................ 28 Results of Vector Error Correction Model (VECM) .................................................................... 28 The base line model ............................................................................................................... 28 The extended model ............................................................................................................... 29 Variance decomposition ......................................................................................................... 30 Impulse Response Functions ................................................................................................. 31
Policy Discussion and Concluding Remarks .......... .............................................................. 31
Policy discussion....................................................................................................................... 31 Concluding remarks .................................................................................................................. 33
References ........................................ ...................................................................................... 34
Appendices ........................................ ..................................................................................... 37
Figures
Figure 1. Economic Growth and Inflation, 1995-2009 .................................................................. 5
Figure 2. GDP Growth Rate Contribution by Sector, 1996-2009 ................................................. 6
Figure 3. Industry Shares in GDP at Constant Price, 2000-2009 ................................................. 7
Figure 4. Revenues - Expenditures and Budget Deficits, 2000-2009........................................... 9
Figure 5. Public Debt and External Debt, 2000-2009 .................................................................. 9
Figure 6. Current Account Deficit and Foreign Exchange Reserves, 2000-2009 ....................... 10
Figure 7. Real and Nominal Exchange Rate VND/USD, 2000-2009 .......................................... 11
Figure 8. Vietnam’s inflation rate and nominal ER VND/USD, 1992-2009 ................................. 12
Figure 9. Vietnam’s inflation rate, money and credit growth rate, 1996-2009 ............................ 13
Figure 10. Inflation Rates of Vietnam and Selected Countries, 2000-2009 ................................ 14

Macroeconomic Determinants of Vietnam’s Inflation 2000-2010: Evidence and Analysis
iii
Figure 11. Vietnam’s Monthly Food and Non-Food CPI, 2000-2010, ........................................ 16
Figure 12. Vietnam’s monthly year-on year food and non-food inflation, 2000-2010 (%) ........... 17
Figure 13. Transmission Channels to Inflation .......................................................................... 25
Figure 1A. Innovations of data in log term, 2001-2010 .............................................................. 37
Figure 2A. Impulse response functions ..................................................................................... 50
Tables
Table 1. Industrial Output Growth by Ownership, 2005-2009 ...................................................... 7
Table 2. Growth Rate of Aggregate Demand’s Components, 2005-2009 .................................... 8
Table 3. Final Demand Components in GDP, 2005-2009 ............................................................ 8
Table 1A. Unit root test on variables at level ............................................................................. 39
Table 2A. Unit root test on variables at first difference .............................................................. 40
Table 3A. Johansen cointegration test on PPP relation ............................................................. 41
Table 4A. Johansen cointegration test on AD relation ............................................................... 42
Table 5A. Johansen cointegration test on AS relation ............................................................... 43
Table 6A. Baseline VECM results ............................................................................................. 44
Table 7A. Extended VECM results ............................................................................................ 46
Table 8A. Variance Decomposition of CPI ................................................................................ 49

Macroeconomic Determinants of Vietnam’s Inflation 2000-2010: Evidence and Analysis
iv
Abbreviations
ADF : Augmented Dickey-Fuller CPI : Consumer Price Index ER : Exchange Rate FDI : Foreign Direct Investment FII : Foreign Indirect Investment GSO : General Statistics Office Of Vietnam HCMC : Ho Chi Minh City IFS : International Financial Statistics IRRS : International Rice Research Institute IMF : International Monetary Fund M2 : Broad Money MoF : Ministry of Finance NKPC : New-Keynesian Phillips Curve PI : Import Price Index PPI : Producers’ Price Index PPP : Purchasing Power Parity SBV : State Bank of Vietnam SOCB : State-owned Commercial Bank UNDP : United Nations Development Programme USD : United States dollar VAR : Vector Autoregression VECM : Vector Error Correction Model VND : Vietnam dong WB World Bank WTO : World Trade Organization

Macroeconomic Determinants of Vietnam’s Inflation 2000-2010: Evidence and Analysis
1
Policy Research Note As macroeconomic stability is the key item on Vietnam’s policy agenda in 2010, inflation is one of the four most pressing issues regarding macroeconomic stability at the moment (together with exchange rate management, budget deficits and trade deficit). For more than two decades now, inflation, especially its determinants and evolution, has been one of the most debatable topics in Vietnam. The reason is obvious: Vietnam underwent hyperinflation during the 1980s and early 1990. The persistent hyperinflation was one of the reasons that triggered the economic reforms in Vietnam since late 1980s. With the only exception during 2000-2003 when inflation was low and stable at 5% or below, inflation rate in Vietnam has been higher, more persistent and more volatile than those of its trading partners. Understanding the causes and consequences of these issues is essential for assessing the impact of macroeconomic policy on the economy. Recent events such as the joining the WTO, the great influx of foreign exchange in 2007-2008, the problems in the foreign exchange markets in 2009 and 2010 and the global economic crisis as well as the threat of returning inflation have posed many new challenges for macroeconomic management and in particular inflation control in Vietnam. These many changes in macroeconomic environment and economic policy during the past few years have posed the need for a systematic and thorough approach to identify the key macro determinants of inflation in the new context of Vietnam. In this study, we use an evidence based approach to identify and analyze the key drivers of inflation in Vietnam in recent years. The literature on inflation in Vietnam, which is mainly not up-to-date with recent events and changes, focuses on the demand-pull factors of inflation and ignores the cost-push factors. The only consideration for supply side factors is the inclusion of world prices (often as external supply shock). Also, one important demand factor that has not been studied (quantitatively) is the role of budget deficit and public debt on inflation. The study is expected to provide the current policy debates in Vietnam with a reliable, scientific and evidence-based macroeconomic research on the main causes of inflation. As controlling inflation is one of the key concerns of the policy agenda this year and the next, this study hopes to clarify the problem and contribute to the macro policy making process.
We start the study with a short overview of the Vietnamese economy over the past decade as well as a historical review of inflation dynamics in Vietnam during 2000-2010. The observations we receive from this overview combined with our thorough review of the literature on inflation determinants in Vietnam as well as in other emerging economies have helped us to build a model to study empirically the macroeconomic determinants of Vietnam’s inflation. The model used in the paper specifies three channels through which various endogenous and exogenous variables can affect prices. These channels are the purchasing power parity (PPP) channel, the aggregate demand (AD) channel and the aggregate supply (AS) channel. The model is built with 12 variables using monthly data of CPI, industrial production, money supply M2, credit, interest rate, exchange rate, producers’ price index PPI, cumulative budget deficits, trading value of the stock market, import price index, world oil price and world rice price over the period from 2000-2010. The variables are estimated using a Vector Error Correction Model. The empirical findings from the model provide useful policy insights. First, it is found that the role of the public’s memory and expectation on inflation are both crucial in shaping the current inflation. This implies the significant role of credibility of government’s policy toward inflation. Memory about a period of high inflation in the past seems only to begin to fade away after 6 months of consistently low and stable inflation. This implies that for fighting inflation, only by

Macroeconomic Determinants of Vietnam’s Inflation 2000-2010: Evidence and Analysis
2
successfully keeping inflation low for at least 6 months, can the government start to rebuild the public’s confidence about a more stable environment of the general price level. This is a good suggestion for the government to be patient in fighting inflation. Six months can be considered as a lower threshold for the government efforts to maintain a low inflation environment in order to rebuild its credibility concerning a serious commitment against inflation, and therefore macroeconomic stability. It is also shown that most of the changes in major macro variables (such as exchange rate, money and credit growth) affect the consumer price index several months before the producer price index. This implies the relative strength of expectation channel vs. the real channel (transmitting through the real production process). The combination of a long memory and sensitive expectation in affecting the inflation explains a fact that it is hard to fight inflation when it is high, and it is also hard to maintain price stable when it is low. In other words, inflation is very sensitive to the current conditions, especially those that can lead to changes in the public’s expectations. Low inflation is in fact an unstable or fragile condition, while high inflation tends to be self-containing in the Vietnamese economy. Second, despite the government’s common explanation that inflation is mostly imported, inflation is basically an internal problem. We find that the world prices tend to play a less significant role than other factors. The world prices, however, do have important effects on production prices. The production prices in fact do not intermediately transmit into consumer prices (inflation), but take some months to realize its impact. Third, the speeds of adjustment of the foreign exchange market and the money market to disturbances are very low or even near zero. This shows that once these markets deviate from the long-run trend, it will take a very long time for the economy to revert back on track despite policy efforts. This has an important implication for policy against inflation: preventive measures with clear guidelines and targets for inflations are much better choices than trying to cope with high inflation after it already started. Also, a wrong choice of policy action will be hard to correct and high inflation will last long. On the other hand, the speed of adjustment from disturbances in the supply side has higher (though still small) impact on inflation. Even though more careful experiments needed to be done with more data on the real side of the economy such as wages and input costs, this initial finding implies that stimulating the real economy through increasing productivity and output growth have better impact on controlling inflation in the longer run than monetary and non-monetary measures. Fourth, the government did have reactions against inflation by both fiscal and monetary tools, but normally acted lately or passively in most of the cases. For fiscal tools, it is rather easy to understand and accept the fact, as it takes time for an adjustment in fiscal plan to be approved and implemented. However, monetary tools are also seen as being carried out at a considerable lag after the first signals of inflation occur. This may be explained with the fact that inflation specification is always a controversial issue, where the government is very reluctant to accept the situation of inflation. The government usually blames the worse situation for some “objective” or “external” reasons. It therefore takes time to turn the inflation issue from the public’s consciousness to the government’s one, and thus an appropriate monetary reaction. For example, it is shown in the paper that in most of the cases, interest rates are adjusted following the changes in CPI after about 3 months. These adjustments are indeed to make the interest rates more comparable with the current inflation rather than to be an action of tightening monetary policy to fight against inflation. Even when a tightening monetary policy takes place, it takes more than 5 months in average to produce effects on the inflation. By that time, inflation rate has been high for 7 to 8 months. This

Macroeconomic Determinants of Vietnam’s Inflation 2000-2010: Evidence and Analysis
3
would have created a long memory on inflation and therefore the cost of fighting inflation will be high. It seems that among monetary tools, raising interest rate has a prompt effect on inflation in comparison with the money growth and credit tightening. However, the effect of a change in interest rate is rather weak. Therefore, the monetary tools are not a really ones for quick response as assumed. Fifth, in contrast to previous study results, the model found considerable role of exchange rate, a devaluation in particular, on increasing pressures on inflation. This difference in results may be explained partly by the fact that previous studies used data from periods when the exchange rate was mostly kept rigid. Recently, since late 2008, the exchange rate has been devaluated more often and with bigger magnitudes. In addition, recent episodes of distortions in the foreign exchange market, especially in the parallel black market, in 2009 and 2010 due to declining trust in VND, speculations and dollarization have increased public expectations about returning inflation. This may contribute to the larger impact of exchange rate on inflation found in this study. Finally, the study did not show clear impact of budget deficits on inflation during the study period. This does not mean that budget deficits have no inflationary pressures. The reason for this is that the financing of budget deficits has two opposing impacts on inflation. On the one hand, financing budget deficits through government borrowing increases interest rate due to higher demand for funds in the loan markets. This is equivalent to tightening monetary policy and thus helps reduce inflation to some extent. On the other hand, financing budget deficits through money creation (if any) is equivalent to expanding money supply and thus causes inflationary pressures. These two opposing forces mitigate and sometimes cancel out each other’s effect on inflation. From the above characteristics of inflation in Vietnam, one may come to a policy implication that the Vietnamese government should have a strong commitment not only in fighting against inflation when it is high, but also, and more importantly, in keeping it low when it is low. This strategy is actually hard to follow as far as the government still prefers economic growth to macroeconomic stability.

Macroeconomic Determinants of Vietnam’s Inflation 2000-2010: Evidence and Analysis
4
Introduction Macroeconomic stability is the key item on Vietnam’s policy agenda in 2010. Four most pressing issues regarding macroeconomic stability currently are: inflation, exchange rate management, trade deficits and budget deficits. These problems that Vietnam is facing are inter-related and need to be addressed simultaneously. For more than two decades now, inflation, especially its determinants and evolution, has been one of the most debatable topics in Vietnam. The reason is obvious: Vietnam underwent hyperinflation during the 1980s and early 1990. The persistent hyperinflation was one of the reasons that triggered the economic reforms in Vietnam since late 1980s. With the only exception during 2000-2003 when inflation was low and stable at 5% or below, inflation rate in Vietnam has been higher, more persistent and more volatile than those of its trading partners. Understanding the causes and consequences of these issues is essential for assessing the impact of macroeconomic policy on the economy. Vo Tri Thanh et.al. (2000), Carmen (2005), Packard (2005) and Baker et.al. (2006) are samples of comprehensive studies on monetary policy and inflation dynamics of the period before 2005. However, recent events such as the joining the WTO, the great influx of foreign exchange in 2007-2008, the problems in the foreign exchange markets in 2009 and 2010 and the global economic crisis as well as the threat of returning inflation have posed many new challenges for macroeconomic management and in particular inflation control in Vietnam. The recent debate on inflation, such as Pham The Anh (2009), Vo Van Minh (2009) and Pham Thi Thu Trang (2009), has been putting the blame on loose monetary policy, rigid exchange rate management, market imperfections, and changes in world prices and in domestic food prices for driving up consumer prices. The many changes in macroeconomic environment and economic policy during the past few years have posed the need for a systematic and thorough approach to identify the key macro determinants of inflation in the new context of Vietnam. In this study, we use an evidence based approach to identify and analyze the key drivers of inflation in Vietnam in recent years. The literature on inflation in Vietnam focuses mainly on the demand-pull factors of inflation and ignores the cost-push factors. The only consideration for supply side factors is the inclusion of world prices (often as external supply shock). Also, one important demand factor that has not been studied (quantitatively) is the role of budget deficit and public debt on inflation. The study is expected to provide the current policy debates in Vietnam with a reliable, scientific and evidence-based macroeconomic research on the main causes of inflation. As controlling inflation is one of the key concerns of the policy agenda this year and the next, this study hopes to clarify the problem and contribute to the macro policy making process. The paper is organized as follows. Section 2 provides a short overview of the Vietnamese economy over the past decade as well as a historical review of inflation dynamics in Vietnam during 2000-2010. Section 3 reviews the literature on inflation determinants in Vietnam as well as in other emerging economies. Section 4 outlines the theoretical framework, reports and discusses the empirical results. And the last Section provides some policy discussion and concluding remarks.

Macroeconomic Determinants of Vietnam’s Inflation 2000-2010: Evidence and Analysis
5
Overview of Vietnamese Economy and Inflation Dynamics, 2000-2010 Overview of Vietnam’s economy In comparison with the previous decade, Vietnam witnessed a period of low economic growth in the first decade of the 21st century. In the late 1990s, Vietnam’s economic growth slowed down due to Vietnam’s sign of hesitation in the process of economic reform from 1996. Concurrently, Vietnam was negatively affected by the spread of the 1997 Asian financial crisis. Consequently, the economy experienced a period of both declining growth rate and deflation in the years 1999-2001 (see Figure 1).
Figure 1. Economic Growth and Inflation, 1995-2009
Source: Authors synthesized from GSO (2010)
Under these circumstances, an economic stimulus plan of loosening credit and expanding State investment began to be implemented from 2000. In the following years, the relatively uninterrupted maintenance of the stimulus policy has somewhat helped the economy regain its growth on one hand, but has also agglomerated seeds of high inflation, which have been disclossured since mid-2007. In addition, joining the World Trade Organization (WTO) in 11/2006 led to a period of ever deepening integration, increasing trade exchange and international investment, and making a strong rise in capital influx (both direct and indirect investment). Demand for VND stability required State Bank of Vietnam to sterilize a large amount of foreign currency, thus contributing to high inflation in 2008. Overall, macro-control in this period proved embarrassing. These factors, together with the tremendous impact of the world economic crisis made the economy suffer a period of low economic growth and high inflation from 2008-2009.
-5
0
5
10
15
20
25
1995 1996 1997 1998 1999 2000 2001 2002 2003 2004 2005 2006 2007 2008 2009
Year
%
GDP Growth Inflation Rate

Macroeconomic Determinants of Vietnam’s Inflation 2000-2010: Evidence and Analysis
6
Figure 2. GDP Growth Rate Contribution by Sector, 1 996-2009
Source: Phạm Văn Hà (2010)
Figure 2 shows the level of contribution to GDP growth of the economy in the period 1996-2009 by major sub-sectors. It can be easily seen that for more than a decade services and the processing industries (manufacturing) have been a spring-board of economic growth. Due to the impact of the crisis, however, the contribution of the processing industry significantly decreased in 2009. Under the influence of economic stimulus packages, construction and services became the most important industries for growth. This is understandable because both industries, as non-trade industries, do not participate in international trade, and are thus the main objects of domestic stimulus policy. The third industry to become important was mining, due to the quick price recovery of raw materials and minerals, under great demand from China. That the mining industry became more important is not only pure chance in the context of recovery after the crisis, rather, as Coxhead (2007) has pointed out, it is likely to be part of a longer-term trend. It is the rise of China that has caused the Southeast Asian countries, which develop more slowly than China, to disperse from exporting processing goods, towards exporting resource-intensive goods. This is due to the attraction of price and profit from China's great demand. And he called it a "new resource curse”. Figure 3 shows the structural shift of GDP in the period of 2000-2009. Generally, the movement tendency matches common rules of the developing countries, with the narrowing rate of agriculture and expanding ones of services and industries.
-0.5
0.0
0.5
1.0
1.5
2.0
2.5
3.0
3.5
4.0
1996-2000 2001-2005 2006 2007 2008 2009
%
Agriculture MiningManufacturing Electricity, gas, water supplyConstruction Services

Macroeconomic Determinants of Vietnam’s Inflation 2000-2010: Evidence and Analysis
7
Figure 3. Industry Shares in GDP at Constant Price, 2000-2009
Source: Phạm Văn Hà (2010)
Table 1 provides information on the growth rate of industrial output growth by ownership. It can be seen very clearly that the domestic sector grew strongly, followed by the FDI sector. The growth of SOEs slowed down, especially local SOEs constantly narrowing in particular. This shows, to some extent, the process of economic restructuring in the direction of expanding both domestic and foreign invested sectors. The SOEs grew more slowly, concentrating more on the central (including corporations and economic groups).
Table 1. Industrial Output Growth by Ownership, 200 5-2009
Unit: % 2005 2006 2007 2008 2009
Total 17,1 16,8 16,7 13,9 7,6 SOEs 7,2 5,9 5 2,7 1,6 Central 12,4 8,9 6,8 4,8 4,1 Local -5,2 -2,9 -0,7 -4,5 -7,7 Non-State Sector 25,5 25,7 24,7 19,8 10,1 FDI Sector 21,2 19,9 19,7 16,9 9,2
Source: GSO (2010).
From the aggregate demand side of the economy, the growth rate of all components of aggregate demand decreased in 2009, especially negative net export growth. This explains why this year’s growth rate was much lower than that of the same period in previous years (Table 2). Concurrently, the inflation rate’s slowing down signals that the economy was growing below its potential line, due to suppressed demand.
0%10%20%30%40%50%60%70%80%90%
100%
2000 2005 2006 2007 2008 2009
Agriculture MiningManufacturing Electricity, gas, water supplyConstruction Services

Macroeconomic Determinants of Vietnam’s Inflation 2000-2010: Evidence and Analysis
8
Table 2. Growth Rate of Aggregate Demand’s Componen ts, 2005-2009
Unit: % 2005 2006 2007 2008 2009 TOTAL 8,44 8,23 8,46 6,31 5,32 Investment 11,15 11,83 26,80 6,27 4,31 Fixed asset accumulation
9,75 9,90 24,16 3,82 8,73
Change in inventory 33,48 37,17 54,56 26,98 -26,18 Final consumption 7,34 8,36 10,63 9,17 4,03 State 8,20 8,50 8,90 7,42 7,60 Private 7,26 8,35 10,80 9,34 3,68 Net export of goods and services
-18,87 25,01 184,19
17,23 -8,19
Source: GSO (2010).
Table 3 shows the component structure of aggregate demand over time, in which the growing rate of final consumption and investment can be clearly seen. This must be paired with trade deficit (negative net exports) in order to create a macroeconomic balance.
Table 3. Final Demand Components in GDP, 2005-2009
Unit: % 2005 2006 2007 2008 2009
TOTAL 100 100 100 100 100 Investment 35,58 36,81 43,13 39,71 38,13 Fixed asset accumulation 32,87 33,35 38,27 34,61 34,52 Change in inventory 2,71 3,46 4,86 5,10 3,61 Final consumption 69,68 69,38 70,81 73,53 72,77 State 6,15 6,03 6,05 6,12 6,30 Private 63,53 63,35 64,76 67,41 66,47 Net export of goods and services -4,18 -4,56 -15,85 -15,21 -10,35 Error and omissions -1,08 -1,63 1,91 1,97 -0,55
Source: GSO (2010).
An interminable high deficit is a fundamental characteristic of Vietnam’s state budget. At the same time, public debt has continuously increased over the past 10 years. Figure 4 shows budget revenue (in GDP) increasing continuously and steadily from about 21% of GDP in 2000 to nearly 28% of GDP in 2007. However, budget expenditure increased just as rapidly as budget revenue, creating a persistent deficit at 5% of GDP. The deficit was particularly high in 2009 due to the implementation of a large economic stimulus package against the economic slowdown.

Macroeconomic Determinants of Vietnam’s Inflation 2000-2010: Evidence and Analysis
9
Figure 4. Revenues - Expenditures and Budget Defici ts, 2000-2009
Source: Authors synthesized from IMF (2003, 2006, 2009)
Public debt (including government debt and debt guaranteed by government) has gradually increased its proportion in GDP over the past decade, from less than 40% of GDP to approximately 50% of GDP in 2009. Meanwhile, foreign debt has been mostly stable at below 35%, and only increased during the years influenced by world economic crises.
Figure 5. Public Debt and External Debt, 2000-2009
Source: Authors synthesized from IMF (2003, 2006, 2009)
-15
-10
-5
0
5
10
15
20
25
30
35
2000 2001 2002 2003 2004 2005 2006 2007 2008 2009
Year
% G
DP
Expenditures Revenues Budget Deficit
0
5
10
15
20
25
30
35
40
45
50
2002 2003 2004 2005 2006 2007 2008 2009
Year
% G
DP
Government Debt External Debt

Macroeconomic Determinants of Vietnam’s Inflation 2000-2010: Evidence and Analysis
10
International trade is a field currently undergoing special development in Vietnam as the country is increasingly integrating into the global economy, signing more and more bilateral free trade agreements, and participating in multilateral organizations such as the World Trade Organization. Such deep integration, however, has brought not only many opportunities but also many new challenges for Vietnam. It is worth noting that since 2002 the current account has returned to the deficit that mainly originated from trade deficits. However, remittance flows have begun to rise, which has somewhat helped to balance the current account. Also, this is a relatively stable period for capital inflows into Vietnam, thus creating a capital surplus and overall balance surplus. As a result, the country’s foreign exchange reserves have continuously improved (Figure 6). In 2007, the first year of Vietnam’s joining the WTO, the current deficit skyrocketed, but the capital account surplus also increased at a faster rate. However, with the slowdown of capital flow under the world economic crisis in 2008, the current account deficit has not narrowed. As a result, Vietnam was forced to strongly reduce foreign exchange reserves, in order to offset the foreign exchange deficit.
Figure 6. Current Account Deficit and Foreign Excha nge Reserves, 2000-2009
Source: Authors synthesized from IMF (2003, 2006, 2009) A continuous deficit of the current account, along with high domestic inflation, caused exchange rates to become a problem. Looking back at nominal VND/USD exchange rates over the past decade, we can see a clear depreciation trend especially since 2007. However, real exchange has exhibited an opposite trend, with a widening gap between nominal and real exchange rates, especially in 2008 and 2009. Vietnam’s CPI (consumer price index) increasing by 99.5% during the period from 2000 to 2009, while that of the US increased by only 23.7% over the same period. The VND/USD rate increased only 23.6% over the period. Thus, if we take the year 2000 as the base year, then the VND has appreciated by 38% in real terms. This would have contributed to a more severe trade deficit of Vietnam after 2003.
-12
-10
-8
-6
-4
-2
0
2
4
6
2000 2001 2002 2003 2004 2005 2006 2007 2008 2009
Current Account Deficit Foreign Reserves

Macroeconomic Determinants of Vietnam’s Inflation 2000-2010: Evidence and Analysis
11
Figure 7. Real and Nominal Exchange Rate VND/USD, 2 000-2009
(base year=2000)
Source: Nguyen Thi Thu Hang et al. (2010)
In short, the macroeconomic characteristics of Vietnam can be summarized as follows:
- Growth rates are high in comparison with regional ones but tend to slow down; at the same time, growth still heavily depends on investment expansion.
- The economy is becoming increasingly unstable with its integration into the world economy (stronger fluctuation of inflation);
- The budget is in interminable deficit, in addition to a trade deficit (dual deficit); - Even when supported by a large remittance flow, the current account balance remains in
deficit. The overall balance sheet is supported by a high level of capital account surplus. However, under the influence of international conditions, capital flows tend to be gradually less stable, leading to the probability of high fluctuation from surplus to deficit.
- With the exchange rate pegged flexibly on the USD (crawling peg), domestic currency tends to appreciate.
Vietnam’s inflation dynamics with key changes in po licy and economic environment Vietnam experienced hyperinflation during the latter half of the 1980s (above 300% per annum) and early 1990s (above 50% per annum). The main reasons for this were the unfavorable weather and food shortages, sluggish growth in both agriculture and manufacturing and weak financial system during the 1980s. These crises were followed by price liberalization and a series of structural economic reforms causing inflation to soar greatly becoming a crisis itself. Faced with these crises, SBV had to aggressively tighten monetary policy with monthly interest rate raised to 12% and exchange rate pegged rigidly against USD. As a result of these policies, inflation started to fell sharply to below 20% in 1992 and close to 10% in 1995. This was a remarkable feature of Vietnam's emergence in the global economy during the second half of the 1990s.
8,000
10,000
12,000
14,000
16,000
18,000
20,000
2000 2001 2002 2003 2004 2005 2006 2007 2008 2009
Nominal exchange rate
Real exchange rate
Year
VN
D/U
SD

Macroeconomic Determinants of Vietnam’s Inflation 2000
12
The government continued its prudent macroeconomic policies along with farto liberalise domestic prices and open up Vietnam's economy to international trade and investment during the 1990s. The period after 1995 was characterieven the first ever slight deflationat -0.5%. Interest rate had also been gradually liberalized interest rate were introduced to replace the2002, commercial banks in Vietnam have been able to legally set lending rates and deposit rates according to market conditions.
Figure 8. Vietnam’s inflation rate and nominal ER V ND/USD, 1992
The period of late 1990s and early 2000s witnessed the aftermath of the 1997Crisis which caused sharp decline in world prices as well as aggregate demand (domestic and international demand for Vietnamese goods). Theincreases in money and credit (30around 36%) during 1997-2003, inflation stayed at modest levels.
Camen (2006) suggests the rapid rate of monetization in Vietnadecline in velocity as another reason for the seemingly lack of a connection between the inflation rate and growth of money and credit.
8,000
10,000
12,000
14,000
16,000
18,000
20,000
1992
1993
1994
1995
Inflation rate (%)
Macroeconomic Determinants of Vietnam’s Inflation 2000-2010: Evidence and Analysis
The government continued its prudent macroeconomic policies along with farto liberalise domestic prices and open up Vietnam's economy to international trade and
The period after 1995 was characterized by modesslight deflation in Vietnam in the year 2000 with annual inflation rate reported
Interest rate had also been gradually liberalized since the mid-1990sinterest rate were introduced to replace the ceilings for lending rates in August 2000. And since 2002, commercial banks in Vietnam have been able to legally set lending rates and deposit rates according to market conditions.
Figure 8. Vietnam’s inflation rate and nominal ER V ND/USD, 1992
Source: GSO and SBV, 2010
The period of late 1990s and early 2000s witnessed the aftermath of the 1997Crisis which caused sharp decline in world prices as well as aggregate demand (domestic and
emand for Vietnamese goods). These are the main reasons increases in money and credit (30-40% per annum) and large devaluations of VND (total of
2003, inflation stayed at modest levels.
Camen (2006) suggests the rapid rate of monetization in Vietnam as reflected in a strong decline in velocity as another reason for the seemingly lack of a connection between the inflation rate and growth of money and credit.
1995
1996
1997
1998
1999
2000
2001
2002
2003
2004
2005
2006
2007
2008
2009
Inflation rate (%) Official exchange rate (VND/USD)
2010: Evidence and Analysis
The government continued its prudent macroeconomic policies along with far-reaching reforms to liberalise domestic prices and open up Vietnam's economy to international trade and
ed by modest inflation and inflation rate reported 1990s with the basic
ceilings for lending rates in August 2000. And since 2002, commercial banks in Vietnam have been able to legally set lending rates and deposit
Figure 8. Vietnam’s inflation rate and nominal ER V ND/USD, 1992-2009
The period of late 1990s and early 2000s witnessed the aftermath of the 1997-1998 Asian Crisis which caused sharp decline in world prices as well as aggregate demand (domestic and
why despite rapid 40% per annum) and large devaluations of VND (total of
m as reflected in a strong decline in velocity as another reason for the seemingly lack of a connection between the
-505101520253035
2009
Official exchange rate (VND/USD)
Macroeconomic Determinants of Vietnam’s Inflation 2000
13
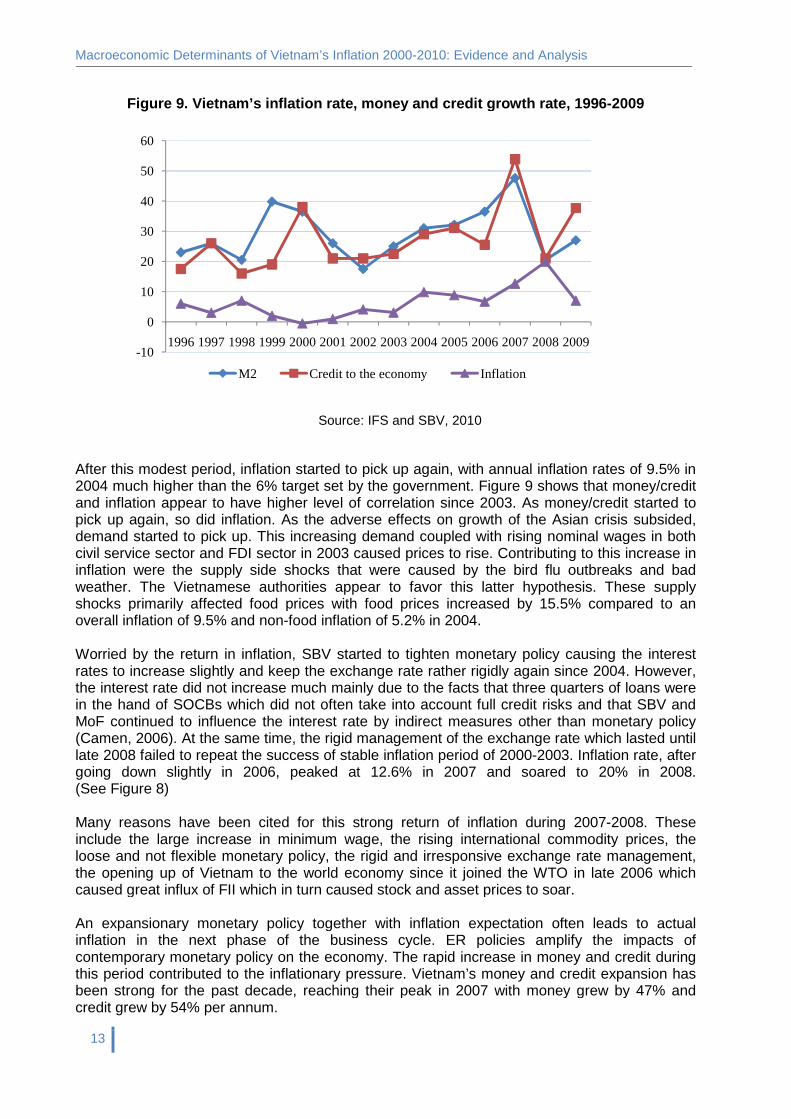
Figure 9 . Vietnam’s inflation rate, money and credit growth rate, 1996
After this modest period, inflation 2004 much higher than the 6% target set by the governmentand inflation appear to have higher level ofpick up again, so did inflation. As the adverse effects on growth of the Asian crisis subsided, demand started to pick up. This increasing demand coupled with rising nominal wages in both civil service sector and FDI sector in 2003 caused prices to rise. inflation were the supply side shocks that were caused by the weather. The Vietnamese authorities appear to favoshocks primarily affected food prices overall inflation of 9.5% and non- Worried by the return in inflation, SBV started to tighten monetary policy causing the interestrates to increase slightly and keep the exchange rate rather rigthe interest rate did not increase much mainly due to the facts that three in the hand of SOCBs which did not often take into account full credit risks and that SBV and MoF continued to influence the interest rate by indirect measures other than monetary policy (Camen, 2006). At the same time, the rigid manlate 2008 failed to repeat the success of stable inflation period of 2000going down slightly in 2006, (See Figure 8) Many reasons have been cited for this strong return of inflation during 2007include the large increase in minimum wage,loose and not flexible monetary policy, the rigid and irresponsive exchange rate the opening up of Vietnam to the world economy since it joined the WTO in late 2006 which caused great influx of FII which in turn cause An expansionary monetary policy together with inflation expectation ofteninflation in the next phase of the business cycle. ER policies amplify the impacts of contemporary monetary policy on the economy. this period contributed to the inflationary pressure. been strong for the past decade, reaching their peak in 2007 with credit grew by 54% per annum.
-10
0
10
20
30
40
50
60
1996 1997 1998 1999
M2
Macroeconomic Determinants of Vietnam’s Inflation 2000-2010: Evidence and Analysis
. Vietnam’s inflation rate, money and credit growth rate, 1996
Source: IFS and SBV, 2010
, inflation started to pick up again, with annual inflation rates of 9.5% in much higher than the 6% target set by the government. Figure 9 shows that money/credit
and inflation appear to have higher level of correlation since 2003. As money/credit started to As the adverse effects on growth of the Asian crisis subsided,
. This increasing demand coupled with rising nominal wages in both civil service sector and FDI sector in 2003 caused prices to rise. Contributing to this increase in inflation were the supply side shocks that were caused by the bird flu outbreaks and bad
authorities appear to favor this latter hypothesis. shocks primarily affected food prices with food prices increased by 15.5% compared to an
-food inflation of 5.2% in 2004.
the return in inflation, SBV started to tighten monetary policy causing the interestto increase slightly and keep the exchange rate rather rigidly again since 2004. However,
the interest rate did not increase much mainly due to the facts that three quarters of loans were in the hand of SOCBs which did not often take into account full credit risks and that SBV and MoF continued to influence the interest rate by indirect measures other than monetary policy (Camen, 2006). At the same time, the rigid management of the exchange rate which lasted until
failed to repeat the success of stable inflation period of 2000-2003. going down slightly in 2006, peaked at 12.6% in 2007 and soared to
reasons have been cited for this strong return of inflation during 2007include the large increase in minimum wage, the rising international commodity prices, loose and not flexible monetary policy, the rigid and irresponsive exchange rate the opening up of Vietnam to the world economy since it joined the WTO in late 2006 which caused great influx of FII which in turn caused stock and asset prices to soar.
An expansionary monetary policy together with inflation expectation ofteninflation in the next phase of the business cycle. ER policies amplify the impacts of contemporary monetary policy on the economy. The rapid increase in money and credit during this period contributed to the inflationary pressure. Vietnam’s money and credit expansion has been strong for the past decade, reaching their peak in 2007 with money grew by 47
2000 2001 2002 2003 2004 2005 2006 2007 2008 2009
Credit to the economy Inflation
2010: Evidence and Analysis
. Vietnam’s inflation rate, money and credit growth rate, 1996-2009
inflation rates of 9.5% in shows that money/credit
. As money/credit started to As the adverse effects on growth of the Asian crisis subsided,
. This increasing demand coupled with rising nominal wages in both Contributing to this increase in
bird flu outbreaks and bad r this latter hypothesis. These supply
.5% compared to an
the return in inflation, SBV started to tighten monetary policy causing the interest idly again since 2004. However,
quarters of loans were in the hand of SOCBs which did not often take into account full credit risks and that SBV and MoF continued to influence the interest rate by indirect measures other than monetary policy
ate which lasted until 2003. Inflation rate, after
soared to 20% in 2008.
reasons have been cited for this strong return of inflation during 2007-2008. These rising international commodity prices, the
loose and not flexible monetary policy, the rigid and irresponsive exchange rate management, the opening up of Vietnam to the world economy since it joined the WTO in late 2006 which
stock and asset prices to soar.
An expansionary monetary policy together with inflation expectation often leads to actual inflation in the next phase of the business cycle. ER policies amplify the impacts of
The rapid increase in money and credit during s money and credit expansion has
money grew by 47% and
2009

Macroeconomic Determinants of Vietnam’s Inflation 2000
14
At the same time, Vietnam appeared to have the signs ofImpossible trinity states that we cannot achieve at the same time all three of the following: fixed ER regime; (ii) free capital the 1990s), in the closed economy where there were no free flows of capital, a relatively fixed ER arrangement accompanied by monetary policy to control inflation was feasible and in fact proved to be effective during 1992more into the world economy, even though Vietnam has not yet completely freed its capital account, the easier flows of capital pose new challenges in implementing the policies in the impossible trinity. Vietnam’s balance of payments shows that finflow to Vietnam was not large. Until 2005, foreign exchange inflows reached only around USD 9 billion (not including unofficial inflows). However, within only two years 2006exchange actually flooded domestic market due to foreign indirect investment, making official reserves increase by 1.6 times the cumulative reserves. This situation posed new challenges for monetary policy in 2007. Within the first 6 months of 2007, SBV had to inject a large amof VND (equivalent to roughly USD 9 billion) to buy foreign exchange to keep the ER stable. The excess supply of domestic currency was not timely sterilized. At the same time, raw material prices increased rapidly. The result was the rise of inflationthe decade reached double digits.would not be able to sustain the interest rate. This is an unprecedented and difficult task for SBV. It was clear that the policy ofinflation, instead it contributed to the increased pressure for higher inflation due to the fact that SBV needed to buy USD to maintain the set ER. Clearly, international integration brings with new challenges for SBV and ER management.interest rate during 2007-2008.
Figure 10. Inflation Rates of Vietnam and Selected Countries,
Source: Nguyen Thi Thu Hang et al. (2010)
Figure 10 shows that since 2004, Vietnam has been experiencing high, more volatile and more persistent inflation rate relative to that of its major trading partners.The global economic crisis of 2008inflation until late 2009. Declining international price accompanied with decreasing demand helped Vietnam to reverse the
-10.00
-5.00
0.00
5.00
10.00
15.00
20.00
25.00
2000
2001
2002
Macroeconomic Determinants of Vietnam’s Inflation 2000-2010: Evidence and Analysis
At the same time, Vietnam appeared to have the signs of the “impossible trinity” problem. ity states that we cannot achieve at the same time all three of the following:
flows and (iii) the independence of monetary policy. Before, in the closed economy where there were no free flows of capital, a relatively fixed
ER arrangement accompanied by monetary policy to control inflation was feasible and in fact 1992-1996. However, as the Vietnamese economy in
more into the world economy, even though Vietnam has not yet completely freed its capital account, the easier flows of capital pose new challenges in implementing the policies in the
Vietnam’s balance of payments shows that for many years before 2006, foreign exchange inflow to Vietnam was not large. Until 2005, foreign exchange inflows reached only around USD 9 billion (not including unofficial inflows). However, within only two years 2006
ded domestic market due to foreign indirect investment, making official reserves increase by 1.6 times the cumulative reserves. This situation posed new challenges for monetary policy in 2007. Within the first 6 months of 2007, SBV had to inject a large amof VND (equivalent to roughly USD 9 billion) to buy foreign exchange to keep the ER stable. The excess supply of domestic currency was not timely sterilized. At the same time, raw material prices increased rapidly. The result was the rise of inflation, which for the first time in the decade reached double digits. However, even if the injected money had been sterilized, we would not be able to sustain the interest rate. This is an unprecedented and difficult task for SBV. It was clear that the policy of keeping stable the ER during 2005-2007 did not help control inflation, instead it contributed to the increased pressure for higher inflation due to the fact that SBV needed to buy USD to maintain the set ER. Clearly, international integration brings with new challenges for SBV and ER management. High inflation rate led to unacceptably high
Figure 10. Inflation Rates of Vietnam and Selected Countries,
Source: Nguyen Thi Thu Hang et al. (2010)
that since 2004, Vietnam has been experiencing high, more volatile and more persistent inflation rate relative to that of its major trading partners.
2008-2009 has contributed to the downward trend in Vietnam’s Declining international price accompanied with decreasing demand
helped Vietnam to reverse the detrimentally upward trend of 2008. As the government’s
2002
2003
2004
2005
2006
2007
2008
2009
China
US
Singapore
Korea
Thailand
Vietnam
2010: Evidence and Analysis
the “impossible trinity” problem. ity states that we cannot achieve at the same time all three of the following: (i) a
the independence of monetary policy. Before (in , in the closed economy where there were no free flows of capital, a relatively fixed
ER arrangement accompanied by monetary policy to control inflation was feasible and in fact However, as the Vietnamese economy integrates
more into the world economy, even though Vietnam has not yet completely freed its capital account, the easier flows of capital pose new challenges in implementing the policies in the
or many years before 2006, foreign exchange inflow to Vietnam was not large. Until 2005, foreign exchange inflows reached only around USD 9 billion (not including unofficial inflows). However, within only two years 2006-2007, foreign
ded domestic market due to foreign indirect investment, making official reserves increase by 1.6 times the cumulative reserves. This situation posed new challenges for monetary policy in 2007. Within the first 6 months of 2007, SBV had to inject a large amount of VND (equivalent to roughly USD 9 billion) to buy foreign exchange to keep the ER stable. The excess supply of domestic currency was not timely sterilized. At the same time, raw
, which for the first time in However, even if the injected money had been sterilized, we
would not be able to sustain the interest rate. This is an unprecedented and difficult task for did not help control
inflation, instead it contributed to the increased pressure for higher inflation due to the fact that SBV needed to buy USD to maintain the set ER. Clearly, international integration brings with it
High inflation rate led to unacceptably high
Figure 10. Inflation Rates of Vietnam and Selected Countries, 2000-2009
that since 2004, Vietnam has been experiencing high, more volatile and more
has contributed to the downward trend in Vietnam’s Declining international price accompanied with decreasing demand
As the government’s
China
US
Singapore
Korea
Thailand
Vietnam

Macroeconomic Determinants of Vietnam’s Inflation 2000-2010: Evidence and Analysis
15
stimulus packages were being accelerated during the second quarter of 2009, money supply started to increase strongly again and so did lending. Commercial banks found themselves running out of cash and trying to increase interest rate to attract household deposits. Thus, the interest rate competition began causing lending rates to rise (above the ceiling rate due to lending fees) as well. Although the increasing trend in interest rate of 2009 did not lead to unhealthy high levels of 2008, both lending and borrowing rates stayed at high levels. Prices started to rise again during the latter half of 2009. In 2010, inflation was high during the first two months due to Tet holiday and the electricity price hike. The inflation rate was quite low and stable during the 5 months from April to August 2010. This implies the effectiveness of inflation control measures of the monetary authorities. However, inflation started to rise again since September 2010 making the CPI for the first 11 months already rose by 9.58% compared to 20.71% and 5.07% for the same period in 2008 and 2009 respectively (see Figure 11). Recent devaluation of the VND against USD in August and the fluctuations in both international and domestic gold prices have been cited as some of the main reasons for this new episode of high inflation. It is obvious that inflation rate is high and volatile in Vietnam. The year 2008 marked the highest level as well as volatility of inflation in Vietnam over the past decade. There are still potential threats that may cause higher inflation in 2010 which include (i) prices of key commodities such as electricity and petroleum are still depressed; (ii) VND is still under depreciation pressures despite considerable devaluations by SBV in 2010; (iii) increasing prices in China pushing up import costs of ongoing infrastructure projects which need imported materials from China and (iv) pressures for more monetary expansion. Part of these pressures as already been realized during the past few months of 2010. The potential unfavorable effects of inflation on poverty and growth are well known. Inflation increases income inequality because it is similar to a regressive tax which has an adverse impact on the poor. If poor households holds most of their wealth in cash and bank deposits with little financial assets like those in Vietnam, high inflation rate will quickly erodes their purchasing power. High inflation can also hurt growth, cloud price signals and limit the quality and quantity of investment. It can also hurt a country’s export competitiveness due to increases in domestic production costs and appreciations of the real exchange rate. (Easterly and Fischer, 2001). These premises hold even stronger in Vietnam as food and food stuffs account for 40-50% of the consumption basket during 2000-2010. Before 2001, food and foodstuffs accounted for over 60 percent of the CPI basket. The share of food was reduced to 48 percent when the living standard survey of 2000 was released. Figure 11 shows that while non-food price has increased 1.7 times compared to that of the year 2000, food price has increased by more than 2.6 times over the same period with headline inflation increased by a little more than 2 times.

Macroeconomic Determinants of Vietnam’s Inflation 2000
16
Figure 11. Vietnam’s Mont
Not only that food prices has increased much morethey are also much more volatile.showing two big spikes in 2004 and 2008. upward trend over the period of 2000sometimes more extreme than general pricesone of the main determinants of inflation in Vietnam. As food comprises such a large share of the CPI basket and food prices are less rigid compared to other commodities in the basket, any change in other factors that can affect prices in general would be reflected almost immediately in food prices. In other words, food prices reflect changes in inflation but not the major cause of inflation itself. Blaming increasing in food prices as a cause to realize more sinister factors (such as monetary and fiscal policy that distorted aggregate demand or unfavorable shocks that affect supply)the first place. However, world food prices can be a source of increasing inflation due to the fact that Vietnam is a large player in world food market. Domestic food exporters seeing high world prices could try to increase domestic prices as well.
0
50
100
150
200
250
300
2000
M1
2000
M7
2001
M1
2001
M7
2002
M1
2002
M7
CPI
Macroeconomic Determinants of Vietnam’s Inflation 2000-2010: Evidence and Analysis
Figure 11. Vietnam’s Mont hly Food and Non-Food CPI, 2000
(base at beginning of 2000)
Source: GSO, 2010
Not only that food prices has increased much more than non-food crisis, Figure 12they are also much more volatile. Food prices moved more in line with headline inflation, showing two big spikes in 2004 and 2008. Non-food prices appear to have more persistent upward trend over the period of 2000-2010. Because food prices tend to move closely and
than general prices, some have mistakenly blamed foodone of the main determinants of inflation in Vietnam. As food comprises such a large share of the CPI basket and food prices are less rigid compared to other commodities in the basket, any
nge in other factors that can affect prices in general would be reflected almost immediately in food prices. In other words, food prices reflect changes in inflation but not the major cause of
Blaming increasing in food prices as a cause of inflation may hinder one’s ability to realize more sinister factors (such as monetary and fiscal policy that distorted aggregate
or unfavorable shocks that affect supply), that actually cause food prices to go up in However, world food prices can be a source of increasing inflation due to the fact
that Vietnam is a large player in world food market. Domestic food exporters seeing high world prices could try to increase domestic prices as well.
2002
M7
2003
M1
2003
M7
2004
M1
2004
M7
2005
M1
2005
M7
2006
M1
2006
M7
2007
M1
2007
M7
2008
M1
2008
M7
2009
M1
2009
M7
2010
M1
2010
M7
CPI_food CPI_non_food
2010: Evidence and Analysis
2000-2010,
food crisis, Figure 12 shows that Food prices moved more in line with headline inflation,
food prices appear to have more persistent 2010. Because food prices tend to move closely and
, some have mistakenly blamed food-prices as one of the main determinants of inflation in Vietnam. As food comprises such a large share of the CPI basket and food prices are less rigid compared to other commodities in the basket, any
nge in other factors that can affect prices in general would be reflected almost immediately in food prices. In other words, food prices reflect changes in inflation but not the major cause of
of inflation may hinder one’s ability to realize more sinister factors (such as monetary and fiscal policy that distorted aggregate
, that actually cause food prices to go up in However, world food prices can be a source of increasing inflation due to the fact
that Vietnam is a large player in world food market. Domestic food exporters seeing high world
2010
M7

Macroeconomic Determinants of Vietnam’s Inflation 2000
17
Figure 12. Vietnam’s monthly year
The above historical review of Vietnam’s inflation dynamics during 2000identify possible inflation determinants in Vietnam. These include credit conditions, exchange rate management, government policies that affect aggregate demand, and other supply shocks.determinants in the world and in Vietnam withmacroeconomic determinants of inflation for Vietnam. These will be the inputs for our model and analysis in Section 4.
Literature Review on Macroeconomic Determinants of Inflation International Research Inflation has been studied extensively in the literature from theoretical discussions to more empirical based research that gostudied the impact of inflation on the economy and welfare while othdeterminants of inflation. We will focus our attention on reviewing the literature on inflation determinants in this study. We cannot begin to discuss inflation determinants without reviewing the classic ideas and models set forth and built upon by famous economists. based on the Phillips curve model which was developed by Phillips (1958) and Lipsey (1950) based on the assumption that there exist a stable and negative relationship between unemployment rate and inflation rate.
-10
0
10
20
30
40
50
2001
M1
2001
M7
2002
M1
2002
M7
2003
M1
CPI
Macroeconomic Determinants of Vietnam’s Inflation 2000-2010: Evidence and Analysis
monthly year -on year food and non- food inflation(%)
Source: GSO, 2010
The above historical review of Vietnam’s inflation dynamics during 2000-2010 has helped us to identify possible inflation determinants in Vietnam. These include external shocks, money and credit conditions, exchange rate management, government policies that affect aggregate demand, and other supply shocks. In the next section, we will review the literature on inflation determinants in the world and in Vietnam with the aim to arrive at a list of possible macroeconomic determinants of inflation for Vietnam. These will be the inputs for our model
on Macroeconomic Determinants of
Inflation has been studied extensively in the literature from theoretical discussions to more that goes into specific cases of individual countries
on the economy and welfare while other focusdeterminants of inflation. We will focus our attention on reviewing the literature on inflation
discuss inflation determinants without reviewing the classic ideas and built upon by famous economists. The current inflation theory is mostly
based on the Phillips curve model which was developed by Phillips (1958) and Lipsey (1950) based on the assumption that there exist a stable and negative relationship between
ment rate and inflation rate.
2003
M7
2004
M1
2004
M7
2005
M1
2005
M7
2006
M1
2006
M7
2007
M1
2007
M7
2008
M1
2008
M7
2009
M1
2009
M7
2010
M1
CPI_food CPI_nonfood
2010: Evidence and Analysis
food inflation , 2000-2010
2010 has helped us to external shocks, money and
credit conditions, exchange rate management, government policies that affect aggregate In the next section, we will review the literature on inflation
the aim to arrive at a list of possible macroeconomic determinants of inflation for Vietnam. These will be the inputs for our model
on Macroeconomic Determinants of
Inflation has been studied extensively in the literature from theoretical discussions to more into specific cases of individual countries. Some research
er focused mainly on determinants of inflation. We will focus our attention on reviewing the literature on inflation
discuss inflation determinants without reviewing the classic ideas and The current inflation theory is mostly
based on the Phillips curve model which was developed by Phillips (1958) and Lipsey (1950) based on the assumption that there exist a stable and negative relationship between
(1)
2010
M1
2010
M7

Macroeconomic Determinants of Vietnam’s Inflation 2000-2010: Evidence and Analysis
18
Friedman (1960) and Phelps (1967) later added the role of (adaptive) expectations about inflation into the model and differentiated between long-run and short-run Phillips curve. However, in the 1970s, empirical results did not support the Phillips curve model and Sargent (1971) and Lucas (1972) (the leader of the rational expectation revolution) raised their criticism of the Phillips curve saying there is no systematic trade-off between inflation and unemployment. More recently, building upon various criticism, the Phillips curve have been continuously modified by Fischer (1977) and Taylor (1979) who introduced nominal rigidities, Calvos(1983) who modeled random price adjustment and Gali and Gertler (1999) who introduced labor share into the model. As a result of these continuous modifications, the New-Keynesian Phillips Curve (NKPC) was built which has forward-looking characteristics, i.e., inflation is determined by forward looking manner. However, the NKPC had to be modified again as profound empirical evidence showing the dependence of inflation on its own lagged values. Woodford (2003) and Christiano, Eichenbaum, and Evans (2005) are among the recent studies that include inflation lags into the Phillips curve. The hybrid-NKPC takes the following form which has both forward- and backward-looking characteristics and a measure for inflationary pressures which captures the excess demand in the system among other. �� � �������� ����� � � (2) As opposed to Keynesian position that the real economy is highly unstable and that monetary management has little control over it, the monetarist school (started by Milton Freidman) argues that the real economy is fairly stable but can be destabilized by changes in monetary growth and thus monetary policy is important. They formulate that an unexpected increase in the rate of growth of money supply raise economic growth (higher than expected) which lead to a reduction in unemployment rate (Okun’s law), which in turn increase inflation rate via the Phillips curve. Unexpected growth in money supply can come from excessive monetary financing of budget deficits or too much credit extended to the private sector. Thus, the monetarist model of inflation determinants usually takes the following form. � � �� ��� ��� ��� (3)
where m is the growth rate of money supply, y is the growth rate of income and ρ captures the opportunity cost of holding money. Interest rate and past inflation are known to be used as a measure for opportunity cost of holding money. However, the monetarist approach to inflation originated from the developed world where the financial system is well developed and there are few structural bottlenecks such as those found in the developing world. The structuralist approach to inflation determinants identifies rigidities that caused inflationary pressures. Such inflationary pressures in developing countries can be caused by distorting government policies, productivity differences in different sectors of the economy, wage hikes, inelastic supply of food, foreign exchange constraints and government budget constraints. These rigidities lead to increase in prices and thus inflation (Akinboade et.al. 2004). The structuralists also view “real” shocks to the economy such as exogenous increase in import prices or sudden increase in budget deficits as causes for inflation. They called them “cost-push” factors to inflation because in essence those factors increase the cost of production, causing upward pressure in prices of certain part of the economy. More often than not, such factor induces an increase in money supply and thus inflation in one part spills over to the whole economy (Greene, 1989). In addition to the monetarist approach and the structuralist approach to inflation, the literature on inflation dynamics and inflation determinants also comprises of a third and perhaps simplest approach to inflation: the purchasing power parity (PPP) approach. This stems from the Law of

Macroeconomic Determinants of Vietnam’s Inflation 2000-2010: Evidence and Analysis
19
One Price which state that in the absent of transport and other transaction costs, the relationship between world price and domestic price becomes � � ��� (4)
where E is the exchange rate between domestic currency and foreign currency. Equation (4) suggests that inflation is influenced either indirectly by higher import prices or directly through increase domestic demand. This equation also implies that exchange rate plays a certain role in determining price level and exchange rate pass-through need to be considered. Exchange rate devaluation can directly affect domestic prices of tradable goods but also indirectly affect the general price level if pricing decisions are affected by import costs. This is especially true for countries which rely on import of intermediate goods for production and/or has relatively high level of dollarization like Vietnam. All of models suggested in the three approaches above have extensively been used, tested empirically and criticized in more recent literature. The PPP approach is criticized for being too simple, ignoring transaction costs (transportation costs and costs created by trade and non trade barriers), ignoring the non-tradable sector and assuming same method of price index calculation across countries. The evidence on the validity of PPP theory is for developing countries is mixed with PPP theory performs better for country that are geographically closed to each other and have strong trade relation, or in countries with high inflation that witnessed rapid exchange rate depreciation. (See more detailed review in Akinboade et.al., 2004). The monetarist approach is criticized for not taking into account structural rigidities and “real” shocks (cost-push factors) which have been proved to be important in developing countries by the structuralist approach. The structuralist approach by itself misses out many factors on the demand side suggested by the monetarists. Thus, efforts have been made in response to such criticisms. A typical recent study on inflation determinants in a small open economy captures the elements of all three approaches. Chhibber (1991), for example, models inflation as a weighted average of inflation in tradable good, non-tradable good and controlled prices and applies it to study inflation determinants in various African countries. Tradable good inflation was model according to PPP approach. Non-tradable good inflation is modeled to depend on elements of both cost-push and demand-pull inflation. Akinboade et.al. (2004) studied the relation between inflation in South Africa and money market, labor market and foreign exchange market. They showed that labor costs, broad money supply had positive correlation with inflation and effective exchange rate had negative impact on inflation in the short run. In the long run they found inflation correlated negatively with interest rate and positively with broad money supply. They also noted that monetary authorities in South Africa had little control over these determinants of inflation making it difficult to achieve inflation targets. Byung-Yeon Kim (2001) studied the relative impacts of monetary, labor and foreign sector on Polish inflation for the period from 1990-1999 and showed that exchange rate and wage but not money play an important role in determining inflation. They suggested that Polish monetary policy was passive during the studied period. Jongwanich and Park (2008) studied cross-country inflation determinants for nine developing Asian countries (including Vietnam) using a hybrid model that comprise both cost-push factors (exogenous oil and food inflation) and demand-pull factors (excess aggregate demand, exchange rate pass-through, import prices, producer price inflation and consumer price inflation). The authors found out that the 2007-2008 surge in Asia’s inflation was caused mainly by excess aggregate demand and inflation expectations (demand pull) and not by the two cost-push factors even though the surge of inflation coincided with increase in international oil and
Macroeconomic Determinants of Vietnam’s Inflation 2000-2010: Evidence and Analysis
20
food prices. Overheating demand and years of lax monetary policy that gave rise to widespread inflation expectations fueled inflation in these countries. Most of the empirical studies confirmed the important role of money factors on inflation in the long run. In the short-run, monetary factors, past inflation, public sector deficits and exchange rate are factors that contribute to inflationary pressures. Samples of such studies are Chhibber (1991) on Africa’s inflation, Lim and Papi (1997) on Turkey inflation, Laryea and Sumaila (2001) on inflation in Tanzania, Akinboade et al. (2004) on South Africa’s inflation, Lehayda (2005) on Ukraine’s inflation and Jonguanich and Park (2008) on Asian developing countries’ inflation. The literature on the relationship between exchange rate and inflation, however, shows mixed results. For example, Chhibber (1991) shows that the impact of devaluation on inflation depends on the degree of exchange rate flexibility, openness of capital account and the level of price controls. In addition, many studies analyze structural and cost-push factors such as oligopoly pricing and cost pressures stemming from wage increases and devaluations. The results are mixed as well, with some of the studies found that markup pricing alone could not explain the causes of persistent inflation and had a relatively small impact on inflation while others found significant impact of rising labor costs on inflation in the long-run. Examples include Lim and Papi (1997), Chhibber (1991), Akinboade et al. (2004) and Leheyda (2005). Bodart (1996) explored the inflation implications of exchange rate reforms in a small open economy by combining fiscal view of inflation with multiple exchange rate systems. He found that a fixed crawl of the official ER has only temporary effects on inflation while a depreciation has more permanent impact on inflation under a system of continuous adjustment of the official rate towards the parallel market rate. Also, long-run increase in fiscal deficit leads to permanently higher inflation. Ito and Sato (2006) studied the exchange rate pass-through in post-crisis Asian countries and show that though the pass-through to import prices was quite high, such pass-through to CPI was rather low (with the exception of Indonesia) and that exchange rate pass-through to CPI was the main reason for Indonesian inflation and nominal depreciation after the Asian crisis. Previous Studies on Vietnam’s Inflation Various attempts have been made to explain inflation dynamics in Vietnam. These studies range from non-quantitative (non-technical) to extensive empirical works. For the purpose of this study, we will focus mainly on reviewing the recent empirical works that have been done about the case of Vietnam. Following the economic theories set forth in the literature on inflation, studies on Vietnam’s inflation also incorporate as many factors as possible from both the cost-push and the demand pull sides of inflation in trying to explain Vietnam’s inflation dynamics. However, due either to the lack of data or to the choice of the authors, most studies ignore the supply side factors and focus mainly on the demand side factors of inflation. The only inclusions of supply side factors are external shocks in world prices (of oil and in rare occasion of rice). The current literature on Vietnam’s inflation determinants circulate around the following factors: CPI, money aggregates, interest rate, exchange rate, output, international oil prices and international rice prices. One of the first comprehensive and quantitative studies is Vo Tri Thanh et.al. (2001). The authors, using monthly data from 1992 to 1999 in a Vector Autoregression (VAR) model with error correction terms, studied the relations between money, CPI, exchange rate and real industrial output. They found out that money growth responded to past movements in inflation and output, indicating a passive monetary policy during the studied period. Exchange rate was

Macroeconomic Determinants of Vietnam’s Inflation 2000-2010: Evidence and Analysis
21
found to have significant influence on inflation while money aggregates did not seem to have predicting power regarding the future movements of prices. Similar results on the role of money aggregates on inflation were found in a study by IMF staff in 2003, also using a VAR model of seven variables: international oil prices, international rice prices, industrial output, exchange rate, money, import prices and consumer prices for the period from Jan 1995 to Mar 2003. The results show that own innovations are important in explaining the behavior of headline inflation, core inflation (non-food inflation) and import prices. Exchange rate has significant influence on import prices but not CPI, reflecting the large weight of non-tradables in the CPI basket and that import prices do not directly feed into domestic prices despite the increasing level of openness. They also show that international rice prices, domestic demand conditions and broad money growth had modest impact on headline inflation but had substantial persistence. However, a later study by the IMF (2006) using quarterly data from 2001 to 2006 found substantial role of money aggregates on inflation. Although the results might be questionable due to a rather small sample, they confirmed the observation that money and credit growth started to have correlation with inflation in since 2002 (as seen in Figure 4). Part of this change can be explained by the liberalization of various important prices during the early 2000s. This study also shows that while inflation expectation and output gap had influencing role on inflation, oil price shocks and exchange rate had a modest role in explaining inflation during the studied period. In addition, Vietnam's inflation had an inertia component higher than in the other regional countries. This suggests that once inflationary expectations are present, it is more difficult to control inflation. The higher inertia may be a result of public's memory of hyper inflation that lasted until the early 1990s. Also Balassa-Samuelson effects are not strong on inflation i.e., even though productivity growth is higher in tradable sector, there is no strong evidence of medium-term increase in relative prices between tradable and non-tradable sector. Camen (2006) used a VAR system with monthly data for the periods February 1996 and April 2005 and found that: (i) total credit to the economy accounted for 25% of variation in CPI and is the key variable in explaining the CPI after 24 months; (ii) total liquid and interest rate explain only a very small part of CPI variation (less than 5%); (iii) oil price and rice price are important which suggest the important role of commodity prices and exchange rate (19%); (iv) US money supply (m3) as a measure of international liquidity also plays an important role in most sample periods. Another study that focus mainly on the influence of dollarization on inflation by Goujon (2006) showed that given the dollarized nature of the economy, money only matter to inflation if dollar holdings were included. The study used a monetarist approach for the period from January 1991 to June 1999. Truong Van Phuoc and Chu Hoang Long (2005) used Granger estimation methods on monthly data from July 1994 to December 2004 and found out that the main determinants of inflation during this period were inflation lags and output gap. Money supply did not appear to have any influence while the impacts of rice, oil and exchange rate pass-through were modest. Nguyen Thi Thuy Vinh and Fujita (2007) used a VAR approach to study the impact of real exchange rate on output and inflation in Vietnam for the period from 1992 to 2005. The authors found out that the main sources of variance in output and price levels were “own shocks” and exchange rate had stronger impact on trade balance and output than on inflation. The VAR model includes industrial output, CPI, exchange rate, money supply, trade deficit and US interest rate (as an exogenous variable). The model focused mainly on the exchange rate pass-through and thus ignored most of the other determinants of inflation.

Macroeconomic Determinants of Vietnam’s Inflation 2000-2010: Evidence and Analysis
22
A similar study by Vo Van Minh (2009) used similar method to study exchange rate pass-through to inflation but with more update data (from January 2001 to February 2007) on nominal effective exchange rate, output gap, oil prices, CPI, import price index and broad money M2. The results show that exchange rate pass-through in Vietnam is incomplete and the degree of pass-through is lower than found in IMF (2003). The author explained this reduction by citing different inflationary environment, less dollarization and deregulation of interest rate policy between the two periods. The study also calls for removal of exchange rate intervention. Nguyen Viet Hung and Pfau (2008) studied the monetary transmission mechanisms in Vietnam using for the period from 1996Q2 to 2005Q4 and shows that there is a strong link between money supply and real output but no strong connection between money supply and inflation. Pham The Anh (2008) used traditional data for 1994M1-2008M8 in a structural VAR model and shows that own innovations explained most of the variations in inflation with shocks to M2 and interest rate playing modest role. Pham The Anh (2009) studied inflation determinants during 1998Q2-2008Q4 using CPI, money supply, interest rate, exchange rate, industrial output and the error correction terms obtained from the cointegration tests for long run PPP and money demand relationships. This study also confirms the role of inflation lags and output and rejects the role of international oil prices on current period inflation. An important finding of this study is the important role of money supply growth on inflation (after three lags) while interest rate show passive role. In addition, there are several non-technical studies relating to inflation dynamics and determinants such as one by Dragon Capital (2007) which blamed international inflation for the increase in Vietnam inflation and UNDP (2008) on food inflation in Vietnam. Both studies tend to support the government stance that inflation was mainly externally generated. In summary, the review of literature on inflation determinants in Vietnam shows a few key points.
1. Most studies only take international oil price (and occasionally international rice price) as representative for the supply side factors, ignoring other factors such as cost, mark-up, and other rigidities.
2. Most of the studies (with the exception of Pham The Anh (2009) which covers until the end of 2008) are outdated and thus did not take into account the recent surge in inflation as well as the world economic crisis of 2008-2009 that has led to various changes in macroeconomic environment and policy.
3. Empirical results on the role of money as determinants are mixed probably due partly to different studied periods, different frequencies of data, and different estimation methods.
4. On the other hand, the literature is quite consistent about the important role of inflation lags, the modest role of exchange rate and international prices.
It is on these points that we hope to confirm/reject and improve when building our model.
Analysis of Key Macroeconomic Determinants of Vietnam’s Inflation The model Basing on the above review of literature on the macroeconomic determinants of inflation, we develop a hybrid model of inflation determinants that comprise both the structural approach and

Macroeconomic Determinants of Vietnam’s Inflation 2000-2010: Evidence and Analysis
23
the monetarist approach. This means that inflation is not only a money phenomenon caused by the distortions in the domestic monetary market but also a result of certain structural/cost-push elements. As we also, following Chhibber (1992), decompose prices into tradable and non-tradable components, we will also test the PPP in the long-run for the case of Vietnam. So in essence, our model combines all three approaches discussed in the previous section. Following widely accepted economic theories, we can express a country’s price level (often measured by the consumer price index - CPI), at any point in time, as a weighted average of tradable good prices (prices of goods and services that are exported or imported by the country) and non-tradable good prices (prices of goods and services produced and consumed within the country only). According to Chhibber (1992), inflation, expressed as a change in price level logP, depends on the change in tradable good prices logPT, in non-tradable good prices logPN and in controlled/administered prices ∆PC. This relation can be expressed in the following forms. logP � α�logP� α�logP� �1 � α� � α� logP! (1)
where α1+ α2<1
For tradable goods, as Vietnam is a small open economy, changes in tradable good prices depend on changes in the world market prices logPf and changes in the prevailing exchange rate logE. And thus, strictly speaking, we can model tradable good prices according to the PPP rule. We will call this the tradable price channel to inflation. logP� � logP" logE (2) Non-tradable good prices are more complicated to model and we will need to look at the domestic market to determine change in those prices. We assume here that the market for non-tradable goods move in line with the country’s aggregate market. Then non-tradable good prices depend on aggregate demand and aggregate supply.
On the supply side, basically, changes in prices of non-tradable goods depend on changes in intermediate input costs (both imported and domestically supplied intermediates) IC, labor costs (as measured by wage W) and a supply mark-up MUs which can be caused by market imperfections. Changes in imported intermediate good prices follow the PPP rule in equation (2). These can be considered cost-push factors that affect domestic inflation. On the demand side, aggregate demand depends on income Y, interest rate r, wealth, government spending and taxes. Changes in these factors may create excess demand and affect prices and can be considered demand-pull factors of inflation. The factors from both supply and demand side can cause changes in non-tradable good prices and thus channel to the general price level. We can specify the non-tradable channel as follows. logP� � β�MU β�logIC β�logW (3) A change in the general mark-up depends on the combination of supply side mark-up and the excess demand in the economy which in turn translates into excess real money balances (excess in the domestic money market). Note that changes in the any of the above components in the productions process are reflected in producers’ prices. So we can proxy changes in non-tradable prices by changes in producers’ price. However, as we are interested in examining the role of money market on domestic inflation, it is worth decomposing our mark-up MU further. As we will, following previous literature, use excess real money balances (EMB) as a proxy for the mark-up in non-tradable good prices we can specify MU as followed.
MU * MU+ EMB � MU+ log -M+P . � log -M/
P .

Macroeconomic Determinants of Vietnam’s Inflation 2000-2010: Evidence and Analysis
24
� MU+ log 0 123456 � log 017
3 6 � ∆logP (4)
where 89: is the supply/producer mark-up, Ms is money supply, Md is money demand and P-1 is price level in the previous period. When real money demand is different from real money supply, we have EMB different from zero and the money market is not in equilibrium. According to economic theories, the demand for money depends on real income Y, interest rate r and changes in expected inflation ∆Pe. Thus, the money demand function can be specified as:
log 0173 6 � γ� γ�log �Y γ�r γ�∆logP= (5)
Equations (1) to (5) can be combined to form a function for inflation as follows (lower case represent log of the variables).
∆p � F�∆p", ∆e, ∆ic/, ∆logw, ∆m+, ∆u, ∆r, ∆p=, ∆p! (6) where expected inflation is proxied using past inflation.
As for the case of Vietnam, several modifications to the model (6) above is needed given the knowledge inferred from our review of Vietnam’s inflation dynamics in Section 2 and the examination of data. We must first emphasize that almost all of the studies on inflation in Vietnam ignore the supply side factors with the only exceptions are world price of oil and in few cases world price of rice which are treated as exogenous shocks. Following are five main modifications we made to the traditional model. The first two are due to lack of data. The omission of wage and other non-tradable input cost and price controls are also common among the literature on Vietnam’s inflation. First, as reliable information on wage and domestically supplied input costs are not available for the time period of the study, where applicable we will use PPI (producers’ price index) as a proxy that represent the supply side with a note that PPI already includes imported prices and well as certain part of the supply/producer mark-up. Yet, we believe that PPI is still a good proxy for the supply side effects on inflation. Second, controlled/administer prices used to play a very important role in the transition period of Vietnam in the 1980s and 1990s. In the 2000s, many regulations on prices have been removed. Still, prices of certain key commodities are still controlled such as public utilities (electricity, water, transportation), petroleum, postal and telecommunication services. However, the relation between price liberalization and inflation was not clear with high inflation followed some price liberalizations but not others. Also, controlled prices account for less than 10% of the CPI basket during the studied period. Although it might be might help explain in part certain short episode of price changes, the study of correlation between price liberalization and change in inflation will be postponed until a further study. Third, we would also like to include a measure for market imperfections into the model. Market imperfections such as rigidities, market power/structure (such as monopoly or oligopoly) and speculations can increase transaction cost, push up prices, keep them at high level and change inflation expectation, thus increase the demand for money. Thus, market imperfections, though a supply side factor can affect the demand side as well. Market imperfections such as nominal rigidities sometimes help buffer and reduce the volatility of inflation in short run. However, in the medium run, nominal rigidities amplify and prolong impacts of monetary and other kinds of shocks to the real economy, affecting inflation expectation and can cause higher inflation. Also, market imperfections in forms of monopoly or oligopoly market structure can cause high mark-up which can translate into higher inflation. Firms with market power often try to push up their prices and keep them at high level (even when input prices return to normal after a shock). This market structure imperfection often leads to persistently high prices in certain markets.

Macroeconomic Determinants of Vietnam’s Inflation 2000-2010: Evidence and Analysis
25
However, measuring market imperfection is a very difficult task, especially in Vietnam where it is almost impossible to observe price setting behaviors of firms, where serial data on prices at different stages of production and marketing, on market concentration ratios in each market are unavailable. Moreover, different markets have different types of imperfections. Going into details in each market for each commodity in the CPI basket is outside of the scope of this study. In our model, these market imperfections will be captured partly in the producers’ price PPI and partly in the excess real money balance resulted from market distortions. Fourth, as reviewed in the literature, public sector deficits have been found to have correlation with inflation. Although the causal relation can go in both directions, the manner of financing public sector deficits (through money creation rather than borrowing) can be inflationary. Data for budget deficit financing through money creation is not available. Even though the data for budget deficit and public borrowing are available, the ad-hoc nature and stocks vs flows issues of the two series make it impossible to infer a reliable/accurate time series money creation (if any). However, the evolution of cumulative real budget deficits (a proxy for increase in public financing through public debt and money creation if any) can affect inflation expectation thus it might be interesting to examine their relationship. Finally, asset prices (such as that of real estate and stocks) have been known to affect inflation through wealth effect. As asset prices increase, people’s wealth increases making them feel richer which increases their demand. We include a measure (called Wealth) for changes in wealth due to changes in asset price in the model to test its role in determining inflation. The above modifications to the traditional model of inflation determinants bring about the following specifications for the inflation equation (lower case represent log of the variables).
∆p � F�∆p", ∆e, ∆ppi, ∆m+, ∆y, ∆wealth, ∆pdebt, ∆p=, ∆r (7) We can summarize the transmission channels to inflation in our model in the following diagram.
Figure 13. Transmission Channels to Inflation
Price level
Prices of Tradable Prices of Non -tradable
World Prices (oil price, rice
price and prices of other
imported inputs
Exchange Rate
Money and credit, interest rate,
income, wealth, government
spending and taxes
Aggregate Demand Aggregate Supply
Imported and domestic input
costs, supply side mark-up, exchange
rate

Macroeconomic Determinants of Vietnam’s Inflation 2000-2010: Evidence and Analysis
26
Data To carry out estimations for macroeconomic determinants of Vietnam’s inflation, we use monthly secondary data covering the period from January 2001 to March 2010. These data were collected from the General Statistics Office (GSO), State Bank of Vietnam (SBV), Ministry of Finance (MoF), International Finance Statistics (IFS), International Rice Research Institute (IRRI) and HCMC Stock Exchange. Details about each series are discussed below. These data series can be grouped into two main groups: (1) conventional data that have previously been used in the case of Vietnam and (2) less conventional data that have rarely or even never been used in the studies about inflation determinants in Vietnam. Innovation of the data during the studied period can be observed in the Appendix. Conventional data series These data series appear in virtually all studies on inflation determinants not only in Vietnam but in the other countries as well. CPI: The monthly data on CPI were obtained from the GSO and re-based to the beginning of January 2000. Examination of the series shows a 200% increase over the studied period of the CPI (see Figure 11). Industrial output: Real income has been known in economic theory and proved empirically to affect demand for money and thus price. We use real industrial production value in 1994 prices as a proxy for real income. Money supply: Monetary policy has direct impact on inflation. Milton Friedman’s famous saying “Inflation is always and everywhere a monetary phenomenon,” although does not completely settle issues on causes of inflation, has made it necessary to include money in any study about inflation. In Vietnam, nominal money and credit growth are known to affect the rate of inflation. As reviewed above, Vo Tri Thanh et.al. (2000) and Carmen (2005) both confirmed the positive relationship between money/credit growth and inflation in Vietnam. An expansionary monetary policy together with inflation expectation often leads to actual inflation in the next phase of the business cycle (See Figure 9). Many have argued that Vietnam’s economic growth in recent years has depended mainly on the expansion of money and credit, not on real improvement in supply and productivity. Thus, any sign of overheating growth would be immediately translated into higher inflation. In other words, due to slow changes in income/output and in the velocity of money, most of the changes in money supply are translated into higher price levels. At the same time, increases in output are supposed to ease the demand pressures in the economy and thus reduce inflation. But due to the reliant on expansionary policy to growth, inflation in Vietnam does not appear to reduce as growth rate increases and only slowed down when the economy entered a recession (such as in 2009). However, other studies like IMF (2003) and Nguyen Viet Hung and Pfau (2008) show little or no significant effect on money on inflation. Obviously empirical results regarding the case of Vietnam are mixed. Reasons cited for these mixed results are the underdeveloped financial market and dollarization in Vietnam. To examine the relation between money and inflation, we use monthly data for M2 obtained from the IFS. We also add domestic credit (obtained from the same source) in our model as credit growth has been of great concerns in Vietnam in recent years. Exchange rate: As updated monthly nominal effective exchange rate is not available, we use the official exchange rate (E) as a proxy. Daily official exchange rate was obtained from the SBV and monthly average was calculated based on the daily series. As reviewed in Section 2,

Macroeconomic Determinants of Vietnam’s Inflation 2000-2010: Evidence and Analysis
27
the official exchange rate in Vietnam which for some periods has been kept rather rigid, is believed to exacerbate shocks to inflation and even caused increases in inflation. Past studies have shown only a small pass-through of exchange rate to inflation. Interest rate: We use monthly data on lending rates (per annum) obtained from the IFS and SBV as an indicator for interest rate. Empirical findings on the role of interest rate on inflation are also mix, as with the case of money. World oil price: Data on world oil price were collected from America’s Energy Information Administration (EIA). World oil price is measured in USD/barrel. Less conventional data As analyzed above, we include the following less conventional data in our model to make the economic model richer and more specific to the case of Vietnam. As data are not available for the indicator the economic model calls for, we substitute them with other proxies. As data for producers’ price index PPI, import price index PI, and accumulated budget deficits are available by quarter only monthly series have been inferred from quarterly data. World rice price: Data on world rice price were collected from International Rice Research Institute (IRRI). World rice price is measured in USD/ton. World rice price was used before in Pham Thi Thu Trang (2009) and IMF (2003) and found to have impact on CPI. Import price index: Import price index (PI) series was collected from the GSO and used as one of the proxies for world price. PI were calculated with the year 2000 as the base year. Producers’ Price Index: We obtain this data from the GSO. PPI were calculated with the year 2000 as the base year. Cumulative Budget Deficit: In our model, we use cumulative budget deficits which in turn is measured as the gap between budget revenue and budget expenditure. The data were collected from the MoF. Asset Prices: We collected three daily data series and obtained monthly averages for VNIndex, total break-even market value of listed firms and total trading value from the HCMC Stock Exchange. We only select trading value as a proxy to study the wealth effect caused by asset prices on inflation as it appears to move more in line with CPI. Tests Unit-root Tests Our first step is to check the above set of data series (in log form and seasonally adjusted) to see if they are stationary. Both Augmented Dickey-Fuller (ADF) test and Phillips Peron (PP) test were used to derive the accurate conclusion on unit roots of the variables. The number of lags in ADF test was selected according to Akaike Information Criterion (AIC), Schwarz Information Criterion (SIC) and LR Criterion. The test statistics suggest that all of the series have unit roots (non-stationary). However, their first differences show stationary which means all variables are integrated of order one I(1). The result of some of these unit-root tests are reported in tables 1A and 2A of the Appendix.

Macroeconomic Determinants of Vietnam’s Inflation 2000-2010: Evidence and Analysis
28
Cointegration Tests We anticipate certain long run relationships among variables of the model. In this step, we use Johansen cointegration test to check for long run relationships in accordance with economic theory. As all the variables are integrate of order one in levels, log values will be used directly (rather than first differences) in the cointegration test. Our economic model suggests there are three long run relations in our model, equivalent to three transmission channels to inflation: (i) PPP channel, (ii) aggregate demand channel and (iii) aggregate supply channel. For the PPP relationship, we use seasonally adjusted log forms of the CPI, import price index, and the official exchange rate i.e. cpi, pi, and e. The results of the test (reported in Table 3A of the Appendix) suggest cointegrating relations exist among the variables. For the aggregate demand relationship, we use seasonally adjusted log forms of the CPI, M2, industrial output and interest rate, i.e. cpi, m2, ind and in_rate. The results of the test are reported in Table 4A of the Appendix and suggest cointegrating relations exist among the variables. For the aggregate supply relationship, we use seasonally adjusted log forms of the CPI, PPI and the variables in the PPP relationship that affect the imported input cost i.e. cpi, ppi, pi and e. The results of the test are reported in Table 5A of the Appendix and suggest cointegrating relations exist among the variables. The error correction terms (ecms) from the Johansen tests will be included in our estimation of inflation determinants if they are statistically significant. Results of Vector Error Correction Model (VECM) We use VECM to test the determinants of monthly percentage change in domestic inflation. For this part we started with a baseline model with only conventional data that include CPI, industrial output, M2, interest rate, exchange rate and world price of oil. Then, we extend the model to add “less conventional data” and explore the effects they have on inflation. The base line model Six variables are included in this baseline model: CPI, industrial output, M2, interest rate, exchange rate and world price of oil. These variables have traditionally been included in international literature as well as the literature on Vietnam’s inflation. The contributions (to current literature on Vietnam’s inflation) that we have in this exercise include: a more up-to-date data base, confirmation as well as rejection of previous findings on inflation determinants in Vietnam. The short-run dynamics of the determinants of inflation under the baseline model are reported in Table 6A of the Appendix. Only significant statistics are reported. The most striking feature is that most of the variables are determined mainly by their own paste innovation. We will explore this point further when we carry out the variance decomposition. As for the determinants of inflation dynamics, the following observations can be made from the results. First, disturbances that deviate the long-run trend of the PPP relation (as measured by the error correction term - ECM) has a statistically significant but very modest impact on inflation while the equivalent term for the money demand relation is not significantly different from zero. These coefficients of the ECMs measure the speed of adjustment of the foreign exchange market and

Macroeconomic Determinants of Vietnam’s Inflation 2000-2010: Evidence and Analysis
29
the money market to disturbances. A small coefficient implies very low or even near zero speed of adjustment. This is an important finding because it shows that once these relations deviate from the long-run trend, it will take a very long time for the economy to revert back on track despite policy efforts. This has an important implication for policy against inflation: preventive measures with clear guidelines and targets for inflations are much better choices than trying to cope with high inflation after it already started. Also, a wrong choice of policy action will be hard to correct and high inflation will last long. Second, inflation varies negatively and slightly with changes in output growth. This result confirms the economic theory that faster output growth reduces the pressure on inflation. Third, the results confirmed past research in Vietnam that (short-run) past inflation plays a key role in determining current inflation. This high inertia is not surprising given the fact that public memory of hyperinflation during the 1980s and early 1990s and the double digit inflation of 2008 is still strong. Fourth, the results also confirm a previous research results on modest or almost insignificant role of money and interest rate on inflation in the short run. The impact of money growth on inflation only takes effect after 5 months. Increases in interest rate do have negative but very small impact on inflation. On the other hand, past inflation appears to influence positively on interest rate with 3 month lags implying passive and delayed monetary policy in response to inflation. Another key finding of the baseline model is that exchange rate devaluation appears to increase inflation. This result is different from past research results which show small to insignificant impact. This difference in results may be explained partly by the fact that previous studies used data from periods when the exchange rate was mostly kept rigid. Recently, since late 2008, the exchange rate has been devaluated more often and with bigger magnitudes. In addition, recent episodes of distortions in the foreign exchange market, especially in the parallel black market, in 2009 and 2010 due to declining trust in VND, speculations and dollarization have increased public expectations about returning inflation. This may contribute to the larger impact of exchange rate on inflation found in this study. However, the model uses official exchange rate declared by SBV rather than an effective exchange rate thus further studies need to be done using the effective exchange rate to have a stronger confirmation on the impact. Finally, the results confirm the findings of previous literature that world price do not appear to have significant impact on inflation. It should be noted, however, that the baseline model uses world price of oil as a proxy for world price and the government has been subsidizing gasoline prices. Thus the impact of changes in world oil prices does not seem to be significant. This finding will be double-checked using more accurate measures of world prices in the extended model below. The extended model We extend the baseline model to include “less conventional” data into the model. These data, as described above, include: credit, trading value of the stock market, import price index, world rice prices, and cumulative budget deficits. The extended model shows long-run cointegrating relationships, the error correction terms of which are included in the VECM. Economic theory suggests these long-run relationships are the PPP, aggregate demand (AD) and aggregate supply (AS) relationships. We use these relationships as restrictions in our VECM. The short-run dynamics of the model is reported in Table 7A of the Appendix. Again, only significant statistics are included. The following can be observed from the results.

Macroeconomic Determinants of Vietnam’s Inflation 2000-2010: Evidence and Analysis
30
The findings from the baseline model are reconfirmed in the extended model. First, the disturbances that deviate the long-run trend of the PPP relation (as measured by the EMC) has statistically significant but still very small impact on inflation. The speed of adjustment for the aggregate demand relation is again insignificant. The merits of the findings we had in the baseline model still hold true in the extended model. Second, past inflation is still the most important coefficient among determinants of inflation implying high inflation inertia in Vietnam. Inflation reverts itself only from month 6th. Third, the results obtained for the impact of exchange rate, money and interest rate as well as world oil prices are similar to the results from the baseline models. In addition, new and interesting findings can be concluded from the results of the extended model for the studied period. First, the residual from the aggregate supply relation is statistically significant and has slightly larger impact on inflation than that of the PPP relation implying a certain role of supply factors on inflation. However, changes in the growth rate of producers’ price index PPI does not appear to have significant short-run impact on inflation. On the other hand, 3-month lagged inflation has important impact on PPI confirming the fact that firms do adjust their pricing due to increases in CPI after certain lag. Second, money growth appears to have larger and longer short-run (though still small) impact on PPI than on inflation and the same goes for credit. This finding has an implication that money and credit policy affects the real economy more than it affects inflation which is influence mainly by public expectation. Also, short-run innovations of interest rate have a smaller but quicker impact on inflation than money growth does. Third, exchange rate does not only have impact on inflation but also on PPI with a longer lag. This is understandable given the more rigid pricing behaviors by firms and also because of the time lag in production from the time the inputs are imported to the time the products are sold by firms. Fourth, changes in budget deficits have no significant short-run impact on inflation but have a small (and mixed) impact on PPI after 4-5 month lag. Finally, world prices as measured by the imported price index rather than just world oil price show considerable impact on inflation and more profoundly on PPI during the studied period. This means the pass-through of international price shocks to producers is stronger than to consumers. Changes in world prices of oil and rice in particular has much smaller effects compared to that of the general imported price index with rice price has a slightly higher impact on consumer price than oil price. Variance decomposition To identify which part of the innovation of endogenous variables can be attributed to their own innovations and which to innovations of other variables, we carry out variance decomposition using Sim’s Recursive Choleski method (following the estimations of our extended VECM). The results show that in short-run (within 3 months) own shocks account for more than 80% of changes in inflation and most other variables. When we look at inflation in particular (Table 8A of the Appendix), we can see that shocks in lags of most variables (rather than inflation) cause very small changes in inflation in the short-run. Shocks to PPI only account for more than 5% of inflation variation after 4 months and shocks to credit after 5 months. The impact of shocks to money supply as well as interest rate stay at low level for at least 6 months implying the long lag it takes for money policy to have impact on inflation. Again, inflation response quicker with

Macroeconomic Determinants of Vietnam’s Inflation 2000-2010: Evidence and Analysis
31
stronger effect and for a longer period to changes in interest rate than to changes in money supply suggesting that interest rate is perhaps a better tool in coping with inflation. Impulse Response Functions Impulse response functions measure the responses of inflation to unanticipated shocks to the endogenous variables of the model. We choose a 24 months horizon and use Choleski decomposition method. The results (reported in Figure 2A in the Appendix) show that shock to money supply (an increase) has lags (5-6 months) before taking into effects but leads to a considerable increase in inflation. Shocks to interest rate and exchange rate do not have significant impact on inflation in the short-run. On the other hand, we also consider the effects of unanticipated inflation shock on other endogenous variable of the model. An unexpected increase in inflation leads to short-run increase in PPI and interest rate but a short-run decrease in money supply and budget deficits and a devaluation of the exchange rate. While the increase in PPI lasts longer than a year, the reduction in money supply and budget deficits and the increase in interest rate only last for about 6-8 months. The response we see from the model to inflation shock is a monetary contraction and the tightening of budget expenditure which revert themselves after 6-8 months. Policy Discussion and Concluding Remarks Policy discussion The empirical findings in this study lead to a number of policy insights. First, it is found that the role of the public’s memory and expectation on inflation are both crucial in shaping the current inflation. This implies the significant role of credibility of government’s policy toward inflation. Memory about a period of high inflation in the past seems only to begin to fade away after 6 months of consistently low and stable inflation. This implies that for fighting inflation, only by successfully keeping inflation low for at least 6 months, can the government start to rebuild the public’s confidence about a more stable environment of the general price level. This is a good suggestion for the government to be patient in fighting inflation. Six months can be considered as a lower threshold for the government efforts to maintain a low inflation environment in order to rebuild its credibility concerning a serious commitment against inflation, and therefore macroeconomic stability. It is also shown that most of the changes in major macro variables (such as exchange rate, money and credit growth) affect the consumer price index several months before the producer price index. This implies the relative strength of expectation channel vs. the real channel (transmitting through the real production process). The combination of a long memory and sensitive expectation in affecting the inflation explains a fact that it is hard to fight inflation when it is high, and it is also hard to maintain price stable when it is low. In other words, inflation is very sensitive to the current conditions, especially those that can lead to changes in the public’s expectations. Low inflation is in fact an unstable or fragile condition, while high inflation tends to be self-containing in the Vietnamese economy. Second, despite the government’s common explanation that inflation is mostly imported, inflation is basically an internal problem. We find that the world prices tend to play a less significant role than other factors. The world prices, however, do have important effects on

Macroeconomic Determinants of Vietnam’s Inflation 2000-2010: Evidence and Analysis
32
production prices. The production prices in fact do not intermediately transmit into consumer prices (inflation), but take some months to realize its impact. Third, the speeds of adjustment of the foreign exchange market and the money market to disturbances are very low or even near zero. This shows that once these markets deviate from the long-run trend, it will take a very long time for the economy to revert back on track despite policy efforts. This has an important implication for policy against inflation: preventive measures with clear guidelines and targets for inflations are much better choices than trying to cope with high inflation after it already started. Also, a wrong choice of policy action will be hard to correct and high inflation will last long. On the other hand, the speed of adjustment from disturbances in the supply side has higher (though still small) impact on inflation. Even though more careful experiments needed to be done with more data on the real side of the economy such as wages and input costs, this initial finding implies that stimulating the real economy through increasing productivity and output growth have better impact on controlling inflation in the longer run than monetary and non-monetary measures. Fourth, the government did have reactions against inflation by both fiscal and monetary tools, but normally acted lately or passively in most of the cases. For fiscal tools, it is rather easy to understand and accept the fact, as it takes time for an adjustment in fiscal plan to be approved and implemented. However, monetary tools are also seen as being carried out at a considerable lag after the first signals of inflation occur. This may be explained with the fact that inflation specification is always a controversial issue, where the government is very reluctant to accept the situation of inflation. The government usually blames the worse situation for some “objective” or “external” reasons. It therefore takes time to turn the inflation issue from the public’s consciousness to the government’s one, and thus an appropriate monetary reaction. For example, it is shown in the paper that in most of the cases, interest rates are adjusted following the changes in CPI after about 3 months. These adjustments are indeed to make the interest rates more comparable with the current inflation rather than to be an action of tightening monetary policy to fight against inflation. Even when a tightening monetary policy takes place, it takes more than 5 months in average to produce effects on the inflation. By that time, inflation rate has been high for 7 to 8 months. This would have created a long memory on inflation and therefore the cost of fighting inflation will be high. It seems that among monetary tools, raising interest rate has a prompt effect on inflation in comparison with the money growth and credit tightening. However, the effect of a change in interest rate is rather weak. Therefore, the monetary tools are not a really ones for quick response as assumed. Fifth, in contrast to previous study results, the model found considerable role of exchange rate, a devaluation in particular, on increasing pressures on inflation. This difference in results may be explained partly by the fact that previous studies used data from periods when the exchange rate was mostly kept rigid. Recently, since late 2008, the exchange rate has been devaluated more often and with bigger magnitudes. In addition, recent episodes of distortions in the foreign exchange market, especially in the parallel black market, in 2009 and 2010 due to declining trust in VND, speculations and dollarization have increased public expectations about returning inflation. This may contribute to the larger impact of exchange rate on inflation found in this study. Finally, the study did not show clear impact of budget deficits on inflation during the study period. This does not mean that budget deficits have no inflationary pressures. The reason for this is that the financing of budget deficits has two opposing impacts on inflation. On the one hand, financing budget deficits through government borrowing increases interest rate due to

Macroeconomic Determinants of Vietnam’s Inflation 2000-2010: Evidence and Analysis
33
higher demand for funds in the loan markets. This is equivalent to tightening monetary policy and thus helps reduce inflation to some extent. On the other hand, financing budget deficits through money creation (if any) is equivalent to expanding money supply and thus causes inflationary pressures. These two opposing forces mitigate and sometimes cancel out each other’s effect on inflation. From the above characteristics of inflation in Vietnam, one may come to a policy implication that the Vietnamese government should have a strong commitment not only in fighting against inflation when it is high, but also, and more importantly, in keeping it low when it is low. This strategy is actually hard to follow as far as the government still prefers economic growth to macroeconomic stability. Concluding remarks In this paper, we review the dynamics of Vietnam’s inflation over the past decade in close relation with various changes in economic environment as well as macroeconomic policy. In addition, the review of literature on determinants of inflation in general and the particular case of Vietnam helps us to form a list of potential macroeconomic determinants of inflation for Vietnam and formulate hypothesis regarding their correlation. The paper then explores the macroeconomic determinants of inflation in Vietnam for the period from 2000-2010. The model used in the paper specifies three channels through which various endogenous and exogenous variables can affect prices. These channels are the purchasing power parity (PPP) channel, the aggregate demand (AD) channel and the aggregate supply (AS) channel. The main findings of the paper are (1) inflation inertia is high and an important determinant of current inflation in Vietnam; (2) adjustment speeds are very slow in both the foreign exchange market and the money market implying difficulty for inflation to be controlled effectively once it starts to climb; (3) the exchange rate pass-through is found to be considerable in the short-run where a devaluation leads to higher prices while cumulative budget deficits do not play an important role in inflation determination; (4) money supply and interest rate has delayed impact on short-run inflation; and (5) short-run pass-through of international inflation to domestic prices is significant. The main limitation of the study are the use of official exchange rate between USD and VND rather than the effective exchange rate between VND and its trading partners so the PPP relation is not fully reflected due to the neglect of the role of other currencies in international trade. However, using the official rate allows us to see the impact of devaluation on inflation and the pressure of higher inflation on the official exchange rate. Another limitation is the lack of data for wages and firm pricing behaviors as supply side factors that potentially affect inflation. However, reliable data on these factors cannot be obtained. Potentially interesting findings could be found if such data can be observed. As the study focus mainly on macroeconomic determinants of inflation, it ignores the role of micro-level determinants such as market structures, localities, types of commodities… that may help to explain the volatility as well as persistence of inflation. These would be ideal extensions to our model.

Macroeconomic Determinants of Vietnam’s Inflation 2000-2010: Evidence and Analysis
34
References ADB (2009), The Key Indicators for Asia and the Pacific 2009, Asian Development Bank. Akinboade, O., F. Siebrits and E. Niedermeier (2004), “The Determinants of Inflation in South
Africa: An Econometric Analysis,” AERC Research Paper 143 Baker, C, P. Tumbarello and F. Ahmed (2006), “Vietnam Selected Issues,” IMF Country Report
No. 06/422 Washington D.C. IMF Bodart, V. (1996), “Multiple exchange rates, fiscal deficits and inflation dynamics,” IMF Working
Paper WB/96/56. Washington D.C. IMF Camen, U. (2006), “Monetary Policy in Vietnam: The Case of a Transition Country,” BIS
Working Paper No. 31. Bank for International Settlement, Basel. Calvo, G (1983), “Staggered Prices in a Utility Maximizing Framework,” Journal of Monetary
Economics, 12, 383-398. Chhibber, A. (1991), “Africa’s Rising Inflation: Causes, Consequences, and Curse,” WB
Working Paper WPS 577 Washington D.C. WB Coxhead, Ian (2007), “A New Resource Curse? Impacts of China’s Boom on Comparative
Advantage and Resource Dependence in Southeast Asia,” World Development, Vol. 35 (7): 1099–1119.
Fielding, D. (2009), “Non-monetary Determinants of Inflation Volatility: Evidence from Nigeria,”
Journal of African Economies, Vol. 19, No. 1, pp. 111-139 Freidman, M. (1968), “The Role of Monetary Policy,” American Economic Review, 58, 1-17 Frisch, H. (1983), Theories of Inflation, Cambridge University Press Gali, J. and M. Gertler (1999), “Inflation Dynamics: A Structural Econometric Analysis,” Journal
of Monetary Economics, No. 44, pp. 195-222 Goujon, M (2006), “Fighting Inflation in a Dollarized Economy: the Case of Vietnam,” Journal of
Comparative Economics No.34, pp. 564–581 GSO (2010) General Statistics Office database Guimaraes-Filho, R. and D. Crichton (2005), “Inflation Dynamics in Malysia,” IMF Working
Paper, Washington D.C. IMF IMF (2003), “Vietnam: Statistical Appendix”, IMF Country Report No. 03/382, International
Monetary Fund. IMF(2006), “Vietnam: Statistical Appendix”, IMF Country Report No. 06/52, International
Monetary Fund. IMF (2009), “Vietnam: 2008 Article IV Consultation—Staff Report; Staff Supplement and
Statement; Public Information Notice on the Executive Board Discussion; and Statement by the Executive Director for Vietnam”, IMF Country Report No. 09/110, International Monetary Fund.

Macroeconomic Determinants of Vietnam’s Inflation 2000-2010: Evidence and Analysis
35
Kovanen, A. (2006), “Why Do Prices in Sierra Leone Change So Often? A Case Study Using Micro-Level Price Data,” IMF Working Paper WP/06/03
Laryea, S. and U. Sumaila (2001), “Determinants of Inflation in Tanzania,” CMI Working Paper
2001:12, Chr. Michelsen Institute Le Anh Tu Packard (2005), “Monetary Policy in Vietnam: Alternative to Inflation Targetting,”
Paper prepared for the Danang July 28 – 30, 2005 Summer Symposium on Continuing Economic and Social Renovation for Development.
Le Viet Hung and W. Pfau (2008), “VAR Analysis of the Monetary Transmission Mechanism in
Vietnam,” http://ssrn.com/abstract=1257854 Leheyda, N. (2005), “Inflation Determinants in Ukraine: A Cointegration Approach,” Research
Paper, University of Mennheim Lim, Cheng Hoon and L. Papi (1997), “An Econometric Analysis of the Determinants of Inflation
in Turkey,” IMF Working Paper WP/97/170 Nguyễn ðức Thành and ðinh Tuấn Minh (2010), “The Vietnamese Economy in 2005-2009 and
Prospects”, Review of World Economic and Political Issues, Vol. 2010 (2): 60-70. Nguyen Thi Thu Hang, Dinh Tuan Minh, To Trung Thanh, Le Hong Giang, Pham Van Ha
(2010), “Exchange Rate Policy: Choices for Recovery,” in Nguyen Duc Thanh edt. Vietnam Annual Economic Report 2010: Choices for Sustainable Growth, Tri Thuc Publishing House.
Nguyen Thi Thuy Vinh and S. Fujita (2007), “The Impact of Real Exchange Rate on Output and
Inflation in Vietnam: A VAR Approach,” Discussion Paper No. 0625 Peiris, S. (2003), “Inflation Dynamics in Vietnam,” Vietnam: Selected Issues, IMF Country
Report No. 03.281 Phelps, E. (1967), “Phillips Curves, Expectation of Inflation, and Optimal Inflation over Time,”,
Economica, 135, 254-281 Phillips, A. (1958), “The Relation between Unemployment and the Rate of Change of Money
Wage Rates in the United Kingdom, 1861-1857,” Economica, 25, 283-99 Pham The Anh (2008) “Ứng dụng mô hình SVAR trong việc xác ñịnh hiệu ứng của chính sách
tiền tệ và dự báo lạm phát ở Việt Nam” Pham The Anh (2009), “Mô hình ước lượng các nhân tố quyết ñịnh lạm phát ở Việt Nam.” Pham Thi Thu Trang (2009), “Các yếu tố tác ñộng tới lạm phát tại Việt Nam – Phân tích chuỗi
thời gian phi tuyến,” Tạp chí Kinh tế và Dự báo số 12 (452) Phạm Văn Hà (2010), “Overview of the Vietnamese Economy in 2009,” Chapter 2 in Nguyễn
ðức Thành (2010), Vietnam Annual Economic Report 2010: Choices for Sustainable Growth, Knowlegde Publishing House, Ha Noi.
Rudd J. and K. Whelan (2005), “Modelling Inflation Dynamics: A Critical Review of Recent
Research,” Finance and Economics Discussion Series, Divisions of Research & Statistics and Monetary Affairs, Federal Reserve Board, Washington, D.C.

Macroeconomic Determinants of Vietnam’s Inflation 2000-2010: Evidence and Analysis
36
Saini, K.G. (1982), “The Monetarist Explanation of Inflation: the Experience of Six Asian Countries,” World Development, 10 (10): 871-84
Sargent, T. (1971), “A Note on the “Accelerationist’ Controversy,” Journal of Money, Credit and
Banking, 3, 721-725 Sims, C.A. (1986), “Are Forecasting Models Usable for Policy Analysis?” Federal Bank of
Minneapolis Quarterly Review 10, pp. 2-16. Taylor, J. (1979) “Staggered Wage Setting in a Macro Model,” American Economic Review,
Papers and Proceedings, Vol. 69, 108-133. Truong Van Phuoc and Chu Hoang Long, “Chỉ số giá tiêu dùng Việt Nam và các yếu tố tác
ñộng: Phương pháp tiếp cận ñịnh lượng,” UNDP (2008), “Food Inflation in Vietnam: Analysis of Trends and Policy Implications,” Research
Paper Vo Van Minh (2009), “Exchange Rate Pass-Through and Its Implications for Inflation in
Vietnam,” Working Paper 0902, Vietnam Development Forum Vo Tri Thanh, Dinh Hien Minh, Do Xuan Truong, Hoang Van Thanh and� Pham Chi Quang
(2000), “Exchange Rate Arrangement in Vietnam: Information Content and Policy Options,” East Asian Development Network (EADN), Individual Research Project
Woodford, M. (2003), Interest and Prices, Princeton University Press

Macroeconomic Determinants of Vietnam’s Inflation 2000-2010: Evidence and Analysis
37
Appendices
Figure 1A. Innovations of data in log term, 2001-20 10
9.6
10.0
10.4
10.8
11.2
01 02 03 04 05 06 07 08 09 10
IND
4.6
4.7
4.8
4.9
5.0
5.1
5.2
5.3
01 02 03 04 05 06 07 08 09 10
PPI
4.4
4.6
4.8
5.0
5.2
5.4
01 02 03 04 05 06 07 08 09 10
CPI
12.0
12.5
13.0
13.5
14.0
14.5
01 02 03 04 05 06 07 08 09 10
M2
11.5
12.0
12.5
13.0
13.5
14.0
14.5
15.0
01 02 03 04 05 06 07 08 09 10
CREDIT
8
10
12
14
16
18
20
01 02 03 04 05 06 07 08 09 10
IN_RATE

Macroeconomic Determinants of Vietnam’s Inflation 2000-2010: Evidence and Analysis
38
9.55
9.60
9.65
9.70
9.75
9.80
9.85
01 02 03 04 05 06 07 08 09 10
EX_RATE
9.2
9.6
10.0
10.4
10.8
11.2
11.6
01 02 03 04 05 06 07 08 09 10
P_DEBT
10
11
12
13
14
15
01 02 03 04 05 06 07 08 09 10
TR_VAL
4.5
4.6
4.7
4.8
4.9
5.0
5.1
01 02 03 04 05 06 07 08 09 10
PI
2.8
3.2
3.6
4.0
4.4
4.8
01 02 03 04 05 06 07 08 09 10
WP_OIL
5.0
5.5
6.0
6.5
7.0
01 02 03 04 05 06 07 08 09 10
WP_RICE

Macroeconomic Determinants of Vietnam’s Inflation 2000-2010: Evidence and Analysis
39
Table 1A. Unit root test on variables at level
Null Hypothesis: Unit root (individual unit root process) Sample: 2001M01 2010M03 Exogenous variables: Individual effects Automatic selection of maximum lags Automatic lag length selection based on SIC: 0 to 7 Total number of observations: 1294 Cross-sections included: 12 Method Statistic Prob.** ADF - Fisher Chi-square 7.12641 0.9997 ADF - Choi Z-stat 4.51477 1.0000 ** Probabilities for Fisher tests are computed using an asymptotic Chi square distribution. All other tests assume asymptotic normality
Intermediate ADF test results INF
Series Prob. Lag Max Lag Obs IND 0.7432 2 12 108 PPI 0.9989 1 12 109 CPI 0.9997 7 12 103 M2 0.9653 3 12 107
CREDIT 0.9612 3 12 107 IN_RATE 0.1652 1 12 109 EX_RATE 0.9886 1 12 109 P_DEBT 0.7069 4 12 106 TR_VAL 0.8417 0 12 110
PI 0.7618 1 12 109 WP_OIL 0.7603 1 12 109
WP_RICE 0.7313 2 12 108

Macroeconomic Determinants of Vietnam’s Inflation 2000-2010: Evidence and Analysis
40
Table 2A. Unit root test on variables at first diff erence
Null Hypothesis: Unit root (individual unit root process) Sample: 2001M01 2010M03 Exogenous variables: Individual effects Automatic selection of maximum lags Automatic lag length selection based on SIC: 0 to 3 Total number of observations: 1296 Cross-sections included: 12 Method Statistic Prob.** ADF - Fisher Chi-square 395.197 0.0000 ADF - Choi Z-stat -15.9950 0.0000 ** Probabilities for Fisher tests are computed using an asymptotic Chi -square distribution. All other tests assume asymptotic normality. Intermediate ADF test results D(INF) Series Prob. Lag Max Lag Obs D(IND) 0.0000 1 12 108 D(PPI) 0.0540 0 12 109 D(CPI) 0.0189 3 12 106 D(M2) 0.0131 2 12 107 D(CREDIT) 0.0100 2 12 107 D(IN_RATE) 0.0000 0 12 109 D(EX_RATE) 0.0000 0 12 109 D(P_DEBT) 0.0059 3 12 106 D(TR_VAL) 0.0000 0 12 109 D(PI) 0.0157 0 12 109 D(WP_OIL) 0.0000 0 12 109 D(WP_RICE) 0.0000 1 12 108

Macroeconomic Determinants of Vietnam’s Inflation 2000-2010: Evidence and Analysis
41
Table 3A. Johansen cointegration test on PPP relati on
Sample (adjusted): 2001M10 2010M03 Included observations: 102 after adjustments Trend assumption: Linear deterministic trend Series: CPI PI EX_RATE Lags interval (in first differences): 1 to 8
Unrestricted Cointegration Rank Test (Trace) Hypothesized Trace 0.05 No. of CE(s) Eigenvalue Statistic Critical Value Prob.**
None * 0.373216 83.37218 29.79707 0.0000
At most 1 * 0.286475 35.72262 15.49471 0.0000 At most 2 0.012603 1.293713 3.841466 0.2554
Trace test indicates 2 cointegrating eqn(s) at the 0.05 level * denotes rejection of the hypothesis at the 0.05 level **MacKinnon-Haug-Michelis (1999) p-values
Unrestricted Cointegration Rank Test (Maximum Eigenvalue) Hypothesized Max-Eigen 0.05 No. of CE(s) Eigenvalue Statistic Critical Value Prob.**
None * 0.373216 47.64956 21.13162 0.0000
At most 1 * 0.286475 34.42891 14.26460 0.0000 At most 2 0.012603 1.293713 3.841466 0.2554
Max-eigenvalue test indicates 2 cointegrating eqn(s) at the 0.05 level * denotes rejection of the hypothesis at the 0.05 level **MacKinnon-Haug-Michelis (1999) p-values

Macroeconomic Determinants of Vietnam’s Inflation 2000-2010: Evidence and Analysis
42
Table 4A. Johansen cointegration test on AD relatio n
Sample (adjusted): 2001M10 2010M03 Included observations: 102 after adjustments Trend assumption: Linear deterministic trend Series: CPI M2 IN_RATE IND Lags interval (in first differences): 1 to 8
Unrestricted Cointegration Rank Test (Trace) Hypothesized Trace 0.05 No. of CE(s) Eigenvalue Statistic Critical Value Prob.**
None * 0.179773 51.14095 47.85613 0.0238
At most 1 * 0.166717 30.92724 29.79707 0.0369 At most 2 0.105494 12.32424 15.49471 0.1420 At most 3 0.009299 0.952897 3.841466 0.3290
Trace test indicates 2 cointegrating eqn(s) at the 0.05 level * denotes rejection of the hypothesis at the 0.05 level **MacKinnon-Haug-Michelis (1999) p-values
Unrestricted Cointegration Rank Test (Maximum Eigenvalue) Hypothesized Max-Eigen 0.05 No. of CE(s) Eigenvalue Statistic Critical Value Prob.**
None 0.179773 20.21371 27.58434 0.3266
At most 1 0.166717 18.60300 21.13162 0.1089 At most 2 0.105494 11.37135 14.26460 0.1366 At most 3 0.009299 0.952897 3.841466 0.3290
Max-eigenvalue test indicates no cointegration at the 0.05 level * denotes rejection of the hypothesis at the 0.05 level **MacKinnon-Haug-Michelis (1999) p-values

Macroeconomic Determinants of Vietnam’s Inflation 2000-2010: Evidence and Analysis
43
Table 5A. Johansen cointegration test on AS relatio n
Sample (adjusted): 2001M10 2010M03 Included observations: 102 after adjustments Trend assumption: Linear deterministic trend Series: CPI PPI PI EX_RATE Lags interval (in first differences): 1 to 8
Unrestricted Cointegration Rank Test (Trace) Hypothesized Trace 0.05 No. of CE(s) Eigenvalue Statistic Critical Value Prob.**
None * 0.396425 107.3546 47.85613 0.0000
At most 1 * 0.334361 55.85626 29.79707 0.0000 At most 2 0.108581 14.34144 15.49471 0.0740 At most 3 0.025335 2.617435 3.841466 0.1057
Trace test indicates 2 cointegrating eqn(s) at the 0.05 level * denotes rejection of the hypothesis at the 0.05 level **MacKinnon-Haug-Michelis (1999) p-values
Unrestricted Cointegration Rank Test (Maximum Eigenvalue) Hypothesized Max-Eigen 0.05 No. of CE(s) Eigenvalue Statistic Critical Value Prob.**
None * 0.396425 51.49833 27.58434 0.0000
At most 1 * 0.334361 41.51482 21.13162 0.0000 At most 2 0.108581 11.72401 14.26460 0.1214 At most 3 0.025335 2.617435 3.841466 0.1057
Max-eigenvalue test indicates 2 cointegrating eqn(s) at the 0.05 level * denotes rejection of the hypothesis at the 0.05 level **MacKinnon-Haug-Michelis (1999) p-values

Macroeconomic Determinants of Vietnam’s Inflation 2000-2010: Evidence and Analysis
44
Table 6A. Baseline VECM results
Vector Error Correction Estimates Sample (adjusted): 2001M08 2010M03 Included observations: 104 after adjustments Standard errors in ( ) & *, **, *** denote significant at 10%, 5% and 1%, respectively
LR test for binding restrictions (rank = 2): Chi-square(3) 9.548179 Probability 0.022824
Error Correction: D(IND) D(CPI) D(M2) D(IN_RATE) D(EX_RATE) CointEq1(PPP) 0.001130** (0.00060)
CointEq2 (AD) -0.022750 (0.01379)
D(IND(-1)) -0.030960** (0.01675)
D(IND(-2)) -0.028791** (0.01441)
D(IND(-3)) -0.025288** (0.01212)
D(IND(-4)) -0.023514** (0.01031)
D(IND(-5)) -0.016405** (0.00800)
D(CPI(-1)) 0.507602*** (0.14540)
D(CPI(-3)) 0.539215*** 51.80418* (0.14570) (27.7660)
D(CPI(-5)) 0.251694** (0.12307)
D(CPI(-6)) -0.259352** (0.11439)
D(M2(-5)) 0.114689*** (0.03920)
D(IN_RATE(-2)) 0.002753*** (0.00093)
D(IN_RATE(-3)) -0.002615*** (0.00099)
D(IN_RATE(-4)) 0.001670* (0.00094)
D(IN_RATE(-5)) -0.001948** -0.519141*** (0.00094) (0.17854)
D(EX_RATE(-1)) 0.226803** -0.656594* (0.09911) (0.33349)
D(EX_RATE(-2)) -0.247623** (0.10156)
D(EX_RATE(-3)) 0.286577*** (0.10341)
D(EX_RATE(-4)) -46.39706* (26.9498)
D(WP_OIL(-1)) 0.009779*

Macroeconomic Determinants of Vietnam’s Inflation 2000-2010: Evidence and Analysis
45
(0.00530) C 0.012037* (0.00637) R-squared 0.795503 0.853476 0.527230 0.572230 0.452223
Adj. R-squared 0.675950 0.767815 0.250841 0.322149 0.131984 Sum sq. resids 0.454472 0.000663 0.007508 24.08087 0.001708 S.E. equation 0.083617 0.003194 0.010747 0.608667 0.005126 F-statistic 6.654010 9.963479 1.907565 2.288180 1.412142 Log likelihood 134.9469 474.5069 348.3132 -71.49501 425.2975 Akaike AIC -1.845132 -8.375133 -5.948331 2.124904 -7.428798 Schwarz SC -0.853485 -7.383486 -4.956685 3.116551 -6.437151 Mean dependent 0.010744 0.007003 0.020402 0.042680 0.002109 S.D. dependent 0.146890 0.006628 0.012417 0.739286 0.005502

Macroeconomic Determinants of Vietnam’s Inflation 2000-2010: Evidence and Analysis
46
Table 7A. Extended VECM results Vector Error Correction Estimates Sample (adjusted): 2001M08 2010M03 Included observations: 104 after adjustments
Standard errors in ( ) & *, **, *** denote significant at 10%, 5% and 1%, respectively
LR test for binding restrictions (rank = 3):
Chi-square(20) 407.6980 Probability 0.000000
Error Correction: D(IND) D(PPI) D(CPI) D(M2) D(CREDIT) D(IN_RATE) D(EX_RATE) D(P_DEBT) D(TR_VAL) CointEq1(PPP) -0.038466* (0.02210)
CointEq2(AD) 0.052330 (0.03959)
CointEq3(AS) 0.100670** (0.04598)
D(CPI(-1)) -1.318734* (0.67163)
D(CPI(-3)) 0.359712** 0.580655*** (0.15708) (0.16598)
D(CPI(-6)) -0.356607** (0.16548)
D(M2(-3)) 0.233534*** 0.117679* (0.05848) (0.06179)
D(M2(-4)) 0.595684* (0.30658)
D(M2(-5)) 0.173791** (0.07748)
D(CREDIT(-1)) 0.090526** -0.333680* (0.04503) (0.16911)
D(CREDIT(-5)) 18.90321** (7.81399)
D(CREDIT(-6)) 0.132456**

Macroeconomic Determinants of Vietnam’s Inflation 2000-2010: Evidence and Analysis
47
(0.05269)
D(IN_RATE(-1)) -0.002385* -
0.012570*** -0.510377** (0.00124) (0.00442) (0.21009)
D(IN_RATE(-2)) -0.590047** (0.25606)
D(IN_RATE(-3)) -0.003263** -0.475447** (0.00129) (0.21711)
D(IN_RATE(-6)) -0.020459** (0.00905)
D(EX_RATE(-2)) 1.501310*** -0.374874** 2.510492** (0.54747) (0.18394) (0.98757)
D(EX_RATE(-3)) 0.243256* 1.186950** (0.13446) (0.47788)
D(EX_RATE(-4)) 0.501922** 0.554607** (0.24322) (0.25698)
D(EX_RATE(-5)) 0.427214* 1.579643* 2.201279* (0.24719) (0.92829) (1.23253)
D(P_DEBT(-1)) -1.730387* -0.172000* 0.104893*** -
4.461876** (0.93141) (0.09795) (0.03291) (2.25295)
D(P_DEBT(-2)) 0.077215*** -2.905588* (0.02451) (1.67771)
D(P_DEBT(-4)) -0.056626** (0.02803)
D(P_DEBT(-5)) 0.048651** (0.02286)
D(P_DEBT(-6)) 0.198223* (0.10051)
D(PI(-1)) -10.07349* 0.302765** 0.292792* -2.084422** (5.34579) (0.14970) (0.15818) (1.01414)
D(PI(-2)) 0.334365* (0.19219)
D(PI(-3)) 53.10642* (30.9452)
D(PI(-5)) 0.448763*** 0.406398*** -17.91753*

Macroeconomic Determinants of Vietnam’s Inflation 2000-2010: Evidence and Analysis
48
(0.12461) (0.13166) (10.7630) D(PI(-6)) -0.224043* -0.318403** 0.803692* 3.265324***
(0.12276) (0.12971) (0.46099) (0.83158) D(WP_OIL(-1)) 0.022041*** -0.084821*
(0.00798) (0.05114)
D(WP_OIL(-6)) 0.576816* -
0.033189*** -0.025790*** (0.30575) (0.00856) (0.00905)
D(WP_RICE(-1)) 0.027654** 0.031817*** (0.01145) (0.01210)
D(WP_RICE(-5)) 0.020458* 6.346063*** 0.061186*** (0.01040) (1.75461) (0.01241)
D(WP_RICE(-6)) 6.008803** (2.53380)
C -
0.010456*** (0.00328)
R-squared 0.894540 0.959219 0.954655 0.836773 0.791742 0.896152 0.906174 0.930560 0.856030 Adj. R-squared 0.612056 0.849984 0.833195 0.399559 0.233908 0.617989 0.654855 0.744559 0.470395 Sum sq. resids 0.234374 0.000184 0.000205 0.002592 0.004570 5.845999 0.000293 0.008435 1.371299 S.E. equation 0.091490 0.002562 0.002707 0.009622 0.012775 0.456931 0.003233 0.017356 0.221303 F-statistic 3.166700 8.781220 7.859852 1.913873 1.419314 3.221676 3.605666 5.002998 2.219796 Log likelihood 169.3823 541.2247 535.4973 403.6136 374.1320 2.119327 517.0477 342.2585 77.51928 Akaike AIC -1.795813 -8.946628 -8.836487 -6.300262 -5.733308 1.420782 -8.481686 -5.120356 -0.029217 Schwarz SC 0.136626 -7.014189 -6.904048 -4.367823 -3.800869 3.353222 -6.549247 -3.187917 1.903223 Mean dependent 0.010744 0.005861 0.007003 0.020402 0.023961 0.042680 0.002109 0.018092 0.023304 S.D. dependent 0.146890 0.006615 0.006628 0.012417 0.014595 0.739286 0.005502 0.034341 0.304096

Macroeconomic Determinants of Vietnam’s Inflation 2000-2010: Evidence and Analysis
49
Table 8A. Variance Decomposition of CPI
Period S.E. IND PPI CPI M2 CREDIT IN_RATE EX_RATE P_DEBT TR_VAL PI WP_OIL WP_RICE 1 0.091490 0.055616 1.944485 97.99990 0.000000 0.000000 0.000000 0.000000 0.000000 0.000000 0.000000 0.000000 0.000000
2 0.107721 1.295910 3.256676 87.27775 0.449794 0.947576 1.055727 0.222478 0.116934 3.00E-07 0.036591 1.333131 4.007434 3 0.115444 1.628797 4.986047 80.18828 0.439092 2.653534 0.471194 1.040999 0.077626 0.714945 0.025057 1.561710 6.212715 4 0.123700 0.794632 5.398001 77.16246 0.673287 4.265145 0.286160 1.822734 0.725011 0.346545 0.606896 0.944275 6.974851 5 0.131903 0.754905 8.401898 71.15065 0.522207 7.761343 0.527098 1.184001 1.167485 0.221000 0.867410 0.797908 6.644091 6 0.153946 0.498965 9.725187 67.50246 0.402032 9.288752 1.024140 0.764286 1.669691 0.156497 2.380502 0.707519 5.879967 7 0.172866 0.405000 12.04409 63.12409 0.395437 9.917197 1.551216 0.606102 1.818211 0.110299 3.423547 0.766507 5.838310 8 0.187499 0.327286 12.78731 56.60595 0.299199 11.42749 4.621835 1.303545 2.099077 0.189085 4.578581 0.669854 5.090797 9 0.206320 0.249438 11.92975 49.91643 0.229287 11.39785 9.279221 3.180149 2.105618 0.417838 6.673859 0.729371 3.891187 10 0.223554 0.243432 10.16010 41.71817 0.395215 10.52876 15.43776 7.502547 1.812264 0.762950 7.838804 0.675402 2.924600 11 0.233642 0.305109 7.637867 32.95792 0.987214 8.906086 22.28570 13.29126 1.339224 1.253628 8.127600 0.631191 2.277206 12 0.242750 0.391580 5.533045 25.19095 2.010553 6.950506 27.03578 18.77922 0.974151 2.075940 8.449320 0.579090 2.029867 13 0.250946 0.342027 3.961674 18.31959 3.505154 5.207066 32.22378 23.15852 0.681684 2.664438 7.691436 0.406788 1.837832 14 0.256092 0.335628 3.412872 13.32840 5.060302 3.769534 35.14053 26.05307 0.546550 3.101951 6.960971 0.289616 2.000576 15 0.261050 0.300344 3.434597 10.17342 6.443155 2.795205 36.12042 28.02514 0.500165 3.538446 6.329233 0.213541 2.126333 16 0.269202 0.224447 3.818115 7.898846 7.522645 2.125636 36.95251 29.16493 0.487069 3.921915 5.481254 0.164427 2.238201 17 0.276056 0.176854 4.447684 6.432288 8.390655 1.674134 36.80343 29.64181 0.515529 4.290006 5.010754 0.130133 2.486722 18 0.279659 0.157809 4.960525 5.543069 9.116141 1.401388 36.61767 29.84990 0.482561 4.587359 4.635872 0.111094 2.536608 19 0.285989 0.165405 5.727037 4.984222 9.576601 1.236534 36.43623 29.85796 0.491286 4.689123 4.184221 0.096650 2.554731 20 0.297815 0.180628 6.440531 4.783069 9.914628 1.125865 35.79324 29.71976 0.498322 4.848365 3.973199 0.084693 2.637701 21 0.310132 0.255645 6.937203 4.822558 10.17321 1.103758 35.41920 29.52082 0.485197 4.894325 3.722344 0.079154 2.586579 22 0.319628 0.312964 7.572550 4.984395 10.41229 1.103595 34.79036 29.28263 0.516312 4.898855 3.499689 0.072820 2.553534 23 0.351485 0.379363 8.035890 5.451166 10.59484 1.147476 33.96385 28.98267 0.527969 4.900568 3.391177 0.073368 2.551663 24 0.382828 0.519869 8.395639 6.159217 10.65197 1.317831 33.24019 28.63328 0.525517 4.783841 3.229959 0.070037 2.472645
Cholesky Ordering: IND PPI CPI M2 CREDIT IN_RATE EX_RATE P_DEBT TR_VAL PI WP_OIL WP_RICE

Macroeconomic Determinants of Vietnam’s Inflation 2000-2010: Evidence and Analysis
50
Figure 2A. Impulse response functions
-.02
-.01
.00
.01
.02
.03
2 4 6 8 10 12 14 16 18 20 22 24
Response of CPI to IND
-.02
-.01
.00
.01
.02
.03
2 4 6 8 10 12 14 16 18 20 22 24
Response of CPI to M2
-.02
-.01
.00
.01
.02
.03
2 4 6 8 10 12 14 16 18 20 22 24
Response of CPI to IN_RATE
-.02
-.01
.00
.01
.02
.03
2 4 6 8 10 12 14 16 18 20 22 24
Response of CPI to EX_RATE
Response to Cholesky One S.D. Innovations ± 2 S.E.

Macroeconomic Determinants of Vietnam’s Inflation 2000-2010: Evidence and Analysis
51
-.010
-.005
.000
.005
.010
.015
.020
2 4 6 8 10 12 14 16 18 20 22 24
Response of PPI to CPI
-.03
-.02
-.01
.00
.01
.02
2 4 6 8 10 12 14 16 18 20 22 24
Response of M2 to CPI
-1.0
-0.5
0.0
0.5
1.0
1.5
2 4 6 8 10 12 14 16 18 20 22 24
Response of IN_RATE to CPI
-.004
-.002
.000
.002
.004
.006
.008
2 4 6 8 10 12 14 16 18 20 22 24
Response of EX_RATE to CPI
-.08
-.04
.00
.04
2 4 6 8 10 12 14 16 18 20 22 24
Response of P_DEBT to CPI
Response to Cholesky One S.D. Innovations ± 2 S.E.