Embed Size (px)
Citation preview
Macmillan/McGraw-Hill
Science: A Closer Look 2008
The Macmillan/ McGraw-Hill Company is a leader in the educational community
known for its development of successful classroom materials based upon a solid foundation
of research. The development of Macmillan/McGraw-Hill’s Science: A Closer Look
continues in that strong tradition. For any science program to be effective, it must provide a
consistent instructional format and design that creates a firm foundation upon which student
success is built. Macmillan/McGraw-Hill’s Science: A Closer Look program was developed
following that model based upon current educational research.
Macmillan/McGraw-Hill’s Science: A Closer Look program is an elementary science
program written to meet the demands and expectations of the National Science Education
Standards and address the Benchmarks for Science Literacy. If students are to succeed on
their local and state science assessments, they must be prepared in both the content being
assessed and in the format of the assessment. By identifying the key benchmarks and
developing specific lessons to meet those expectations, Macmillan/McGraw-Hill’s Science:
A Closer Look can insure content coverage and student success.
This document summarizes our research efforts and is divided into four parts:
1. A bibliography of the research that was reviewed and studied and
which provided the foundation for our instructional pedagogy and
lesson structure.
2. A summary of our field study data conducted on the prior
Macmillan Science series which provided a basis in the
development of Science: A Closer Look. This verification data
supports the instructional methodology and program design.
3. A review of results of the long term implementation studies on how
the Macmillan/McGraw-Hill and its support of staff development
initiatives translated into teacher and student success as measured
by public release of state test data in the St. Louis Public Schools.
4. A review of State Test Score Results from Districts using
Macmillan/ McGraw-Hill Science. This program’s effectiveness
provided the foundation for the design of Science: A Closer Look
Part I
Bibliography of Research
Sources
The following citations were reviewed by our author and editors as
part of the development of Macmillan/McGraw-Hill’s Science: A
Closer Look. The academic studies, educational research reports,
and professional articles listed below helped to inform and guide the
development process. These studies form the underpinnings of our
instructional methodology and learning pedagogy.
American Association for the Advancement of Science. Science for All
Americans. New York: Oxford University Press, 1990.
Aleven, V., and Koedinger, K. (2002). An effective metacognitive strategy:
Learning by doing and explaining with a computer-based cognitive tutor.
Cognitive Science, 26, 147-179.
American Association for the Advancement of Science’s Project 2016.
Dialogue on Early Childhood Science, Mathematics, and Technology
Education. Washington, DC: American Association for the Advancement
of Science, 1999.
American Association for the Advancement of Science’s, Project 2016.
Benchmarks for Science Literacy. New York: Oxford University Press,
1993.
Anderson, J.R., Reder, L.M., and Simon, H.A. (1996, May). Situated learning
and education. Educational Researcher, 25(4), 5-96.
Appleton, Ken and Ian Kindt. How do beginning elementary teachers cope
with science: Development of pedagogical content knowledge in science.
Boston, MA: National Association for Research in Science Teaching
conference, 1999.
Anderson, V. & Hidi, S. “Teaching students to summarize”. Educational
Leadership. 46. (1988/1989). 26-28.
Archambault, Reginald. John Dewey on Education: Selected Writings. New
York: Random House, 1965.
Armbruster, B.B., Anderson, T.H., & Meyer, J.L. Improving content-area
reading using instructional graphics. Reading Research Quarterly, 26(4)
(1992). 393-416.
Ball, D., and Rundquist, S. (1993). Collaboration as a context for joining
teacher learning with learning about teaching. In D.K. Cohen, M.W.
McLaughlin, and J.E. Talbert (Eds.), Teaching for understanding:
Challenges for policy and practice (pp. 13-42). San Francisco: Jossey-
Bass.
Barone, T., Berliner, D., Blanchard, J., Casanova, U., and McGowan, T.
(1996). A future for teacher education: Developing a strong sense of
professionalism. In J. Silula (Ed.), Handbook of research on teacher
education (2nd ed.) (pp. 1108-1149). New York: Macmillan.
Barron, B.J., Schwartz, D.L., Vye, N.J., Moore, A., Petrosino, A., Zech., L.,
Bransford, J.D., and Cognition and Technology Group at Vanderbilt.
(1998). Doing with understanding: Lessons from research on problem and
project-based learning. Journal of Learning Sciences, 7(3 and 4), 271-312.
Bauch, J.P. (Ed.). (1997). The Bridge Project: Connecting parents and schools
through voice messaging. Report on the pilot projects. Nashville, TN:
Vanderbilt University and Work/Family Directions, Inc.
Baxter, G.P., and Glaser, R. (1997). A cognitive framework for performance
assessment. CSE technical report. National Center for Research on
Evaluation, Standards, and Student Testing, Graduate School of Education,
University of California, Los Angeles.
Beeth, Michael E. “Teaching Science in Fifth Grade: Instruction Goals That
Support Conceptual Change.” Journal of Research in Science Teaching
35.10 (1998): 1091–1101.

Beeth, Michael E. and Peter Hewson. Learning Goals in an Exemplary
Science Teacher’s Practice and Social Factors in Teaching for Conceptual
Change. The Ohio State University P-12 Project, 2002. Available online at
http://www.osu.edu.p12.
Bereiter, C., and Scardamalia, M. (1989). Intentional learning as a goal of
instruction. In L.B. Resnick (Ed.), Knowing, learning, and instruction:
Essays in honor of Robert Glaser (pp. 361-392). Hillsdale, NJ: Erlbaum.
Bielaczyc, K., Pirolli, P., and Brown, A.L. (1995). Training in self-
explanation and self-regulation strategies: Investigating the effects of
knowledge acquisition activities on problem solving. Cognition and
Instruction,13, 221-252.
Black, P., and William, D. (1998). Assessment and classroom learning. In
Assessment and Education. Special issue of Assessment in Education:
Principles, Policy and Practice, 5(1), 7-75. Carfax Publishing..
Blake, I.K. (1994). Language development and socialization in young
African-American children. In P.M. Greenfield and R.R. Cocking (Eds.),
Cross cultural roots of minority child development (pp. 167-195).
Hillsdale, NJ: Erlbaum.
Blosser, Patricia E. “Science Misconceptions Research and Some
Implications for the Teaching of Science to Elementary School Students.”
ERIC/SMEAC Science Education Digest No. 1, 1987.
Bransford, J.D., Zech, L., Schwartz, D., Barron, B., Vye, N.J., and Cognition
and Technology Group at Vanderbilt. (1998). Designs for environments
that invite and sustain mathematical thinking. In P. Cobb (Ed.),
Symbolizing, communicating, and mathematizing: Perspectives on
discourse, tools, and instructional design. Mahwah, NJ: Erlbaum.
Brasell, H. (1987). The effect of real-time laboratory graphing on learning
graphic representations of distance and velocity. Journal of Research in
Science Teaching, 24, 385-395.
Brice-Heath, S. (1981). Toward an ethnohistory of writing in American
education. In M.F. Whiteman (Ed.), Writing: The nature, development and
teaching of written communication (vol. 1) (pp. 25-45). Hillsdale, NJ:
Erlbaum.
Brice-Heath, S. (1983). Ways with words: Language, life and work in
communities and classrooms. Cambridge, UK: Cambridge University
Press.
Brown, A.L. (1975). The development of memory: Knowing, knowing about
knowing, and knowing how to know. In H.W. Reese (Ed.), Advances in
child development and behavior (vol. 10). New York: Academic Press.
Brown, A.L., and Campione, J.C. (1994). Guided discovery in a community
of learners. In K. McGilly (Ed.), Classroom lessons: Integrating cognitive
theory and classroom practices (pp. 229-270). Cambridge, MA: MIT
Press.
Brown, A.L., and Campione, J.C. (1996). Psychological theory and the design
of innovative learning environments: On procedures, principles, and
systems. In L. Schauble and R. Glaser (Eds.), Innovations in learning:
New environments for education (pp. 289-325). Mahwah, NJ: Erlbaum.
Brown, A.L., and DeLoache, J.S. (1978). Skills, plans, and self-regulation. In
R. Siegler (Ed.), Children’s thinking: What develops? (pp. 3-35). Hillsdale,
NJ: Erlbaum.
Brown, A.L., and Palincsar, A.S. (1989). Guided, cooperative learning and
individual knowledge acquisition. In L. Resnick (Ed.), Knowing, learning,
and instruction: Essays in honor of Robert Glaser (pp. 393-451).
Hillsdale, NJ: Erlbaum.
Brown, D. (1992). Using examples to remediate misconceptions in physics:
Factors influencing conceptual change. Journal of Research in Science
Teaching, 29, 17-34.
Brown, D., and Clement, J. (1989). Overcoming misconceptions via
analogical reasoning: Factors influencing understanding in a teaching
experiment. Instructional Science, 18, 237-261.
Bybee, Rodger W. Achieving Scientific Literacy: From Purposes to
Practices. Portsmouth, NH: Heinemann, 1997.
Campione, J., and Brown, A.L. (1987). Linking dynamic assessment with
school achievement. In C.S. Lidz (Ed.), Dynamic assessment: An
interactional approach to evaluating learning potential (pp. 82-114). New
York: Guilford.
Cardellichio, T., and Field, W. (1997, March). Seven strategies to enhance
neural branching. Educational Leadership, 54(6).
Carey, S., Evans, R., Honda, M., Jay, E., and Unger, C. (1989). An
experiment is when you try it and see if it works: A study of grade 7
students’ understanding of the construction of scientific knowledge.
International Journal of Research in Science Teaching, 30(10), 1241-
1257.
Cazden, C. (1988). Classroom discourse. Portsmouth, NH: Heinemann.
Cazden, C., Michaels, S., and Tabors, P. (1985). Spontaneous repairs in
sharing time narratives: The intersection of metalinguistic awareness,
speech event and narrative style. In S. Freedman (Ed.), The acquisition of
written language: Revision and response. Norwood, NJ: Ablex.
Chi, M.T.H., Bassok, M., Lewis, M.W., Reimann, P., and Glaser, R. (1989).
Self-explanations: How students study and use examples in learning to
solve problems. Cognitive Science, 13, 145-182.
Chi, M.T.H., deLeeuw, N., Chiu, M., and LaVancher, C. (1994). Eliciting
self-explanations improves understanding. Cognitive Science, 18, 439-477.
Clement, J. (1993). Using bridging analogies and anchoring intuitions to deal
with students’ preconceptions in physics. Journal of Research in Science
Teaching, 30(10), 1241-1257.
Cobb, P., Yackel, E., and Wood, T. (1992). A constructivist alternative to the
representational view of mind in mathematics education. Journal for
Research in Mathematics Education, 19, 99-114.
Cognition and Technology Group at Vanderbilt. (1994). From visual word
problems to learning communities: Changing conceptions of cognitive
research. In K. McGilly (Ed.), Classroom lessons: Integrating cognitive
theory and classroom practice (pp. 157-200). Cambridge, MA: MIT
Press/Bradford Books.
Cognition and Technology Group at Vanderbilt. (1997). The Jasper Project:
Lessons in curriculum, instruction, assessment, and professional
development. Mahwah, NJ: Erlbaum.
Cohen, D.K. (1990). A revolution in one classroom: The case of Mrs. Oublier.
Educational Evolution and Policy Analysis, 12, 330-338.
DiSessa, A. (1982). Unlearning Aristotelian physics: A study of knowledge-
base learning. Cognitive Science, 6, 37-75.
Doris, Ellen. Doing What Scientists Do: Children Learn to Investigate Their
World. Portsmouth, NH: Heinemann, 1991.
Duckworth, E. “The Having of Wonderful Ideas” and Other Essays on
Teaching and Learning. New York: Teachers College Press, Columbia
1987.
Dweck, C., and Legget, E. (1988). A social-cognitive approach to motivation
and personality. Psychological Review, 95, 256-273.
Dweck, C.S. (1989). Motivation. In A. Lesgold and R. Glaser (Eds.),
Foundation for a psychology of education (pp. 87-136). Hillsdale, NJ:
Erlbaum.
Ericsson, K.A., Krampe, R.T., and Tesch-Romer, C. (1993). The role of
deliberate practice in the acquisition of expert performance. Psychological
Review, 100, 363-406.
Evans, J.St.B.T. (1989). Bias in human reasoning. Hillsdale, NJ: Erlbaum.
Flavell, J.H. (1973). Metacognitive aspects of problem-solving. In L.B.
Resnick (Ed.), The nature of intelligence. Hillsdale, NJ: Erlbaum.
Gagné, R., and Gibson, J.J. (1947). Research on the recognition of aircraft. In
J.J. Gibson (Ed.), Motion picture training and research. Washington, DC:
U.S. Government Printing Office.
Gallas, Karen. Talking Their Way into Science: Hearing Children’s Questions
and Theories, Responding with Curricula. New York: Teachers College
Press, 1995.
Gardner, H. The Unschooled Mind: How Children Think and How Schools
Should Teach. New York: Basic Books. 1991.
Garner, W.R. (1974). The processing of information and structure. Potomac,
MD: Erlbaum.
Geary, D. (1994). Children’s mathematical development: Research and
practice applications. Washington, DC: American Psychological
Association.
Gee, J.P. (1989). What is literacy? Journal of Education, 171, 18-25.
Gibson, J.J, and Gibson, E.J. (1955). Perceptual learning: Differentiation or
enrichment. Psychological Review, 62, 32-51.
Gick, M.L., and Holyoak, K.J. (1980). Analogical problem solving. Cognitive
Psychology, 12, 306-355.
Gick, M.L., and Holyoak, K.J. (1983). Schema induction and analogical
transfer. Cognitive Psychology, 15, 1-38.
Greenfield, P.M., and Cocking, R.R. (Eds.). (1996). Interacting with video.
Greenwich, CT: Ablex.
Greenfield, P.M., and Suzuki, L.K. (1998). Culture and human development:
Implications for parenting, education, pediatrics, and mental health. In I.E.
Sigel and K.A. Renninger (Eds.), Handbook of child psychology (vol. 4)
(pp. 1059-1109). New York: Wiley and Sons.
Griffin, C., Simmons, D.C., & Kameenui, E.J. Investigating the effectiveness
of graphic organizer instruction on the comprehension and recall of
science content by students with learning disabilities. Journal of Reading,
Writing, & Learning Disabilities International. 7(4). 1992. 355-376.
Grotzer, Tina. Math/Science Matters: Resource booklets on research in
mathematics and science teaching. Harvard Graduate School of Education,
1996.
Habermas, J. (1990). Moral consciousness and communicative action.
Cambridge, MA: MIT Press.
Hall, Jody, Carol Callahan, Helen Kitchel, Patricia Pierce, and Pedie O’Brien.
Organizing Wonder: Making Inquiry Science Work in the Elementary
School. Portsmouth, NH: Heinemann, 1998.
Harlen, Wynne. Primary Science: Taking the Plunge. Portsmouth, NH:
Heinemann, 2001.
Hatano, G. “The nature of everyday science: A brief introduction”. British
Journal of Developmental Psychology. (1990): 8:245-250.
Heath, S.B. (1981). Questioning at home and school: A comprehensive study.
In G. Spindler (Ed.), Doing ethnography: Educational anthropology in
action. New York: Holt, Rinehart, and Winston.
Heath, S.B. (1983). Ways with words: Language, life, and work in
communities and classrooms. Cambridge, UK: Cambridge University
Press.
Heaton, R.M. (1992). Who is minding the mathematics content? A case study
of a fifth-grade teacher. Elementary School Journal, 93, 151-192.
Kelly, Anthony E., and Richard A. Lesh. Handbook for research design in
mathematics and science education. Mahwa, NH: Lawrence Erlbaum
Associates, 2000.
Inagaki, K., and Hatano, G. (1987). Young children’s spontaneous
personification as analogy. Child development, 58, 1013-1020.
Kafai, Y.B. (1995). Minds in play: Computer game design as a context for
children’s learning. Hillsdale, NJ: Erlbaum.
Klentschy, M., Garrison, L., & Amaral, O.M. Valle Imperial Project in
science (VIPS) four year comparison of student achievement data 1995-
1999. Unpublished manuscript. 2001.
Lampert, M. (1998). Studying teaching as a thinking practice. In J. Greene
and S.G. Goldman (Eds.), Thinking practices (pp. 53-78). Hillsdale, NJ:
Erlbaum.
Lave, J. (1988). Cognition in practice: Mind, mathematics, and culture in
everyday life. Cambridge, MA: Cambridge University Press.
Lave, J., and Wenger, E. (1991). Situated learning: Legitimate peripheral
participation. New York: Cambridge University Press.
Lee, C.D., and Slaughter-Defoe, D. (1995). Historical and sociocultural
influences of African American education. In J.A. Banks and C.M. Banks
(Eds.), Handbook of research on multicultural education (pp. 348-371).
New York: Macmillan.
Lesgold, A., Chipman, S., Brown, J.S., and Soloway, E. (1990). Prospects for
information science and technology focused on intelligent training systems
concerns. In Annual review of computer science (pp. 383-394). Palo Alto,
CA: Annual Review Press.
Lesgold, A.M. (1984). Acquiring expertise. In J.R. Anderson and S.M.
Kosslyn (Eds.), Tutorials in learning and memory: Essays in honor of
Gordon Bower (pp. 31-60). Hillsdale, NJ: Erlbaum.
Lesgold, A.M. (1988). Problem solving. In R.J. Sternberg and E.E. Smith
(Eds.), The psychology of human thoughts. New York: Cambridge
University Press.
Levitt, Karen. “An Analysis of Elementary Teachers’ Beliefs Regarding the
Teaching and Learning of Science.” Science Education. 86.1 (2002): 1–22.
Longbottom, John and Philip Butler. “Why teach science? Setting rational
goals for science education.” Science Education 83.4 (1999): 473–492.
Martin, M., I. Mullis, A. Beaton, E. Gonzalez, T. Smith, and D. Kelly.
Science achievement in the primary school years: IEA’s Third
International Mathematics and Science Study. Center for the study of
Testing, Evaluation, and Educational Policy, Boston College, 1997.
Martin, Michael O., Ina V.S. Mullis, Eugenio Gonzalez, Kelvin Gregory,
Teresa Smith, Steven Chrostowski, Robert Garden, and Kathleen
O’Connor. TIMSS 1999 International Science Report: Findings from IEA’s
Repeat of the Third International Science and Science Study at the Eighth
Grade. Chestnut Hill, MA: Boston College, 2000.
Marzano, R., Pickering, D., Pollock, J. Classroom Instruction that Works:
Research-based Strategies for Increasing Student Achievement.
Alexandria, VA: Association for Supervision and Curriculum
Development. 2001.
McLaughlin, E. M. Effects of graphic organizers and levels of text difficulty
on less proficient fifth grade reader’s comprehension of expository text.
Dissertation Abstracts International, Vol. 51 (9-A). (1991, March). 3028.
Means, B., and Olson, K. (1995). Technology’s role in student-centered
classrooms. In H. Walberg and H. Waxman (Eds.), New directions for
research on teaching. Berkeley, CA: McCutchan.
Merrill, D.C., Reiser, B.J., Ranney, M., and Trafton, J.G. (1992). Effective
tutoring techniques: A comparison of human tutors and intelligent tutoring
systems. Journal of the Learning Sciences, 2(3), 277-305.
Mestre, J.P., Gerace, W.J., Dufresne, R.J., and Leonard, W.J. (1997).
Promoting active learning in large classes using a classroom
communication system. In The changing role of physics departments in
modern universities: Proceedings of the International Conference on
Undergraduate Physics Education (pp. 1019-1036). Woodbury, NY:
American Institute of Physics.
Michaels, S. (1981a). “Sharing time,” children’s narrative styles and
differential access to literacy. Language in Society, 10, 423-442.
Michaels, S. (1981b). Discourses of the seasons. Technical report. Urbana,
IL: Reading Research and Education Center.
Michaels, S. (1986). Narrative presentations: An oral preparation for literacy
with first graders. In J. Cook-Gumperz (Ed.), The social construction of
literacy (pp. 94-115). New York: Cambridge University Press.
Miller, G.A. (1956). The magical number seven, plus or minus two. Some
limits on our capacity to process information. Psychological Review, 63,
81-87.
Minstrell, J. “Teaching Science for Understanding.” Toward the Thinking
Curriculum: Current Cognitive Research”. Alexandria, VA: Association
for Supervision and Curriculum Development. (1989) 130-131.
Moll, L.C., and Whitmore, K.F. (1993). Vygotsky in classroom practice.
Moving from individual transmission to social transaction. In E.A.
Forman, N. Minick, and C.A. Stone (Eds.), Contexts for learning (pp. 19-
42). New York: Oxford University Press.
Moll, L.C., Tapia, J., and Whitmore, K.F. (1993). Living knowledge: The
social distribution of cultural sources for thinking. In G. Salomon (Ed.),
Distributed cognitions (pp. 139-163). Cambridge, UK: Cambridge
University Press.
Moshman, D. (1995a). Reasoning as self-constrained thinking. Human
Development, 38, 53-64.
Moshman, D. (1995b). The construction of moral rationality. Human
Development, 38, 265-281.
Mullis, Ina, Michael Martin, Teresa Smith, Robert Garden, Kelvin Gregory,
Eugenio Gonzalez, Steven Chrostowski, and Kathleen O’Connor, TIMSS
Assessment Frameworks and Specifications 2003. Chestnut Hill, MA:
Boston College, 2002.
NARST “Research Matters--to the Science Teacher.” A selection of brief
research-based papers developed by the National Association for Research
in Science Teaching (NARST), 2001. Available online at
http://www2.educ.sfu.ca/narstsite/ publications.html
National Research Council. National Science Education Standards.
Washington, DC: National Academy of Sciences, 1996.
National Research Council. Inquiry and the national science education
standards: A guide for teaching and learning. Washington DC: National
Academy Press. 2000.
Newman, D., Griffin, P., and Cole, M. (1989). The construction zone:
Working for cognitive change in school. New York: Cambridge University
Press.
Newstead, S.E., and Evans, J.St.B.T. (Eds.). (1995). Perspectives on thinking
and reasoning: Essays in honour of Peter Wason. Hillsdale, NJ: Erlbaum.
Nuthall, G. The way students learn. Acquiring knowledge from an integrated
science and social studies unit. Elementary School Journal. 99(4). (1999).
303-341.
Palincsar, A.S. (1986). Reciprocal teaching: Teaching reading as thinking.
Oak Brook, IL: North Central Regional Educational Laboratory.
Palincsar, A.S., and Brown, A.L. (1984). Reciprocal teaching of
comprehension monitoring activities. Cognition and Instruction, 1, 117-
175.
Perfetto, G.A., Bransford, J.D., and Franks, J.J. (1983). Constraints on access
in a problem solving context. Memory and Cognition, 11, 24-31.
Peters, Joseph M. and Peter C. Gega. Science in Elementary Education.
Prentice Hall, 2002.
Peterson, P.L., and Barnes, C. (1996). Learning together: Challenges of
mathematics, equity, and leadership. Phi Delta Kappan, 77(7), 485-491.
Pintrich, P.R., and Schunk, D. (1996). Motivation in education: Theory,
research and application. Columbus, OH: Merrill Prentice-Hall.
Polya, G. (1957). How to solve it: A new aspect of mathematical method.
Princeton, NJ: Princeton University Press.
Pressley, M., Wood, E., Woloshyn, V., Martin, V., King, A., & Menke, D.
Encouraging mindful use of prior knowledge: Attempting to construct
explanatory answers facilitates learning. Educational Psychologist. 27(1).
(1993). 91-109.
Pressley, M.J., El-Dinary, P.B., Marks, M.B., Brown, R., and Stein, S.
(1992). Good strategy instruction is motivating and interesting. In K.A.
Renninger, S. Hidi, and A. Krapp (Eds.), The role of interest in learning
and development (pp. 333-358). Hillsdale, NJ: Erlbaum.
Resnick, L.B. (1987). Education and learning to think. Committee on
Mathematics, Science, and Technology Education, Commission on
Behavioral and Social Sciences and Education, National Research Council.
Washington, DC: National Academy Press. Available:
http://www.nap.edu.
Rivard, L.P., & Straw, S.B. The effect of talk and writing on learning science:
An exploratory study. Science Education 84(5). (2000). 566-593.
Roberts, N., and Barclay, T. (1988, Fall). Teaching model building to high
school students: Theory and reality. Journal of Computers in Mathematics
and Science Teaching,13–24.
Roediger, H. (1997). Memory: Explicit and implicit. Paper presented at the
Symposium, Recent Advances in Research on Human Memory, National
Academy of Sciences. Washington, DC.
Rogoff, B. (1990). Apprenticeship in thinking: Cognitive development in
social context. New York: Oxford University Press.
Rogoff, B. (1998). Cognition as a collaborative process. In W. Damon, D.
Kuhn, and R.S. Siegler (Eds.), Handbook of child psychology: Cognition,
perception, and language (5th ed.) (pp. 679-744). New York: Wiley.
Romance, Nancy R. and Michael R. Vitale. “A Curriculum Strategy That
Expands Time for In-Depth Elementary Science Instruction by Using
Science-Based Reading Strategies: Effects of a Year-Long Study in Grade
Four.” Journal of Research in Science Teaching 29.6 (1992): 545-554.
Rosebery, Ann and Beth Warren Terc. Boats, Balloons & Classroom Video:
Science Teaching as Inquiry. Portsmouth, NH: Heinemann, 1998.
Salmon, M.H., and Zeitz, C.M. (1995). Analyzing conversational reasoning.
Informal Logic, 17, 1-23.
Saul, Wendy and Jeanne Reardon. (Eds.). Beyond the Science Kit.
Portsmouth, NH: Heinemann, 1996.
Saxe, G.B. (1990). Culture and cognitive development: Studies in
mathematical understanding. Hillsdale, NJ: Erlbaum.
Scardamalia, M., Bereiter, C., and Steinbach, R. (1984). Teachability of
reflective processes in written composition. Cognitive Science, 8, 173-190.
Schauble, L., Klopfer, L.E., and Raghavan, K. (1991). Students’ transition
from an engineering model to science model of experimentation. Journal
of Research in Science Teaching, 28, 859-882.
Schoenfeld, A.H. (1983). Problem solving in the mathematics curriculum: A
report, recommendation and annotated bibliography. Mathematical
Association of America Notes (No. 1).
Schoenfeld, A.H. (1985). Mathematical problem solving. Orlando, FL:
Academic Press.
Schwartz, D., and Bransford, J.D. (1998). A time for telling. Cognition and
Instruction, 16(4), 475-522.
Schwartz, D.L., Lin, X., Brophy, S., and Bransford, J.D. (1999). Toward the
development of flexibly adaptive instructional designs. In C.M. Reigelut
(Ed.), Instructional design theories and models (vol. II) (pp. 183-213).
Hillsdale, NJ: Erlbaum.
Shepardson, D.P., & Britsch, S.J. the role of children’s journals in elementary
school science activities. Journal of Research in Science Teaching. 38(1).
(2001). 43-69.
Sticht, T.G., Hofstetter, C.R., & Hofsetter, C. H. Knowledge, literacy and
power. San Diego, CA: Consortium for Workplace Education and Lifelong
Learning. 1997.
Taylor, O., and Lee, D. (1987). Standardized tests and African American
children: Communication and language issues. Negro Educational Review,
38, 67-80.
Thornton, R.K., and Sokoloff, D.R. (1998). Assessing student learning of
Newton’s laws: The force and motion conceptual evaluation and the
evaluation of active learning laboratory and lecture curricula. American
Journal of Physics, 64, 338-352.
University of Massachusetts. A Constructivist View of Science Education.
2002. Available at
http://umperg.physics.umass.edu/perspective/constructivism.
Van Secker, C.E., & Lissitz, R.W. Estimating the impact of instructional
practices on student achievement in science. The Journal of Science
Teaching. 36(10). (1999). 1110-1126.
Vye, N.J., Goldman, S.R., Voss, J.F., Hmelo, C., Williams, S., and Cognition
and Technology Group at Vanderbilt. (1998a). Complex mathematical
problem solving by individuals and dyads. Cognition and Instruction,
15(4).
Vye, N.J., Schwartz, D.L., Bransford, J.D., Barron, B.J., Zech, L., and
Cognition and Technology Group at Vanderbilt. (1998b). SMART
environments that support monitoring, reflection, and revision. In D.
Hacker, J. Dunlosky, and A. Graesser (Eds.), Metacognition in educational
theory and practice. Mahwah, NJ: Erlbaum.
Wellman, H.M., Ritter, K., and Flavell, J.H. (1975). Deliberate memory
behavior in the delayed reactions of very young children. Developmental
Psychology, 11, 780-787.
Weiss, Iris, Eric R. Banilower, Kelly C. McMahon, and P. Sean Smith. Report
of the 2000 National Survey of Science and Mathematics. Horizon
Research, 2001.
Wertsch, J.V (1991). Voices of the mind. Cambridge, MA: Harvard University
Press.
White, B.Y., and Fredericksen, J.R. (1998). Inquiry, modeling, and
metacognition: Making science accessible to all students. Cognition and
Instruction, 16(1), 3-118.
Wiebe, Arthur. “AIMS As a Way of Thinking.” AIMS Education Foundation
(January 1991) 4.
Wiggins, G., & McTighe, J. Understanding by Design. Alexandria, VA:
Association for Supervision and Curriculum Development. (1998)
Youniss, J., and Damon, W. (1992). Social construction in Piaget’s theory. In
H .Berlin and P.B. Pufal (Eds.), Piaget’s theory: Prospects and
possibilities (pp. 267-286). Hillsdale, NJ: Erlbaum.
Part II.
Executive Summary
Research and Field Study
Results
The following section provides a summary of the field test site results
that were gathered as part of the validation on the effectiveness of
the instructional model utilized in Science: A Closer Look. These
studies were conducted by an independent educational research firm
and the results were provided to Macmillan/McGraw-Hill
publishing.
Field Studies:
Background
The field studies measured the effectiveness of the instructional model used in an elementary
science program published by the McGraw-Hill School Division.
Teachers who participated in this study administered grade appropriate chapter pre tests prior
to teaching chapters from Macmillan/McGraw-Hill Science. Post-tests were administered
after using the materials in an effort to assess student progress. The results of these tests are
included in this report.
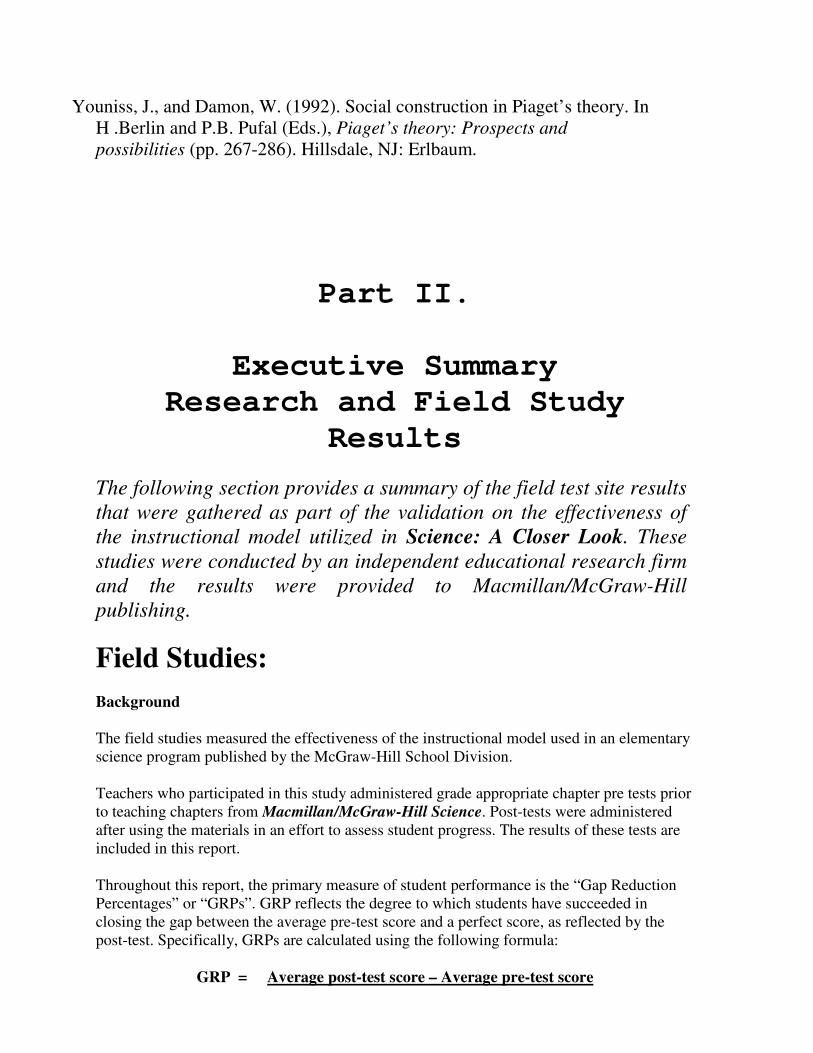
Throughout this report, the primary measure of student performance is the “Gap Reduction
Percentages” or “GRPs”. GRP reflects the degree to which students have succeeded in
closing the gap between the average pre-test score and a perfect score, as reflected by the
post-test. Specifically, GRPs are calculated using the following formula:
GRP = Average post-test score – Average pre-test score
100%- Average pre-test score
A GRP of 0%means that student performance did not improve from pre-test to post-test. A
GRP of 50% means that students have closed half the gap between the average pre-test score
and a perfect score. For example, an average pre-test score of 50% that is followed by an
average post-test score of 75% yields a GRP of 50%; in other words, the gap between the
average pre-test score and a perfect score closed by half. Of course, a GRP of 100% means
that the gap between the average pre-test score and a perfect score has been eliminated.
The GRP was formulated to measure performance because percentages change, a more
typical measure, is unduly influenced by a pre-test score. For example, a post-test score of
90% yields a percentage change of only 12 percent if the pre-test score was 80. By contrast, a
post-test score of 40% yields a percentage change of 33% if the pre-test score was 30%. In
these examples, a ten percentage point increase yields a very different and potentially
misleading percentage change figures. The GRP attempts to eliminate this variability which
occurs because of high pre-test scores minimize the possibility of significant percentage
changes, while low pre-test scores all but ensure them.
Consider another example, average pre- and post- test scores of 20% and 80%, respectively,
yield a percentage change of 300 percent and a GRP of 75 percent. Average pre- and post-
test scores of 60% and 90% respectively, yield a much lower percentage change of 50
percent, but the same GRP of 75 percent. The latter is true because in both cases, the gap
between average pre-test score and a perfect score closed by three-quarters.
Results:
In total, 2,913 students completed pre- and post- test: 232 students in seven Grade 1
classrooms; 868 students in ten Grade 2 classrooms; 598 students in eight Grade 3
classrooms; 648 students in Grade 4 classrooms; 455 students in seven Grade 5 classrooms;
and 112 students in two Grade 6 classrooms.
Field Test Parameters
Grade Number of Classrooms Number of Students 1 7 232
2 10 868
3 8 598
4 13 648
5 7 455
6 2 112
Seven public schools participated in this project: three in urban communities, two in
suburban communities; and two in rural communities. The schools were located in six states:
California, Georgia, Illinois, Missouri, New York, and North Carolina
Of the 2,913 students who participated, 48% were boys, 52% were girls; 26% are minorities;
and 14% receive free or reduced-cost lunch.
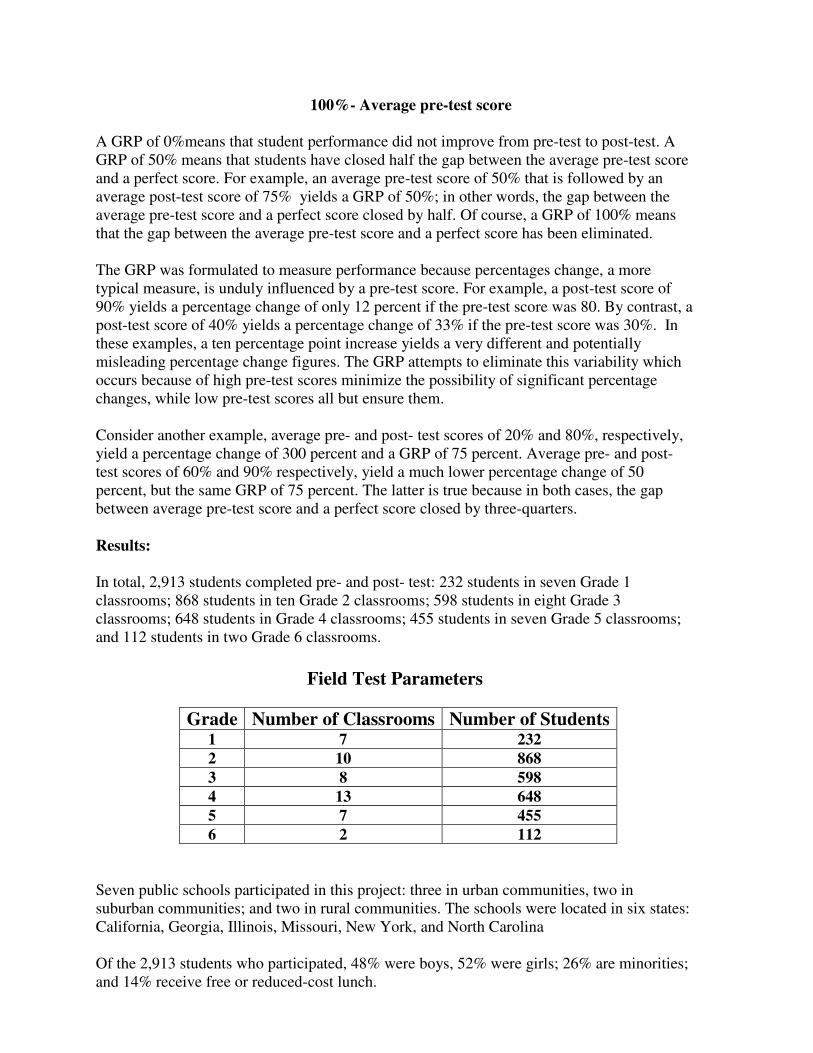
Top Line Results
♦ Research results indicate that test scores increased among students using MMH Science
♦ Eight out of ten students earned higher scores after using MMH Science
♦ Scores improved among both boys and girls
♦ Scores improved among minority and non-minority students
♦ Scores improved among students who reviewed free/reduced-cost lunch
♦ Overall the gap between average pre-test score and perfect score closed by 46%, or stated
differently, on average, scores increased by 59% after using MMH Science.
Test Comparisons: Grade Level Pre-/Post- Test
Grade Level Pre-/Post-
Test Score Comparisons
0
10
20
30
40
50
60
70
80
Grade 1 Grade 2 Grade 3 Grade 4 Grade 5
Avg. Pre- Test Score
Avg. Post-Test Score
Individual Grade Results
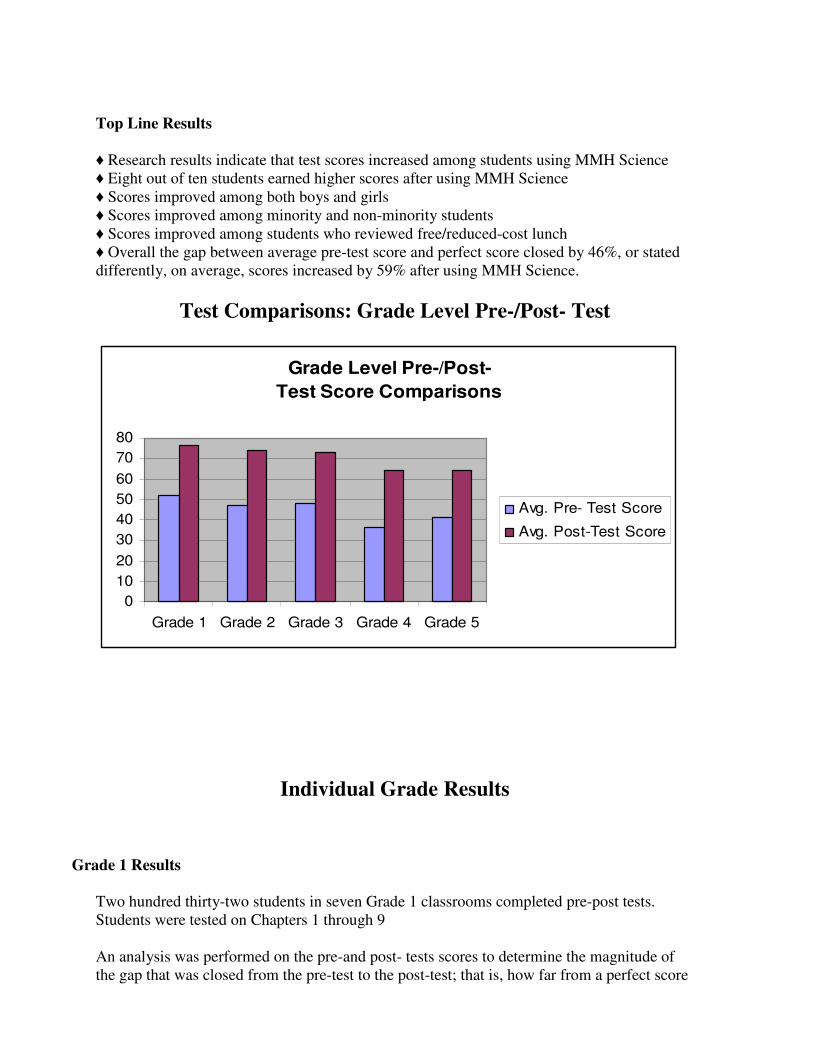
Grade 1 Results
Two hundred thirty-two students in seven Grade 1 classrooms completed pre-post tests.
Students were tested on Chapters 1 through 9
An analysis was performed on the pre-and post- tests scores to determine the magnitude of
the gap that was closed from the pre-test to the post-test; that is, how far from a perfect score
students were before instructions compared to how far they were after instruction. The results
from each classroom are listed in individual tables.
Grade 1 Pre-/Post- Test Scores
0
20
40
60
80
100
MV1-1 PK1-1 JW1-1 JW2-1 JW3-1 FH1-1 BH1-1
Classrooms
Avera
ge
Test
Sco
res
Avg. Pre-Test Score Avg. Post-test Score
Grade 2 Results
Eight hundred sixty-eight students in ten Grade 2 classrooms completed pre-post tests.
Students were tested on Chapters 1 through 12
An analysis was performed on the pre-and post- tests scores to determine the magnitude of
the gap that was closed from the pre-test to the post-test; that is, how far from a perfect score
students were before instructions compared to how far they were after instruction. The results
from each classroom are listed below. In one class, the gap between the average pre-test
score and a perfect score closed by 68 percent.
Grade 2 Pre- Post- Test Scores
0
20
40
60
80
100
JW1-2 JW2-2 JW3-2 MV1-2 PK1-2 BH1-2 JE1-2 TJ1-2 TJ2-2 TJ3-2
Schools
Avera
ge T
est
Sco
res
Avg. Pre-Test Score Avg. Post-Test Score
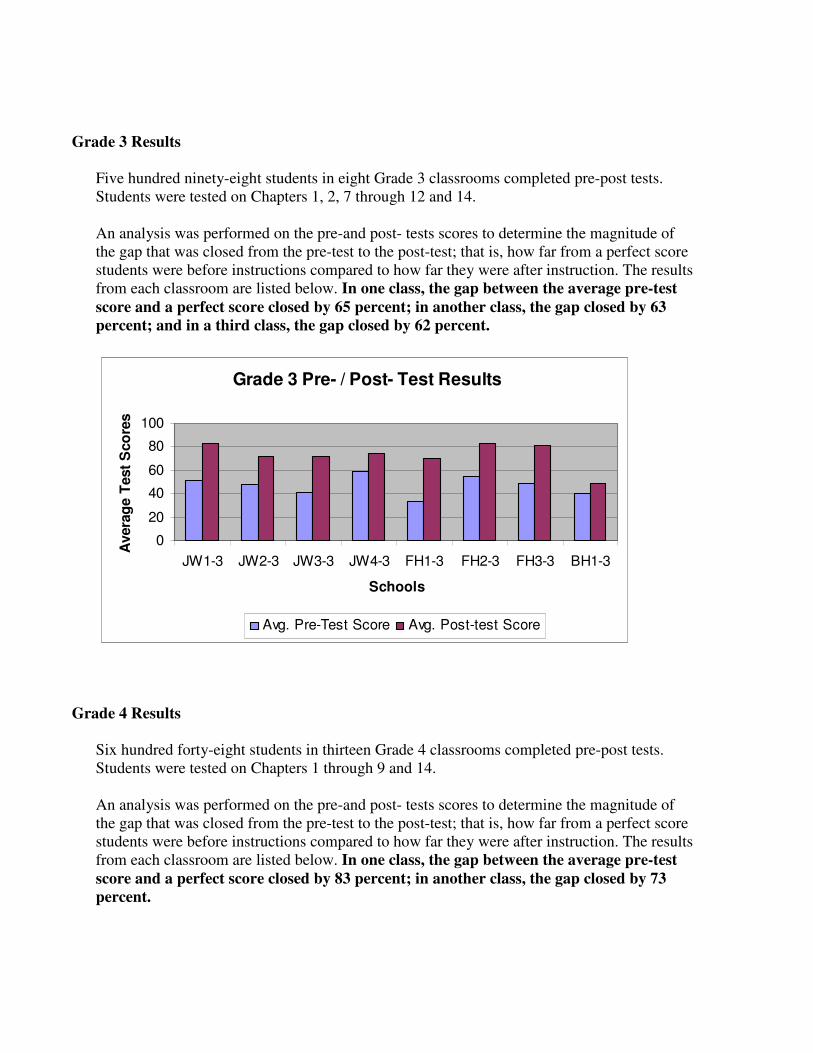
Grade 3 Results
Five hundred ninety-eight students in eight Grade 3 classrooms completed pre-post tests.
Students were tested on Chapters 1, 2, 7 through 12 and 14.
An analysis was performed on the pre-and post- tests scores to determine the magnitude of
the gap that was closed from the pre-test to the post-test; that is, how far from a perfect score
students were before instructions compared to how far they were after instruction. The results
from each classroom are listed below. In one class, the gap between the average pre-test
score and a perfect score closed by 65 percent; in another class, the gap closed by 63
percent; and in a third class, the gap closed by 62 percent.
Grade 3 Pre- / Post- Test Results
0
20
40
60
80
100
JW1-3 JW2-3 JW3-3 JW4-3 FH1-3 FH2-3 FH3-3 BH1-3
Schools
Avera
ge T
est
Sco
res
Avg. Pre-Test Score Avg. Post-test Score
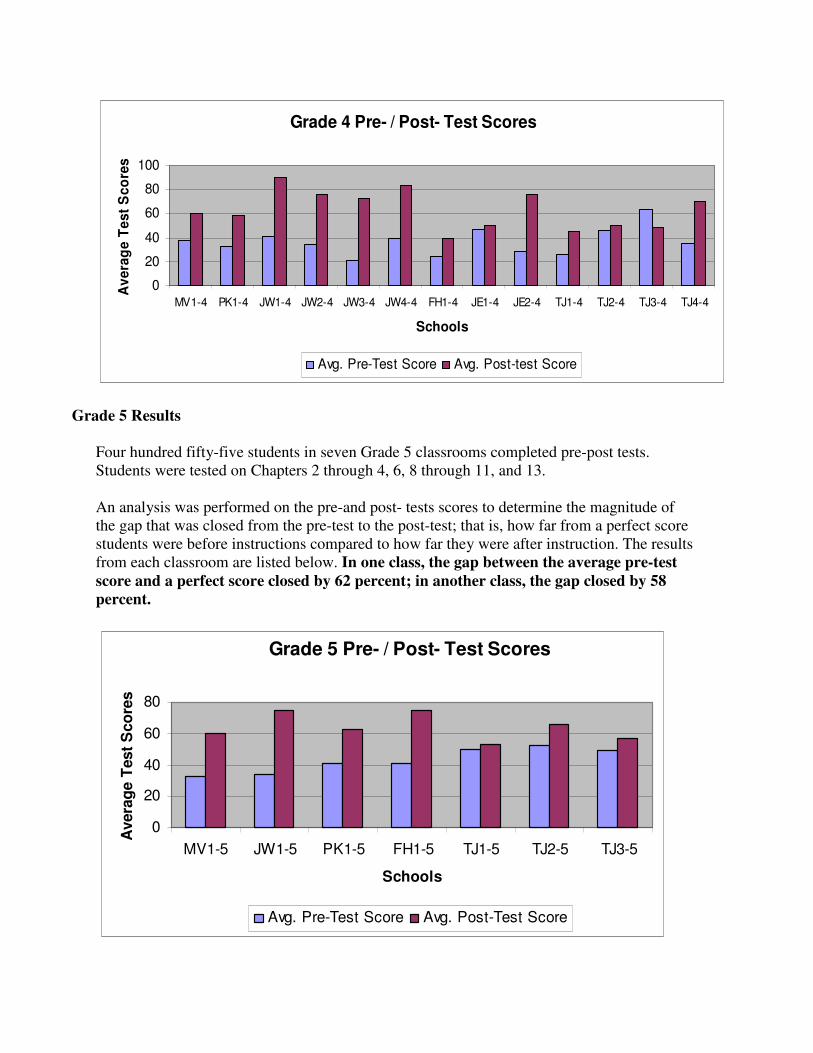
Grade 4 Results
Six hundred forty-eight students in thirteen Grade 4 classrooms completed pre-post tests.
Students were tested on Chapters 1 through 9 and 14.
An analysis was performed on the pre-and post- tests scores to determine the magnitude of
the gap that was closed from the pre-test to the post-test; that is, how far from a perfect score
students were before instructions compared to how far they were after instruction. The results
from each classroom are listed below. In one class, the gap between the average pre-test
score and a perfect score closed by 83 percent; in another class, the gap closed by 73
percent.
Grade 4 Pre- / Post- Test Scores
0
20
40
60
80
100
MV1-4 PK1-4 JW1-4 JW2-4 JW3-4 JW4-4 FH1-4 JE1-4 JE2-4 TJ1-4 TJ2-4 TJ3-4 TJ4-4
Schools
Av
era
ge
Te
st
Sc
ore
s
Avg. Pre-Test Score Avg. Post-test Score
Grade 5 Results
Four hundred fifty-five students in seven Grade 5 classrooms completed pre-post tests.
Students were tested on Chapters 2 through 4, 6, 8 through 11, and 13.
An analysis was performed on the pre-and post- tests scores to determine the magnitude of
the gap that was closed from the pre-test to the post-test; that is, how far from a perfect score
students were before instructions compared to how far they were after instruction. The results
from each classroom are listed below. In one class, the gap between the average pre-test
score and a perfect score closed by 62 percent; in another class, the gap closed by 58
percent.
Grade 5 Pre- / Post- Test Scores
0
20
40
60
80
MV1-5 JW1-5 PK1-5 FH1-5 TJ1-5 TJ2-5 TJ3-5
Schools
Avera
ge T
est
Sco
res
Avg. Pre-Test Score Avg. Post-Test Score
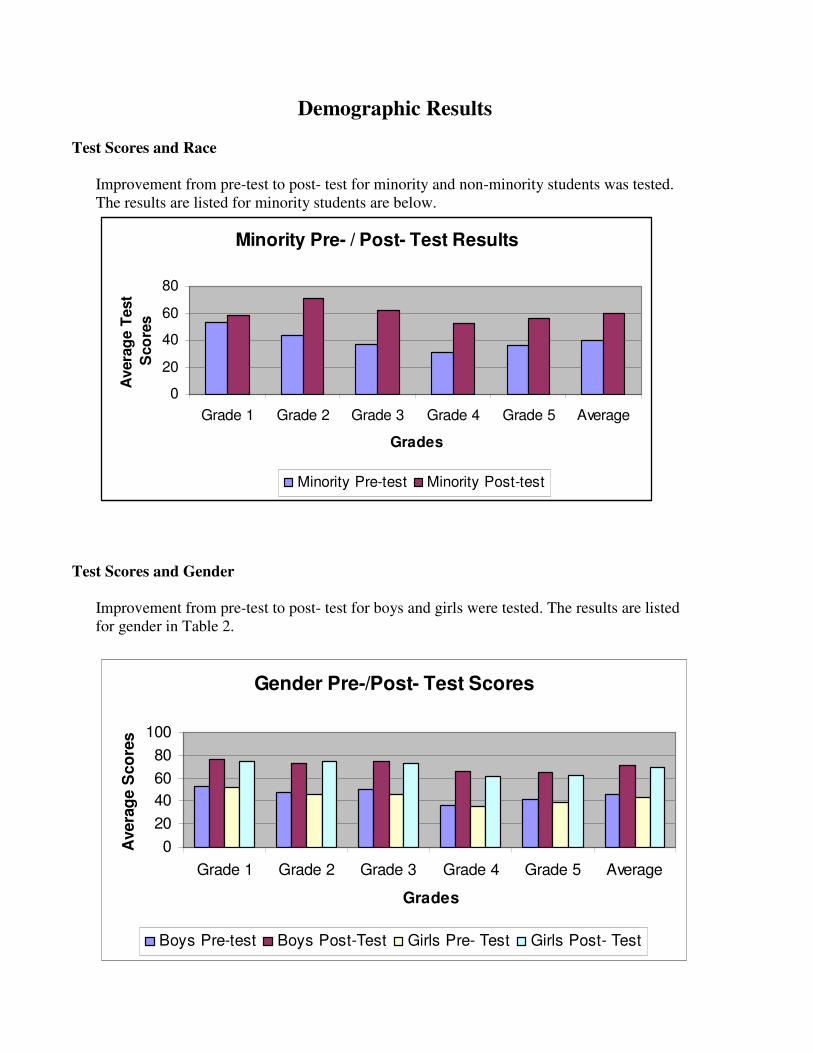
Demographic Results
Test Scores and Race
Improvement from pre-test to post- test for minority and non-minority students was tested.
The results are listed for minority students are below.
Minority Pre- / Post- Test Results
0
20
40
60
80
Grade 1 Grade 2 Grade 3 Grade 4 Grade 5 Average
Grades
Avera
ge T
est
Sco
res
Minority Pre-test Minority Post-test
Test Scores and Gender
Improvement from pre-test to post- test for boys and girls were tested. The results are listed
for gender in Table 2.
Gender Pre-/Post- Test Scores
0
20
40
60
80
100
Grade 1 Grade 2 Grade 3 Grade 4 Grade 5 Average
Grades
Avera
ge S
co
res
Boys Pre-test Boys Post-Test Girls Pre- Test Girls Post- Test
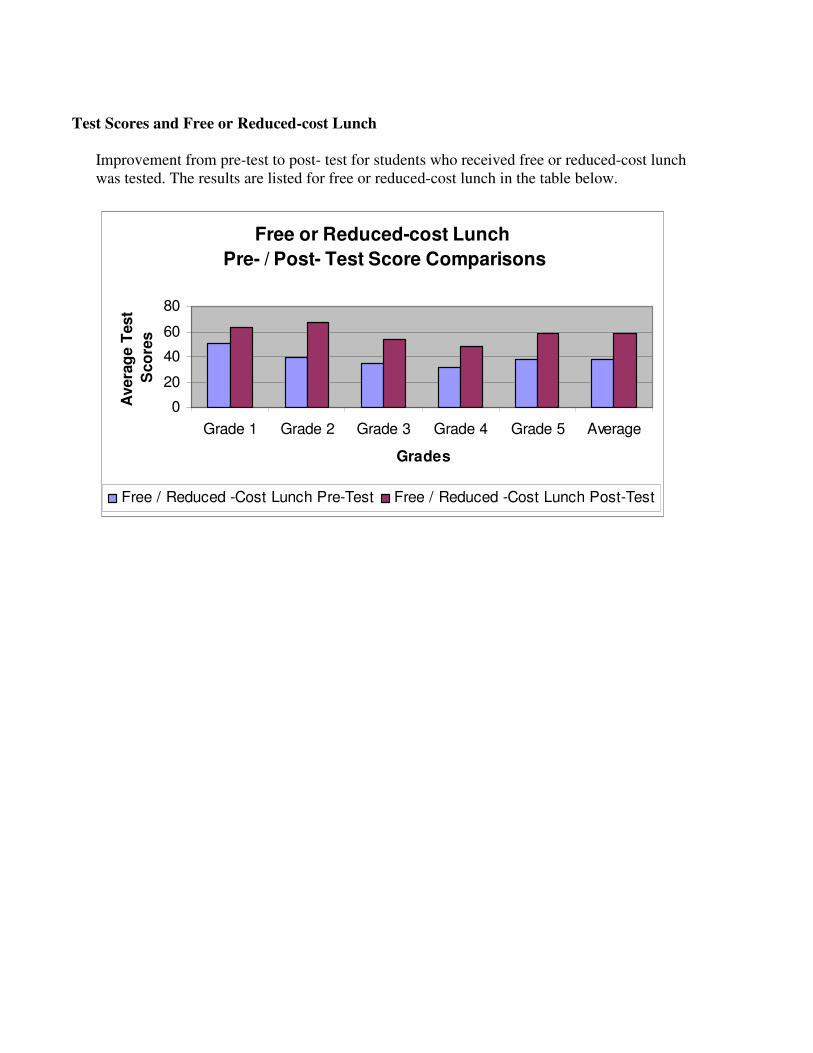
Test Scores and Free or Reduced-cost Lunch
Improvement from pre-test to post- test for students who received free or reduced-cost lunch
was tested. The results are listed for free or reduced-cost lunch in the table below.
Free or Reduced-cost Lunch
Pre- / Post- Test Score Comparisons
0
20
40
60
80
Grade 1 Grade 2 Grade 3 Grade 4 Grade 5 Average
Grades
Avera
ge T
est
Sco
res
Free / Reduced -Cost Lunch Pre-Test Free / Reduced -Cost Lunch Post-Test
Part III.
Efficacy Studies
The following section provides a review of an independent study
conducted in the St. Louis Public School system. The results show
that with the implementation of Macmillan/McGraw-Hill Science
student achievement in science improved as measured by the
Missouri Assessment Program (MAP). An additional benefit was
noted as a result of this initial study. Student reading achievement
also improved as a result of increase science instructional time.
Additional supporting studies are also included.
St. Louis Study
St. Louis Public Schools
Higher Scores on the Latest Missouri Assessment Program (MAP)
Continue Multi-year Improvement in Elementary Schools;
Science Shows Biggest Improvement of Any Subject
Overview
The results of the latest scores on the Missouri Assessment Program (MAP) tests show that
elementary students in the St. Louis Public School district continue to “catch up” to the
Missouri State average in science, communication arts, and mathematics. MAP test scores*
of students in SLPS elementary schools have improved at such a fast rate over the past five
years that the District will actually meet the state average in all three subjects by next year or
the following year just by continuing to improve at this rate.
Data
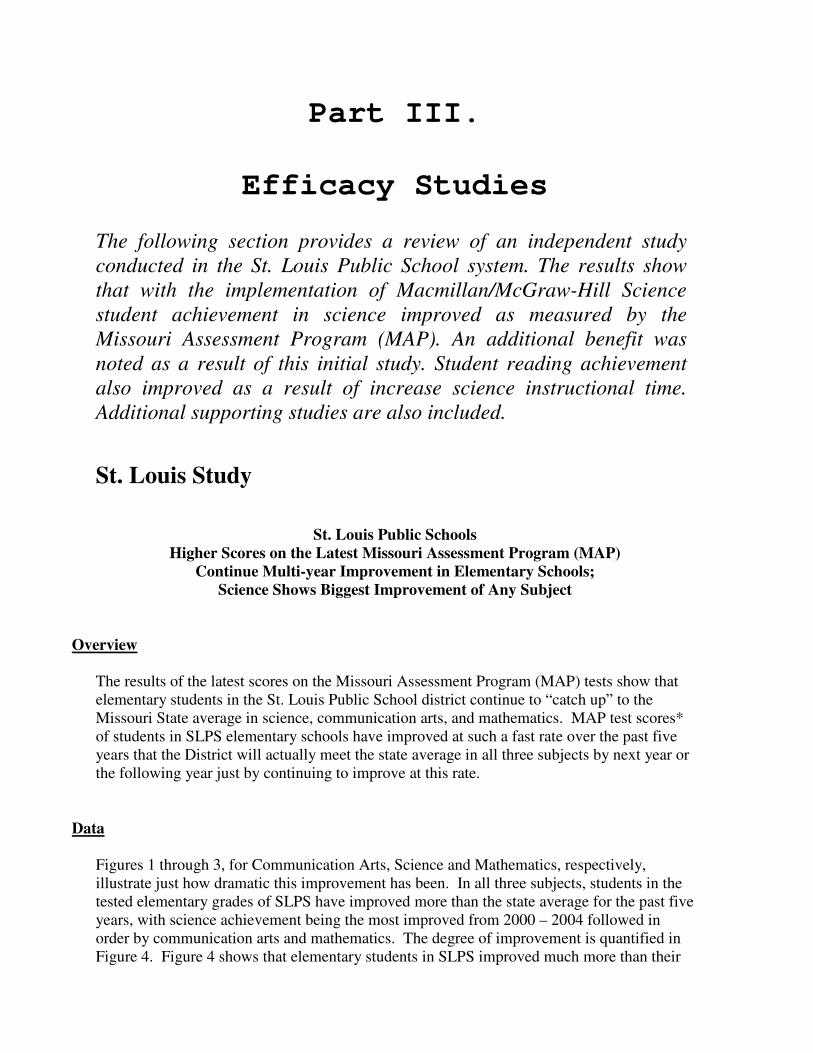
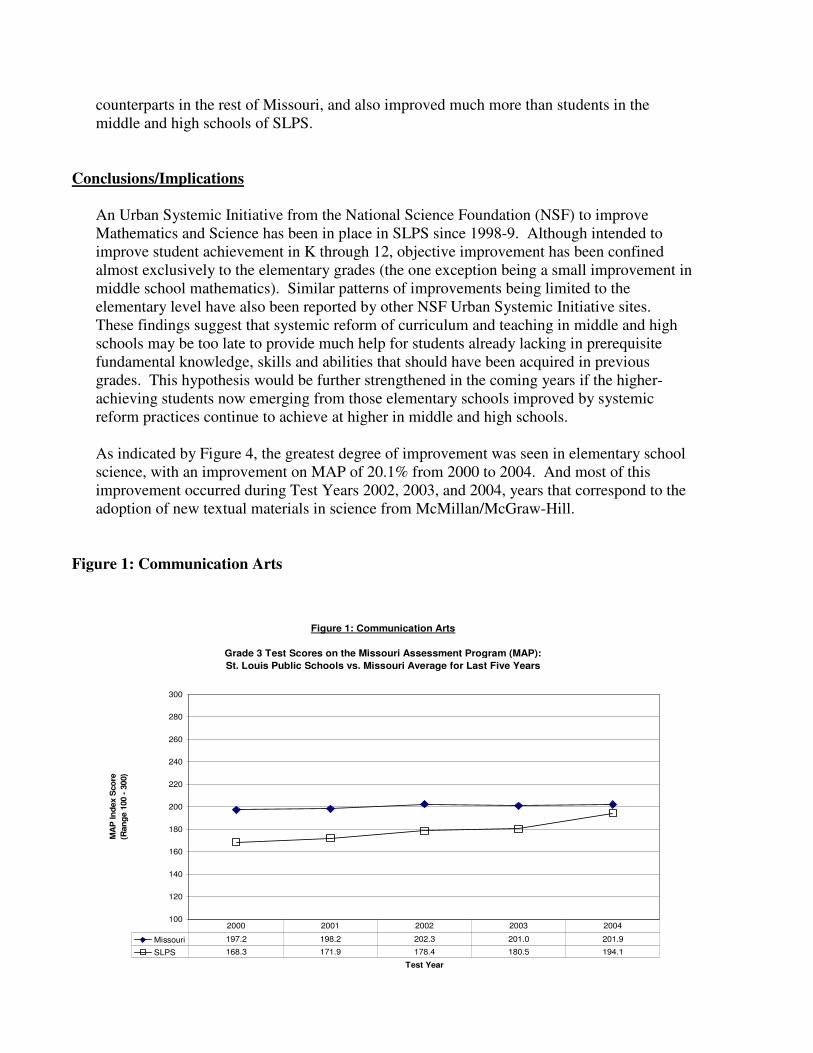
Figures 1 through 3, for Communication Arts, Science and Mathematics, respectively,
illustrate just how dramatic this improvement has been. In all three subjects, students in the
tested elementary grades of SLPS have improved more than the state average for the past five
years, with science achievement being the most improved from 2000 – 2004 followed in
order by communication arts and mathematics. The degree of improvement is quantified in
Figure 4. Figure 4 shows that elementary students in SLPS improved much more than their
counterparts in the rest of Missouri, and also improved much more than students in the
middle and high schools of SLPS.
Conclusions/Implications
An Urban Systemic Initiative from the National Science Foundation (NSF) to improve
Mathematics and Science has been in place in SLPS since 1998-9. Although intended to
improve student achievement in K through 12, objective improvement has been confined
almost exclusively to the elementary grades (the one exception being a small improvement in
middle school mathematics). Similar patterns of improvements being limited to the
elementary level have also been reported by other NSF Urban Systemic Initiative sites.
These findings suggest that systemic reform of curriculum and teaching in middle and high
schools may be too late to provide much help for students already lacking in prerequisite
fundamental knowledge, skills and abilities that should have been acquired in previous
grades. This hypothesis would be further strengthened in the coming years if the higher-
achieving students now emerging from those elementary schools improved by systemic
reform practices continue to achieve at higher in middle and high schools.
As indicated by Figure 4, the greatest degree of improvement was seen in elementary school
science, with an improvement on MAP of 20.1% from 2000 to 2004. And most of this
improvement occurred during Test Years 2002, 2003, and 2004, years that correspond to the
adoption of new textual materials in science from McMillan/McGraw-Hill.
Figure 1: Communication Arts
Figure 1: Communication Arts
Grade 3 Test Scores on the Missouri Assessment Program (MAP):
St. Louis Public Schools vs. Missouri Average for Last Five Years
100
120
140
160
180
200
220
240
260
280
300
Test Year
MA
P In
dex S
co
re
(Ran
ge 1
00 -
300)
Missouri 197.2 198.2 202.3 201.0 201.9
SLPS 168.3 171.9 178.4 180.5 194.1
2000 2001 2002 2003 2004
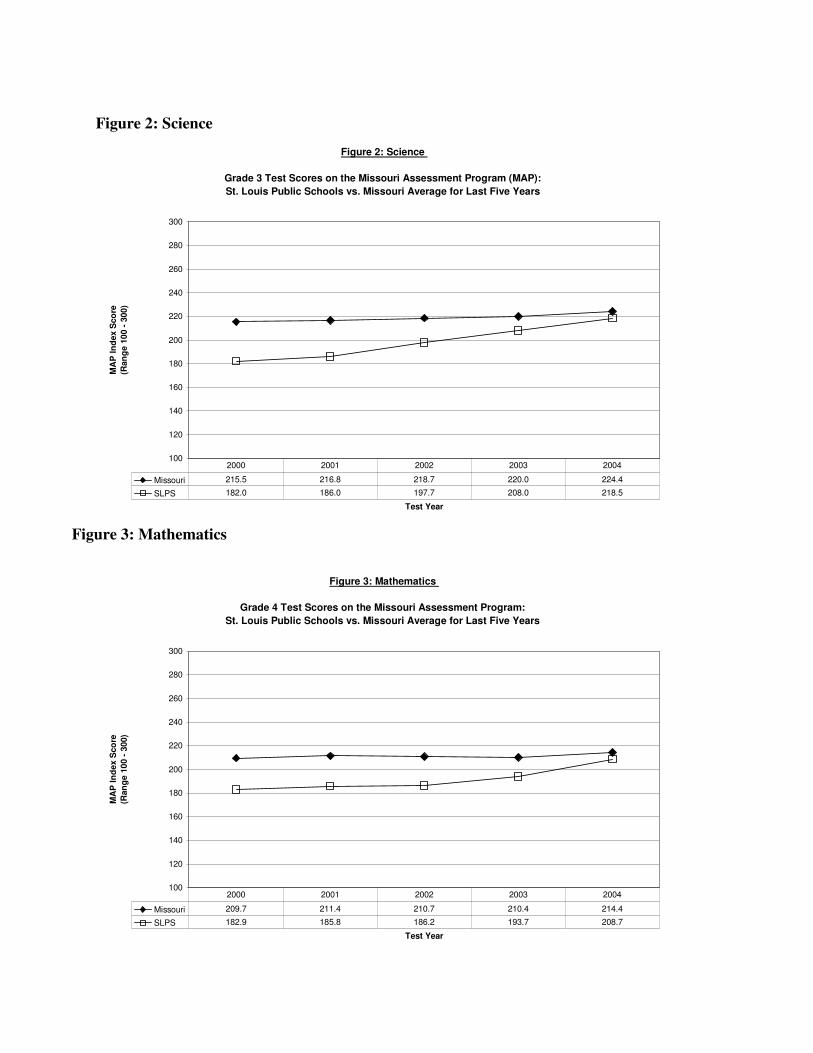
Figure 2: Science
Figure 2: Science
Grade 3 Test Scores on the Missouri Assessment Program (MAP):
St. Louis Public Schools vs. Missouri Average for Last Five Years
100
120
140
160
180
200
220
240
260
280
300
Test Year
MA
P I
nd
ex S
co
re
(Ran
ge 1
00 -
300)
Missouri 215.5 216.8 218.7 220.0 224.4
SLPS 182.0 186.0 197.7 208.0 218.5
2000 2001 2002 2003 2004
Figure 3: Mathematics
Figure 3: Mathematics
Grade 4 Test Scores on the Missouri Assessment Program:
St. Louis Public Schools vs. Missouri Average for Last Five Years
100
120
140
160
180
200
220
240
260
280
300
Test Year
MA
P I
nd
ex S
co
re
(Ran
ge 1
00 -
300)
Missouri 209.7 211.4 210.7 210.4 214.4
SLPS 182.9 185.8 186.2 193.7 208.7
2000 2001 2002 2003 2004
Figure 4:
Percent Improvement in MAP Test Index Scores from 2000 to 2004 by Grade and Subject
St. Louis Public Schools (SLPS) Compared to the Missouri Average
Grade Subject District Year 2000 Year 2004 % Improve
Three/Four Comm. Arts SLPS 168.3 194.1 15.3
Three/Four Science SLPS 182.0 218.5 20.1
Three/Four Mathematics SLPS 182.9 208.7 14.1
Three/Four Comm. Arts Missouri 197.2 201.9 2.4
Three/Four Science Missouri 215.5 224.4 4.1
Three/Four Mathematics Missouri 209.7 214.4 2.2
Seven/Eight Comm. Arts SLPS 154.8 153.9 -0.6
Seven/Eight Science SLPS 136.5 134.9 -1.2
Seven/Eight Mathematics SLPS 134.4 144.3 7.4
Seven/Eight Comm. Arts Missouri 190.8 191.2 0.2
Seven/Eight Science Missouri 169.3 168.6 -0.4
Seven/Eight Mathematics Missouri 167.6 173.4 3.5
Ten/Eleven Comm. Arts SLPS 154.2 142.5 -7.6
Ten/Eleven Science SLPS 135.4 127.1 -6.1
Ten/Eleven Mathematics SLPS 135.8 129.3 -4.8
Ten/Eleven Comm. Arts Missouri 182.9 185.2 1.3
Ten/Eleven Science Missouri 166.2 167.4 0.7
Ten/Eleven Mathematics Missouri 162.2 171.1 5.5
MAP Index Score
*NOTE: MAP scores are presented as Index Scores ranging from 100 to 300. Scores were
calculated by the formula developed by the Missouri Department of Elementary and
Secondary Education (DESE) for purposes of comparing scores among different
demographic groups and among different schools.
Science & Reading Improvement in Grade 3
by St. Louis Public Schools (SLPS):
MAP Test Results Currently (2004) and Four Years Ago (2000)
Compared by Students' Race and to the Missouri (MO) Average
0
10
20
30
40
50
60
70
80
90
100
District/Student Race, Subject, and Test Year
Pe
rce
nt
of
Stu
de
nts
S
co
rin
g P
rofi
cie
nt
or
Hig
he
r o
n M
AP
Te
st
CommArts 31.7 34.6 11.5 29.1 29.8 35.6
Science 44.9 51.2 19.1 45.5 43.0 60.1
4 Years Ago Currently 4 Years Ago Currently 4 Years Ago Currently
MO/All SLPS/Black SLPS/White
Section 2:
Supporting Study: University City, MO Study
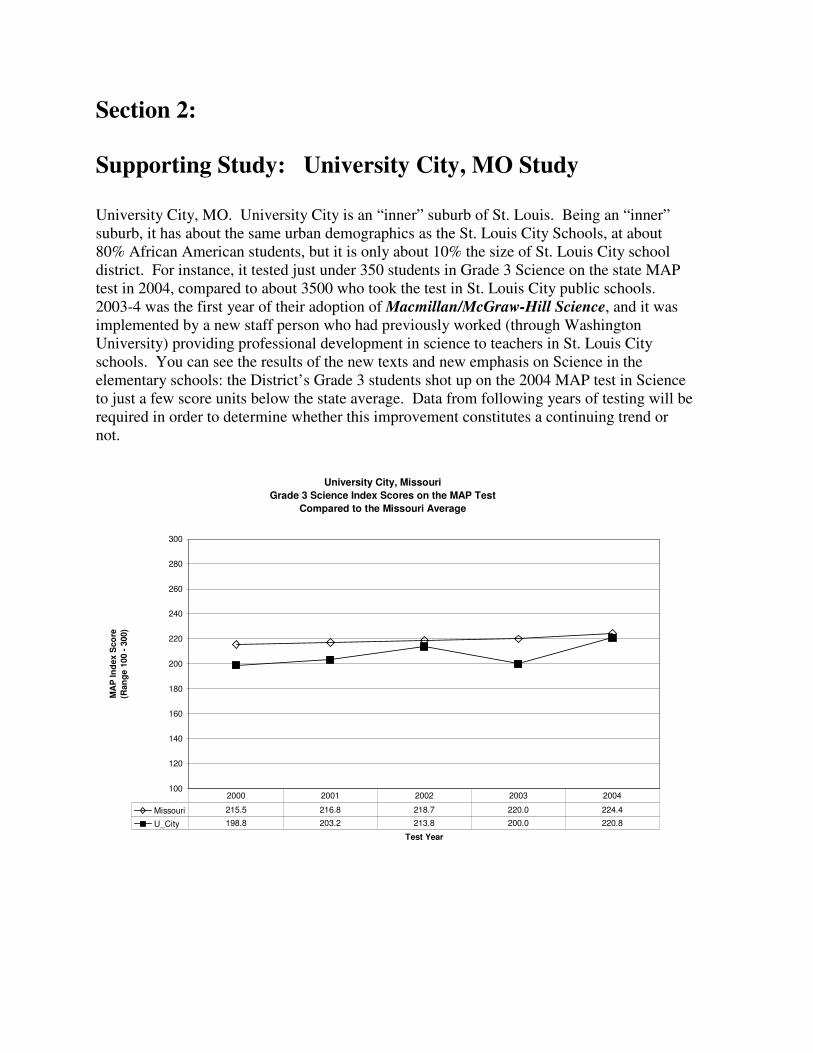
University City, MO. University City is an “inner” suburb of St. Louis. Being an “inner”
suburb, it has about the same urban demographics as the St. Louis City Schools, at about
80% African American students, but it is only about 10% the size of St. Louis City school
district. For instance, it tested just under 350 students in Grade 3 Science on the state MAP
test in 2004, compared to about 3500 who took the test in St. Louis City public schools.
2003-4 was the first year of their adoption of Macmillan/McGraw-Hill Science, and it was
implemented by a new staff person who had previously worked (through Washington
University) providing professional development in science to teachers in St. Louis City
schools. You can see the results of the new texts and new emphasis on Science in the
elementary schools: the District’s Grade 3 students shot up on the 2004 MAP test in Science
to just a few score units below the state average. Data from following years of testing will be
required in order to determine whether this improvement constitutes a continuing trend or
not.
University City, Missouri
Grade 3 Science Index Scores on the MAP Test
Compared to the Missouri Average
100
120
140
160
180
200
220
240
260
280
300
Test Year
MA
P I
nd
ex S
co
re
(Ran
ge 1
00 -
300)
Missouri 215.5 216.8 218.7 220.0 224.4
U_City 198.8 203.2 213.8 200.0 220.8
2000 2001 2002 2003 2004
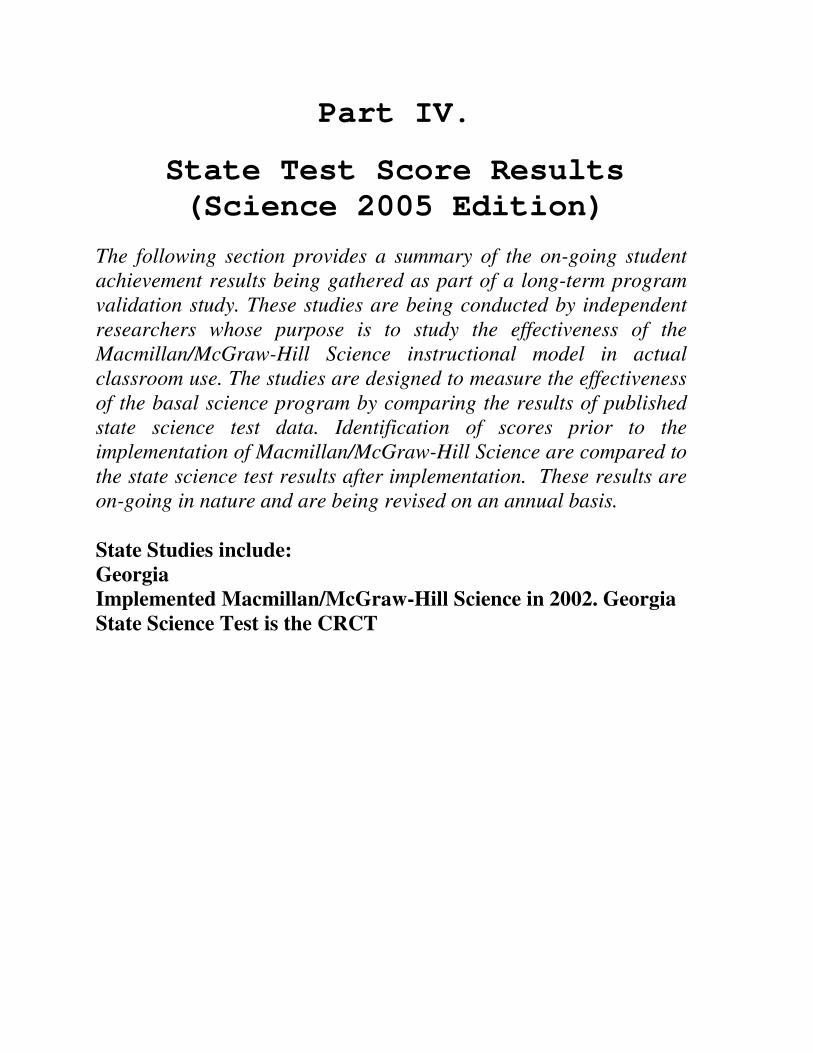
Part IV.
State Test Score Results
(Science 2005 Edition)
The following section provides a summary of the on-going student
achievement results being gathered as part of a long-term program
validation study. These studies are being conducted by independent
researchers whose purpose is to study the effectiveness of the
Macmillan/McGraw-Hill Science instructional model in actual
classroom use. The studies are designed to measure the effectiveness
of the basal science program by comparing the results of published
state science test data. Identification of scores prior to the
implementation of Macmillan/McGraw-Hill Science are compared to
the state science test results after implementation. These results are
on-going in nature and are being revised on an annual basis.
State Studies include:
Georgia
Implemented Macmillan/McGraw-Hill Science in 2002. Georgia
State Science Test is the CRCT
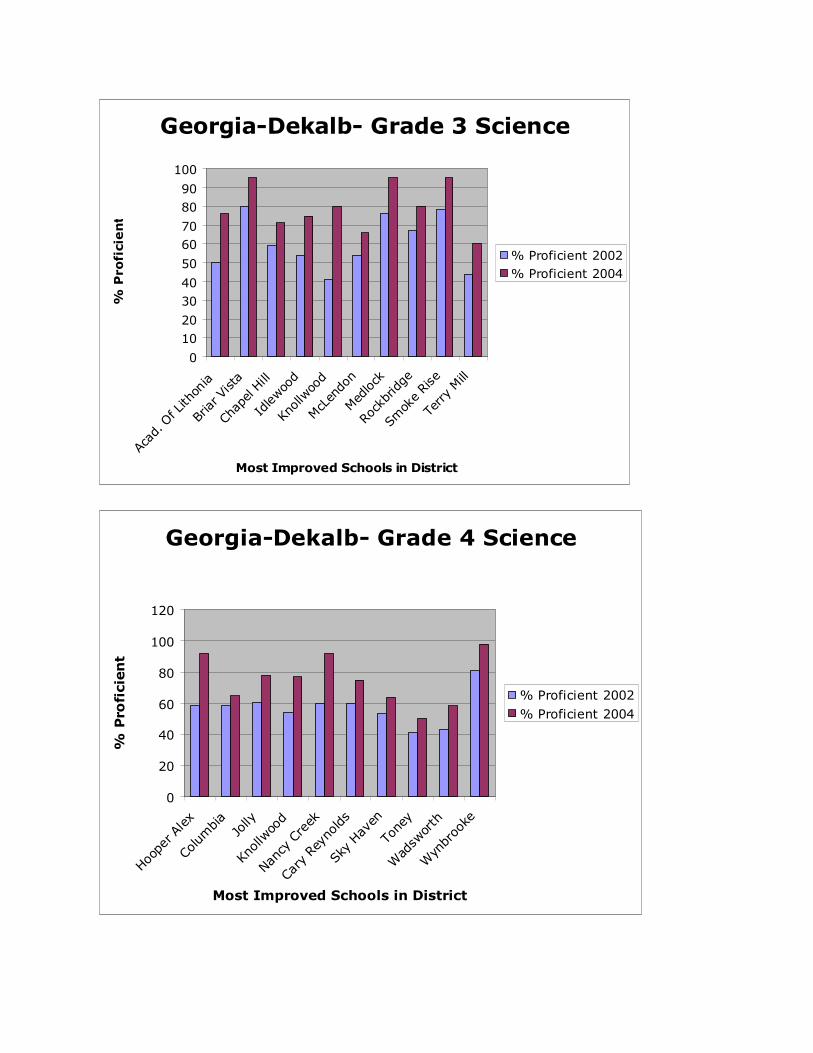
Georgia-Dekalb- Grade 3 Science
0
10
20
30
40
50
60
70
80
90
100
Acad. O
f Lith
onia
Briar Vis
ta
Chapel
Hill
Idle
woo
d
Knollwoo
d
McL
endon
Med
lock
Rock
bridge
Smok
e Ris
e
Terry
Mill
Most Improved Schools in District
% Proficient
% Proficient 2002
% Proficient 2004
Georgia-Dekalb- Grade 4 Science
0
20
40
60
80
100
120
Hoop
er Ale
x
Colum
biaJo
lly
Knollwoo
d
Nancy
Cre
ek
Cary R
eynold
s
Sky H
aven
Toney
Wad
swor
th
Wyn
brooke
Most Improved Schools in District
% Proficient
% Proficient 2002
% Proficient 2004
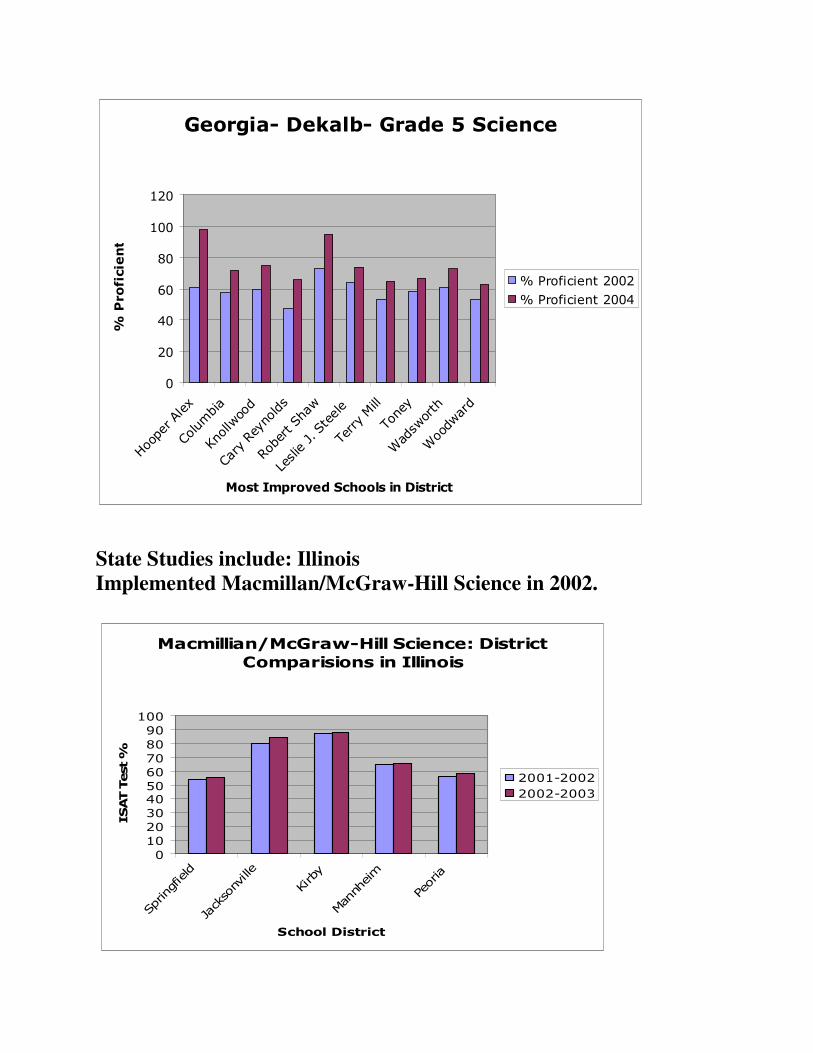
Georgia- Dekalb- Grade 5 Science
0
20
40
60
80
100
120
Hoop
er Ale
x
Colum
bia
Knollwoo
d
Cary R
eynold
s
Robert Shaw
Lesl
ie J
. Ste
ele
Terry
Mill
Toney
Wad
swor
th
Wood
ward
Most Improved Schools in District
% Proficient
% Proficient 2002
% Proficient 2004
State Studies include: Illinois
Implemented Macmillan/McGraw-Hill Science in 2002.
Macmillian/McGraw-Hill Science: District
Comparisions in Illinois
0
10
20
30
4050
60
70
80
90
100
Springf
ield
Jack
sonv
ille
Kirby
Man
nheim
Peoria
School District
ISAT Test %
2001-2002
2002-2003
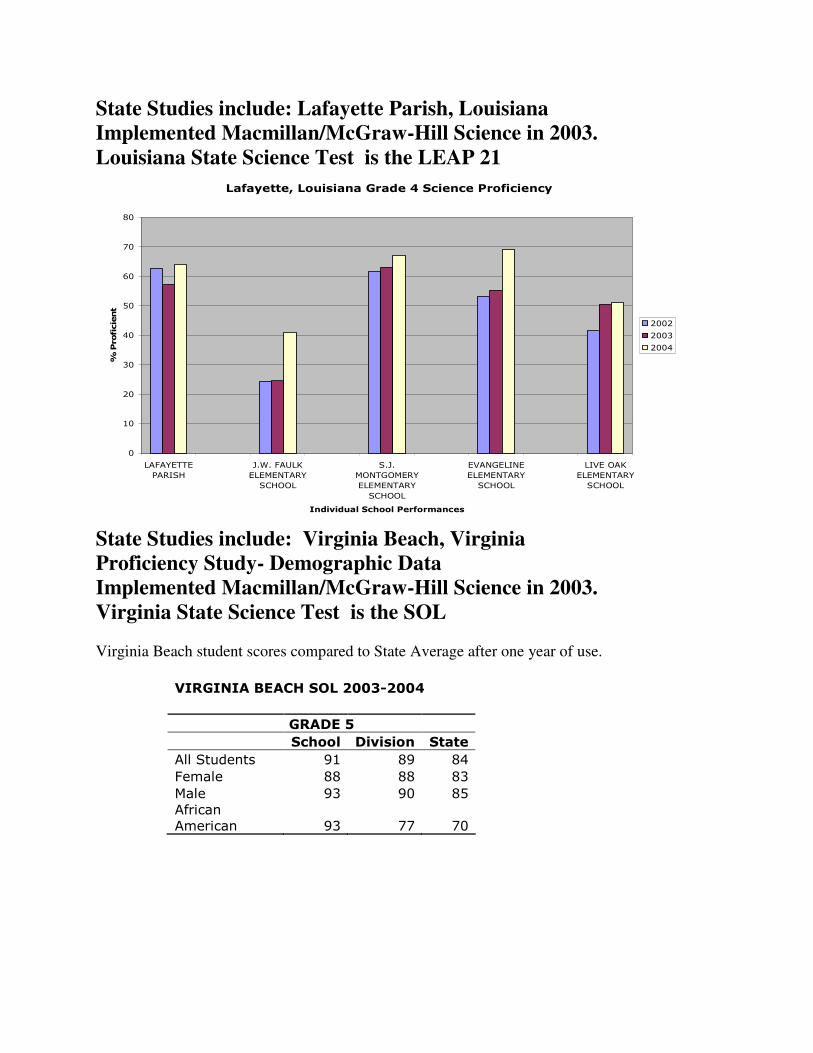
State Studies include: Lafayette Parish, Louisiana
Implemented Macmillan/McGraw-Hill Science in 2003.
Louisiana State Science Test is the LEAP 21
Lafayette, Louisiana Grade 4 Science Proficiency
0
10
20
30
40
50
60
70
80
LAFAYETTE
PARISH
J.W. FAULK
ELEMENTARY
SCHOOL
S.J.
MONTGOMERY
ELEMENTARY
SCHOOL
EVANGELINE
ELEMENTARY
SCHOOL
LIVE OAK
ELEMENTARY
SCHOOL
Individual School Performances
% Proficient
2002
2003
2004
State Studies include: Virginia Beach, Virginia
Proficiency Study- Demographic Data
Implemented Macmillan/McGraw-Hill Science in 2003.
Virginia State Science Test is the SOL
Virginia Beach student scores compared to State Average after one year of use.
VIRGINIA BEACH SOL 2003-2004
GRADE 5
School Division State
All Students 91 89 84
Female 88 88 83
Male 93 90 85
African
American 93 77 70
Grade 5 SOL Science Performance 2003-2004
60
65
70
75
80
85
90
95
All Students Female Male African American
% Proficiency
School
Division
State
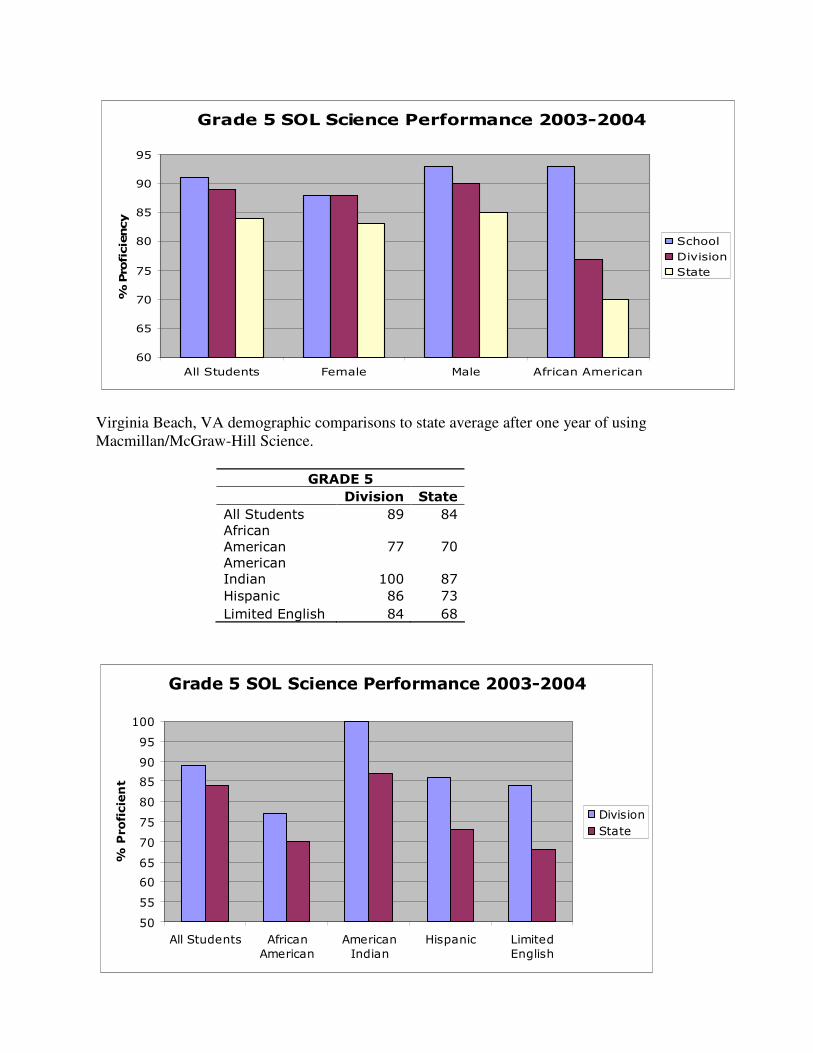
Virginia Beach, VA demographic comparisons to state average after one year of using
Macmillan/McGraw-Hill Science.
GRADE 5
Division State
All Students 89 84
African
American 77 70
American
Indian 100 87
Hispanic 86 73
Limited English 84 68
Grade 5 SOL Science Performance 2003-2004
50
55
60
65
70
75
80
85
90
95
100
All Students African
American
American
Indian
Hispanic Limited
English
% Proficient
Division
State
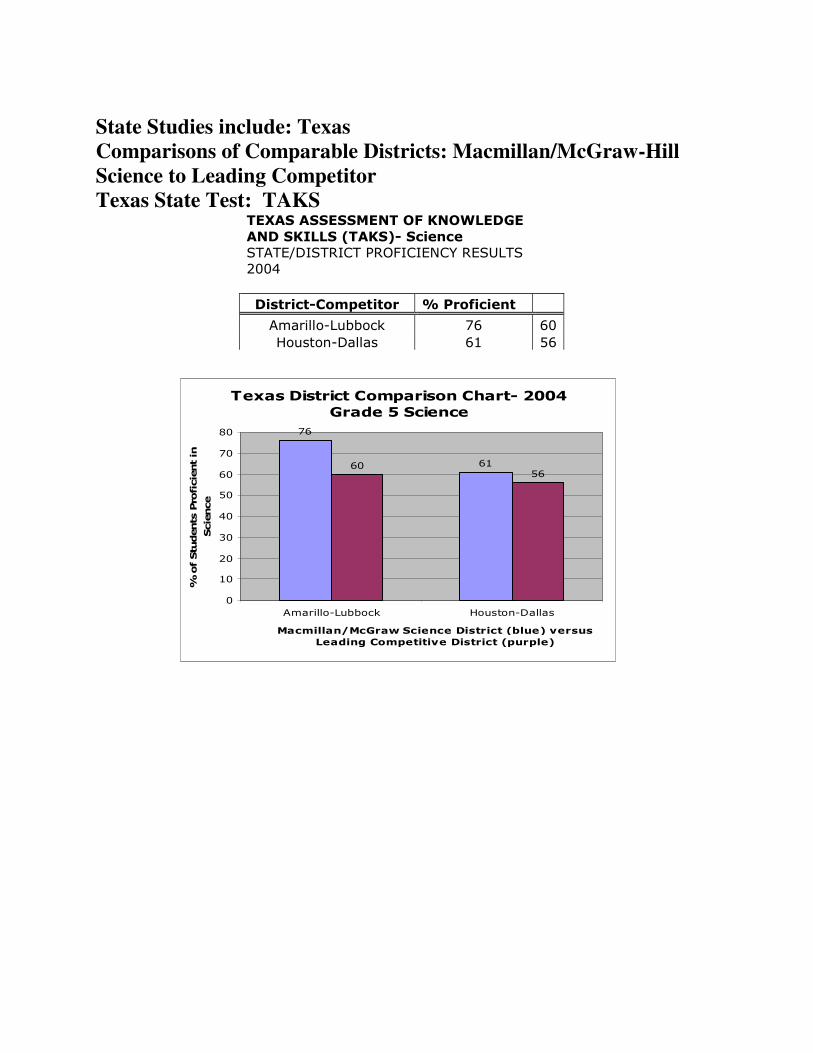
State Studies include: Texas
Comparisons of Comparable Districts: Macmillan/McGraw-Hill
Science to Leading Competitor
Texas State Test: TAKS TEXAS ASSESSMENT OF KNOWLEDGE
AND SKILLS (TAKS)- Science
STATE/DISTRICT PROFICIENCY RESULTS
2004
District-Competitor % Proficient
Amarillo-Lubbock 76 60
Houston-Dallas 61 56
Texas District Comparison Chart- 2004
Grade 5 Science
76
616056
0
10
20
30
40
50
60
70
80
Amarillo-Lubbock Houston-Dallas
Macmillan/McGraw Science District (blue) versus
Leading Competitive District (purple)
% of Students Proficient in
Science

![MacMillan/McGraw-Hill Treasuresstatic.wixie.com/files/kits/Enhancing_Treasures-Grades_1-6.pdf · Enhancing MacMillan/McGraw-Hill Treasure [ 6 ] Grade 1 - Unit 4: Nature Watch Learn](https://img.dokumen.tips/doc/110x75/5eaaa7c621ec04588163f055/macmillanmcgraw-hill-enhancing-macmillanmcgraw-hill-treasure-6-grade-1-unit.jpg)