Embed Size (px)
Citation preview

E:\Marketing Communications\Papers and Presentations\Technical Papers\New Technical Papers\Machinery Vibration Limits#8.doc 1
Machinery Vibration Limits and
Dynamic Structural Response
By Brian C. Howes, P. Eng., M.Sc.
Brian Howes is Manager of Engineering for Beta Machinery Analysis Ltd., Calgary. His previous experience has included research and development in the area of pulsations and vibrations of piping systems, and troubleshooting of problems in a wide range of equipment including turbines, pumps, compressors, pulp refiners, ball mills, furnaces and piping systems. He has a Master of Science in Solid Mechanics from the University of Calgary, and is a member of the Vibration Institute. ABSTRACT Changes in case vibration readings are used to monitor rotating machinery condition. Absolute levels of vibration are indications of condition except where structural resonances (e.g.: bearing housings, or motor bases) amplify vibrations at certain frequencies (usually integer multiples of shaft speed). Dynamic response at vibration test points can be measured on new installations to assist in establishing standards for absolute vibrations. Also, changes in dynamic response over time can add to understanding of machine condition. Discussion of case history to illustrate points is included.
http://www.BetaMachinery.com

2
Machinery Vibration Limits and
Dynamic Structural Response
Vibration monitoring of rotating machinery has developed over the years to the point where it is an accepted maintenance tool. Much effort has been applied towards developing guidelines regarding acceptable absolute levels of vibration. Discussions of some of these standards and their inadequacies are given in References 1, 2 and 3. The real intent of vibration monitoring, in our opinion, is to infer the absolute force levels or more basically, the stress levels, acting in the monitored machine. Based on the conclusions reached from the analysis of vibration levels, decision must be made to balance a rotor, redesign an impellor, shut a process down and open the case of a compressor, etc., all involving potentially expensive downtime of the machine. Correct analysis of the cause of high vibration levels can permit quick correction with consequent dollar savings. Case, shaft absolute and shaft relative-to-case vibration readings are all used for diagnosis. Structural resonances can produce local increases or decreases (Reference 1) in these vibration levels with no change in force level in the machine. It is important to distinguish between the presence of large forces (eg: large unbalance, malalignment, high vane passing pulsations, etc.) and dynamic amplification of the internally generated forces by a structural resonance, as the type of corrective measure will be different. Three classes of problem can be envisioned:
- high vibration, acceptable forces, structural resonance - high vibration, unacceptable forces, structural resonance - high vibration, unacceptable forces, no structural resonance.
Another aspect of vibration analysis involves the amount of prior knowledge. Two general situations occur:
- troubleshooting a new problem or a newly started machine with no background vibration data available for the machine.
- trending of vibration levels over an extended period has been carried out and is
used to assist in diagnosing the cause of a problem on a machine. Although this paper is written from the first point of view, trending of vibrations would generally be preferred. Trending will detect changes in machine condition that may be very difficult to detect without historical information.
http://www.BetaMachinery.com

3
An example of this concept was recently observed on a centrifugal compressor. The vibration levels were within “guideline”. However, the compressor had recently lost a blade. The vibration levels before losing the blade were significantly less than “guideline”. Without the historical information a case could not be made for shutting the unit down, bearing in mind the high cost of lost production during shutdown. Knowledge of the dynamic stiffness of machines at the various vibration test points can reduce the need to rely on historical data. The following case histories are provided as examples to show situations where simple measurement of vibrations and comparison with standards would have or did cause confusion and lost time in the correct diagnosis of the problem. Consider the situation in which a machine has unbalance generating 1000 lb. shaking force at operating speed of 3600 rpm. If the bearing housing has a dynamic stiffness of 1,000,000 lb/in, then the vibration amplitude will be: 1000 inch = .001 inch = 2 mil p-p 1,000,000 or: .001 inch x 3600 x 2 rad = .377 in pk 60 sec sec Now consider a similar machine with a bearing housing having a stiffness of only 500,000 lb/in. The same unbalance would produce 4 mils p-p or .75 in/sec peak. The quality of the balance of each machine is the same, yet according to the vibration standards the second machine is in “worse condition”. That is “has poorer balance”. If one accepts that stress is proportional to vibration, the second machine should be balanced to twice as stringent a standard as the first. This might require balancing twice as often as the first machine with proportionately higher costs of downtime. Alternatively, an increase in the dynamic stiffness of the bearing housing would make the machine less sensitive to changes in balance (eg: due to wear or buildup on the rotor over a period of time) producing operating savings at the cost of an initial “capital” expense.
http://www.BetaMachinery.com
4
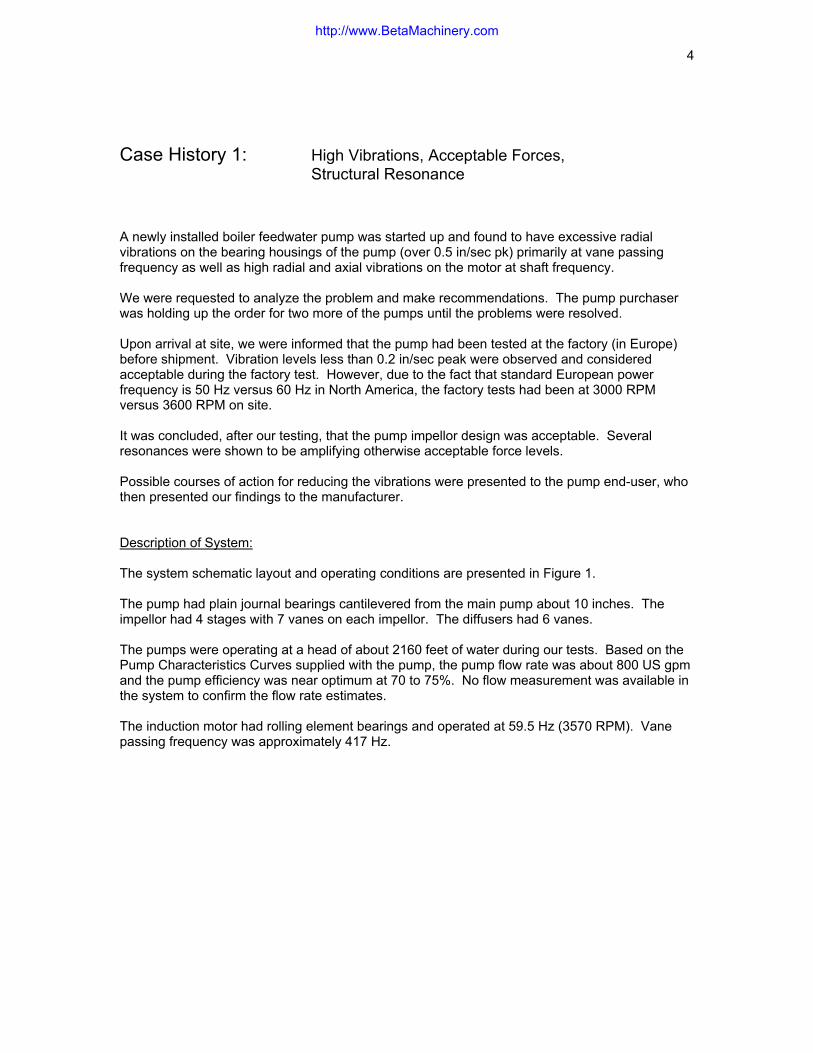
Case History 1: High Vibrations, Acceptable Forces, Structural Resonance
A newly installed boiler feedwater pump was started up and found to have excessive radial vibrations on the bearing housings of the pump (over 0.5 in/sec pk) primarily at vane passing frequency as well as high radial and axial vibrations on the motor at shaft frequency. We were requested to analyze the problem and make recommendations. The pump purchaser was holding up the order for two more of the pumps until the problems were resolved. Upon arrival at site, we were informed that the pump had been tested at the factory (in Europe) before shipment. Vibration levels less than 0.2 in/sec peak were observed and considered acceptable during the factory test. However, due to the fact that standard European power frequency is 50 Hz versus 60 Hz in North America, the factory tests had been at 3000 RPM versus 3600 RPM on site. It was concluded, after our testing, that the pump impellor design was acceptable. Several resonances were shown to be amplifying otherwise acceptable force levels. Possible courses of action for reducing the vibrations were presented to the pump end-user, who then presented our findings to the manufacturer. Description of System: The system schematic layout and operating conditions are presented in Figure 1. The pump had plain journal bearings cantilevered from the main pump about 10 inches. The impellor had 4 stages with 7 vanes on each impellor. The diffusers had 6 vanes. The pumps were operating at a head of about 2160 feet of water during our tests. Based on the Pump Characteristics Curves supplied with the pump, the pump flow rate was about 800 US gpm and the pump efficiency was near optimum at 70 to 75%. No flow measurement was available in the system to confirm the flow rate estimates. The induction motor had rolling element bearings and operated at 59.5 Hz (3570 RPM). Vane passing frequency was approximately 417 Hz.
http://www.BetaMachinery.com

5
Testing: The vibration levels at or near the four bearings were recorded initially. The unfiltered readings showed high vibrations, particularly on the pump inboard. These data are presented in Table 1 in terms of both velocity and acceleration. They are also presented in Figure 2 in spectral form. The coupled motor vibrations were high also as show in Figure 2. Uncoupled, the motor did not run very much smoother. The uncoupled motor vibration data are presented in Table 2 and Figure 3. The majority of the vibrations on the pump bearings were observed to be at 7 times shaft speed. This frequency coincides with vane passing frequency on the impellor. The pump body did not show high levels of vibration. Immediately, suspicion fell on the impellor design. The pump characteristics had been extrapolated from 3000 RPM tests. Could an error have been made in the design? Were the impellors not staggered on the shaft? The buyer believed that the impellors were staggered, but we did not see the impellor to confirm this point. In an attempt to further our understanding of the pump, we measured pressure pulsations at the outlet of the pump. The spectrum of these pulsations is presented in Figure 4. Also shown on Figure 4 are dimensions associated with the pulsation measurement. The pressure transducer was located at least 43 inches from the pump impellor. Calculating the speed of sound in water at 330 degrees Fahrenheit inside a pipe of non-uniform wall thickness (due to the presence of the valve) gives an approximate value of 4000 to 5000 feet per second. The wavelength of 420 Hz pulsation (7 times shaft speed) will be in the range of 150 to 100 inches, making the distance from pump to pressure transducer close to a half-wave length. Assuming the pump is a velocity source, the pressure transducer was probably near a pressure minimum in the standing wave pattern at 420 Hz throughout the discharge piping system. This means that pulsations elsewhere in the system, including in the pump could have been much larger than measured. Unfortunately, the test valve used was the only one available in the discharge piping. Reference “4” suggests that pulsations less than 3% of line pressure are acceptable in centrifugal pumps. Pulsations were less than this limit at the measurement point. The results of the pulsation measurements did not prove that the impellor design was unacceptable, nor that there was an acoustical resonance in the piping. They did not prove that the impellor design was adequate either.
http://www.BetaMachinery.com
6
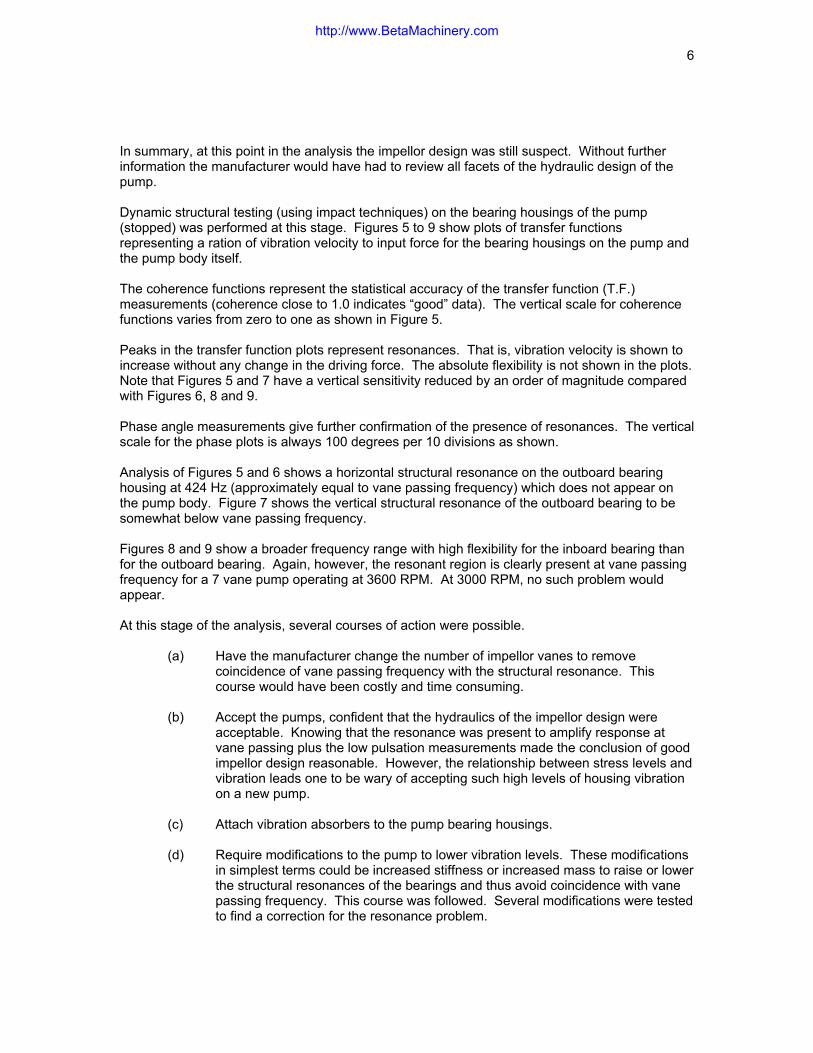
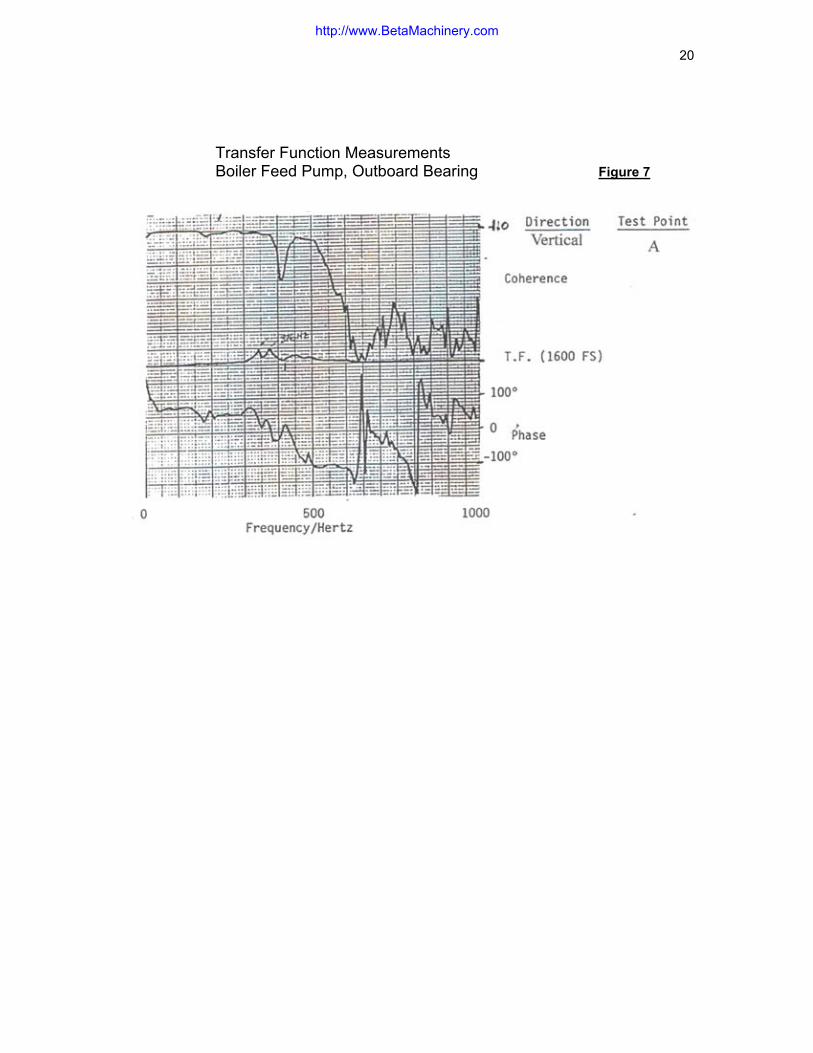
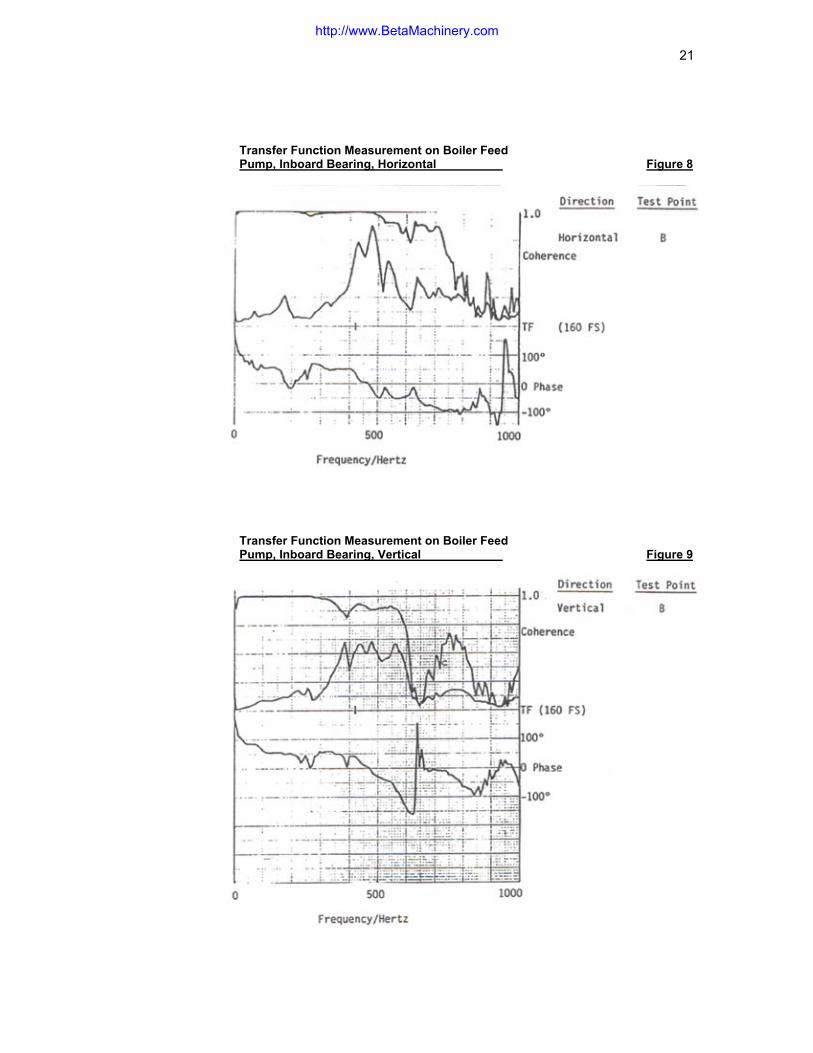
In summary, at this point in the analysis the impellor design was still suspect. Without further information the manufacturer would have had to review all facets of the hydraulic design of the pump. Dynamic structural testing (using impact techniques) on the bearing housings of the pump (stopped) was performed at this stage. Figures 5 to 9 show plots of transfer functions representing a ration of vibration velocity to input force for the bearing housings on the pump and the pump body itself. The coherence functions represent the statistical accuracy of the transfer function (T.F.) measurements (coherence close to 1.0 indicates “good” data). The vertical scale for coherence functions varies from zero to one as shown in Figure 5. Peaks in the transfer function plots represent resonances. That is, vibration velocity is shown to increase without any change in the driving force. The absolute flexibility is not shown in the plots. Note that Figures 5 and 7 have a vertical sensitivity reduced by an order of magnitude compared with Figures 6, 8 and 9. Phase angle measurements give further confirmation of the presence of resonances. The vertical scale for the phase plots is always 100 degrees per 10 divisions as shown. Analysis of Figures 5 and 6 shows a horizontal structural resonance on the outboard bearing housing at 424 Hz (approximately equal to vane passing frequency) which does not appear on the pump body. Figure 7 shows the vertical structural resonance of the outboard bearing to be somewhat below vane passing frequency. Figures 8 and 9 show a broader frequency range with high flexibility for the inboard bearing than for the outboard bearing. Again, however, the resonant region is clearly present at vane passing frequency for a 7 vane pump operating at 3600 RPM. At 3000 RPM, no such problem would appear. At this stage of the analysis, several courses of action were possible.
(a) Have the manufacturer change the number of impellor vanes to remove coincidence of vane passing frequency with the structural resonance. This course would have been costly and time consuming.
(b) Accept the pumps, confident that the hydraulics of the impellor design were
acceptable. Knowing that the resonance was present to amplify response at vane passing plus the low pulsation measurements made the conclusion of good impellor design reasonable. However, the relationship between stress levels and vibration leads one to be wary of accepting such high levels of housing vibration on a new pump.
(c) Attach vibration absorbers to the pump bearing housings.
(d) Require modifications to the pump to lower vibration levels. These modifications
in simplest terms could be increased stiffness or increased mass to raise or lower the structural resonances of the bearings and thus avoid coincidence with vane passing frequency. This course was followed. Several modifications were tested to find a correction for the resonance problem.
http://www.BetaMachinery.com

7
MOD 1 A hydraulic jack resting against the pump body was used to stiffen the outboard bearing in the horizontal direction. The housing static deflection was limited to .001”, measured with a dial indicator relative to the pump body. MOD 2 The static deflection was increased to .002”. MOD 3 A second jack was added on the opposite side and was loaded to reduce the
deflection to zero. Figures 10 to 13 show the “as found” and resulting transfer functions measured at each step in the modifications discussed above. The expected reduction in vibrations at 424 Hz can be calculated from the reduction in measured dynamic flexibility in the plots. The best reduction obtained was a factor of 2 for MOD 3. Modifications to reduce resonant frequencies were attempted next. MOD 4 The jacks were removed and weights totaling 20.5 lbs. were clamped to the
outboard bearing housing. MOD 5 The weight was increased to 50 lb. Figures 14 to 16 show the as found and resulting transfer functions measured on the pump. Note that Figure 16 is for the vertical direction. The best expected reduction in vibrations for MOD 5 appears to be greater than a factor of 20 in the horizontal direction. Figures 17 and 18 show the spectra of running vibrations on the pump with various sets of weights added to the bearings. Figure 17 shows vibrations at A, first with 38 lbs. clamped on bearing A, and then with 38 lbs., also on bearing B. Note the further reduction at A due to lower vibrations at B. Figure 18 shows vibrations at B, first with 38 lbs. added only on bearing A, then with 38 lbs. also on bearing B. Figure 19 shows vibrations across the machine with 47.5 lbs. of weight clamped on both of the bearing housings. Note that the vertical vibrations have increased at bearing B at vane passing compared with the 38 lb. weight results in Figure 18, while the horizontal vibrations have decreased. The motor vibration remained to be analyzed. Further structural response tests were made on the motor in the horizontal and axial directions. Refer to Figures 20 and 21. These Figures show structural resonances present at the same frequencies that show high response on the motor in Figures 2 and 3. The skid showed signs of poor design which would explain the structural resonances. The skid was concrete filled, but the concrete was not connected to the steel due to shrinkage. Our recommendation for vibration reduction on the motor was to rebuild the skid.
http://www.BetaMachinery.com

8
Case History 2: High Vibrations, Unacceptable Forces, Structural Resonance
High vibration levels were observed on a steam turbine driving a centrifugal compressor. The unit had been in operation for about 17 years without incident. The problem appeared as an increase of vibration on the turbine inboard bearing housing. The owner decided that a problem had developed with the turbine. The spare rotor was installed, but no change in vibrations resulted. Next, a new coupling was ordered (at premium rates). Two weeks later, it was installed. No change was observed in vibrations. Alignment was changed but again, no decrease in vibration was produced. Balancing on the coupling was performed with mixed results. Vibrations were reduced on the turbine inboard bearing but were increased on the compressor inboard. At this stage, we were brought into the job. Our analysis showed that the turbine inboard bearing was resonant at the problem frequency. The case vibrations were reduced to acceptable levels by installing stiffeners under the turbine bearing. Realignment and trim balancing further reduced vibrations. However, we concluded that the sudden change in vibrations was still significant and recommended that the compressor be inspected at the earliest convenience time. It was suspected that cracks were present on the rotor and small pieces of metal were being lost. Later inspection proved the analysis to be correct. The compressor balance changed. The turbine inboard bearing was the most sensitive structural component and showed the highest level of vibration on the unit. The compressor bearing housings were much stiffer and showed little case vibration before or after the change in rotor balance. Shaft-relative readings also showed larger shaft motion at the turbine inboard than at the compressor inboard. Proper analysis of this machine problem in the beginning could have saved much time and lost production, not to mention unnecessary changes to the unit.
http://www.BetaMachinery.com

9
Case History 3: High Vibrations, Unacceptable Forces, No Structural Resonance
High vibration levels were observed on a wood pulp refiner. It was noted that the vibrations were particularly high in the axial direction and that the axial motion of the motor (8000 HP synchronous, 3600 RPM) was out of phase with respect to the refiner motion. High levels of vibration were noticed after the grinding plates on the rotor had been replaced. An analysis was performed for the owner and it was suggested that the alignment should be rechecked because of the high axial vibration and the “out-of-phase” motion. The owner requested an additional analysis by us. We observed that the motor-refiner combination was mounted on an inertia block (concrete, 10 ft x 30 ft x 3 ft). Shaker tests by us on similar units had shown that the flexible mode of vibration of the inertia block was consistent with the phase relationship of the axial motion of the motor and the refiner. The system was not resonant, however. The refiner was run with the replaceable disc removed from the rotor. Vibrations decreased to acceptable levels. It was concluded that the total problem related to imbalance of the replaceable disc on the rotor due to a lack of concentricity between the factory jig and the centre of the disc, or between the disc and rotor centres. The mode shape of the vibration converted radial forces at the refiner disc into axial motion at the bearings due to flexing of the inertia block. This case is an example of the problem one has using phase measurements alone to diagnose the presence of misalignment. Understanding the mode shape of the system is required. Trending Structural Response Changes Another use for structural dynamic measurements is the determination of changes in a structure. An intriguing example of this is mentioned in Reference 5, for use on offshore structures. The response to wave action is used to detect cracks in struts supporting the platform. Vibration trends have been used regularly in the past, but the assumption is usually made that the rotor is the only thing changing. Vibration trends have been used regularly in the past, but the assumption is usually made that the change in forces generated by the rotating components is the cause of changes in vibration. Of course, structural changes such as loose bolts, cracked legs, failed grout or loose bearing caps, to mention a few possibilities, could equally well be the cause of vibration changes. One way to check for this possibility would be to compare dynamic response data.
http://www.BetaMachinery.com

10
Conclusions: The diagnosis of machinery faults should be based on as many pieces of information as possible. Different sensors should be used wherever possible. Past history is extremely valuable and should be reviewed when available. The dynamic structural response of all vibration test points should be a basic part of vibration analyses. These data should be recorded when the unit is newly commissioned and periodically (eg: at shutdowns) afterwards. The structural response includes the mode shapes of vibration at key frequencies. Structural response and vibration readings permit the estimation of forces in the machine. Decisions regarding how to solve problems can be made more rationally with this information, thus reducing downtime and saving money.
http://www.BetaMachinery.com
11
References 1. “Some Considerations in Adopting Machinery Vibration Standards”
A. Stewart Maxwell, Preprint for presentation to Vibration Institute. 2. “Machinery Vibration Criteria”
Lionel M. Lortie, Vibration Institute. 3. “Program Machine Maintenance by Measuring Vibration Velocity”
Steve Maten, Hydrocarbon Processing – Sept. 1970 pp 291 – 296 4. Survey of Feed Pump Outages” FP-754
Prepared by Energy Research and Consultants Corporation, Morrisville, Pennsylvania, April, 1978.
5. “Accelerometers used in Platform Inspection Method”
pg. 92 Oil & Gas Journal – June 21, 1982
http://www.BetaMachinery.com

12
Figure 1: Layout & Operating Conditions Layout:
4 Stage Pump with 7 vanes on each impellor and 6 vanes on the diffusers Pump Gear Coupling Induction Motor 3570 RPM, 700 HP Operating Conditions – “As Found”:
TSuction
330 dg.F. (variable) Pump Bearing Temperature
PSuction
75 psig A: 40 dg.C
TDischarge
325 dg.F. (variable) B: 42 dg.C.
PDischarge
940 psig Pump Head = 2160 ft. H20
Pump Bearing Oil Pressure
20 psig
Balancing Press.
88.5 psig (203 f.o.w.)
http://www.BetaMachinery.com

13
Table 1 “As Found” Vibration Data (unfiltered)
Bearing
Direction in/sec pk. g pk.
A Horizontal Vertical Axial
.24
.13 .1
1.56 .72 .48
B Horizontal Vertical
.51
.333.3 2.3
C Horizontal Vertical
.27 .2
.63 1.3
D Horizontal Vertical Axial
.27
.19
.21
.64 .6
.48
http://www.BetaMachinery.com
14
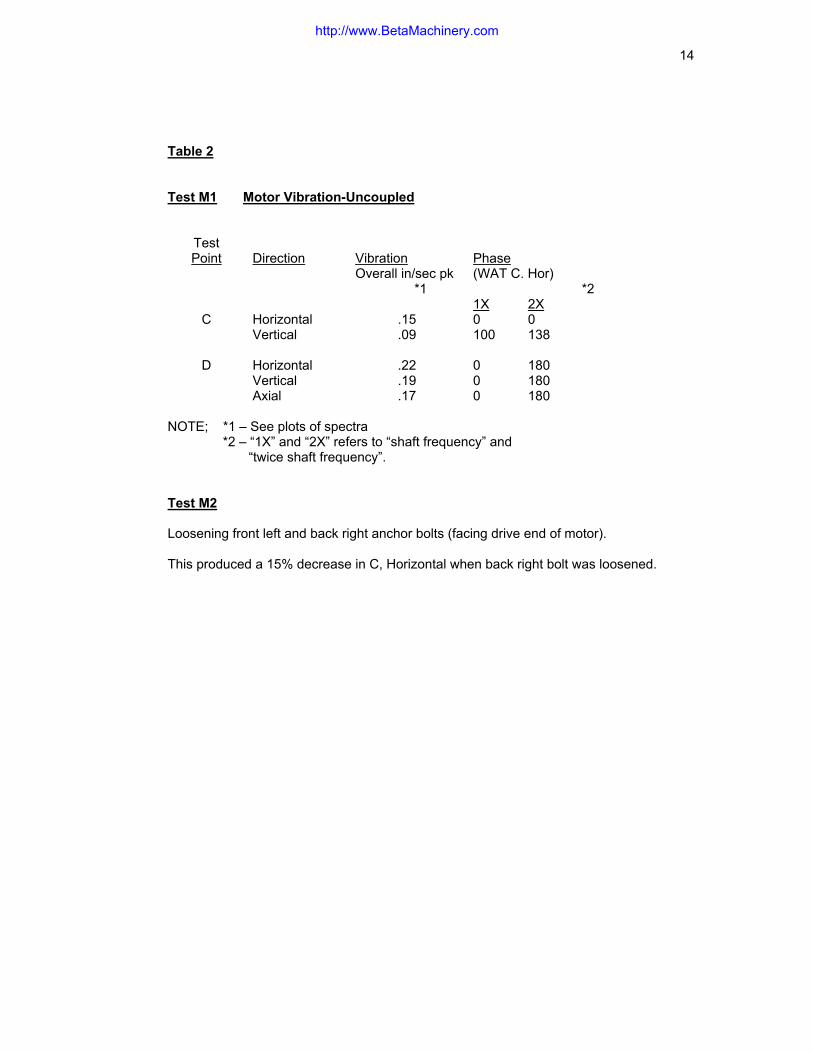
Table 2 Test M1 Motor Vibration-Uncoupled
Test Point
Direction
Vibration
Overall in/sec pk *1
Phase (WAT C. Hor)
*2 1X 2X
C Horizontal Vertical
.15
.09 0 100
0 138
D Horizontal Vertical Axial
.22
.19
.17
0 0 0
180 180 180
NOTE; *1 – See plots of spectra *2 – “1X” and “2X” refers to “shaft frequency” and “twice shaft frequency”. Test M2 Loosening front left and back right anchor bolts (facing drive end of motor). This produced a 15% decrease in C, Horizontal when back right bolt was loosened.
http://www.BetaMachinery.com

15
“As Found” Vibration Boiler Feed Pump and Motor Figure 2
http://www.BetaMachinery.com

16
Vibration Data on the Motor Uncoupled from the Pump Figure 3
http://www.BetaMachinery.com

17
Boiler Feed Pump Pulsation Measured on the Discharge Figure 4
http://www.BetaMachinery.com

18
Transfer Function Measurements Boiler Feed Pump, Outboard Bearing Figure 5 Direction Test Point
http://www.BetaMachinery.com
20
Transfer Function Measurements Boiler Feed Pump, Outboard Bearing Figure 7
http://www.BetaMachinery.com
21
Transfer Function Measurement on Boiler Feed Pump, Inboard Bearing, Horizontal Figure 8
Transfer Function Measurement on Boiler Feed Pump, Inboard Bearing, Vertical Figure 9
http://www.BetaMachinery.com

22
Outboard Bearing, Horizontal, Transfer Function Measurement. Repeated for Comparison with Modified System Figure 10
http://www.BetaMachinery.com

23
Transfer Function Measured for MOD 1 (Stiffening) Figure 11
Direction Test Point
Transfer Function Measured for MOD 2 (Stiffening) Figure 12 Direction Test Point
Transfer Funtion Measured for MOD 3 (Stiffening) Figure 13
Direction Test Point
http://www.BetaMachinery.com

24
Transfer Function Measured for MOD 4 (Added Mass) Figure 14 Direction Test Point
Transfer Function Measured for MOD 5 (Added Mass) Figure 15 Direction Test Point
http://www.BetaMachinery.com

25
Transfer Function Measured for MOD 5, Vertical (Added Mass) Figure 16
Running Vibrations on Boiler Feed Pump Outboard Bearing with weights clamped to Bearings A and with weights clamped to Bearings A and B Figure 17
Direction Test Point
http://www.BetaMachinery.com

26
Running Vibrations on Boiler Feed Pump Inboard Bearing with weights clamped to Bearing A and with weights clamped to Bearings A and B Figure 18 Direction Test Point
http://www.BetaMachinery.com

27
Running Vibrations on Boiler Feed Pump and Motor with 47.5 lb weights clamped to Pump Bearings Figure 19
http://www.BetaMachinery.com

28
Horizontal Transfer Function and Rundown Response on Motor Figure 20
Axial Transfer Function Measured on Motor Figure 21
http://www.BetaMachinery.com


![Vibration Energy Harvesting: Machinery Vibration, …...Vibration Energy Harvesting: Machinery Vibration, Human Move ment and Flow Induced Vibration 27 r ma P 4]Z 2 (3) where a Y Z2](https://img.dokumen.tips/doc/110x75/5e7c70af07fbe24a6e769fc0/vibration-energy-harvesting-machinery-vibration-vibration-energy-harvesting.jpg)


![20_Sample Machinery Vibration Analysis Report[1]](https://img.dokumen.tips/doc/110x75/577cc9ce1a28aba711a4aa46/20sample-machinery-vibration-analysis-report1.jpg)