Embed Size (px)
Citation preview

Machine learning for water monitoring, hydrology and sustainability
Kevin Swersky
Joint work with Touraj Farahmand, Nando de Freitas, Michael Osborne, Roman Garnett, Ryan Turner and others

Outline
Why is water monitoring important?
How is it done?
How can machine learning help?
What have we done so far?

The water industry
Fresh water is a limited resource Estimates of Canadian economic impact range from $7.3B-$23B Industries directly tied to water include:
Agriculture Mining Forestry Hydro power Waste management
Essential to the health and well-being of both people and the environment

Effects of climate
Changing climates are creating water shortages and changing flood patterns
Extreme weather is becoming the new norm
Urban supplies are under stress
From 1994 to 1999 26% of Canadian municipalities reported water shortages due to increased consumption, drought, or infrastructure problems

Water Monitoring
It is rare to find one level of government with sole jurisdiction over water monitoring. Typically shared by many levels.
Data is needed for: Allocation, engineering design, prediction and forecasting, environmental impact assessments, transportation, fisheries and ecosystems management, resource extraction, industrial use, recreation
Monitoring is needed because water is not distributed evenly in space and time
Understanding its distribution can lead to solutions when water is temporarily unavailable
The linkage between water and the economy is so compelling that decisions
about water are rarely deferred. Decisions that are uninformed almost always have unintended consequences, with impacts on the environment, health, and society.

Water Survey of Canada
2400 stream gage stations
28 regional offices
200+ end users
US Geological Survey
7500 stream gage stations
500+ staff using AQUARIUS Rating Curve (GRSAT)
National Streamgaging Network Locations using AQUARIUS (~11,000)
www.aquaticinformatics.com | 7
Water monitoring in North America

Vancouver based software development company
200+ customers in North America, Australia, Asia and Europe
Federal/State/Municipal Government Agencies
Engineering Consultants / Hydropower
Any organization responsible for managing water
Aquatic Informatics

Aquarius
Aquatic Informatics Provides Customer Support, Customer Service, Training and Product Development
AQUARIUS
Is software for hydrologists and water resource managers Is the de facto standard in North America for hydrometric Time Series data management and Rating Curve development.

Data acquisition and management
Data Logger Comm. Link
Data
Acquisition
and Decoding
Data
Management
System
Sensor
outliersSensor
Drift
Comm.
outliers
Comm.
Gap
Real abnormal
event
Real Parameter from Natural Environment
Sensor Signal before comm.
transmission (Logger signal)
Observed telemetry signal after
comm. reception and decoding
Site visit and logger data filesField measurements
Calibration Errors
Fouling Errors
Logger data file
Telemetry
Data

Data processing pipeline

How can machine learning help?
Machine learning can automate, simplify and improve many aspects of water monitoring including:
1) Improving modeling and analysis
2) Detecting and correcting equipment malfunctions
3) Detecting environmental anomalies
4) Predicting the effects of policy decisions
5) Automating and controlling allocation and distribution

Common water quality indicators
For each signal: 1 point every ~5-15 minutes = 30,000-100,000 points per year per signal

Challenges
Environmental time series in general are complex and hard to model Problems:
Highly non-stationary Highly non-linear Many changes in dynamics Can contain outliers, anomalies, gaps, etc.
Our models need to be:
General Flexible Robust Interpretable Fast and efficient for real-time applications Easy to setup and use

Our first approach is develop good probabilistic models for several basic problems
Gap filling/forecasting
Fault detection
Anomaly/outlier detection
Probabilistic models provide many beneficial properties
that are important in an industrial setting Consistent, unified framework
Provides uncertainty in results
Suggests natural extensions to deal with many kinds of issues

www.aquaticinformatics.com | 16
Univariate models
We use Gaussian processes to model univariate series
Flexible, easy to use, tunable parameters are intuitive (choosing kernels) Sparse Gaussian processes can help with speed (Snelson 2006, Titsias 2009) Issues: heteroscedasticity, nonstationarity, spike noise, changepoints

The power of redundancy
We can exploit correlated signals to build more robust models. Even simple linear methods work well under this regime.
Nonlinearly correlated signals from same sensor
Linearly correlated signals from different sensors

The power of redundancy

The power of redundancy
Handling sensor faults
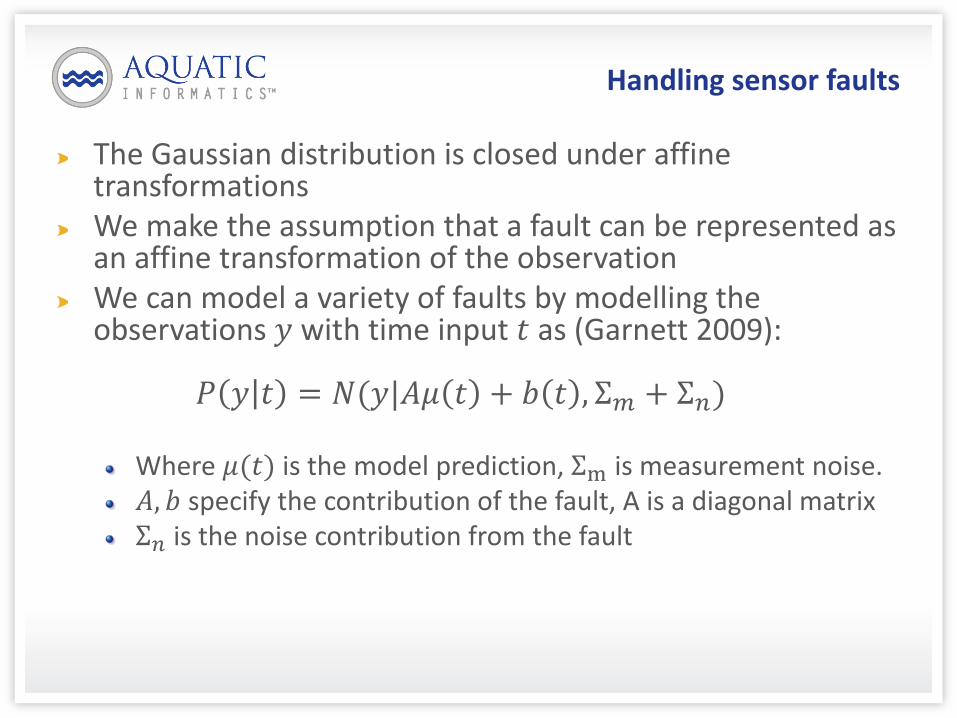
The Gaussian distribution is closed under affine transformations We make the assumption that a fault can be represented as an affine transformation of the observation We can model a variety of faults by modelling the observations 𝑦 with time input 𝑡 as (Garnett 2009):
𝑃 𝑦 𝑡 = 𝑁(𝑦|𝐴𝜇 𝑡 + 𝑏 𝑡 , Σ𝑚 + Σ𝑛) Where 𝜇(𝑡) is the model prediction, Σm is measurement noise. 𝐴, 𝑏 specify the contribution of the fault, A is a diagonal matrix Σ𝑛 is the noise contribution from the fault

Sensor offset
For example, a sensor that undergoes a constant offset 𝑐 in a faulty region 𝐹:
𝐴 𝑖𝑡 , 𝑖𝑡 = 1
𝑏 𝑡 = 𝑐0 if 𝑡 ∈ 𝐹
else
Σn = 0

Stuck sensor
A stuck sensor that outputs some constant reading 𝑐 plus noise:
𝐴 𝑖𝑡 , 𝑖𝑡 = 01 if 𝑡 ∈ 𝐹
else
𝑏 𝑡 = 𝑐0 if 𝑡 ∈ 𝐹
else
Σ𝑛 𝑖𝑡 , 𝑖𝑡 = 𝜎𝑛2

Sensor drift
Dealing with sensor drift is much harder! Drifts are often nonlinear due to sensor design In univariate signals, it is often difficult to even “eyeball” sensor drifts
Sensors are usually recalibrated every few weeks before drift becomes too severe
Either we need to develop really good univariate drift models, or utilize sensor networks

Case study: fishkiller
This is a time-series for a river in British Columbia measuring water level in meters
Water level is determined by a nearby dam upstream When “jitters” occur, salmon get trapped and drown Detecting and preventing these events will save thousands of fish

Dealing with anomalies: the fault bucket (Osborne 2011)
Model faults as being a Gaussian with large variance Each point can be faulty or not faulty 2𝑛 ways of classifying every point
We make several approximations to get the posterior probability of faultiness for a current point
The 2𝑛−1 posterior probability of past faults can be approximated by a single Gaussian The present faultiness is independent of past faultiness

The supervised approach (Turner 2011)
Supervised extension to Bayesian Online Changepoint Detection (Turner 2010) algorithm.
BOCPD trains a predictive distribution using data since the last changepoint which is a latent variable
The supervised extension trains the conditional over run lengths directly

Future Work
Need fast nonlinear regression models for nonstationary data with multiple correlated outputs and side information that don’t require much hand-tuning Consider supervised approaches for modelling sensor failures and anomalies How do we elegantly combine these models into a cohesive system? Long term work: lots of problems in e.g. time-series classification/motif detection, optimal control, multitask learning, etc. Really long term work: models to predict spatiotemporal changes for different decisions, models for automated control systems Will likely need to combine machine learning models with physical models

For more information:
Touraj Farahmand: [email protected]
Kevin Swersky: [email protected]
Nando de Freitas: [email protected]
www.aquaticinformatics.com | 28

Thank you!
www.aquaticinformatics.com | 29


![[hydrology] groundwater hydrology - david k. todd (2005).pdf](https://img.dokumen.tips/doc/110x75/577c77961a28abe0548cb0b1/hydrology-groundwater-hydrology-david-k-todd-2005pdf.jpg)


![[Hydrology] groundwater hydrology david k. todd (2005)](https://img.dokumen.tips/doc/110x75/55a8e6001a28ab6c2f8b4687/hydrology-groundwater-hydrology-david-k-todd-2005-55b0d9a792c06.jpg)

![[Hydrology] Groundwater Hydrology - David K. Todd (2005)](https://img.dokumen.tips/doc/110x75/548ce7beb47959e2288b45f9/hydrology-groundwater-hydrology-david-k-todd-2005.jpg)