Embed Size (px)
Citation preview

Machine Learning and Optimization For Traffic and Emergency Resource Management.
Milos HauskrechtDepartment of Computer Science
University of Pittsburgh
Students: Branislav Kveton, Tomas SingliarUPitt collaborators: Louise Comfort, JS Lin
External: Eli Upfal (Brown), Carlos Guestrin (CMU)

S-CITI related projects
Modeling multivariate distributions of traffic variables
Optimization of (emergency) resources over unreliable transportation network
Traffic monitoring and traffic incident detection Optimization of distributed systems with
discrete and continuous variables: Traffic light control

S-CITI related projects
Modeling multivariate distributions of traffic variables
Optimization of (emergency) resources over unreliable transportation network
Traffic monitoring and traffic incident detection Optimization of control of distributed systems
with discrete and continuous variables: Traffic light control

Traffic network
PITTSBURGH
Traffic network systems are stochastic (things happen at random) distributed (at many places concurrently)
Modeling and computational challenges Very complex structure Involved interactions High dimensionality

Challenges
Modeling the behavior of a large stochastic system Represent relations between traffic variables
Inference (Answer queries about model) Estimate congestion in unobserved area using limited
information Useful for a variety of optimization tasks
Learning (Discovering the model automatically) Interaction patterns not known Expert knowledge difficult to elicit Use Data
Our solutions: probabilistic graphical models, statistical Machine learning methods

Road traffic data We use PennDOT sensor network
155 sensors for volume and speed every 5 minutes
Legend
Sensors
State & Interstate
LocalTownRd
Twonship
2.5 0 2.51.25 Miles
¯

Models of traffic data Local interactions Markov random
field Effects are circular
Solution:Break the cycles

The all-independent assumption
Unrealistic!
Mixture of trees A tree structure
retains many dependencies but still loses some
Have many trees to represent interactions
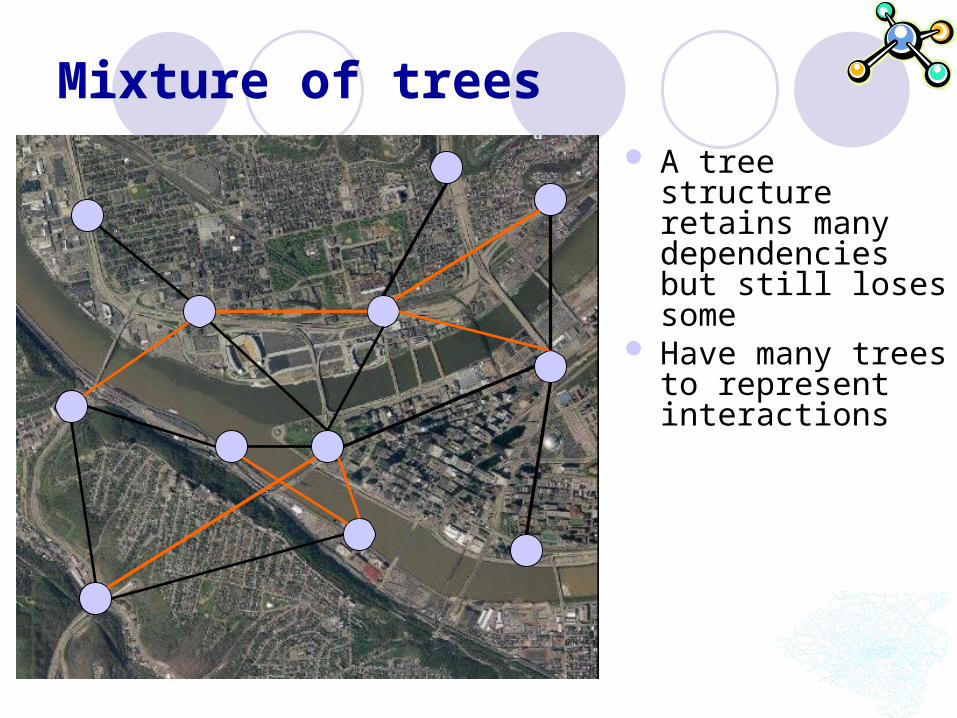
Latent variable model
A combination of latent factors represent interactions
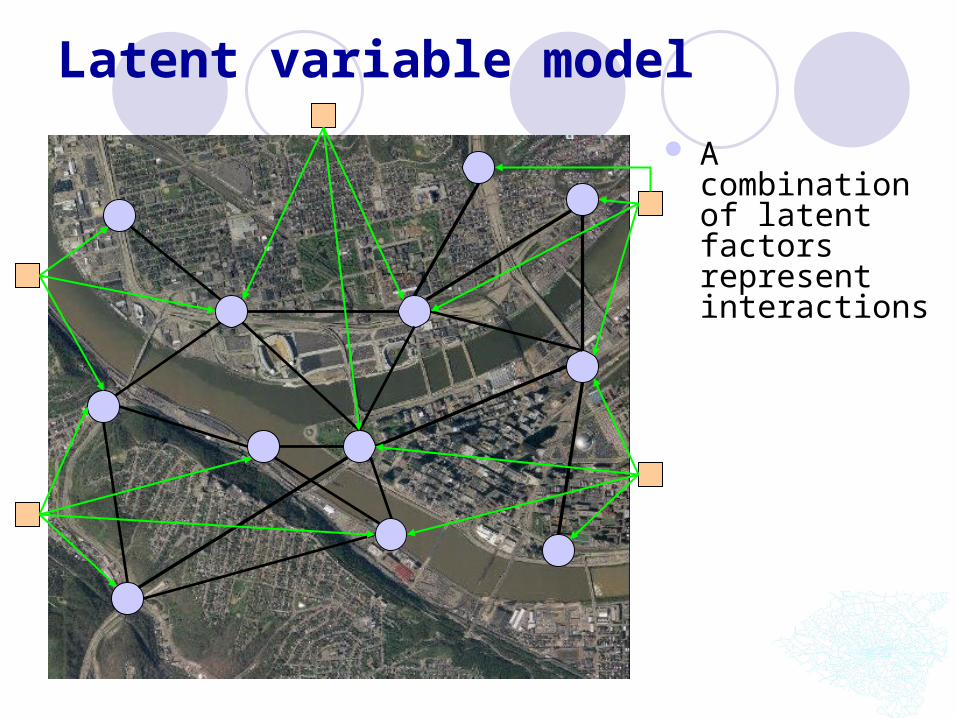
Four projects
Modeling multivariate distributions of traffic variables
Optimization of (emergency) resources over unreliable transportation network
Traffic monitoring and traffic incident detection Optimization of distributed systems with
discrete and continuous variables: Traffic light control

Optimizations in unreliable transportation networks Unreliable network – connections (or nodes) may fail
E.g. traffic congestion, power line failure

Optimizations in unreliable transportation networks Unreliable network – connections (nodes) may fail
more than one connection may go down to

Optimizations in unreliable transportation networks Unreliable network – connections (nodes) may fail
many connections may go down together

Optimizations in unreliable transportation networks Unreliable network – connections (nodes) may fail
parts of the network may become disconnected

Optimizations of resources in unreliable transportation networks
Example: emergency system. Emergency vehicles use the network system to get from one location to the other

Optimizations of resources in unreliable transportation networks
One failure here won’t prevent us from reaching the target, though the path taken can be longer

Optimizations of resources in unreliable transportation networks
Two failures can get the two nodes disconnected

Optimizations of resources in unreliable transportation networks
Emergencies can occur at different locations and they can come with different priorities

Optimizations of resources in unreliable transportation networks
… considering all possible emergencies, it may be better to change the initial location of the vehicle to get a better coverage

Optimizations of resources in unreliable transportation networks … If emergencies are concurrent and/or some
connections are very unreliable it may be better to use two vehicles …

Optimizations of resources in unreliable transportation networks
where to place the vehicles and how many of them to achieve the coverage with the best expected cost-benefit tradeoff
?
?
?
??
?
?
?
?
?
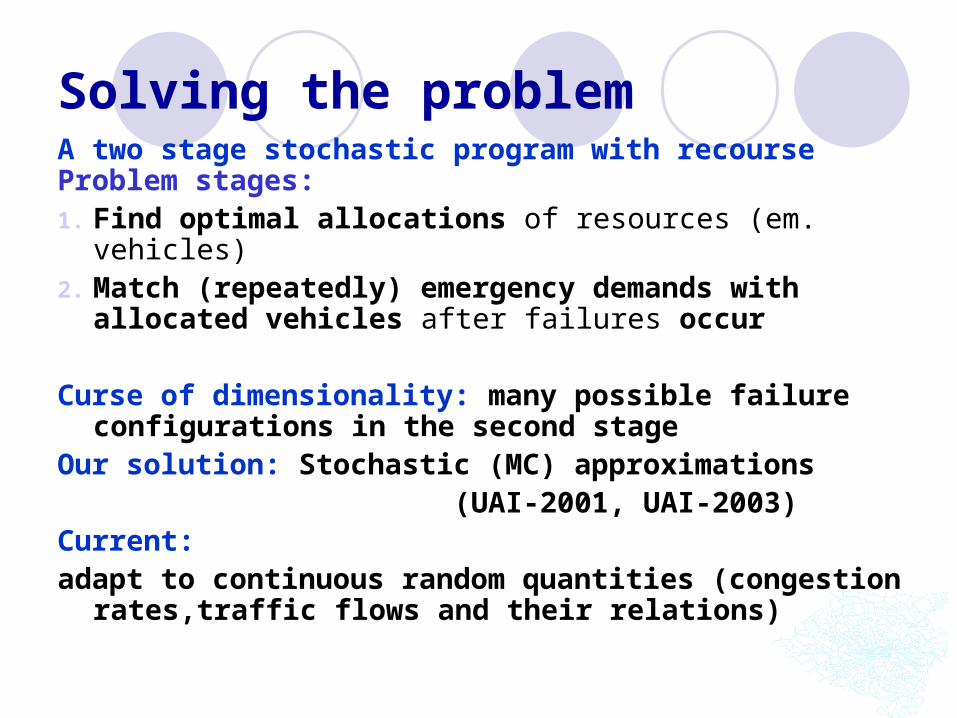
Solving the problemA two stage stochastic program with recourse Problem stages:1. Find optimal allocations of resources (em. vehicles)2. Match (repeatedly) emergency demands with
allocated vehicles after failures occur
Curse of dimensionality: many possible failure configurations in the second stage
Our solution: Stochastic (MC) approximations (UAI-2001, UAI-2003)Current: adapt to continuous random quantities (congestion
rates,traffic flows and their relations)

Four projects
Modeling multivariate distributions of traffic variables
Optimization of (emergency) resources over unreliable transportation network
Traffic monitoring and traffic incident detection
Optimization of distributed systems with discrete and continuous variables: Traffic light control

Incident detection on dynamic data
incident
incident no incident

Incident detection algorithms
Incidents detected indirectly through caused congestion State of the art: California 2 algorithm
If OCC(up) – OCC(down) > T1, next step If [OCC(up) – OCC(down)]/ OCC(up) > T2, next step If [OCC(up) – OCC(down)]/ OCC(down) > T3, possible
accident If previous condition persists for another time step, sound
alarm Hand-calibrated for the specific section of the road
Occupancy spikes Occupancy falls
Incident detection algorithms
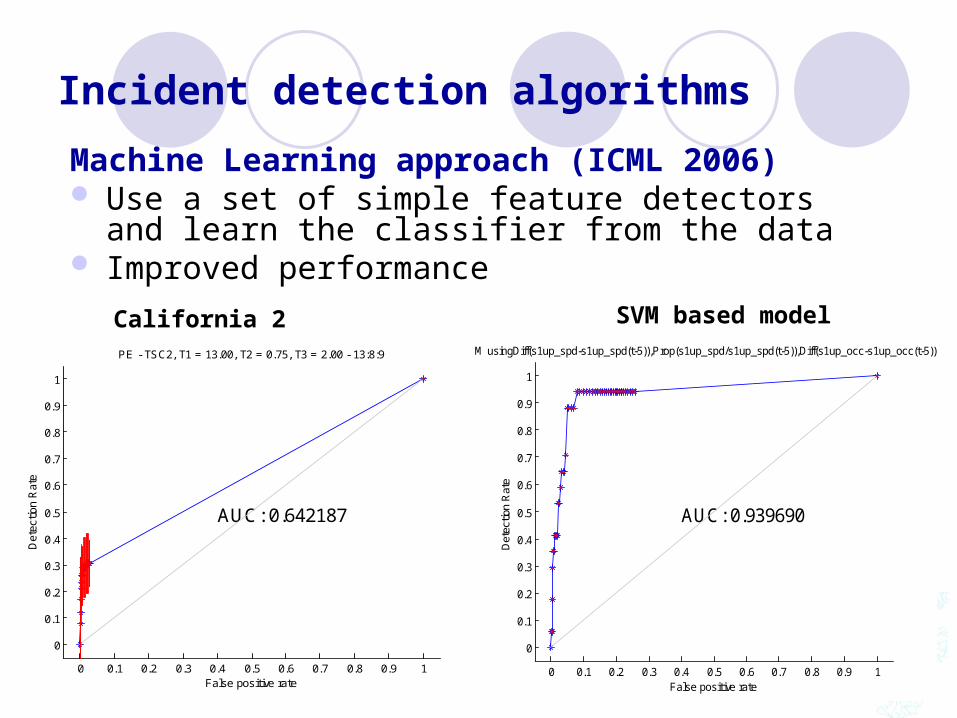
Machine Learning approach (ICML 2006) Use a set of simple feature detectors and learn the
classifier from the data Improved performance
0 0.1 0.2 0.3 0.4 0.5 0.6 0.7 0.8 0.9 1
0
0.1
0.2
0.3
0.4
0.5
0.6
0.7
0.8
0.9
1
AUC: 0.642187
PE - TSC2, T1 = 13.00, T2 = 0.75, T3 = 2.00 - 13:8:9
False positive rate
Det
ectio
n R
ate
0 0.1 0.2 0.3 0.4 0.5 0.6 0.7 0.8 0.9 1
0
0.1
0.2
0.3
0.4
0.5
0.6
0.7
0.8
0.9
1
AUC: 0.939690
PE - SVM usingDiff(s1up_spd-s1up_spd(t-5)),Prop(s1up_spd/s1up_spd(t-5)),Diff(s1up_occ-s1up_occ(t-5))... - 8:52:24
False positive rate
Det
ectio
n R
ate
California 2 SVM based model

Four projects
Modeling multivariate distributions of traffic variables
Optimization of (emergency) resources over unreliable transportation network
Traffic monitoring and traffic incident detection Optimization of control of distributed systems
with discrete and continuous variables: Traffic light control
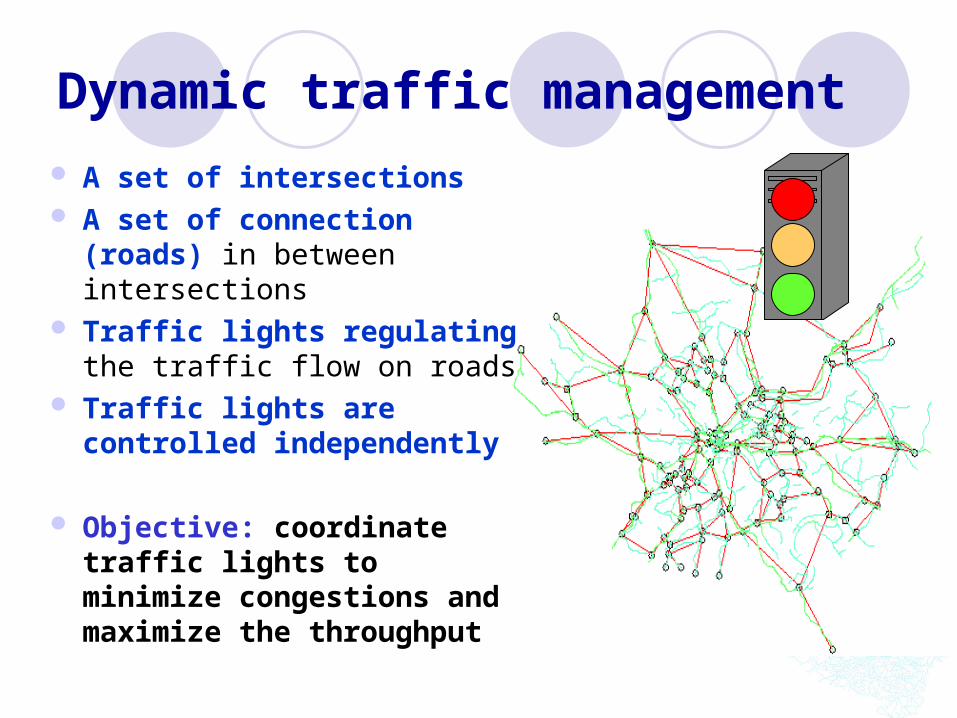
Dynamic traffic management
A set of intersections A set of connection (roads)
in between intersections Traffic lights regulating the
traffic flow on roads Traffic lights are controlled
independently
Objective: coordinate traffic lights to minimize congestions and maximize the throughput
Solutions Problems:
how to model the dynamic behavior of the system how to optimize the plans
Our solutions (NIPS 03,ICAPS 04, UAI 04, IJCAI 05, ICAPS 06, AAAI 06) Model: Factored hybrid Markov decision processes
continuous and discrete variables Optimization:
Hybrid Approximate Linear Programming optimizations over 30 dimensional continuous state
spaces and 25 dimensional action spacesGoals: hundreds of state and action variables

Thank you
Questions