Embed Size (px)
Citation preview

Machine-Condition Monitoring Using Vibration Analysis A Case Study from an Iron-Ore Mine
BO 0178-11

Machine-Condition Monitoring using Vibration Analysis
A Case Study from an Iron-Ore Mine
by D.N.Brown & J.C.Jorgensen Briiel & Kjeer
Introduction Within the mining industry an in- in a number of the vital phases of the fully used to detect and diagnose
creasing trend in equipment design to- mining operation, with some impres- faults. wards larger, more complex and more sive results. productive units is being experienced. Vibration monitoring at the mine As equipment grows in both size and On the shove l s used for ore exca- has resulted in considerable savings in capital cost, so downtime reflects not vation, the condition of the motor- plant maintenance costs. Several only in increasing maintenance costs, generator set, the hoist and swing faults detected by the system, in par-but also in greater loss of production transmission, and the hoist's Magne- ticular those on the trucks, would have by an idle unit. This has resulted, torque® drive are monitored. On the caused considerable damage had they therefore, in an increasing interest in hau lage trucks used for transport- not been discovered. After these en-maintenance schemes that allow maxi- ing the ore to the primary crushing couraging results, a decision has been mum operating life. The one viable plant, the monitoring programme cov~ made by the maintenance section to solution to this is predictive mainte- ers the diesel engine and generator. In intensify the monitoring programme nance - measuring machine condition the mine's concentrator, the auto- to cover other critical plant-machin-and repairing when and only when geneous mills, pumps and conveyors ery. This programme will include, measurements indicate it necessary. are covered. amongst others, monitoring of the
blasthole rotary-drilling units, and in-This Application Note details one A detailed description of the moni- creasing activity in monitoring of the
such predictive maintenance scheme, toring programme at the Mount ancillary equipment in the concentra-at the Quebec Cartier Mine at Mount Wright mine is given here, together tor plant. Wright, Canada. Here, vibration mon- with a number of examples where vi-itoring is being successfully employed bration monitoring has been success-
The Mine The Quebec Cartier Mine at Mount The Mining P r o c e s s that feed the concentrator. The con-
Wright lies on the Quebec-Labrador After blasting, electric shovels load centrator consists of six cascade-type Trough in Northern Canada and pro- the broken rock onto diesel-electric autogeneous grinding mills, spirals to duces some 16 million tons of iron ore trucks, which carry the ore to the separate the ground ore into concen-per year. The Mount Wright mine is mine's processing plant. The crude ore trate and tailings, screens, and a large an open-pit development 6400 m long from the mine is primarily low-grade, number of pumps and conveyors that by 1220 m wide and will ultimately requiring crushing and concentrating move the ore through the various pro-sink 300 m below ground level. There to remove waste. Two gyratory crush- cessing stages. The end product from are 1000 employed at the mine which ers reduce the ore to approximately the concentrator is a concentrate con-has been in operation since 1976. 20 cm, which is then conveyed to silos taining approximately 66,5% iron.
2
The Vibration Monitoring Programme The vibration monitoring pro- In particular, the 3517 was used on chines was increased, and more and
gramme began in 1980 with the pur- truck engines to look for engine/gener- more reliance was placed on the vibra-chase of a Briiel&Kjeer Type 3517 ator misalignment and bad mounting tion monitoring programme. This cul-Portable Balancing and Analyzing Set. of the engine sub-frame. In one specif- minated in the programme being up-This set was successfully used to mon- ic application, the 3517 was also used graded in 1985 to a desk-top computer itor the condition of a number of ma- for evaluating the suspension of the based system, capable of automatical-chines. It allowed the maintenance en- trucks. On the shovels, the 3517 was ly detecting faults from vibration data gineers to become familiar with vibra- used for checking misalignment and recorded on tape. The system has tion monitoring, and to obtain unbalance of the electric motors. powerful fault-diagnostic facilities and experience with the vibration signa- is capable of handling and storing tures and their relevance for each type As experience with the system was large amounts of data. of monitored machine. gained, the number of monitored ma-
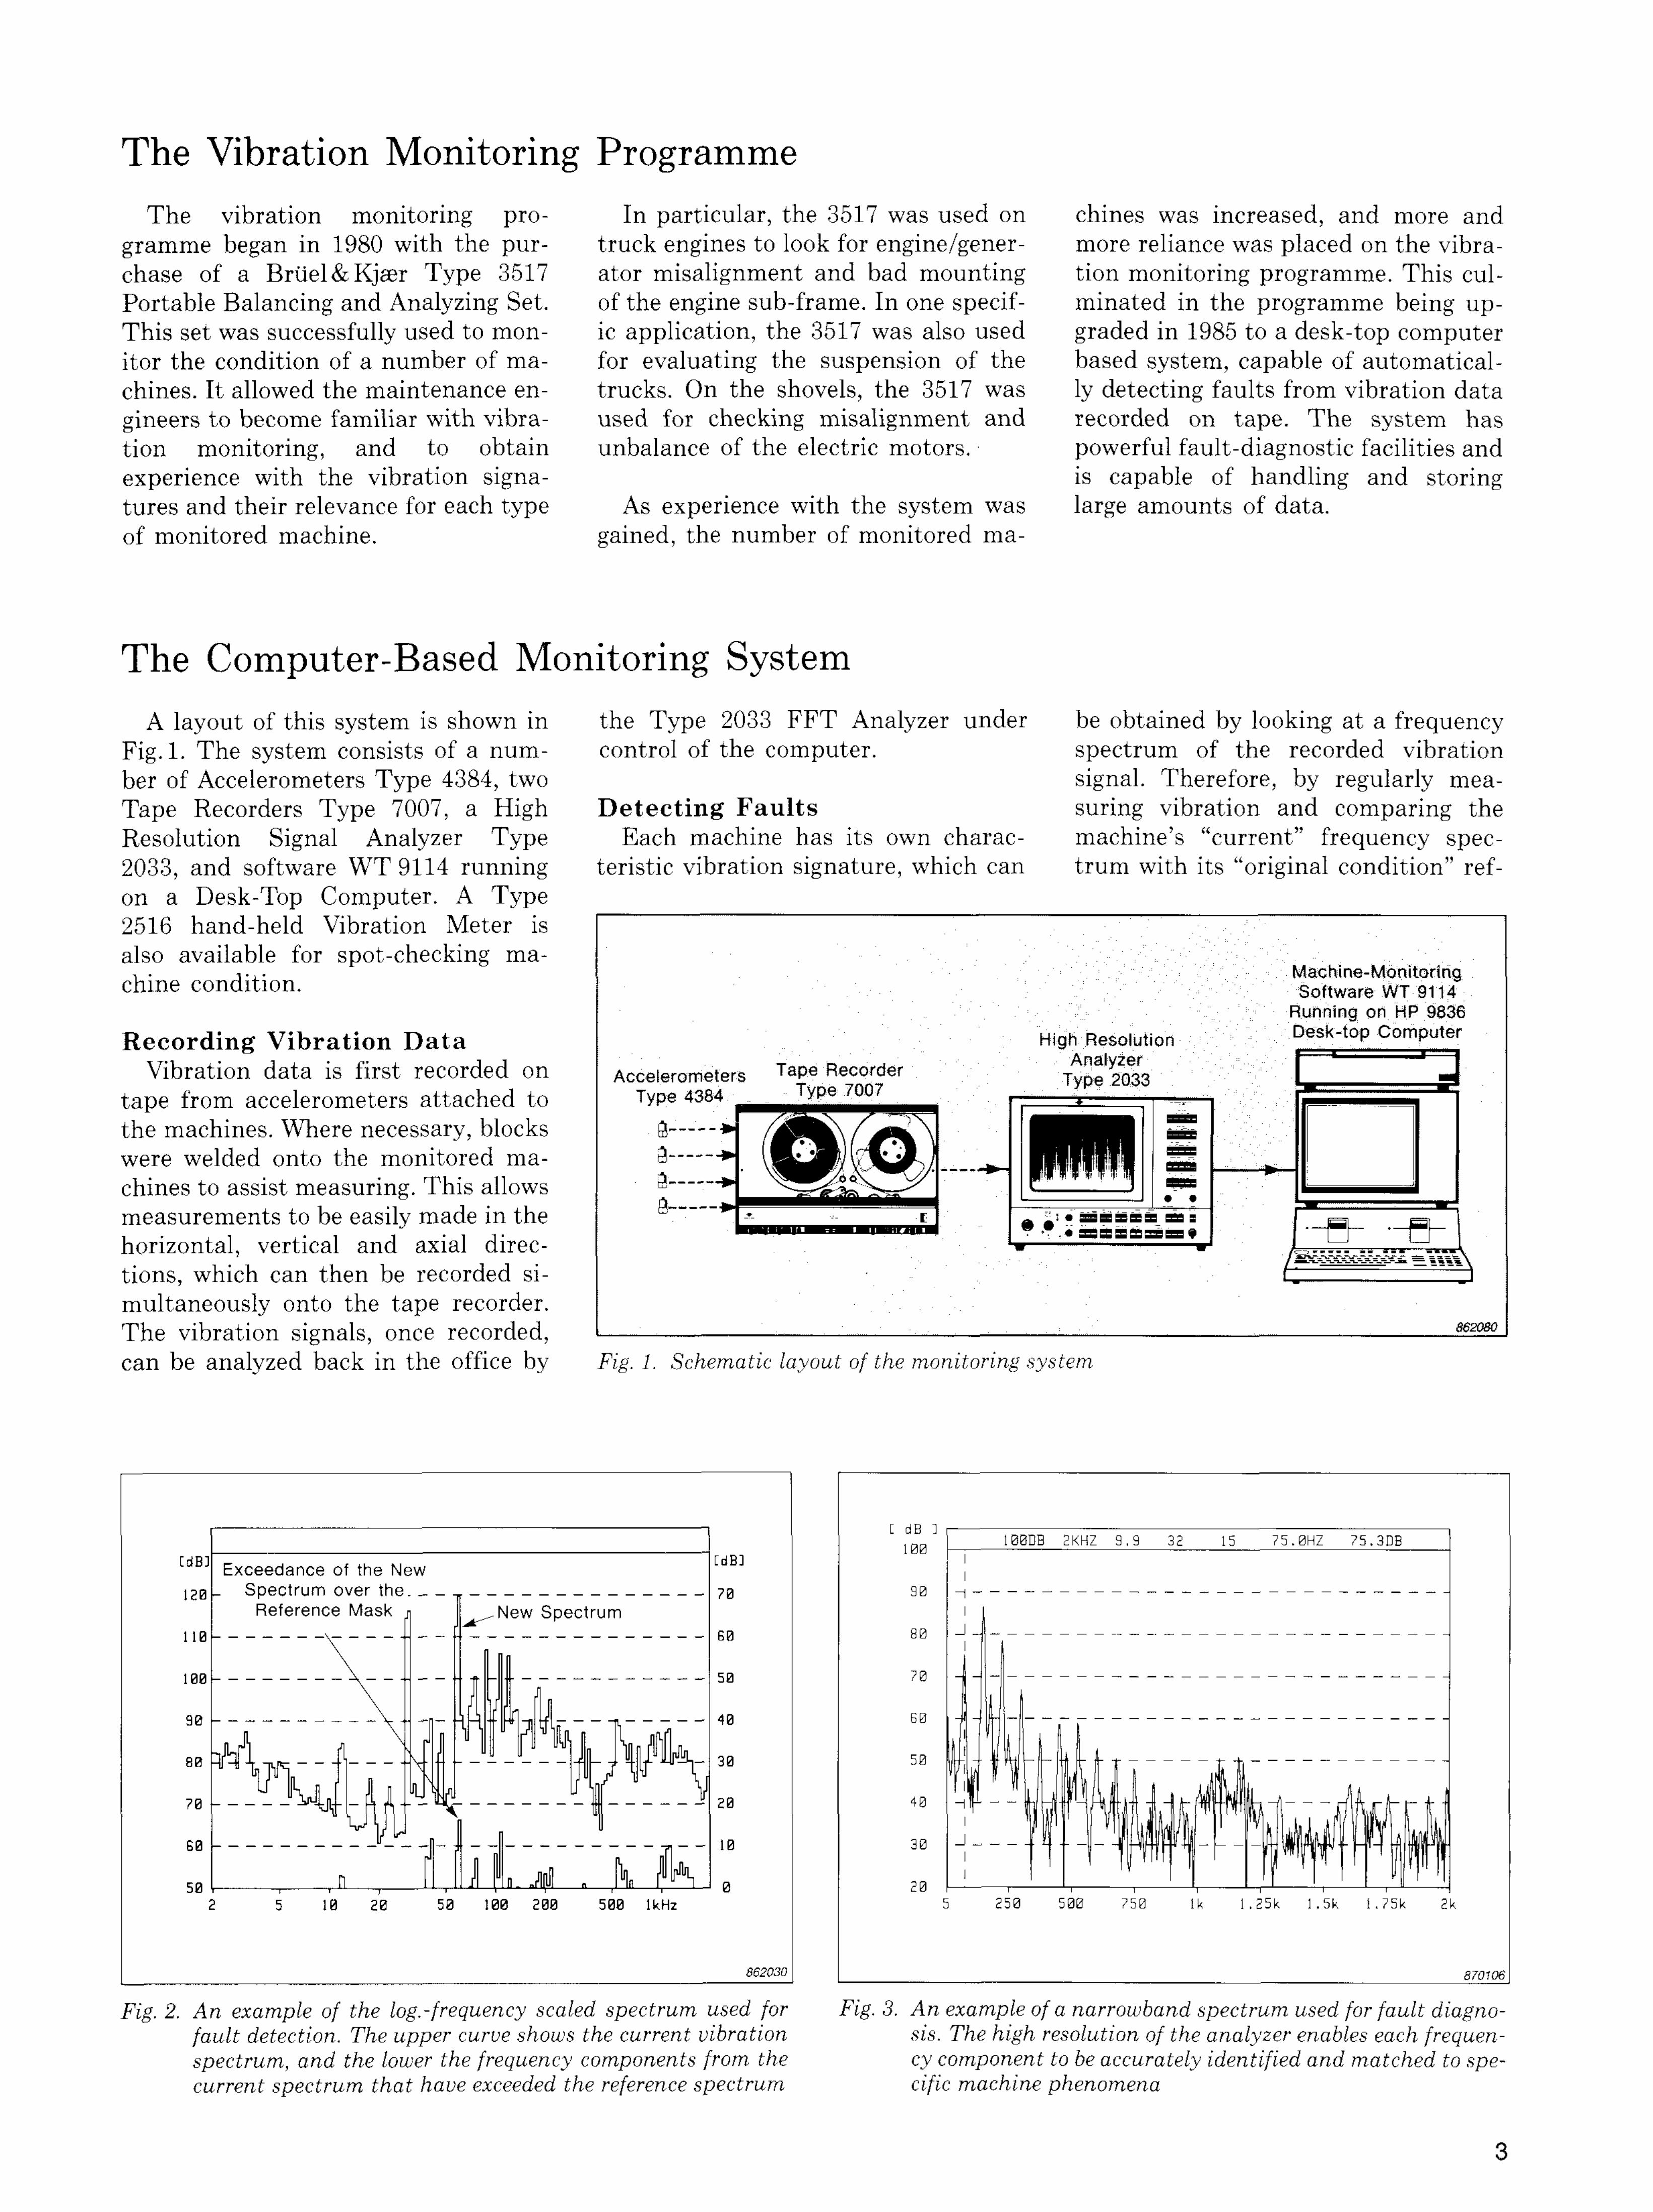
The Computer-Based Monitoring System A layout of this system is shown in the Type 2033 FFT Analyzer under be obtained by looking at a frequency
Fig. 1. The system consists of a num- control of the computer. spectrum of the recorded vibration ber of Accelerometers Type 4384, two signal. Therefore, by regularly mea-Tape Recorders Type 7007, a High D e t e c t i n g Faul t s suring vibration and comparing the Resolution Signal Analyzer Type Each machine has its own charac- machine's "current" frequency spec-2033, and software WT 9114 running teristic vibration signature, which can trum with its "original condition" ref-on a Desk-Top Computer. A Type 2516 hand-held Vibration Meter is also available for spot-checking machine condition.
Record ing Vibrat ion D a t a Vibration data is first recorded on
tape from accelerometers attached to the machines. Where necessary, blocks were welded onto the monitored machines to assist measuring. This allows measurements to be easily made in the horizontal, vertical and axial directions, which can then be recorded simultaneously onto the tape recorder. The vibration signals, once recorded, can be analyzed back in the office by Fig. 1. Schematic layout of the monitoring system
Fig. 2. An example of the log.-frequency scaled spectrum used for Fig. 3. An example of a narrowband spectrum used for fault diagno-fault detection. The upper curve shows the current vibration sis. The high resolution of the analyzer enables each frequen-spectrum, and the lower the frequency components from the cy component to be accurately identified and matched to spe-current spectrum that have exceeded the reference spectrum cific machine phenomena
3

erence spectrum, changes in the con- rience with both use of the system and range) over time can be seen using a dition of the machine will be revealed. of the vibration-characteristics of each trend analysis plot. A prediction is Fig. 2 shows an example of this fault monitored machine. This enables given of the time remaining before a detection procedure. The upper curve them to judge machine condition from pre-defined "danger" level is reached. is the current spectrum, and the lower a quick glance at the spectrum, and to Suspect points on the graph can be is the amount by how much the cur- place absolute vibration limits on par- excluded from the prediction to gain a rent spectrum has exceeded the refer- ticular machine parts. more accurate trend curve. ence spectrum.
High F a u l t - D e t e c t i o n Reso lu t ion To obtain the best frequency range The system further takes care of To enable the full range of faults to to trend on, the use of the 3—Dimen-
any speed changes that may occur be- be detected, both high- and low-fre- s ional Plot facility can be employed. tween measurements, which could quency components have to be dis- This feature shows how the pattern of otherwise invalidate the spectrum played in a single spectrum with the frequency increases has been changing comparison. same frequency-resolution. To enable over time.
this, the frequency spectrum used for The technician who makes the tape the spectrum comparison is logarith- Fault D i a g n o s i s
recordings also makes the spectrum mically scaled. In this type of format, The high-powered fault diagnostic comparison. To carry out this spec- the frequency resolution at a particu- facilities of the system enable suspect trum comparison, all he has to do is lar frequency is a percentage of the faults to be pin-pointed to a specific replay the vibration data into the ana- frequency concerned, allowing faults machine component. These diagnostic lyzer, call up the appropriate refer- to be detected over a three decade fre- facilities include narrowband zoom-ence spectrum and execute the com- quency range. analysis, cepstrum analysis, and side-parison program. Any increases will be band and harmonic cursors. An exam-automatically reported. Trend A n a l y s i s pie of a narrowband spectrum is
As machine condition worsens, so shown in Fig. 3. The maintenance engineers at the the development of an increasing fre-
mine have built up considerable expe- quency component (or frequency
Shovel Vibration Monitoring There are a total of 13 electrically-
powered shovels in operation at the mine, each with a 15 m3 bucket capacity. These comprise; Bucyrus - Erie 295 B and 195 B l , P&H 2100 BL and Marion 201 M.
At present the shovel availability is approximately 65%. Vibration monitoring has played a major part in maintaining this high level, as just one year ago the availability was 45%. The main problems encountered are with the motor-generator (MG) Set which, at costs in the region of $250000 for replacement and $100000 for repair, represents a potentially considerable maintenance cost.
The monitoring programme for the shovels covers the following items:
Motor -Genera tor (MG) Se t - unbalance and misalignment problems; Hoist and S w i n g T r a n s m i s s i o n -gear and bearing problems; Hoist Magnetorque® D r i v e - unbalance, bearing and operation problems.
Motor -Genera tor Se t M e a s u r e ment P r o g r a m m e
The MG-Set contains the main AC motor and the DC generators for the swing, hoist, crowd and propel motion. Problems due to unbalance and instal- Fig. 4, Top view of the P&H shovels showing the measurement points used
4

lation- and progressive-misalignment are quite common, resulting in excessive wear and leading to a reduced operating life.
Figs. 4 and 5 show the measurement points on the two types of MG-Sets found in the shovels. Vibration measurements are first made on a new or reconditioned MG-set when it is in the maintenance shop, prior to fitting in the shovel. A reference spectrum for comparison is then recorded. Immediately after installation in the shovel another reference spectrum is recorded (this is to check for installation problems, usually misalignment, and sometimes transportation problems). Measurements are then made on the MG-Set every 1000 to 1200 hours, and spectrum comparisons made with both the reference spectra (although the measurement interval is now being decreased to every 600 hours to obtain more results for better trend analysis).
After spectrum comparison, the vibration levels of any increasing fre-
+. u „i A Fig, 5. Schematic (top) view of the Bucyrus-Ene and Marion shovels showing the measure-quency components are checked h ± . H/ , ' J b
. , . , , , ment points used against those in a standard and repairs are carried out if necessary. This standard has been drawn up from ex- of an MG-Set could be identified by ed directly on the MG-Set base, but perience with the shovels and usually increasing vibration at twice the shaft attached separately on a cantilever ar-an increase of 20 dB is taken to indi- rotational frequency (the 2nd harmon- rangement. Due to difficulties in in-cate that immediate action is needed. ic). stallation, the motor is prone to mis-If a problem is found and the levels alignment problems. are high, then the fault is immediately Fig. 6 shows some examples indicat-corrected. However, if the fault is only ing misalignment. The spectrum to An unbalance in any of the com-just beginning to develop, then this is the left shows a spectrum comparison ponents of the MG-Set could be iden-recorded and a close watch kept on on a Swing Generator, indicating a tified by increasing vibration at the the component in future. very high (>30dB) increase at the sec- shaft rotational frequency. An exam-
ond harmonic, 60 Hz. The spectrum to pie of this is shown in Fig. 7, which Fault Detect ion Examples from the right shows an approximate 16 dB shows a spectrum comparison from a the MG—Set increase at the second harmonic on Hoist Generator. This shows an in-
Experience has shown that mis- the Poney Motor, used to soft start crease of approximately 16 dB at al ignment of any of the components the MG-Set. The motor is not mount- 30 Hz, the Generator rotor frequency.
Fig. 6. Two examples of misalignment, indicated by high increases in the 2 x rotation frequency component
5
I . . . ™ ^ — " ■ ■ — ^
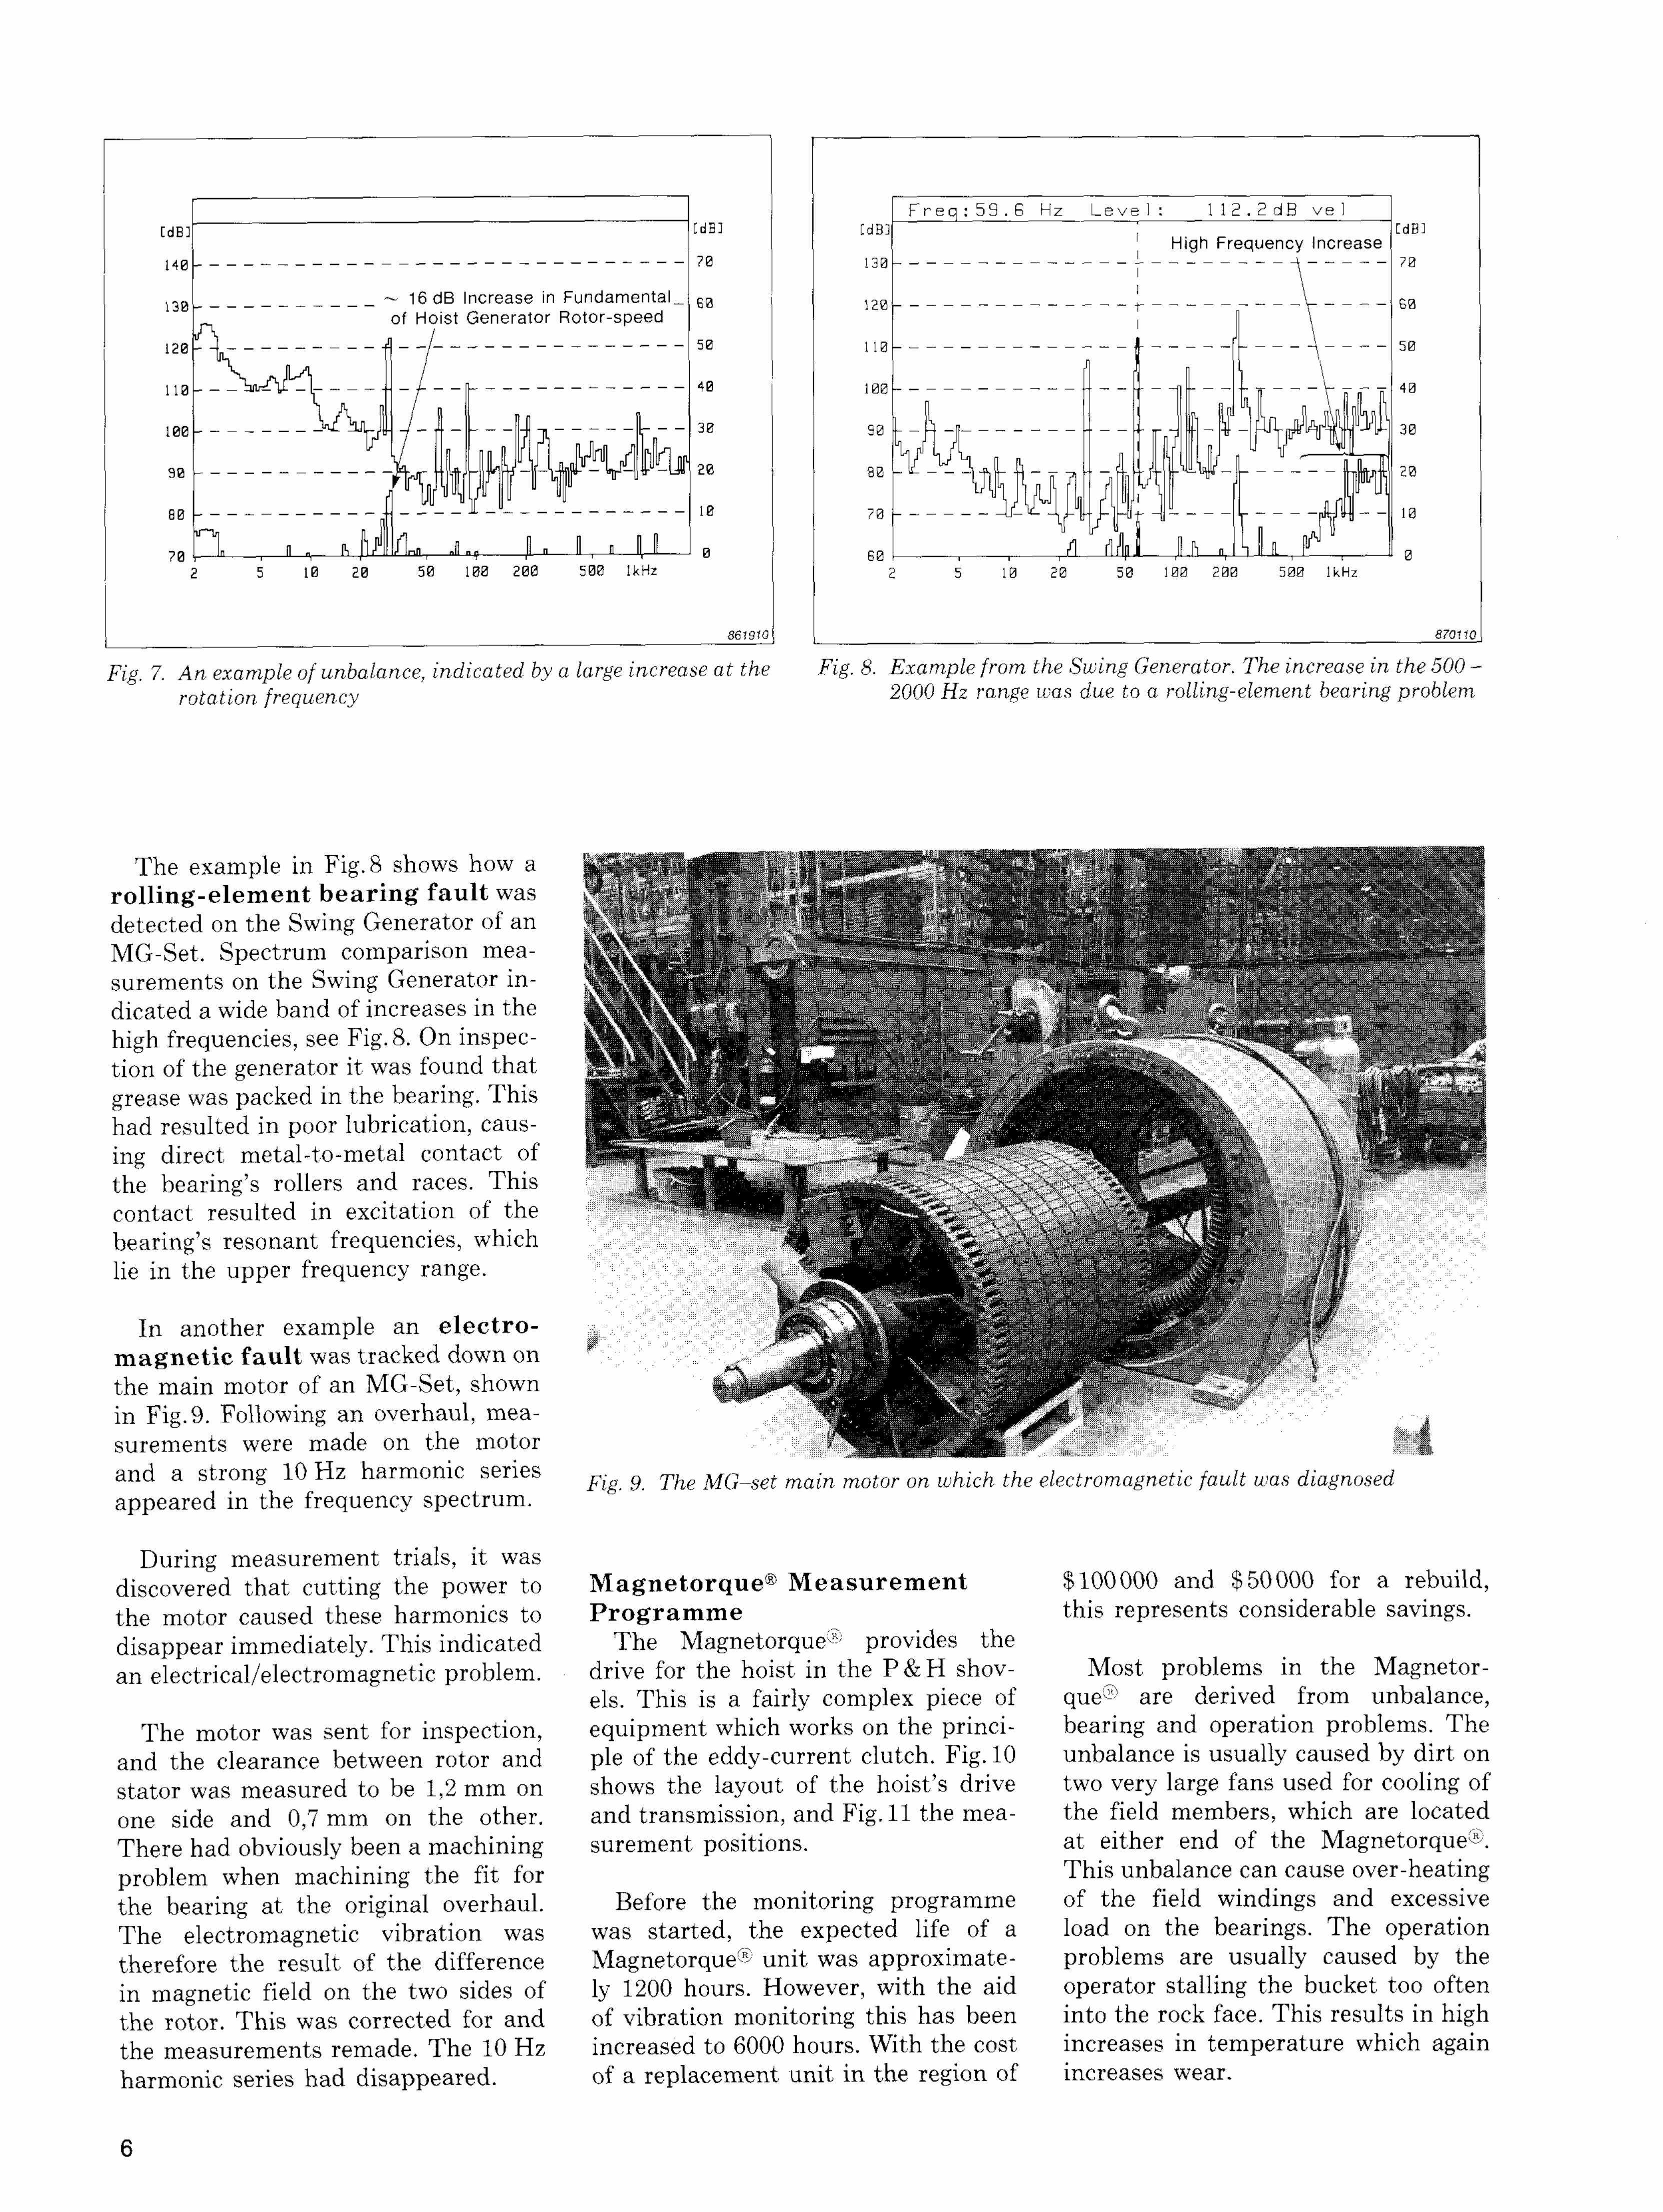
Fig. 7. An example of unbalance, indicated by a large increase at the Fig. 8. Example from the Swing Generator. The increase in the 500 -rotation frequency 2000 Hz range was due to a rolling-element bearing problem
The example in Fig. 8 shows how a rol l ing-e lement bearing fault was detected on the Swing Generator of an MG-Set. Spectrum comparison measurements on the Swing Generator indicated a wide band of increases in the high frequencies, see Fig. 8. On inspection of the generator it was found that grease was packed in the bearing. This had resulted in poor lubrication, causing direct metal-to-metal contact of the bearing's rollers and races. This contact resulted in excitation of the bearing's resonant frequencies, which lie in the upper frequency range.
In another example an e lectromagnet ic fault was tracked down on the main motor of an MG-Set, shown in Fig. 9. Following an overhaul, measurements were made on the motor and a strong 10 Hz harmonic series f.^ g The MG_set main motor on which ^ e electromagnetic fault was diagnosed appeared in the frequency spectrum.
During measurement trials, it was discovered that cutting the power to Magnetorque® M e a s u r e m e n t $100000 and $50000 for a rebuild, the motor caused these harmonics to Programme this represents considerable savings. disappear immediately. This indicated The Magnetorque® provides the an electrical/electromagnetic problem. drive for the hoist in the P & H shov- Most problems in the Magnetor-
els. This is a fairly complex piece of que® are derived from unbalance, The motor was sent for inspection, equipment which works on the princi- bearing and operation problems. The
and the clearance between rotor and pie of the eddy-current clutch. Fig. 10 unbalance is usually caused by dirt on stator was measured to be 1,2 mm on shows the layout of the hoist's drive two very large fans used for cooling of one side and 0,7 mm on the other. and transmission, and Fig. 11 the mea- the field members, which are located There had obviously been a machining surement positions. at either end of the Magnetorque®. problem when machining the fit for This unbalance can cause over-heating the bearing at the original overhaul. Before the monitoring programme of the field windings and excessive The electromagnetic vibration was was started, the expected life of a load on the bearings. The operation therefore the result of the difference Magnetorque® unit was approximate- problems are usually caused by the in magnetic field on the two sides of ly 1200 hours. However, with the aid operator stalling the bucket too often the rotor. This was corrected for and of vibration monitoring this has been into the rock face. This results in high the measurements remade. The 10 Hz increased to 6000 hours. With the cost increases in temperature which again harmonic series had disappeared. of a replacement unit in the region of increases wear.
6
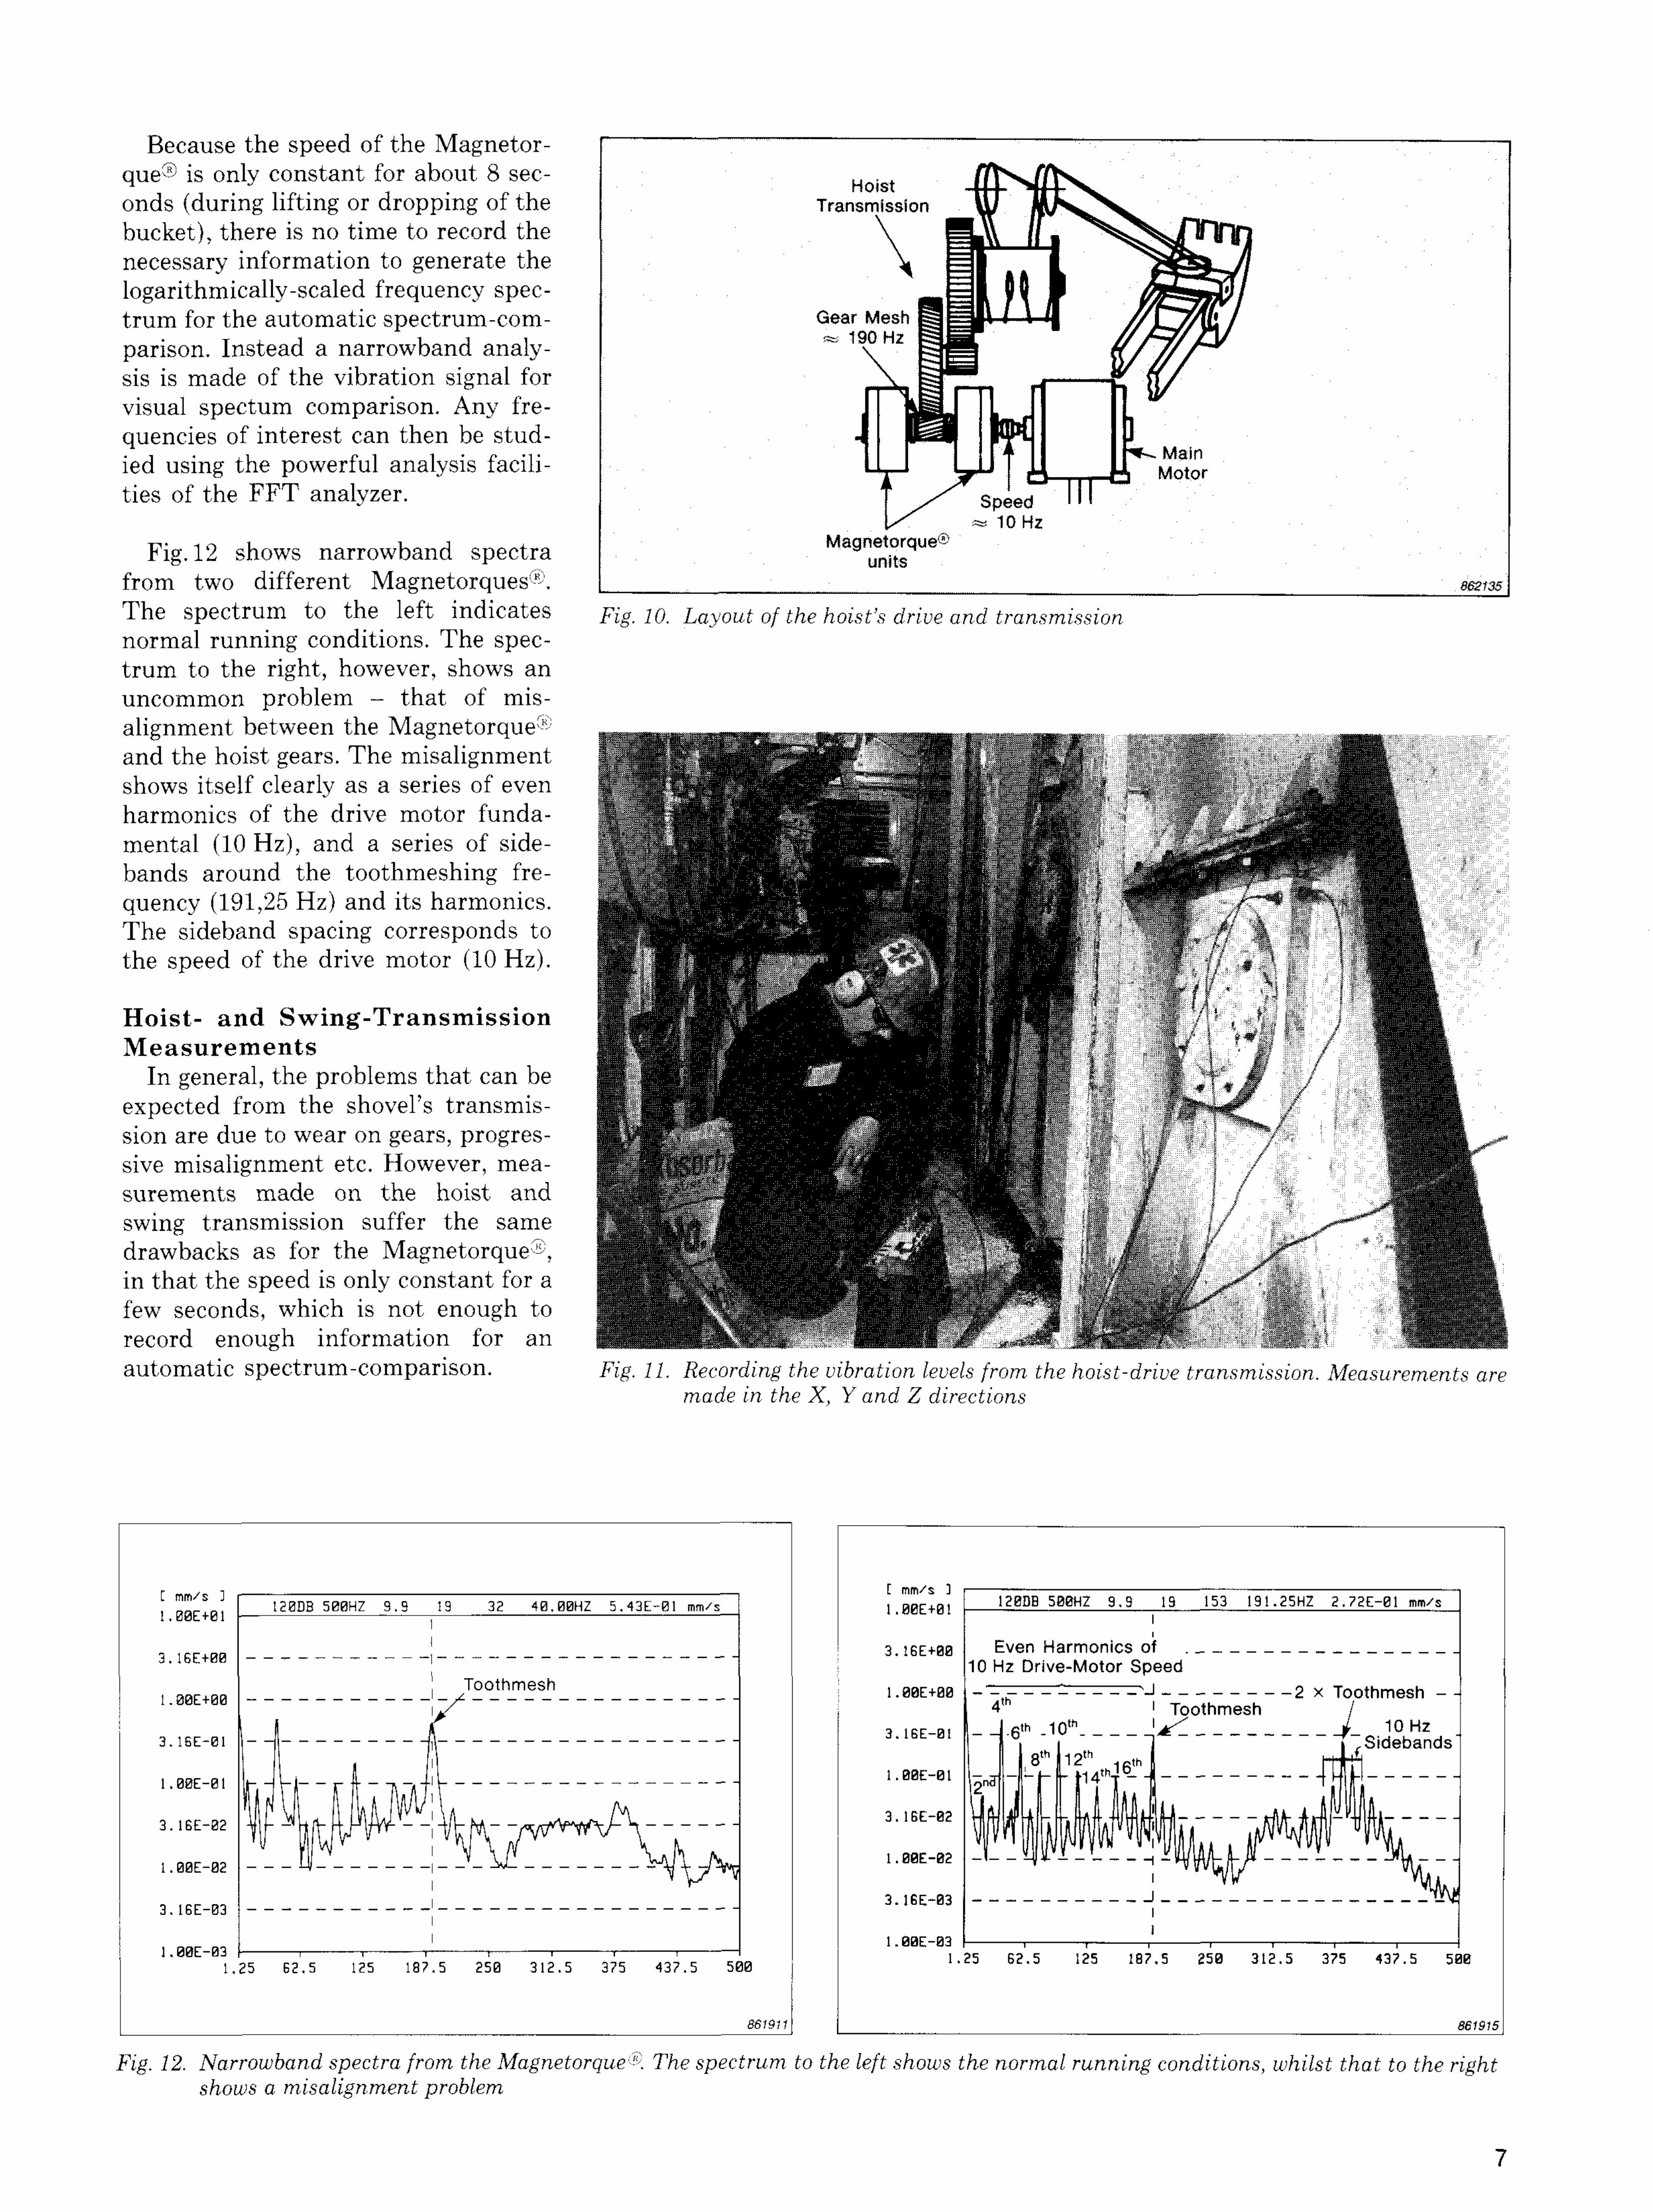
Because the speed of the Magnetor-que® is only constant for about 8 seconds (during lifting or dropping of the bucket), there is no time to record the necessary information to generate the logarithmically-scaled frequency spectrum for the automatic spectrum-comparison. Instead a narrowband analysis is made of the vibration signal for visual spectum comparison. Any frequencies of interest can then be studied using the powerful analysis facilities of the FFT analyzer.
Fig. 12 shows narrowband spectra from two different Magnetorques®. The spectrum to the left indicates Fig. 10. Layout of the hoist's drive and transmission normal running conditions. The spectrum to the right, however, shows an uncommon problem - that of misalignment between the Magnetorque® and the hoist gears. The misalignment shows itself clearly as a series of even harmonics of the drive motor fundamental (10 Hz), and a series of sidebands around the toothmeshing frequency (191,25 Hz) and its harmonics. The sideband spacing corresponds to the speed of the drive motor (10 Hz).
Hoist - and S w i n g - T r a n s m i s s i o n M e a s u r e m e n t s
In general, the problems that can be expected from the shovel's transmission are due to wear on gears, progressive misalignment etc. However, measurements made on the hoist and swing transmission suffer the same drawbacks as for the Magnetorque®, in that the speed is only constant for a few seconds, which is not enough to record enough information for an automatic spectrum-comparison. Fig. 11. Recording the vibration levels from the hoist-drive transmission. Measurements are
made in the X, Y and Z directions
Fig. 12. Narrowband spectra from the Magnetorque■'$ The spectrum to the left shows the normal running conditions, whilst that to the right shows a misalignment problem
7
The measurements are made on the One of the side-effects of worn checks are made under the operator's casing of the hoist-machinery gearbox. transmission is that excessive vibra- seat. Measurements are made every They are then presented in the form tions are transmitted over the whole 200 hours of shovel operation. of histograms showing vibration level of the shovel structure. This causes at the gear mesh of first intermediary excessive discomfort for the operator, (380 Hz) and of the bull gear (34 Hz). and consequently regular vibration
Truck Vibration Monitoring The truck fleet at the mine consists
of a total of 41 Wabco, Terex and Unit Rig diesel-electric trucks, each with a capacity of 170 tons. The trucks are powered by a 1600 BHP diesel engine driving a DC generator, which in turn drives an electric motor mounted on each of the rear wheel-sets. At a cost of approximately 1 million-$ each, these trucks represent a considerable investment.
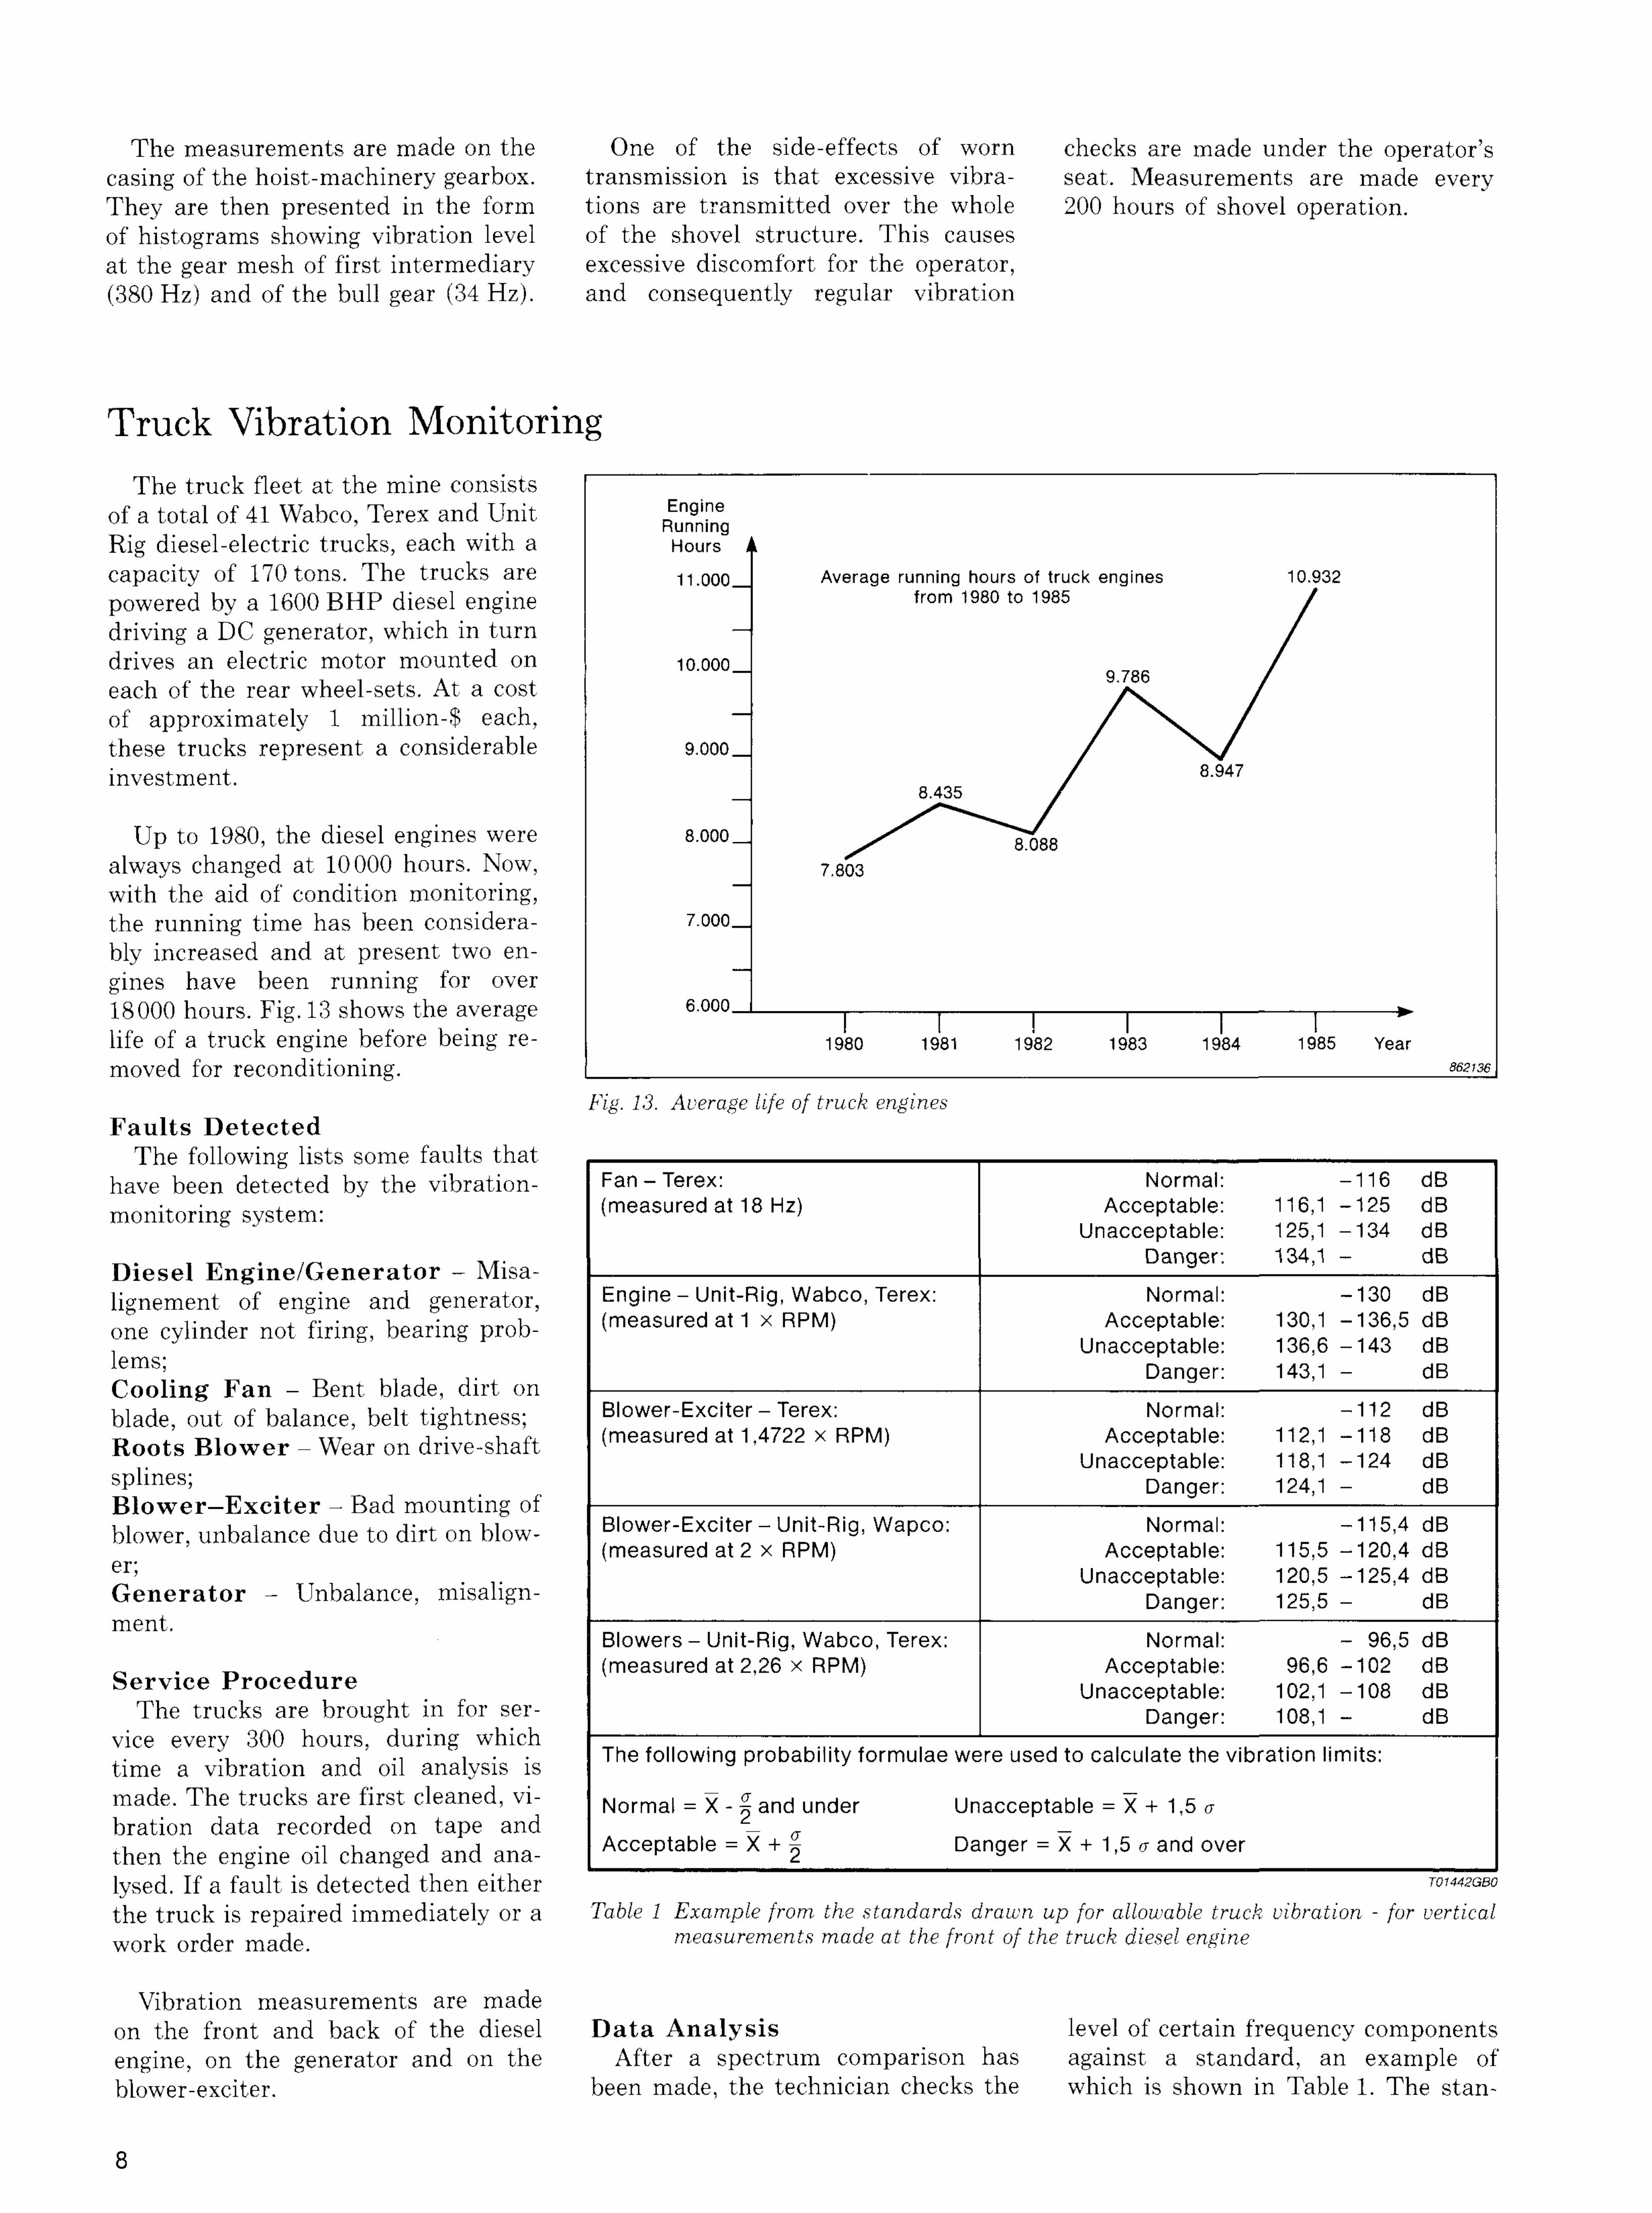
Up to 1980, the diesel engines were always changed at 10000 hours. Now, with the aid of condition monitoring, the running time has been considerably increased and at present two engines have been running for over 18000 hours. Fig. 13 shows the average life of a truck engine before being removed for reconditioning.
Fig. 13. Average life of truck engines Faults Detected
The following lists some faults that . . . have been detected by the vibration- Fan - Terex: Normal: -116 dB monitoring system: (measured at 18 Hz) Acceptable: 116,1 -125 dB
8 J Unacceptable: 125,1 -134 dB T^- i T^ • ir* ± A/r Danger: 134,1 - dB D i e s e l Eng ine /Genera tor - Misa- — lignement of engine and generator, Engine - Unit-Rig, Wabco, Terex: Normal: -130 dB one cylinder not firing, bearing prob- (measured at 1 x RPM) Acceptable: 130,1 -136,5 dB , Unacceptable: 136,6 -143 dB i e m s ;
1 1 . .. Danger: 143,1 - dB Cooling Fan - Bent blade, dirt on blade, out of balance, belt tightness; Blower-Exciter-Terex: Normal: -112 dB Roots B l o w e r - Wear on drive-shaft (measured at 1,4722 x RPM) Acceptable: 112,1 -118 dB
Unacceptable: 118,1 -124 dB splines; Danger: 124,1 - dB Blower—Exciter - Bad mounting of blower, unbalance due to dirt on blow- Blower-Exciter-Unit-Rig, Wapco: Normal: -115,4 dB
(measured at 2 x RPM) Acceptable: 115,5 -120,4 dB e r ; TT i , • i- Unacceptable: 120,5 -125,4 dB Generator - Unbalance, misalign- Danger- 125 5 - dB m e n t .
Blowers-Unit-Rig, Wabco, Terex: Normal: - 96,5 dB _ , (measured at 2,26 x RPM) Acceptable: 96 ,6 -102 dB
Service Procedure Unacceptable: 102,1 -108 dB The trucks are brought in for ser- Danger: 108,1 - dB
vice every 300 hours, during which —; — ■————————— ., j -i l • The following probability formulae were used to calculate the vibration limits: time a vibration and oil analysis is made. The trucks are first cleaned, vi- N o r m a , = x - f and under Unacceptable = X + 1,5 a bration data recorded on tape and _ _ . ,, • -i i j „ i „„rt Acceptable = X + « Danger = X + 1,5 a and over then the engine oil changed and ana- [ ^ 2 ^
lysed. If a fault is detected then either WUKGBO the truck is repaired immediately or a Table 1 Example from the standards drawn up for allowable truck vibration - for vertical work order made measurements made at the front of the truck diesel engine
Vibration measurements are made on the front and back of the diesel Data Analysis level of certain frequency components engine, on the generator and on the After a spectrum comparison has against a standard, an example of blower-exciter. been made, the technician checks the which is shown in Table 1. The stan-
8
Fan - Terex: Normal: -116 dB (measured at 18 Hz) Acceptable: 116,1 -125 dB
Unacceptable: 125,1 -134 dB Danger: 134,1 — dB
Engine - Unit-Rig, Wabco, Terex: Normal: -130 dB (measured at 1 x RPM) Acceptable: 130,1 -136,5 dB
Unacceptable: 136,6 -143 dB Danger: 143,1 dB
Blower-Exciter - Terex: Normal: -112 dB (measured at 1,4722 x RPM) Acceptable: 112,1 -118 dB
Unacceptable: 118,1 -124 dB Danger: 124,1 dB
Blower-Exciter-Unit-Rig, Wapco: Normal: -115,4 dB (measured at 2 x RPM) Acceptable: 115,5 -120,4 dB
Unacceptable: 120,5 -125,4 dB Danger: 125,5 dB
Blowers - Unit-Rig, Wabco, Terex: Normal: - 96,5 dB (measured at 2,26 x RPM) Acceptable: 96,6 -102 dB
Unacceptable: 102,1 -108 dB Danger: 108,1 _ _ dB
The following probability formulae we ;re used to calculate the vibration limits:
Normal = X - S and under Un acceptable = X + 1,5 a
Acceptable = X + | Da .nger = X + 1,5 a and over
T01442GB0

Fig. 14. Trend curves at blower drive-shaft rotational frequency. The trend to the left is for 73,6 Hz, and that to the right for 70,8 Hz
dard, which has been drawn up by the maintenance engineer, gives the absolute vibration levels that can be tolerated. These levels were obtained from statistical analysis of vibration levels recorded on the trucks.
The Roots B l o w e r D r i v e - S h a f t A major problem arose concerning
the drive shaft for the Roots Blower. A number of engines were destroyed after the splines locating the shaft into the drive-hubs stripped. The engine governor is driven by this shaft and, in the event of the shaft stopping, the engine would overspeed and eventually destroy itself. At a replacement cost in the region of $160000, such breakdowns could not be tolerated.
The problem first arose after a modification to the engine. This had an unfortunate side-effect which resulted in the blower-drive being constantly loaded and unloaded, and eventually wearing the splines at the end of the drive shaft. At this point, due to the seriousness of the problem, the life of a blower was restricted to 5000 hours. A decision was therefore made to monitor this problem with the aid of the vibration monitoring system. This proved successful and the blower life was raised to 15000 hours. The engine manufacturer was duly informed of Fig. 15. The measurement point used on the truck engines to detect the Roots Blower drive the problem, and the design subse- problem quently changed.
The problem was monitored using the spectrum comparison and trending facilities of the system. The problem could be characterised by an increasing vibration component at the rotation frequency of the blower drive-shaft. Fig. 14 shows trend curves made at this rotation frequency. The blower drive-shaft rotation frequency Fig. 16. The blower drive-shaft with the worn splines indicated
9
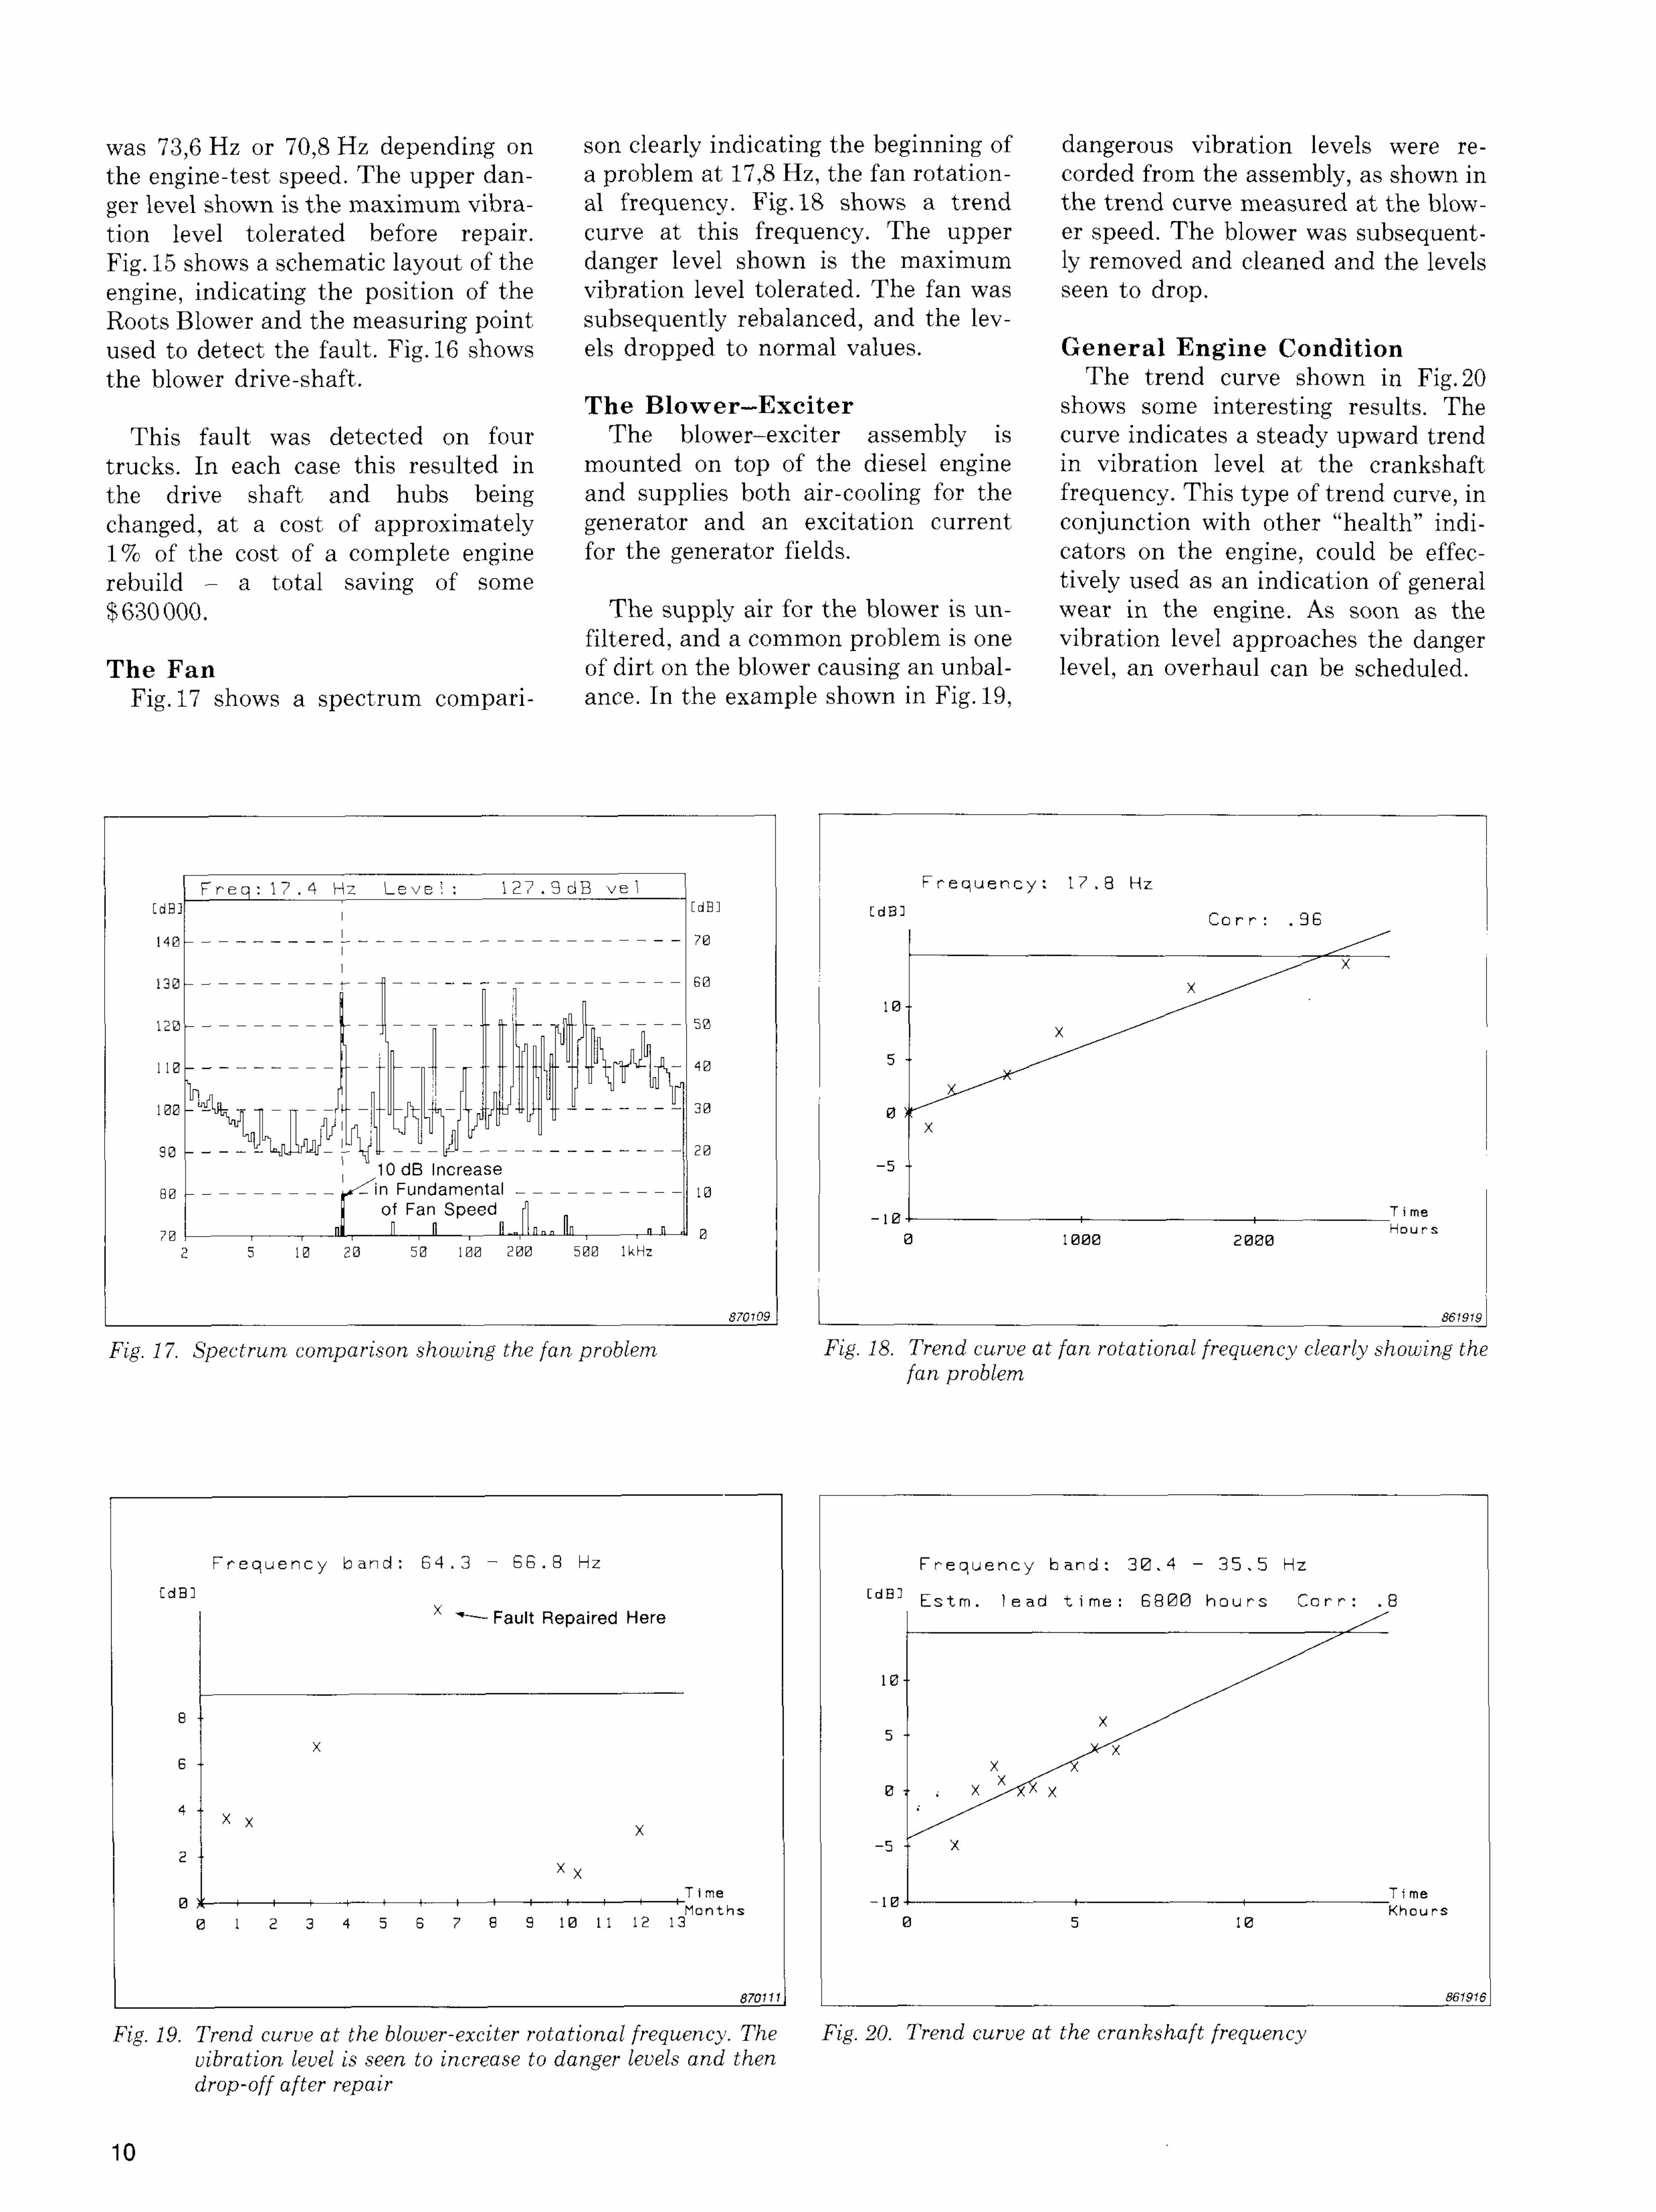
was 73,6 Hz or 70,8 Hz depending on son clearly indicating the beginning of dangerous vibration levels were re-the engine-test speed. The upper dan- a problem at 17,8 Hz, the fan rotation- corded from the assembly, as shown in ger level shown is the maximum vibra- al frequency. Fig. 18 shows a trend the trend curve measured at the blow-tion level tolerated before repair. curve at this frequency. The upper er speed. The blower was subsequent-Fig. 15 shows a schematic layout of the danger level shown is the maximum ly removed and cleaned and the levels engine, indicating the position of the vibration level tolerated. The fan was seen to drop. Roots Blower and the measuring point subsequently rebalanced, and the lev-used to detect the fault. Fig. 16 shows els dropped to normal values. General Engine Condition the blower drive-shaft. The trend curve shown in Fig. 20
The Blower—Exciter shows some interesting results. The This fault was detected on four The blower-exciter assembly is curve indicates a steady upward trend
trucks. In each case this resulted in mounted on top of the diesel engine in vibration level at the crankshaft the drive shaft and hubs being and supplies both air-cooling for the frequency. This type of trend curve, in changed, at a cost of approximately generator and an excitation current conjunction with other "health" indi-1% of the cost of a complete engine for the generator fields. cators on the engine, could be effee-rebuild - a total saving of some tively used as an indication of general $630000. The supply air for the blower is un- wear in the engine. As soon as the
filtered, and a common problem is one vibration level approaches the danger The Fan of dirt on the blower causing an unbal- level, an overhaul can be scheduled.
Fig. 17 shows a spectrum compari- ance. In the example shown in Fig. 19,
Fig. 17. Spectrum comparison showing the fan problem Fig. 18. Trend curve at fan rotational frequency clearly showing the fan problem
Fig. 19. Trend curve at the blower-exciter rotational frequency. The Fig. 20. Trend curve at the crankshaft frequency vibration level is seen to increase to danger levels and then drop-off after repair
10
Concentrator Vibration Monitoring The Mount Wright concentrator is
one of the largest beneficiating plants in the world, capable of handling 135000 tons of crude ore daily. The concentrator houses six parallel circuits that comprise the ore grinding and concentrating equipment. The vibration monitoring programme covers the six autogeneous grinding mills, belt conveyor drives and several hundred pumps.
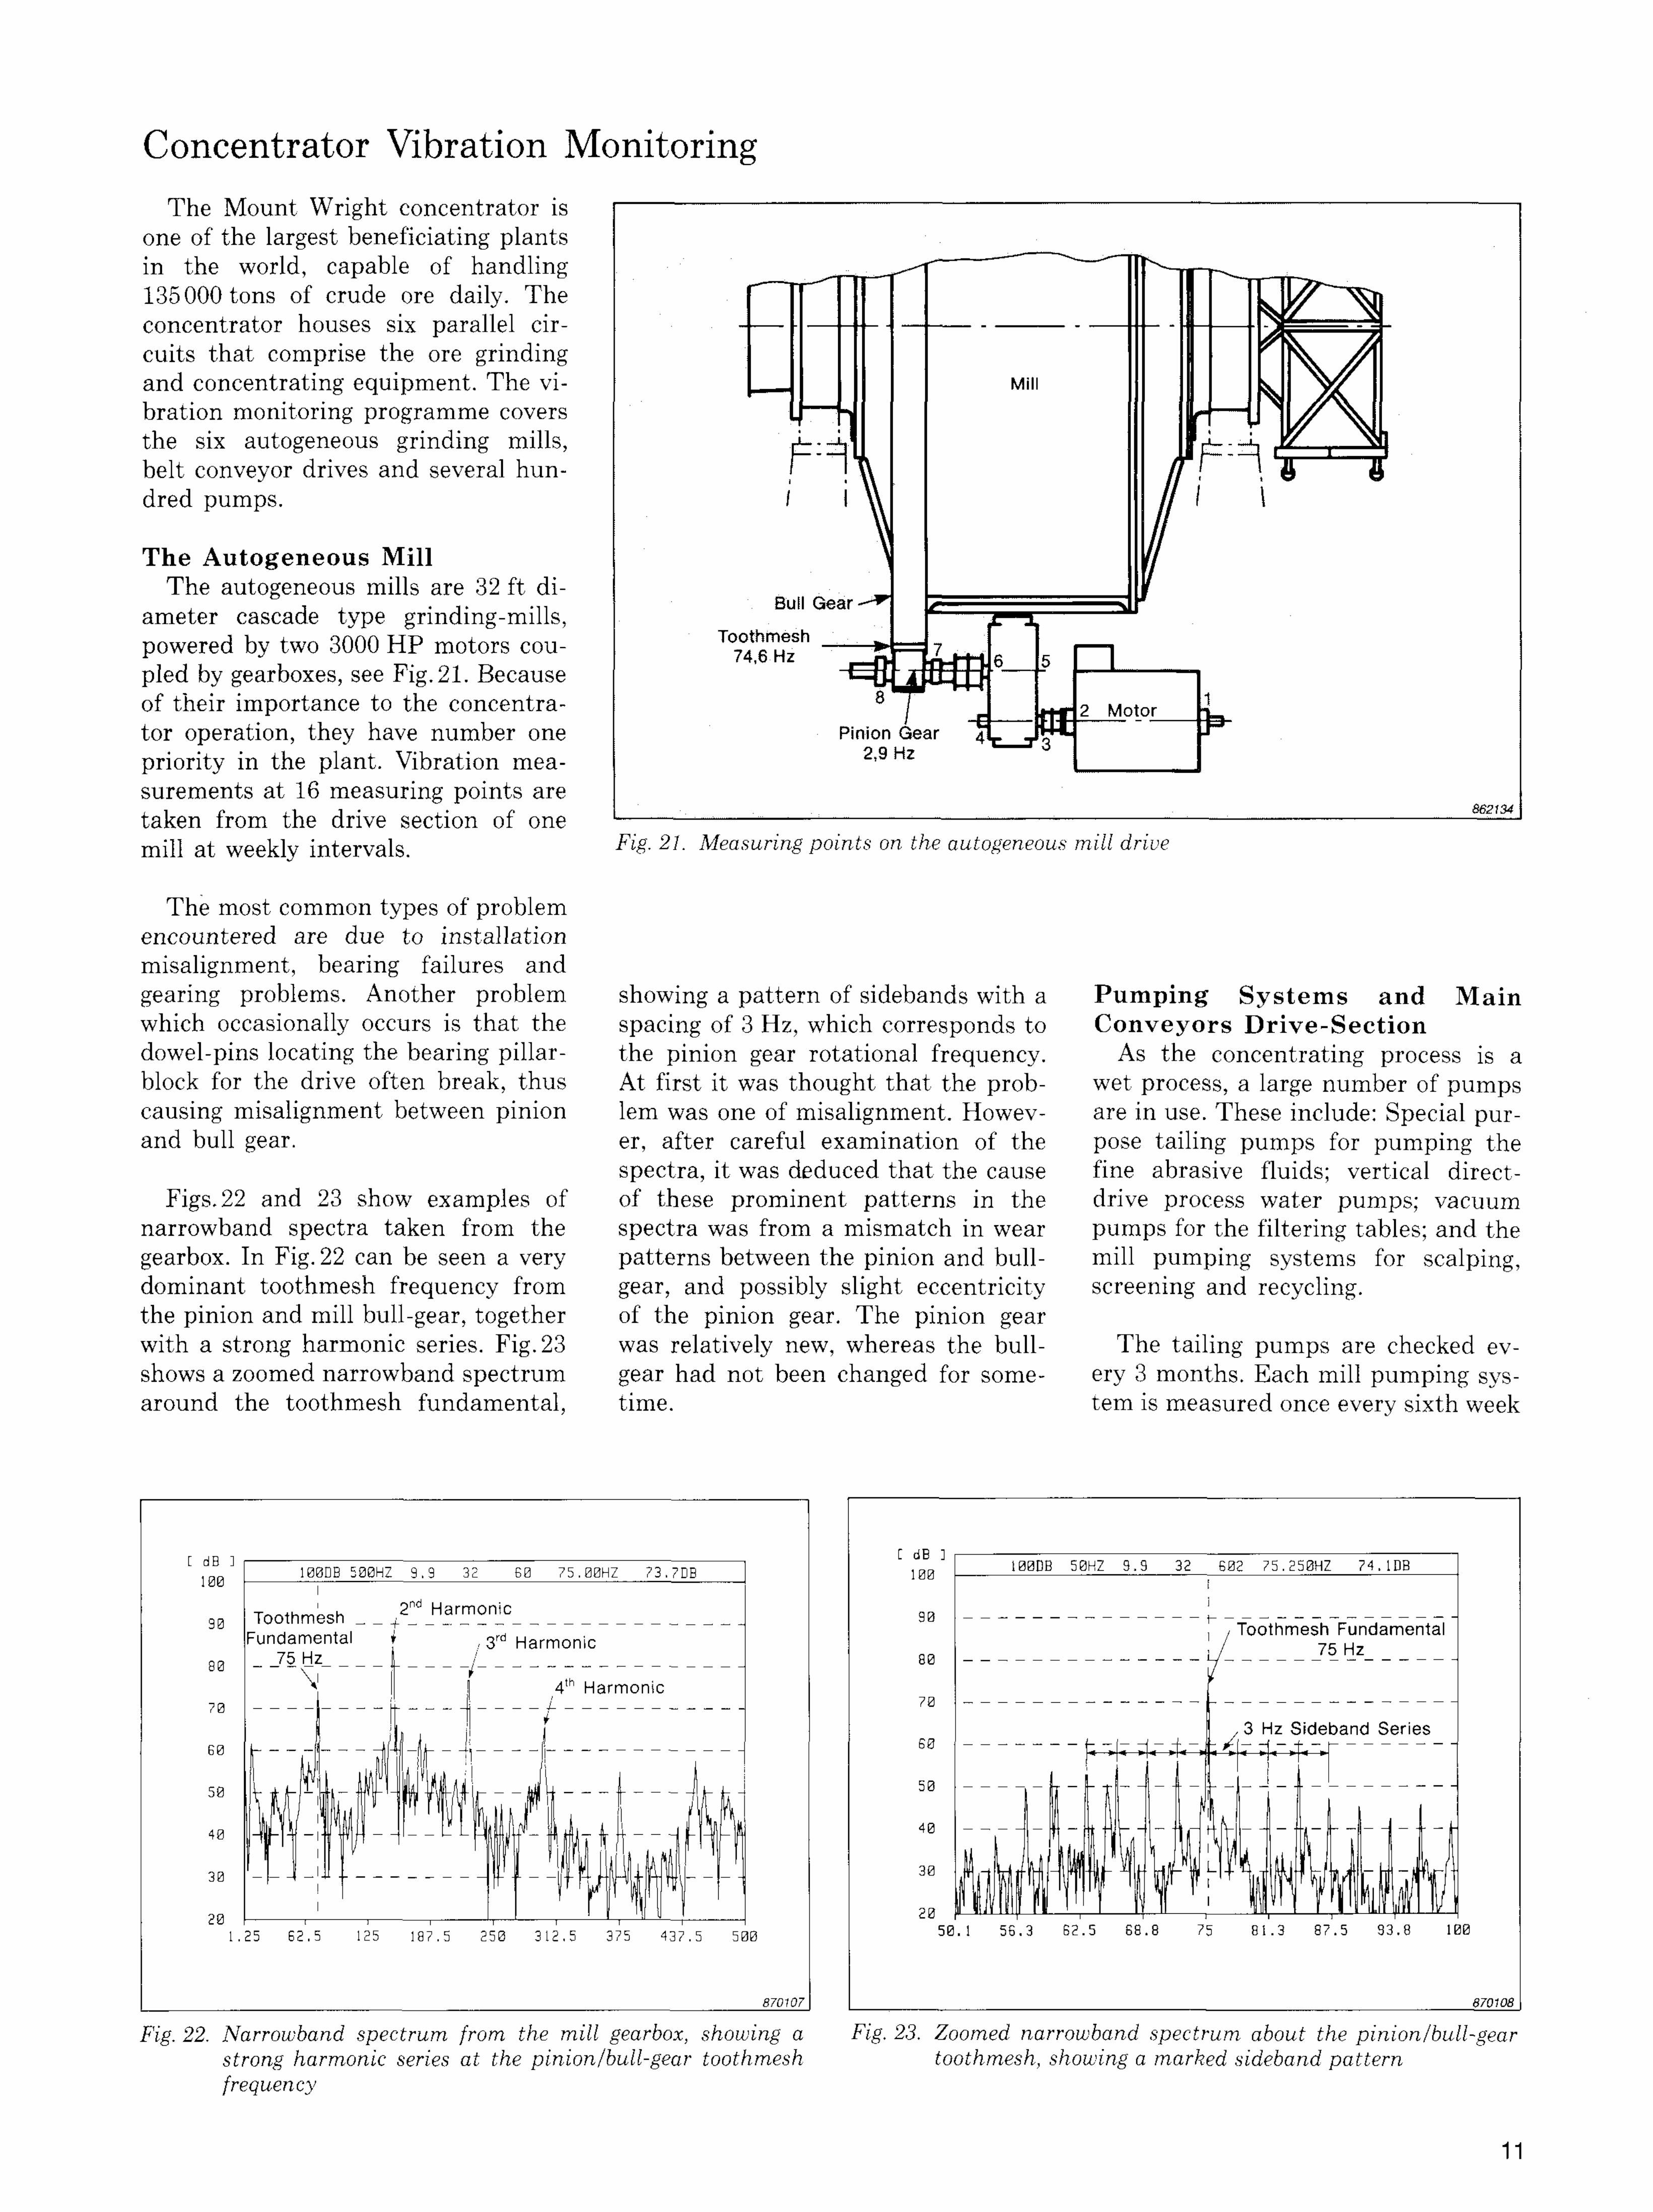
The Autogeneous Mill The autogeneous mills are 32 ft di
ameter cascade type grinding-mills, powered by two 3000 HP motors coupled by gearboxes, see Fig. 21. Because of their importance to the concentrator operation, they have number one priority in the plant. Vibration measurements at 16 measuring points are taken from the drive section of one mill at weekly intervals Fig- 21. Measuring points on the autogeneous mill drive
The most common types of problem encountered are due to installation misalignment, bearing failures and gearing problems. Another problem showing a pattern of sidebands with a Pumping S y s t e m s and Main which occasionally occurs is that the spacing of 3 Hz, which corresponds to Conveyors Dr ive -Sect ion dowel-pins locating the bearing pillar- the pinion gear rotational frequency. As the concentrating process is a block for the drive often break, thus At first it was thought that the prob- wet process, a large number of pumps causing misalignment between pinion lem was one of misalignment. Howev- are in use. These include: Special pur-and bull gear. er, after careful examination of the pose tailing pumps for pumping the
spectra, it was deduced that the cause fine abrasive fluids; vertical direct-Figs. 22 and 23 show examples of of these prominent patterns in the drive process water pumps; vacuum
narrowband spectra taken from the spectra was from a mismatch in wear pumps for the filtering tables; and the gearbox. In Fig. 22 can be seen a very patterns between the pinion and bull- mill pumping systems for scalping, dominant toothmesh frequency from gear, and possibly slight eccentricity screening and recycling. the pinion and mill bull-gear, together of the pinion gear. The pinion gear with a strong harmonic series. Fig. 23 was relatively new, whereas the bull- The tailing pumps are checked ev-shows a zoomed narrowband spectrum gear had not been changed for some- ery 3 months. Each mill pumping sys-around the toothmesh fundamental, time. tern is measured once every sixth week
Fig. 22. Narrowband spectrum from the mill gearbox, showing a Fig. 23. Zoomed narrowband spectrum about the pinion/bull-gear strong harmonic series at the pinion/bull-gear toothmesh toothmesh, showing a marked sideband pattern frequency
11
(1 line is measured per week), and the intervals due to the lack of manpower. tion of the pumps and conveyor-vacuum pumps for the filtering tables Typical problems are related to misa- drives, thus providing protection every 2 months. ligment, bearings and gears. against a sudden worsening of condi
tion. An analysis from tape recorded Typical fault processes monitored P r o p o s e d Moni tor ing measurements could then be made at
are: Bearing and gearing problems, P r o g r a m m e intervals realistic for the present man-and misalignment etc. On the tailing Due to the very large number of power availability, or when the 2516 pumps, which have a fluid drive, ped- measuring points (in the thousands), indicated increasing vibration levels. estal bearing problems are often found it is not really feasible for two techni-due to misalignment of the motor, cians to make tape recordings at regu-pump and fluid drive. lar, short intervals. It is therefore now
being considered to use the Type 2516 Vibration measurements from the broadband Vibration Meter for a
conveyor are taken at relatively long quick, regular spot-check of the condi-
Conclusions
♦ : ♦ . . ■ ■ ■ ■ ■ : - ■ < ■ , ,
m m m w n M i ^ i : - ■ - ' : ; ; ; & « # * s i ' ■ -:-;
1 i f m s s w m m < ^ * > . . . ■ > ■ ■ ■ ■■■■■ ■ ■.♦ m
h . ♦ : , . . ; ■ ■ ■ : : :
" * » « ? £ : < « : * K S S J : - — ■ . ; ; . . . ■ - ■ ■ : ■ : : ■ ■ ■ : : : ■ :
■ ■ ■ ■ ■ ■ ■ - - W Y - ? > ; : > : : ' - . n e g m m m 1 1 a m i i i : : " L H I l i t ■ :iS«: v'i;^-;:-::: . £ i i i . y J i i i i
^^'■■:9^Kg^^K^g^9^^^m- '■'■ ' ••••'•'ilSliiffliiipiii;:. . -sisfps-. . • ■' . . . . . . . . mmmmmmmmmmM IlllfllTlri ;• . hovels,;--.trtacte-:.:aiid • mills- :^g^: ; ' . ' : ;)v^ p ^ ^ ^ l ^ . ^ f l l . ^ g * help
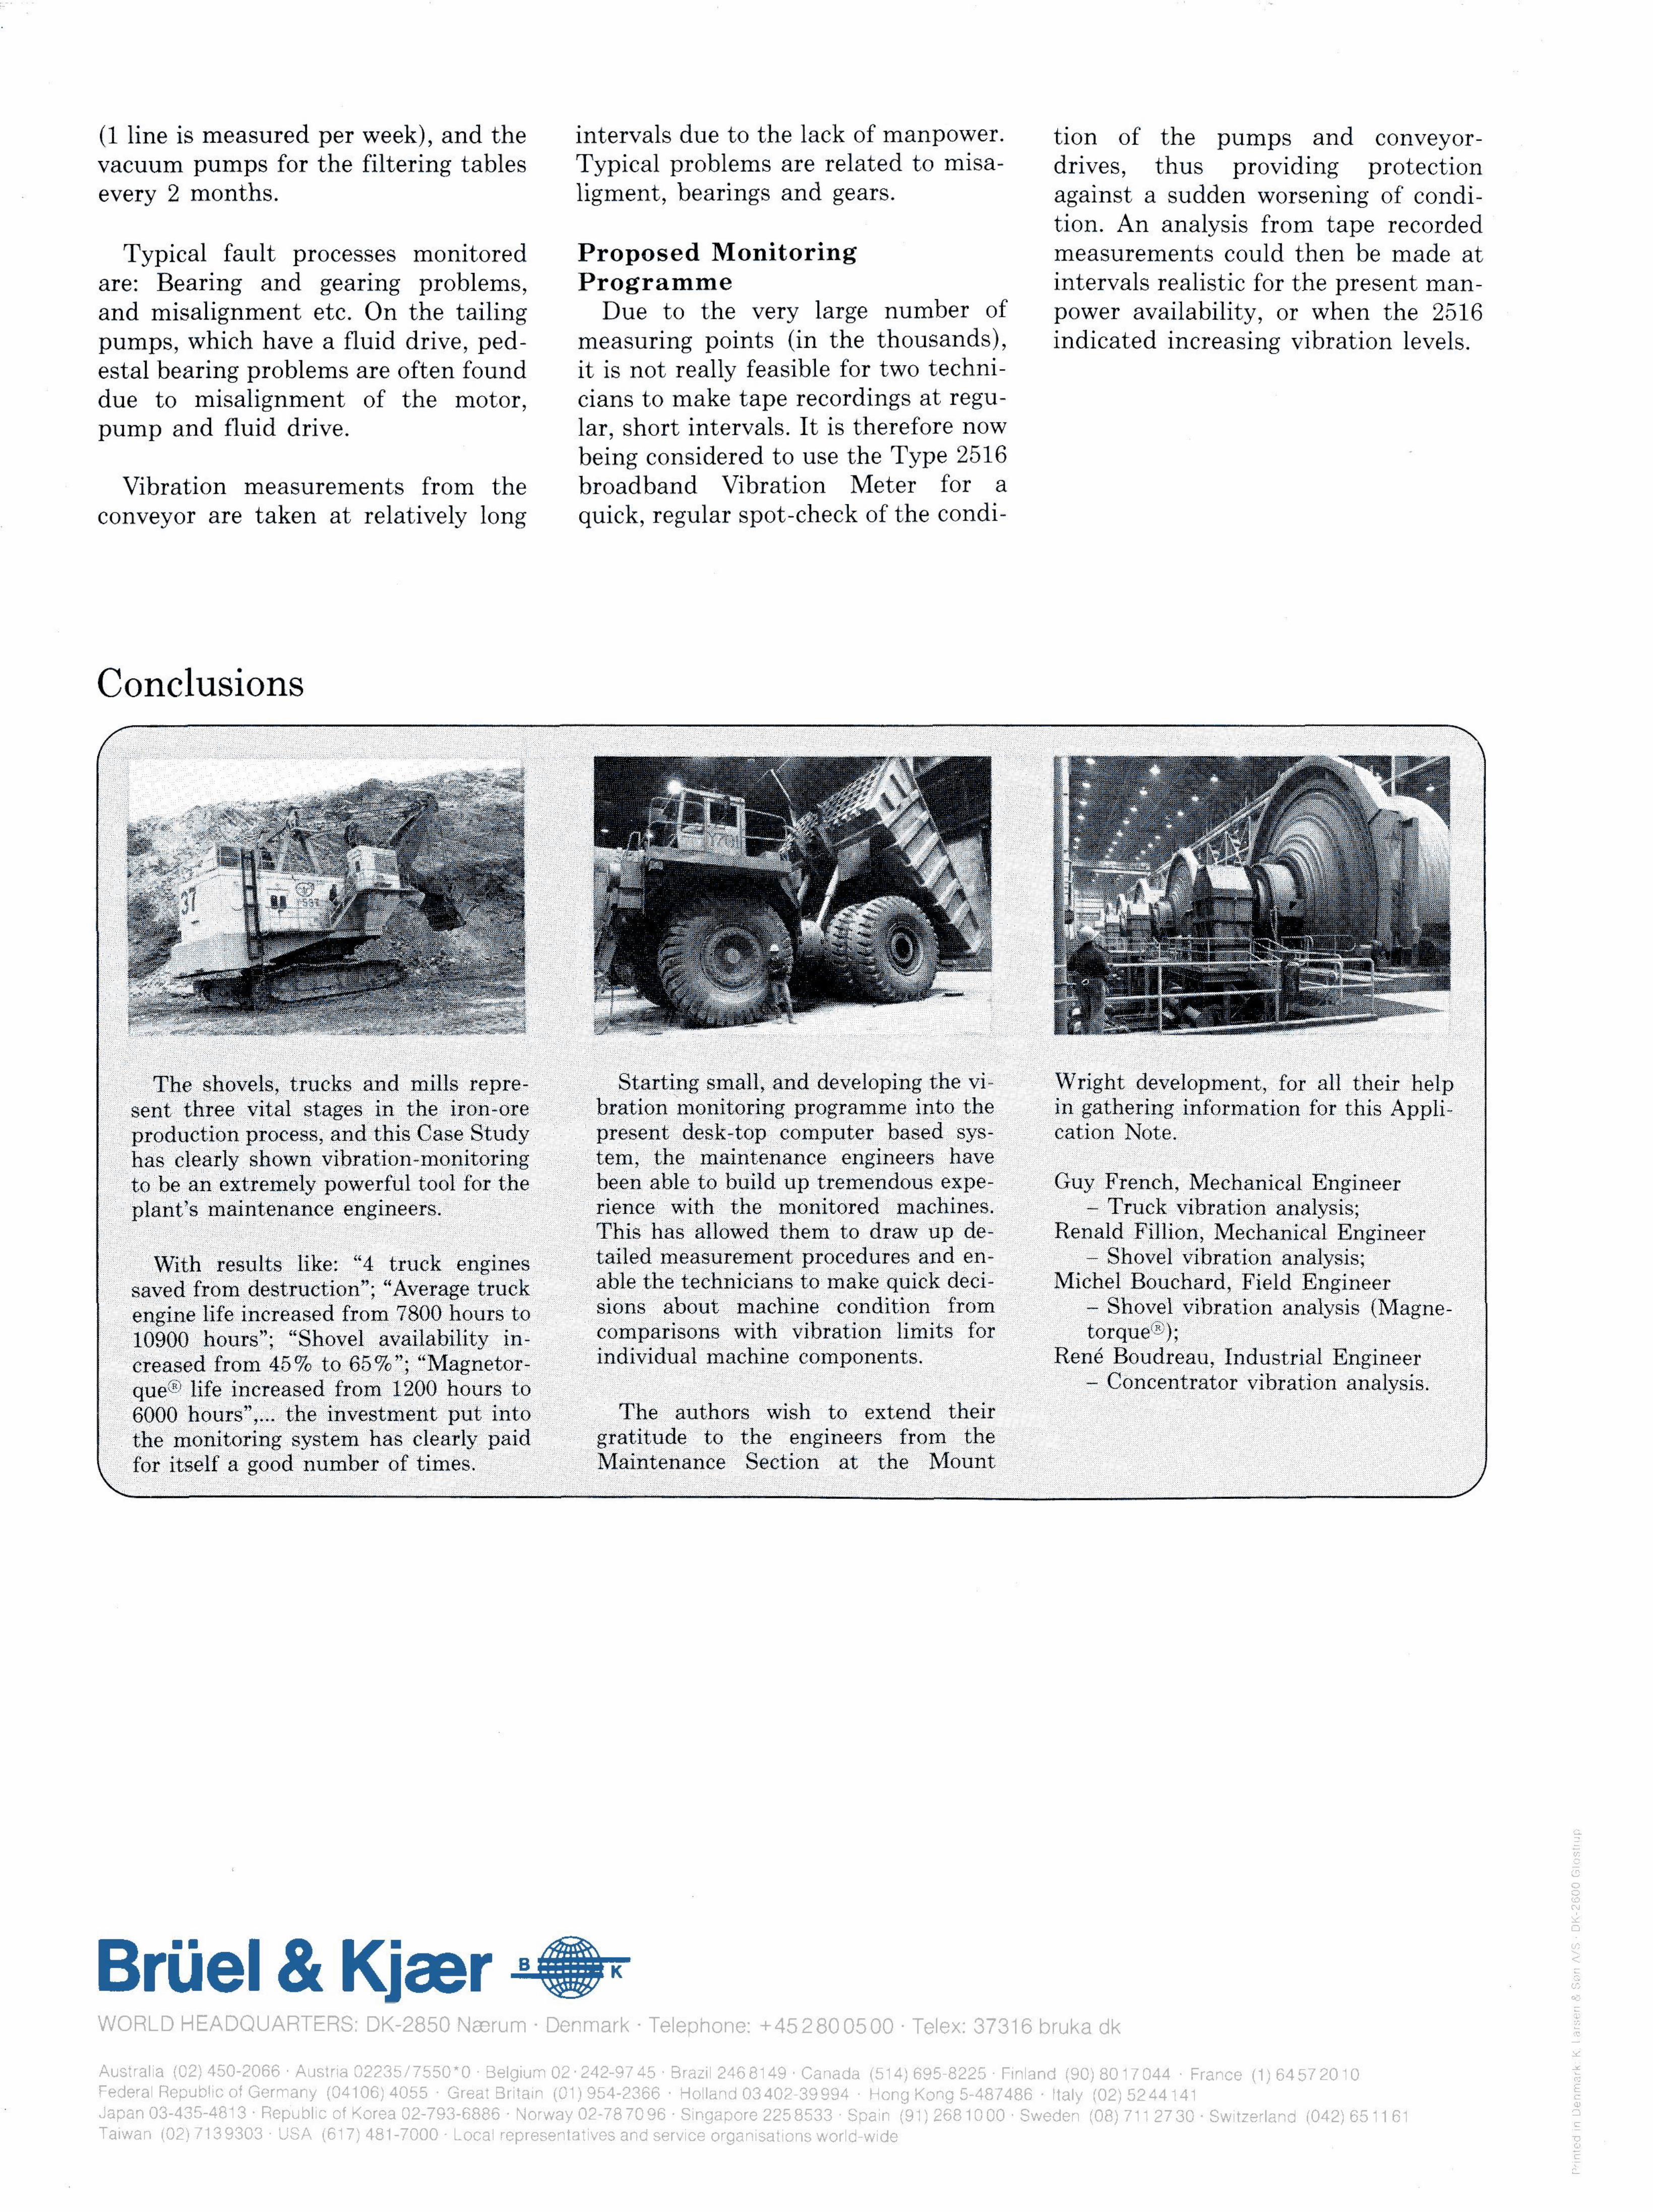
sent three vital stages in the iron-ore bration monitoring programme into the in gathering information for this Appli-production process, and this Case Study present desk-top computer based sys- cation Note. has clearly shown vibration-monitoring tern, the maintenance engineers have to be an extremely powerful tool for the been able to build up tremendous expe- Guy French, Mechanical Engineer
f p l a ^ rienee with the monitored machines. - Truck vibration analysis; This has allowed them to draw up de- Renald Pillion, Mechanical Engineer
llfflllSi'•^th:;results;rlike'- "4 truck engines ■\ i^tdJift^BSSW^^^:^^^BI^%ttd en- - Shovel vibration analysis; ^VPH from fWrurtior."- "Average truck able the technicians to make quick deci- Michel Bouchard, Field Engineer
•: - engine life increased from 7800 hours to Wm'^m^&^im^mj^^^ from -Shovel vibration analysis (Magne-10900 hours"; "Shovel availability in- comparisons with vibration limits for torque*);
B i i i i » a 5 i ■ imm 4£f t to #5%*; "Magnetor- individual machine components. Rene Boudreau, Industrial Engineer que® life increased from 1200 hours to - Concentrator vibration analysis. 6000 hours",... the investment put into/ The authors wish to extend their
:the monitoring system has clearly paid gratitude to th^ from the for itself a good number of times. Maintenance Section at the Mount