Embed Size (px)
Citation preview

Mach 5 User’s Manual Revision 2.0 1

Mach 5 User’s Manual Revision 2.0 2
WARRANTY
The Gentec-EO MACH 5 Meter carries a one-year warranty (from date of shipment) against material and/or workmanship defects, when used under normal operating conditions. The warranty does not cover damages related to battery leakage or misuse. Gentec-EO Inc. will repair or replace, at Gentec-EO Inc.’s option, any MACH 5 that proves to be defective during the warranty period, except in the case of product misuse. Any attempt by an unauthorized person to alter or repair the product voids the warranty. The manufacturer is not liable for consequential damages of any kind. Customers must fill in and mail the warranty card in order to activate the warranty. In case of malfunction, contact your local Gentec-EO distributor or nearest Gentec-EO Inc. office to obtain a return authorization number. The material should be returned to:
Gentec Electro-Optics, Inc.
445, St-Jean-Baptiste, Suite 160 Québec, QC
Canada G2E 5N7
Tel: (418) 651-8003 Fax: (418) 651-1174
e-mail: [email protected]
Website: www.gentec-eo.com
CLAIMS
To obtain warranty service, contact your nearest Gentec-EO agent or send the product, with a description of the problem, and prepaid transportation and insurance, to the nearest Gentec-EO agent. Gentec-EO Inc. assumes no risk for damage during transit. Gentec-EO Inc. will, at its option, repair or replace the defective product free of charge or refund your purchase price. However, if Gentec-EO Inc. determines that the failure is caused by misuse, alterations, accident or abnormal conditions of operation or handling, you will be billed for the repair and the repaired product will be returned to you, transportation prepaid.
Mach 5 User’s Manual Revision 2.0 3
SAFETY INFORMATION
Do not use the MACH 5 if the device or the detector looks damaged, or if you suspect that the MACH 5 is not operating properly. Appropriate installation must be done for water-cooled and fan-cooled detectors. Refer to the specific instructions for more information. Wait a few minutes before handling the detectors after power is applied. Surfaces of the detectors get very hot and there is a risk of injury if they are not allowed to cool down. Note: This equipment has been tested and found to comply with the limits for a Class
B digital device, pursuant to part 15 of the FCC Rules. These limits are designed to provide reasonable protection against harmful interference in a residential installation. This equipment generates, uses, and can radiate radio frequency energy. If not installed and used in accordance with the instructions, it may cause harmful interference to radio communications. However, there is no guarantee that interference will not occur in a particular installation. If this equipment does cause harmful interference to radio or television reception, which can be determined by turning the equipment off and on, try to correct the interference by taking one or more of the following steps:
• Reorient or relocate the receiving antenna. • Increase the distance between the equipment and receiver. • Connect the equipment to an outlet that is on a different circuit than the
receiver. • Consult the dealer or an experienced radio/TV technician for help.
Caution: Changes or modifications not expressly approved in writing by Gentec-EO Inc. may void the user’s authority to operate this equipment.
SYMBOLS
The following international symbols are used in this manual:
Refer to the manual for specific Warning or Caution information to avoid any damage to the product.
DC, Direct Current
Mach 5 User’s Manual Revision 2.0 4
Table of Contents Introduction ....................................................................................................................... 5 Installing the Software ...................................................................................................... 6 Power Source ..................................................................................................................... 8 Probe Connection .............................................................................................................. 8 Indicator LED’s ................................................................................................................ 8 USB ..................................................................................................................................... 9 Detector Output ................................................................................................................ 9 External Trigger................................................................................................................ 9 Turning the Unit On ......................................................................................................... 9 Power on Tests................................................................................................................... 9 The Applications Software ............................................................................................. 10 The Main Controls .......................................................................................................... 10 The Instrument Control Display ................................................................................... 15 The Live Mode Display ................................................................................................... 17 The Life Test Display ...................................................................................................... 19 The Applications Software Menu .................................................................................. 25 The Strip Chart Display ................................................................................................. 25 The Histogram Display ................................................................................................... 28 The Statistics Display ...................................................................................................... 29 The FFT Display ............................................................................................................. 32 The Probe Data Display.................................................................................................. 33 Operating Mach 5 with the Applications Software ..................................................... 37 Getting Ready to Measure Data .................................................................................... 38 Range Setting ................................................................................................................... 38 Trigger Level Setting ...................................................................................................... 38 Trigger Source Setting .................................................................................................... 38 Trigger Polarity (Slope) Setting ..................................................................................... 38 Trigger Delay Setting ...................................................................................................... 38 Trigger Level Tracking Setting ..................................................................................... 40 Zero Baseline ................................................................................................................... 41 Autoset ............................................................................................................................. 41 Measuring Data ............................................................................................................... 41 Retrieving Data ............................................................................................................... 42 Analyzing Data ................................................................................................................ 42 Missing Pulses.................................................................................................................. 43 Data Correction ............................................................................................................... 43 Wavelength Correction .................................................................................................. 43 Temperature Correction ................................................................................................ 44 Pulse Memory .................................................................................................................. 44 File Management ............................................................................................................. 44 Obtaining Help ................................................................................................................ 44 Recycling and separation procedure. ............................................................................ 46
7.8.1 Separation: ............................................................................................................ 46

Mach 5 User’s Manual Revision 2.0 5
7.8.2 Dismantling procedure: .................................................................................... 46 Introduction The Mach 5 is an advanced high speed energy meter capable of measuring up to 100,000 pulses per second. It is used with the Mach 5 Applications Software, which creates a full featured data acquisition system for measuring and displaying laser energy. The Mach 5 is used with compatible GENTEC-EO probes, the M5-PJ (Pyroelectric Sensor) or the M5-SJ (Silicon Sensor). Figure 1 shows the Mach 5 front panel. Figure 2 shows the Mach 5 back panel.
Figure 1, Mach 5 Front Panel

Mach 5 User’s Manual Revision 2.0 6
Figure 2, Mach 5 Back Panel Installing the Software Do not plug the Mach 5 into your PC yet.
Step 1, Installing the Applications Software.
1. Insert the installation CD. The installation will start automatically. If it does not, browse to the setup.exe file on the CD and run it.
2. The Welcome to the GENTEC-EO Mach 5 Installation Wizard will open. Select Next.
3. The Select Destination Folder dialog box will open. It is recommended that you leave the destination folder at the default setting. Select Next.
4. The Ready to Install the Application dialog box will open. Select Next. The application software and support files will be installed.
5. Upon completion of the installation, the Success dialog box will open. Select Finish.
6. Leave the CD in your PC as the USB drivers are located on the disk and are needed for step 2.
Step 2, Installing the USB Drivers
1. Connect the Mach 5 to your PC with the supplied USB cable.
2. Connect the power supply and turn on the Mach 5.

Mach 5 User’s Manual Revision 2.0 7
3. The Found New Hardware Wizard will run. If the Windows Update prompt appears, select No, not this time and press Next.
4. When the Install from CD appears, select Install Software Automatically and press Next.
5. When the Completing prompt appears, select finish.

Mach 5 User’s Manual Revision 2.0 8
The software installation is now complete. You may now run the application software. The software will wait until it finds a Mach 5 instrument on the USB before it becomes functional. If the Mach 5 is disconnected from the USB or turned off, the software will return to the wait state until the Mach 5 is on the USB again. Power Source The Mach 5 system is supplied with a 10V, 1.5A universal power module. It will accept voltages from +9V to +15V provided they supply at least 1A and the plug is 5.5mm outer diameter, 2.1 mm inner diameter, and 11mm in length, with the center being positive. Plug the supply into the DC power jack located on the front panel. Probe Connection The Mach 5 probes use a 7 pin locking connector. See figure 2. Plug in the probe by lining up the red reference dots and pushing the connector until it latches into its locked position. To remove the probe, power down the unit and pull on the outer sleeve. The connector will unlock and disengage. Indicator LED’s There are 6 LED’s on the Mach 5 front panel as shown in figure 1. The Power LED is illuminated when ever an external supply is plugged into the DC power jack. The Trigger LED illuminated when the Mach 5 is triggered. This LED functions at all times, whether the Mach 5 is armed or not. The Over temp LED illuminates when the measure probe temperature exceeds 65°C. This LED is only updated when the unit is armed and triggered.

Mach 5 User’s Manual Revision 2.0 9
The Armed LED illuminated when the unit has been armed for data collection. Note that the unit can be armed even if no triggers are present. The Out of Range LED illuminates when the internal ADC detects a voltage outside of its measurement range. This LED is only updated when the unit is armed and triggered. The Buffer Full LED illuminates when the internal pulse memory is full. USB The Mach 5 communicates with the host PC via a USB port. The device supports full speed USB 2.0. The host P.C must have the Mach 5 USB drivers installed. These drivers are on the disc supplied with the Mach instrument. The Application Software is written in LabView and uses the NI-VISA software from National Instruments to affect a communication link with the Mach 5. The USB cable can be unplugged from the Mach 5 during operation at any time, but the applications software will not function in this state other than to wait for a Mach 5 to be connected to the USB. Detector Output The Detector Output provides an amplified, buffered signal from the probe. The full scale signal is 3.00V in a given range and is offset by -1.25V nominal. External Trigger Mach 5 supports internal and external triggering. Connect a TTL trigger signal to this input to use external triggering. Turning the Unit On Before turning the Mach 5 on, be sure that the probe in use is plugged in. When the Mach 5 powers up, it reads the probe memory to obtain required information for correct operation. Mach 5 cannot detect a probe removal, so hot swapping the probe is not permitted. Doing so will not cause damage, but the probe information will not be updated. Once the probe and power supply are connected, turn the unit on by setting the Power Switch to ON. The Power LED will illuminate. The remaining LEDS will turn on briefly as the Mach 5 performs internal self-tests, then they will turn off. The Mach 5 is now ready to use. Power on Tests When powered on, the Mach 5 tests its internal memory and its control circuitry to ensure it can accurately measure data. If the internal memory fails its test, the Mach 5 will flash the Over Temp LED. If the control circuitry fails its test, the Mach 5 will flash the Out of
Mach 5 User’s Manual Revision 2.0 10
Range LED. Should either of these conditions occur, contact GENTEC-EO for service of the unit. The Applications Software The Mach 5 Application Software consists of controls and indicators on 6 display tabs:
1. The Instrument Controls Display. 2. The Strip Chart Display. 3. The Histogram Display. 4. The Statistics Display. 5. The FFT Display. 6. The Probe Data Display
The desired display is selected by clicking on the appropriate tab. The Main Controls Figure 3 shows the Instrument Controls Display of the Applications Software.

Mach 5 User’s Manual Revision 2.0 11
Figure 3, Instrument Controls Display The main controls for the instrument are below the display tabs. They are: Range Sets the instrument to the desired range. Note that the available ranges are dependant on the sensor responsivity. Since the sensor responsivity varies with wavelength, turning Wavelength Compensation on may cause a rescale of the available ranges. If this occurs, the instrument will set itself to the same currently set range if it is still available. If it is not, the instrument will set itself to the next available range. Trigger Level The trigger level in percent of full scale. If the level is set to 10% and the range is set to 200uJ, then the instrument will trigger on signals greater than 20uJ. Trigger Source Internal causes the instrument to take a measurement (if it is armed) whenever a pulse is present that is greater than the set trigger level. External causes the instrument to take a measurement (if it is armed) whenever an external trigger pulse is sent, regardless of whether or not a laser pulse has occurred. This is useful for testing for missing laser pulses.

Mach 5 User’s Manual Revision 2.0 12
Trigger Polarity Sets the trigger edge polarity for the external trigger pulse. Positive triggers on the rising edge of the trigger pulse, negative triggers on the falling edge of the trigger pulse. Trigger Delay This is the delay of the trigger pulse. If used with external trigger, the timing relationship between the external trigger pulse and the laser firing event can be accounted for by setting the delay appropriately. The range is -938ns to +2480ns. Trigger Hold off This is the hold off in microseconds for the trigger event. After a trigger event the instrument will not trigger again until the hold off expires. This is useful for bursts of pulses at a given rep rate. Supposed there are bursts of 5 pulses occurring every 10us and the bursts themselves occur every 200us. Setting to hold off to 50us will cause only the first pulse in the 5 pulse burst to be measured. Setting the trigger hold off to zero disables trigger hold off. Arm Arms the instrument for a data gathering run. Arming the instrument clears any existing data from the pulse memory, and then enables trigger detection in the processor. As each pulse is measured, the result is stored in pulse memory, up to 4 million pulses. (4,194,304) When the pulse memory is full, measurement continues but the data is discarded. Note that arming the instrument disables all other controls on the application that communicate with the instrument. This is done to prevent the instrument from losing pulse data while responding to commands or queries. Read Pulse Memory This control calls a user prompt that asks for the pulse offset and the number of pulses to retrieve from pulse storage memory. Once that information is acquired, the pulse memory is read. The destination of the pulse memory is dependant on the state of the Read to File and Read to Display check boxes. The pulse memory is capable of storing up to 4,194,303 pulses. This is a large volume of data and it can be time consuming to retrieve all of it at once. The pulse offset and number of pulses to retrieve controls make this manageable. As an example, suppose there are 2 million pulses in the memory. The user can ask for this data in batches of 500,000 pulses at a time in 4 batches: Read 1, pulse offset = 1, number of pulses to retrieve = 500,000

Mach 5 User’s Manual Revision 2.0 13
Read 2, pulse offset = 500,001, number of pulses to retrieve = 500,000 Read 3, pulse offset = 1,000,001, number of pulses to retrieve = 500,000 Read 4, pulse offset = 1,500,001, number of pulses to retrieve = 500,000 The response of the application to large pulse batches will depend on the host PC. A test machine with a 2.66GHz dual core processor and 3GB of memory retrieved 500,000 pulses to a data file in 7.9 seconds. The retrieval to the display took 20.9 seconds. The extra time is due to the processing of the large data arrays in the application. Batch Size The number of pulses to measure when the instrument is armed. Missing Pulse Threshold The energy level used to test a data set for missing pulses. Any pulse energy in the set that is lower than this threshold will cause a missing pulse to be recorded. This control must be set before testing the data. % Frequency Stability Threshold With internal triggering, if the pulse is below the trigger level, no trigger will occur, but the period timer will still be running. This means that the period will be longer between the pulses adjacent to the missing pulses. The applications software examines the pulse data for this condition and records the time stamps where the period is discontinuous. From the continuous period data, the true period can be found and used to count how many pulses were missing in the discontinuities. The % Frequency Stability Threshold setting determines how much time stamp mismatch is allowed before a pulse is determined to be missing. This control must be set before the data set is tested. Search Data For Missing Pulses Searches the current data set for missing pulses. Pulse data are searched using to criteria, the Missing Pulse Threshold and the Frequency Stability Threshold. A large data set can take many seconds to search. Missing Pulse Threshold The energy level used to test a data set for missing pulses. Any pulse energy in the set that is lower than this threshold will cause a missing pulse to be recorded. Frequency Stability Threshold

Mach 5 User’s Manual Revision 2.0 14
With internal triggering, if the pulse is below the trigger level, no trigger will occur, but the period timer will still be running. This means that the period will be longer between the pulses adjacent to the missing pulses. The applications software examines the pulse data for this condition and records the time stamps where the period is discontinuous. From the continuous period data, the true period can be found and used to count how many pulses were missing in the discontinuities. The % Frequency Stability Threshold setting determines how much time stamp mismatch is allowed when computing the true frequency. Wavelength Sets the wavelength of the laser in use. Since the sensor responsivity varies with wavelength, turning Wavelength Compensation on with the wavelength set to any value other than the calibration wavelength may cause a rescale of the available ranges. If this occurs, the instrument will set itself to the same currently set range if it is still available. If it is not, the instrument will set itself to the next available range. Aperture Area The sensor or user aperture area in cm2. Attenuation Factor This is used to compensate the data for the use of an external optic, such as a beam splitter. If the external optic is only presenting 10% of the beam to the sensor, then enter 0.1 for the factor. The data will be scaled by 1 / Attenuation Factor so that it represents the energy of the beam before the optic. If this causes the data values to exceed the range, then the strip charts in the various displays will need to be set to auto scale before the data will be visible. Note: This parameter must be set before reading the Pulse Data. Sigma for Standard Deviation The number, z, used in the standard deviation value. If a data distribution is approximately normal then about 68% of the values are within 1 standard deviation of the mean, about 95% of the values are within two standard deviations and about 99.7% lie within 3 standard deviations. For various values of z, the percentage of values expected to lie in the symmetric confidence interval (-zs,zs) are as follows: s percentage

Mach 5 User’s Manual Revision 2.0 15
1s 68.27% 2s 95.450% 3s 99.7300% 4s 99.993666% 5s 99.99994267% 6s 99.9999998027% Move to Next Display Moves the Tab Control to the next Display Tab. There are four LED indicators for the instrument above the display tabs. They are: The Over temp LED illuminates when the measure probe temperature exceeds 65°C. This LED is only updated when the unit is armed and triggered. The Out of Range LED illuminates when the internal ADC detects a voltage outside of its measurement range. This LED is only updated when the unit is armed and triggered. The Wavelength Correction On LED illuminates if Wavelength Correction is On. The Temperature Correction On LED illuminates if Temperature Correction is On. The Instrument Control Display Tab also shown in figure 3 is used to control instrument settings that are not as frequently used as those on the Main Display The display contains controls and indicators. The Instrument Control Display The Controls on the Instrument Control Display area are: Temperature Correction Turns Temperature Compensation On. The instrument measures the temperature of the sensor and records the data with each pulse. If Temperature Compensation is On, this data is used to compensate the measured pulse data for temperature induced responsivity changes. If Temperature Compensation is Off, the data is not corrected. The instrument always sends the temperature data with the pulse data. Compensation is done by the host application. Wavelength Correction Turns Wavelength Compensation On. The sensor responsivity is wavelength dependant. Turning Wavelength Compensation On causes the instrument to restructure its internal gains to compensate for the variation in responsivity. Since the sensor responsivity varies

Mach 5 User’s Manual Revision 2.0 16
with wavelength, turning Wavelength Compensation on may cause a rescale of the available ranges. If this occurs, the instrument will set itself to the same currently set range if it is still available. If it is not, the instrument will set itself to the next available range. Trigger Level Tracking Turns Trigger Level Tracking On. This applies to Internal Trigger Mode only. Since the Mach 5 uses a hardware trigger, and the pulse that creates the trigger exhibits a DC drift proportional to average power, the trigger level will appear to shift in relation to the pulse as the. At low duty cycle, the pulse baseline will be stable and triggers will occur as intended. With high duty cycles the pulse will drift negative. If this drift is greater than the set trigger level the instrument will stop triggering and miss pulses. To prevent this, the trigger level must be corrected as the pulse baseline drifts. Trigger Tracking monitors the DC level of the pulse and modifies the trigger level so it remains at the set level in relation to the pulse. When triggering stops or Mach 5 is disarmed, or trigger tracking is turned off, the trigger level returns to its unmodified state. Test Pulse Memory Tests the internal instrument pulse storage memory and returns the result. Note that testing the pulse storage memory is destructive of any pulse data currently stored. Clear Pulse Memory Clears the internal instrument pulse storage memory. Note that clearing the pulse storage memory is destructive of any pulse data currently stored. Query Number Stored Returns the number of pulses currently stored in the pulse memory. Auto Read Batch If this box is checked, then after a data batch is taken it will be automatically directed to a data file, to the displays, or both depending on the state of the Read to File and Read to Displays check boxes. If there is no currently open data file, you will be prompted to select one. Subsequent files will be auto incremented. Read to File Sets the target for any pulses read from instrument memory to a text file. If a data file is currently open then it will be used. If there is no file open, the user will be prompted to select or create a file. Data is stored in the following format:

Mach 5 User’s Manual Revision 2.0 17
Pulse Energy (in Joules), Time Stamp (in Seconds), Probe Temperature (in degrees Celsius), and Error Flag The Error flag is decoded as follows: 0 = no errors in batch. 1 = out of range error for one or more pulses in batch. 2 = over temp error for one or more pulses in batch. 3 = out of range and over temp errors for one or more pulses in batch. Read to Display Sets the target for any pulses read from instrument memory to the application displays. (Strip Chart, Histogram, FFT, and Statistics pages) Autoset Calls the Autoset VI. This VI attempts to find the best range and trigger level for the signal being measured. The flow is: 1. Set the trigger source to internal. 2. Set the trigger delay to 0ns. 3. Set trigger level to 7% 4. Set Range to top Range. 5. Test for triggering. If no triggers are present, the VI reduces the range to the next lowest and tests for triggering. It repeats this process until the lowest range is reached. If no triggers are present, it then reduces the trigger level 1% at a time until either triggering occurs or the minimum trigger level is reached. When a trigger is found, the VI returns the discovered setup to the Instrument Controls Display. Zero Baseline The DC level of a pulse for a Pyroelectric sensor is dependant on the average energy. If the DC level drifts out of range, pressing this button will cause the instrument to readjust the DC level in the instrument to compensate for this drift. The Live Mode Display Call Live Mode Display

Mach 5 User’s Manual Revision 2.0 18
Calls a display of measured data sampled at a 10Hz rate. Calling the display side affects: Range, Trigger Level, Trigger Source, Trigger Polarity, and Trigger Delay as these parameters are controllable from the Live Mode Display VI. The data may be logged to a file for later analysis. Note that the statistics displayed are being performed on the data set. To reset and start a new batch of statistics, press the Clear Plot button. The display averaging is a moving average. This means that the average will not be complete until all the samples are taken, but the displays will reflect the current averaged value until this happens. Suppose that a batch size of 5 is selected, and then Apply Display Averaging is selected. The samples will be averaged as follows: Sample Number Number Averaged 1 1 sample summed, divided by 1 2 2 samples summed, divided by 2 3 3 samples summed, divided by 3 4 4 samples summed, divided by 4 5 5 samples summed, divided by 5 The averaging filter is now full. As each new sample is taken, it will replace the oldest sample and a new average will be computed based on the new data set, that is sample 6 will replace sample 1, the and the new set will be averaged.

Mach 5 User’s Manual Revision 2.0 19
The Life Test Display Run Life Test The Life Tests Vi will start a test at a desired time; measure the desired number of pulses at a desired interval, until the desired stop time is reached. Each test in the sequence is stored in an auto incrementing file. Each test sets min, mean, and max is plotted on a strip chart for quick reference. When the test is started, it will prompt for a file name. That file name will be used for all tests in the sequence, with a number appended to it to differentiate the data sets. For example, if you name the file My Test Set, and there are 5 tests in the set, the saved files will be My Test Set 1.txt, My Test Set 2.txt, My Test Set 3.txt, My Test Set 4.txt, and My Test Set 5.txt. There are two methods of running a life test. You can type in a Start Time, Stop Time, Number of Pulses in Batch, and a Test Interval. When Start Test is pressed, the VI will calculate the number of tests and the test duration. It will then wait until the selected start time to begin the test sequence. Alternatively, you can type in Number of Pulses in Batch and a Test Interval, and then press Start Using Current Time. The VI will prompt for the number of tests to run, and then it will calculate the Stop Time and the Test Duration and begin testing immediately. Test data may be viewed in the main application the same as any saved data set, unless you have appended additional test to the file by typing into the Additional File Information text box.

Mach 5 User’s Manual Revision 2.0 20
The Controls are: Start Test Starts the test with the selected parameters for Start Time, Stop Time, and Test Interval. Start Using Current Time Starts the test immediately and calculates the Stop Time from the Current Time, Number of Tests, and Test Interval. Abort Test Aborts the currently running test sequence. Any test files that have been taken prior to the abort will be saved. Exit Test Exits the Life test VI and returns to the main application. Number of Pulses in Batch

Mach 5 User’s Manual Revision 2.0 21
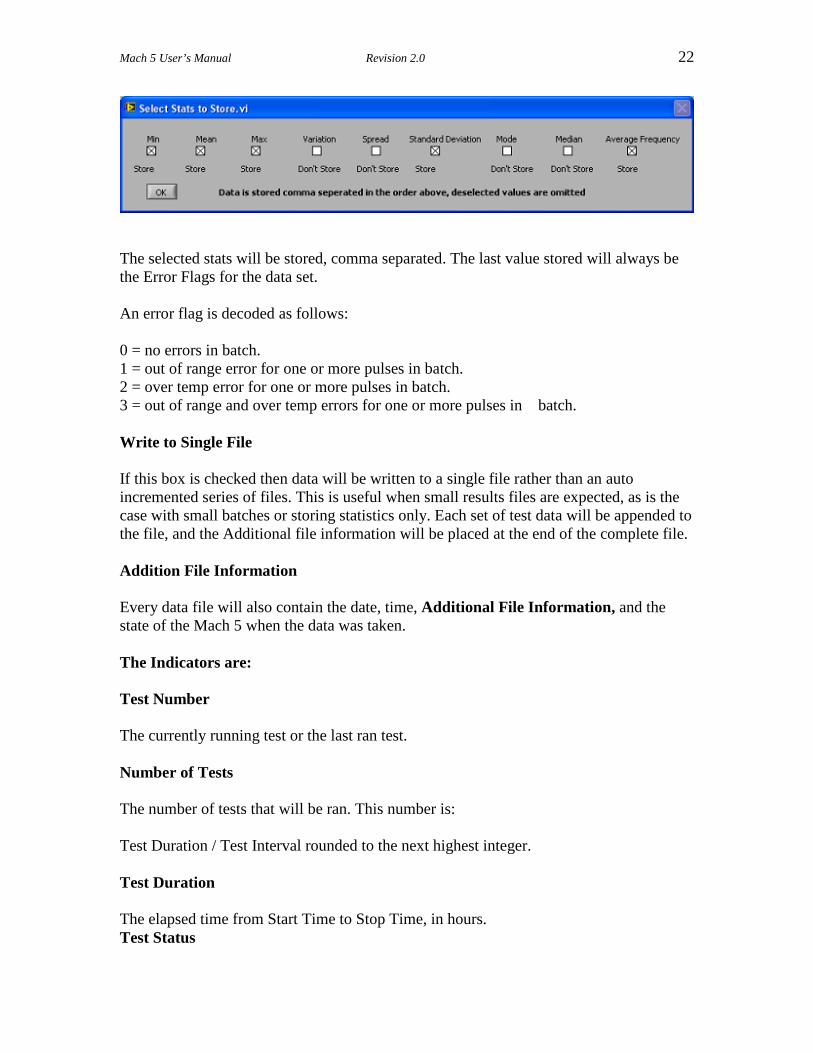
The Number of pulses to measure when the instrument is armed. The measured pulse batch data will be written to the test file. Note that the first pulse in the batch after an arm is always discarded by the Mach 5. (See the Measuring Data Section) If the laser is free running, this will not be an issue. If the laser is in burst mode, then be sure to set the batch size to 1 less than the burst size. Test Interval How often to measure a batch. For example, you can set up the VI to start at 12:00 AM, stop at 8:00 AM, and measure a batch every hour. The VI will measure the batch size set at 12:00 AM, 1:00 AM, 2:00 AM, 3:00 AM, 4:00 AM, 5:00 AM, 6:00 AM, and 7:00 AM. Be sure that you have made a reasonable setup. If you have a test interval of a few seconds, the individual tests will not have time to run before the next test is called. Note that in this case the tests will still run in the proper sequence and will be executed as fast as possible. Start Time When to start the first test. Must be less than Stop Time and greater than the current time. Stop Time When to stop the last test. Must be greater than Start Time and greater than the current time. Additional File Information Enter notes and other information you wish to be appended to each of the test files in the set. This information can be updated in between tests, but do not update this while a test is active. Store Raw Data Store the raw pulse data. Each pulse will be stored, with its time stamp, its temperature, and the error flag. Store Statistics If this box is checked then statistics on each batch will be stored in the data file(s). The stored values are selected by the user. When this box is checked, the following Stats Selection Menu will appear:
Mach 5 User’s Manual Revision 2.0 22
The selected stats will be stored, comma separated. The last value stored will always be the Error Flags for the data set. An error flag is decoded as follows: 0 = no errors in batch. 1 = out of range error for one or more pulses in batch. 2 = over temp error for one or more pulses in batch. 3 = out of range and over temp errors for one or more pulses in batch. Write to Single File If this box is checked then data will be written to a single file rather than an auto incremented series of files. This is useful when small results files are expected, as is the case with small batches or storing statistics only. Each set of test data will be appended to the file, and the Additional file information will be placed at the end of the complete file. Addition File Information Every data file will also contain the date, time, Additional File Information, and the state of the Mach 5 when the data was taken. The Indicators are: Test Number The currently running test or the last ran test. Number of Tests The number of tests that will be ran. This number is: Test Duration / Test Interval rounded to the next highest integer. Test Duration The elapsed time from Start Time to Stop Time, in hours. Test Status

Mach 5 User’s Manual Revision 2.0 23
The current status of the running test sequence. Data File The last data file that was written to. Statistics Strip Chart A running display of the data sets statistics, as well as any error conditions in the current data set. The chart may be auto scaled, but the auto scale will not occur until a new data set is plotted.
Also included are the range and trigger status of the instrument during the test. These parameters cannot be changed during a life test. Save Instrument Setup Saves the current instrument settings for recall. Recall Instrument Setup

Mach 5 User’s Manual Revision 2.0 24
Recalls a saved instrument setup. Statistics Colors Calls a VI that allows custom colors to be set for the Statistics indicators. These colors are persistent until changed by the user.
File Path The path and name of the currently open data file. USB Active Illuminates whenever the application detects a Mach 5 instrument has been plugged into the USB. Mach 5 Found Whenever the application detects a Mach 5 instrument has been plugged into the USB, it queries it for its identification. If the response is correct, this LED illuminates. Initialization Complete Whenever the application detects a Mach 5 instrument has been plugged into the USB, it

Mach 5 User’s Manual Revision 2.0 25
initializes the GUI and the instrument based on the instrument setup and the probe in use. When the initialization is complete, this LED illuminates. The Applications Software Menu Menu Items There are 2 menus on the applications software, File, and Help. The File Menu has 5sub items: Open Data File, Copy Data File to Displays, Copy Display Data to File, Close Data File, and Exit. Open Data file opens a saved data file. The file path will be displayed in the file path indicator. Copy Data File to Displays copies the contents of the currently open data file to the application displays. Copy Display Data to File copies the currently displayed data to a data file. The user will be prompted to choose the destination file. Close Data file closes the currently open data file. The file path will be removed from the file path indicator. Exit stops the application and exits the program. Any open files are closed. The Help Menu has 3 sub items: Show Context Help, Help, and About. Show Context Help turns on context sensitive help. Placing the mouse cursor over an item on the GUI will cause a help window to appear for that item if this control is On. Setting the control to Off closes the help window. Call Help File calls a Compiled Help File. About calls information about the software. The Strip Chart Display Figure 4 shows the Strip Chart Display of the Applications Software.

Mach 5 User’s Manual Revision 2.0 26
Figure 4, Strip Chart Display The functions of the controls or indicators are: Energy Plot A strip chart of the retrieved data set, if the target has been set to display, or if a data file has been copied into the displays. The trend (slope) of the data is also plotted. Variation Variation is defined as (Max - Min) / Mean. Trend Slope The slope of the data trend line. Auto Scale Auto Scales the Y axis of the strip chart. Normalize to Mean Plots the data as data / mean.
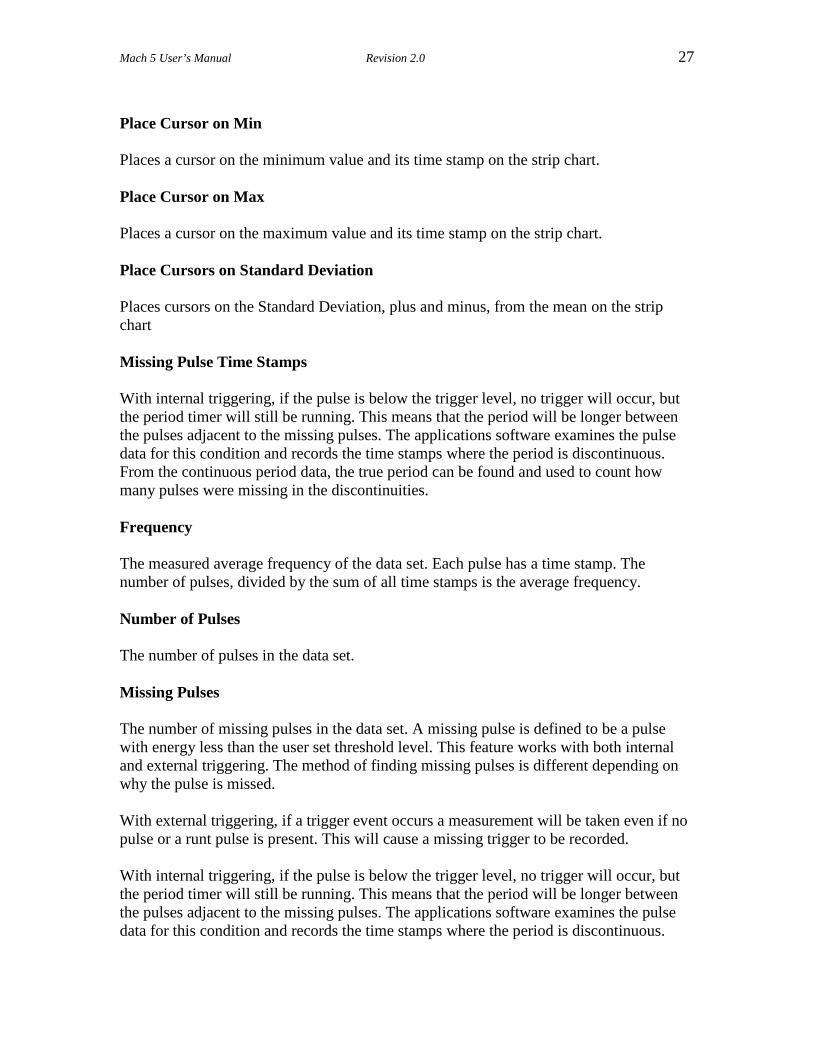
Mach 5 User’s Manual Revision 2.0 27
Place Cursor on Min Places a cursor on the minimum value and its time stamp on the strip chart. Place Cursor on Max Places a cursor on the maximum value and its time stamp on the strip chart. Place Cursors on Standard Deviation Places cursors on the Standard Deviation, plus and minus, from the mean on the strip chart Missing Pulse Time Stamps With internal triggering, if the pulse is below the trigger level, no trigger will occur, but the period timer will still be running. This means that the period will be longer between the pulses adjacent to the missing pulses. The applications software examines the pulse data for this condition and records the time stamps where the period is discontinuous. From the continuous period data, the true period can be found and used to count how many pulses were missing in the discontinuities. Frequency The measured average frequency of the data set. Each pulse has a time stamp. The number of pulses, divided by the sum of all time stamps is the average frequency. Number of Pulses The number of pulses in the data set. Missing Pulses The number of missing pulses in the data set. A missing pulse is defined to be a pulse with energy less than the user set threshold level. This feature works with both internal and external triggering. The method of finding missing pulses is different depending on why the pulse is missed. With external triggering, if a trigger event occurs a measurement will be taken even if no pulse or a runt pulse is present. This will cause a missing trigger to be recorded. With internal triggering, if the pulse is below the trigger level, no trigger will occur, but the period timer will still be running. This means that the period will be longer between the pulses adjacent to the missing pulses. The applications software examines the pulse data for this condition and records the time stamps where the period is discontinuous.

Mach 5 User’s Manual Revision 2.0 28
From the continuous period data, the true period can be found and used to count how many pulses were missing in the discontinuities. Min The minimum pulse energy in the data set. Max The maximum pulse energy in the data set. Mean The mean pulse energy in the data set. Spread Spread is defined as: (max - min) / (max + min) Standard Deviation The standard deviation of the pulse energy in the data set. This can be interpreted as the RMS noise. Standard Deviation and Variance Details: The VI calculates the output values using the following equations. n - 1 µ = SUM [ Xi / n ] i = 0 where µ is mean and n is the number of elements in X. standard deviation = Q^2 n - 1 Q^2 = SUM [ ( Xi - µ)^2 /( n - 1) ] i = 0 where Q is variance, µ is mean. The Histogram Display Figure 5 shows the Histogram Display of the Applications Software.

Mach 5 User’s Manual Revision 2.0 29
Figure 5, Histogram Display The functions of the controls or indicators are: Number of Bins Number of bins to be used to calculate the histogram. Histogram Plot Histogram of the measured pulse energies in the sample buffer. The Gaussian fit to the data is plotted as well. The statistics are shown on this display as well. See the Strip Chart section for their description. The Statistics Display Figure 6 shows the Statistics Display of the Applications Software.

Mach 5 User’s Manual Revision 2.0 30
Figure 6, Statistics Display The functions of the controls or indicators are: Display STDEV Divided by Mean Displays the standard deviation as: Standard Deviation / Mean Display Fluence Displays the statistics as Fluence, J/cm^2. Display Average Power Displays the statistics as Average Power. This is calculated as Watts = Joules x Frequency. Min The minimum pulse energy in the data set. Max

Mach 5 User’s Manual Revision 2.0 31
The maximum pulse energy in the data set. Mean The mean pulse energy in the data set. Spread Spread is defined as: (max - min) / (max + min) Median Finds the median value of the pulse energy data by sorting the values of pulse energy and selecting the middle element(s) of the sorted array. Standard Deviation The standard deviation of the pulse energy in the data set. This can be interpreted as the RMS noise. Standard Deviation and Variance Details: The VI calculates the output values using the following equations. n - 1 µ = SUM [Xi / n] i = 0 Where µ is mean and n is the number of elements in X. Standard deviation = Q2 n - 1 Q^2 = SUM [(Xi - µ)^2 /( n - 1) ] i = 0 Where Q is variance, µ is mean. Mode Mode is the most frequently occurring value in a sequence of numbers. For example, if the input sequence is X = {0, 1, 3, 3, 4, 4, 4, 5, 5, 7},

Mach 5 User’s Manual Revision 2.0 32
the mode of X is 4 because that is the value that most often occurs in X. Pulses Below Threshold When the Search Data for Missing Pulses button is pressed, the current data set is examined. Any pulses with energy less than the threshold are flagged as missing, and their time stamps are recorded and displayed. This can be used with internal and external triggering, but it is most effective when used with external triggering. Pulses Below Trigger With internal triggering, if the pulse is below the trigger level, no trigger will occur, but the period timer will still be running. This means that the period will be longer between the pulses adjacent to the missing pulses. The applications software examines the pulse data for this condition and records the time stamps where the period is discontinuous. From the continuous period data, the true period can be found and used to count how many pulses were missing in the discontinuities. Average Frequency The measured average frequency of the data set. Pulse Jitter The difference between the maximum and minimum pulse periods in the data set. The FFT Display Figure 7 shows the FFT Display of the Applications Software. This is useful for finding periodic disturbances in the data.

Mach 5 User’s Manual Revision 2.0 33
Figure 7, FFT Display The function of the controls and indicators are: Remove DC Component Removes the DC component from the FFT. This control must be set before reading the data from the instrument or a saved data file. Unwrap Phase Unwrap Phase, when set to TRUE, enables phase unwrapping on the output phase Amplitude Spectrum Phase. The Probe Data Display Figure 8 shows the Probe Data Display of the Applications Software.

Mach 5 User’s Manual Revision 2.0 34
Figure 8, Probe Data Display The functions of the controls or indicators are: Wavelength Correction Factor The responsivity correction factor that corresponds to the wavelength response of the sensor. Note that this is only active when wavelength is on and the set wavelength is different than the calibration wavelength. Calibration Wavelength The wavelength of the laser used to calibrate the sensor. Calibration Temperature The temperature of the sensor at calibration. Temperature Coefficient The temperature coefficient of the sensor. This is used in the temperature correction algorithm. Responsivity

Mach 5 User’s Manual Revision 2.0 35
The responsivity of the sensor at the calibration wavelength and temperature. Log Wavelength Scale Toggles the wavelength axis of the absorption plot between log and linear scale. % Absorption Plot The absorption curve of the sensor versus wavelength. This data is used along with the calibration wavelength and the user's laser wavelength to calculate the wavelength correction factor. Max Energy Reading (J) The maximum energy that the instrument can read before the internal circuitry is saturated. The instrument ranges are fixed in decade intervals, so if the maximum energy is 15mJ, the maximum available range will be 20mJ, but the instrument will only read up to 15mJ in that range. Note that the maximum energy is dependent on the sensor responsivity. Since the sensor responsivity varies with wavelength, turning Wavelength Compensation on may cause a rescale of the available ranges. If this occurs, the maximum energy will also change. User Probe Cal This control calls a VI that allows the user to set a specific wavelength response for the probe in use. The response will be stored in the probe memory. This allows for a user calibration of desired wavelengths. Wavelength Correction must be set to ON for this VI to work correctly. Make sure the instrument is correctly set up for measurements and is triggered before calling this VI. Use the Live Mode if necessary to ensure this.

Mach 5 User’s Manual Revision 2.0 36
The Controls are: Measured Average Power Enter the measured average power from your Power Meter Here. Mach 5 will use this to compute a new calibration factor for the wavelength in use and store it in the probe in use. Read Average Power From Mach 5 Arms the instrument for a data gathering run, takes the measurement batch and then extracts the Energy and Frequency to use in calculating the average power. Calculate Probe Response and Send to Probe Reads the current probe wavelength response curve, calculates the new response point from the data, then writes the new calculated Probe Response to the Probe memory. After the probe EPROM is written, Mach 5 will be reset to ensure the new data is correctly read from the probe. Load a Default Probe Response Write a selectable default Probe Response to the Probe memory.

Mach 5 User’s Manual Revision 2.0 37
After the probe EPROM is written, Mach 5 will be reset to ensure the new data is correctly read from the probe. Exit Exits the VI and returns to the main display. The new probe response table will be stored and used until a new one is written by the user. It is persistent over a power down. The Indicators are: Wavelength (nm) Wavelength in nm. Mach 5 will use this to determine the probe wavelength response index for the new calibration factor for the wavelength in use. Probe Response (%) The calculated probe response at the wavelength in use. The VI uses the measured power from the user input and the measured power from Mach 5 to calculate the new response point. It then uses the new response and the selected wavelength to write the new point into the probe EPROM. Energy (J) The mean pulse energy in the data set. Average Frequency (Hz) The measured average frequency of the data set. Computed Average Power (W) Average Power = Frequency x Energy. Operating Mach 5 with the Applications Software Plug the power supply and probe into the Mach 5 instrument. Start the application software. The software will set itself to the Instrument Control Tab and initialize contact with the instrument. It will then set itself to the Probe Data tab and read the required information from the probe. The software will then configure itself for the ranges appropriate to the probe and illuminate the Initialization Complete LED. The system is now ready for use.

Mach 5 User’s Manual Revision 2.0 38
Getting Ready to Measure Data The Mach 5 instrument and applications software provide a versatile high speed measurement system. It must be properly set up to work well. The following sections discuss the controls that set up the instrument for measuring data. Range Setting The available ranges are dictated by the probe in use. Use the range control to set the range to a value appropriate for the expected energy. Note that energy values above the range value can be measured, but accuracy may be reduced. In general, the smallest range that will contain the expected energy should be used, i.e., if the maximum energy to be measure is 189μJ, the use the 200μJ range. Note that this energy can be measured in the 2mJ range with a trigger level below 9%, or an external trigger, but more accurate results will be obtained in the 200μJ range. Trigger Level Setting If internal trigger is used, then the trigger level is set to a value that is less that the lowest expected energy. For example, energies from 1.8mJ to 15mJ are expected. Select the 20mJ range, and set the trigger level to less than 1.8 / 20 x 100 = 9 %. You may have to experiment with the trigger level until the trigger LED illuminates. Trigger Source Setting The trigger source can be set to internal or external. Internal trigger generates a trigger event whenever the pulse exceeds the trigger level. External triggering generates a trigger even whenever a TTL pulse is received on the External trigger input. A measurement is taken when a trigger even is generated, so with external triggering missing or runt pulses can be discovered. Trigger Polarity (Slope) Setting In external trigger mode, the rising or falling edge of the TTL pulse may be selected as the trigger event. Trigger Delay Setting The Mach 5 instrument samples the pulse being measured to determine the pulse energy. In order to accurately measure the energy, the trigger event must be temporally aligned with the pulse. This alignment is accomplished by setting the trigger delay. For internal triggering, the delay is set to the default value of 0ns and the user need not do anything. When set to internal triggering the instrument compares the amplitude of each pulse from the sensor to the set trigger level. If the pulse amplitude exceeds the set trigger level, then

Mach 5 User’s Manual Revision 2.0 39
a trigger is generated by the instrument. For external triggers, if the TTL trigger occurs within less than 100ns of the emission of a laser pulse, then the default value will suffice. If used with external trigger, the timing relationship between the external TTL trigger and the laser firing event can be accounted for by setting the delay appropriately. The available range is -932ns to 2863ns. The figure below shows an external trigger pulse and the analog out from the Mach 5 measured on an oscilloscope.
If the trigger is set to external, with a rising edge polarity, then the temporal relationship between the rising edge of the trigger trace and the rising edge of the pulse trace must be known. The figure below is the same as above with the time base expanded and a set of cursors turned on.
The delay is seen to be approximately 300ns. This will be the trigger delay setting. The delay to the falling edge of the trigger pulse is -1250ns. Since the range of delay is -932ns to 2863ns, setting the polarity to falling edge would result in inaccurate measurements.

Mach 5 User’s Manual Revision 2.0 40
Note that when the instrument is set back to internal trigger, the polarity is reset to rising edge, and the trigger delay is reset to 0ns. Trigger Level Tracking Setting This applies to Internal Trigger Mode only. Since the Mach 5 uses a hardware trigger, with a Pyroelectric probe the pulse that creates the trigger exhibits a DC drift, the trigger level will appear to shift in relation to the pulse. At low duty cycle, the pulse baseline will be stable and triggers will occur as intended. With high duty cycles the pulse will drift negative. If this drift is greater than the set trigger level the instrument will stop triggering and miss pulses. To prevent this, the trigger level must be corrected as the pulse baseline drifts. Trigger Tracking monitors the DC level of the pulse and modifies the trigger level so it remains at the set level in relation to the pulse. When triggering stops or Mach 5 is disarmed, or trigger tracking is turned off, the trigger level returns to its unmodified state. It is possible for the Mach 5 to lose track of the trigger under certain conditions. See figure 8.
Figure 8, Pulse Drift Suppose trigger level tracking is off and a pulse with energy of 21μJ is being measured at a very low repetition rate in the 200μJ range. The trigger level is set to 10%, or 20μJ, so data is being acquired. Now suppose the repetition rate is turned to 100,000pps and the signal drifts negative by 12%. The pulse energy is still 21μJ, but the “peak” of the pulse is now at 18.5μJ. This is below the trigger level and data is now being missed. If trigger

Mach 5 User’s Manual Revision 2.0 41
tracking had been turned on, the trigger level would have followed the pulse as it drifted and no data would have been lost. Now suppose in the previous example trigger tracking had been on. The trigger level would have followed the pulse down as it drifted 12%. If the Mach 5 is then disarmed, but the laser is left running at the same repletion rate, the pulse will stay at the same level, but the trigger will return to its non corrected state. When Mach 5 is disarmed, no measurements are being taken and therefore no information about the pulse drift is available to use for trigger tracking. When Mach 5 is rearmed, no triggers will occur as the trigger level is still too high relative to the drifted pulse. The solution to this is to readjust the trigger until the trigger LED illuminates, to use the Zero Baseline button, or to press the Autoset button. Zero Baseline The DC level of a pulse for a Pyro Electric sensor is dependant on the average energy. If the DC level drifts out of the ADC range and the Out of Range LED illuminates, pressing this button will cause the instrument to readjust the DC level in the instrument to compensate for this drift. Autoset This button calls the Autoset VI. This VI attempts to find the best range and trigger level for the signal being measured. The flow is: 1. Set the trigger source to internal. 2. Set the trigger delay to 0ns. 3. Set trigger level to 7% 4. Set the Range to Top Range. 5. Test for triggering. If no triggers are present, the VI reduces the range to the next lowest and tests for triggering. It repeats this process until the lowest range is reached. If no triggers are present, it then reduces the trigger level 1% at a time until either triggering occurs or the minimum trigger level is reached. When a trigger is found, the VI returns the discovered setup to the Instrument Controls Display. Measuring Data Once range and trigger setting have been made, and the trigger LED is illuminated, then data can be acquired. Press the ARM button. The ARM LED will illuminate indicating that pulses are being measured. The Mach 5 can store 4,194,303 pulses in internal memory. At 100,000 PPS, this is over 40 seconds of data. At 1,000 PPS, this is almost 70

Mach 5 User’s Manual Revision 2.0 42
minutes of data. Pressing the ARM button again stops data acquisition and the pulses are now stored in the Mach 5 memory and are ready to be retrieved and analyzed. If an event occurs during pulse measurement that could potentially corrupt the measurement, then that pulse will be discarded. The significance of this is that the first pulse of a batch taken after an arm is always discarded. Since the arm command is sent asynchronous to the laser pulses, and then the first trigger event after the arm could occur on the tail of the pulse, resulting in a lower measurement than expected. To avoid this case, the Mach 5 will discard this first measurement. In most cases this is not an issue, but if a set number of pulses are being sent by the laser, as in a burst mode, then Mach 5 must be set to a batch size of one less pulse. Retrieving Data Press the Read Pulse Memory Button. This control calls a user prompt that asks for the pulse offset and the number of pulses to retrieve from pulse storage memory. Once that information is acquired, the pulse memory is read. The destination of the pulse memory is dependant on the state of the Read to File and Read to Display the check boxes. Note that both boxes can be checked. Alternatively, the Auto Read Batch box on the Instrument Controls Tab can be checked. This will cause the entire measured batch to be automatically read into the selected data target, files, displays, or both as soon as the batch is taken. The pulse memory is capable of storing up to 4,194,303 pulses. This is a large volume of data and it can be time consuming to retrieve all of it at once. The pulse offset and number of pulses to retrieve controls make this manageable. As an example, suppose there are 2 million pulses in the memory. The user can ask for this data in batches of 500,000 pulses at a time in 4 batches: Read 1, pulse offset = 1, number of pulses to retrieve = 500,000 Read 2, pulse offset = 500,001, number of pulses to retrieve = 500,000 Read 3, pulse offset = 1,000,001, number of pulses to retrieve = 500,000 Read 4, pulse offset = 1,500,001, number of pulses to retrieve = 500,000 The response of the application to large pulse batches will depend on the host PC. A test machine with a 2.66GHz dual core processor and 3GB of memory retrieved 500,000 pulses to a data file in 7.9 seconds. The retrieval to the display took 20.9 seconds. The extra time is due to the processing of the large data arrays in the application. Analyzing Data The Mach 5 Applications Software has 4 data analysis displays. There is a strip chart for a visual representation of laser stability. There is a Histogram for a visual representation of the pulse distribution. There is an FFT display that allows the use to look for interference signals in the data. Last, there is a statistics display that computes commonly used statistical measurements.

Mach 5 User’s Manual Revision 2.0 43
Missing Pulses The Mach 5 Applications software is capable of detecting missing pulses in two ways. Missing pulses below a user set threshold. When the Search Data for Missing Pulses button is pressed, the current data set is examined. Any pulses with energy less than the threshold are flagged as missing, and there time stamps are recorded and displayed. This can be used with internal and external triggering, but it is most effective when used with external triggering. Missing pulses due to missing time stamps. With internal triggering, if the pulse is below the trigger level, no trigger will occur, but the period timer will still be running. This means that the period will be longer by at least 2x ± the frequency stability of the laser between the pulses adjacent to the missing pulses. The applications software examines the pulse data for this condition and records the time stamps where the period is discontinuous. From the continuous period data, the true period can be found and used to count how many pulses were missing in the discontinuities. The % Frequency Stability Threshold setting determines how much time stamp mismatch is allowed when measuring the true frequency. Other data analysis may be performed by importing the saved data files into a software package such as MathCad. Data Correction The Mach 5 system is capable of correcting data for wavelength and temperature variation from the calibration values. Both of these corrections can be disabled if so desired. Wavelength Correction Wavelength correction is done in the Mach 5 instrument. When a wavelength different from the calibration value is selected, the internal gains of the instrument are changed to normalize the response of the probe to the calibration wavelength. Since the sensor responsivity can vary significantly with wavelength, turning Wavelength Compensation on may cause a rescale of the available ranges. If this occurs, the instrument will set itself to the currently set range if it is still available. If it is not, the instrument will set itself to the next available range.

Mach 5 User’s Manual Revision 2.0 44
The response of the probe is stored in the probe memory and is read when the Mach 5 is powered on. It is plotted on the Probe Data display Temperature Correction Temperature correction is done in the Mach 5 Application Software. When a temperature different from the calibration value is selected, the software computes the correction factor based on the responsivity temperature coefficient and the variation form the calibration value. Since temperature induced variations are typically a few percent or less, no gain rescaling is needed to adequately compensate the measurements. Pulse Memory Mach 5 contains an internal memory for storing measured pulse data. Due to the high repetition rate that Mach 5 can measure, there is no real time display. Data is retrieved from pulse memory after it has been acquired and displayed using the Applications Software. The internal memory can be read to either the displays, to a file, or both. Reading the pulse memory does not remove the data from the memory. The same data can be read multiple times if desired. Data will be lost if:
1. The memory is tested. The memory test writes patterns to the pulse memory and then verifies those patterns. Any stored test data will be overwritten. Requesting a memory test will cause the software to prompt the user to ensure this is the intended action.
2. The memory is cleared. The memory clear writes zeros to the pulse memory. Any stored test data will be overwritten. Requesting a memory clear will cause the software to prompt the user to ensure this is the intended action.
3. The Mach 5 is powered down. The pulse memory is SDRAM and is a volatile memory.
File Management After data has been acquired, it may be saved to an external file for later analysis, either by the Applications Software or some other software package of the users’ choice. The Applications Software can open, close, and copy an open file to the Applications Software displays. Obtaining Help There is context sensitive help available by selecting the Show Context Help item in the help menu. A help window will appear when the mouse cursor is placed over a control or indicator. There is a compiled help file that can be called by selecting the Help item in the help menu.

Mach 5 User’s Manual Revision 2.0 45
Instrument Specifications
Power Supply 9V-15V at 1A Dimensions (inches) 6.56 x 6.67 x 2.19 Indicators Power, Trigger, Buffer Full,
Over Temp, Armed, Out of Range External Trigger Optically Coupled TTL External Trigger Slope Selectable, positive or negative Internal Trigger Selectable, 2% to 20% of full scale in 1%
increments. Internal Trigger Accuracy ±10% of the set level. Trigger Delay Selectable, 38ns to 3825ns, 15ns
increments. Ranges Probe Dependant, See probe specifications Accuracy, Energy Measurement ±1% of full scale Instrument, ±2% of full
scale Instrument and Probe Resolution, Energy Measurement 1 part in 2000 Linearity, Energy Measurement ±1% Accuracy, PPS Measurement ±1% of reading Resolution, PPS Measurement 1pps to 10,000pps, < 1Hz
10,000pp to 50,000pps, < 20Hz 50,000pps to 200,000pps, < 80Hz
Input Impedance 10KΩ Analog Output Full Scale 3.00Vpp Analog Output Impedance 100Ω Temperature Compensation Range 15°C to 65°C, User can disable Wavelength Compensation Range Probe Dependant, User can disable

Mach 5 User’s Manual Revision 2.0 46
Recycling and separation procedure. This section is used by the recycling center when the monitor is at the end of its life. Breaking the calibration seal or opening the monitor will void the Monitor warranty. The complete Monitor contains 1 Monitor 1 USB cable 1 Instruction manual 1 Calibration certificate 1 Software cdrom 7.8.1 Separation: Paper: Manual and certificate Aluminum: Monitor enclosure. Printed circuit board: inside the monitor.
7.8.2 Dismantling procedure:
To open the monitor:
Remove all the screws on both sides of the monitor:
Remove the PCB by sliding it out of the enclosure.
Mach 5 User’s Manual Revision 2.0 47
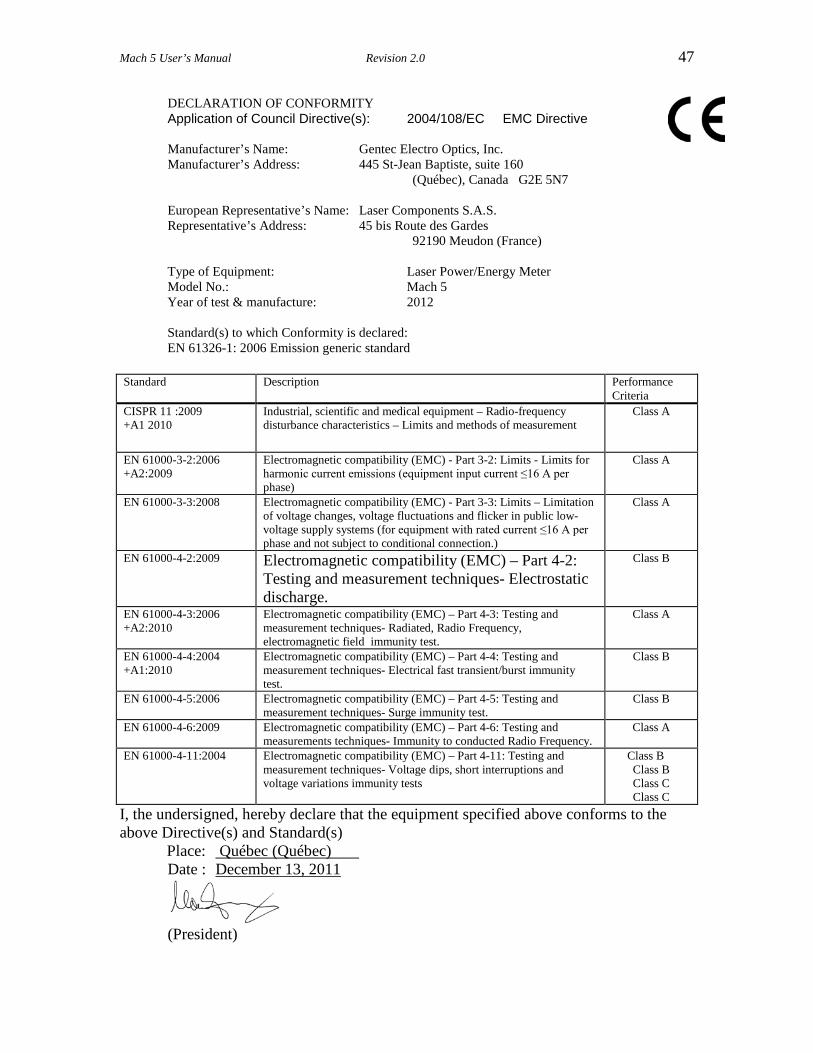
DECLARATION OF CONFORMITY Application of Council Directive(s): 2004/108/EC EMC Directive Manufacturer’s Name: Gentec Electro Optics, Inc. Manufacturer’s Address: 445 St-Jean Baptiste, suite 160
(Québec), Canada G2E 5N7 European Representative’s Name: Laser Components S.A.S. Representative’s Address: 45 bis Route des Gardes
92190 Meudon (France) Type of Equipment: Laser Power/Energy Meter Model No.: Mach 5 Year of test & manufacture: 2012
Standard(s) to which Conformity is declared: EN 61326-1: 2006 Emission generic standard
Standard Description Performance Criteria
CISPR 11 :2009 +A1 2010
Industrial, scientific and medical equipment – Radio-frequency disturbance characteristics – Limits and methods of measurement
Class A
EN 61000-3-2:2006 +A2:2009
Electromagnetic compatibility (EMC) - Part 3-2: Limits - Limits for harmonic current emissions (equipment input current ≤16 A per phase)
Class A
EN 61000-3-3:2008
Electromagnetic compatibility (EMC) - Part 3-3: Limits – Limitation of voltage changes, voltage fluctuations and flicker in public low-voltage supply systems (for equipment with rated current ≤16 A per phase and not subject to conditional connection.)
Class A
EN 61000-4-2:2009
Electromagnetic compatibility (EMC) – Part 4-2: Testing and measurement techniques- Electrostatic discharge.
Class B
EN 61000-4-3:2006 +A2:2010
Electromagnetic compatibility (EMC) – Part 4-3: Testing and measurement techniques- Radiated, Radio Frequency, electromagnetic field immunity test.
Class A
EN 61000-4-4:2004 +A1:2010
Electromagnetic compatibility (EMC) – Part 4-4: Testing and measurement techniques- Electrical fast transient/burst immunity test.
Class B
EN 61000-4-5:2006 Electromagnetic compatibility (EMC) – Part 4-5: Testing and measurement techniques- Surge immunity test.
Class B
EN 61000-4-6:2009
Electromagnetic compatibility (EMC) – Part 4-6: Testing and measurements techniques- Immunity to conducted Radio Frequency.
Class A
EN 61000-4-11:2004 Electromagnetic compatibility (EMC) – Part 4-11: Testing and measurement techniques- Voltage dips, short interruptions and voltage variations immunity tests
Class B Class B Class C Class C
I, the undersigned, hereby declare that the equipment specified above conforms to the above Directive(s) and Standard(s)
Place: Québec (Québec) Date : December 13, 2011
(President)

Mach 5 User’s Manual Revision 2.0 48