Embed Size (px)
Citation preview


DOCTORAL THESES IN FOOD SCIENCES AT THE UNIVERSITY OF TURKU Food Chemistry
NMR Metabolomics of Foods – Investigating the Influence of Origin on Sea Buckthorn Berries, Brassica Oilseeds and
Honey
MAARIA KORTESNIEMI
Food Chemistry and Food Development Department of Biochemistry
TURKU, FINLAND – 2016

Food Chemistry and Food Development Department of Biochemistry University of Turku, Finland Supervised by
Professor emeritus Heikki Kallio, Ph.D. Professor Baoru Yang, Ph.D. Department of Biochemistry Department of Biochemistry University of Turku University of Turku Turku, Finland Turku, Finland
Adjunct professor Jari Sinkkonen, Ph.D. Department of Chemistry University of Turku Turku, Finland
Reviewed by Professor Francisco A. Tomás-Barberán, Ph.D. Department of Food Science and Technology CEBAS-CSIC Murcia, Spain
Professor emeritus Robert Verpoorte, Ph.D. Institute of Biology Leiden University Leiden, the Netherlands
Opponent Professor Hanne Christine S. Bertram, Ph.D. Department of Food Science Aarhus University Årslev, Denmark
Research director Professor Baoru Yang, Ph.D. Department of Biochemistry University of Turku Turku, Finland
The originality of this dissertation has been checked in accordance with the University of Turku quality assurance system using the Turnitin OriginalityCheck service
ISBN 978-952-93-8154-8 (print) ISBN 978-952-93-8155-5 (PDF) ISSN 2323-9395 (print) ISSN 2323-9409 (pdf) Painosalama Oy – Turku, Finland 2016


Table of Contents
TABLE OF CONTENTS
ABSTRACT ........................................................................................................ i
SUOMENKIELINEN ABSTRAKTI ............................................................. iii
LIST OF ABBREVIATIONS ........................................................................... v
LIST OF ORIGINAL PUBLICATIONS ...................................................... vii
1 INTRODUCTION......................................................................................... 1
2 REVIEW OF THE LITERATURE ............................................................ 4 The effect of origin and related factors on food composition
and quality ..................................................................................... 4 Genotype and phenotype .................................................... 4 Geographical origin ............................................................ 6 Abiotic stress ...................................................................... 8 Temporal variation ........................................................... 11
Sea buckthorn berries .................................................................. 12 Seeds of oilseed rape and turnip rape .......................................... 15 Honey .......................................................................................... 18 Nuclear magnetic resonance in food and agriculture .................. 20
Nuclear magnetic resonance (NMR) spectroscopy .......... 20 Data pre-processing .......................................................... 24 Multivariate data analysis ................................................ 27 Metabolomics ................................................................... 29
Summary ..................................................................................... 40
3 AIMS OF THE STUDY ............................................................................. 42
4 MATERIALS AND METHODS ............................................................... 43 Samples ....................................................................................... 43
Sea buckthorn berries ....................................................... 43 4.1.1.1 Wild sea buckthorn ........................................... 43 4.1.1.2 Cultivated sea buckthorn ................................... 44
Brassica oilseeds .............................................................. 45 4.1.2.1 Ripened seeds .................................................... 45 4.1.2.2 Developing seeds .............................................. 46
Honey ............................................................................... 46 Methods ....................................................................................... 47

Table of Contents
Sample preparation ........................................................... 47 Nuclear magnetic resonance (NMR) spectroscopy .......... 48 Spectral processing ........................................................... 48 Origin-related background information ........................... 49
4.2.5.1 Meteorological data (crops) .............................. 49 4.2.5.2 Melissopalynological analysis (honey) ............. 50
Statistics and multivariate data analysis ........................... 50
5 RESULTS AND DISCUSSION ................................................................. 52 NMR metabolomics reveals the phenotypic plasticity in sea
buckthorn berry composition in respect to genotype × environment interaction .............................................................. 52
Wild sea buckthorn berries ............................................... 52 Cultivars 'Terhi' and 'Tytti' ............................................... 55
The influence of genotype, growth conditions and developmental stage on Brassica oilseeds .................................. 56
Ripened seeds ................................................................... 56 Developing seeds .............................................................. 58
Botanical origin of honey is elucidated by NMR fingerprints and multivariate modelling ......................................................... 60
6 SUMMARY AND CONCLUSION ........................................................... 64
ACKNOWLEDGEMENTS.............................................................................66
APPENDIX: ORIGINAL PUBLICATIONS ................................................85


Abstract
i
ABSTRACT
The origin of foods plays an important role in their metabolome (the set of compounds present as products of metabolic events). The compositions of food plants are inevitably determined by a number of inherent and external factors – most importantly by the genotype (species, subspecies, cultivar, variety) and the prevailing conditions and weather parameters at each growth environment. The declaration of food origin can be defined and protected by law. The constantly increasing consumer awareness towards food origin, authenticity and quality has set the need for efficient tools for their verification. Metabolomics based on nuclear magnetic resonance (NMR) spectroscopy is increasingly being applied in analysing food composition and quality and in detecting food frauds and adulterations.
The aim of the current work was to determine the influence of origin-related variables in food composition and quality by using 1H NMR metabolomics. The model foods – sea buckthorn (Hippophaë rhamnoides) berries, oilseeds of Brassica spp. and varietal honey – represent different foods with special sensory, nutritional, bioactive, commercial and national significance. The sea buckthorn berry metabolites were investigated in respect to the genotype (subspecies, cultivar) and geographical origin, with special emphasis on the influence of northern latitudes and related conditions. In the oilseeds, the inter-species variation and the influence of environmental and developmental stage on the seed composition was investigated. NMR profiling was applied in characterising the marker compounds for different honey types for botanical authentication. Multivariate analysis methods such as principal component (PCA) and discriminant analyses (PLS-DA, OPLS-DA) were applied in every sub-study to determine the key metabolites and origin-related factors characterising the food samples.
The sea buckthorn subspecies were mainly distinguished by the relatively high content of ethyl-β-D-glucopyranoside (ssp. rhamnoides) and malic acid and vitamin C (ssp. sinensis). The northern latitude and respective conditions (the length of growth season, temperature, radiation and precipitation) was shown to alter the chemical composition of berries of the same genetic origin. In subarctic latitudes, the berries formed more ascorbic acid while the levels of ethyl glucose remained relatively low. The berries of cultivar 'Tytti' contained more ethyl glucoside while the berries of 'Terhi' contained more quinic acid in comparison. Calculated from the start of the growing season until harvest, the effective temperature sum (degree days) and the radiation sum correlated positively with ethyl glucoside that accumulated up to six-fold in overripe berries in southern Finland. The sea buckthorn berries (ssp. sinensis) grown at over 2000 m altitude contained typically more ascorbic and malic acids.

Abstract
ii
The seeds of turnip rape was characterised by a relatively higher sucrose and polyunsaturated fatty acid content over oilseed rape that had a higher content of sinapine and oil in general. Growth conditions with reduced temperature added to the level of unsaturation in the oilseed lipids and delayed the seed development.
The varietal honeys were classified with the aid of NMR profiling, as the typical sugar composition and other botanical markers were characterised. Also, previously unreported markers were designated for dandelion honeys.
The correlations between complex food metabolomes and the origin-related variables were easily accomplished with NMR metabolomics. Especially, the effect of northern conditions on the growth place-dependent compositional flexibility (phenotypic plasticity) of the plant foods was deemed considerable. The results of this thesis can be further used to determine food quality, origin and authenticity and as an aid in plant breeding operations.

Abstract
iii
SUOMENKIELINEN ABSTRAKTI
Alkuperällä on suuri vaikutus elintarvikkeen metabolomiin eli aineenvaihduntatuotteiden kokonaisuuteen. Erityisesti kasviperäisten elintarvikkeiden koostumukseen vaikuttavat lukuisat sisäiset ja ulkoiset alkuperään liittyvät tekijät, kuten perimä (laji, alalaji, lajike) ja kasvupaikalle tyypilliset ympäristö- ja sääolosuhteet. Elintarvikkeen alkuperä voidaan määritellä ja suojata lainsäädännöllisin perustein. Kuluttajien kasvanut kiinnostus ja tietämys elintarvikkeiden alkuperää, aitoutta ja laatua kohtaan on lisännyt tehokkaiden ja luotettavien laadunvarmistusmenetelmien tarvetta. Varsinkin ydinmagneettista resonanssispektroskopiaan (NMR) perustuvaa metabolomiikkatutkimusta hyödynnetään yhä useammin elintarvikkeiden koostumuksen, laadun ja aitouden analysoinnissa. Tämän tutkimuksen tarkoituksena oli selvittää alkuperän vaikutusta tyrnimarjojen (Hippophaë rhamnoides), rypsin- ja rapsinsiementen (Brassica spp.) sekä lajihunajan koostumukseen 1H-NMR-metabolomiikan avulla. Nämä elintarvikkeet ovat kansallisesti ja kaupallisesti arvokkaita ja mielenkiintoisia niille tyypillisten aistittavien, ravitsemuksellisten ja bioaktiivisten ominaisuuksien ansiosta.
Tyrnimarjojen koostumusta vertailtiin eri alalajien (ssp. rhamnoides ja ssp. sinensis) ja lajikkeiden ('Terhi' ja 'Tytti') sekä kasvupaikkojen (Suomi, Kiina, Kanada) välillä. Tavoitteena oli erityisesti selvittää, miten erityisesti pohjoisille leveysasteille tyypilliset olosuhteet vaikuttavat marjojen aineenvaihdunta-tuotteisiin. Öljysiementen kohdalla tutkittiin myös miten lajikohtainen perimä sekä kasvupaikan/-olosuhteiden ja siemenen kehittymisvaihe vaikuttavat siementen kemialliseen koostumukseen ja laatuun. Hunajien tapauksessa NMR-metabolomiikkaa hyödynnettiin kasvialkuperäkohtaisten sormenjälki-yhdisteiden tunnistamiseen ja kotimaisten lajihunajien kasvialkuperän varmentamiseen. Kaikissa osatutkimuksissa sovellettiin pääkomponentti- (PCA) ja diskriminanttianalyysiin (PLS-DA, OPLS-DA) perustuvia monimuuttujamenetelmiä tärkeimpien näyteryhmiä erottavien ja määrittävien yhdisteiden ja taustatekijöiden selvittämiseksi.
Tyrnin alalajit erottuivat pääasiassa suhteellisesti korkean etyyli-β-D-glukopyranosidin (ssp. rhamnoides) sekä omenahappo- ja C-vitamiini-pitoisuuden (ssp. sinensis) perusteella. Pohjoisen leveysasteen ja sille tyypillisten olosuhteiden (kasvukauden pituus, lämpötila, säteily, sademäärä) todettiin muokanneen samaa geneettistä alkuperää olevien marjojen kemiallista koostumusta. Subarktisilla leveyksillä tyrnimarjaan muodostui enemmän askorbiinihappoa ja etyyliglukosidin määrä oli alhainen. 'Tytti'-lajikkeen marjat sisälsivät enemmän etyyliglukosidia, kun taas 'Terhi' sisälsi vastaavasti enemmän kviinihappoa. Kasvukauden tehoisa lämpösumma ja säteilysumma korreloivat positiivisesti etyyliglukosidin kanssa, jota kertyi ylikypsiin
Abstract
iv
marjoihin Etelä-Suomessa jopa kuusinkertainen määrä kypsiin verrattuna. Yli 2000 metrin korkeudessa kasvaneissa tyrnimarjoissa (ssp. sinensis) oli tyypillisesti korkeampi omena- ja askorbiinihappopitoisuus.
Suhteellisesti korkeampi sakkaroosipitoisuus ja monityydyttymättömien rasvahappojen osuus oli tyypillisempää rypsille, kun taas rapsi erottui rypsistä korkeamman öljy- ja sinapiinipitoisuuden perusteella. Kylmempi kasvupaikka lisäsi monityydyttymättömien rasvahappojen osuutta öljysiemenissä ja hidasti siemenen kehittymistä.
NMR-profiloinnin avulla lajihunajat pystyttiin luokittelemaan kullekin hunajalle ominaisen sokerikoostumuksen ja muiden kasvialkuperästä kertovien merkkiyhdisteiden perusteella. Voikukkahunajalle tunnistettiin myös aiemmin raportoimattomia merkkiyhdisteitä.
NMR-metabolomiikan avulla pystyttiin helposti selvittämään monimutkaisten aineenvaihduntatuotteiden kokonaisuuksien ja elintarvikkeen alkuperään liittyvien muuttujien välisiä yhteyksiä. Varsinkin pohjoisten kasvuolosuhteiden vaikutus kasviperäisten elintarvikkeiden koostumukselliseen vaihteluun oli huomattava. Väitöskirjan tuloksia voidaan hyödyntää elintarvikkeiden laadun, alkuperän ja aitouden varmistamisessa sekä kasvinjalostuksen apuna.

List of Abbreviations
v
LIST OF ABBREVIATIONS
1H Proton 13C Carbon-13 Ala Alanine ALA α-Linolenic acid CDCl3 Deuterated chloroform (chloroform-d) CD3OD Deuterated methanol (methanol-d4) COSY Correlation spectroscopy cv. Cultivar d1 Relaxation delay (s) D2O Deuterated water DMSO-d6 Deuterated dimethyl sulfoxide (dimethyl sulfoxide-d6) ds Number of dummy scans DSS 4,4-dimethyl-4-silapentane-1-sulfonic acid FID Free induction decay FT Fourier transform HMBC Heteronuclear multiple-bond correlation HMF Hydroxymethylfurfural HR-MAS High-resolution magic angle spinning HSQC Heteronuclear single-quantum coherence Hz Hertz MHz Megahertz NMR Nuclear magnetic resonance NOESY Nuclear Overhauser effect spectroscopy ns Number of scans OPLS-DA Orthogonal partial least squares discriminant analysis p Loadings matrix PCA Principal component analysis PLS-DA Partial least squares (projection to latent structures)
discriminant analysis ppm Parts per million PUFA Polyunsaturated fatty acid Q2 An estimate of predictive ability Q2(cum) Cumulative Q2 R2 An estimate of goodness of fit R2X Fraction of X variation explained by a component R2X(cum) Cumulative R2X R2Y Fraction of Y variation explained by a component R2Y(cum) Cumulative R2Y RF Radio-frequency

List of Abbreviations
vi
sn Stereospecific numbering S/N Signal-to-noise ratio t Score matrix T Temperature (K/° C) TAG Triacylglycerol TMS Tetramethylsilane TOCSY Total correlation spectroscopy TSP 3-(Trimethylsilyl)propionic-2,2,3,3-d4 acid UV Ultra-violet / unit variance VIP Variable influence on projection WAF Weeks after flowering

List of Original Publications
vii
LIST OF ORIGINAL PUBLICATIONS
I. Kortesniemi, M.; Sinkkonen, J.; Yang, B; Kallio, H. 1H NMR spectroscopy reveals the effect of genotype and growth conditions on composition of sea buckthorn (Hippophaë rhamnoides L.) berries. Food Chem. 2014, 147, 138–146.
II. Kortesniemi, M.; Vuorinen, A.L.; Sinkkonen, J.; Yang, B.; Rajala, A.; Kallio, H. NMR metabolomics of ripened and developing oilseed rape (Brassica napus) and turnip rape (Brassica rapa). Food Chem. 2015, 172, 63–70.
III. Kortesniemi, M.; Slupsky, C.M.; Ollikka, T.; Kauko, L.; Spevacek, A.R.; Sjövall, O.; Yang, B.; Kallio, H. NMR profiling facilitates the characterization of Finnish honeys of different botanical origins. Food Res. Int. 2016, 86, 83–92.
IV. Kortesniemi, M.; Sinkkonen, J.; Yang, B; Kallio, H. NMR metabolomics demonstrates phenotypic plasticity of sea buckthorn (Hippophaë rhamnoides) berries in respect to growth conditions in Finland and Canada. Food Chem. 2017, 219, 139–147.

Introduction
1
1 INTRODUCTION
Food, as it ultimately consists of tissues, cells, organs or organisms of animal, plant and/or microbial origin, and of the products of their primary and secondary metabolism, is susceptible to numerous endo- and exogenous factors influencing its composition and quality. The origin of a food or a raw ingredient is one the key elements that influence the occurrence and concentration of food metabolites. From the genetic foundation1-5, growth place6-10, weather and environmental conditions3,11-15, soil16,17, developmental stage18-21, agricultural practices22,23 and harvest24-28 to processing and storage29,30, the colour, structure, taste, flavour, shelf life and the nutritional quality of the food can be affected in every step of its life cycle (Figure 1). Here, the effect of origin, covering genotype, geographical origin, related abiotic stress and time-related variation is reviewed.
As this thesis and literature review mainly focuses on plants, plant-based foods and agri-foods, the food genotype – referring to the species, subspecies, variety, cultivar and breed – can be regarded to be one of the most influential origin-related factors affecting food composition. The genetic background usually reflects the quantitative, qualitative and ecological values of the food or food crop. Often, the effect of both the genotype and the environment (the genotype × environment interactions) are taken into consideration when explaining phenological traits of (food) plants.2,9,17,31 The growth environment dictates the conditions, under which the crops must develop, grow, reproduce and make harvest. The fluctuating weather conditions and changing climate cause seasonal variation in botanic foodstuffs. Environmental stress factors can have an adverse effect on crop productivity and quality. Alternatively, stress may promote the accumulation of plant protectants, also beneficial to human health.7,10,32
As Finland is situated roughly between 60 and 70 degrees northern latitude, its location-related characteristics in e.g. angle of solar radiation, combined with the temperate effects of the Gulf Stream and the prevailing boreal/arctic biotope, create exceptional prerequisites for studying the “northern effect” within one country. Plant-wise, the growing locations north of the Arctic Circle (66° N) are subject to extreme daily light conditions during the summer months. This characteristic is linked to a higher bioactive and nutritional value of food plants as they protect themselves by synthesising secondary metabolites.7,32-34
The model foods chosen for the study – sea buckthorn (Hippophaë rhamnoides) berries, oilseeds Brassica and honey – represent different Nordic foods and raw materials with special nutritional, sensory, bioactive and commercial value. Sea buckthorn berries, although extensively studied during

Fi
g. 1
Fac
tors
affe
ctin
g th
e co
mpo
sitio
n an
d qu
ality
of (
plan
t) fo
ods.
The
effe
ct c
an b
e se
en in
cro
p yi
eld,
mor
phol
ogy,
sen
sory
pr
oper
ties a
nd n
utrit
iona
l and
bio
activ
e va
lue.
Introduction 2

Introduction
3
the past decades, are still of scientific interest as a high-value berry for direct consumption and the processing of value-added products (foods, nutraceuticals and cosmetics). The oilseed rape (Brassica napus) and turnip rape (Brassica rapa) allow the self-reliant production of omega-3-rich vegetable oils and sustainable plant protein in Finland. As northern conditions are more favourable to turnip rape, it is more widely cultivated in Finland compared to oilseed rape. The national oilseed production can, however, hang in the balance for changing climate and banning of commonly used yet controversial insecticides. Honey again, is a complex natural product crafted by the honeybees (Apis mellifera L.). The composition of honey reflects the botanical and geographical origin of the raw material, the floral nectar, or the honeydew, the sugary secretions of sap-sucking insects. Finnish honey is the northernmost honey in the world. Of the approximate production of 1.6 million kilograms of honey in Finland annually, a fraction is labelled as varietal (unifloral) honey having the sensory, physicochemical and melissopalynological characteristics of a certain plant source. The raw material originating from the nectarous plants or from the nectar-sucking insects producing honeydew, but also the bee metabolism and the conditions during honey processing and storage affect the honey composition.
Metabolomics offers the potential for a universal and holistic approach in food analysis in order to advance food authenticity, traceability, quality and safety and to understand the biological mechanisms and derived from the origin-related prerequisites.35-40 Nuclear magnetic resonance (NMR) spectroscopy combined with multivariate data analysis allows the examination of a wide spectrum of compounds at once while extracting the essence of the origin-related information.
The thesis reviews the current literature related to the effects of genotype, geographical origin, abiotic stress and temporal variation on food composition and quality, with special emphasis on sea buckthorn berries, Brassica oilseeds and honey. The basics and the recent applications of NMR spectroscopy and metabolomics in food analysis are also covered.

Review of the Literature
4
2 REVIEW OF THE LITERATURE
The effect of origin and related factors on food composition and quality
Genotype and phenotype
The crop genotype can generally be associated with phenological traits such as morphological and sensory properties, crop yield and yield stability. The complex interaction of components from all the functional levels (genome, transcriptome, proteome and metabolome) and the environment produces the phenotype, the output of the system measured in systems-level metabolomics and systems biology.41 Novel phenotypic traits can be developed through breeding and genetic modification.
According to the NCBI database, the genome sequencing has been carried out for several food plants, including apple (Malus dometicus), camelina (Camelina sativa), chickpea (Cicer arietinum), corn (Zea mays), cucumber (Cucumis sativus), beet (Beta vulgaris ssp. vulgaris), field mustard (Brassica rapa), mung bean (Vigna radiata), muskmelon (Cucumis melo), potato (Solanum tuberosum), rape (Brassica napus), soybean (Glycine max), sweet orange (Citrus sinensis), tomato (Solanum lycopersicum) and wine grape (Vitis vinifera).42 As part of the food phenotype, the chemical composition represents compounds derived from biochemical processes occurring in the food. Intricate metabolic networks of primary and secondary metabolism are under multi-level regulation (e.g. transcriptional, post-transcriptional and translational) and can involve an approximate of 200,000 metabolites in plants.31,43,44 Authentication of food varieties and species has been achieved with several techniques, including infrared (IR), Raman, nuclear magnetic resonance (NMR), site-specific nuclear isotopic fractionation NMR (SNIF-NMR) and fluorescent spectroscopy, gas (GC) and liquid chromatography (HPLC), thermal scanning calorimetry (DSC), mass spectrometry (MS, MSn), isotope ratio mass spectrometry (IRMS), electronic nose and DNA- and ELISA-based techniques.45 Markers of random amplified polymorphic DNA (RAPD) can be used to detect genetic diversity and population genetic differentiation. This approach has been used to study the relation between genetic distance and geographical distribution of, for example, sea buckthorn (Hippophaë rhamnoides) subspecies.46,47
Oilseed rape is one of the food crops that have gone through extensive breeding to optimise yield and nutritional quality. The target traits have been the levels of oil, protein and oleic acid and erucic acid and glucosinolates, the

Review of the Literature
5
anti-nutrients. The bred cultivars are now mostly erucic acid-free, low-glucosinolate and high-oleic cultivars. The oil content for example, is a complex quantitative trait, which is linked with other storage and structural compounds in the seed, and is influenced by seed development and environmental conditions.48 The walnut (Juglans regia L.) genotype has been shown to affect mainly the fatty acids, hydrocarbons and sterols in the nut oil. The established fingerprints for oil of three walnut varieties were cycloartenol, eicosane and tetracosane (var. 'Criolla'), linolenic acid, 24-methylenecycloartanol and tetradecane ('Chandler'), and docosane and oleic acid ('Franquette').49
In blackcurrants (Ribes nigrum L.), the genotype was shown to be the most significant factor for the berry composition.4 The highest variation in anthocyanins, ascorbic acid (vitamin C), flavonols, phenolic acids, sugars and titratable acidity was seen among different selections and cultivars. Of Finnish blackcurrant cultivars, 'Melalahti' has a high content of glucose and a ratio of sugars and acids compared to varieties 'Mortti' and 'Ola', which had relatively higher levels of fructose, citric acid, quinic acid and ascorbic acid.33 Similarly, the strawberry (Fragaria spp.) genotype affects both the sensory and bioactive properties of the fruit, for example, the volatile compounds contributing to the aroma.1,23,50 Capocasa et al. reported that the strawberry genotype is more important to the nutritional quality of the fruit than the cultivation conditions.1 Peach (Prunus persicum) cultivar with resistance to biotic stress (herbivory) shows higher levels of volatile compounds compared to a vulnerable cultivar.51 In apples, the 'Almagold' cultivar, resistant to apple scab (Venturia inaequalis), exhibit comparatively higher antifungal properties than the more susceptible variety, 'Golden Delicious'.52
Food genotype can sometimes be a matter of authenticity and consumer safety. Due to recent food scandals, for example the European horse meat scam in 2013, the awareness towards food origin and authenticity and the need for efficient tools to verify them have increased. Also, the public is concerned about the potential threats of genetically modified (GM) crops to food safety and food security. Food metabolomics, DNA-based methods and other tools have been developed to identify and detect fraudulent and genetically modified foods from authentic and non-GM products, respectively. Multiplex polymerase chain reaction (PCR) technique, detecting multiple target sequences simultaneously, has been used to detect and identify genetically modified crops such as soybean, maize and canola.53
The authenticity of meat, fish and the products thereof is usually determined at species level. For example, different NMR-based methods have been developed to authenticate beef from horse meat by their triacylglycerol profiles.54 The origin of fish (wild vs. cultured) has been studied on e.g. sea

Review of the Literature
6
bass (Dicentrarchus labrax)55 and gilthead sea bream (Sparus aurata)56.
Geographical origin
The geographical origin refers to a specific country, region, growth site or latitude. The altitude and topography are also included in this retrospect. The term terroir, often used in oenology and viticulture, describes the effect of origin and related factors on the metabolic characteristics of wine grapes (Vitis vinifera L.) and wine.17 Largely, terroir refers to a specific region and the surrounding ecosystem and related environmental conditions. The effect of cultivar, viticultural practices, edaphic factors and the topography of the vineyard can be sometimes be covered by this term.17 Certain origin-specific food names are protected in the EU.
The growth conditions can vary substantially at different latitudes. Especially, latitude affects the length of growth season, day length, the intensity and quality of light, and temperature.7 At high latitudes, the growth conditions may cause plants abiotic stress, affecting their development and metabolism. Same genotypes can produce different phenotypes in different conditions, exhibiting plasticity. In the Nordic countries, where the vegetative period is generally short, the growing season is defined as the period when the daily mean temperature is above +5 °C.57 The long summer days and cool night temperatures characteristic to northern climate have been shown to promote biosynthesis of phenolic compounds in plants.7 Cool climate and winter can also reduce the prevalence of pests and subsequently the need for their chemical control. The differences in longitude, again, may represent varying topography, elevation/altitude, microclimates, biotope, or agricultural zone. Out of these, the altitude can again shift the environmental conditions to a more unfavourable direction as it increases.
Element- and natural abundance isotope-based analyses are prominent in tracing the geographical origin of foods.58 Of mass spectrometric techniques, the isotope ratio (IR-MS), inductively coupled plasma (ICP-MS), proton transfer reaction (PTR-MS) and gas chromatography–mass spectrometry (GC-MS) have been applied in geographical authentication due to their high sensitivity when analysing e.g. inorganic elements and volatiles.59 On the other hand, robust NMR-based analyses combined with chemometrics efficiently discriminate different foods based on their geographical origin, covering a wide range of metabolites in one analysis.8,59-64 As an example, the natural distribution of C3 and C4 plants at higher and lower latitudes, respectively, affect the 13C/12C gradient in the plant material which can be used as an indicator of geographical origin.58
As the response of fifteen basil (Ocimum spp.) genotypes (representing five
Review of the Literature
7
species) to their genotype–environment interactions was studied, the yield of fresh herb and essential oil was shown to be strongly influenced by the environmental conditions at different locations.2 The two agroclimates compared produced seven different chemotypes, all of which were characterised by specific volatile fingerprints. In 1977, Hårdh & Hårdh showed that northern latitude in Finland lowered the content of carotene in carrot (Daucus carota L.) and parsley (Petroselinum crispum), and intensified the colours in strawberry, tomato, beet root, spinach (Spinacia oleracea) and lettuce (Lactuca sativa).65 Also, carrot, beet root, swede (Brassica napus subsp. rapifera) and strawberries exhibited higher content of sugar and dry matter in the north (67–69° N) compared to south (60° N). The comparison of blackcurrants grown in southern (56° N) and northern (65° N) Sweden showed that the levels of phenolic acids and glucosides of cyanidin, quercetin and kaempferol were higher in the north.4 With Finnish blackcurrants, lower amounts of total flavonol glycosides, anthocyanins and phenolics was recorded in the northern berries (regardless of cultivar) contrary to the higher amount of hydroxycinnamic acid conjugates (cv. 'Mortti' and 'Ola').12 High latitude also correlated with lower content of sugars and citric acid and higher content of malic, quinic and ascorbic acids in the blackcurrant juice.33
Statistically significant differences can be seen in the content of palmitoleic acid, sterols, triterpenic alcohols and hydrocarbons in virgin olive oils (VOOs) from different altitudinal origins.66 Higher level of β-sitosterol is characteristic to VOOs from low-altitude (< 400 m) and 24-methylenecycloarthanol to VOOs from high altitude (> 700 m). In sea buckthorn (Hippophaë rhamnoides ssp. sinensis) berries, high altitude has been shown to decrease the content of sugars while increasing malic and ascorbic acids.67
Cocoa (Theobroma cacao L.) beans can be traced to originate from Africa, America or Asia and Oceania based on their compositional characteristics. However, the differences are also linked to the local varieties or hybrids and the techniques used in cocoa processing and fermentation. According to Marseglia et al., the American cocoa beans can be characterised by caffeine, caffeic acid, acetic acid, epicatechin and amino acids, compared to African beans that have higher levels of citric acid, formic acid and sugars.64 The elucidation of the Asian and Oceanian samples was not, however, as clear-cut, possibly due to their close genetic background to the cocoa beans from Africa. Chocolate made from the cocoa beans from Ghana and Nigeria has been shown to correlate with strongly perceived chocolate flavour, showing the influence of the country of origin on the flavour characteristics and quality of chocolate.6 The knowledge of the quality properties of foods from certain regions may steer consumer choices.
In honey, the geographical origin is closely related to the botanical origin
Review of the Literature
8
due the regional differences in local flora.61 The physicochemical and sensory properties of honey are highly dependent on the origin of the raw material, the floral nectar or the honeydew produced by nectar-feeding insects.68 For example, the colour, consistency, aroma and sugar composition of the honey are mostly determined by the nectar source. The geographical origin per se may have an effect on the moisture content, acidity and the level of active enzymes in honey. Also, the stable isotope abundance ratios or the mineral and trace element compositions can be specific to certain areas.
The link between the geographical origin, authenticity and traceability of foods is apparent. The EU Council Regulations EC No. 509/2006 and 510/2006 protect certain European agricultural products and foodstuffs as traditional specialities guaranteed and their geographical indications and designations of origin, respectively.69,70 For example, saffron (Crocus sativus L.)71 and buffalo mozzarella72 from specific regions in Italy hold the denomination of Protected Designation of Origin (PDO). The hazelnuts (Corylus avellana L. cv. 'Tonda Gentile Trilobata') from Piedmont63 and the 'Interdonato' lemons of Messina73 are example of foods of Protected Geographical Indication (PGI). The Finnish foods under the origin-related EU-regulation include the Lapin puikula (almond potato from Lapland), the Lapin Poron liha (reindeer meat from Lapland), the Kainuun rönttönen (traditional pasty from Kainuu region), the Kitkan viisas (vendace from lakes of Koillismaa highlands) and the Puruveden muikku (vendace of Lake Puruvesi), holding either the PDO or PGI designation.70 In addition, the Finnish beer, sahti, the Karelian pasty, karjalanpiirakka, and the kalakukko, which is fish baked inside a loaf rye bread, are recognised as Traditional Specialities Guaranteed (TSG). The TSG label is granted on the basis of the area and methods of production. However, the control of these Finnish specialities does not include chemical analyses nor are they likely to be subject to fraud other than mislabelling.
Abiotic stress
In general, stress can have adverse effects on plant growth, development and productivity. Abiotic stress refers to stress caused by exposures to extreme chemical or physical settings, unlike biotic stress, which is triggered generally by a physical injury or pathology caused by another organism. Abiotic environmental stress can negatively impact crop productivity and quality, to the extent that global food security can be compromised. Environmental stress factors include excess/shortage of light, heat or water, nutrient deficit, high edaphic salinity and exposure to phytotoxic substances. Environmental factors may promote oxidative stress that is caused by the formation of reactive oxygen species (ROS; singlet oxygen, hydrogen peroxide, superoxide anion,
Review of the Literature
9
hydroxyl radical, perhydroxyl radical). As a result, the plant secondary metabolism activates and antioxidative ascorbic acid, α-tocopherol, carotenoids and flavonoids are being synthesised. The stress may also induce epigenetic changes. The plant genotype, developmental stage and the type of impacted tissue or organ define how the crops respond to the stress – by resisting or succumbing. The severity and duration of the stress, number of exposures and the effect of other concurrent stressors also define the outcome. Resistance to stress results in survival and improved tolerance through the expression of defence metabolites but susceptibility can lead to death. The plant metabolism is altered as the signal transduction pathways activate after stress recognition. The mitogen-activated protein kinase (MAPK) cascades operate in stress responses and signalling related to hormones and reactive oxidative species (ROS), resulting in changes in downstream signal transduction, metabolism and/or gene expression.43,74-76
In crop plants, stress can induce changes in assimilation, water and nutrient uptake, secondary metabolism, programmed cell death and gene expression.75 Elevated temperatures are generally stressful to plants and can for example expose crops to yield losses and pest invasion via warm winds.13 Metabolically, heat stress can increase protein levels in cereals and oilseeds.75 High temperatures and radiation can limit the formation of anthocyanins (and colour) in wine grapes17, carotenoids in carrots and tomatoes27,65 and lycopene in tomatoes27. Dry growth season correlates also with lower levels of stilbenes and viniferins in grapes.17 However, heat and/or high-UV stress has been shown to increase the concentration of phenolic antioxidants, ascorbic acid and carotenoids, for example, in apples and lettuce.75 Intense light can induce the biosynthesis and accumulation of protective flavonoids and anthocyanins, whereas shading can alter the composition of anthocyanins and reduce the accumulation of flavonols.17 In cloudberries, cool and rainy growth season induces significantly higher content of anthocyanins and the unsaturation level of fatty acids compared to warm and dry summer that in turn promotes the berry yield.11 Shade can promote the formation of α-tocopherol and reduce the level of citric acid in cloudberries.11
The quality and duration of radiation vary in different areas of the world. Light and the phase of light regime encompass irradiance and its spectral composition, polarisation and photoperiod. At northern latitudes, the light regime is at its most extreme, with lengthy periods of either midnight sun or polar nights. High latitudes generally correlate with cooler climates and long photoperiods yet with reduced exposures to solar irradiation, causing a stressful growing environment for plants. The solar angle and the time of day dictate the spectral distribution of red and far-red light.7,77 Light is richer in blue radiation in the north and can promote chlorophyll formation, for example, in spinach

Review of the Literature
10
and lettuce.65 Despite its prerequisites, agriculture in northern latitudes is possible as a
result of long-lasted acclimatisation and adaptation.13 In general, the northern conditions have been shown to increase the phenolic content of several berries7, like bilberries78 and sea buckthorn10,32. Blackcurrants, on the other hand, exhibit higher levels of phenolics, including flavonols and anthocyanins, when grown in lower latitudes.4,12 Still, high latitude promotes the accumulation of aromatic acids in blackcurrant berries. Plant response to different environments is seen as plasticity. Whereas high temperatures can limit the formation of anthocyanins, low temperatures can induce their accumulation.17 Cold stress can immobilise membrane lipids and slow down reaction kinetics. In long term, cellular damage, dehydration, energy depletion and metabolic dysfunction may occur. Several important food crops, such as potatoes, fruits, berries and vegetables are prone to suffer from night frosts.15 Soil frost and snow cover night frost can delay sowing and seed germination on the spring. Chilling stress can promote the activity of several enzymes, including catalase, glutathione and superoxide dismutase, in several plant species. Temperate and sub-arctic crops can withstand cold stress by increasing the level of membrane phospholipids. Sugars (sucrose, glucose, fructose, raffinose and stachyose), proline and glycinebetaine can accumulate to further advance tolerance to freezing temperatures.76 Bilberries of northern clone was shown to ripen faster than the ones of southern clone when grown in cold temperature by Uleberg et al. Moreover, the content of anthocyanins, total phenolics, malic acid and sucrose was significantly higher in the northern clone.78 Relating to northern conditions, low temperature can especially favour delphinidin glycosides, while long day length can significantly favour the formation of delphinidin, malvinidin, peonidin and petunidin glycosides in bilberries. Similarly, high latitude and related conditions correlate positively with flavonol glycosides in sea buckthorn berries.32 Sea buckthorn transcriptome shows promotion of flavonoid, carotenoid and photosynthetic pathways under cold and freeze stress.79
Water deficit can promote the biosynthesis of anthocyanins and stilbenes in wine grapes.17 Water stress can also be caused by freezing temperatures through dehydration and ice crystal formation. Osmotic regulation by accumulating cellular solutes helps stress-tolerant plants to acclimatise to drought or salinity. Such known osmolytes are e.g. proline, glycinebetaine, sugar alcohols and raffinose. Most of these function also as osmoprotectants that are able to scavenge hydroxyl radicals.76 Green tea (Camellia sinensis L.) exposed to high temperatures and precipitation contain more theanine, while cooler areas with low precipitation result in relatively higher levels of amino acids, epi(gallo)catechins, epi(gallo)catechin-3-gallates and caffeine.80 Water

Review of the Literature
11
deficiency increases the formation of trans-piceid (trans-resveratrol 3-O-β-D-glucoside), the biosynthesis of stilbene precurors and the expression of stilbene synthase in Cabernet Sauvignon grapes.81 Tomatoes elicit genotype-specific responses when subjected to water deficit at different developmental stages.82 The water deficit during cell division phase can accumulate more sugars and less acids in one genotype, while deficit during fruit maturation can result in less sugars, acids and carotenoids in the other. Hence, with controlled water deficit at a right developmental stage, tomato genotypes of poor quality can turn out sweeter and tastier, whereas genotypes perceived as of good quality in normal conditions may suffer loss of sensory and nutritional quality.
High altitude can expose plants especially to high ultraviolet (UV) radiation. As a result of depleting ozone layer, exposure to UV-radiation has increased in the polar areas.7 The altitude of vineyard can have significant difference in the phenolic metabolites of wine.17 As radical scavengers, phenolic compounds can accumulate to protect the plant as flavonoids and anthocyanins can absorb UV-radiation. The levels of stilbenes, for example, tend to increase as altitude increases. Stilbenes, including the health-promoting resveratrol, are products of the phenylpropanoid–acetate pathway.76 However, the resveratrol biosynthesis may be under cultivar-specific control.81 In sea buckthorn berries, high altitude correlates negatively with sugars and positively with ascorbic acid, malic acid and flavonol glycosides.32,67 Sea buckthorn grown in high altitudes has been shown to exhibit higher resistance against drought and UV-B radiation.83
Temporal variation
Grapes and wine are prime examples of the effect of seasonal variation on the products as the composition of the grape berry is mostly influenced by the vintage (year of harvest).17 Seasonal or yearly variation owe to annual fluctuations in weather conditions. Also the within-season variation in temperature, precipitation and winter conditions can severely influence crop growth, maturation, yield, quality, and the timing of agricultural operations.13-15 The yearly variation in blackcurrants, according to Vagiri et al., was seen as a significant (p < 0.05) difference among monomeric anthocyanins, flavonols, phenolic acids, ascorbic acid, soluble solids and titratable acidity.4 In walnut oil, the content of tocopherols and volatile compounds is influenced by the crop year.49 Additionally, the combined effect of variety and crop year is significant for palmitic and linolenic acids.
Growing degree days and season dynamics can vary substantially season-to-season and influence the crop metabolism and ripening.13,57 The stage of ripeness, relating to the time of harvest, defines the physical and chemical attributes of food crops. Raffo et al. showed that as sea buckthorn berries gain

Review of the Literature
12
weight, the soluble solids and total organic acids decrease.84 The level of carotenoids increased towards late harvest. Anesi et al. reported a declining trend of hydroxycinnamic acid derivatives and flavan-3-ols in grapes from véraison (start of harvest, early maturity) through mid-harvest to full maturity stage.17
In Italian cherry tomatoes harvested throughout the year, the seasonal variation was shown mostly in the levels of α-tocopherol and unsaturated lipids, or chlorophylls and phospholipids, depending of the cultivar.27 For example, the heat and light conditions during summer repressed the formation of carotenoids (lycopene). The crop age and the phase of the growth season also affect the chemical and sensory properties of green tea shoots.85 In a study by Liu et al., the tea leaves collected at early spring season were scored highest over mid- and late spring harvests, outperforming in infusion colour, aroma and taste.85 According to Kallio et al., the best harvesting time for sea buckthorn berries in terms of vitamin C and tocopherols/tocotrienols would be late August and early-to-mid September (in southwest Finland), respectively.24
To further narrow down the window for metabolic fluctuation within a timeframe, diurnal variation in temperature and sunlight can also have an impact on plant metabolism and respiration. The photoperiodic cycle (circadian rhythm) under the natural environmental conditions affect the organism’s metabolic system daily.86 Short nights at high latitudes reduce the time to transform assimilation products to storage compounds. Relatively high dry matter content can be an indicator of this.65 Among certain plants growing in water-starving areas, the crassulacean acid metabolism (CAM) is a photosynthetic carbon fixation pathway and an alternative route for the C3 and C4 pathways. CAM-plants, an example of which is the pineapple (Ananas comosus), one of the few food crops utilising CAM photosynthesis, undergo large diurnal changes in organic acids and sugars.87,88 Especially, the level of malic acid increases nocturnally as a result of carbon assimilation while the sugar levels increase during the day.87,88 In herbs, the diurnal fluctuation can be seen in their essential oil content. Spearmint (Mentha spicata L.), for example, was shown to produce maximum oil content at 9 a.m., while the optimum time for a high limonene and carvone yield was reached at 9 p.m. and at 3 a.m., respectively.28
Sea buckthorn berries
Sea buckthorns (Hippophaë spp.) are thorny deciduous shrubs of the oleaster family (Elaeagnaceae) that are highly adaptable to changing and stressful environmental conditions like drought, cold and salinity. The most eminent and commercially important species, Hippophaë rhamnoides L., has naturally

Review of the Literature
13
scattered in different regions of Asia and Europe.89,90 In addition to the array of natural species and subspecies, numerous cultivars have been developed for specific properties, such as fruit yield and quality, ease to harvest and resistance to cold, pests and diseases.91,92 Sea buckthorn berries are used both traditionally in folk remedies and as raw materials for foods, nutraceuticals and medicines. Common food uses include juices, jams and alcoholic drinks.89,92 However, the use of sea buckthorn is not limited to the berries, as the leaves, seeds and bark can be utilised for various pharmaceutical, cosmetic and food applications.92 In Finland, the wild sea buckthorn of ssp. rhamnoides is spread and thriven along the waterfronts of the Baltic Sea and the Gulf of Bothnia.89 The development of sea buckthorn is highly dependent on temperature and light conditions. Vegetation begins when daily average temperature reaches 5–7 °C, while flowering requires temperature of 10–15 °C.93
The berries of sea buckthorn are characterised by their yellow-to-reddish orange colour, spherical-to-cylindrical form of 3–12 mm in length, oleaginous pulp, tangy flavour and high nutritional value.89,91 The berries contain a wide variety of nutrients and bioactive compounds, including unsaturated fatty acids, carotenoids, tocopherols, tocotrienols, sterols, phenolic compounds, vitamins, sugars, sugar alcohols, glucose derivatives, inositols, free amino acids and minerals.10,92,94-97 O-Ethyl β-D-glucopyranoside (henceforth ethyl glucoside; Figure 2) is a compound characteristic to sea buckthorn but rarely found in other fruits. Ethyl glucoside was first elucidated from the sea buckthorn berries in 2006 by Tiitinen, Yang, Haraldsson, Jonsdottir and Kallio.98 In 2014, the presence of a corresponding methyl derivative was reported.99 The composition of sea buckthorn berries is known to vary due to the influence of their genotype, growth place, harvesting time, agro-climatic parameters and ripening.3,24,26,67,84,96,100-102
Fig. 2 O-Ethyl β-D-glucopyranoside (ethyl glucoside).
Sugars and acids are the main components affecting the sensory properties of sea buckthorn103. The main saccharides in sea buckthorn berries are glucose and fructose, with traces of sucrose.100 Sugars are formed and accumulated in plants as the result of the primary metabolism initiated by photosynthesis.76 The sugar content in sea buckthorn has been shown to correlate with growth
Review of the Literature
14
altitude and latitude.3,67 In general, the berries contain more sugar when grown in non-subarctic conditions and low altitudes.3,67 The amount of total sugar in 100 ml juice (ssp. mongolica) varies between 1.7 and 10.1 g, most of which is glucose.67,100 In the juice of ssp. sinensis, the levels vary dramatically depending on the growth location (0.4–24.2 g/100 ml)67,100. In the juice of ssp. rhamnoides, the total sugar level is approximately 3 g/100 ml at highest.100
Citric and malic acids are the predominating acids in most fruits. In sea buckthorn, malic and quinic acids dominate, with minor levels of citric acid.104 Organic acids function as intermediates in the respiratory metabolism (Krebs cycle) and as storage compounds in vacuoles. The total acidity can decrease during ripening as the acids may be used in respiration or converted to sugars.84,100 Acids are important for the taste (sourness) and sensory acceptance of fruits and berries. For example, the sugar/acid ratio correlates with sweetness and pleasantness of sea buckthorn juice.103,104 The levels of malic and quinic acid are influenced by the altitude and the latitude of the growth place.67 High altitude is also known to increase the level of malic acid.67
Contributing to the overall antioxidative capacity and nutritional value of sea buckthorn berries, vitamin C (ascorbic acid) is another key metabolite in terms of quality and nutritional value. Level of vitamin C in the berries varies between 0.3 and 3.0 g/100 g fresh weight (and 0.03 and 1.70 g/100 ml juice)3,24,67,91,95 and is rivalled practically only by rosehip (Rosa spp.). Especially, the berries of ssp. sinensis are also very rich in vitamin C.24 Also, the berries of the Finnish cultivars 'Terhi' and 'Tytti' have a high content of ascorbic acid of up to 2 and 3 g/100 g, respectively.91 The ascorbic acid content in the berries is not significantly affected by specific weather conditions3 but can decrease during ripening24,84. However, low latitude and high altitude are related to higher levels of ascorbic acid (ssp. sinensis).67 Yearly variation is generally not significant.24,67 Ascorbic acid can deplete at refrigerated temperatures which can reduce the nutritional value of sea buckthorn juice.105
Alkyl glucosides, of which ethyl and methyl glucoside are found in sea buckthorn may have a role as osmolytes. Other reported sources of methyl glucoside are roses (Rosa hybrid L.)106 and white clover (Trifolium repens L.)107. Ethyl glucoside is found in yuzu (Citrus junos) peel.108 Both compounds can be absorbed in the blood stream and excreted in urine postprandially but their physiological effect, if any, has remained unknown.99,109 However, the ethyl glucoside may contribute negatively in the pleasantness of sea buckthorn juice.110 The content of ethyl glucoside is wide-ranging among subspecies and cultivars.3,100 For example, the berries of ssp. sinensis and ssp. mongolica contain only traces of ethyl glucoside compared to ssp. rhamnoides in which the levels may reach up to 1.9 g/100 ml juice.100 In addition, the levels can increase during maturation to the calibre of 2.5–3.0 g/100 ml.100

Review of the Literature
15
Inositols and methylinositols are cyclitols that have many biological functions in plants as protective, stress-adaptive metabolites. myo-Inositol and its derivatives, for example, take part in many biosynthetic and regulatory pathways, including carbohydrate and lipid metabolism, promoting plant growth and development.76 Cyclitols are also important for animal and human physiology. For example, L-quebrachitol may function as gastroprotective111 and antidiabetic112 agent when consumed.
In addition to the aqueous metabolites, the origin of sea buckthorn is relevant for the contents of phenolic compounds, lipids and lipid-soluble metabolites. Phytosterols are present in both pulp and seed.113,114 Characteristic to sea buckthorn, the soft part is rich in palmitoleic acid (16:1n−7).115 The berries of ssp. carpatica were shown to contain 53–97 mg/100 g (dw) carotenoids by Pop et al.116 The berries of ssp. sinensis contain higher levels of flavonol glycosides, most of which are 3-O-glycosides of isorhamnetin and quercetin, compared to ssp. mongolica.32 Consisting of (epi)gallocatechins as the main monomer units, B-type proanthocyanidins serve as essential contributors to the total antioxidant activity of the fruit.10,117 Tocopherol and tocotrienol levels reported by Kallio et al. ranged from 40 mg/kg (fw berry flesh) in ssp. rhamnoides to 120 mg/kg in spp. sinensis. In comparison, values ranging from 22 mg/kg to at 43 mg/kg have been reported in Canadian cultivars.97
Seeds of oilseed rape and turnip rape
Oilseed rape (Brassica napus) and, to a lesser extent, turnip rape (Brassica rapa) are important crops not only for vegetable oil production, but as raw material for biofuel, protein and fibre. In layman’s terms, rapeseed and canola oils may refer to any cooking oil of B. napus ssp. oleifera, B. rapa ssp. oleifera or Brassica juncea. Genome-wise, B. napus and B. rapa represent types AACC (2n = 38) and AA (2n = 20), respectively.118
According to FAOSTAT, in 2014, the production quantity of rapeseed was approximately 71 million tons globally. The contribution of Europe and Finland was 29 million (41%) and 62,000 tons (0.09%), respectively. These seed oils are naturally rich in essential polyunsaturated fatty acids, linoleic acid (9,12-octadecadienoic acid; 18:2n−6) and α-linolenic acid (9,12,15-octadecatrienoic acid; 18:3n−3, ALA). Especially, the abundance of ALA results in optimally low ratio of n−6/n−3 fatty acids for human diet.119 The dietary omega-3 fatty acids have been linked to a reduced risk of cardiovascular and metabolic diseases, stroke and cancer.119-121 However, the susceptibility of the double bonds for oxidation during storage, cooking and digestion can again lead to undesirable physiological responses like oxidative stress and inflammation.122-

Review of the Literature
16
124 Canola and other modern rapeseed cultivars are bred to no longer contain erucic acid (13-docosenoic acid; 22:1n−9), hazardous to human health, and glucosinolates.48
The oil content and quality are determined by the genome of the oil plant and its interactions with the environment.125 The genetic regulation is mainly based on the maternal factors. Turnip rape is a freely cross-pollinating heterozygote, while oilseed rape is mainly self-pollinating homozygote. However, when grown in open-air, the oilseed rape can also undergo cross-pollination, yielding in less pure genotypes. Yet, effect of the maternal genotype on the seed oil is considered stronger than the pollen’s.125 The oilseeds grown under open-field conditions are susceptible to several biotic and abiotic stresses that can affect the oil composition.118
In B. napus, the level of photosynthetic activity in leaves and siliques correlates with the seed yield and the oil quality.126 Photosynthetically assimilated carbon is transported into seeds (sinks) mainly as sucrose.127 Its glycolysis plays an important role in initiating the seed maturation. Sugar transport in seed coat potentially regulates the oil synthesis by controlling sugar concentration in ovules.128 Oilseed rape and turnip rape are considered ripened approximately 114 and 102 days after sowing, respectively.129 Stress conditions can delay the seed ripening by a week.21
The synthesis and accumulation of oil starts in the early stage of the embryo development.125 The de novo biosynthesis of fatty acids and triacylglycerols (TAGs) takes place in the sn-glycerol-3-phosphate pathway (Kennedy pathway)130. Monounsaturated and saturated fatty acids are synthetised in plastid and transported for a stepwise acylation in the endoplasmic reticulum (ER) by the enzyme fatty acyl elongase (FAE). The key enzymes for the synthesis of polyunsaturated fatty acids are the fatty acid desaturases (FAD2 and FAD3) that target the monounsaturated fatty acyls attached to the sn-2 position of phosphatidylcholine. The expression of corresponding genes, FAD2 and FAD3, decreases toward ripening.21 The acyl-CoA pool provides fatty acids for the acylation, which is controlled by the acyltransferases GPAT (acyl-CoA:sn-glycerol-3-phosphate) and LPAAT (acyl-CoA:lysophosphatidic acid acyltransferase). The final acylation of a diacylglycerol to a triacylglycerol is catalysed by the acyl-CoA:diacylglycerol acyltransferase (GPAT).127 The TAGs are stored in the oil bodies of the mature seed, within the cytoplasm of cotyledon cells. The oil content can reach 50%, w/w. According to Miller et al., flowering is initiated approximately at 580–670 and 470–550 °Cd (when the base temperature is 0 °C) in B. napus and B. rapa, respectively.131 Similarly, the seed filling starts at 970–1070 and 830–930 °Cd, while maturity is reached at 1330–1450 and 1150–1280 °Cd. During the final weeks before maturation, the TAG composition of turnip rape seed oil remains fairly constant.132

Review of the Literature
17
Phosphaditylcholine is an alternative intermediate in the TAG biosynthesis.133 It also serves as an important membrane lipid and acyl carrier. Sinapine, or O-sinapoylcholine, is a characteristic metabolite to Brassicaceae (Figure 3). It is considered to be a supplier of choline for phosphadityl choline biosynthesis. The esters of sinapic acid are products of the phenylpropanoid pathway. Sinapic acid esters are assumed to be formed via serine carboxypeptidase-like acyltransferases.134 The metabolic route entails uridine diphosphate (UDP)-glucose:sinapate glucosyltransferase (SGT), sinapoylglucose:choline sinapoyltransferase (SCT), sinapoylglucose:L-malate sinapoyltransferase (SMT) and sinapoylcholine esterase (SCE). According to Boucherau et al., the dry seed of B. napus can contain 36 µmol/g of phenolic choline esters, of which 72% is sinapine.135 In addition to influence of genotype, the content of aromatic cholinyl esters are subject to environmental influence.135 Intensive light/UV-stress is known to promote the formation of sinapates, as they may function as UV-protectants.136 Drought, again, lowers the levels of sinapine, especially when encountered during the early vegetative growth period.135,137
Fig. 3 O-Sinapoylcholine (sinapine). The antinutritive properties and the unpleasant taste of sinapine and sinapates may limit the use of Brassica oilseeds in feedstock.48 Other antinutrients present in rapeseed meal are glucosinolates (0.5–8%, depending on the cultivar).138 As secondary metabolites, sinapates and glucosinolates may have a role in plant defence, e.g. against biotic and abiotic stress, like UV radiation and drought.137,138 Moreover, rapeseed phenolics have shown potential bioactivity against oxidation and inflammation in vitro.139,140 As a feed crop, oilseed rape is more applicable due to its higher protein yield per hectare compared to turnip rape.141 Low oil content may correlate with higher protein content, however, a clear trade-off between protein and oil in B. napus and B. rapa has not been shown.141 However, heat stress has been shown to increase protein in B. napus.75 Global warming can reduce the oil content in the seeds of oilseed rape and turnip rape as they have to respond to warmers temperatures during growing season.75,142 This may eventually compromise the oilseed

Review of the Literature
18
production especially in the northern latitudes. However, the abiotic stress caused by lower temperatures and short day can increase the level of the nutritionally important α-linolenic acid in B. rapa.21 Water stress can have an effect on rapeseed quality not only by limiting vegetative growth but also by changing seed lipid composition and by accumulating phenolics and glucosinolates.137 Water deficiency during vegetative growth can especially decrease the level of oleic acid.137 Drought, heat and salt stress can decrease the lipid concentration in oilseed rape.75
Honey
Honey, as the Council Directive 2001/110/EC143, for example, defines, is the natural sweet food produced by the honeybee, Apis mellifera. The bees collect and modify floral nectar or honeydew (excreted by plant-sucking insects, e.g. aphids) to be stored and ripened in the honeycomb. The basic components of honey are fructose and glucose. The relative amounts of these monosaccharides, as well as the other saccharides, organic acids and minor components of honey are related to the origin of the honey raw material.
While foraging, the bees pollinate important food crops, like oilseeds, nuts, fruits and berries, increasing the overall meaning and value of beekeeping and honey production. The significance of farmed bees is increasing as the natural pollinators are diminishing. Pollination increases crop yield and quality while improving ripening, shelf-life and resistance against disease.144,145
Blossom, or floral, honeys can be derived from several (multifloral honeys) or mostly from one specific plant source (unifloral or varietal honeys). The botanical origin highly affects the chemical and sensory (flavour, odour, colour, texture) properties of the honey. Whenever a specific origin-related product name is used, it should come from the indicated source (botanical, regional, territorial or topographical) and possess characteristic sensory, physicochemical and microscopic properties.143 General criteria for the chemical composition of honey include the content of fructose, glucose and sucrose, moisture, water-insoluble content, electrical conductivity, free acidity, diastase activity and the hydroxymethylfurfural (HMF) content.143 Varietal honeys are generally priced higher than regular multifloral or bulk honeys. Varietal honeys may possess unique bioactivities owing to their plant origin. For example, buckwheat (Fagopyrum esculentum) honeys have shown promising antioxidant and antimicrobial activities against human pathogenic bacteria.146,147
Harmonised methods for the characterisation and quality control of honeys have been established by the International Honey Commission and are implemented through the Codex Alimentarius standard 12-1981 and the

Review of the Literature
19
Council Directive on honey.143,148 These include melissopalynological, physicochemical and sensory analyses.149-151
Conventionally, the botanical origin of honey is determined by performing the melissopalynological, sensory and physicochemical analyses, including electrical conductivity, sugars, enzyme activity, proline, colour, optical rotation, pH and acidity. For example, the overall content of fructose and glucose, the fructose/glucose ratio and glucose/water ratio are approximate indicators of botanical origin. Still, known problems with the established methods exist.148 Firstly, the high natural variability among honeys from different botanical and geographical origins introduces great challenges for the analytical methods. Moreover, the apicultural practices on how to control the bees’ foraging behaviour are limited. Secondly, this extensive set of method is laborious and time-consuming while, to some extent, requiring special expertise. None of the methods give unambiguous result on the actual nectar source. Sensory analysis, usually performed by the beekeepers themselves, is quick and simple but highly prone to subjectivity and the lack of comprehensive proficiency. However, it also allows the evaluation of quality defects, such as fermentation.150 The pollen analysis, on the other hand, does not guarantee reliable reference to the actual plant source in terms of the collected nectar. Pollen grains in the honey can be carried over with the respective nectar or from exogenous sources. Certain pollen types can be under- (e.g. Taraxacum spp.) or over-represented (e.g. Brassica spp.) or from non-melliferous sources (e.g. Filipendula spp.), distorting the interpretation of the pollen profiles.149,152 The annual variation in pollen profiles can be up to 10%.152 The pollen types found most frequently in Finnish honeys are Trifolium repens, Rubus spp., Salix spp. and Brassicaceae152. Honeydew honeys are of non-floral origin, since their raw material is the sugary secretions (honeydew) of plant-sucking insects, such as aphids (Hemiptera spp.).153
The term ‘unifloral’ is quite often misrepresentative in the case of Finnish honeys having the characteristics of a certain botanical origin. In Finland, bee hives have to be transported to specific locations, e.g. to bogs, in order to collect varietal honeys. Often the Finnish varietal honeys do not meet the given standards, and are therefore placed in an unfavourable situation commercially. Therefore, more specific methods resting on the compositional characteristics of nectar and respective amendments in the regulations permitting their official use is recommended.
The standard physicochemical analyses, although giving accurate data on the honey composition while relating to the nectar source, do not reveal any specific characteristic for different honey types. Therefore, a method which is based on specific botanical markers is required. Several chromatographic and spectroscopic methods have been applied in the analysis of honey phenolics,

Review of the Literature
20
volatiles, amino acids and saccharides that could serve as markers of botanical origin.68,151,154-156
To further challenge for the honey analytics, together with e.g. olive oil, milk and saffron, honey is one of the most adulterated foods in the world.157 Especially, the manuka (Leptospermum scoparium) honey, indigenous to New Zealand, Tasmania and Australia, and the most highly priced and sought-after honey globally, is subject to extensive adulteration and mislabelling. Manuka honey contains methylglyoxal, which is claimed to be the active compound behind the renowned antimicrobial and antiviral properties of the honey. Adulterated honeys usually contain additions of sugar or sugar syrups. The botanical or geographical origin may also be fraudulently declared. Authentication can be performed with e.g. chromatography or spectroscopy, by revealing conflicting metabolic profiles.155,158-160 The C4-sugars from sugar cane and corn can be detected with GC, HPLC, MS and SNIF-NMR.160,161
Nuclear magnetic resonance in food and agriculture
Nuclear magnetic resonance (NMR) spectroscopy
The phenomenon of nuclear magnetic resonance (NMR) in condensed matter was first introduced by physicist Bloch and Purcell and their groups in the turn of 1945–1946162,163. Later, following the introduction of Fourier transform (FT) method by Ernst164, multidimensional NMR and cryomagnets, NMR techniques have gained firm foothold not only in structural elucidation of chemical compounds but in the routine, high-throughput applications in physical, chemical and biological sciences, including food sciences.165,166
NMR spectroscopy is based on the magnetic properties of atomic nuclei, i.e. nuclei with a non‐zero spin quantum number (I) will be NMR-active. For example, the proton (1H) and other common nuclei, carbon-13 (13C), nitrogen-15 (15N), fluorine-19 (19F), silicon-29 (29Si) and phosphorus (31P), have a spin quantum number of I = ½. Nuclei with non-zero quantum numbers act as magnetic dipoles with a magnetic moment µ. The magnetic moment is the product of the gyromagnetic ratio γ and the spin quantum number.165,166
When exposed to a strong external magnetic field (B0) the nuclei will be distributed in (2I + 1) energy levels. The small energy difference between the two spin states (+½ and −½) depends on the field strength (Figure 4). As the nucleus is irradiated at a nucleus-specific radio frequency, a spin transition occurs. The frequency of this transition is related to the chemical surroundings of the nucleus, hence giving information on how the nucleus is surrounded by neighbouring nuclei. The radio frequency (RF) transmitter detects the absorption of energy and records it as a signal, creating the NMR raw data. The

Review of the Literature
21
resulting free induction decay (FID) signal is Fourier-transformed into frequency domain signal. The signals have chemical shifts (δ), expressed as hertz (Hz) or as parts per million (ppm). The δ-values (in ppm) are independent of the operating frequency of the instrument. The chemical shift of a signal is determined by several factors, including electron density, deshielding by the electronegativity of neighbouring atoms, anisotropic effects induced by the magnetic field, deshielding by hydrogen bonding, and affected by variations in temperature, pH, dilution and concentration. The intensity of the signal depends on the differences in the populations of the energy levels. The signal-to-noise (S/N) ratio is proportional to the magnetic field strength, gyromagnetic ratio and number of scans (ns). The acquisition time (aq), relative to the number of data points (td) and spectral width (sw), is typically 1–5 s for proton spectra. Longer AQ improves the digital resolution of fine coupling structures.167
Fig. 4 Top: Nuclei in a natural state vs. nuclei subjected to an external magnetic field (B0). Below (left): ΔE (= γB0) is the difference in energy between the two energy levels, where the spin can be parallel or anti‐parallel to B0. Below (right): Precessional motion of the nuclear magnetic moment, µ, around B0. 165,167 The B0 causes the electrons in the atom to rotate around their orbitals. The nuclei precess with a frequency ω0 (Larmor frequency) around the magnetic field (Figure 4). As the nucleus returns to the lower energy state, it relaxes. The longitudinal or spin–lattice relaxation (T1) represents the time the nucleus spends at the higher energy state and the energy transfer from the spin to the

Review of the Literature
22
environment of the nucleus (z-magnetisation). The transverse or spin–spin relaxation (T2) relates to the energy transfer between individual spins (x,y-magnetisation). The FID fades as the nuclear spins relax back towards equilibrium. The rate of the both relaxation mechanisms is exponential. During the relaxation, the M0 returns to the Boltzmann equilibrium following a spiral pathway. When determining the absolute concentration of a compound, full relaxation is required before applying the next pulse. Hence, the recycling time should be five times the maximum T1. Correction factors may be used when the complete relaxation is not applicable, taking into account the differences in various nuclei and internal standard.165,166,168
The proton exhibits a high natural abundance (99.98%) and a high relative sensitivity at constant magnetic field.165 Carbon-13 of natural abundance of 1.1%, on the other hand, require significantly longer experimental times to produce adequate data, but is commonly coupled with proton detection in heteronuclear 2D-experiments. 13C NMR can be used, for example, to determine the relative concentration and the ratio of sn-1,3 and sn-2 fatty acids in lipidic samples, as Mannina et al. did in the case of sea bass muscle extracts.55 The 31P NMR spectroscopy is worthwhile when targeting e.g. phospholipids in olive oils.169 Spyros & Dais have reviewed some of the other food applications of 31P NMR, including meat and fish (post mortem metabolism), milk (inorganic phosphate, casein-bonded phosphoserine, polyphosphates, phospholipids, casein), starch (starch phosphate monoester, phospholipids, inorganic phosphate), phytate, lecithins, phosphoproteins, oligo- and polyphosphates and organophosphorus pesticides.170 Mattinen et al., on the other hand, used quantitative 31P NMR to determine structural characteristics of suberin polymers in potato skins.171
High-resolution NMR requires a liquid sample. Deuterated solvents are used to provide a deuterium NMR signal for magnetic field stabilisation and to allow optimised resolution for each sample. Most commonly, D2O, DMSO-d6, CD3OD and CDCl3 are used for different applications, respectively. Presaturation can be performed by applying continuous weak RF irradiation at the solvent frequency prior to excitation and acquisition.167 The solvent spins are subsequently rendered, leaving them unobservable. A suitable internal standard compound, e.g. TMS (tetramethylsilane) for organic solvents and TSP (3-(trimethylsilyl)propionic-2,2,3,3-d4 acid) or DSS (4,4-dimethyl-4-silapentane-1-sulfonic acid(-d6)) for aqueous solutions, is used to calibrate the chemical shift while serving as a reference for quantitation and a resolution indicator. Volatility (TMS), pH sensitivity (TSP, DSS), protein binding capacity (TSP) and hygroscopicity (DMSO-d6), however, can limit the appropriateness of the substance in quantitative analysis.172 In addition to use of purposeful reference compound, the recycle time (d1) and the number of scans

Review of the Literature
23
(ns) are the key parameters to optimise for accurate quantification. The resonance frequency of a nucleus is dependent on its magnetic
environment, namely the neighbouring nuclei (the molecular structure). This is the basis for the NMR’s unique capacity in determining molecular structures. Other factors, such as small deviations in field stability and homogeneity, temperature, pH and solute interactions can cause variation in the chemical shifts.166 The proton signal splits based on n number of equivalent neighbouring protons. The splitting pattern of a proton follows the n + 1 rule, where n is the number of protons in the adjacent carbon(s). The relative intensity ratios of the split signals and the peak multiplicities comply with the rules of the Pascal’s triangle. The split lines are at equidistance corresponding to the coupling constants between the coupled nuclei. The inter-proton coupling is typically largest, 2–15 Hz, between geminal protons (H–C–H). In vicinal (H–C–C–H) coupling, the coupling constant is determined by the Karplus curve according to the dihedral angle (0–180°) between the protons and can be 0–15 Hz. If the coupling path goes over four or more bonds, the coupling constant is reduced close to zero. Also, coupling over a double bond is subject to the influence of cis/trans-configuration of the protons. Exceptions to the coupling rules are based on molecular symmetry, chirality and equivalency.168
An example of a common workflow in elucidation of molecular structures could comprise of 1H, 13C, 1H–1H COSY (correlation spectroscopy; proton J-coupling over 2–3 bonds), TOCSY (relayed proton J-couplings within a spin system), 1H–13C HSQC (heteronuclear coupling over one bond), 1H–13C HMBC (long-range heteronuclear couplings over 2–3 bonds) and NOESY (nuclear Overhauser effect spectroscopy; correlations through space) experiments.167 The area ratio of integral values of signals serves as an indicator of the relative number of nuclei representing each signal (1H).
As an example of solid-state NMR, the high-resolution magic-angle spinning (HR-MAS) NMR can be applied to the analysis of biological tissues and different food matrices.18,64,173,174 Powdered or sliced food samples can be analysed as such without time-consuming sample pre-treatment phase. This technique facilitates high-resolution solid-state experiments by eliminating perturbing dipolar coupling and allowing narrow line-widths with the “magic” angle (θ = 54.7°) spinning.165 For example, the quality and metabolic characteristics of semi-solid food samples like capsicum peppers175, garlic173, lemon juice73, mangoes176, mozzarella cheese72 and tomatoes18,177 have successfully been studied with HR-MAS NMR. The HR-MAS technique allows deuterium locking. Therefore, the sample is flushed/topped with (saline or buffered) D2O. 13C cross-polarization (CP)-MAS NMR has been used for dry solid samples, e.g. in structural characterisation of cutin and suberin polymers in fruits, berries, vegetables, cereal and potatoes.178 The cross-

Review of the Literature
24
polarisation improves the S/N of the non-sensitive 13C nucleus. Time-domain nuclear magnetic resonance (TD-NMR) is a low-resolution
method that measures differences in relaxation properties.179 Applicable in food authentication (e.g. milk180) and quality control (beef181), the benchtop TD-NMR instruments, or minispecs, are routinely used in the industry as a standard method in determining fat and water content in food and feed.179,182
The Carr–Purcell–Meiboom–Gill (CPMG) pulse sequence is widely used with biofluids where high-molecular weight metabolites (e.g. proteins) display broader signals than smaller molecules as they have a shorter T2 relaxation time.167 As a so-called spin-echo method, it minimises diffusion effects and exchange processes by applying a 90x° pulse followed by a (τ – 180y° – τ)n pulse train.165,166 The CPMG pulse can be applied in two-dimensional T1–T2 correlation relaxometry of complex food matrices, like egg white and yolks, fruit parenchyma and hydrocolloids.183
The general principle of site-specific nuclear isotope fractionation (SNIF-) NMR is to measure natural isotope ratios 2H/1H (or D/H) and 13C/12C. The ratios are influenced by many factors, such as origin and processing.184 SNIF-NMR is applied, for example, in the authentication and characterisation of beer185, fruit juices45, honey161, maple syrup186, vanillin187 and wine45,188. C4 syrup additions starting at 9–10% can be detected from honey.161 As a comparison, chromatographic methods can detect syrup additions of 5–10%.160
The emergence of cryogenic probes (cryoprobes) has increased the sensitivity of NMR instruments as they reduce thermal noise and increase S/N. The RF coils and preamplifiers are cooled while the immediate surroundings of the sample remain at room temperature. Microcoil probes improve again sensitivity and allow the sample volumes to be reduced to a few micro- or nanoliters. Flow-probes are used in the hyphenated hybrid technique of LC–NMR(–MS).166 The LC–NMR(–MS) can further enhance the elucidation of natural products and complex plant materials.189,190 NMR spectroscopy may revolutionalise in the near future, as the use of dynamic nuclear polarisation (DNP) method based on polarisation transfer from electron to nuclei becomes more common. DNP-NMR improves on signal intensities drastically and thus reduces data collection time significantly.191
Data pre-processing
The raw NMR metabolomics data usually consists of tens of thousands of data points representing NMR spectra and tens or hundreds of objects representing samples. The NMR data is also susceptible to the effects of the water signal and the variation in pH, temperature and ionic strength.37,192 To simplify and optimise the data analysis phase, certain data pre-processing methods need to

Review of the Literature
25
be applied. Izquierdo-García et al.193 have reviewed some of the common software packages for NMR data processing, including the AMIX (Bruker BioSpin, Germany), matNMR194, Chenomx NMR Suite (Chenomx Inc., Canada), KnowItAll (Bio-Rad Laboratories Inc., CA) and MestReNova (Mestrelab Research, Spain). These packages provide a number of functions for spectral processing and for the identification and quantification of metabolites.193 Additionally, the MVAPACK195 and the MetaboAnalyst196, for example, provide a platform for statistical and multivariate analysis.
The data processing workflow generally consists of zero filling prior to phase and baseline correction (manual/automatic) and may be complimented by apodization, spectral alignment, peak picking, integration, deconvolution, binning, normalisation and scaling.41,197 First, however, the FIDs (time-domain data) are transformed into spectra (frequency-domain data) by applying Fourier transform (FT). In phase correction, a constant or frequency independent parameter (zero-order) and a linear parameter dependent on the frequency (first-order) are added to the spectrum in order to eliminate phase distortions.193 The phase correction can be performed manually or with automated algorithms. Baseline correction removes distortions in the baseline that can negatively affect statistical and quantitative analysis.198 Automatic baseline correction usually deploys polynomial subtraction and manual corrections can further be made with polynomial, exponential, sine or spline functions.193 Baseline fitting can also be based on, for example, automated algorithm with manual point-wise correction199, locally weighted scatterplot smoothing (LOWESS)200 or asymmetric least-squares method.193,198
The S/N and the resolution of the spectra can be improved by multiplying the time-domain data prior to FT with a window function (apodisation). Exponential window function improves S/N, the extent of which can be adjusted with line-broadening (LB). Digital resolution can be enhanced with Gaussian window function or zero-filling, if the increase of acquisition time is not desirable. The Gaussian window function improves lineshapes and resolution but also increases noise. In zero-filling, a set of zero data points are added to the FID tail. In the actual spectrum, the zero points are situated between the original data points. However, whenever resolution is improved the S/N is reduced and vice versa.
The inhomogeneity of the magnetic field can severely hamper spectral quality with lineshape distortions. Shim correction based on reference deconvolution can be used to eliminate signal non-symmetry and to standardise the spectra for further analyses.201
The NMR peak misalignments along the frequency axis cause unwanted bias and noise in the data analysis phase. The misalignments common in biological samples are usually derived from variance in pH and intermolecular

Review of the Literature
26
interactions.202 While binning may dissipate some of the misalignment, spectral resolution is lost. Examples of peak alignment algorithms include, for example, interval correlated shifting (icoshift)202, correlation optimised warping (COW)203,204, dynamic time warping (DTW)205, fuzzy warping (FW)205,206, hierarchical cluster-based peak alignment (CluPA)207 and peak or recursive alignment with fast Fourier transform (PFFT/RFFT)205. Warping algorithms apply local stretching or compression, may form artefacts, are usually computationally complex and thus require hours of execution time. The use of FFT cross-correlation engine speeds up the processing.207 For example, the icoshift alignment tool, including a FFT function, allows a fast alignment of NMR peaks simultaneously for the whole dataset without forming spectral artefacts.202
Signal integration is used to determine the number of nuclei responsible for each signal. Signal integrals, relative to the number of nuclei, are proportional to the molar concentration of the compound and can also be used to determine the absolute concentrations of compounds. Suitable signal-to-noise ratio and narrow lineshapes being the requirements, the duration of recycle time, the number of scans and the receiver gain are critical parameters in achieving a obtain reliable and accurate results. In mixture analyses, signal overlapping, however, can severely complicate the integration and the quantitative analysis. Instead of the peak area, the peak height can also be used in the calculations.37
The study by del Campo et al. demonstrated how the NMR quantification of citric and malic acid, commonly present in fruits, is highly affected by the sample pH and the presence of structurally similar aspartic acid.208 Here, the accurate quantification of these acids from fruit juices required a pH-adjustment to pH 1.0 in order to avoid signal overlapping. Spraul et al. integrated the overlapped components of citric and malic acid multiplets in fruit juices after applying 2D J-resolved experiments that simplified and separated the signals.209 The accurate integration of overlapping signals can also be obtained with deconvolution, featured for example in the Chenomx NMR Suite. Modelled spectrum (reference compound libraries) and the known concentration of the internal standard are used in the quantification.37,210 Monakhova et al. exploited a set of independent component analysis (ICA) algorithms to further enhance the deconvolution of complex food samples with highly overlapping components such as sugars.211
The integration can also be challenged by the water signal. The signal tails, or moreover, the water suppression procedures can interfere the resonances near the water signal. The experimental parameters related to the solvent suppression need to be optimised to eliminate the co-suppressive (saturation) effect in neighbouring signals.37
Binning, or bucketing, is a technique often applied in metabolomics when

Review of the Literature
27
the size (and unwanted variation) of the dataset is wished to be reduced. In binning, the data is divided into regions and the subsequent region integrals form the reduced dataset in text (and subsequently tabular) form. As the spectral data usually consists of thousands of data points, the number of variables can now be reduced to hundreds to facilitate data analysis. Equally-sized regions of width 0.01–0.04 ppm are often used in metabolomics (rectangular bucketing), while variable-sized custom bins and advanced binning (based on picked peaks) are also possible.37,193,212
The unwanted vertical and horizontal variation can be eliminated from the data (now in tabular from) with normalisation and scaling, respectively. Data normalisation makes the data from all samples directly comparable with each other by generally minimising dilution effects as the variation in concentrations is removed.193,213,214 The selected normalisation method can have a significant effect on the outcome of the data analysis.214 The data can normalised either to total spectrum area (%) or to the area of a reference compound, highest peak.
Scaling targets the systematic bias in spectral intensities and the often largely varying numerical ranges of variables. Unit variance (UV) scaling divided by standard deviation, giving the variables an equal weight. UV-scaling can therefore create unwanted noise as the low-intensity variables and the baseline can be accentuated while the strong variables are attenuated. However, UV-scaling can be useful when the data consists of variables that have different units, e.g. in multi-platform datasets. Mean-centring by mean subtraction, often accompanied by the UV-scaling (hence auto-scaling), sets all variable means to zero to improve interpretation. In Pareto scaling, the variable is divided by the square root of the standard deviation. Pareto scaling is often the scaling method of choice in NMR metabolomics data as it acts as an intermediate between UV-scaling and mean-centring (also referred to as “no scaling”) and has emphasis on the medium and small features in the data. The variance in Pareto scaling equals the square root of the variable standard deviation. Both normalisation and scaling are imperative for metabolomics-based data analysis.213,215
Multivariate data analysis
Multivariate data analysis is used to extracting meaningful information from complex metabolomics data. The basic focus areas in multivariate analysis are data overview, pattern recognition, finding similarities/dissimilarities, classification, discrimination, regression and prediction modelling.215,216 Principal component analysis (PCA)217,218 is the staple in multivariate data analysis. As an unsupervised multivariate projection method, it is used to extract and display systemic variation in the data matrix (X), consisting of rows (observations) and columns (variables). PCA gives an overview of the data,

Review of the Literature
28
revealing trends, pattern, groups and outliers. Principal components (PCs) are linear combinations of the original variables and describe the variation in the dataset in descending order of magnitude. The score matrix of a PCA model represents the observations as coordinates relative to the PCs. A scatter plot of the score vectors (t) provides a summary or overview of all observations (or samples) in the data table. Loadings matrix describes which variables contributed in to the respective PCs. The loading vectors (p) define the relation among the measured variables. A loadings plot shows the influence or weight of the individual X-variables in the model and gives information of the basic patterns within the data. A model’s goodness-of-fit (explained variation) and predictive ability are expressed as R2 and Q2, respectively.166,215,219
Hierarchical cluster analysis (HCA), also an unsupervised method, is used to classify and cluster observations and/or variables based on their similarities and dissimilarities. Classified as either agglomerative or divisive HCA, the clusters are paired from bottom up or from top down in hierarchy, respectively. As a result, a cluster tree (dendrogram) is formed. The distance between clusters indicates the (dis)similarity.166,215 For example, Mazzei et al. used agglomerative HCA to classify mozzarella cheese examined with 1H HR-MAS NMR and applied Euclidean distances to measure the similarity between sample groups.72 As a result, two major clusters were formed according to the geographical origin of the cheeses.
Supervised multivariate, or pattern recognition methods are characterised by the inclusion of the data matrix Y, representing dependent variables. Partial least squares (PLS) projections to latent structures is a regression method used to find linear relationships between data blocks X and Y (containing quantitative values)220. PLS is commonly used in discriminant analysis (PLS-DA), the Y now consisting of qualitative values. Discriminant analysis requires homogenous classes in order to work. The binary code is applied to set class memberships as dummy variables forming the Y matrix. Although powerful methods as such, the PLS-based models may be negatively affected by the non-related systemic variation between the matrices.166,215,219 The orthogonal partial least squares (OPLS) is an adaptation of the PLS that separates the systemic variation in X into that of linearly related to Y and of unrelated, or orthogonal, to Y. Again, discriminant analysis can be applied (OPLS-DA). As the X-variation is concentrated to only one predictive component with one Y, and the non-predictive variation is filtered to orthogonal components, the model interpretability is improved. However, several orthogonal components can exist. The orthogonal variation allows the examination of the within-class variation. Bidirectional OPLS (O2PLS) is predictive towards both X and Y, modelling joint X–Y covariation and the Y-orthogonal variation in X or vice versa. Despite their predictive performance, both PLS and OPLS models can

Review of the Literature
29
easily be overfitted and their predictability overestimated under certain conditions, for example, in the occurrence of non-homogenous distribution of observations in classes and excess interclass variation.215,219,221
Model validation is a fundamental part of the multivariate data analysis, ruling out chance and substantiating the significance of the model. Predictive models can be validated by cross-validation, permutation test, external validation, and by predicting new observations. Cross-validation, or internal validation, gives estimates of the significance of a latent variable and the general predictive power of the model. In the cross-validation procedure, the data is divided into K groups followed by model formations, excluding one group every time. For example, a sevenfold cross-validation is applied in the SIMCA-P+ by default. In a permutation test, the position of Y-data is randomly shifted (e.g. 20 times) to appear in different order. The permuted values are compared to the R2Y and Q2Y estimates of the original model. As a result of the permutation test, the Y-axis intercepts of R2 and Q2 in a regression line plot should be less than 0.3–0.4 and 0.05, respectively, to indicate model validity.215,222
External validation is considered a comprehensive validation method that consists of building a training set and a test set with independent observations. The training set must be able to predict for example the class membership of the samples in the test set and any new observations.215,222
Besides PLS-based supervised multivariate methods, are linear discriminant analysis (LDA), k-nearest neighbours (kNN), soft independent modelling for class analogy (SIMCA) and artificial neural networks (ANN) among those of frequently utilised with NMR spectroscopic and metabolomics data. For example, Santos et al. applied SIMCA and kNN in the classification of authentic and adulterated milk samples analysed with 1H TD-NMR.180 Both models exhibited generally good sensitivity and specificity, although some false positives were revealed.
Metabolomics
Metabolomics is a field of research concentrating on studying the metabolites within a biological entity at a given time. The metabolome represents a complex of compounds derived from dynamic and complex biochemical processes of primary and secondary metabolism occurring in tissues, cells, organs or organisms, in interaction with the environment.31 Food metabolome can be defined as the pool of compounds present, subject to the influence of food origin, processing and storage.223 As food is generally of plant or animal origin, metabolomics of biological systems parallels to food metabolomics.37 The vast diversity of close to 200,000 metabolites within plants makes plant
Review of the Literature
30
foods much more complex metabolically than animal foods.31,37 Metabolomics, as so aptly put by Ward and others (2007), “… can not only assist in a deeper understanding of the complex interactive nature of … metabolic networks and their responses to genetic change but also will provide unique insights into the fundamental nature of … phenotypes in relation to development, physiology and environment”.189 Metabolomics is a powerful tool in functional genomics, plant systems biology and agriculture as it can provide a universal overview of plants combining phenotypic, morphological, clinical and other biological data with DNA, RNA, protein and metabolite analyses.224-226 Agricultural applications include trait development and biorefining.224 For example, omics-based phenotyping strategies are used in rapeseed breeding.48 Along with genomics, proteomics and transcriptomics, metabolomics complements the omics tools.
NMR metabolomics explores metabolic events and outcomes by extracting meaningful information from complex spectroscopic data with chemometrics.210 Non-NMR approaches for metabolomics study include HPLC, LC–MS, GC–MS, CE–MS (capillary electrophoresis–mass spectrometry), FT-IR (Fourier transform infrared spectroscopy) and FT-ICR–MS (Fourier transform ion cyclotron–mass spectrometry).35,227 The key advantages of NMR over chromatographic and mass spectrometric methods include simple preparation without derivatisation (e.g. silylation in GC) or fractionation, basically full recovery of samples, relatively fast analysis, simultaneous detection of several compound classes of varying concentrations and high reproducibility.35,225,228 In addition, NMR is quantitative and yields very little solvent waste. However, costly instrumentation and maintenance and low sensitivity (although, today, to a lesser extent) are recognised disadvantages of NMR.35 Even though the metabolomics approach with NMR allows the holistic and comprehensive analysis of the sample composition, only a mere fraction of the whole metabolome can be assessed at one time, as the dynamic range of metabolites can vary from picomolar to molar.37,228
Closely related to metabolomics terminologically and ideologically, metabonomics229 is focused on drug metabolism and systems biology research on biofluids. The term foodomics, referring to the use omics-techniques in field of food chemistry and nutrition, was first introduced in 2009 by Alejandro Cifuentes and subsequently adopted by researchers applying either NMR or mass spectrometry in food metabolomics.230 Metabolic fingerprinting is a global screening method suitable for complex samples as it involves the comprehensive and simultaneous analysis of a wide variety of metabolites, omitting the quantification of individual metabolites.37,41,231,232 Metabolic profiling experiments follow a more limited set of metabolites often through specific pathways and can involve metabolite identification and

Review of the Literature
31
quantification.37,41,232,233 As a useful tool for screening biological systems and dynamic processes, metabolic profiling can be used to identify changes in major metabolites according to plant genotypes.41,234 However, this approach is less applicable in identifying minor differences between sample groups, or variances in metabolites present in low levels.234 Targeted profiling focuses, according to Weljie et al.210, on quantitative analysis of specific metabolites.35 Untargeted approach in metabolomics, on the contrary, refers to the general exploration of the sample composition without specific target metabolites or the need for metabolite identification and quantification.
The general NMR metabolomics workflow, as illustrated in Figure 5, include sample preparation for direct analysis or for analysis after extraction and data acquisition, processing, analysis and interpretation.37,41 The biological variation (time of harvest, developmental stage, enzymatic degradation, oxidation) of foodstuffs should be taken into account in experimental design, sampling and sample conservation in order to avoid rapid metabolic changes.37,225,228,235 Flash-freezing using liquid nitrogen, freeze-drying and storing at −80 °C are preferred methods to retain the sample integrity in the post-sampling phase.37,228,235 Lyophilisation can also be used as a method for sample concentration and for minimising the intensity of the water resonance in the proton spectra.37 With liquid foodstuffs such as juices, wine, oils and honey, a direct analysis with only a small addition (≥ 5–10%) of d-solvent (including internal standard) combined with a solvent-suppression sequence is applicable.37,228 Otherwise, an extraction step is required. The choice of extraction solvent predefines the metabolites in focus. For example, Sobolev et al. analysed both aqueous (D2O) and lipidic fractions (CD3OD/CDCl3, 3:2, v/v) of lettuce leaves for a more comprehensive metabolic coverage of sugars, amino acids, phenolic compounds, carotenoids, pheophytins, sterols, several classes of lipids and hydrocarbons.236 Typical sample volumes of 300–750 µl may be cut down to a few microliters when so called micro- or nanoprobes are used.235 pH-adjustment by using a buffer solution or manually with additions of NaOH and HCl are usually applied to minimise variation in chemical shifts.37,228 Procedures for metabolomics, including sample preparation, have been thoroughly reviewed for example by Beckonert et al.233 and Mannina et al.37
In the past decade, NMR metabolomics in plant and food analysis has advanced substantially. The applications in the analysis of food composition, quality and authenticity have already covered most food categories: fruits and berries29,51,237-240, vegetables18,22,27,29,175,177, fish30,55,56,241, meat54,242-245, cheese72,246-248, milk180,249-251, honey159,252-257, vegetable oils169,258-262, juices73,209,263-265, tea80,266, coffee267-270, wine62,188,271-273, spirits274, cocoa64, spices71,275,276, as previously reviewed.37,40 In addition, metabolomics has been

Fi
g. 5
Sch
emat
ic il
lustr
atio
n of
the
met
abol
omic
s wor
kflo
w in
food
ana
lysis
.37,4
1,21
4
Review of the Literature 32

Review of the Literature
33
harnessed to accommodate research on food consumption and physiological monitoring in nutritional interventions.35 Table 1 summarizes the most recent NMR metabolomics studies on foodstuffs published during 2010–2016.
In agriculture, metabolomics can improve the consistency, predictability and cost-effectiveness in plant breeding when producing quality food resistant to stress and with high nutritional value.277 Discrimination of anomalous metabolic profiles can be applied in detecting of crop pathologies such as tomato mosaic virus278 and citrus greening disease279, or genetically modified crops280,281. Similarly, organically produced foods, potatoes282, tomatoes22 and milk251 as examples here, can be autheticated based on their metabolic response to the farming system, specified by e.g. the type of fertilisation used and the subsequent availability of nutrients such as nitrogen. Kim et al., Romero et al. and Sanchéz Peréz et al. used NMR metabolomics to study the effect of maturation or ripening on blackberries238, olive oil283 and tomatoes18, respectively.
As with the naturally occurring biochemical changes in the food metabolic pathways pre-harvest, the changes occurring during food processing and storage are equally ideal subjects for metabolomics-type investigation and monitoring.223 NMR metabolomics is especially trending in monitoring fermentation, as it allows a rapid screening of metabolic patterns during the dynamic process, with the inherent prospect of identifying novel compounds. Piras et al. studied metabolic changes due to the use of carbohydrates, acid production and proteolysis during the natural ripening process of cheese.247 Also, the adjunct cultures had an effect on e.g. citric acid levels.247 Spevacek et al. monitored beer metabolites in different brewing conditions.284 Dry hopping was shown to alter the yeast purine metabolism during fermentation, producing significantly different levels of adenine, adenosine and 2'-deoxyadenosine compared to late hopping.284 The extent of tea fermentation (oxidation) process can be seen, for example, in the levels of flavan-3-ols, gallic acid and caffeine, as shown by Lee et al.80
Santucci et al. monitored the occurring in climacteric fruits (peaches, plums and tomatoes) during post-harvest cold storage.29 Castejón et al. used PCA and PLS regression to classify meat samples according to their storage time and to predict the ageing time, respectively.244 The 1H NMR data of meat exudates were used to build the models. To monitor fruit freshness and shelf-life, Capitani et al. used the T2 spin–spin relaxation time-based measurements to determine the water status of intact kiwifruits237 and blueberries285. The water status analysis with a portable instrument is fast and, together with metabolite profiling and targeted analysis, can give a comprehensive result of the commercial grade and overall quality of the foodstuff.237,285 Rochfort et al. combined flavour-, aroma- and mouthfeel-related parameters from sensory

Tabl
e 1
Rece
nt N
MR
met
abol
omic
s-re
late
d re
sear
ch o
n di
ffere
nt fo
odstu
ffs (2
010–
2016
). Fo
od sa
mpl
e So
lven
t M
Hz
Dat
a an
alys
is Su
bjec
t Ke
y m
etab
olite
s Re
f. Be
ef
D2O
60
0 PC
A, O
PLS-
DA
D
iscrim
inat
ion
of g
eogr
aphi
cal o
rigin
A
min
o ac
ids,
succ
inic
aci
d 8
D2O
50
0 PC
A, P
LS
Effe
ct o
f con
serv
atio
n an
d ag
eing
Fa
tty a
cids
, ace
tic a
cid,
am
ino
acid
s, su
gars
, nu
cleo
tides
, ino
sine
24
4
CDCl
3 60
, 60
0 PC
A
Aut
hent
icat
ion
(bee
f vs.
hors
e m
eat)
Lipi
ds
54
D2O
60
0 PC
A, C
T M
etab
olic
pro
filin
g, c
lass
ifica
tion
acco
rdin
g to
the
leve
l of i
rradi
atio
n tre
atm
ent
Gly
cero
l, la
ctic
aci
d es
ters
, p-s
ubsti
tute
d ph
enol
ic c
ompo
und
245
Beer
10
% D
2O
500
PCA
, PLS
-DA
A
gein
g O
rgan
ic a
cids
, dex
trins
, aro
mat
ic c
ompo
unds
28
6 10
% D
2O
600
PCA
, LM
M
Com
posit
iona
l cha
nges
dur
ing
brew
ing
proc
esse
s, ef
fect
of h
oppi
ng
met
hod
(late
-hop
ped
vs. d
ry-h
oppe
d)
Suga
rs, a
min
o ac
ids a
nd d
eriv
ativ
es, n
ucle
o-tid
es a
nd d
eriv
ativ
es, e
nerg
y- a
nd fa
tty a
cid
met
abol
ism-re
late
d m
etab
olite
s, vi
tam
ins
284
Blac
k ra
spbe
rry
(Rub
us c
orea
nus)
D
2O; C
D3O
D/
D2O
/TFA
-d;
CDO
D3
600
PCA
, PLS
-DA
Ef
fect
of m
atur
atio
n sta
ge
Suga
rs, a
min
o ac
ids,
orga
nic
acid
s, ph
enol
ic
com
poun
ds
238
Bovi
ne m
ilk
D2O
60
0 PC
A
Clas
sific
atio
n, e
ffect
of b
reed
and
co
agul
atio
n pr
oper
ties
Carn
itine
, lac
tose
, citr
ic a
cid,
cho
line
250
CDCl
3 40
0, b
LD
A, F
DA
, PLS
-D
A
Aut
hent
icat
ion
(org
anic
vs.
conv
entio
nal)
Lipi
ds
251
Cabb
age
(Bra
ssic
a sp
p.)
CD3O
D /
sodi
um
phos
phat
e bu
ffer /
D
2O
600
PCA
, HCA
D
iscrim
inat
ion
of c
ultiv
ars a
nd
geog
raph
ical
orig
ins
GA
BA, a
cetic
aci
d, a
min
o ac
ids,
O-p
hosp
ho-
chol
ine,
phe
nyla
cetic
aci
d, su
ccin
ic a
cid,
su
cros
e
287
Carro
t (D
aucu
s ca
rota
L.)
CDCl
3, D
2O
600
Mul
tiblo
ck P
CA
Effe
ct o
f gen
otyp
e Su
gars
, am
ino
acid
s, nu
cleo
tides
, fat
ty a
cids
, ste
rols,
β-c
arot
ene
288
D2O
/CD
3OD
(2:1
), CD
Cl3
400
PCA
, AN
OV
A
Effe
ct o
f gen
otyp
e, g
eogr
aphi
cal
orig
in a
nd p
edoc
limat
e A
min
o ac
ids,
orga
nic
acid
s, su
gars
, ste
rols,
fa
tty a
cids
, cho
line,
que
rcet
in g
lyco
side,
ca
tech
in, u
ridin
e ph
osph
ate,
nia
cina
mid
e,
falc
arin
ol, c
arot
enoi
ds
289
Chee
se
40
0a PC
A, H
CA, D
A
Qua
lity
cont
rol,
auth
entic
atio
n
PUFA
s, iso
buty
lic a
lcoh
ol, l
actic
aci
d, a
cetic
ac
id
72
CDCl
3 40
0 PC
A
Det
ectio
n of
veg
etab
le fa
t, di
scrim
inat
ion
of c
hees
e ty
pes
Lipi
ds
246
D2O
40
0 PC
A, P
LS
Effe
ct o
f che
ese
ripen
ing,
A
min
o ac
ids,
orga
nic
acid
s, ch
olin
e, p
hosp
ho-
247
Review of the Literature 34

Food
sam
ple
Solv
ent
MH
z D
ata
anal
ysis
Subj
ect
Key
met
abol
ites
Ref.
auth
entic
atio
n ch
olin
e, c
arbo
hydr
ates
Ch
errie
s (Pr
unus
av
ium
L.)
Na 2
C 2O
4 buf
fer
400
PCA
, LD
A, P
LS-
DA
, SIM
CA
Char
acte
risat
ion
of g
eogr
aphi
cal
orig
in
Mal
ic a
cid,
glu
cose
, fru
ctos
e, g
luta
min
e,
succ
inic
aci
d 29
0
Citru
s fru
it (C
itrus
sp
p.)
10%
D2O
60
0 PC
A, O
PLS-
DA
Th
e ef
fect
of m
icro
envi
ronm
ent
Am
ino
acid
s, su
ccin
ic a
cid,
GA
BA, s
ugar
s, lim
onin
glu
cosid
e 16
Buffe
red
D2O
40
0 PL
S, c
ross
-va
lidat
ion
Aut
hent
icat
ion
of o
rang
e ju
ice
Not
spec
ified
26
4
KH
2PO
4 in
D2O
PCR,
PLS
D
iscrim
inat
ion
of fr
uit s
peci
es a
nd
varie
ties,
juic
e de
grad
atio
n,
quan
tific
atio
n of
met
abol
ites
Org
anic
aci
ds, e
than
ol
265
Coco
a be
ans
(The
obro
ma
caca
o L.
)
D2O
:CD
OD
3 (8:
2)
600,
40
0a O
SC, P
LS, P
CA,
PLS-
DA
, OPL
S-D
A, D
Mod
X
Geo
grap
hica
l orig
in
Am
ino
acid
s, or
gani
c ac
ids,
suga
rs, c
affe
ine,
ca
ffeic
aci
d, e
pica
tech
in
64
Coffe
e (C
offe
a sp
p.)
Sodi
um p
hosp
hate
bu
ffer /
D2O
50
0b PC
A, O
PLS-
DA
D
iscrim
inat
ion
of sp
ecie
s, va
riety
and
ge
ogra
phic
al o
rigin
Su
cros
e, c
affe
ine,
chl
orog
enic
aci
ds, c
holin
e,
amin
o ac
ids,
orga
nic
acid
s, tri
gone
lline
26
8
Buffe
r 50
0 O
PLS
Aut
hent
icat
ion
and
qual
ity o
f cof
fee
blen
ds
Ace
tic a
cid,
trigo
nelli
ne, f
orm
ic a
cid,
caf
fein
e 26
9
CD3O
D–p
hosp
hate
so
dium
buf
fer
(H2O
/D2O
, 1:1
)
500
PCA
, OPL
S-D
A
Qua
lity
asse
ssm
ent,
effe
ct o
f ge
ogra
phic
al o
rigin
Su
cros
e, G
ABA
, qui
nic
acid
, cho
line,
ace
tic
acid
, fat
ty a
cids
27
0
Cola
bev
erag
e D
2O
400
PCA
Q
ualit
y co
ntro
l Ca
ffein
e, a
cesu
lfam
e-K
, asp
arta
me,
cy
clam
ate,
ben
zoic
aci
d, H
MF,
E 1
50D
, va
nilli
n
291
Crab
mea
t Po
tass
ium
ph
osph
ate
buffe
r in
D2O
; CD
Cl3
400
PCA
, PLS
-DA
D
iscrim
inat
ion
of sp
ecie
s, nu
tritio
nal
char
acte
risat
ion,
qua
lity
asse
ssm
ent
Glu
tam
ic a
cid,
ala
nine
, gly
cine
, hom
arin
e,
lact
ic a
cid,
bet
aine
, tau
rine,
MU
FAs
292
Crab
pas
te
K2H
PO4/N
aH2P
O4
in H
2O/D
2O
400
PCA
, OPL
S-D
A
Qua
lity,
effe
ct o
f fer
men
tatio
n tim
e La
ctic
aci
d, b
etai
ne, t
aurin
e, tr
imet
hyla
min
e-N-
oxid
e, tr
igon
ellin
e, in
osin
e, a
deno
sine
diph
osph
ate,
2-p
yrid
inem
etha
nol,
amin
o ac
ids,
glut
amic
aci
d, su
cros
e, fo
rmic
aci
d,
acet
ic a
cid,
trim
ethy
lam
ine,
hyp
oxan
thin
e
293
Gar
lic (A
llium
sati-
vum
L.)
40
0a PL
S-D
A
Clas
sific
atio
n of
cul
tivar
s and
ge
ogra
phic
al o
rigin
s A
min
o ac
ids,
orga
nic
acid
s, fa
tty a
cids
, gl
ucos
e, o
rgan
osul
phur
com
poun
ds, a
llici
n 17
3
Review of the Literature 35

Food
sam
ple
Solv
ent
MH
z D
ata
anal
ysis
Subj
ect
Key
met
abol
ites
Ref.
DM
SO-d
6/D2O
60
0
PCA
Ef
fect
of t
herm
al p
roce
ssin
g Fr
ucto
se, g
luco
se, a
cetic
aci
d, fo
rmic
aci
d,
pyro
glut
amic
aci
d, c
yclo
allii
n, H
MF
294
Gra
pe (V
itis s
pp.)
CD3O
D :
KH
2PO
4 bu
ffer i
n D
2O (1
:1)
600
PCA
, PLS
-DA
, O
PLS-
DA
M
etab
olic
cha
ract
erisa
tion
of
culti
vars
A
min
o ac
ids,
chol
ine,
suga
rs, o
rgan
ic a
cids
, fla
vono
ids,
phen
ylpr
opan
oids
20
Gra
pe m
arc
spiri
t D
2O :
oxal
ate
buffe
r 60
0 PC
A, O
PLS-
DA
Ef
fect
of o
rigin
, gra
pe g
enot
ype
and
vint
age
Am
ino
acid
s, et
hyl e
sters
, fus
el a
lcoh
ols,
succ
inic
aci
d, la
ctic
aci
d, su
gars
, pol
yols
274
Haz
elnu
t (Co
rylu
s av
ella
na L
.) CD
3OD
60
0 PC
A, C
T A
uthe
ntic
atio
n, e
ffect
of o
rigin
, cl
assif
icat
ion
(raw
vs.
roas
ted)
Tr
igon
ellin
e, a
min
o ac
ids,
o-di
subs
titut
ed
arom
atic
com
poun
d 63
Hon
ey
CDCl
3 60
0 PC
A, P
LS-D
A
Det
erm
inat
ion
of b
otan
ical
orig
in
Terp
ene
acid
s, he
xana
l, ch
rysin
, pyr
rolo
dine
de
rivat
ive
295
D2O
40
0 PC
A, H
CA,
KN
N, S
IMCA
, PL
S-D
A
Clas
sific
atio
n of
bot
anic
al o
rigin
, di
scrim
inat
ion
and
dete
ctio
n of
ad
ulte
ratio
ns, p
redi
ctio
n of
hon
ey
type
Am
ino
acid
s, su
gars
, org
anic
aci
ds, H
MF,
et
hano
l 25
5
CDCl
3 60
0 PC
A, O
2PLS
-DA
D
eter
min
atio
n of
bot
anic
al o
rigin
Fl
avon
oids
, γ‐LACT‐3‐PKA,8‐hydroxy‐
linalool,dehydrovom
ifoliol,caffeine,m
ono‐
terpeneacids
252
D2O
50
0 O
PLS-
DA
D
iscrim
inat
ion
of g
eogr
aphi
cal o
rigin
M
ono-
, di-,
tri-
and
tetra
sacc
harid
es
61
10%
D2O
PCA
, OPL
S-D
A
Det
erm
inat
ion
of b
otan
ical
orig
in
Form
ic a
cid,
tyro
sine,
phe
nyla
cetic
aci
d,
dehy
drov
omifo
liol
253
KH
2PO
4 in
D2O
/ H
2O /
D2O
40
0 IC
A, J
AD
E A
uthe
ntic
atio
n, d
eter
min
atio
n of
bo
tani
cal o
rigin
, qua
ntifi
catio
n of
m
etab
olite
s
Suga
rs, o
rgan
ic a
cids
, HM
F, e
than
ol,
met
hylg
lyox
al, d
ihyd
roxy
acet
one
159
Hum
an b
reas
t milk
D
2O
600
PCA
, PLS
-DA
Ef
fect
of m
ater
nal p
heno
type
and
die
t on
the
hum
an m
ilk m
etab
olom
e (o
ligos
acch
arid
es)
Fuco
se, 2
’-fuc
osyl
lact
ose,
3’-f
ucos
ylla
ctos
e la
ctod
ifuco
tetra
ose,
lact
o-N-
tetra
ose,
lact
o-N-
fuco
pent
aose
I, 6
’-sia
lylla
ctos
e
296
D2O
pho
spha
te
buffe
r 40
0 PL
S-D
A
Disc
rimin
atio
n (s
ecre
tors
vs.
non-
secr
etor
s)
2’‐fucosyllactose,lactodifucotetraose,
lacto‐
N‐fucopentaoses,lacto‐N‐
difucohexaoses
297
Ice
crea
m
CDCl
3 40
0 PC
A
Det
ectio
n of
veg
etab
le fa
t Fa
tty a
cids
and
este
rs
246
Man
go (M
angi
fera
sp
p.)
Oxa
late
buf
fer /
D
2O
500
PCA
D
iscrim
inat
ion
of c
ultiv
ars
Arg
inin
e, h
istid
ine,
phe
nyla
lani
ne,
glut
amin
e, sh
ikim
ic a
cid,
trig
onel
line
263
Review of the Literature 36

Food
sam
ple
Solv
ent
MH
z D
ata
anal
ysis
Subj
ect
Key
met
abol
ites
Ref.
Mus
sels
D
2O; C
DCl
3 80
0 PC
A, P
LS-D
A
Disc
rimin
atio
n of
spec
ies,
effe
ct o
f or
igin
G
luco
se, a
min
o ac
ids,
hom
arin
e, o
rgan
ic
acid
s, ta
urin
e, b
etai
ne
298
Oliv
e oi
l CD
Cl3
500
PCA
, LD
A, P
LS-
DA
, SIM
CA,
CART
Aut
hent
icat
ion,
geo
grap
hica
l ch
arac
teris
atio
n A
lcoh
ols,
stero
ls, h
ydro
carb
ons,
toco
pher
ols
259
CHCl
3 60
PL
S D
etec
tion
of a
dulte
ratio
n of
oliv
e oi
l w
ith h
azel
nut o
il Li
pids
26
1
CDCl
3 40
0/
500
PCA
, pt-P
LS-
(DA
), O
PLS-
W2A
, OCP
LS2
Culti
var c
lass
ifica
tion,
fing
erpr
intin
g Li
pids
26
2
Peac
h (P
runu
s per
-si
ca L
.) D
2O p
hosp
hate
bu
ffer
600
PCA
, AN
OV
A
Met
abol
ic p
rofil
ing
of v
arie
ties
Suga
rs, a
min
o ac
ids,
myo
-inos
itol,
chol
ine,
fumaricacid,quinicacid,chlorogenicacid,
neochlorogenicacid
51
Na 2
HPO
4/NaH
2PO
4 in
D2O
60
0 PC
A, P
LS
Effe
ct o
f pos
t-har
vest
stora
ge
Am
ino
acid
s, ch
olin
e, e
than
ol, m
etha
nol,
gala
ctur
onic
aci
d, su
gars
, pol
yphe
nols,
or
gani
c ac
ids
29
Pepp
er (C
apsi
cum
an
nuum
L.)
40
0a PL
S-D
A
Disc
rimin
atio
n of
cul
tivar
s and
ge
ogra
phic
al o
rigin
Su
gars
, am
ino
acid
s, or
gani
c ac
ids,
olef
ins,
fatty
aci
ds, a
scor
bic
acid
17
5
Plum
(Pru
nus s
p.)
Na 2
HPO
4/ N
aH2P
O4 i
n D
2O
600
PCA
, PLS
Ef
fect
of p
ost-h
arve
st sto
rage
A
min
o ac
ids,
chol
ine,
eth
anol
, met
hano
l, ga
lact
uron
ic a
cid,
ket
obut
yric
aci
d, su
cros
e,
flavo
noid
s, po
lyph
enol
s, or
gani
c ac
ids,
urid
ine,
UD
P, U
DPG
29
Pork
mea
t H
2O/D
2O
600,
a PC
A
Mea
t qua
lity
of d
iffer
ent p
ork
bree
ds
Am
ino
acid
s, ca
rnos
ine,
glu
cose
, cho
line
deriv
ativ
es, c
reat
ine,
lact
ic a
cid
Pota
to (S
olan
um
tube
rosu
m L
.)
400a
PCA
, PLS
-DA
D
iscrim
inat
ion
of v
arie
ties a
nd
farm
ing
syste
ms (
orga
nic
vs.
conv
entio
nal)
Tota
l nitr
ogen
, car
bon
and
hydr
ogen
; am
ino
acid
s, or
gani
c ac
ids,
suga
rs
282
D2O
40
0c / 50
0 PC
A, P
LS-D
A
Effe
ct o
f the
rmal
pro
cess
ing
(raw
vs.
steam
ed)
Suga
rs, a
min
o ac
ids,
orga
nic
acid
s 29
9
Saffr
on (C
rocu
s sa
tivus
L.)
DM
SO-d
6 50
0 PC
A, O
PLS-
DA
Q
ualit
y co
ntro
l, ef
fect
of o
rigin
Pi
croc
roci
n, c
roci
ns
71
DM
SO-d
6 50
0 PC
A, O
PLS-
DA
Q
ualit
y co
ntro
l G
lyco
sides
of c
roce
tin a
nd p
icro
croc
in, f
ree
suga
rs a
nd fa
tty a
cids
27
5
DM
SO-d
6 60
0 O
(2)P
LS-D
A
Aut
hent
icat
ion
Not
spec
ified
27
6 Sa
lmon
(Sal
mo
sa-
CDCl
3 40
0 SI
MCA
D
iffer
entia
tion
of w
ild a
nd fa
rmed
O
leic
aci
d, li
nole
ic a
cid
300
Review of the Literature 37

Food
sam
ple
Solv
ent
MH
z D
ata
anal
ysis
Subj
ect
Key
met
abol
ites
Ref.
lar)
fis
h D
2O;
CD3O
D/C
DCl
3 40
0 PC
A, O
PLS-
DA
Ef
fect
of d
ieta
ry se
sam
in o
n fis
h m
etab
olom
e G
luco
se, g
lyco
gen,
leuc
ine,
val
ine,
cre
atin
e,
carn
itine
, lac
tic a
cid,
nuc
leos
ides
24
1
D2O
60
0 K-
inde
x M
onito
ring
post-
mor
tem
cha
nges
in
diffe
rent
stor
age
cond
ition
s Bi
ogen
ic a
min
es
30
Sea
buck
thor
n (H
ippo
phaë
rham
-no
ides
L.)
D2O
40
0 PC
A
Berry
qua
lity,
effe
ct o
f gen
otyp
e Su
gars
, am
ino
acid
s, or
gani
c ac
ids
239
KH
2PO
4 in
D2O
/ CD
3OD
60
0 PC
A, P
LS-D
A
Gen
otyp
e-re
late
d fin
gerp
rints,
qua
lity
L-Q
uebr
achi
tol,
mal
ic a
cid,
suga
rs, f
atty
ac
ids,
flavo
nes
240
Tea
(Cam
ellia
si
nens
is L.
) Ph
osph
ate
buffe
r in
H2O
/D2O
50
0 PC
A, O
PLS-
DA
Ef
fect
of c
limat
e an
d ge
ogra
phic
al
orig
in
Thea
nine
, am
ino
acid
s, qu
inic
aci
d, g
luco
se,
epic
atec
hin
(EC)
, epi
gallo
cate
chin
(EG
C),
epig
allo
cate
chin
-3-g
alla
te (E
GCG
), ca
ffein
e
301
H2O
/D2O
50
0 PC
A
Effe
ct o
f fer
men
tatio
n Ep
icat
echi
n, e
piga
lloca
tech
in, e
pica
tech
in-3
-ga
llate
, epi
gallo
cate
chin
-3-g
alla
te, t
hean
ine,
al
anin
e, a
cetic
aci
d, q
uini
c ac
id, g
luta
mic
ac
id, c
affe
ine,
sucr
ose,
glu
cose
, gal
lic a
cid
80
H2O
/D2O
50
0 PC
A, P
LS-D
A,
OPL
S-D
A
Effe
ct o
f geo
grap
hica
l orig
in
Thea
nine
, iso
leuc
ine,
leuc
ine,
val
ine,
al
anin
e, th
reon
ine,
glu
tam
ine,
qui
nic
acid
, gl
ucos
e, e
pica
tech
in, e
piga
lloca
tech
in, e
pi-
gallo
cate
chin
-3-g
alla
te, c
affe
ine
266
Tom
ato
(Sol
anum
ly
cope
rsic
um L
.)
500a
PCA
Ti
ssue
diff
eren
tiatio
n, e
ffect
of
ripen
ing
Suga
rs, c
utin
, mal
ic a
cid,
citr
ic a
cid,
lipi
ds,
amin
o ac
ids
18
EDTA
in D
2O
400
PCA
, LD
A
Aut
hent
icat
ion
(org
anic
vs.
conv
entio
nal)
Mal
ic a
cid,
asp
arag
ine,
asp
artic
aci
d,
fruct
ose,
glu
cose
, hist
idin
e, c
holin
e,
thre
onin
e, tr
igon
ellin
e, a
deno
sine
mon
opho
spha
te
22
D2O
70
0 PC
A
Met
abol
ic p
rofil
ing
at d
iffer
ent s
tage
s of
ripe
ning
, aut
hent
icat
ion,
de
term
inat
ion
of g
eogr
aphi
cal o
rigin
Glu
cose
, fru
ctos
e, fa
tty a
cids
, citr
ic a
cid,
al
anin
e, m
etha
nol,
acet
ylgl
utam
ic a
cid,
G
ABA
, glu
tam
ine,
glu
tam
ic a
cid,
asp
artic
ac
id
177
CDCl
3 40
0 PC
A
Effe
ct o
f gro
win
g se
ason
α-
Toco
pher
ol, u
nsat
urat
ed li
pids
, ch
loro
phyl
ls, p
hosp
holip
ids
27
Na 2
HPO
4/NaH
2PO
4 in
D2O
60
0 PC
A, P
LS
Effe
ct o
f pos
t-har
vest
stora
ge
Am
ino
acid
s, fe
rulic
aci
d, su
ccin
ic a
cid,
ga
lact
uron
ic a
cid,
sucr
ose,
UD
PG
29
Win
e 10
% D
2O
800
PCA
, PLS
-DA
Se
nsom
ics,
effe
ct o
f var
iety
and
ber
ry
Suga
rs, a
min
o ac
ids,
prol
ine,
ace
tic a
cid,
27
1
Review of the Literature 38

Food
sam
ple
Solv
ent
MH
z D
ata
anal
ysis
Subj
ect
Key
met
abol
ites
Ref.
shad
ing
succ
inic
aci
d, m
alic
aci
d, g
lyce
rol,
etha
nol
CD3O
D
500
PCA
, PLS
, O
PLS,
O2P
LS
Sens
omic
s, ef
fect
of w
ine
type
and
vi
ntag
e 2,
3-Bu
tane
diol
, mal
ic a
cid,
pro
line,
tarta
ric
acid
, lac
tic a
cid,
succ
inic
aci
d, th
reon
ine,
fla
vono
ls, fl
avan
-3-o
ls
272
10%
D2O
60
0 PC
A, E
CVA
, iE
CVA
Ef
fect
of f
erm
enta
tion
stage
, pr
oduc
tion
year
, orig
in (t
erro
ir)
Suga
rs, e
than
ol, l
actic
aci
d, m
alic
aci
d,
isope
ntan
ol, i
sobu
tano
l 27
3
KH
2PO
4 in
D2O
40
0 PC
A, L
DA
, M
AN
OV
A
Aut
hent
icat
ion;
effe
ct o
f var
iety
, ge
ogra
phic
al o
rigin
and
vin
tage
Sh
ikim
ic a
cid,
caf
taric
aci
d, 2,3‐butanediol,
lacticacid,aceticacid,proline,succinic
acid,m
alicacid,glycerol,tartaricacid,
glucose,phenoliccom
pounds,aminoacids
62
a H
R-M
AS,
hig
h-re
sona
nce
mag
ic-a
ngle
spi
nnin
g. b
13C-
base
d an
alys
is. c
Qua
ntita
tive
in s
itu a
naly
sis.
Abb
revi
atio
ns:
AN
N,
artif
icia
l ne
ural
net
wor
k; A
NO
VA
, ana
lysis
of
varia
nce;
CA
RT, c
lass
ifica
tion
and
regr
essio
n tre
e; C
T, c
lass
ifica
tion
tree;
DA
, di
scrim
inan
t an
alys
is; D
Mod
X,
dista
nce
to m
odel
; H
CA,
hier
arch
ical
clu
ster
anal
ysis;
ICA
, in
depe
nden
t co
mpo
nent
ana
lysis
; (i)
ECV
A,
(inte
rval
) ex
tend
ed c
anon
ical
var
iate
ana
lysis
; JA
DE,
joi
nt a
ppro
xim
ate
diag
onal
isatio
n of
eig
enm
atric
es;
K-in
dex,
in
dica
tor
of f
ish f
resh
ness
; K
NN
, k-n
eare
st ne
ighb
ours
; LD
A, l
inea
r di
scrim
inan
t an
alys
is; L
MM
, lin
ear
mix
ed-e
ffect
s m
odel
; M
AN
OV
A,
mul
tivar
iate
ana
lysis
of
varia
nce;
O(2
)PLS
(-DA
), or
thog
onal
par
tial
leas
t sq
uare
s (d
iscrim
inan
t an
alys
is);
OCS
, or
thog
onal
sig
nal
corre
ctio
n; O
CPLS
2, o
rthog
onal
con
strai
ned
parti
al l
east
squa
res
proj
ectio
n to
lat
ent
struc
ture
s; O
PLS-
W2A
, or
thog
onal
Wol
d’s
two-
bloc
ks M
ode
A P
LS; P
CA, p
rinci
pal c
ompo
nent
ana
lysis
; PLS
, par
tial l
east
squa
res
/ pro
ject
ion
to la
tent
str
uctu
res;
PLS-
DA
, pa
rtial
lea
st sq
uare
s di
scrim
inan
t an
alys
is; p
t-PLS
, po
st-tra
nsfo
rmat
ion
PLS;
SIM
CA,
soft
inde
pend
ent
mod
ellin
g of
cla
ss a
nalo
gy.
Review of the Literature 39

Review of the Literature
40
analysis with NMR metabolomics data to evaluate the quality characteristics and sensory properties of wines.271 The rapid and inexpensive analysis can reduce the need for sensory analysis in wine quality control.271 The high-throughput, automated, push-button NMR-based analytical tools have taken field in food industry as they improve the cost-efficiency and the time management of food quality control. For example, the quantitative flow-injection NMR with automated data analysis is used in mixture analysis of fruit juices, as described by Spraul et al.209
The use of non-targeted fingerprinting in official food control was reviewed by Esslinger et al.302 The quality assessment and authentication of virgin olive oil by NMR spectroscopy was reviewed by Dais & Hatzakis.169 Although highly applicable in food authentication and detection of hazards or manipulations, food fingerprinting is challenged by appropriate validation, standardisation, harmonisation and databases in order to function as a routine procedure.40,302
Summary
Food, as it ultimately consists of tissues, cells, organs or organisms of animal, plant and/or microbial origin, and of the products of their metabolism, is susceptible to numerous endo- and exogenous factors influencing its composition and quality. The origin of a food or a raw ingredient is one of the key elements that influence the occurence and concentration of food metabolites. The sensory properties, shelf life and the nutritional quality of foods are subject to extensive variation derived from the genetic foundation, growth place, weather, soil, agricultural practices, harvest, processing and storage conditions.
The food genotype (species, subspecies, variety, cultivar and breed) determines the preconditions but adaptation and acclimation to varying environments increase the prevalence of different phenotypes by altering the primary and secondary metabolism. To a large extent, the geographical origin determines the climatic charactersitics and prevailing abiotic stress factors, mainly on account of latitude and altitude. High latitudes generally correlate with cooler climates and long photoperiods but reduced exposures to solar irradiation. The abiotic stress can result in a higher bioactive and nutritional value of the food plants as they aim to protect themselves by accumulating secondary metabolites. The natural fluctuations in weather conditions cause seasonal variation between harvests. For example, the sea buckthorn berry composition is subject not only to genetic variation among subspecies and cultivars. As highly adaptable to harsh environments, the berries of sea buckthorn exhibit different phenotypes according to the growth conditions. The

Review of the Literature
41
time of harvest and the stage of ripeness also contribute to the berry composition and quality. Similarly, the Brassica oilseeds, naturally rich in linoleic acid and α-linolenic acid, show compositional variation according to their genetic and geographical background. Abiotic stress can delay the seed development and ripening and alter the lipid, protein and secondary metabolism.
Honey, as an example of food susceptible for origin-related fraudulence, is a multifaceted natural product representing various floral sources and/or honeydew of insect origin. The compositional, sensory and physical characteristics of honey reflect the source of nectar (or honeydew) collected and processed by the honeybees. The limitations of the established practices in honey quality control can lead to ambiguity in the honey characterisation and to subsequent mislabelling. Both the botanical and geographical origins of honey are targets for economically motivated adulteration and fraud.
NMR spectroscopy, especially when used in metabolomics, offers a wide aptitude in food analysis aiming to advance food authenticity, traceability, quality and safety and to understand the biological mechanisms derived from the origin-related prerequisites. Metabolomics is an effective tool in understanding metabolic pathways through non-targeted and targeted analysis of metabolites associated with specific genotypes, geographical origin, exposure and/or resistance to biotic and abiotic stress, and seasonal variation related to the food origin and prevailing growth conditions. Chemometrics and multivariate tools facilitate the analysis of complex mixtures that foods generally are and enable the relevant information to be extracted and interpreted. The advantage in the fundamentally untargeted character of NMR metabolomics allows novel findings, such as bioindicators of environmental stress or markers of origin, to surface.

Aims of the Study
42
3 AIMS OF THE STUDY
The general aim of the study was to use NMR metabolomics to investigate effect of origin on the composition and quality of sea buckthorn berries, Brassica oilseeds and honey. With sea buckthorn berries and oilseeds, the objective was to investigate the effect of genotype and growth environment, with special emphasis on the effect of northern latitudes and related conditions. With honey, the objective was to authenticate the botanical origin and the key markers of Finnish honeys.
The objectives of the individual studies were to: I Investigate the effect of genotype and growth environment on wild sea
buckthorn berries of two subspecies from Finland and China, respectively; II Investigate the effect of genotype, growth environment and the
developmental stage on the seeds of oilseed rape and turnip rape in Finland;
III Discriminate and find markers of Finnish varietal honeys of different botanical origins; and
IV Investigate the effect of genotype and growth environment on sea buckthorn berries of two Finnish cultivars grown in different locations in Finland and Canada.

Materials and Methods
43
4 MATERIALS AND METHODS
Samples
The sample sets in this study were (I) wild sea buckthorn berries (Hippophaë rhamnoides ssp. rhamnoides from Finland and H. rhamnoides ssp. sinensis from China), (II) ripened and developing seeds of oilseed rape (Brassica napus) and turnip rape (B. rapa) from five locations in Finland, (III) honeys of nine different botanical origins and (IV) cultivated sea buckthorn berries (H. rhamnoides ssp. rhamnoides cv. 'Terhi' and 'Tytti') from different growth sites in Finland and Canada.
Sea buckthorn berries
4.1.1.1 Wild sea buckthorn
Two of the sub-studies were focused on sea buckthorn berries, Hippophaë rhamnoides L. (Elaegnaceae). In the first study (I), wild sea buckthorn (H. rhamnoides ssp. rhamnoides;) berry samples were collected from three locations in Finland: Uusikaupunki in 2007–2010 (latitude 61° N, longitude 21° E; altitude 1 m), Kemi in 2008–2009 (65° N, 24° E; 1 m) and Taapajärvi in 2007–2010 (67° N, 24° E; 170 m) (Figure 6). The wild shrubs were transplanted in 1992 from the island of Karta on the coastal area of the Gulf of Bothnia to both Uusikaupunki and Taapajärvi in order to investigate the effect of latitude and environmental conditions on the berry composition. Karta is located 1 km apart from the Uusikaupunki growth site. The berries from Kemi were picked from wild bushes on a small uninhabited island off the coast.
All the Chinese berries (H. rhamnoides ssp. sinensis) were collected from natural growth sites in six locations in 2006: Hebei (latitude 41° N, longitude 116° E; altitude 818 m; harvest date Oct 29); Heilongjiang (47° N, 127° E; 210 m; Nov 28); Ordos (39° N, 109° E; 1480 m; Nov 24); Shanxi (37° N, 113° E; 1512 and 2182 m; Oct 21); Sichuan (31° N, 106° E; 2000, 2500 and 3000 m; Oct 20) and Qinghai (36° N, 101° E; 3115 m; Oct 29) (Figure 6).
Neither fertilisers nor pesticides/herbicides were used on the bushes. The berries were picked in a randomised manner from several shrubs when optimally ripe (except in Taapajärvi, 2008, when the berries were picked as unripe and semi-ripe), then frozen and stored immediately at −20 °C until analysed. The optimal ripeness for harvest and consumption of the berries was determined by experienced local pickers.
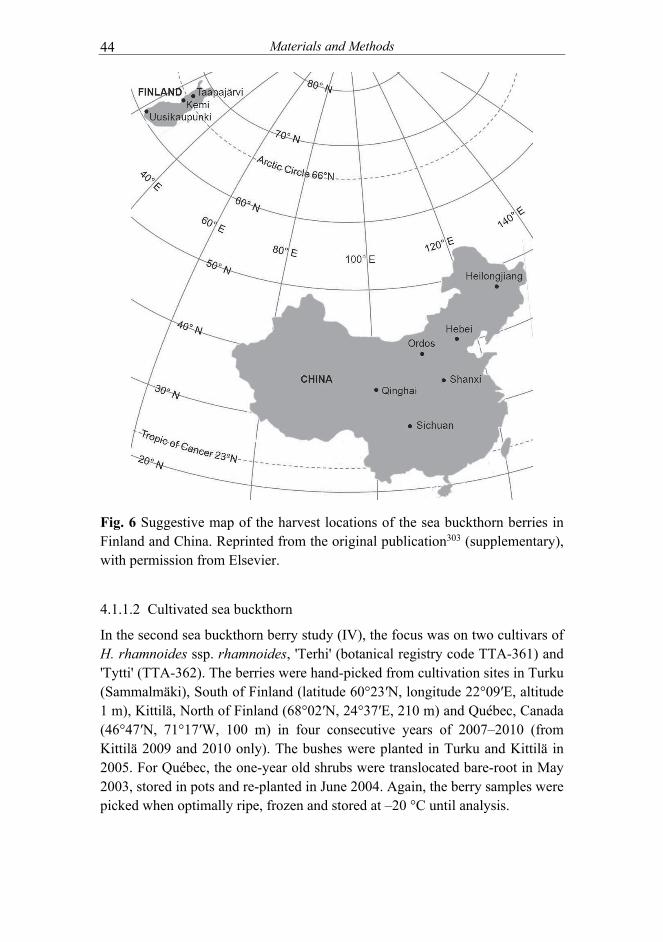
Materials and Methods
44
Fig. 6 Suggestive map of the harvest locations of the sea buckthorn berries in Finland and China. Reprinted from the original publication303 (supplementary), with permission from Elsevier.
4.1.1.2 Cultivated sea buckthorn
In the second sea buckthorn berry study (IV), the focus was on two cultivars of H. rhamnoides ssp. rhamnoides, 'Terhi' (botanical registry code TTA-361) and 'Tytti' (TTA-362). The berries were hand-picked from cultivation sites in Turku (Sammalmäki), South of Finland (latitude 60°23′N, longitude 22°09′E, altitude 1 m), Kittilä, North of Finland (68°02′N, 24°37′E, 210 m) and Québec, Canada (46°47′N, 71°17′W, 100 m) in four consecutive years of 2007–2010 (from Kittilä 2009 and 2010 only). The bushes were planted in Turku and Kittilä in 2005. For Québec, the one-year old shrubs were translocated bare-root in May 2003, stored in pots and re-planted in June 2004. Again, the berry samples were picked when optimally ripe, frozen and stored at –20 °C until analysis.

Materials and Methods
45
Brassica oilseeds
4.1.2.1 Ripened seeds
Ripened seeds of low erucic acid spring rape (oilseed rape; Brassica napus L. ssp. oleifera) and spring turnip rape (Brassica rapa L. ssp. oleifera) of the 2011 crops were received via MTT Agrifood Research Finland (current Natural Resources Institute Finland – Luke) from the official variety test trial sites in Hauho, Inkoo, Jokioinen, Maaninka and Pernaja (Figure 7).129 The five trial sites situated in different cultivation zones according to their geographical location: Inkoo (I; 60° N, 25° E) and Pernaja (P; 60° N, 26° E) were located in zone I, Jokioinen (J; 61° N, 24° E) and Hauho (H; 61°N, 25° E) in zone II and Maaninka (M; 63° N, 27° E) in zone III, respectively. The zonal classification is based on the temperature sum accumulation of a region during growing season129.
Fig. 7 Locations of the open field sites.129 Reprinted from the original publication304 (supplementary), with permission from Elsevier.
The oilseed rape genotypes were 'Belinda' (hybrid; from I/P/H), 'Brando' (hybrid; H), 'DLE 1006' (I/P/H), 'DLE 1107' (I/P/H), 'Early Bird' (I), 'Highlight' (I/P/H), 'Lunedie' (I), 'Majong' (hybrid; I/P/J/H), 'Marie' (I/P/H), 'Mirco CL' (hybrid; I/J/H), 'Proximo' (I/P/J/H), 'SW Q2865' (I/P/J/H), 'Tamarin' (I/H) and 'Trapper' (hybrid; I/P/J/H). The turnip rape genotypes chosen for this study were 'Aurea CL' (I/P/J/H), 'Bor 05075' (I/P/J/H/M), 'Bor 05100' (I/P/J/H/M), 'Bor 07010' (I/P/J/H), 'Cordelia' (J), 'Juliet' (J), 'SW Petita' (I/P/J/H/M) and 'Viikki 11' (I/P/J/H). Weeds and pests were controlled according to the protocol of the test sites. The plots were harvested when fully matured and the yield
Materials and Methods
46
obtained was dried after harvest to a moisture content of approximately 9%. Seeds from one or two block samples were randomly selected for extraction.
4.1.2.2 Developing seeds
The seed development was followed under controlled conditions, representing both optimal and stress conditions. The oilseed rape genotypes 'Marie' and 'Bor 01000' and the turnip rape genotypes 'SW Petita' and 'Bor 05075' were cultivated as described by Vuorinen et al. (2014).21 Optimal growing conditions were created in a growth room and in a greenhouse at +22 °C with 16 h day length and at +15–20 °C with 16–19 h day length, respectively. Stress conditions were created with the reduced temperature (+15 °C, 16 h) in a growth chamber. The siliques were harvested at and pooled to correspond 2, 3 and 4 weeks after flowering (WAF; start of flowering observed approximately 30 and 50 days after germination for turnip rape and oilseed rape, respectively21), with ± 3 days marginal per weekly time point and stored temporarily at −20 °C. The seeds were gently plucked with tweezers (on ice) and stored at −80 °C.
Honey
For the third (III) sub-study, twenty Finnish honeys of varying origins of nectar (or honeydew) were acquired with the aid of the Finnish Beekeepers’ Association (Helsinki, Finland). The honeys were harvested in 2012 and 2013. The botanical origins of the honey samples were buckwheat (Fagopyrum esculentum; samples 1, 2 and 20), dandelion (Taraxacum officinale; samples 3–5 and 18), heather (Calluna vulgaris; samples 10–12 and 19), Himalayan balsam (Impatiens glandulifera; sample 14), linden (Tilia spp.; sample 9), lingonberry (Vaccinium vitis-idaea; sample 16) and clover (Trifolium repens/hybridum; sample 8). Three samples of honeydew honeys (samples 6, 7 and 13) and two multifloral honeys (samples 15 and 17) were also included in the study. Samples 1–17 were acquired directly from the producers (of which 3–16 via the Finnish Beekeepers’ Association), while samples 18–20 were bought from a producer’s market stand. The samples were from eleven different beekeepers and 15 geographical origins from different parts of Finland (the exact origins of the samples 18–20 was not known, but they were from the same producer). The honeys were harvested by the beekeepers prior to the end of flowering of the focal plant. Dandelion and lingonberry honeys were harvested at the end of June. All the other honey types, excluding heather, were harvested during late July to early August. Heather honey, as a late variety, was harvested in mid-August. The honeys were handled and stored according to each beekeeper’s customary practices. The samples were stored in the ambient temperature and protected from light prior to analyses.

Materials and Methods
47
Methods
Sample preparation
In studies I and IV, the sea buckthorn berries were deseeded, freeze-dried, and ground in liquid nitrogen prior to extraction. Berry powder (100 mg) was mixed with 4 ml acetone–water (7:3, v/v), vortexed and sonicated for 10 min in RT, followed by centrifugation (Heraeus Labofuge 200, Hanau, Germany) at 968 × g for 10 min. The extraction was repeated after supernatant collection. The pooled supernatants were frozen at −80 °C, after which the samples were dried in a vacuum centrifuge (Heto Holten Maxi-Dry Plus, Allerød, Denmark). The dry residue was dissolved in 800 µl of formate-buffered deuterium oxide (D2O) containing 0.05% (TSP), pH 3.75. After filtration (0.45 µm), the sample pH was adjusted to 2.70 with 1 N NaOH (in D2O) and 57% HCl (in H2O). An aliquot of 600 µl was transferred into a 5-mm NMR tube for analysis.
In study II, the ripened seeds of oilseed rape / turnip rape (100 mg) were extracted in 1.5 ml cyclohexane using an Ultra-Turrax T 25 homogeniser (IKA Works, Wilmington, NC), equipped with an 8 G dispersing element. The extract was centrifuged (1730 × g, 10 min), separated, evaporated under a N2-flow and re-dissolved in 600 µl chloroform-d (CDCl3). The seeds were re-extracted with CDCl3 and methanol-d4 (CD3OD), sonicating for 30 min in 1.5 ml solvent, respectively. All three extracts were filtered (0.45 µm) and stored in −20/−80 °C until analysis, prior to which 600 µl of extracts were transferred to 5-mm NMR tubes.
The developing oilseeds were removed from the siliques and pooled according to the time point. The seeds (50 mg) were extracted with 800 µl CDCl3 by crushing the seeds with a stirring rod, followed by vortexing for 1 min and sonicating for 10 min. The extract was filtered and stored at −80 °C.
In study III, a 100 mg of honey (mixed by stirring) was combined with 800 µl of ultrapure H2O (Millipore, Billerica, MI). After a 5 min vortexing, the sample was centrifuged (14,000 × g, 1 min, 20 °C) and filtered by ultracentrifugation (3 kDa; Amicon, Millipore). Internal standard DSS-d6 (23 µl; 4.6187 mM in D2O, with 0.2% NaN3) was added to the filtrate (207 µl). The pH of the mixture was adjusted to 6.55 ± 0.05 with NaOH and/or HCl. An aliquot of 180 µl was transferred to a 3-mm NMR tube for analysis. Selected honey samples were also extracted with chloroform and analysed in 600 µl CDCl3 according to Schievano et al.295
In each study, three independent technical replicates were performed in order to take the effect of potential matrix inhomogeneity into account. Each replicate was analysed once.
Materials and Methods
48
Nuclear magnetic resonance (NMR) spectroscopy
The instrument used in studies I, II and IV was a 500 MHz Bruker Avance spectrometer (Bruker BioSpin AG, Fällanden, Switzerland), equipped with a broadband inverse autotune probe (BBI-5mm-Zgrad-ATM) and operating at 500.13 MHz for proton and at 125.76 MHz for carbon-13 (Instrument Centre, Department of Chemistry, University of Turku, Finland). The instrument used in the study III was a 600 MHz Bruker Avance III spectrometer, equipped with a 5-mm triple resonance inverse cryoprobe (CPTCI) and a temperature-controlled SampleJet sample changer (Nuclear Magnetic Resonance Facility, UC Davis, CA).
In studies I and IV, the water-suppressed proton spectra were acquired at 25 °C with 1D NOESY presaturation pulse programme (noesypr1d), consisting of 320 scans, an acquisition time of 3.28 s, a recycle delay of 4 s, a mixing time of 100 ms and a 90°-pulse of 6.9 µs. Free induction decays (FIDs) were collected with 64 k data points, covering a spectral width of 10 kHz. Prior to Fourier transform, an exponential line-broadening function of 0.3 Hz was applied to the FIDs. Other 1D and 2D standard experiments, like DQF-COSY (cosygpmfqf), HMBC (hmbcgplpndqf), HSQC (hsqcetgpsi2), CH2-edited HSQC (hsqcedetgpsisp2), NOESY (noesygp) and 1D TOCSY (selmlgp) were applied to a selection of samples.
In study II, a standard zg30 pulse programme of 160 scans (64 k, 10 kHz) was applied with acquisition time of 3.28 s, relaxation delay of 7 s, and 90° pulse of 6.90 µs. Automatic receiver gain, with the exception of set value of 90 for CD3OD extracts, was used. A selection of samples were subjected to additional DQF-COSY (cosygpmfqf), HMBC (hmbcgplpndqf), HSQC (hsqcetgpsi2), CH2-edited HSQC (hsqcedetgpsisp2) and 1D TOCSY (selmlgp) experiments.
In study III, a noesypr1d pulse programme with 128 scans, 16 dummy scans, 32 k data points, sweep width of 12 ppm, acquisition time of 2.5 s, relaxation delay of 2.5 s, mixing time of 100 ms and receiver gain of 32 was used for the aqueous samples (298 K). An irradiation of 70 dB for water presaturation was applied. The chloroform extracts were analysed with a zg30 pulse at 298 K using 512 scans, 8 dummy scans, 32 k data points and spectral width of 14 ppm.
Spectral processing
The spectra (studies I, II and IV) were pre-processed with TopSpin 1.3 software (Bruker Biospin GmbH, Rheinstetten, Germany), followed by binning with the AMIX toolkit (Bruker Biospin GmbH). In study III, Chenomx NMR

Materials and Methods
49
Suite 8.0 (Chenomx Inc., Edmonton, Canada) was applied in both pre-processing and binning. Baseline and phase correction were performed manually and/or automatically. Bin widths of 0.002 (I, IV), 0.04 (II) and 0.02/customised ppm (III) were used. In general, the spectral areas covering solvent peaks and redundant or no information were excluded from the datasets.
In study I, the bin integrals and spectral intensities were scaled to positive intensities and normalised to the reference region of TSP, respectively. The spectral alignment tool icoshift202 was used in the Matlab environment (MATLAB® R2015b, MathWorks Inc., Natick, MA via CSC – IT Center for Science Ltd.). Customised intervals were designed for the spectral data to minimise spectral misalignment. Correlation shifting based on the calculated average spectrum with additional pre-correlation shifting phase was applied. The maximum allowed shift per interval was determined automatically and the missing values were replaced with ‘NaN’.
In study II, bin widths of 0.04 ppm were used. Scaling to positive intensities and normalisation to total intensity was applied to bin integrals and spectral intensities, respectively. In study III, the spectra were first zero-filled to 128 k data points. Shim correction to 0.5 Hz with subsequent line broadening of 0.5 Hz was applied (Chenomx Processor). The data was normalised to the total spectral area.
In study IV, a shim correction to a linewidth of 0.9 Hz was applied (Chenomx Processor). The data was firstly reduced to 0.02 ppm-sized bins and normalised to total spectral area after which the spectral data from technical replicates were averaged and customised variable-sized bins, containing preferably only signals from single metabolites when applicable, were created in Excel.
The NMR peaks and metabolites were assigned and identified, using literature, the Chenomx NMR Suite 7.5–8.1 software and the metabolite databases Human Metabolome Database (HMDB; http://www.hmdb.ca/)305, Spectral database for Organic Compounds (SDBS; http://riodb01.ibase.aist.go.jp/sdbs/; National Institute of Advanced Industrial Science and Technology, Japan), Yeast Metabolome Database (YMDB; http://www.ymdb.ca/)306. Selected samples were subjected to additional 2D NMR experiments.
Origin-related background information
4.2.5.1 Meteorological data (crops)
The meteorological data used in studies I and IV was collected by the Finnish Meteorological Institute (Helsinki, Finland) and the National Climate Data and

Materials and Methods
50
Information Archive of the Environment Canada (Fredericton, New Brunswick, Canada). Weather data for China was unavailable. Data from the weather stations of Kustavi Isokari (latitude 60° N, longitude 21° E, altitude 4 m), Kemi-Tornio Airport (65° N, 24° E, 19 m), Rovaniemi Airport (66° N, 25° E, 195 m) were used for the locations of Uusikaupunki, Kemi and Taapajärvi, respectively. The data from Turku Artukainen (60° N, 22° E, 8 m), Kittilä Pokka (68° N, 25° E, 275 m) and the Jean Lesage International Airport (46° N, 71° W, 74 m) were used for Turku, Kittilä and Québec, respectively.
The meteorological data for the study II for Inkoo, Pernaja, Jokioinen, Hauho and Maaninka was from Espoo Sepänkylä (60° N, 25° E, 31 m), Porvoo Harabacka (60° N, 26° E, 22 m), Jokioinen Observatory (61° N, 24° E, 104 m), Hämeenlinna Lammi Pappila (61° N, 25° E, 125 m) and Maaninka Halola (63° N, 27° E, 90 m), respectively.
The total number of days, effective days (Tmean > +5 °C), hot days (Tmax > +25 °C), temperature sum (sum of daily average temperatures), effective temperature sum (degree days; the sum of positive difference between daily average temperatures and +5 °C), global radiation sum, average relative humidity and precipitation sum were calculated for each location. The daily records from the start of the growing season until the harvest date were included. The weather data was used in multivariate modelling after UV-scaling.
4.2.5.2 Melissopalynological analysis (honey)
The botanical roots of the honeys (study III) were surveyed by an expert from the Finnish Beekeepers’ Association using a standard melissopalynological (pollen) test.149,307 Circa 400 pollen grains were microscoped, identified and counted for each honey sample. Relative percentages of pollen types were calculated based on the test.
Statistics and multivariate data analysis
The SIMCA-P+ 12.0.1 software (MKS Instruments AB, Umeå/Malmö, Sweden; former Umetrics AB, Umeå, Sweden) was used for the multivariate data analyses. Mean-centring, Pareto-scaling and unit variance (UV) scaling was used in different cases. Principal component analysis (PCA), partial least squares discriminant analysis (PLS-DA) and orthogonal partial least squares discriminant analysis (OPLS-DA) were used to create the multivariate models. In the supervised models, a classification according to subspecies, species, cultivar, botanical origin, or geographical origin was used. The PLS-DA models were validated by performing a permutation test of 20 permutations.
In study I, independent samples t-test or Mann–Whitney U test (non-

Materials and Methods
51
parametric variables) were used to test statistically significant (p < 0.05) differences within the data. In study IV, Pearson’s correlation coefficients were calculated for selected weather variables and bins.

Results and Discussion
52
5 RESULTS AND DISCUSSION
NMR metabolomics reveals the phenotypic plasticity in sea buckthorn berry composition in respect to genotype × environment interaction
Wild sea buckthorn berries
The berries from Uusikaupunki (60° N; example spectrum in Figure 8) and Kemi (65° N) were easily distinguished by the relatively high levels of ethyl glucoside (2.1–3.3 and 0.7–1.7 g/100 g, fw), whereas berries from Taapajärvi (67° N) had lower levels of the ethyl glucoside (37–180 mg/100 g), but intensive signals of malic (4.9–8.1 g/100 g). The level of glucose, ethyl glucoside, quinic acid and trigonelline were statistically different between the berries from Uusikaupunki and Taapajärvi (p < 0.05), indicating responsiveness to the climate as affected by latitude and phenotypic plasticity among the plants of the same genetic origin. Although the geographical distance between Kemi and Taapajärvi is relatively short, the locations situate at different zones. In the northern temperate watershed area, Kemi’s proximity to the Bothnian Bay affects its climate (middle boreal climate zone).308 Taapajärvi, above the Arctic Circle, belongs to the northern boreal zone. In comparison, the climate in Uusikaupunki is hemiboreal – generally the most favourable in Finland.
Degree days, symbolising the total energy available for the crop, are defined as the sum of values exceeding the threshold (+5 °C in the Nordic countries).57 Here, the effective temperature sums of 1210–1340 °Cd were recorded in Uusikaupunki as the highest (Table 2). In the north, the sums were up to 600 °Cd lower. The discrimination of ssp. rhamnoides was mainly associated with typically higher temperature, radiation and humidity and lower precipitation in the south, yielding higher levels of ethyl glucoside and glucose, and lower levels of malic, quinic and ascorbic acids. Ascorbic and quinic acids showed positive correlation with the precipitation sum, being representative of the northernmost berries. Seasonal variation in precipitation may also partly explain why the levels of ascorbic acid in the Uusikaupunki berries were 83–104% higher in 2007–2008 compared to 2009–2010.
In China (ssp. sinensis), high altitudes had a strong effect on berry composition, correlating positively with ascorbic and malic acids. The profile of sea buckthorn from high altitudes (2000–3000 m) and low latitude (31° N) in Sichuan differed from the other samples of ssp. sinensis. The berries from Sichuan contained hardly any sugars, whereas signals of L-quebrachitol and high contents of ascorbic acid dominated the sugar region of the NMR spectra. The berries of Qinghai (36° N, 3115 m) also exhibited higher levels of ascorbic

Fig.
8 T
he f
ull
1 H N
MR
spec
trum
(sa
mpl
e fro
m U
usik
aupu
nki,
Finl
and,
200
9).
The
area
of
5.30
–9.3
0 pp
m i
s zo
omed
for
clo
ser
obse
rvat
ion.
Abb
revi
atio
ns: H
is, h
istid
ine;
Phe
, phe
nyla
lani
ne; T
rg, t
rigon
ellin
e; T
SP, t
rimet
hylsi
lyl p
ropi
onic
-d4 a
cid
(sta
ndar
d); T
yr,
tyro
sine.
Rep
rinte
d fro
m th
e or
igin
al p
ublic
atio
n303 (
supp
lem
enta
ry),
with
per
miss
ion
from
Else
vier
.
Results and Discussion 53
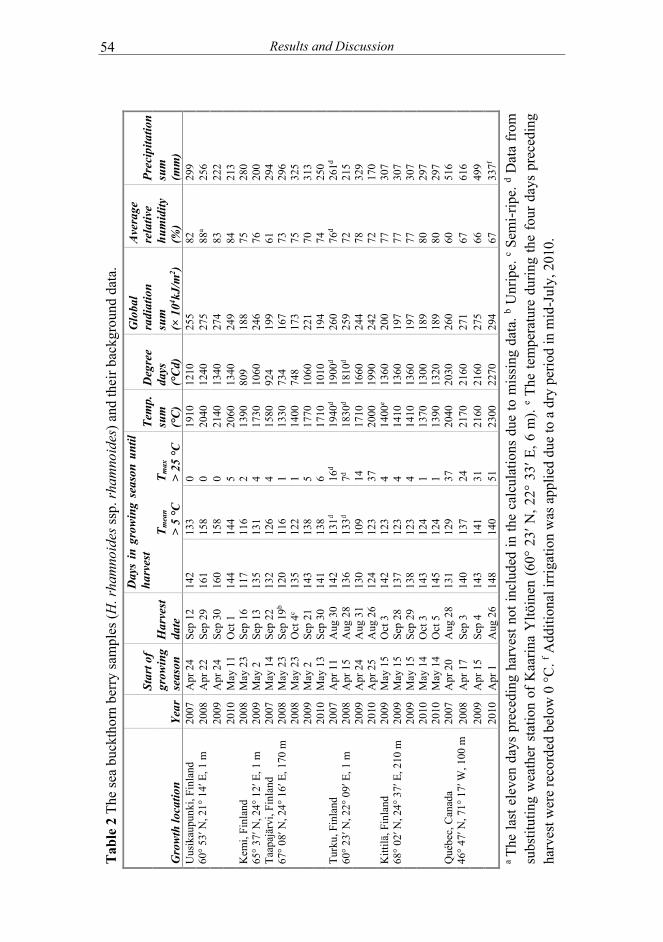
Tabl
e 2 T
he se
a bu
ckth
orn
berry
sam
ples
(H. r
ham
noid
es ss
p. rh
amno
ides
) and
thei
r bac
kgro
und
data
.
Gro
wth
loca
tion
Year
Star
t of
grow
ing
seas
on
Har
vest
da
te
Day
s in
gro
wing
sea
son
until
ha
rves
t Te
mp.
su
m
(°C)
Deg
ree
days
(°
Cd)
Glo
bal
radi
atio
n su
m
(× 1
04 kJ/m
2 )
Aver
age
rela
tive
hum
idity
(%
)
Prec
ipita
tion
sum
(m
m)
T m
ean
> 5
°C
T max
>
25 °C
U
usik
aupu
nki,
Finl
and
60° 5
3′ N
, 21°
14′
E, 1
m
2007
A
pr 2
4 Se
p 12
14
2 13
3 0
1910
12
10
255
82
29
9 20
08
Apr
22
Sep
29
161
158
0 20
40
1240
27
5
88a
256
2009
A
pr 2
4 Se
p 30
16
0 15
8 0
2140
13
40
274
83
22
2 20
10
May
11
Oct
1
144
144
5 20
60
1340
24
9
84
213
Kem
i, Fi
nlan
d 65
° 37′
N, 2
4° 1
2′ E
, 1 m
20
08
May
23
Sep
16
117
116
2 13
90
809
18
8
75
280
2009
M
ay 2
Se
p 13
13
5 13
1 4
1730
10
60
246
76
20
0 Ta
apaj
ärvi
, Fin
land
67
° 08′
N, 2
4° 1
6′ E
, 170
m
2007
M
ay 1
4 Se
p 22
13
2 12
6 4
1580
92
4
199
61
29
4 20
08
May
23
Sep
19b
120
116
1 13
30
734
16
7
73
296
2008
M
ay 2
3 O
ct 4
c 13
5 12
2 1
1400
74
8
173
75
32
5 20
09
May
2
Sep
21
143
138
5 17
70
1060
22
1
70
313
2010
M
ay 1
3 Se
p 30
14
1 13
8 6
1710
10
10
194
74
25
0 Tu
rku,
Fin
land
60
° 23′
N, 2
2° 0
9′ E
, 1 m
20
07
Apr
11
Aug
30
142
131d
16d
1940
d
1900
d 26
0
76d
261d
2008
A
pr 1
5 A
ug 2
8 13
6 13
3d 7d
1830
d 18
10d
259
72
21
5 20
09
Apr
24
Aug
31
130
109
14
1710
16
60
244
78
32
9 20
10
Apr
25
Aug
26
124
123
37
2000
19
90
242
72
17
0 K
ittilä
, Fin
land
68
° 02′
N, 2
4° 3
7′ E
, 210
m
2009
M
ay 1
5 O
ct 3
14
2 12
3 4
1400
e 13
60
200
77
30
7 20
09
May
15
Sep
28
137
123
4 14
10
1360
19
7
77
307
2009
M
ay 1
5 Se
p 29
13
8 12
3 4
1410
13
60
197
77
30
7 20
10
May
14
Oct
3
143
124
1 13
70
1300
18
9
80
297
2010
M
ay 1
4 O
ct 5
14
5 12
4 1
1390
13
20
189
80
29
7 Q
uébe
c, C
anad
a 46
° 47′
N, 7
1° 1
7′ W
, 100
m
2007
A
pr 2
0 A
ug 2
8 13
1 12
9 37
20
40
2030
26
0
60
516
2008
A
pr 1
7 Se
p 3
140
137
24
2170
21
60
271
67
61
6 20
09
Apr
15
Sep
4 14
3 14
1 31
21
60
2160
27
5
66
499
2010
A
pr 1
A
ug 2
6 14
8 14
0 51
23
00
2270
29
4
67
337f
a Th
e la
st el
even
day
s pr
eced
ing
harv
est n
ot in
clud
ed in
the
calc
ulat
ions
due
to m
issin
g da
ta. b U
nrip
e. c S
emi-r
ipe.
d Dat
a fro
m
subs
titut
ing
wea
ther
sta
tion
of K
aarin
a Y
ltöin
en (6
0° 2
3′ N
, 22°
33′
E, 6
m).
e The
tem
pera
ture
dur
ing
the
four
day
s pr
eced
ing
harv
est w
ere
reco
rded
bel
ow 0
°C. f A
dditi
onal
irrig
atio
n w
as a
pplie
d du
e to
a d
ry p
erio
d in
mid
-Jul
y, 2
010.
Results and Discussion 54

Results and Discussion
55
and malic acids. For the berries from Ordos (39° N, 1480 m), the dominating compound was glucose, but the level of malic acid was lowest of all the samples. Visually, the berries from Shanxi (37° N, 1512/2182 m), Heilongjiang (47° N, 210 m) and Hebei (41° N, 818 m) had quite similar profiles. The results were in accordance with the earlier report the berry juice of ssp. sinensis.67
Methyl glucoside was present in both subspecies at fairly low levels (≤ 0.1 g/100 g). Statistically significant differences between the subspecies were shown by the levels of ascorbic acid (p < 0.01), methyl glucoside (p < 0.01), L-quebrachitol (p < 0.01) and phenylalanine (p < 0.05). The PCA, explaining 63% of the total variance by the first two principal components, showed excellent goodness-of-fit (R2X(cum) = 0.93) and sound predictive ability (Q2(cum) = 0.78).
Full discrimination between the subspecies was achieved with the first (X: 26.5%, Y: 56.2%) and third (X: 13.7%, Y: 16.7%) component in PLS-DA, owing to the strong variable influence of ethyl glucoside and malic acid for ssp. rhamnoides (Finland) and ssp. sinensis (China), respectively. For the Chinese berries, fructose was also a positive correlation. Fructose had a negative weight on both the first and second PLS components.
Compared to earlier reports based on chromatographic analysis of the sea buckthorn berries3,33,98, both advantages and disadvantages can be stated for NMR metabolomics. Whereas NMR allows a wider range of metabolites to be examined in a single analysis without derivatisation, fractionation and need for standard compounds, the analysis of inositols, fructose and citric acid is challenged by overlapping signals. Still, even though these resonances would visually seem obstructed, the multivariate power is generally able to extract the latent information within the NMR data.
Cultivars 'Terhi' and 'Tytti'
The two cultivars, although possessing very similar traits because of their genetic background91, were discriminated by relatively higher levels of quinic acid in the berries of 'Terhi' and ethyl glucoside in 'Tytti'. Malic acid was also present at higher levels in 'Tytti'. Both cultivars were generally low in fructose, compared to the wild berries of the same subspecies or ssp. sinensis in study I. Overall, Finnish berries of ssp. rhamnoides are low in total sugar compared to other subspecies of Russian or Chinese origin.309
The metabolic profiles of the berries of cv. 'Terhi' and 'Tytti' varied greatly between northern (Kittilä, 68° N) and southern Finland (Turku, 60° N) and Canada (Québec, 46° N). The PCA loadings suggested positive correlations between Kittilä and quinic acid (bin 2.02) and Québec and ethyl glucoside (1.23, 4.48). Turku on the other hand correlated negatively with malic acid (2.86). Berries from the high latitude had relatively higher levels of quinic acid,
Results and Discussion
56
glucose, L-quebrachitol and ascorbic acid. Kittilä samples contained much lower levels of ethyl glucoside compared to berries from Turku or Québec. Relatively higher levels of free essential amino acids (phenylalanine, tyrosine, tryptophan and valine) were also detected in the Kittilä berries. As in study I, phenylalanine correlated with high latitude, underpinning its role as a precursor for phenolic compounds in the phenylpropanoid pathway.76 Berries from the Turku correlated positively with ethyl glucoside and negatively with malic acid. Berries from Québec correlated positively with malic acid and negatively with quinic acid and ethyl glucoside. Whereas the relative air humidity during the growth season has been shown to correlate positively with ethyl glucose, methyl-myo-inositol, malic acid and total acid in wild sea buckthorn (study I) and berries of ssp. mongolica, with 'Terhi' and 'Tytti' such trend was not seen.
Ethyl glucoside, characteristic to ssp. rhamnoides, did not accumulate during ripening in the north, unlike in the south. The southern growth conditions, especially degree days and global radiation, correlated positively (r = 0.63 and r = 0.59, respectively) with ethyl glucoside. The average natural daily photoperiod during the growth season (until ripe) was 10 h (ranging 0–18 h) in Turku and 6 h (0–20 h) in Kittilä. While the highest daily sunlight period was recorded in Kittilä, the daily average was lower than in the south. Parallel to Taapajärvi and Uusikaupunki in study I, Kittilä and Turku belong to the northern boreal and hemiboreal zone, respectively.308 Ethyl glucoside was shown to accumulate six-fold at the late stage of maturation in the south. The overripe berries were also characterised by lower levels of glucose, malic acid and quinic acid, and higher levels of phenylalanine, tyrosine, choline and uridine. The already low levels of ethyl glucose in Kittilä did not increase in overripe berries, indicating that the northern conditions do not favour the formation of the metabolite. The high content of ethyl glucoside in the overripe berries suggests that the compound may act as either a storage compound or as a protective compound against heat/light stress in the south and/or ethanol-induced toxicity.310
The influence of genotype, growth conditions and developmental stage on Brassica oilseeds
Ripened seeds
In addition to the major lipids present in the cyclohexane extracts, choline (in CDCl3) with sucrose and sinapic acid esters (in CD3OD, Table 3), the minor seed components generally lost during oil processing and refining, were detected. A higher content of polyunsaturated fatty acids and sucrose were observed in turnip rape, while the overall oil content and sinapine levels were

Results and Discussion
57
Table 3 Chemical shift assignments of the 1H NMR signals from the methanol
extracts with HSQC correlations.
Multi-plicitya
Chemical shift (ppm) J (Hz)
HSQC correlation (ppm)
Functional group Attribution
s 0.72 CH3-18 sterol s 0.73 CH3-18 sterol m 0.84 CH3
t 0.90 7.2 13.2 CH3 saturated fatty acids, oleic acid
t 0.91 CH3 linoleic acid t 0.97 7.5 CH3 α-linolenic acid d 1.09 6.9 CH3 d 1.15 6.2 CH3 s 1.22 m 1.31 (CH2)n acyl s 1.45 m 1.61 OCO-CH2-CH2 acyl s 1.97 m 2.04 26.8 CH2-CH=CH unsaturated m 2.33 33.6 OCO-CH2 acyl t 2.77 6.3 =CH-CH2-CH= linoleic t 2.81 5.8 =CH-CH2-CH= linolenic s 3.21 53.0 N(CH3)3 cholinyl s 3.22 53.0 N(CH3)3 cholinyl s 3.26 53.0 N(CH3)3 cholinyl s 3.35 48.3 N(CH3)3 cholinyl dd/t 3.36 9.6 69.9 CH-4 sucrose (α-Glcb) dd 3.43 3.6; 9.8 71.7 CH-2 sucrose (α-Glc) d 3.60 12.2 62.7 CH2-6 sucrose (β-Fruc) d 3.64 12.2 62.7 CH2-6’ sucrose (β-Fru) m 3.71 73.0 CH-3 sucrose (α-Glc) m 3.75 61.8 CH-6 sucrose (β-Fru) m 3.77 CH-5 sucrose (β-Fru) m 3.77 CH2-N(CH3)3 O-phosphocholine s 3.89 55.5 OCH3-3/5 sinapine t 4.03 74.1 CH-4 sucrose (β-Fru) d 4.09 8.2 77.9 CH-3 sucrose (β-Fru) dd 4.16 6.2; 12.0 CH2-OCOR glycerol (sn-1/3) br 4.27 dd 4.36 3.8; 12.0 CH2-OCOR glycerol (sn-1/3) m 4.55–4.62 m 4.66 P-O-CH2 O-phosphocholine m 5.27 CH-OCOR glycerol (sn-2) m 5.34 129.3 CH=CH unsaturated d 5.39 3.9 92.1 CH-1 sucrose (α-Glc) d 5.41 3.9 raffinose/stachyose (α-Glc) d 6.44 15.9 CH-β sinapine s 6.93 105.7 aromatic CH-2/6 sinapine d 7.69 15.9 CH-α sinapine d 7.73 15.9 CH-α sinapic acid ester s 8.09 a Multiplicity: s, singlet; d, doublet; t, triplet; dd, doublet of doublets; m, multiplet; br, broad signal. b α-Glc, O-α-D-glucopyranosyl. c β-Fru, β-D-fructofuranoside.

Results and Discussion
58
higher in oilseed rape. However, absolute discrimination among the oilseed species was not established here. The effect of genotype on the oilseed metabolome at cultivar-level was not included within this study as the cultivar traits were negligible compared to the influence of species and, to some extent, growth place. In PCA applied to the cyclohexane extracts, the weight of the allylic methylene bin of 2.05 indicated a higher content of PUFAs firstly in B. rapa and especially in the northernmost location, Maaninka. Both observations were consistent with prior knowledge as low temperature is known to increase the level of ALA.21 High content of ALA may be desirable for dietary reasons, yet, as it is easily oxidised, the quality and shelf life of the oil can be decreased and the possible health benefits adversed.118,119
In PCA applied to the CD3OD extract data, the loadings of the third component revealed the key metabolites discriminating the species as sinapine for B. napus and polyunsaturated fatty acids and sucrose for B. rapa. The average daily temperatures of 16–17 °C were recorded in all location, while the highest and lowest temperature sums were in Pernaja (B. napus, 2130 °C) and Maaninka (B. rapa, 1310 °C), respectively. The OPLS-DA applied to the CD3OD extracts revealed a positive correlation among the samples from Pernaja and Maaninka, owing to sucrose and cholinyl resonances. The growth sites on zone II correlated each other, likely owing to their close proximity and similar weather conditions. In that respect, since oilseed rape generally matures slower than turnip rape, the relatively higher temperature and radiation conditions in Pernaja may have promoted the seed maturation as to correspond the compositional characteristics of turnip rape grown in Maaninka.
Developing seeds
The NMR profiles of the two oilseed rape and two turnip rape genotypes revealed the metabolic differences in optimal and cold conditions at different stages of early seed development. During the first weeks after flowering, the degree of unsaturation (δ 0.97 and 1.30 ppm, Figure 9) was shown to increase more in relation to the overall lipid content (δ 0.88 and 1.25 ppm). The lipid composition changed more between 2 and 3 WAF than between 3 and 4 WAF, indicating that the desaturation is activated at this stage after the primary fatty acid biosynthesis.124 Concurrently, a decrease in the terminal methyl resonance at δ 0.83 ppm occurred. Although the sampling of the siliques from the greenhouse (15–20 °C, 16–19 h), growth room (22 °C, 16 h) and low-temperature (15 °C, 16 h) test was uneven, the PCA modelling showed several trends along the first component (R2X[1] = 0.88, Q2[1] = 0.86). The same trend was seen as in Figure 9, as the 2 WAF and 3–4 WAF samples were split on positive and negative sides of the component, respectively. The respective loadings indicated a relatively lower level of acyl (–CH2–) resonances

Results and Discussion
59
corresponding those of saturated and oleic acids (δ 1.20 and 1.24 ppm) in 2 WAF and relatively higher levels of acyl resonances of polyunsaturated fatty acids (δ 1.28 and 1.32 ppm) in 3 and 4 WAF. The low-temperature treatment mimicking the effect of growth conditions in northern latitudes delayed the development by a week and correlated with the higher level of unsaturation. The results were consistent with the previous findings of increasing expression levels of acyltransferase, elongase and desaturase genes DGAT1–3, FAE1 and FAD3 from the 3 or 4 WAF time point on.21
Fig. 9 An example of the effect of seed development stage on lipid profile. The aliphatic range in this figure shows some of the differences between the seeds picked 2 weeks after flowering (black spectra) and the seeds picked 3 or 4 weeks after flowering (grey spectra) affect. As the seed develops, the content of polyunsaturated fatty acids increases, while the 0.83 ppm resonances decrease. Reprinted from the original publication304 (supplementary), with permission from Elsevier.

Results and Discussion
60
Botanical origin of honey is elucidated by NMR fingerprints and multivariate modelling
According to the melissopalynological data (Table 4), many of the samples contained pollen from Apiaceae (e.g. angelicas), Brassicaceae (oilseed rape, turnip rape), Rubus spp. (mainly raspberry), Salix spp. (willows) and Trifolium spp. (white/alsike and red clover), of which the pollen of Apiaceae and Brassicaceae is generally over-represented.152 These are generally the most prevalent pollen types found in Finnish honeys.152 In the pollen analysis, honeydew honeys were characterised by the presence of fungal spores, hyphae and microscopic algae at a ratio of honeydew elements-to-pollen grains exceeding three (> 3).149 With NMR, melezitose and trehalose, with fumaric, lactic, malic, and succinic acids were assigned markers of honeydew. Asparagine and aspartic acid were also present in honeydew honey at detectable levels. The marker present in the organic extract, diacylglyceryl ether, complimented the results.311 In PCA, the data polarised into honeydew and floral honeys as the honeydew-specific saccharide melezitose, and glucose and fructose for floral honeys had the strongest influence on the distribution. The first two principal components explained 83% of the total variation in the PCA model (R2X(cum) = 0.99 and Q2(cum) = 0.96).
While the dandelions (Taraxacum spp.) are commonly available for foraging and rich in nectar, only few grains of pollen can be found in honeys. Here, 0–2.4% of the pollen in the dandelion honeys was from Taraxacum, highlighting the ambiguity of pollen-based identification. In fact, most of the honeys contained regulatory-wise insufficient levels (< 45%) of pollen from the signified botanical origin. The second principal component in PCA could be seen as an approximate indicator of fructose-to-glucose (F/G) ratio and thus the possible origin of nectar. Low F/G ratio indicates readiness to crystallisation. Honeys with high F/G ratio, on the other hand, stay liquid. Based on the PCA, dandelion honey had the highest relative content of glucose, consistent with prior knowledge.312 Novel markers in dandelion honeys were detectable in the aliphatic region of the spectra and identified as 2-hydroxy-3-methylbutyric, 2-hydroxy-3-methylpentanoic, 3-methyl-2-oxopentanoic and 4-methyl-2-oxopentanoic acids (Figure 10, Figure 11). These metabolites were present at low levels and varying proportions. Although the structures of these compounds suggest that they could be products of microbial fermentation, they still can be regarded as specific for dandelion honey. Unlike dandelion honey, clover honey was distinguished by the relatively high and low levels of fructose and glucose, respectively. Buckwheat pollen can be regarded as under- represented pollen types, consistent with previous knowledge.312 The levels of
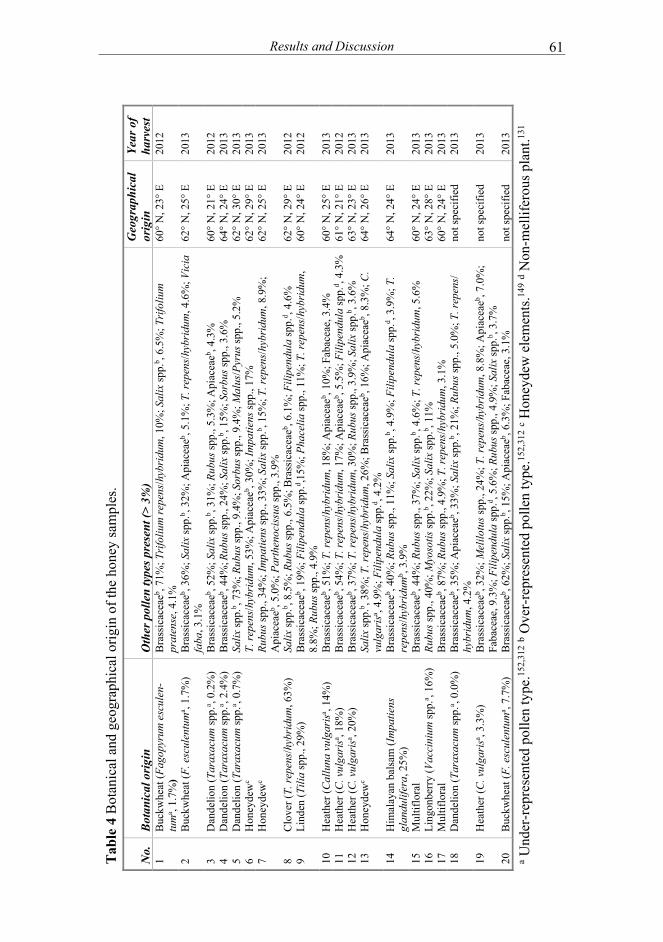
Tabl
e 4
Bota
nica
l and
geo
grap
hica
l orig
in o
f the
hon
ey sa
mpl
es.
No.
Bo
tani
cal o
rigin
O
ther
pol
len
type
s pre
sent
(> 3
%)
Geo
grap
hica
l or
igin
Ye
ar o
f ha
rves
t 1
Buck
whe
at (F
agop
yrum
esc
ulen
-tu
ma ,
1.7%
) Br
assic
acea
eb , 71
%; T
rifol
ium
repe
ns/h
ybrid
um, 1
0%; S
alix
spp.
b , 6.
5%; T
rifol
ium
pr
aten
se, 4
.1%
60
° N, 2
3° E
20
12
2 Bu
ckw
heat
(F. e
scul
entu
ma ,
1.7%
) Br
assic
acea
eb , 36
%; S
alix
spp.
b , 32
%; A
piac
eaeb ,
5.1%
; T. r
epen
s/hyb
ridu
m, 4
.6%
; Vic
ia
faba
, 3.1
%
62° N
, 25°
E
2013
3 D
ande
lion
(Tar
axac
um sp
p.a ,
0.2%
) Br
assic
acea
eb , 52
%; S
alix
spp.
b , 31
%; R
ubus
spp.
, 5.3
%; A
piac
eaeb ,
4.3%
60
° N, 2
1° E
20
12
4 D
ande
lion
(Tar
axac
um sp
p.a ,
2.4%
) Br
assic
acea
eb , 44
%; R
ubus
spp.
, 24%
; Sal
ix sp
p.b ,
15%
; Sor
bus s
pp.,
3.6%
64
° N, 2
4° E
20
13
5 D
ande
lion
(Tar
axac
um sp
p.a ,
0.7%
) Sa
lix sp
p.b ,
73%
; Rub
us sp
p., 9
.4%
; Sor
bus s
pp.,
9.4%
; Mal
us/P
yrus
spp.
, 5.2
%
62° N
, 30°
E
2013
6
Hon
eyde
wc
T. re
pens
/hyb
ridum
, 53%
; Api
acea
eb , 30
%; I
mpa
tiens
spp.
, 17%
62
° N, 2
9° E
20
13
7 H
oney
dew
c Ru
bus s
pp.,
34%
; Im
patie
ns sp
p., 3
3%; S
alix
spp.
b , 15
%; T
. rep
ens/h
ybri
dum
, 8.9
%;
Api
acea
eb , 5.
0%; P
arth
enoc
issus
spp.
, 3.9
%
62° N
, 25°
E
2013
8 Cl
over
(T. r
epen
s/hyb
ridu
m, 6
3%)
Salix
spp.
b , 8.
5%; R
ubus
spp.
, 6.5
%; B
rass
icac
eaeb ,
6.1%
; Fili
pend
ula
spp.
d , 4.
6%
62° N
, 29°
E
2012
9
Lind
en (T
ilia
spp.
, 29%
) Br
assic
acea
eb , 19
%; F
ilipe
ndul
a sp
p.d ,1
5%; P
hace
lia sp
p., 1
1%; T
. rep
ens/h
ybrid
um,
8.8%
; Rub
us sp
p., 4
.9%
60
° N, 2
4° E
20
12
10
Hea
ther
(Cal
luna
vul
garis
a , 14
%)
Bras
sicac
eaeb ,
51%
; T. r
epen
s/hyb
ridum
, 18%
; Api
acea
eb , 10
%; F
abac
eae,
3.4
%
60° N
, 25°
E
2013
11
H
eath
er (C
. vul
gari
sa , 18
%)
Bras
sicac
eaeb ,
54%
; T. r
epen
s/hyb
ridum
, 17%
; Api
acea
eb , 5.
5%; F
ilipe
ndul
a sp
p.d ,
4.3%
61
° N, 2
1° E
20
12
12
Hea
ther
(C. v
ulga
risa ,
20%
) Br
assic
acea
eb , 37
%; T
. rep
ens/h
ybrid
um, 3
0%; R
ubus
spp.
, 3.9
%; S
alix
spp.
b , 3.
6%
63° N
, 23°
E
2013
13
H
oney
dew
c Sa
lix sp
p.b ,
38%
; T. r
epen
s/hyb
ridum
, 26%
; Bra
ssic
acea
eb , 16
%; A
piac
eaeb ,
8.3%
; C.
vulg
arisa ,
4.9%
; Fili
pend
ula
spp.
d , 4.
2%
64° N
, 26°
E
2013
14
Him
alay
an b
alsa
m (I
mpa
tiens
gl
andu
lifer
a, 2
5%)
Bras
sicac
eaeb ,
40%
; Rub
us sp
p., 1
1%; S
alix
spp.
b , 4.
9%; F
ilipe
ndul
a sp
p.d ,
3.9%
; T.
repe
ns/h
ybri
dum
b , 3.
9%
64° N
, 24°
E
2013
15
Mul
tiflo
ral
Bras
sicac
eaeb ,
44%
; Rub
us sp
p., 3
7%; S
alix
spp.
b , 4.
6%; T
. rep
ens/h
ybri
dum
, 5.6
%
60° N
, 24°
E
2013
16
Li
ngon
berry
(Vac
cini
um sp
p.a ,
16%
) Ru
bus s
pp.,
40%
; Myo
sotis
spp.
b , 22
%; S
alix
spp.
b , 11
%
63° N
, 28°
E
2013
17
M
ultif
lora
l Br
assic
acea
eb , 87
%; R
ubus
spp.
, 4.9
%; T
. rep
ens/h
ybri
dum
, 3.1
%
60° N
, 24°
E
2013
18
D
ande
lion
(Tar
axac
um sp
p.a ,
0.0%
) Br
assic
acea
eb , 35
%; A
piac
eaeb ,
33%
; Sal
ix sp
p.b ,
21%
; Rub
us sp
p., 5
.0%
; T. r
epen
s/ hy
brid
um, 4
.2%
no
t spe
cifie
d 20
13
19
Hea
ther
(C. v
ulga
risa ,
3.3%
) Br
assic
acea
eb , 32
%; M
elilo
tus s
pp.,
24%
; T. r
epen
s/hy
brid
um, 8
.8%
; Api
acea
eb , 7.
0%;
Faba
ceae
, 9.3
%; F
ilipe
ndul
a sp
p.d ,
5.6%
; Rub
us sp
p., 4
.9%
; Sal
ix sp
p.b ,
3.7%
no
t spe
cifie
d 20
13
20
Buck
whe
at (F
. esc
ulen
tum
a , 7.
7%)
Bras
sicac
eaeb ,
62%
; Sal
ix sp
p.b ,
15%
; Api
acea
eb , 6.
3%; F
abac
eae,
3.1
%
not s
peci
fied
2013
a U
nder
-repr
esen
ted
polle
n ty
pe.15
2,31
2 b Ove
r-rep
rese
nted
pol
len
type
.152,
312 c H
oney
dew
ele
men
ts.14
9 d Non
-mel
lifer
ous p
lant
.131
Results and Discussion 61

Results and Discussion
62
Fig. 10 Low-intensity, high-field fingerprints for the featured heather, buckwheat, dandelion and linden honeys (overlapping spectra of samples 1–5, 9–12 and 18–20).
OH
O
OH OH
O
OH
OH
O
O
OH
O
O
a) b)
c) d)
Fig. 11 Compounds suggested as novel markers of Taraxacum spp. honey. a) 2-hydroxy-3-methylbutyric acid, b) 2-hydroxy-3-methylpentanoic acid, c) 3-methyl-2-oxopentanoic acid and d) 4-methyl-2-oxopentanoic acid. isoleucine, leucine and valine were highest in buckwheat honeys (Figure 10). Also, threonine, tyrosine and 4-hydroxybenzoic acid with some unassigned signals at δ 5.04, 6.67, 6.70 and 6.80 ppm were characteristic to buckwheat. Heather honeys were marked by 3-phenyllactic and phenylacetic acid, together with relatively higher amounts of acetic, benzoic, formic, phenyllactic and pyruvic acid and proline. In addition, dehydrovomifoliol311 present in the

Results and Discussion
63
organic extract was specific to heather. The pair-wise discriminations (OPLS-DA; R2 > 0.9, Q2 > 0.9) of buckwheat, dandelion and heather honeys emphasised the weight of abovementioned botanical markers and the relative content of glucose and fructose. Linden honey was authenticated by a known marker, 1-O-β-gentiobiosyl (6-O-(β-D-glucopyranosyl)-β-D-glucopyranosyl) ester of 4-(1-hydroxy-1-methylethyl)cyclohexa-1,3-diene-1-carboxylic acid (also as respective aglycone in CDCl3), and a relatively high proportion of gentiobiose.313 Lingonberry honey contained relatively high content of methyl syringate311 (in CDCl3) and was also characterised by unassigned peaks at the aromatic region, suggesting that these signals originate from a compound representative of Vaccinium spp. As for clover and Himalayan balsam honey, there were not any specific aqueous markers to be declared for lingonberry honey.
Incorrect classification of one heather and one Himalayan balsam honey was revealed with NMR, and they were subsequently denoted as honeydew (sample 13) and multiforal honey (sample 15), respectively. The botanical origin of the samples 18–20 (of commercial and therefore of unspecified geographical origin) were confirmed to match the labelling. However, the levels of the key botanical markers were lower than in the other respective honeys, possibly due to handling and storage conditions or careless harvest.
As the first steps in NMR metabolomics-based characterisation of Finnish varietal honeys, this study successfully found clear discriminative basis to which future unknown samples could be referenced. However, to upgrade predictive power of the models, the dataset should be complemented with other honey varieties and more samples to construct a comprehensive national honey library. Also, as pure varietal honeys rarely exist naturally, experiments involving caged beehives on unifloral patches would be required in order to accommodate the requirements. Until then, the method is not fully comprehensive for routine quality control but still applicable in the qualitative characterisation of buckwheat, dandelion, heather, honeydew and linden honeys.
Summary and Conclusion
64
6 SUMMARY AND CONCLUSION
The experimental part of the thesis concentrated on the NMR metabolomics of sea buckthorn berries and Brassica oilseeds as crops of varying genotypes grown in varying locations and environmental conditions, and honey, as an example of food deriving its characteristics from the boreal nature but often being subject to mislabelling and fraudulence.
Genetic and climatic factors significantly affect the composition and quality of sea buckthorn berries. Berries of same genetic origin may exhibit drastically different phenotypes in different climates and growth conditions as affected by latitude and altitude. Glucose, ethyl glucose, malic acid, quinic acid and ascorbic acid are the key metabolites in sea buckthorn berries influenced by the growth place. The northern growth conditions produce more vitamin C and precursors for other secondary metabolites for protective compounds against abiotic stress factors related to the high latitude. Significant metabolic differences in genetically identical berries were observed between latitudes 60° and 67–68° north in Finland. High altitudes (> 2000 m) correlated with greater levels of malic and ascorbic acids in ssp. sinensis. The NMR metabolomics approach applied here is effective for identification of metabolites, geographical origin and subspecies of sea buckthorn berries.
In oilseed rape and turnip rape, the genotype at species-level and the growth place were the main determinants for the seed composition. Differences in the major lipids and the minor metabolites between the two species were found. A higher content of polyunsaturated fatty acids and sucrose were observed in turnip rape. The overall oil content and sinapine levels were higher in oilseed rape. The effect of cultivar type on the oilseed metabolome was considered negligible compared to the effect of the growth place and the associated conditions. No clear trends among cultivars were shown, however, the combined cultivar × environment interaction cannot be ruled out.
The NMR–multivariate approach allowed the full characterisation of Finnish buckwheat, dandelion and heather honeys, whose true botanical origin is grossly understated in the pollen analysis. Novel markers were suggested for characterisation of the dandelion honey. The metabolic fingerprints and the fructose-to-glucose ratio will also promote the identification of other honey types, such as clover, honeydew and linden honey. The methodological power of NMR metabolomics in finding and identifying botanical markers originating from the floral/nectar source rivals the existing set of established tools in honey analysis and encourages further developments aiming towards a national honey library.
The studies included in this thesis demonstrated the applicability of NMR-based analysis in determining the some of the key metabolic compounds of

Summary and Conclusion
65
different foods and raw ingredients in respect to the food origin (especially the Nordic dimension). This research provides novel approaches and tools for food quality control and plant breeding, while supporting the selection of raw ingredients aimed at optimal sensory and chemical properties for the food and nutraceutical industry. The knowledge on crop quality and differences between species, cultivars, growth sites and maturity in order to find the optimum conditions for producing profitable quality crops may rise to even greater importance in the near future, considering climatic changes. Assisting in agricultural and breeding processes, metabolomics can help in the selection of target genotypes and cultivation sites for enrichment of bioactive components or sensory properties. Also, consumer awareness towards food origin and authenticity and the need for efficient tools to verify them have increased. The methodologies used here could potentially be extended to be used in detecting food frauds/adulterations, quality defects and genetically modified crops. In that respect, it is essential to characterise the key metabolites that unmistakably define and differentiate foods, as also shown here. However, the models and spectral libraries to which future samples are compared need to be complemented with and representative of a wide range of samples and their variations in order to exhibit their full performance in internationally valid quality control. NMR metabolomics is an essential tool in understanding metabolic profiles of foods that are effected by different environmental factors and, in due course, reflecting to consumer acceptance and trust in the global food markets.

Acknowledgements
66
ACKNOWLEDGEMENTS
The work for this thesis was mainly conducted in the Food Chemistry and Food Development unit of the Department of Biochemistry and the Instrument Centre, Department of Chemistry, at the University of Turku. Part of the work was carried out at the Department of Food Science & Technology and the NMR Facility of University of California, Davis.
I am deeply grateful for funding provided by the Doctoral Programme in Molecular Food Sciences (DPMLS) of the University of Turku Graduate School (UTUGS), the Finnish Cultural Foundation and the Magnus Ehrnrooth foundation. Also, the Magnus Ehrnrooth foundation and the Turku University Foundation are thanked for the generous travel grants.
I wish to express the warmest of thanks to my supervisors, Professor emeritus Heikki Kallio, Professor Baoru Yang and Adjunct professor Jari Sinkkonen. Heikki encouraged me to embark on this journey and has enabled great opportunities for me along the way. I am grateful to Baoru for believing in me even when I couldn’t – I feel that she has always had my best interest at heart. Both Heikki and Baoru are warmly thanked for their guidance, patience, trust and unlimited support. I cannot thank Jari enough for teaching and supporting me, he has also been one of the key persons for this thesis to ever exist. He has always made me feel welcome in the Instrument Centre gang whatever the occasion and I have enjoyed every minute, during and after work.
I am so grateful to Professor Carolyn M. Slupsky and all the lab members in UC Davis for allowing me to join their outstanding team for six months; it was an important time for me in many ways. Sweet thanks to Lassi Kauko, Olli Sjövall, and Tarja Ollikka and Heikki Vartiainen (Finnish Beekeepers’ Association) for the collaboration and the valuable input in the honey study. Lassi is especially acknowledged for his sincere enthusiasm and immense expertise in all things honey and bees.
I wish to thank Ari Rajala (Natural Resources Institute Finland, Luke) and Anssi Vuorinen for the contribution in the rapeseed studies and participation in the annual follow-up meetings with their valuable insight and expertise. Anssi is also thanked for the fun company during field trips to the sea buckthorn and rapeseed patches. I warmly thank all my food science colleagues at Arcanum for creating such a pleasant working environment. Special thanks and hugs go to Leeni Mäkilä, Anni Lindstedt, Anu Nuora and Jie Zheng for their valuable peer support, help and friendship. The technical and administrative staff of the Department of Biochemistry, especially Anu Hirvensalo and Jani Sointusalo, are warmly thanked for their help during this thesis work. Also, I wish to thank the Food Chemistry and Food Development students Johanna Salo, Mikael Fabritius, Annamari Kumpulainen, Merja Nylander and Marjaana Parikainen

Acknowledgements
67
for their great input to the lab work. Finally, I want to express my gratitude to my family and friends. I thank my
parents Maaret and Markku for their encouragement, support and patience, and my dear partner Kristian for all his love by taking my mind off work and sweetening my life.
Turku, December 2016
References
68
REFERENCES
1. Capocasa, F.; Scalzo, J.; Mezzetti, B.; Battino, M. Combining quality and antioxidant attributes in the strawberry: The role of genotype. Food Chem. 2008, 111, 872–878.
2. Patel, R.P.; Singh, R.; Rao, B.R.R.; Singh, R.R.; Srivastava, A.; Lal, R.K. Differential response of genotype × environment on phenology, essential oil yield and quality of natural aroma chemicals of five Ocimum species. Ind. Crops Prod. 2016, 87, 210–217.
3. Zheng, J.; Yang, B.; Trépanier, M.; Kallio, H. Effects of genotype, latitude, and weather conditions on the composition of sugars, sugar alcohols, fruit acids, and ascorbic acid in sea buckthorn (Hippophae rhamnoides ssp. mongolica) berry juice. J. of Agric. Food Chem. 2012, 60, 3180–3189.
4. Vagiri, M.; Ekholm, A.; Öberg, E.; Johansson, E.; Andersson, S.C.; Rumpunen, K. Phenols and ascorbic acid in black currants (Ribes nigrum L.): variation due to genotype, location, and year. J. Agric. Food Chem. 2013, 61, 9298–9306.
5. Zhao, H.; Guo, B.; Wei, Y.; Zhang, B. Effects of wheat origin, genotype, and their interaction on multielement fingerprints for geographical traceability. J. Agric. Food Chem. 2012, 60, 10957–10962.
6. Jinap, S.; Dimick, P.S.; Hollender, R. Flavour evaluation of chocolate formulated from cocoa beans from different countries. Food Control 1995, 6, 105–110.
7. Jaakola, L.; Hohtola, A. Effect of latitude on flavonoid biosynthesis in plants. Plant Cell Environ. 2010, 33, 1239–1247.
8. Jung, Y.; Lee, J.; Kwon, J.; Lee, K.; Ryu, D.H.; Hwang, G. Discrimination of the geographical origin of beef by 1H NMR-based metabolomics. J. Agric. Food Chem. 2010, 58, 10458–10466.
9. Peltonen-Sainio, P.; Jauhiainen, L.; Sadras, V.O. Phenotypic plasticity of yield and agronomic traits in cereals and rapeseed at high latitudes. Field Crops Res. 2011, 124, 261–269.
10. Yang, W.; Laaksonen, O.; Kallio, H.; Yang, B. Proanthocyanidins in sea buckthorn (Hippophaë rhamnoides L.)
berries of different origins with special reference to the influence of genetic background and growth location. J. Agric. Food Chem. 2016, 64, 1274–1282.
11. Jaakkola, M.; Korpelainen, V.; Hoppula, K.; Virtanen, V. Chemical composition of ripe fruits of Rubus chamaemorus L. grown in different habitats. J. Sci. Food Agric. 2012, 92, 1324–1330.
12. Zheng, J.; Yang, B.; Ruusunen, V.; Laaksonen, O.; Tahvonen, R.; Hellsten, J.; Kallio, H. Compositional differences of phenolic compounds between black currant (Ribes nigrum L.) cultivars and their response to latitude and weather conditions. J. Agric. Food Chem. 2012, 60, 6581–6593.
13. Peltonen-Sainio, P.; Pirinen, P.; Mäkelä, H.M.; Hyvärinen, O.; Huusela-Veistola, E.; Ojanen, H.; Venäläinen, A. Spatial and temporal variation in weather events critical for boreal agriculture: I Elevated temperatures. Agric. Food Sci. 2016, 25, 44–56.
14. Peltonen-Sainio, P.; Pirinen, P.; Mäkelä, H.M.; Ojanen, H.; Venäläinen, A. Spatial and temporal variation in weather events critical for boreal agriculture: II Precipitation. Agric. Food Sci. 2016, 25, 57–70.
15. Peltonen-Sainio, P.; Pirinen, P.; Laapas, M.; Mäkelä, H.M.; Ojanen, H.; Venäläinen, A. Spatial and temporal variation in weather events critical for boreal agriculture: III Frost and winter time fluctuation. Agric. Food Sci. 2016, 25, 71–80.
16. Zhang, X.; Breksa, A.P.; Mishchuk, D.O.; Slupsky, C.M. Elevation, rootstock, and soil depth affect the nutritional quality of mandarin oranges. J. Agric. Food Chem. 2011, 59, 2672–2679.
17. Anesi, A.; Stocchero, M.; Dal Santo, S.; Commisso, M.; Zenoni, S.; Ceoldo, S.; Tornielli, G.B.; Siebert, T.E.; Herderich, M.; Pezzotti, M.; Guzzo, F. Towards a scientific interpretation of the terroir concept: plasticity of the grape berry metabolome. BMC Plant Biol. 2015, 15 (191), 17.
18. Sánchez Pérez, E.M.; Iglesias, M.J.; López Ortiz, F.; Sánchez Pérez, I.; Martínez Galera, M. Study of the suitability of HRMAS NMR for metabolic profiling of tomatoes: Application to tissue

References
69
differentiation and fruit ripening. Food Chem. 2010, 122, 877–887.
19. Lombardo, V.A.; Osorio, S.; Borsani, J.; Lauxmann, M.A.; Bustamante, C.A.; Budde, C.O.; Andreo, C.S.; Lara, M.V.; Fernie, A.R.; Drincovich, M.F. Metabolic profiling during peach fruit development and ripening reveals the metabolic networks that underpin each developmental stage. Plant Physiol. 2011, 157, 1696–1710.
20. Ali, K.; Maltese, F.; Fortes, A.M.; Pais, M.S.; Choi, Y.H.; Verpoorte, R. Monitoring biochemical changes during grape berry development in Portuguese cultivars by NMR spectroscopy. Food Chem. 2011, 124, 1760–1769.
21. Vuorinen, A.L.; Kalpio, M.; Linderborg, K.M.; Kortesniemi, M.; Lehto, K.; Niemi, J.; Yang, B.; Kallio, H.P. Coordinate changes in gene expression and triacylglycerol composition in the developing seeds of oilseed rape (Brassica napus) and turnip rape (Brassica rapa). Food Chem. 2014, 145, 664–673.
22. Hohmann, M.; Christoph, N.; Wachter, H.; Holzgrabe, U. 1H NMR profiling as an approach to differentiate conventionally and organically grown tomatoes. J. Agric. Food Chem. 2014, 62, 8530–8540.
23. Kårlund, A.; Hanhineva, K.; Lehtonen, M.; Karjalainen, R.O.; Sandell, M. Nontargeted metabolite profiles and sensory properties of strawberry cultivars grown both organically and conventionally. J. Agric. Food Chem. 2015, 63, 1010–1019.
24. Kallio, H.; Yang, B.; Peippo, P. Effects of different origins and harvesting time on vitamin C, tocopherols, and tocotrienols in sea buckthorn (Hippophaë rhamnoides) berries. J. Agric. Food Chem. 2002, 50, 6136–6142.
25. Yang, B.; Kallio, H. Effects of harvesting time on triacylglycerols and glycerophospholipids of sea buckthorn (Hippophaë rhamnoides L.) berries of different origins. J. Food Compos. Anal. 2002, 15, 143–157.
26. Yang, B.; Halttunen, T.; Raimo, O.; Price, K.; Kallio, H. Flavonol glycosides in wild and cultivated berries of three major subspecies of Hippophaë rhamnoides and changes during harvesting period. Food Chem. 2009, 115, 657–664.
27. Masetti, O.; Ciampa, A.; Nisini, L.; Valentini, M.; Sequi, P.; Dell’Abate, M.T. Cherry tomatoes metabolic profile determined by 1H-high resolution-NMR spectroscopy as influenced by growing season. Food Chem. 2014, 162, 215–222.
28. Bufalo, J.; Zheljazkov, V.D.; Cantrell, C.L.; Astatkie, T.; Ciampa, L.; Jeliazkova, E. Diurnal effects on spearmint oil yields and composition. Sci. Hortic. 2015, 182, 73–76.
29. Santucci, C.; Tenori, L.; Luchinat, C. NMR fingerprinting as a tool to evaluate post-harvest time-related changes of peaches, tomatoes and plums. Food Res. Int. 2015, 75, 106–114.
30. Shumilina, E.; Ciampa, A.; Capozzi, F.; Rustad, T.; Dikiy, A. NMR approach for monitoring post-mortem changes in Atlantic salmon fillets stored at 0 and 4 °C. Food Chem. 2015, 184, 12–22.
31. Fiehn, O. Metabolomics – the link between genotypes and phenotypes. Plant Mol. Biol. 2002, 48, 155–171.
32. Ma, X.; Laaksonen, O.; Zheng, J.; Yang, W.; Trépanier, M.; Kallio, H.; Yang, B. Flavonol glycosides in berries of two major subspecies of sea buckthorn (Hippophaë rhamnoidesL.) and influence of growth sites. Food Chem. 2016, 200, 189–198.
33. Zheng, J.; Yang, B.; Tuomasjukka, S.; Ou, S.; Kallio, H. Effects of latitude and weather conditions on contents of sugars, fruit acids, and ascorbic acid in black currant (Ribes nigrumL.) juice. J. Agric. Food Chem. 2009, 57, 2977–2987.
34. Zheng, J.; Kallio, H.; Yang, B. Sea buckthorn (Hippophaë rhamnoides ssp. rhamnoides) berries in Nordic environment: compositional response to latitude and weather conditions. J. Agric. Food Chem. 2016, 64, 5031–5044.
35. Wishart, D.S. Metabolomics: applications to food science and nutrition research. Trends Food Sci. Technol. 2008, 19, 482–493.
36. Cevallos-Cevallos, J.M.; Reyes-De-Corcuera, J.I.; Etxeberria, E.; Danyluk, M.D.; Rodrick, G.E. Metabolomic analysis in food science: a review. Trends Food Sci. Technol. 2009, 20, 557–566.
37. Mannina, L.; Sobolev, A.P.; Viel, S. Liquid state 1H high field NMR in food analysis.

References
70
Prog. Nucl. Magn. Reson. Spectrosc. 2012, 66, 1–39.
38. Oms-Oliu, G.; Odriozola-Serrano, I.; Martín-Belloso, O. Metabolomics for assessing safety and quality of plant-derived food. Food Res. Int. 2013, 54, 1172–1183.
39. Laghi, L.; Picone, G.; Capozzi, F. Nuclear magnetic resonance for foodomics beyond food analysis. TrAC Trends Anal. Chem. 2014, 59, 93–102.
40. Cubero-Leon, E.; Peñalver, R.; Maquet, A. Review on metabolomics for food authentication. Food Res. Int. 2014, 60, 95–107.
41. Larive, C.K.; Barding, G.A.; Dinges, M.M. NMR spectroscopy for metabolomics and metabolic profiling. Anal. Chem. 2015, 87, 133–146.
42. National Center for Biotechnology Information Eukaryotic genomes annotated at NCBI. http://www.ncbi.nlm.nih.gov/ genome/annotation_euk/all/ (accessed 2016/05/25).
43. Chinnusamy, V.; Dalal, M.; Zhu, J. Epigenetic regulation of abiotic stress responses in plants. In Plant Abiotic Stress, 2nd ed.; Jenks, M.A., Hasegawa, P.M., Eds.; John Wiley & Sons, Inc: Ames, 2013; pp. 203–229.
44. Qi, X.; Chen, X.; Wang, Y., Eds. Plant Metabolomics: Methods and Applications. Chemical Industry Press, Springer: Beijing, Dortrecht, 2015; pp. 319.
45. Reid, L.M.; O'Donnell, C.P.; Downey, G. Recent technological advances for the determination of food authenticity. Trends Food Sci. Technol. 2006, 17, 344–353.
46. Sun, K.; Chen, W.; Ma, R.; Chen, X.; Li, A.; Ge, S. Genetic variation in Hippophae rhamnoides ssp. sinensis (Elaeagnaceae) revealed by RAPD markers. Biochem. Genet. 2006, 44, 186–197.
47. Chen, W.; Su, X.; Zhang, H.; Sun, K.; Ma, R.; Chen, X. High genetic differentiation of Hippophae rhamnoides ssp. yunnanensis (Elaeagnaceae), a plant endemic to the Qinghai-Tibet plateau. Biochem. Genet. 2010, 48, 565–576.
48. Abbadi, A.; Leckband, G. Rapeseed breeding for oil content, quality, and sustainability. Eur. J. Lipid Sci. Technol. 2011, 113, 1198–1206.
49. Martínez, M.L.; Mattea, M.A.; Maestri, D.M. Varietal and crop year effects on lipid composition of walnut (Juglans regia) genotypes. J. Am. Oil Chem. Soc. 2006, 83, 791–796.
50. Hakala, M.A.; Lapveteläinen, A.T.; Kallio, H.P. Volatile compounds of selected strawberry varieties analyzed by purge-and-trap headspace GC-MS. J. Agric. Food Chem. 2002, 50, 1133–1142.
51. Capitani, D.; Sobolev, A.P.; Tomassini, A.; Sciubba, F.; De Salvador, F.R.; Mannina, L.; Delfini, M. Peach fruit: Metabolic comparative analysis of two varieties with different resistances to insect attacks by NMR spectroscopy. J. Agric. Food Chem. 2013, 61, 1718–1726.
52. Sciubba, F.; Di Cocco, M.E.; Gianferri, R.; Capuani, G.; De Salvador, F.R.; Fontanari, M.; Gorietti, D.; Delfini, M. Nuclear magnetic resonance-based metabolic comparative analysis of two apple varieties with different resistances to apple scab attacks. J. Agric. Food Chem. 2015, 63, 8339–8347.
53. James, D.; Schmidt, A.; Wall, E.; Green, M.; Masri, S. Reliable detection and identification of genetically modified maize, soybean, and canola by multiplex PCR analysis. J. Agric. Food Chem. 2003, 51, 5829–5834.
54. Jakes, W.; Gerdova, A.; Defernez, M.; Watson, A.D.; McCallum, C.; Limer, E.; Colquhoun, I.J.; Williamson, D.C.; Kemsley, E.K. Authentication of beef versus horse meat using 60 MHz 1H NMR spectroscopy. Food Chem. 2015, 175, 1–9.
55. Mannina, L.; Sobolev, A.P.; Capitani, D.; Iaffaldano, N.; Rosato, M.P.; Ragni, P.; Reale, A.; Sorrentino, E.; D’Amico, I.; Coppola, R. NMR metabolic profiling of organic and aqueous sea bass extracts: Implications in the discrimination of wild and cultured sea bass. Talanta 2008, 77, 433–444.
56. Melis, R.; Cappuccinelli, R.; Roggio, T.; Anedda, R. Addressing marketplace gilthead sea bream (Sparus aurata L.) differentiation by 1H NMR-based lipid fingerprinting. Food Res. Int. 2014, 63, 258–264.
57. Tveito, O.E.; Førland, J.; Alexandersson, H.; Drebs, A.; Jónsson, T.; Tuomenvirta, H.; Vaarby Laursen, E. Nordic climate maps. KLIMA report 2001, 06 (01), 28.

References
71
58. Kelly, S.; Heaton, K.; Hoogewerff, J. Tracing the geographical origin of food: The application of multi-element and multi-isotope analysis. Trends Food Sci. Technol. 2005, 16, 555–567.
59. Luykx, D.M.A.M.; van Ruth, S.M. An overview of analytical methods for determining the geographical origin of food products. Food Chem. 2008, 107, 897–911.
60. Consonni, R.; Cagliani, L.R. Geographical characterization of polyfloral and acacia honeys by nuclear magnetic resonance and chemometrics. J. Agric. Food Chem. 2008, 56, 6873–6880.
61. Consonni, R.; Cagliani, L.R.; Cogliati, C. Geographical discrimination of honeys by saccharides analysis. Food Control 2013, 32, 543–548.
62. Godelmann, R.; Fang, F.; Humpfer, E.; Schütz, B.; Bansbach, M.; Schäfer, H.; Spraul, M. Targeted and nontargeted wine analysis by 1H NMR spectroscopy combined with multivariate statistical analysis. Differentiation of important parameters: grape variety, geographical origin, year of vintage. J. Agric. Food Chem. 2013, 61, 5610–5619.
63. Caligiani, A.; Coisson, J.D.; Travaglia, F.; Acquotti, D.; Palla, G.; Palla, L.; Arlorio, M. Application of 1H NMR for the characterisation and authentication of "Tonda Gentile Trilobata" hazelnuts from Piedmont (Italy). Food Chem. 2014, 148, 77–85.
64. Marseglia, A.; Acquotti, D.; Consonni, R.; Cagliani, L.R.; Palla, G.; Caligiani, A. HR MAS 1H NMR and chemometrics as useful tool to assess the geographical origin of cocoa beans – Comparison with HR 1H NMR. Food Res. Int. 2016, 85, 273–281.
65. Hårdh, K.; Hårdh, J.E. Studies on quality of vegetables and strawberries at different latitudes in Finland. Ann. Agric. Fenn. 1977, 16, 19–26.
66. Aparicio, R.; Ferreiro, L.; Alonso, V. Effect of climate on the chemical composition of virgin olive oil. Anal. Chim. Acta 1994, 292, 235–241.
67. Zheng, J.; Kallio, H.; Linderborg, K.; Yang, B. Sugars, sugar alcohols, fruit acids, and ascorbic acid in wild Chinese sea buckthorn (Hippophaë rhamnoides ssp. sinensis) with special reference to influence
of latitude and altitude. Food Res. Int. 2011, 44, 2018–2026.
68. Anklam, E. A review of the analytical methods to determine the geographical and botanical origin of honey. Food Chem. 1998, 63, 549–562.
69. European Union Council regulation (EC) No 509/2006 of 20 March 2006 on agricultural products and foodstuffs as traditional specialities guaranteed. OJ 2006, L 93, 1–11.
70. European Union Council regulation (EC) No 510/2006 on the protection of geographical indications and designations of origin for agricultural products and foodstuffs. OJ 2006, L 93, 12–25.
71. Cagliani, L.R.; Culeddu, N.; Chessa, M.; Consonni, R. NMR investigations for a quality assessment of Italian PDO saffron (Crocus sativusL.). Food Control 2015, 50, 342–348.
72. Mazzei, P.; Piccolo, A. 1H HRMAS-NMR metabolomic to assess quality and traceability of mozzarella cheese from Campania buffalo milk. Food Chem. 2012, 132, 1620–1627.
73. Cicero, N.; Corsaro, C.; Salvo, A.; Vasi, S.; Giofré, S.V.; Ferrantelli, V.; Di Stefano, V.; Mallamace, D.; Dugo, G. The metabolic profile of lemon juice by proton HR-MAS NMR: the case of the PGI Interdonato Lemon of Messina. Nat. Prod. Res. 2015, 29, 1894–1902.
74. Pessarakli, M. (Ed.). Handbook of Plant and Crop Stress, 3rd ed.; CRC Press Taylor & Francis Group: Boca Raton, 2011; pp. 1245.
75. Wang, Y.; Frei, M. Stressed food – The impact of abiotic environmental stresses on crop quality. Agric. Ecosyst. Environ. 2011, 141, 271–286.
76. Buchanan, B.B.; Gruissem, W.; Jones, R.L., Eds. Biochemistry and Molecular Biology of Plants, 2nd ed.; John Wiley & Sons, Ltd.: Hoboken, 2015; pp. 1283.
77. Cohen, J.H.; Berge, J.; Moline, M.A.; Sørensen, A.J.; Last, K.; Falk-Petersen, S.; Renaud, P.E.; Leu, E.S.; Grenvald, J.; Cottier, F.; Cronin, H.; Menze, S.; Norgren, P.; Varpe, Ø; Daase, M.; Darnis, G.; Johnsen, G. Is ambient light during the high Arctic polar night sufficient to act as a visual cue for zooplankton? PLoS ONE 2015, 10 (e0126247), 12.
References
72
78. Uleberg, E.; Rohloff, J.; Jaakola, L.; Trôst, K.; Junttila, O.; Häggman, H.; Martinussen, I. Effects of temperature and photoperiod on yield and chemical composition of Northern and Southern clones of bilberry (Vaccinium myrtillus L.). J. Agric. Food Chem. 2012, 60, 10406–10414.
79. Chaudhary, S.; Sharma, P.C. DeepSAGE based differential gene expression analysis under cold and freeze stress in seabuckthorn (Hippophae rhamnoides L.). PLoS ONE 2015, 10 (e0121982), 17.
80. Lee, J.; Lee, B.; Chung, J.; Shin, H.; Lee, S.; Lee, C.; Hong, Y. 1H NMR-based metabolomic characterization during green tea (Camellia sinensis) fermentation. Food Res. Int. 2011, 44, 597–604.
81. Deluc, L.G.; Decendit, A.; Papastamoulis, Y.; Mérillon, J.; Cushman, J.C.; Cramer, G.R. Water deficit increases stilbene metabolism in Cabernet Sauvignon berries. J. Agric. Food Chem. 2011, 59, 289–297.
82. Ripoll, J.; Urban, L.; Brunel, B.; Bertin, N. Water deficit effects on tomato quality depend on fruit developmental stage and genotype. J. Plant Physiol. 2016, 190, 26–35.
83. Yang, Y.; Yao, Y.; Xu, G.; Li, C. Growth and physiological responses to drought and elevated ultraviolet-B in two contrasting populations of Hippophae rhamnoides. Physiol. Plant. 2005, 124, 431–440.
84. Raffo, A.; Paoletti, F.; Antonelli, M. Changes in sugar, organic acid, flavonol and carotenoid composition during ripening of berries of three seabuckthorn (Hippophae rhamnoides L.) cultivars. Eur. Food Res. Technol. 2004, 219, 360–368.
85. Liu, J.; Zhang, Q.; Liu, M.; Ma, L.; Shi, Y.; Ruan, J. Metabolomic analyses reveal distinct change of metabolites and quality of green tea during the short duration of a single spring season. J. Agric. Food Chem. 2016, 64, 3302–3309.
86. Queiroz, O. Circadian rhythms and metabolic patterns. Annu. Rev. Plant. Physiol. 1974, 25, 115–134.
87. Bartholomew, D.P.; Kadzimin, S.B. Chapter 5 – Pineapple. In Ecophysiology of tropical crops, 1st ed.; Alvim, P.d.T., Kozlowski, T.T.. Eds.; Academic Press: New York, 1977; pp. 113–156.
88. Ming, R.; VanBuren, R.; Wai, C.M.; Tang, H.; Schatz, M.C.; Bowers, J.E.; Lyons, E.;
Wang, M.; Chen, J.; Biggers, E.; Zhang, J.; Huang, L.; Zhang, L.; Miao, W.; Zhang, J.; Ye, Z.; Miao, C.; Lin, Z.; Wang, H.; Zhou, H.; Yim, W.C.; Priest, H.D.; Zheng, C.; Woodhouse, M.; Edger, P.P.; Guyot, R.; Guo, H.; Guo, H.; Zheng, G.; Singh, R.; Sharma, A.; Min, X.; Zheng, Y.; Lee, H.; Gurtowski, J.; Sedlazeck, F.J.; Harkess, A.; McKain, M.R.; Liao, Z.; Fang, J.; Liu, J.; Zhang, X.; Zhang, Q.; Hu, W.; Qin, Y.; Wang, K.; Chen, L.; Shirley, N.; Lin, Y.; Liu, L.; Hernandez, A.G.; Wright, C.L.; Bulone, V.; Tuskan, G.A.; Heath, K.; Zee, F.; Moore, P.H.; Sunkar, R.; Leebens-Mack, J.; Mockler, T.; Bennetzen, J.L.; Freeling, M.; Sankoff, D.; Paterson, A.H.; Zhu, X.; Yang, X.; Smith, J.A.; Cushman, J.C.; Paull, R.E.; Yu, Q. The pineapple genome and the evolution of CAM photosynthesis. Nat. Genet. 2015, 47, 1435–1442.
89. Rousi, A. The genus Hippophaë L. A taxonomic study. Ann. Bot. Fenn. 1971, 8, 177–227.
90. Li, T.S.C.; Beveridge, T.H.J. Sea Buckthorn (Hippophae Rhamnoides L.): Production and Utilization; NRC Research Press: Ottawa, 2003; pp. 133.
91. Karhu, S. New sea buckthorn cultivars Terhi, Tytti and Tarmo. In Sadonkorjuu - Tutkittua puutarhatuotantoa 2000-2002 : Harvest - Horticultural research results 2000-2002; Hovi, T., Karhu, S., Linna, M., Suojala, T., Eds.; MTT: Jokioinen, 2003; Vol. 42, pp. 83–84.
92. Li, T.S.C.; Schroeder, W.R. Sea buckthorn (Hippophae rhamnoides L.): a multipurpose plant. HortTechnology 1996, 6, 370–380.
93. Li, T.S.C.; McLoughlin, C. Sea buckthorn production guide; Canada Seabuckthorn Enterprises Limited: Peachland, 1997; pp. 27.
94. Bal, L.M.; Meda, V.; Naik, S.N.; Satya, S. Sea buckthorn berries: A potential source of valuable nutrients for nutraceuticals and cosmoceuticals. Food Res. Int. 2011, 44, 1718–1727.
95. Korekar, G.; Dolkar, P.; Singh, H.; Srivastava, R.B.; Stobdan, T. Variability and the genotypic effect on antioxidant activity, total phenolics, carotenoids and ascorbic acid content in seventeen natural population of Seabuckthorn (Hippophae
References
73
rhamnoides L.) from trans-Himalaya. LWT - Food Sci. Technol. 2014, 55, 157–162.
96. Andersson, S.C.; Rumpunen, K.; Johansson, E.; Olsson, M.E. Tocopherols and tocotrienols in sea buckthorn (Hippophae rhamnoides L.) berries during ripening. J. Agric. Food Chem. 2008, 56, 6701–6706.
97. Fatima, T.; Kesari, V.; Watt, I.; Wishart, D.; Todd, J.F.; Schroeder, W.R.; Paliyath, G.; Krishna, P. Metabolite profiling and expression analysis of flavonoid, vitamin C and tocopherol biosynthesis genes in the antioxidant-rich sea buckthorn (Hippophae rhamnoides L.). Phytochemistry 2015, 118, 181–191.
98. Tiitinen, K.M.; Yang, B.; Haraldsson, G.G.; Jonsdottir, S.; Kallio, H.P. Fast analysis of sugars, fruit acids, and vitamin C in sea buckthorn (Hippophaë rhamnoides L.) varieties. J. Agric. Food Chem. 2006, 54, 2508–2513.
99. Lindstedt, A.; Järvinen, R.; Sinkkonen, J.; Lehtonen, H.; Graça, G.; Viitanen, M.; Gil, A.M.; Kallio, H. Postprandial response on fatty meal is affected by sea buckthorn (Hippophaë rhamnoides) supplementation: NMR metabolomics study. Food Res. Int. 2014, 58, 23–34.
100. Yang, B. Sugars, acids, ethyl β-D-glucopyranose and a methyl inositol in sea buckthorn (Hippophaë rhamnoides) berries. Food Chem. 2009, 112, 89–97.
101. Leskinen, H.M.; Suomela, J.; Yang, B.; Kallio, H.P. Regioisomer compositions of vaccenic and oleic acid containing triacylglycerols in sea buckthorn (Hippophaë rhamnoides) pulp oils: influence of origin and weather conditions. J. Agric. Food Chem. 2010, 58, 537–545.
102. Yang, B.; Zheng, J.; Kallio, H. Influence of origin, harvesting time and weather conditions on content of inositols and methylinositols in sea buckthorn (Hippophaë rhamnoides) berries. Food Chem. 2011, 125, 388–396.
103. Tang, X.; Kälviäinen, N.; Tuorila, H. Sensory and hedonic characteristics of juice of sea buckthorn (Hippophae rhamnoides L.) origins and hybrids. LWT - Food Sci. Technol. 2001, 34, 102–110.
104. Tiitinen, K.M.; Hakala, M.A.; Kallio, H.P. Quality components of sea buckthorn
(Hippophaë rhamnoides) varieties. J. Agric. Food Chem. 2005, 53, 1692–1699.
105. Gutzeit, D.; Baleanu, G.; Winterhalter, P.; Jerz, G. Vitamin C content in sea buckthorn berries (Hippophaë rhamnoides L. ssp. rhamnoides) and related products: a kinetic study on storage stability and the determination of processing effects. J. Food Sci. 2008, 73, C615–C620.
106. Ichimura, K.; Kohata, K.; Koketsu, M.; Yamaguchi, Y.; Yamaguchi, H.; Suto, K. Identification of methyl β-glucopyranoside and xylose as soluble sugar constituents in roses (Rosa hybrida L.). Biosci. Biotechnol. Biochem. 1997, 61, 1734–1735.
107. Smith, A.E.; Phillips, D.V. Identification of methyl-β-d-glucopyranoside in white clover foliage. J. Agric. Food Chem. 1981, 29, 850–852.
108. Sawabe, A.; Matsubara, Y. Bioactive glycosides in citrus fruit peels. Stud. Plant Sci. 1999, 6, 261–274.
109. Teague, C.; Holmes, E.; Maibaum, E.; Nicholson, J.; Tang, H.; Chan, Q.; Elliott, P.; Wilson, I. Ethyl glucoside in human urine following dietary exposure: detection by 1H NMR spectroscopy as a result of metabonomic screening of humans. Analyst 2004, 129, 259–264.
110. Sandell, M.A.; Laaksonen, O.A.; Puputti, S.; Kallio, H.P.; Yang, B. Chapter 110: The role of ethyl-β-D-glucoside in the pleasantness of sea buckthorn juice. In Flavour Science: Proceedings from XIII Weurman Flavour Research Symposium, Ferreira, V., Lopez, R., Eds.; Academic Press: San Diego, 2014; pp. 601–605.
111. de Olinda, T.M.; Lemos, T.L.G.; Machado, L.L.; Rao, V.S.; Santos, F.A. Quebrachitol-induced gastroprotection against acute gastric lesions: Role of prostaglandins, nitric oxide and K+ATP channels. Phytomedicine 2008, 15, 327–333.
112. Xue, Y.; Miao, Q.; Zhao, A.; Zheng, Y.; Zhang, Y.; Wang, P.; Kallio, H.; Yang, B. Effects of sea buckthorn (Hippophaë rhamnoides) juice and L-quebrachitol on type 2 diabetes mellitus in db/db mice. J. Funct. Foods 2015, 16, 223–233.
113. Yang, B.; Karlsson, R.M.; Oksman, P.H.; Kallio, H.P. Phytosterols in sea buckthorn (Hippophaë rhamnoides L.) berries: Identification and effects of different

References
74
origins and harvesting times. J. Agric. Food Chem. 2001, 49, 5620–5629.
114. Li, T.S.C.; Beveridge, T.H.J.; Drover, J.C.G. Phytosterol content of sea buckthorn (Hippophae rhamnoides L.) seed oil: Extraction and identification. Food Chem. 2007, 101, 1633–1639.
115. Yang, B.; Kallio, H.P. Fatty acid composition of lipids in sea buckthorn (Hippophaë rhamnoides L.) berries of different origins. J. Agric. Food Chem. 2001, 49, 1939–1947.
116. Pop, R.M.; Weesepoel, Y.; Socaciu, C.; Pintea, A.; Vincken, J.; Gruppen, H. Carotenoid composition of berries and leaves from six Romanian sea buckthorn (Hippophae rhamnoides L.) varieties. Food Chem. 2014, 147, 1–9.
117. Rösch, D.; Mügge, C.; Fogliano, V.; Kroh, L.W. Antioxidant oligomeric proanthocyanidins from sea buckthorn (Hippophaë rhamnoides) pomace. J. Agric. Food Chem. 2004, 52, 6712–6718.
118. Kole, C., Ed. Genome Mapping and Molecular Breeding in Plants – Oilseeds; Springer: Berlin, Heidelberg, 2007; Vol. 2, pp. 302.
119. Simopoulos, A.P. The importance of the ratio of omega-6/omega-3 essential fatty acids. Biomed. Pharmacother. 2002, 56, 365–379.
120. Nguemeni, C.; Delplanque, B.; Rovère, C.; Simon-Rousseau, N.; Gandin, C.; Agnani, G.; Nahon, J.L.; Heurteaux, C.; Blondeau, N. Dietary supplementation of alpha-linolenic acid in an enriched rapeseed oil diet protects from stroke. Pharmacol. Res. 2010, 61, 226–233.
121. Bu, J.; Dou, Y.; Tian, X.; Wang, Z.; Chen, G. The role of omega-3 polyunsaturated fatty acids in stroke. Oxid. Med. Cell. Longev. 2016, 2016 (6906712), 8.
122. Awada, M.; Soulage, C.O.; Meynier, A.; Debard, C.; Plaisancié, P.; Benoit, B.; Picard, G.; Loizon, E.; Chauvin, M.; Estienne, M.; Peretti, N.; Guichardant, M.; Lagarde, M.; Genot, C.; Michalski, M. Dietary oxidized n-3 PUFA induce oxidative stress and inflammation: role of intestinal absorption of 4-HHE and reactivity in intestinal cells. J. Lipid Res. 2012, 53, 2069–2080.
123. Tarvainen, M.; Phuphusit, A.; Suomela, J.; Kuksis, A.; Kallio, H. Effects of antioxidants on rapeseed oil oxidation in an artificial digestion model analyzed by UHPLC–ESI–MS. J. Agric. Food Chem. 2012, 60, 3564–3579.
124. Thiyam-Holländer, U.; Eskin, N.A.M.; Matthäus, B., Eds. Canola and rapeseed: production, processing, food quality, and nutrition; CRC Press: Boca Raton, 2013; pp. 374.
125. Weselake, R.J.; Taylor, D.C.; Rahman, M.H.; Shah, S.; Laroche, A.; McVetty, P.B.E.; Harwood, J.L. Increasing the flow of carbon into seed oil. Biotechnol. Adv. 2009, 27, 866–878.
126. Wang, C.; Hai, J.; Yang, J.; Tian, J.; Chen, W.; Chen, T.; Luo, H.; Wang, H. Influence of leaf and silique photosynthesis on seeds yield and seeds oil quality of oilseed rape (Brassica napus L.). Eur. J. Agron. 2016, 74, 112–118.
127. Baud, S.; Lepiniec, L. Physiological and developmental regulation of seed oil production. Prog. Lipid Res. 2010, 49, 235–249.
128. Liu, J.; Hua, W.; Yang, H.; Guo, T.; Sun, X.; Wang, X.; Liu, G.; Wang, H. Effects of specific organs on seed oil accumulation in Brassica napus L. Plant Sci. 2014, 227, 60–68.
129. Kangas, A.; Laine, A.; Niskanen, M.; Salo, Y.; Vuorinen, M.; Jauhiainen, L.; Nikander, H. Results of official variey trials 2004–2011. MTT Kasvu 2011, 18, 1–172.
130. Kennedy, E.P. Biosynthesis of complex lipids. Fed. Proc. 1961, 20, 934–940.
131. Miller, P.; Lanier, W.; Brandt, S. Using growing degree days to predict plant stages, In Montguide, MT200103 AG. Montana State University Extension Service: Bozeman, 2001; Vol. 7, pp. 8.
132. Kallio, H.; Johansson, A.; Oksman, P. Composition and development of turnip rapeseed (Brassica campestris) oil triacylglycerols at different stages of maturation. J. Agric. Food Chem. 1991, 39, 1752–1756.
133. Bates, P.D.; Stymne, S.; Ohlrogge, J. Biochemical pathways in seed oil synthesis. Curr. Opin. Plant Biol. 2013, 16, 358–364.

References
75
134. Baumert, A.; Milkowski, C.; Schmidt, J.; Nimtz, M.; Wray, V.; Strack, D. Formation of a complex pattern of sinapate esters in Brassica napus seeds, catalyzed by enzymes of a serine carboxypeptidase-like acyltransferase family? Phytochemistry 2005, 66, 1334–1345.
135. Bouchereau, A.; Hamelin, J.; Lamour, I.; Renard, M.; Larher, F. Distribution of sinapine and related compounds in seeds of Brassica and allied genera. Phytochemistry 1991, 30, 1873–1881.
136. Dixon, R.A.; Paiva, N.L. Stress-induced phenylpropanoid metabolism. Plant Cell 1995, 7, 1085–1097.
137. Bouchereau, A.; Clossais-Besnard, N.; Bensaoud, A.; Leport, L.; Renard, M. Water stress effects on rapeseed quality. Eur. J. Agron. 1996, 5, 19–30.
138. Fang, J.; Reichelt, M.; Hidalgo, W.; Agnolet, S.; Schneider, B. Tissue-specific distribution of secondary metabolites in rapeseed (Brassica napus L.). PLoS ONE 2012, 7 (e48006), 8.
139. Vuorela, S.; Meyer, A.S.; Heinonen, M. Impact of isolation method on the antioxidant activity of rapeseed meal phenolics. J. Agric. Food Chem. 2004, 52, 8202–8207.
140. Vuorela, S.; Kreander, K.; Karonen, M.; Nieminen, R.; Hämäläinen, M.; Galkin, A.; Laitinen, L.; Salminen, J.; Moilanen, E.; Pihlaja, K.; Vuorela, H.; Vuorela, P.; Heinonen, M. Preclinical evaluation of rapeseed, raspberry, and pine bark phenolics for health related effects. J. Agric. Food Chem. 2005, 53, 5922–5931.
141. Peltonen-Sainio, P.; Jauhiainen, L.; Hyövelä, M.; Nissilä, E. Trade-off between oil and protein in rapeseed at high latitudes: Means to consolidate protein crop status? Field Crops Res. 2011, 121, 248–255.
142. Peltonen-Sainio, P.; Jauhiainen, L.; Hakala, K. Crop responses to temperature and precipitation according to long-term multi-location trials at high-latitude conditions. J. Agric. Sci. 2011, 149, 49–62.
143. European Union Council directive 2001/110/EC of 20 December 2001 relating to honey. OJ 2002, L 010, 47–52.
144. Bommarco, R.; Marini, L.; Vaissière, B.E. Insect pollination enhances seed yield, quality, and market value in oilseed rape. Oecologia 2012, 169, 1025–1032.
145. Klatt, B.K.; Holzschuh, A.; Westphal, C.; Clough, Y.; Smit, I.; Pawelzik, E.; Tscharntke, T. Bee pollination improves crop quality, shelf life and commercial value. Proc. R. Soc. B 2013, 281 (20132440), 8.
146. Gheldof, N.; Wang, X.; Engeseth, N.J. Buckwheat honey increases serum antioxidant capacity in humans. J. Agric. Food Chem. 2003, 51, 1500–1505.
147. Huttunen, S.; Riihinen, K.; Kauhanen, J.; Tikkanen-Kaukanen, C. Antimicrobial activity of different Finnish monofloral honeys against human pathogenic bacteria. APMIS 2013, 121, 827–834.
148. Persano Oddo, L.; Bogdanov, S. Determination of honey botanical origin: problems and issues. Apidologie 2004, 35, S2–S3.
149. von der Ohe, W.; Persano Oddo, L.; Piana, M.L.; Morlot, M.; Martin, P. Harmonized methods of melissopalynology. Apidologie 2004, 35, S18–S25.
150. Piana, M.L.; Persano Oddo, L.; Bentabol, A.; Bruneau, E.; Bogdanov, S.; Guyot Declerck, C. Sensory analysis applied to honey: state of the art. Apidologie 2004, 35, S26–S37.
151. Bogdanov, S.; Ruoff, K.; Persano Oddo, L. Physico-chemical methods for the characterisation of unifloral honeys: a review. Apidologie 2004, 35, S4–S17.
152. Salonen, A.; Ollikka, T.; Grönlund, E.; Ruottinen, L.; Julkunen-Tiitto, R. Pollen analyses of honey from Finland. Grana 2009, 48, 281–289.
153. Fischer, M.K.; Shingleton, A.W. Host plant and ants influence the honeydew sugar composition of aphids. Funct. Ecol. 2001, 15, 544–550.
154. Hermosín, I.; Chicón, R.M.; Dolores Cabezudo, M. Free amino acid composition and botanical origin of honey. Food Chem. 2003, 83, 263–268.
155. Cotte, J.F.; Casabianca, H.; Chardon, S.; Lheritier, J.; Grenier-Loustalot, M. Chromatographic analysis of sugars applied to the characterisation of monofloral honey. Anal. Bioanal. Chem. 2004, 380, 698–705.
156. Svečnjak, L.; Bubalo, D.; Baranović, G.; Novosel, H. Optimization of FTIR-ATR spectroscopy for botanical authentication of

References
76
unifloral honey types and melissopalynological data prediction. Eur. Food Res. Technol. 2015, 240, 1101–1115.
157. Moore, J.C.; Spink, J.; Lipp, M. Development and application of a database of food ingredient fraud and economically motivated adulteration from 1980 to 2010. J. Food Sci. 2012, 77, R118–R126.
158. Bertelli, D.; Lolli, M.; Papotti, G.; Bortolotti, L.; Serra, G.; Plessi, M. Detection of honey adulteration by sugar syrups using one-dimensional and two-dimensional high-resolution nuclear magnetic resonance. J. Agric. Food Chem. 2010, 58, 8495–8501.
159. Spiteri, M.; Jamin, E.; Thomas, F.; Rebours, A.; Lees, M.; Rogers, K.M.; Rutledge, D.N. Fast and global authenticity screening of honey using 1H-NMR profiling. Food Chem. 2015, 189, 60–66.
160. Cotte, J.F.; Casabianca, H.; Chardon, S.; Lheritier, J.; Grenier-Loustalot, M.F. Application of carbohydrate analysis to verify honey authenticity. J. Chromatogr. A 2003, 1021, 145–155.
161. Cotte, J.F.; Casabianca, H.; Lhéritier, J.; Perrucchietti, C.; Sanglar, C.; Waton, H.; Grenier-Loustalot, M.F. Study and validity of 13C stable carbon isotopic ratio analysis by mass spectrometry and 2H site-specific natural isotopic fractionation by nuclear magnetic resonance isotopic measurements to characterize and control the authenticity of honey. Anal. Chim. Acta 2007, 582, 125–136.
162. Bloch, F.; Hansen, W.W.; Packard, M. Nuclear induction. Phys. Rev. 1946, 69, 127.
163. Purcell, E.M.; Torrey, H.C.; Pound, R.V. Resonance absorption by nuclear magnetic moments in a solid. Phys. Rev. 1946, 37–38.
164. Ernst, R.R.; Anderson, W.A. Application of Fourier transform spectroscopy to magnetic resonance. Rev. Sci. Instrum. 1966, 37, 93–102.
165. Günther, H. NMR spectroscopy: basic principles, concepts and applications in chemistry, 3rd ed; Wiley-VCH: Weinheim, 2013; pp. 736.
166. Spyros, A.; Dais, P. NMR Spectroscopy in Food Analysis; The Royal Society of Chemistry: Cambridge, 2013; pp. 329.
167. Claridge, T.D.W., Ed. High-resolution NMR techniques in organic chemistry, 2nd ed.; Elsevier: Oxford, 2009; Vol. 27, pp. 383.
168. Balcı, M. Basic 1H- and 13C-NMR spectroscopy; Elsevier: Amsterdam, 2005; pp. 430.
169. Dais, P.; Hatzakis, E. Quality assessment and authentication of virgin olive oil by NMR spectroscopy: A critical review. Anal. Chim. Acta 2013, 765, 1–27.
170. Spyros, A.; Dais, P. 31P NMR spectroscopy in food analysis. Prog. Nucl. Magn. Reson. Spectrosc. 2009, 54, 195–207.
171. Mattinen, M.; Filpponen, I.; Järvinen, R.; Li, B.; Kallio, H.; Lehtinen, P.; Argyropoulos, D. Structure of the polyphenolic component of suberin isolated from potato (Solanum tuberosum var. Nikola). J. Agric. Food Chem. 2009, 57, 9747–9753.
172. Mo, H.; Raftery, D. Solvent signal is a NMR concentration reference. Anal. Chem. 2008, 80, 9835–9839.
173. Ritota, M.; Casciani, L.; Han, B.; Cozzolino, S.; Leita, L.; Sequi, P.; Valentini, M. Traceability of Italian garlic (Allium sativum L.) by means of HRMAS-NMR spectroscopy and multivariate data analysis. Food Chem. 2012, 135, 684–693.
174. Santos, A.D.C.; Fonseca, F.A.; Lião, L.M.; Alcantara, G.B.; Barison, A. High-resolution magic angle spinning nuclear magnetic resonance in foodstuff analysis. TrAC Trends Anal. Chem. 2015, 73, 10–18.
175. Ritota, M.; Marini, F.; Sequi, P.; Valentini, M. Metabolomic characterization of Italian sweet pepper (Capsicum annum L.) by means of HRMAS-NMR spectroscopy and multivariate analysis. J. Agric. Food Chem. 2010, 58, 9675–9684.
176. Gil, A.M.; Duarte, I.F.; Delgadillo, I.; Colquhoun, I.J.; Casuscelli, F.; Humpfer, E.; Spraul, M. Study of the compositional changes of mango during ripening by use of nuclear magnetic resonance spectroscopy. J. Agric. Food Chem. 2000, 48, 1524–1536.
177. Mallamace, D.; Corsaro, C.; Salvo, A.; Cicero, N.; Macaluso, A.; Giangrosso, G.; Ferrantelli, V.; Dugo, G. A multivariate statistical analysis coming from the NMR metabolic profile of cherry tomatoes (the

References
77
Sicilian Pachino case). Physica A 2014, 401, 112–117.
178. Järvinen, R. Cuticular and suberin polymers of edible plants: analysis by gas chromatographic-mass spectrometric and solid state spectroscopic methods. Academic dissertation, Turun yliopisto, Turku, Finland, 2010.
179. Todt, H.; Guthausen, G.; Burk, W.; Schmalbein, D.; Kamlowski, A. Water/moisture and fat analysis by time-domain NMR. Food Chem. 2006, 96, 436–440.
180. Santos, P.M.; Pereira-Filho, E.R.; Colnago, L.A. Detection and quantification of milk adulteration using time domain nuclear magnetic resonance (TD-NMR). Microchem. J. 2016, 124, 15–19.
181. Pereira, F.M.V.; Bertelli Pflanzer, S.; Gomig, T.; Lugnani Gomes, C.; de Felício, P.E.; Alberto Colnago, L. Fast determination of beef quality parameters with time-domain nuclear magnetic resonance spectroscopy and chemometrics. Talanta 2013, 108, 88–91.
182. Rudi, T.; Guthausen, G.; Burk, W.; Reh, C.T.; Isengard, H.-D. Simultaneous determination of fat and water content in caramel using time domain NMR. Food Chem. 2008, 106, 1375–1378.
183. Hills, B.; Benamira, S.; Marigheto, N.; Wright, K. T1-T2 correlation analysis of complex foods. Appl. Magn. Reson. 2004, 26, 543–560.
184. Martin, G.J.; Martin, M.L. Deuterium labelling at the natural abundance level as studied by high field quantitative 2H NMR. Tetrahedron Lett. 1981, 22, 3525–3528.
185. Martin, G.J.; Benbernou, M.; Lantier, F. Application of site-specific natural isotope fractionation (SNIF-NMR) of hydrogen to the characterization of European beers. J. Inst. Brewing 1985, 91, 242–249.
186. Martin, G.G.; Martin, Y.; Naulet, N.; McManus, H.J.D. Application of 2H SNIF-NMR and 13C SIRA-MS analyses to maple syrup: detection of added sugars. J. Agric. Food Chem. 1996, 44, 3206–3213.
187. Jamin, E.; Martin, F.; Martin, G.G.; Fauhl, A.-C. Determination of site-specific (deuterium/hydrogen) ratios in vanillin by 2H-nuclear magnetic resonance spectrometry: collaborative study. J. AOAC Int. 2007, 90, 187–195.
188. Monakhova, Y.B.; Godelmann, R.; Hermann, A.; Kuballa, T.; Cannet, C.; Schäfer, H.; Spraul, M.; Rutledge, D.N. Synergistic effect of the simultaneous chemometric analysis of 1H NMR spectroscopic and stable isotope (SNIF-NMR, 18O, 13C) data: Application to wine analysis. Anal. Chim. Acta 2014, 833, 29–39.
189. Ward, J.L.; Baker, J.M.; Beale, M.H. Recent applications of NMR spectroscopy in plant metabolomics. FEBS Journal 2007, 274, 1126–1131.
190. Sarker, S.D.; Nahar, L. Hyphenated techniques and their applications in natural products analysis. In Natural Products Isolation; Sarker, D.S., Nahar, L., Eds.; Humana Press: Totowa, 2012; pp. 301–340.
191. Maly, T.; Debelouchina, G.T.; Bajaj, V.S.; Hu, K.; Joo, C.; Mak–Jurkauskas, M.L.; Sirigiri, J.R.; van der Wel, P.C.A.; Herzfeld, J.; Temkin, R.J.; Griffin, R.G. Dynamic nuclear polarization at high magnetic fields. J. Chem. Phys. 2008, 128, 052211.
192. Skov, T.; Honoré, A.H.; Jensen, H.M.; Næs, T.; Engelsen, S.B. Chemometrics in foodomics: Handling data structures from multiple analytical platforms. TrAC Trends Anal. Chem. 2014, 60, 71–79.
193. Izquierdo-García, J.L.; Villa, P.; Kyriazis, A.; del Puerto-Nevado, L.; Pérez-Rial, S.; Rodriguez, I.; Hernandez, N.; Ruiz-Cabello, J. Descriptive review of current NMR-based metabolomic data analysis packages. Prog. Nucl. Magn. Reson. Spectrosc. 2011, 59, 263–270.
194. van Beek, J.D. matNMR: A flexible toolbox for processing, analyzing and visualizing magnetic resonance data in Matlab®. J. Magn. Reson. 2007, 187, 19–26.
195. Worley, B.; Powers, R. MVAPACK: a complete data handling package for NMR metabolomics. ACS Chem. Biol. 2014, 9, 1138–1144.
196. Xia, J.; Psychogios, N.; Young, N.; Wishart, D.S. MetaboAnalyst: a web server for metabolomic data analysis and interpretation. Nucleic Acids Res. 2009, 37, W652–W660.
197. Brennan, L. NMR-based metabolomics: From sample preparation to applications in

References
78
nutrition research. Prog. Nucl. Magn. Reson. Spectrosc. 2014, 83, 42–49.
198. Smolinska, A.; Blanchet, L.; Buydens, L.M.C.; Wijmenga, S.S. NMR and pattern recognition methods in metabolomics: From data acquisition to biomarker discovery: A review. Anal. Chim. Acta 2012, 750, 82–97.
199. Chang, D.; Banack, C.D.; Shah, S.L. Robust baseline correction algorithm for signal dense NMR spectra. J. Magn. Reson. 2007, 187, 288–292.
200. Xi, Y.; Rocke, D.M. Baseline correction for NMR spectroscopic metabolomics data analysis. BMC Bioinformatics 2008, 9 (324), 10.
201. Metz, K.R.; Lam, M.M.; Webb, A.G. Reference deconvolution: A simple and effective method for resolution enhancement in nuclear magnetic resonance spectroscopy. Concepts Magn. Reson. 2000, 12, 21–42.
202. Savorani, F.; Tomasi, G.; Engelsen, S.B. icoshift: A versatile tool for the rapid alignment of 1D NMR spectra. J. Magn. Reson. 2010, 202, 190–202.
203. Nielsen, N.V.; Carstensen, J.M.; Smedsgaard, J. Aligning of single and multiple wavelength chromatographic profiles for chemometric data analysis using correlation optimised warping. J. Chromatogr. A 1998, 805, 17–35.
204. Tomasi, G.; Berg, F.; Andersson, C. Correlation optimized warping and dynamic time warping as preprocessing methods for chromatographic data. J. Chemometrics 2004, 18, 231–241.
205. Bloemberg, T.G.; Gerretzen, J.; Lunshof, A.; Wehrens, R.; Buydens, L.M.C. Warping methods for spectroscopic and chromatographic signal alignment: A tutorial. Anal. Chim. Acta 2013, 781, 14–32.
206. Wu, W.; Daszykowski, M.; Walczak, B.; Sweatman, B.C.; Connor, S.C.; Haselden, J.N.; Crowther, D.J.; Gill, R.W.; Lutz, M.W. Peak alignment of urine NMR spectra using fuzzy warping. J. Chem. Inf. Model. 2006, 46, 863–875.
207. Vu, T.N.; Valkenborg, D.; Smets, K.; Verwaest, K.A.; Dommisse, R.; Lemière, F.; Verschoren, A.; Goethals, B.; Laukens, K. An integrated workflow for robust alignment and simplified quantitative
analysis of NMR spectrometry data. BMC Bioinformatics 2011, 12 (405), 14.
208. del Campo, G.; Berregi, I.; Caracena, R.; Santos, J.I. Quantitative analysis of malic and citric acids in fruit juices using proton nuclear magnetic resonance spectroscopy. Anal. Chim. Acta 2006, 556, 462–468.
209. Spraul, M.; Schütz, B.; Humpfer, E.; Mörtter, M.; Schäfer, H.; Koswig, S.; Rinke, P. Mixture analysis by NMR as applied to fruit juice quality control. Magn. Reson. Chem. 2009, 47, S130–S137.
210. Weljie, A.M.; Newton, J.; Mercier, P.; Carlson, E.; Slupsky, C.M. Targeted profiling: quantitative analysis of 1H NMR metabolomics data. Anal. Chem. 2006, 78, 4430–4442.
211. Monakhova, Y.B.; Tsikin, A.M.; Kuballa, T.; Lachenmeier, D.W.; Mushtakova, S.P. Independent component analysis (ICA) algorithms for improved spectral deconvolution of overlapped signals in 1H NMR analysis: application to foods and related products. Magn. Reson. Chem. 2014, 52, 231–240.
212. Neidig, K. AMIX-Viewer & AMIX Software Manual, v. 3.9.; Bruker BioSpin GmbH: Rheinstetten, 2009; pp. 436.
213. Craig, A.; Cloarec, O.; Holmes, E.; Nicholson, J.K.; Lindon, J.C. Scaling and normalization effects in NMR spectroscopic metabonomic data sets. Anal. Chem. 2006, 78, 2262–2267.
214. Savorani, F.; Rasmussen, M.A.; Mikkelsen, M.S.; Engelsen, S.B. A primer to nutritional metabolomics by NMR spectroscopy and chemometrics. Food Res. Int. 2013, 54, 1131–1145.
215. Eriksson, L.; Byrne, T.; Johansson, E.; Trygg, J.; Vikström, C. Multi- and Megavariate Data Analysis: Basic Principles and Applications, 3rd ed.; MKS Umetrics AB: Malmö, 2013; pp. 500.
216. Worley, B.; Powers, R. Multivariate analysis in metabolomics. Curr. Metabolomics 2013, 1, 92–107.
217. Pearson, K. On lines and planes of closest fit to systems of points in space. Philos. Mag. 1901, 2, 559–572.
218. Hotelling, H. Analysis of a complex of statistical variables into principal components. J. Educ. Psychol. 1933, 24, 417–441.

References
79
219. Trygg, J.; Lundstedt, T. Chapter 6 –Chemometrics Techniques for Metabonomics. In The Handbook of Metabonomics and Metabolomics; Lindon, J.C., Nicholson, J.K., Holmes, E., Eds.; Elsevier B.V.: Amsterdam, 2007; pp. 171–199.
220. Wold, S.; Sjöström, M.; Eriksson, L. PLS-regression: a basic tool of chemometrics. Chemometrics Intellig. Lab. Syst. 2001, 58, 109–130.
221. Bylesjö, M.; Rantalainen, M.; Cloarec, O.; Nicholson, J.K.; Holmes, E.; Trygg, J. OPLS discriminant analysis: combining the strengths of PLS-DA and SIMCA classification. J. Chemometrics 2006, 20, 341–351.
222. Triba, M.N.; Le Moyec, L.; Amathieu, R.; Goossens, C.; Bouchemal, N.; Nahon, P.; Rutledge, D.N.; Savarin, P. PLS/OPLS models in metabolomics: the impact of permutation of dataset rows on the K-fold cross-validation quality parameters. Mol. BioSyst. 2015, 11, 13–19.
223. Trimigno, A.; Marincola, F.C.; Dellarosa, N.; Picone, G.; Laghi, L. Definition of food quality by NMR-based foodomics. Curr. Opin. Food Sci. 2015, 4, 99–104.
224. Dixon, R.A.; Gang, D.R.; Charlton, A.J.; Fiehn, O.; Kuiper, H.A.; Reynolds, T.L.; Tjeerdema, R.S.; Jeffery, E.H.; German, J.B.; Ridley, W.P.; Seiber, J.N. Applications of metabolomics in agriculture. J. Agric. Food Chem. 2006, 54, 8984–8994.
225. Verpoorte, R.; Choi, Y.H.; Mustafa, N.R.; Kim, H.K. Metabolomics: back to basics. Phytochem. Rev. 2008, 7, 525–537.
226. Nadella, K.D.; Marla, S.S.; Kumar, P.A. Metabolomics in agriculture. OMICS 2012, 16, 149–159.
227. Lämmerhofer, M.; Weckwerth, W., Eds.. Metabolomics in Practice: Successful Strategies to Generate and Analyze Metabolic Data; Wiley-VCH: Weinheim, 2013; pp. 442.
228. Sotelo, J.; Slupsky, C.M. Metabolomics using nuclear magnetic resonance (NMR). In Metabolomics in Food and Nutrition; Weimer, B.C., Slupsky, C.M., Eds.; Woodhead Publishing: Philadelphia, 2013; pp. 29–43.
229. Nicholson, J.K.; Connelly, J.; Lindon, J.C.; Holmes, E. Metabonomics: a platform
for studying drug toxicity and gene function. Nat. Rev. Drug Discov. 2002, 1, 153–161.
230. Cifuentes, A. Food analysis and foodomics. J. Chromatogr. A 2009, 1216, 7109.
231. Defernez, M.; Colquhoun, I.J. Factors affecting the robustness of metabolite fingerprinting using 1H NMR spectra. Phytochemistry 2003, 62, 1009–1017.
232. Dettmer, K.; Aronov, P.A.; Hammock, B.D. Mass spectrometry-based metabolomics. Mass Spectrom. Rev. 2007, 26, 51–78.
233. Beckonert, O.; Keun, H.C.; Ebbels, T.M.D.; Bundy, J.; Holmes, E.; Lindon, J.C.; Nicholson, J.K. Metabolic profiling, metabolomic and metabonomic procedures for NMR spectroscopy of urine, plasma, serum and tissue extracts. Nat. Protocols 2007, 2, 2692–2703.
234. Kirk, H.; Choi, Y.H.; Kim, H.K.; Verpoorte, R.; van, d.M. Comparing metabolomes: the chemical consequences of hybridization in plants. New Phytol. 2005, 167, 613–622.
235. Kim, H.K.; Choi, Y.H.; Verpoorte, R. NMR-based metabolomic analysis of plants. Nat. Protocols 2010, 5, 536–549.
236. Sobolev, A.P.; Brosio, E.; Gianferri, R.; Segre, A.L. Metabolic profile of lettuce leaves by high-field NMR spectra. Magn. Reson. Chem. 2005, 43, 625–638.
237. Capitani, D.; Mannina, L.; Proietti, N.; Sobolev, A.P.; Tomassini, A.; Miccheli, A.; Di Cocco, M.E.; Capuani, G.; De Salvador, R.; Delfini, M. Monitoring of metabolic profiling and water status of Hayward kiwifruits by nuclear magnetic resonance. Talanta 2010, 82, 1826–1838.
238. Kim, H.; Park, S.J.; Hyun, S.; Yang, S.; Lee, J.; Auh, J.; Kim, J.; Cho, S.; Marriott, P.J.; Choi, H. Biochemical monitoring of black raspberry (Rubus coreanus Miquel) fruits according to maturation stage by 1H NMR using multiple solvent systems. Food Res. Int. 2011, 44, 1977–1987.
239. Li, W.; Ruan, C.; Teixeira, d.S.; Guo, H.; Zhao, C. NMR metabolomics of berry quality in sea buckthorn (Hippophae L.). Mol. Breed. 2013, 31, 57–67.
240. Su, Y.W.; Tan, E.; Zhang, J.; , Y.J.L.; Liu, Y.; Liu, C.; Z.X.D.; Zhang, Y. Study

References
80
on three different species tibetan medicine sea buckthorn by 1H-NMR-based metabonomics. Zhongguo Zhong Yao Za Zhi 2014, 39, 4234–4239.
241. Wagner, L.; Trattner, S.; Pickova, J.; Gómez-Requeni, P.; Moazzami, A.A. 1H NMR-based metabolomics studies on the effect of sesamin in Atlantic salmon (Salmo salar). Food Chem. 2014, 147, 98–105.
242. Straadt, I.K.; Aaslyng, M.D.; Bertram, H.C. Assessment of meat quality by NMR – an investigation of pork products originating from different breeds. Magn. Reson. Chem. 2011, 49, S71–S78.
243. Zanardi, E.; Caligiani, A.; Padovani, E.; Mariani, M.; Ghidini, S.; Palla, G.; Ianieri, A. Detection of irradiated beef by nuclear magnetic resonance lipid profiling combined with chemometric techniques. Meat Sci. 2013, 93, 171–177.
244. Castejón, D.; García-Segura, J.M.; Escudero, R.; Herrera, A.; Cambero, M.I. Metabolomics of meat exudate: Its potential to evaluate beef meat conservation and aging. Anal. Chim. Acta 2015, 901, 1–11.
245. Zanardi, E.; Caligiani, A.; Palla, L.; Mariani, M.; Ghidini, S.; Di Ciccio, P.A.; Palla, G.; Ianieri, A. Metabolic profiling by 1H NMR of ground beef irradiated at different irradiation doses. Meat Sci. 2015, 103, 83–89.
246. Monakhova, Y.B.; Godelmann, R.; Andlauer, C.; Kuballa, T.; Lachenmeier, D.W. Identification of imitation cheese and imitation ice cream based on vegetable fat using NMR spectroscopy and chemometrics. Int. J. Food Sci. 2013, 2013 (367841), 9.
247. Piras, C.; Cesare Marincola, F.; Savorani, F.; Engelsen, S.B.; Cosentino, S.; Viale, S.; Pisano, M.B. A NMR metabolomics study of the ripening process of the Fiore Sardo cheese produced with autochthonous adjunct cultures. Food Chem. 2013, 141, 2137–2147.
248. Pisano, M.B.; Scano, P.; Murgia, A.; Cosentino, S.; Caboni, P. Metabolomics and microbiological profile of Italian mozzarella cheese produced with buffalo and cow milk. Food Chem. 2016, 192, 618–624.
249. Monakhova, Y.B.; Kuballa, T.; Leitz, J.; Andlauer, C.; Lachenmeier, D.W. NMR
spectroscopy as a screening tool to validate nutrition labeling of milk, lactose-free milk, and milk substitutes based on soy and grains. Dairy Sci. Technol. 2011, 92, 109–120.
250. Sundekilde, U.K.; Frederiksen, P.D.; Clausen, M.R.; Larsen, L.B.; Bertram, H.C. Relationship between the metabolite profile and technological properties of bovine milk from two dairy breeds elucidated by NMR-based metabolomics. J. Agric. Food Chem. 2011, 59, 7360–7367.
251. Erich, S.; Schill, S.; Annweiler, E.; Waiblinger, H.; Kuballa, T.; Lachenmeier, D.W.; Monakhova, Y.B. Combined chemometric analysis of 1H NMR, 13C NMR and stable isotope data to differentiate organic and conventional milk. Food Chem. 2015, 188, 1–7.
252. Schievano, E.; Stocchero, M.; Morelato, E.; Facchin, C.; Mammi, S. An NMR-based metabolomic approach to identify the botanical origin of honey. Metabolomics 2012, 8, 679–690.
253. Zieliński, Ł; Deja, S.; Jasicka-Misiak, I.; Kafarski, P. Chemometrics as a tool of origin determination of Polish monofloral and multifloral honeys. J. Agric. Food Chem. 2014, 62, 2973–2981.
254. Donarski, J.A.; Jones, S.A.; Charlton, A.J. Application of cryoprobe 1H nuclear magnetic resonance spectroscopy and multivariate analysis for the verification of Corsican honey. J. Agric. Food Chem. 2008, 56, 5451–5456.
255. Boffo, E.F.; Tavares, L.A.; Tobias, A.C.T.; Ferreira, M.M.C.; Ferreira, A.G. Identification of components of Brazilian honey by 1H NMR and classification of its botanical origin by chemometric methods. LWT - Food Sci. Technol. 2012, 49, 55–63.
256. Consonni, R.; Cagliani, L.R.; Cogliati, C. NMR characterization of saccharides in Italian honeys of different floral sources. J. Agric. Food Chem. 2012, 60, 4526–4534.
257. Ohmenhaeuser, M.; Monakhova, Y.B.; Kuballa, T.; Lachenmeier, D.W. Qualitative and quantitative control of honeys using NMR spectroscopy and chemometrics. ISRN Anal. Chem. 2013, 2013 (825318), 9.
258. Sacco, A.; Brescia, M.; Liuzzi, V.; Reniero, F.; Guillou, G.; Ghelli, S.; Meer, P. Characterization of italian olive oils

References
81
based on analytical and nuclear magnetic resonance determinations. J. Am. Oil Chem. Soc. 2000, 77, 619–625.
259. Alonso-Salces, R.M.; Héberger, K.; Holland, M.V.; Moreno-Rojas, J.M.; Mariani, C.; Bellan, G.; Reniero, F.; Guillou, C. Multivariate analysis of NMR fingerprint of the unsaponifiable fraction of virgin olive oils for authentication purposes. Food Chem. 2010, 118, 956–965.
260. Fang, G.; Goh, J.Y.; Tay, M.; Lau, H.F.; Li, S.F.Y. Characterization of oils and fats by 1H NMR and GC/MS fingerprinting: Classification, prediction and detection of adulteration. Food Chem. 2013, 138, 1461–1469.
261. Parker, T.; Limer, E.; Watson, A.D.; Defernez, M.; Williamson, D.; Kemsley, E.K. 60 MHz 1H NMR spectroscopy for the analysis of edible oils. TrAC Trends Anal. Chem. 2014, 57, 147–158.
262. Piccinonna, S.; Ragone, R.; Stocchero, M.; Del Coco, L.; De Pascali, S.A.; Schena, F.P.; Fanizzi, F.P. Robustness of NMR-based metabolomics to generate comparable data sets for olive oil cultivar classification. An inter-laboratory study on Apulian olive oils. Food Chem. 2016, 199, 675–683.
263. Koda, M.; Furihata, K.; Wei, F.; Miyakawa, T.; Tanokura, M. Metabolic discrimination of mango juice from various cultivars by band-selective NMR spectroscopy. J. Agric. Food Chem. 2012, 60, 1158–1166.
264. Vigneau, E.; Thomas, F. Model calibration and feature selection for orange juice authentication by 1H NMR spectroscopy. Chemometrics Intellig. Lab. Syst. 2012, 117, 22–30.
265. de Oliveira, C.R.; Carneiro, R.L.; Ferreira, A.G. Tracking the degradation of fresh orange juice and discrimination of orange varieties: An example of NMR in coordination with chemometrics analyses. Food Chem. 2014, 164, 446–453.
266. Lee, J.; Lee, B.; Chung, J.; Kim, H.; Kim, E.; Jung, S.; Lee, H.; Lee, S.; Hong, Y. Metabolomic unveiling of a diverse range of green tea (Camellia sinensis) metabolites dependent on geography. Food Chem. 2015, 174, 452–459.
267. Wei, F.; Furihata, K.; Hu, F.; Miyakawa, T.; Tanokura, M. Two-dimensional 1H–13C
nuclear magnetic resonance (NMR)-based comprehensive analysis of roasted coffee bean extract. J. Agric. Food Chem. 2011, 59, 9065–9073.
268. Wei, F.; Furihata, K.; Koda, M.; Hu, F.; Kato, R.; Miyakawa, T.; Tanokura, M. 13C NMR-based metabolomics for the classification of green coffee beans according to variety and origin. J. Agric. Food Chem. 2012, 60, 10118–10125.
269. Cagliani, L.R.; Pellegrino, G.; Giugno, G.; Consonni, R. Quantification of Coffea arabica and Coffea canephora var. robusta in roasted and ground coffee blends. Talanta 2013, 106, 169–173.
270. Kwon, D.; Jeong, H.; Moon, H.; Kim, H.; Cho, J.; Lee, J.; Hong, K.S.; Hong, Y. Assessment of green coffee bean metabolites dependent on coffee quality using a 1H NMR-based metabolomics approach. Food Res. Int. 2015, 67, 175–182.
271. Rochfort, S.; Ezernieks, V.; Bastian, S.E.P.; Downey, M.O. Sensory attributes of wine influenced by variety and berry shading discriminated by NMR metabolomics. Food Chem. 2010, 121, 1296–1304.
272. Ali, K.; Maltese, F.; Toepfer, R.; Choi, Y.H.; Verpoorte, R. Metabolic characterization of Palatinate German white wines according to sensory attributes, varieties, and vintages using NMR spectroscopy and multivariate data analyses. J. Biomol. NMR 2011, 49, 255–266.
273. López-Rituerto, E.; Savorani, F.; Avenoza, A.; Busto, J.H.; Peregrina, J.M.; Engelsen, S. Investigations of La Rioja terroir for wine production using 1H NMR metabolomics. J. Agric. Food Chem. 2012, 60, 3452–3461.
274. Fotakis, C.; Zervou, M. NMR metabolic fingerprinting and chemometrics driven authentication of Greek grape marc spirits. Food Chem. 2016, 196, 760–768.
275. Ordoudi, S.A.; Cagliani, L.R.; Lalou, S.; Naziri, E.; Tsimidou, M.Z.; Consonni, R. 1H NMR-based metabolomics of saffron reveals markers for its quality deterioration. Food Res. Int. 2015, 70, 1–6.
276. Petrakis, E.A.; Cagliani, L.R.; Polissiou, M.G.; Consonni, R. Evaluation of saffron (Crocus sativus L.) adulteration with plant

References
82
adulterants by 1H NMR metabolite fingerprinting. Food Chem. 2015, 173, 890–896.
277. Van Emon, J.M. The omics revolution in agricultural research. J. Agric. Food Chem. 2016, 64, 36–44.
278. López-Gresa, M.P.; Lisón, P.; Kim, H.K.; Choi, Y.H.; Verpoorte, R.; Rodrigo, I.; Conejero, V.; Bellés, J.M. Metabolic fingerprinting of tomato mosaic virus infected Solanum lycopersicum. J. Plant Physiol. 2012, 169, 1586–1596.
279. Slisz, A.M.; Breksa, A.P.; Mishchuk, D.O.; McCollum, G.; Slupsky, C.M. Metabolomic analysis of citrus infection by 'Candidatus Liberibacter' reveals insight into pathogenicity. J. Proteome Res. 2012, 11, 4223–4230.
280. Sobolev, A.P.; Capitani, D.; Giannino, D.; Nicolodi, C.; Testone, G.; Santoro, F.; Frugis, G.; Iannelli, M.A.; Mattoo, A.K.; Brosio, E.; Gianferri, R.; D'Amico, I.; Mannina, L. NMR-metabolic methodology in the study of GM foods. Nutrients 2010, 2 (1), 15.
281. Simó, C.; Ibáñez, C.; Valdés, A.; Cifuentes, A.; García-Cañas, V. Metabolomics of genetically modified crops. Int. J. Mol. Sci. 2014, 15, 18941–18966.
282. Pacifico, D.; Casciani, L.; Ritota, M.; Mandolino, G.; Onofri, C.; Moschella, A.; Parisi, B.; Cafiero, C.; Valentini, M. NMR-based metabolomics for organic farming traceability of early potatoes. J. Agric. Food Chem. 2013, 61, 11201–11211.
283. Romero, N.; Saavedra, J.; Tapia, F.; Sepúlveda, B.; Aparicio, R. Influence of agroclimatic parameters on phenolic and volatile compounds of Chilean virgin olive oils and characterization based on geographical origin, cultivar and ripening stage. J. Sci. Food Agric. 2016, 96, 583–592.
284. Spevacek, A.R.; Benson, K.H.; Bamforth, C.W.; Slupsky, C.M. Beer metabolomics: molecular details of the brewing process and the differential effects of late and dry hopping on yeast purine metabolism. J. Inst. Brewing 2016, 122, 21–28.
285. Capitani, D.; Sobolev, A.P.; Delfini, M.; Vista, S.; Antiochia, R.; Proietti, N.; Bubici, S.; Ferrante, G.; Carradori, S.; Salvador, F.R.D.; Mannina, L. NMR
methodologies in the analysis of blueberries. Electrophoresis 2014, 35, 1615–1626.
286. Rodrigues, J.A.; Barros, A.S.; Carvalho, B.; Brandão, T.; Gil, A.M. Probing beer aging chemistry by nuclear magnetic resonance and multivariate analysis. Anal. Chim. Acta 2011, 702, 178–187.
287. Kim, J.; Jung, Y.; Song, B.; Bong, Y.; Ryu, D.H.; Lee, K.; Hwang, G. Discrimination of cabbage (Brassica rapassp.pekinensis) cultivars grown in different geographical areas using 1H NMR-based metabolomics. Food Chem. 2013, 137, 68–75.
288. Clausen, M.R.; Edelenbos, M.; Bertram, H.C. Mapping the variation of the carrot metabolome using 1H NMR spectroscopy and consensus PCA. J. Agric. Food Chem. 2014, 62, 4392–4398.
289. Tomassini, A.; Sciubba, F.; Di Cocco, M.E.; Capuani, G.; Delfini, M.; Aureli, W.; Miccheli, A. 1H NMR-based metabolomics reveals a pedoclimatic metabolic imprinting in ready-to-drink carrot juices. J. Agric. Food Chem. 2016, 64, 5284–5291.
290. Longobardi, F.; Ventrella, A.; Bianco, A.; Catucci, L.; Cafagna, I.; Gallo, V.; Mastrorilli, P.; Agostiano, A. Non-targeted 1H NMR fingerprinting and multivariate statistical analyses for the characterisation of the geographical origin of Italian sweet cherries. Food Chem. 2013, 141, 3028-3033.
291. Maes, P.; Monakhova, Y.B.; Kuballa, T.; Reusch, H.; Lachenmeier, D.W. Qualitative and quantitative control of carbonated cola beverages using 1H NMR spectroscopy. J. Agric. Food Chem. 2012, 60, 2778–2784.
292. Zotti, M.; De Pascali, S.A.; Del Coco, L.; Migoni, D.; Carrozzo, L.; Mancinelli, G.; Fanizzi, F.P. 1H NMR metabolomic profiling of the blue crab (Callinectes sapidus) from the Adriatic Sea (SE Italy): A comparison with warty crab (Eriphia verrucosa), and edible crab (Cancer pagurus). Food Chem. 2016, 196, 601–609.
293. Chen, D.; Ye, Y.; Chen, J.; Yan, X. Evolution of metabolomics profile of crab paste during fermentation. Food Chem. 2016, 192, 886–892.
294. Liang, T.; Wei, F.; Lu, Y.; Kodani, Y.; Nakada, M.; Miyakawa, T.; Tanokura, M.
References
83
Comprehensive NMR analysis of compositional changes of black garlic during thermal processing. J. Agric. Food Chem. 2015, 63, 683–691.
295. Schievano, E.; Peggion, E.; Mammi, S. 1H nuclear magnetic resonance spectra of chloroform extracts of honey for chemometric determination of its botanical origin. J. Agric. Food Chem. 2010, 58, 57–65.
296. Smilowitz, J.T.; O’Sullivan, A.; Barile, D.; German, J.B.; Lönnerdal, B.; Slupsky, C.M. The human milk metabolome reveals diverse oligosaccharide profiles. J. Nutr. 2013, 143, 1709–1718.
297. Praticó, G.; Capuani, G.; Tomassini, A.; Baldassarre, M.E.; Delfini, M.; Miccheli, A. Exploring human breast milk composition by NMR-based metabolomics. Nat. Prod. Res. 2014, 28, 95–101.
298. Rochfort, S.J.; Ezernieks, V.; Maher, A.D.; Ingram, B.A.; Olsen, L. Mussel metabolomics – Species discrimination and provenance determination. Food Res. Int. 2013, 54, 1302–1312.
299. Aisala, H.; Sinkkonen, J.; Kalpio, M.; Sandell, M.; This, H.; Hopia, A. In situ quantitative 1H nuclear magnetic resonance spectroscopy discriminates between raw and steam cooked potato strips based on their metabolites. Talanta 2016, 161, 245–252.
300. Capuano, E.; Lommen, A.; Heenan, S.; de la Dura, A.; Rozijn, M.; van Ruth, S. Wild salmon authenticity can be predicted by 1H-NMR spectroscopy. Lipid Technol. 2012, 24, 251–253.
301. Lee, J.; Lee, B.; Chung, J.; Hwang, J.; Lee, S.; Lee, C.; Hong, Y. Geographical and climatic dependencies of green tea (Camellia sinensis) metabolites: a 1H NMR-based metabolomics study. J. Agric. Food Chem. 2010, 58, 10582–10589.
302. Esslinger, S.; Riedl, J.; Fauhl-Hassek, C. Potential and limitations of non-targeted fingerprinting for authentication of food in official control. Food Res. Int. 2014, 60, 189–204.
303. Kortesniemi, M.; Sinkkonen, J.; Yang, B.; Kallio, H. 1H NMR spectroscopy reveals the effect of genotype and growth conditions on composition of sea buckthorn (Hippophaë rhamnoides L.) berries. Food Chem. 2014, 147, 138–146.
304. Kortesniemi, M.; Vuorinen, A.L.; Sinkkonen, J.; Yang, B.; Rajala, A.; Kallio, H. NMR metabolomics of ripened and developing oilseed rape (Brassica napus) and turnip rape (Brassica rapa). Food Chem. 2015, 172, 63–70.
305. Wishart, D.S.; Tzur, D.; Knox, C.; Eisner, R.; Guo, A.C.; Young, N.; Cheng, D.; Jewell, K.; Arndt, D.; Sawhney, S.; Fung, C.; Nikolai, L.; Lewis, M.; Coutouly, M.; Forsythe, I.; Tang, P.; Shrivastava, S.; Jeroncic, K.; Stothard, P.; Amegbey, G.; Block, D.; Hau, D.D.; Wagner, J.; Miniaci, J.; Clements, M.; Gebremedhin, M.; Guo, N.; Zhang, Y.; Duggan, G.E.; MacInnis, G.D.; Weljie, A.M.; Dowlatabadi, R.; Bamforth, F.; Clive, D.; Greiner, R.; Li, L.; Marrie, T.; Sykes, B.D.; Vogel, H.J.; Querengesser, L. HMDB: the Human Metabolome Database. Nucleic Acids Res. 2007, 35, D521–D526.
306. Jewison, T.; Knox, C.; Neveu, V.; Djoumbou, Y.; Guo, A.C.; Lee, J.; Liu, P.; Mandal, R.; Krishnamurthy, R.; Sinelnikov, I.; Wilson, M.; Wishart, D.S. YMDB: the Yeast Metabolome Database. Nucleic Acids Res. 2012, 40, D815–D820.
307. Louveaux, J.; Maurizio, A.; Vorwohl, G. Methods of melissopalynology. Bee World 1978, 59, 139–157.
308. Kersalo, J.; Pirinen, P., Eds. Suomen maakuntien ilmasto (in Finnish); Ilmatieteenlaitos: Helsinki, 2009; Vol. 8, pp. 185.
309. Tang, X.; Tigerstedt, P.M.A. Variation of physical and chemical characters within an elite sea buckthorn (Hippophae rhamnoides L.) breeding population. Sci. Hortic. 2001, 88, 203–214.
310. Kraemer, K.H.; Schenkel, E.P.; Verpoorte, R. Glucosylation of ethanol in Ilex paraguariensis cell suspension cultures. Plant Cell Rep. 1999, 18, 509–513.
311. Schievano, E.; Morelato, E.; Facchin, C.; Mammi, S. Characterization of markers of botanical origin and other compounds extracted from unifloral honeys. J. Agric. Food Chem. 2013, 61, 1747–1755.
312. Salonen, A. Boreal unifloral honeys: Screening of composition and properties. Academic dissertation, University of Eastern Finland, Joensuu, Finland, 2011.

References
84
313. Frérot, E.; Velluz, A.; Decorzant, E.; Naef, R. From linden flower to linden honey. Part 2 – Glycosidic precursors of cyclohexa-1,3-diene-1-carboxylic acids. Chem. Biodivers. 2006, 3, 94–100.

DOCTORAL THESES IN FOOD SCIENCES AT THE UNIVERSITY OF TURKU
1. REINO R. LINKO (1967) Fatty acids and other components of Baltic herring flesh lipids. (Organic chemistry). 2. HEIKKI KALLIO (1975) Identification of volatile aroma compounds in arctic bramble, Rubus arcticus L. and their
development during ripening of the berry, with special reference to Rubus stellatus SM. 3. JUKKA KAITARANTA (1981) Fish roe lipids and lipid hydrolysis in processed roe of certain Salmonidae fish as
studied by novel chromatographic techniques. 4. TIMO HIRVI (1983) Aromas of some strawberry and blueberry species and varieties studied by gas liquid
chromatographic and selected ion monitoring techniques. 5. RAINER HUOPALAHTI (1985) Composition and content of aroma compounds in the dill herb, Anethum graveolens
L., affected by different factors. 6. MARKKU HONKAVAARA (1989) Effect of porcine stress on the development of PSE meat, its characteristics and
influence on the economics of meat products manufacture. 7. PÄIVI LAAKSO (1992) Triacylglycerols – approaching the molecular composition of natural mixtures. 8. MERJA LEINO (1993) Application of the headspace gas chromatography complemented with sensory evaluation to
analysis of various foods. 9. KAISLI KERROLA (1994) Essential oils from herbs and spices: isolation by carbon dioxide extraction and
characterization by gas chromatography and sensory evaluation. 10. ANJA LAPVETELÄINEN (1994) Barley and oat protein products from wet processes: food use potential. 11. RAIJA TAHVONEN (1995) Contents of lead and cadmium in foods in Finland. 12. MAIJA SAXELIN (1995) Development of dietary probiotics: estimation of optimal Lactobacillus GG concentrations. 13. PIRJO‐LIISA PENTTILÄ (1995) Estimation of food additive and pesticide intakes by means of a stepwise method. 14. SIRKKA PLAAMI (1996) Contents of dietary fiber and inositol phosphates in some foods consumed in Finland. 15. SUSANNA EEROLA (1997) Biologically active amines: analytics, occurrence and formation in dry sausages. 16. PEKKA MANNINEN (1997) Utilization of supercritical carbon dioxide in the analysis of triacylglycerols and isolation
of berry oils. 17. TUULA VESA (1997) Symptoms of lactose intolerance: influence of milk composition, gastric emptying, and
irritable bowel syndrome. 18. EILA JÄRVENPÄÄ (1998) Strategies for supercritical fluid extraction of analytes in trace amounts from food
matrices. 19. ELINA TUOMOLA (1999) In vitro adhesion of probiotic lactic acid bacteria. 20. ANU JOHANSSON (1999) Availability of seed oils from Finnish berries with special reference to compositional,
geographical and nutritional aspects. 21. ANNE PIHLANTO‐LEPPÄLÄ (1999) Isolation and characteristics of milk‐derived bioactive peptides. 22. MIKA TUOMOLA (2000) New methods for the measurement of androstenone and skatole – compounds
associated with boar taint problem. (Biotechnology). 23. LEEA PELTO (2000) Milk hypersensitivity in adults: studies on diagnosis, prevalence and nutritional management. 24. ANNE NYKÄNEN (2001) Use of nisin and lactic acid/lactate to improve the microbial and sensory quality of
rainbow trout products. 25. BAORU YANG (2001) Lipophilic components of sea buckthorn (Hippophaë rhamnoides) seeds and berries and
physiological effects of sea buckthorn oils. 26. MINNA KAHALA (2001) Lactobacillar S‐layers: Use of Lactobacillus brevis S‐layer signals for heterologous protein
production. 27. OLLI SJÖVALL (2002) Chromatographic and mass spectrometric analysis of non‐volatile oxidation products of
triacylglycerols with emphasis on core aldehydes. 28. JUHA‐PEKKA KURVINEN (2002) Automatic data processing as an aid to mass spectrometry of dietary
triacylglycerols and tissue glycerophospholipids. 29. MARI HAKALA (2002) Factors affecting the internal quality of strawberry (Fragaria x ananassa Duch.) fruit. 30. PIRKKA KIRJAVAINEN (2003) The intestinal microbiota – a target for treatment in infant atopic eczema? 31. TARJA ARO (2003) Chemical composition of Baltic herring: effects of processing and storage on fatty acids,
mineral elements and volatile compounds. 32. SAMI NIKOSKELAINEN (2003) Innate immunity of rainbow trout: effects of opsonins, temperature and probiotics
on phagocytic and complement activity as well as on disease resistance. 33. KAISA YLI‐JOKIPII (2004) Effect of triacylglycerol fatty acid positional distribution on postprandial lipid
metabolism. 34. MARIKA JESTOI (2005) Emerging Fusarium‐mycotoxins in Finland. 35. KATJA TIITINEN (2006) Factors contributing to sea buckthorn (Hippophaë rhamnoides L.) flavour. 36. SATU VESTERLUND (2006) Methods to determine the safety and influence of probiotics on the adherence and
viability of pathogens. 37. FANDI FAWAZ ALI IBRAHIM (2006) Lactic acid bacteria: an approach for heavy metal detoxification. 38. JUKKA‐PEKKA SUOMELA (2006) Effects of dietary fat oxidation products and flavonols on lipoprotein oxidation.

39. SAMPO LAHTINEN (2007) New insights into the viability of probiotic bacteria. 40. SASKA TUOMASJUKKA (2007) Strategies for reducing postprandial triacylglycerolemia. 41. HARRI MÄKIVUOKKO (2007) Simulating the human colon microbiota: studies on polydextrose, lactose and cocoa
mass. 42. RENATA ADAMI (2007) Micronization of pharmaceuticals and food ingredients using supercritical fluid techniques. 43. TEEMU HALTTUNEN (2008) Removal of cadmium, lead and arsenic from water by lactic acid bacteria. 44. SUSANNA ROKKA (2008) Bovine colostral antibodies and selected lactobacilli as means to control gastrointestinal
infections. 45. ANU LÄHTEENMÄKI‐UUTELA (2009) Foodstuffs and medicines as legal categories in the EU and China. Functional
foods as a borderline case. (Law). 46. TARJA SUOMALAINEN (2009) Characterizing Propionibacterium freudenreichii ssp. shermanii JS and Lactobacillus
rhamnosus LC705 as a new probiotic combination: basic properties of JS and pilot in vivo assessment of the combination.
47. HEIDI LESKINEN (2010) Positional distribution of fatty acids in plant triacylglycerols: contributing factors and chromatographic/mass spectrometric analysis.
48. TERHI POHJANHEIMO (2010) Sensory and non‐sensory factors behind the liking and choice of healthy food products.
49. RIIKKA JÄRVINEN (2010) Cuticular and suberin polymers of edible plants – analysis by gas chromatographic‐mass spectrometric and solid state spectroscopic methods.
50. HENNA‐MARIA LEHTONEN (2010) Berry polyphenol absorption and the effect of northern berries on metabolism, ectopic fat accumulation, and associated diseases.
51. PASI KANKAANPÄÄ (2010) Interactions between polyunsaturated fatty acids and probiotics. 52. PETRA LARMO (2011) The health effects of sea buckthorn berries and oil. 53. HENNA RÖYTIÖ (2011) Identifying and characterizing new ingredients in vitro for prebiotic and synbiotic use. 54. RITVA REPO‐CARRASCO‐VALENCIA (2011) Andean indigenous food crops: nutritional value and bioactive
compounds. 55. OSKAR LAAKSONEN (2011) Astringent food compounds and their interactions with taste properties. 56. ŁUKASZ MARCIN GRZEŚKOWIAK (2012) Gut microbiota in early infancy: effect of environment, diet and
probiotics. 57. PENGZHAN LIU (2012) Composition of hawthorn (Crataegus spp.) fruits and leaves and emblic leafflower
(Phyllanthus emblica) fruits. 58. HEIKKI ARO (2012) Fractionation of hen egg and oat lipids with supercritical fluids. Chemical and functional
properties of fractions. 59. SOILI ALANNE (2012) An infant with food allergy and eczema in the family – the mental and economic burden of
caring. 60. MARKO TARVAINEN (2013) Analysis of lipid oxidation during digestion by liquid chromatography‐mass
spectrometric and nuclear magnetic resonance spectroscopic techniques. 61. JIE ZHENG (2013) Sugars, acids and phenolic compounds in currants and sea buckthorn in relation to the effects of
environmental factors. 62. SARI MÄKINEN (2014) Production, isolation and characterization of bioactive peptides with antihypertensive
properties from potato and rapeseed proteins. 63. MIKA KAIMAINEN (2014) Stability of natural colorants of plant origin. 64. LOTTA NYLUND (2015) Early life intestinal microbiota in health and in atopic eczema. 65. JAAKKO HIIDENHOVI (2015) Isolation and characterization of ovomucin – a bioactive agent of egg white. 66. HANNA‐LEENA HIETARANTA‐LUOMA (2016) Promoting healthy lifestyles with personalized, APOE genotype
based health information: The effects on psychological‐, health behavioral and clinical factors. 67. VELI HIETANIEMI (2016) The Fusarium mycotoxins in Finnish cereal grains: How to control and manage the risk. 68. MAARIA KORTESNIEMI (2016) NMR metabolomics of foods – Investigating the influence of origin on sea
buckthorn berries, Brassica oilseeds and honey.