Embed Size (px)
Citation preview

M. De Cecco - Robotics and Sensor Fusion
RANSAC
(RANdom SAmple Consensus)
Prof. Mariolino De Cecco, Ing. Luca Baglivo, Ing. Nicolò Blasi, Ilya Afanasyev
Department of Structural Mechanical Engineering, University of Trento
Email: [email protected]
http://www.mariolinodececco.altervista.org

M. De Cecco - Robotics and Sensor Fusion
2/21
The block diagram of recognition task:
02/04/2012
Object detection and localization
ObjectMeasurement
system
Data
Fitting Algorithm
Pre-processing
Math. model
- Dimensions;A-priori know:
- Features (shape, curvature, etc.)
- Superquadrics, etc.
- Camera, laser- Kinect- Multicamera system
- Point clouds- Images, video
- Eliminating the background;- Changing the contrast, size, etc.
- Optimization, iterations, etc.;
- Criteria of quality.
- RANSAC;
Results- Transformation matrix, angles, distance, accuracy, etc.
M. De Cecco - Robotics and Sensor Fusion
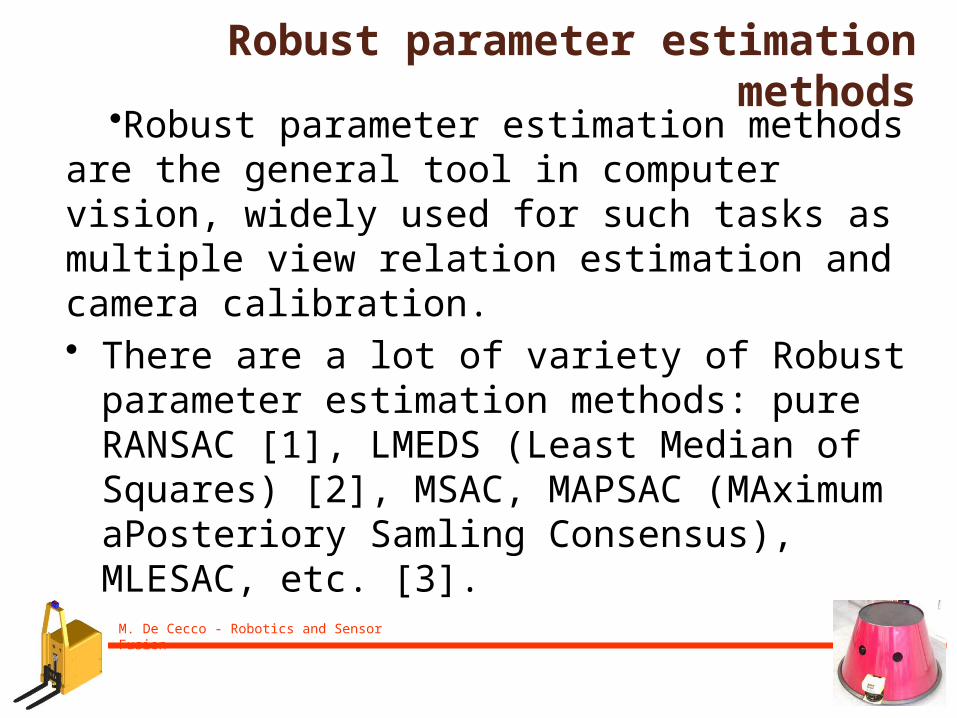
•Robust parameter estimation methods are the general tool in computer vision, widely used for such tasks as multiple view relation estimation and camera calibration. • There are a lot of variety of Robust parameter
estimation methods: pure RANSAC [1], LMEDS (Least Median of Squares) [2], MSAC, MAPSAC (MAximum aPosteriory Samling Consensus), MLESAC, etc. [3].
Robust parameter estimation methods
M. De Cecco - Robotics and Sensor Fusion
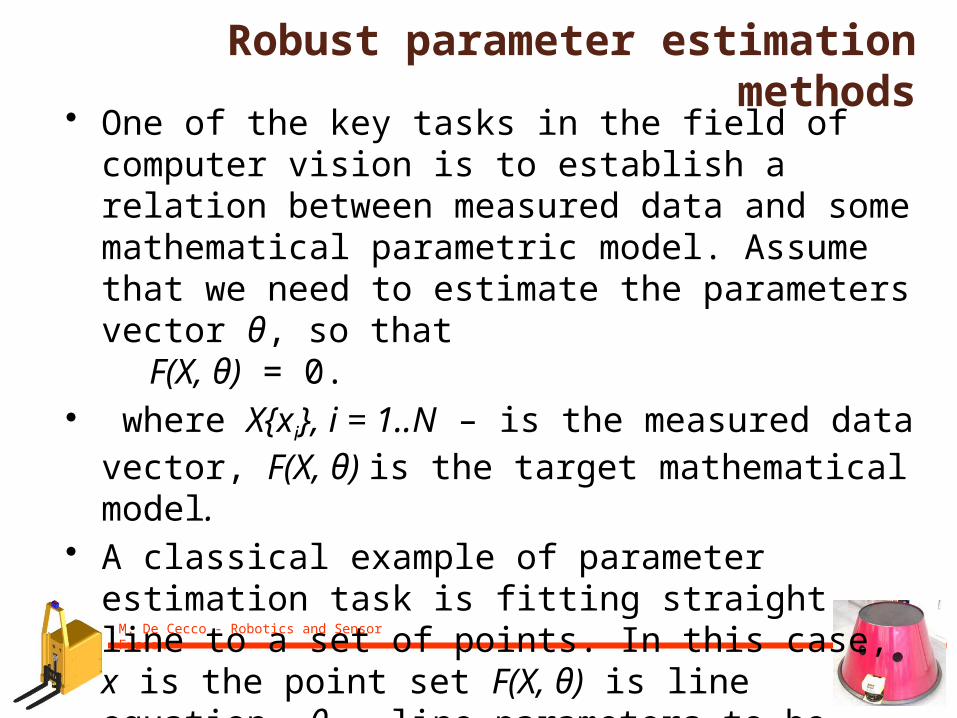
• One of the key tasks in the field of computer vision is to establish a relation between measured data and some mathematical parametric model. Assume that we need to estimate the parameters vector θ, so that
F(X, θ) = 0.• where X{xi}, i = 1..N – is the measured data vector,
F(X, θ) is the target mathematical model. • A classical example of parameter estimation task is
fitting straight line to a set of points. In this case, x is the point set F(X, θ) is line equation, θ - line parameters to be estimated.
Robust parameter estimation methods

M. De Cecco - Robotics and Sensor Fusion
• A simple example is fitting of a line in two dimensions to a set of observations
A data set with many outliers for which a line has to be fitted.
Fitted line with RANSAC; outliers have no influence on the result.

M. De Cecco - Robotics and Sensor Fusion
Estimating 2D lines [4]

M. De Cecco - Robotics and Sensor Fusion
• The data points generated by the target model (I the framework of set distance) are called inliers with respect to the model F, the other points are called outliers.
• RANSAC is an abbreviation for "RANdom SAmple Consensus". It is an iterative method to estimate parameters of a mathematical model from a set of observed data which contains outliers.
• The algorithm was first published by Fischler and Bolles in 1981 [1].
Robust parameter estimation methods

M. De Cecco - Robotics and Sensor Fusion
RANSAC algorithm [3]

M. De Cecco - Robotics and Sensor Fusion
Estimating 2D lines for SAC-algorithms [5]

M. De Cecco - Robotics and Sensor Fusion
• Scopo
• A basic assumption is that the data consists of "inliers", i.e., data whose distribution can be explained by some set of model parameters, and "outliers" which are data that do not fit the model.
3. regressione del modello

M. De Cecco - Robotics and Sensor Fusion
• Nel metodo dei minimi quadrati l’indice di prestazione è costituito dalla somma dei quadrati degli scarti (anche detti residui) [6]:
Essendo:
3. regressione del modello
L’insieme dei parametri si determina:
c1,...,cm i2
i1
N
i yi f c1,c2,cm , x1i, x2i
,xni
c1,...,cm :
minck
i
2
i1
N

M. De Cecco - Robotics and Sensor Fusion
parametri (a,b)
x
y
N Dati sperimentali
3. regressione del modello
Caso lineare - Calcolo retta ai minimi quadrati:
Si noti che i residui risultano essere lineari in funzione dei parametri da determinare
Dunque anche il fitting con un polinomio qualsiasi risulta risolvibile in maniera analoga
ei
i yi axi b
y ax b
M. De Cecco - Robotics and Sensor Fusion
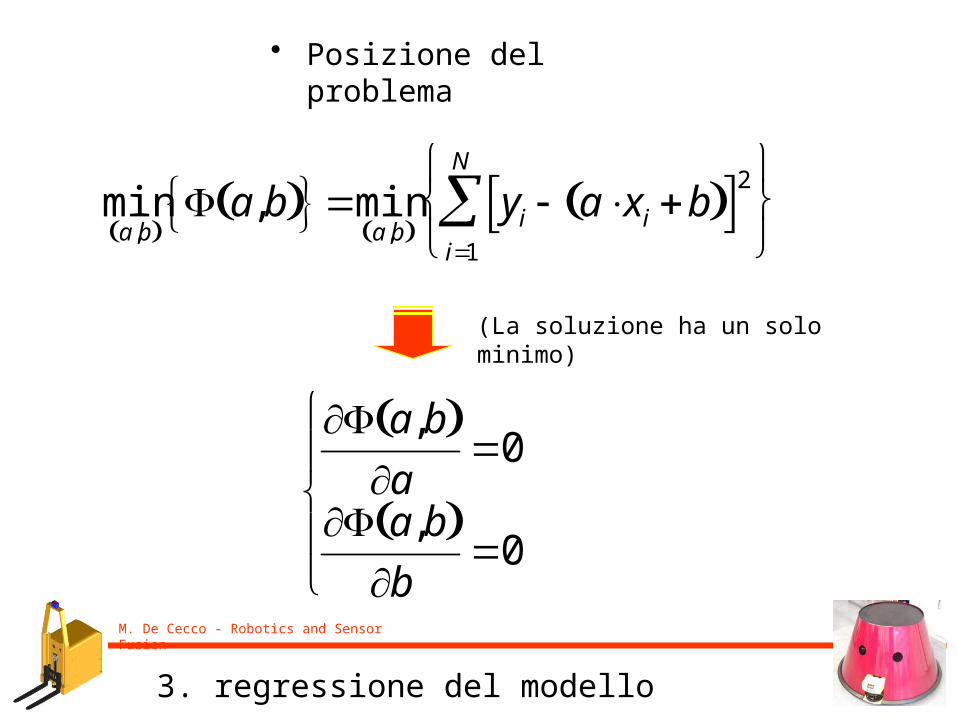
• Posizione del problema
3. regressione del modello
(La soluzione ha un solo minimo)
a,b a
0
a,b b
0
mina,b
a,b mina,b
yi axi b 2
i1
N

M. De Cecco - Robotics and Sensor Fusion
• Soluzione
3. regressione del modello
Dove:
a Cxy
Cxx
b y ax
y 1
Ny i
i1
N
x 1
Nx i
i1
N
Cxx xi x 2
i1
N
xi2 nx 2
i1
N
Cxy xi x yi y i1
N
xiyi nx y i1
N
y yi axi b 2
i1
N
N 2
a y
Cxx
b y
xi2
i1
N
NCxx
M. De Cecco - Robotics and Sensor Fusion
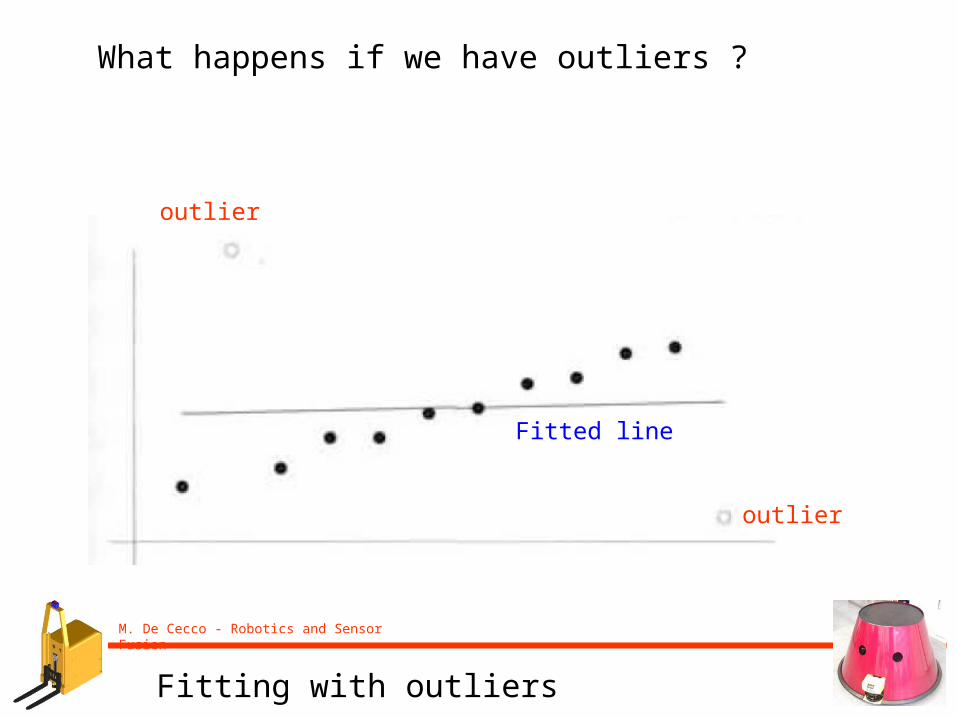
What happens if we have outliers ?
outlier
outlier
Fitted line
Fitting with outliers
M. De Cecco - Robotics and Sensor Fusion
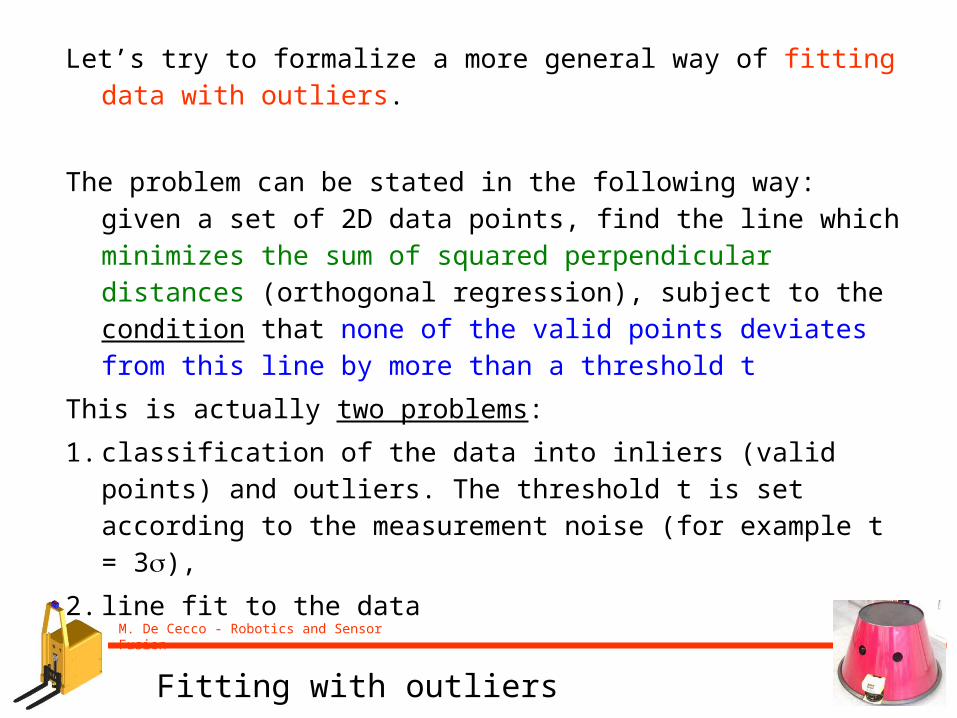
Let’s try to formalize a more general way of fitting data with outliers.
The problem can be stated in the following way: given a set of 2D data points, find the line which minimizes the sum of squared perpendicular distances (orthogonal regression), subject to the condition that none of the valid points deviates from this line by more than a threshold t
This is actually two problems:
1. classification of the data into inliers (valid points) and outliers. The threshold t is set according to the measurement noise (for example t = 3),
2. line fit to the data
Fitting with outliers

M. De Cecco - Robotics and Sensor Fusion
The key idea is very simple:
repeat N times the following:
• select randomly two points
• compute the connecting line
• the support for this line is measured by the number of points that lie within the distance threshold t
the line with most support is deemed the robust fit
The points within the threshold distance are the inliers (and constitute the consensus set).
Fitting with outliers

M. De Cecco - Robotics and Sensor Fusion
The intuition is that if one of the points is an outlier then the line will not gain much support
Fitting with outliers

M. De Cecco - Robotics and Sensor Fusion
Scoring a line by its support has the additional advantage of favouring better fits. The line (a, b) has a support of 10, whereas the line (a, d), where the sample points are neighbours, has a support of only 4.
Consequently, even though both samples contain no outliers, the line (a. b) will be selected
Fitting with outliers

M. De Cecco - Robotics and Sensor Fusion
As stated by Fischler and Bolles [Fischler, 1981]:
"The RANSAC procedure is opposite to that of conventional smoothing techniques: Rather than using as much of the data as possible to obtain an initial solution and then attempting to eliminate the invalid data points (like for example using the Chauvenet criteria), RANSAC uses as small an initial data set as feasible and enlarges this set with consistent data when possible".
Fitting with outliers

M. De Cecco - Robotics and Sensor Fusion
Objective
Robust fit of a model to a data set S which contains outliers.
Algorithm
Randomly select a sample of s data points from S and instantiate the model from this subset
Determine the set of data points Si which are within a distance threshold t of the model. The set Si, is the consensus set of the sample and defines the inliers of S
If the size of Si (the number of inliers) is greater than some threshold T, re-estimate the model using all the points in Si and terminate
(iv) If the size of Si is less than T, select a new subset and repeat the above,
(v) After N trials the largest consensus set Si is selected, and the model is re-estimated using all the points in the subset Si
Algorithm

M. De Cecco - Robotics and Sensor Fusion
Algorithm revised
Select a sample of s data
Use the s data to estimate the model
Determine the consensus set Si and its cardinality ns
ns >T
Use Si to estimate the model
yes
no
Determine the new consensus set Si and the cardinality nsnew
yes
nnew = nold
no
Stop
Verify the sample dataThis to verify if the sample is able to provide a reliable fitting
This to ensure a Maximum Likelikood solution
{
{

M. De Cecco - Robotics and Sensor Fusion
It is often computationally infeasible and unnecessary to try every possible sample. Instead the number of samples N is chosen sufficiently high to ensure with a probability, p, that at least one of the random samples of s points is free from outliers.
Usually p is chosen at 0.99
The number N of samples required to ensure, with a probability p = 0.99, that at least one sample has no outliers for a given size of sample S, and proportion of outliers
N Log 1 p
Log 1 1 S
Number of samples

M. De Cecco - Robotics and Sensor Fusion
For a given and p the number of samples increases with the size of the minimal subset
It might be thought that it would be advantageous to use more than the minimal subset, three or more points in the case of a line, because then a better estimate of the line would be obtained, and the measured support would more accurately reflect the true support. However, this possible advantage in measuring support is generally outweighed by the severe increase in computational cost incurred by the increase in the number of samples.
How large is an acceptable consensus set? A rule of thumb is to terminate if the size of the consensus set is similar to the number of inliers believed to be in the data set, given the assumed proportion of outliers, i.e. for n data points T < (1 - ) n
Number of samples - consensus set

M. De Cecco - Robotics and Sensor Fusion
An advantage of RANSAC is its ability to achieve robust estimation of the model parameters, i.e., it can estimate the parameters with a high degree of accuracy even when significant amount of outliers are present in the data set.
A disadvantage of RANSAC is that there is no upper bound on the time it takes to compute these parameters. When an upper time bound is used (a maximum number of iterations) the solution obtained may not be the optimal one, it may not even be one that fits the data in a good way. A reasonable model can be produced by RANSAC only with a certain probability, a probability that becomes larger the more iterations that are used
Another disadvantage of RANSAC is that it requires the setting of problem-specific thresholds.
RANSAC - conclusions

M. De Cecco - Robotics and Sensor Fusion
Example - plane fitting
QuickTime™ and a decompressor
are needed to see this picture.
Suppose we acquired the 3D cloud of points of a cube:

M. De Cecco - Robotics and Sensor Fusion
close allclear all %% CARICHIAMO E PLOTTIAMO IL SET DI DATIload('Points.mat');all_point = Points(: , 1:3);all_point(: , 1) = -all_point(: , 1); % convenzione Kinect ? % Plot all pointsfigure('Name','All points')hold onaxis equalplot3(Points(:,1), Points(:,2), Points(:,3), '.' ) %% FITTIAMO CON RANSAC IL PIANO% decimiamo i puntiss = length(all_point);ii = 1 : 10 : ss;all_pointDec = all_point(ii , :); % FIT RANSAC[B, P, inliers] = ransacfitplane(all_pointDec', 0.01, 1); % Plot risultatoplotPlane3D( all_point' , B )
Example - main function

M. De Cecco - Robotics and Sensor Fusion
% RANSACFITPLANE - fits plane to 3D array of points using RANSAC% Usage [B, P, inliers] = ransacfitplane(XYZ, t, feedback)% This function uses the RANSAC algorithm to robustly fit a plane% to a set of 3D data points.%% Arguments:% XYZ - 3xNpts array of xyz coordinates to fit plane to.% t - The distance threshold between data point and the plane% used to decide whether a point is an inlier or not.% feedback - Optional flag 0 or 1 to turn on RANSAC feedback% information.%% Returns:% B - 4x1 array of plane coefficients in the form% b(1)*X + b(2)*Y +b(3)*Z + b(4) = 0% The magnitude of B is 1.% This plane is obtained by a least squares fit to all the% points that were considered to be inliers, hence this% plane will be slightly different to that defined by P below.% P - The three points in the data set that were found to% define a plane having the most number of inliers.% The three columns of P defining the three points.% inliers - The indices of the points that were considered% inliers to the fitted plane. % Copyright (c) 2003-2008 Peter Kovesi
Example – RANSACFITPLANE [7]
M. De Cecco - Robotics and Sensor Fusion
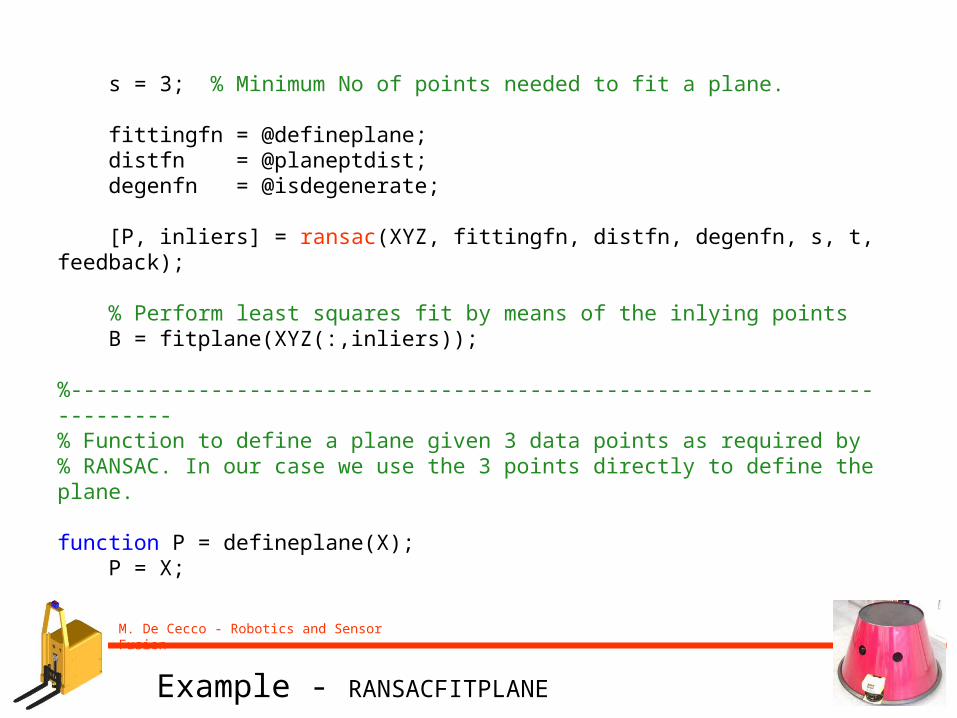
s = 3; % Minimum No of points needed to fit a plane. fittingfn = @defineplane; distfn = @planeptdist; degenfn = @isdegenerate; [P, inliers] = ransac(XYZ, fittingfn, distfn, degenfn, s, t, feedback); % Perform least squares fit by means of the inlying points B = fitplane(XYZ(:,inliers)); %------------------------------------------------------------------------% Function to define a plane given 3 data points as required by% RANSAC. In our case we use the 3 points directly to define the plane. function P = defineplane(X); P = X;
Example - RANSACFITPLANE

M. De Cecco - Robotics and Sensor Fusion
% Function to calculate distances between a plane and a an array of points in the X matrix where % each column represents the x, y, z coordinates (X: 3 x Npts array of xyz coordinates)% The plane is defined by a 3x3 matrix, P. The three columns of P defining% three points that are within the plane.function [inliers, P] = planeptdist(P, X, t)n = cross(P(:,2)-P(:,1), P(:,3)-P(:,1)); % Plane normal.n = n/norm(n); % Make it a unit vector.
npts = length(X); d = zeros(npts,1); % d will be an array of distance values. % The perpendicular distance from the plane to each point: % d = n’ * ( X - P(:,1) ) [1 x Npts] for i=1:3 d = d + ( X(i,:)’ - P(i,1) ) * n(i) ; end inliers = find(abs(d) < t); % Function to determine whether a set of 3 points are in a degenerate% configuration for fitting a plane as required by RANSAC. In this case% they are degenerate if they are colinear. function r = isdegenerate(X) % The three columns of X are the coords of the 3 points. r = iscolinear(X(:,1),X(:,2),X(:,3));
Example - RANSACFITPLANE

M. De Cecco - Robotics and Sensor Fusion
At the end we obtain the following fitted ‘floor’ plane
QuickTime™ and a decompressor
are needed to see this picture.
Example - OUTCOME

M. De Cecco - Robotics and Sensor Fusion
Ideas for homework
1. To use the camera view to assert consensus. Colour or curvature information could be used
2. To use the 3D and colour information to assert consensus
3. To modify the consensus criteria simulating the laser view of the fitted object
Ideas for homework

M. De Cecco - Robotics and Sensor Fusion
Links1. M.A.Fischler, R.C.Bolles. “Random Sample Consensus: A paradigm for
model fitting with applications to image analysis and automated cartography”. // In Communications of the ACM, 24 (6), pp. 381-395,1981.
2. P.J.Rousseeuw. “Least median of squares regression”. // In Journal of the American Statistical Association, 79(388), pp. 871-880, 1984.
3. Konouchine A., Gaganov V., Veznevets V. “AMLESAC: A New Maximum Likelihood Robust Estimator”. // In proceedings of conf. “Graphicon 2005” (Novosibirsk, Russia). P.8. www.graphicon.ru/
4. Marco Zuliani. RANSAC for Dummies. // January 31, 2012. vision.ece.ucsb.edu/~zuliani/Research/RANSAC/docs/RANSAC4Dummies.pdf
5. GML RANSAC Matlab Toolbox v 0.1: http://research.graphicon.ru/machine-learning/gml-ransac-matlab-toolbox-2.html
6. R. Hartley and A. Zisserman, “Multiple View Geometry in Computer Vision”. // Cambridge University Press, 2003.
7. Kovesi Peter. RANSAC software in MATLAB. 2003-2008. www.csse.uwa.edu.au/~pk/research/matlabfns/.
Grazie per attenzione!!


![Jenny A. Baglivo - Introduction to Mathematica Commands [2004] [p45]](https://img.dokumen.tips/doc/110x75/577cc0de1a28aba71191676c/jenny-a-baglivo-introduction-to-mathematica-commands-2004-p45.jpg)


