Embed Size (px)
Citation preview

M. Bressi, F. Cavalli, C. Belis, J-P. Putaud, S. Dos Santos, K. Douglas, R. Passarella
R. Fröhlich, A. Prévôt
E. Petralia, M. Berico, A. Malaguti, M. Stracquadanio
Chemical composition of submicron particles with an Aerosol Chemical Speciation Monitor
at the JRC-Ispra site

1. IntroductionWhy to study the chemical composition of submicron particles (PM1)?
2Aerosol SourcesAerosol Size
« Aerosols: collection of airborne solid or liquid particles » (IPCC, 2007)

Adapted from Putaud et al. (2010)
Comparison of annual PM2.5 levels at different sites in Europe
2020 EU Annual PM2.5 limit value
= 20 µg/m3
Why to study the chemical composition of PM1 at Ispra?
Decesari et al. (2001)
Po Valley region
3
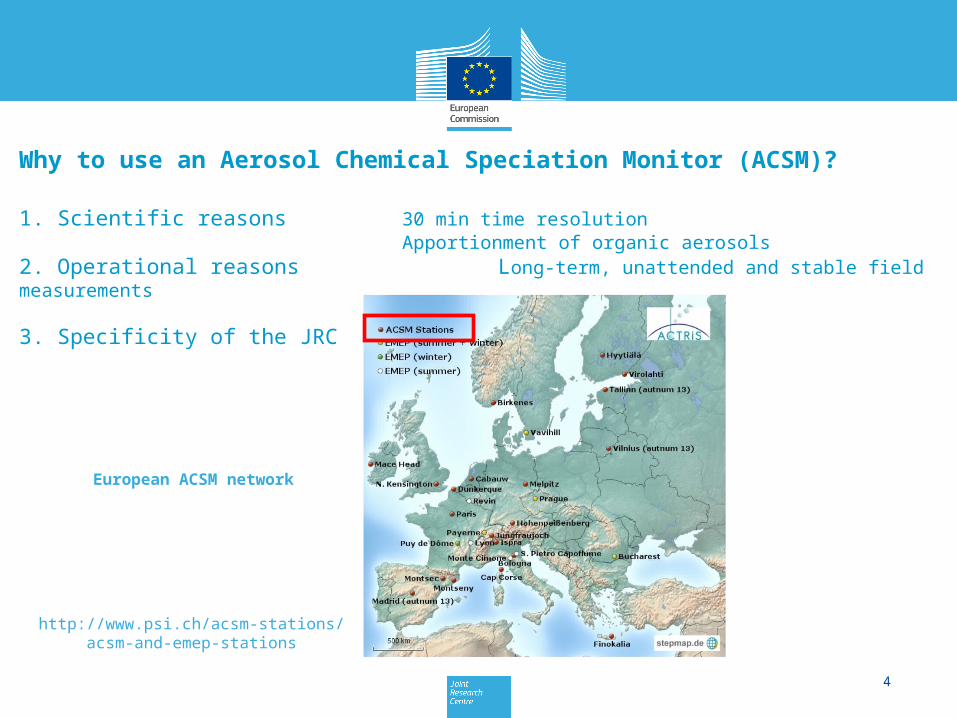
Why to use an Aerosol Chemical Speciation Monitor (ACSM)?
1. Scientific reasons 30 min time resolutionApportionment of organic aerosols
2. Operational reasons Long-term, unattended and stable field measurements
3. Specificity of the JRC
4
http://www.psi.ch/acsm-stations/ acsm-and-emep-stations
European ACSM network

Objectives of this talk
Present the assessment of the precision and the accuracy of ACSM measurements
Document the levels and the chemical composition of PM1 at Ispra
Focus on the organic fraction of PM1 at Ispra
5

2. Material and methods
2.1 Sampling site
6
PM1020/06/2013 On-going
20/12/2012 20/08/2013
Continuous measurements since 20 December 2012

Ng et al., 2011
Q-MS
Chemical composition of non-refractory (NR) PM1: Organics (Org), NO3, SO4, NH4, Cl
Time resolution: 30 min
2.2 ACSM description
Aerodyne Research Inc.
7

4 calibrationsRFNO3
=3.03E-11 amp/(µg/m3)
RIENH4=5.3
Ionization Efficiency (IE)Ammonium Nitrate
calibrations
1 calibrationRFNO3
=4.46E-11 amp/(µg/m3)
RIENH4=6.0
Collection Efficiency (CE) Relative IE (RIE)
Time series correction
Ion transmission
correction (ITC)
CE=0.5 for every compound.RIE: Org, SO4, NO3, Cl from literature
(Canagaratna et al., 2007; Jimenez et al., 2003; Ng et al., 2011)
Very stable N2 signal SEM voltage modified every ~2-3 days
Close to the default correction Substantial discrepancies
ACSMs
8
2.3 Calibration, tuning and correction factors
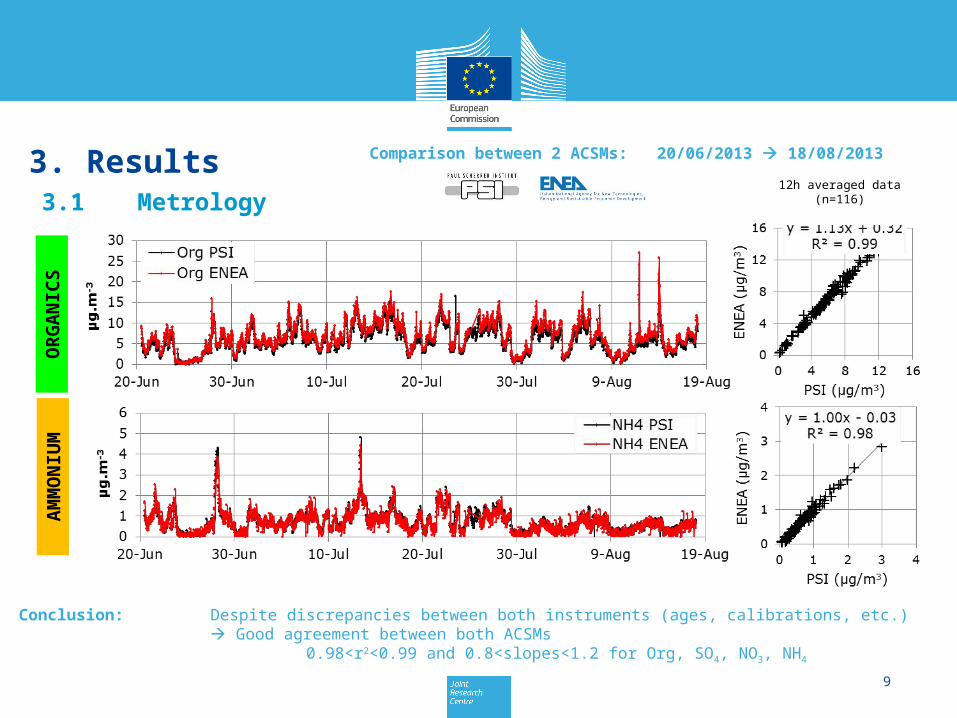
3. Results3.1 Metrology
9
OR
GA
NIC
SA
MM
ON
IUM
Comparison between 2 ACSMs: 20/06/2013 18/08/2013
Conclusion: Despite discrepancies between both instruments (ages, calibrations, etc.) Good agreement between both ACSMs
0.98<r2<0.99 and 0.8<slopes<1.2 for Org, SO4, NO3, NH4
12h averaged data(n=116)

Conclusion: Good agreement between ACSM and other analytical techniques
10
Comparison between ACSM and independent analytical techniques: 20/12/2013 28/02/2013O
RG
AN
ICS
NIT
RA
TE
AC
SM
C
OM
PO
UN
DS
+
EC

3.2 Chemistry
11
Temporal variation of NR-PM1 during the winter season
(20/12/2012 21/03/2013)
Strong daily variations atmospheric dilution and
condensation
Example of an atmospheric process visible with the
ACSM
Temporal variation of PM1 chemical composition
12
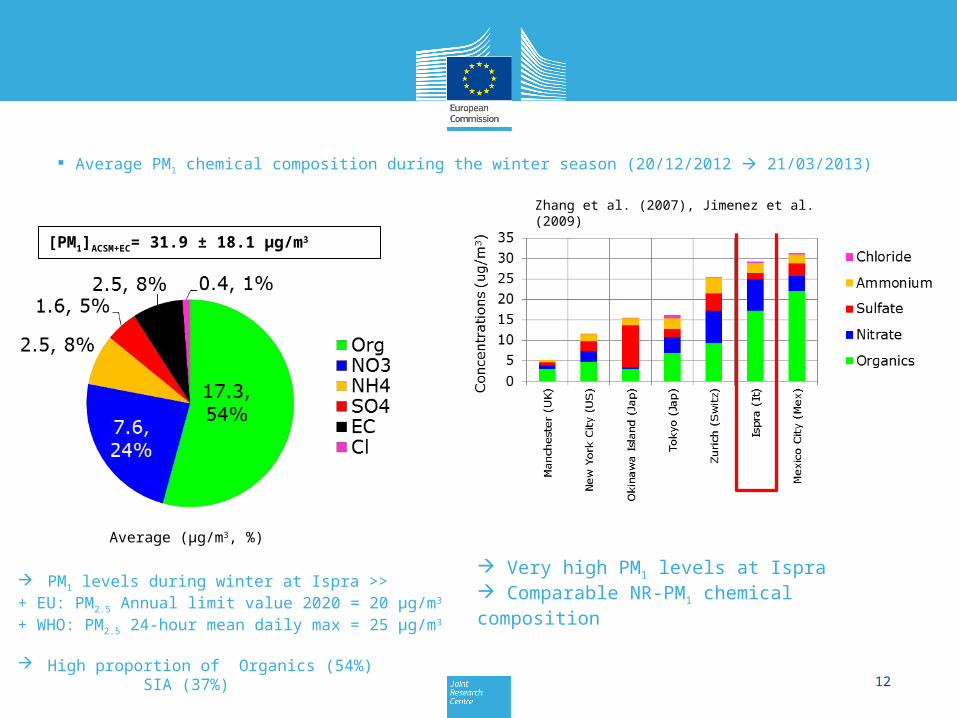
Average PM1 chemical composition during the winter season (20/12/2012 21/03/2013)
[PM1]ACSM+EC= 31.9 ± 18.1 µg/m3
Average (µg/m3, %)
PM1 levels during winter at Ispra >> + EU: PM2.5 Annual limit value 2020 = 20 µg/m3
+ WHO: PM2.5 24-hour mean daily max = 25 µg/m3
High proportion of Organics (54%)SIA (37%)
Very high PM1 levels at Ispra Comparable NR-PM1 chemical composition
Zhang et al. (2007), Jimenez et al. (2009)

3.3 Organic Aerosol (OA) apportionment
13Hallquist et al. (2009)
Classical classes of OA in AMS/ACSM studies
OA
OOA
HOA
LV-OOA
SV-OOA
COA BBOA
Organic compounds: Definition: any molecules made of C and H that can also contain O, N, P.Low level of understanding regarding their effects on human health, biogeochemical cycles and Earth’s climate.
Organic Aerosol
Oxygenated OA
Hydrocarbon-likeOA
Low-Volatility OOA
Semi-Volatile OOA
CookingOA
Biomass BurningOA

14
X = G * F Mass spectral Matrix
Factor contribution Factor profile
= *
+ EResidual matrix
Method: Positive Matrix Factorization (PMF)
m/z 12 m/z 13 m/z 14 … n8:00 0.01 0.10 0.058:30 0.00 0.27 0.309:00 0.22 0.00 0.00
…m
m/z 12 m/z 13 m/z 14 … n08:00am 0.01 0.10 0.0508:30am 0.00 0.27 0.3009:00am 0.22 0.00 0.00
…m
+Na Cl EC … n
11/09/2009 0,00 0,00 0,0112/09/2009 0,00 0,00 0,0213/09/2009 0,00 0,01 0,02
…m
m/z 12 m/z 13 m/z 14 … nm/z 12 m/z 13 m/z 14 … n08:00am 0.02 0.01 0.0508:30am 0.00 0.04 0.0609:00am 0.05 0.00 0.00
…m
m/z 12 m/z 13 m/z 14 … nm/z 12 m/z 13 m/z 14 … nF1 0.01 0.02 0.30F2 0.00 0.27 0.01F3 0.22 0.00 0.00…p
F1 F2 F3 … p08:00am 0.25 0.01 0.0508:30am 0.00 0.30 0.0609:00am 0.05 0.00 0.44
…m

15
m/z 57m/z 60
m/z 44
Factor identification (1/2)
Facto
r p
rofi
les
20/12/2012 21/04/2013

16
LV-OOA 1
LV-OOA 2
BBOA 1
BBOA 2
HOA
OOA other
Factor identification (2/2)
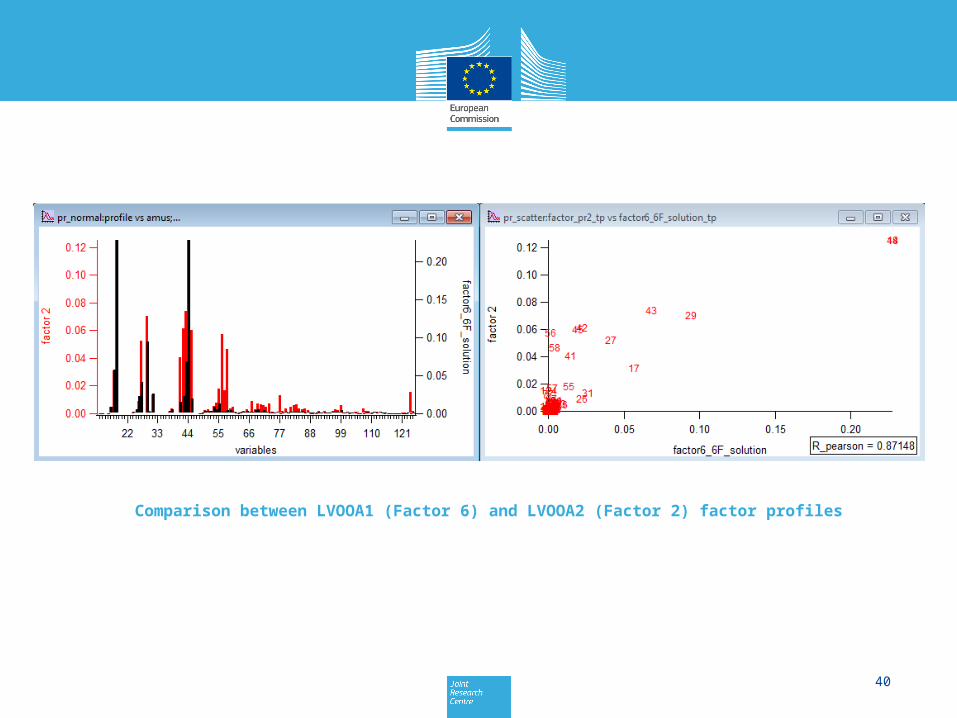
Correlation between my factor profiles and factor profiles found in the literature(field studies or chamber experiment)

17
Factor contribution (1/2)
Abso
lute
contr
ibuti
on
(µg/m
3)
Rela
tive c
ontr
ibuti
on
Diu
rnal co
ntr
ibuti
on
(µg/m
3)
Avera
ged c
ontr
ibu
tion
(µg
/m3;
%) Period
20/12/2012 21/04/2013
LV-OOA 1LV-OOA 2 BBOA 2HOAOOA other BBOA 1

18
Factor contribution (2/2)
Comparison of OA apportionment with other European studies (adapted from Crippa et al., 2013)
Note: Sampling periods Ispra study: December 2012 – April 2013 Other studies: February/March 2009
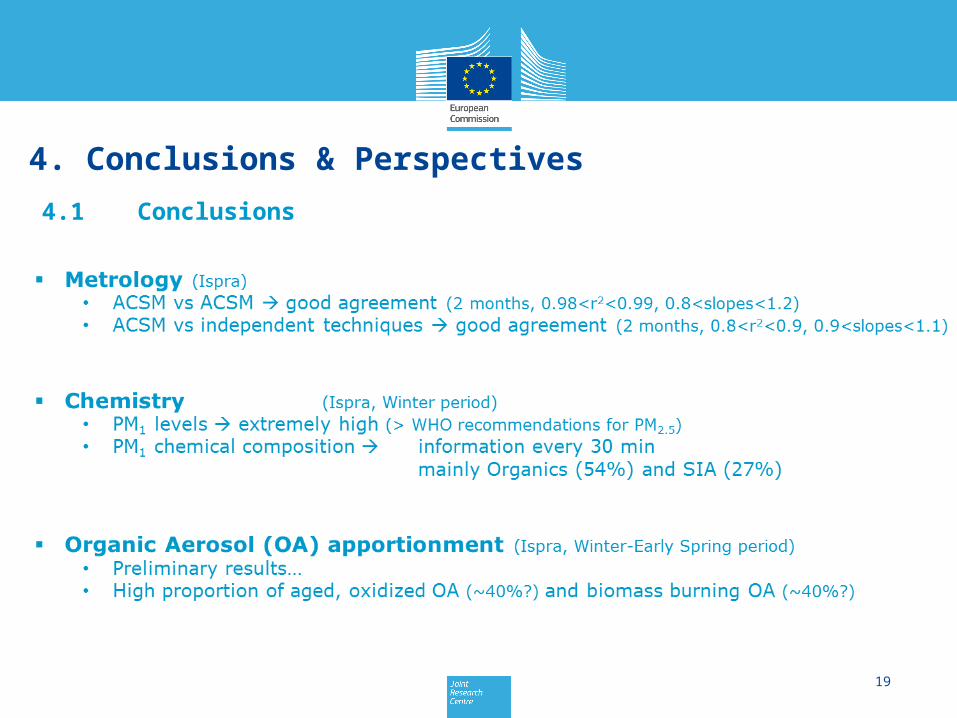
4. Conclusions & Perspectives
4.1 Conclusions
19

4.2 Perspectives
20
Metrology• Comparison between 13 ACSMs in Paris in November (ENEA instrument + data
treatment tool developed by Claudio Belis)• ACSM ? Chemical composition of PM in the European air quality network ?
Chemistry• A European aerosol phenomenology: real-time measurements of PM1 chemical
composition (JRC leadership under discussion)
OA apportionment• Use of external tracers, use of different methodologies (e.g. ME-2), etc.• Define a common methodology for OA apportionment at the European level
Source apportionment• Real sources behind this chemical composition??

APPENDICES
21

Why to study the chemical composition of submicron particles (PM1)?
22Forster et al. (2007)

23
Canagaratna et al. (2007)

24
AER
OS
OL
CH
EM
ISTR
Y
GA
S P
HA
SE
CH
EM
ISTR
Y
24-h daily sampling of PM2.5
20 Dec 2012 28 Feb 2013
Elemental Carbon (EC)
Organic Carbon (OC)
Organic Matter (OM):OM=1.4*OC (Putaud et al., 2010)Sunset Lab. OCEC Analyzer
(EUSAAR2 protocol)
Major ions including:SO4
NO3
NH4
ClIon ChromatographyPartisol Plus
AER
OS
OL
PH
YS
ICS
Condensation Particle Counter
Size distribution10 to 800 nm
Differential Mobility Analyzer
CO
NO, NO2
O3
20 Dec 2012 7 Feb 201320 Dec 2012 22 Feb 2013
SO2

OR
GA
NIC
S
Note: Org ENEA plotted with the default Ion Transmission Correction (ITC) on this graph
Defa
ult
IT
C
Exp
eri
men
tal ITC
12h averaged data(n=116)
25
ENEA versus PSI Q-ACSM

SU
LFA
TE
Defa
ult
IT
C
Exp
eri
men
tal ITC
12h averaged data(n=116)
Note: SO4 ENEA plotted with the default Ion Transmission Correction (ITC) on this graph
26

NIT
RA
TE
12h averaged data(n=116)
Incl
ud
ing
all
data
poin
ts
Excl
ud
ing
28
Ju
ne 1
2p
m
27

AM
MO
NIU
MC
HLO
RID
E
12h averaged data(n=116)
28

PSI Q-ACSM versus other analytical techniquesN
ITR
ATE
Good agreement for Secondary Inorganic Aerosol (SIA): r²=0.8-0.9, slope=0.9-1.0
SU
LFA
TE
AM
MO
NIU
M
29

CH
LO
RID
EO
RG
AN
ICS
AC
SM
CO
MP
OU
ND
S
+ E
C
Off-line Chloride large uncertainties
Surprisingly good despite expected
filter sampling artifacts
Good agreement
30

Zhang et al. (2007)
31

Jimenez et al. (2009)
32

Zhang et al. (2007)
33

Zhang et al. (2011)
34
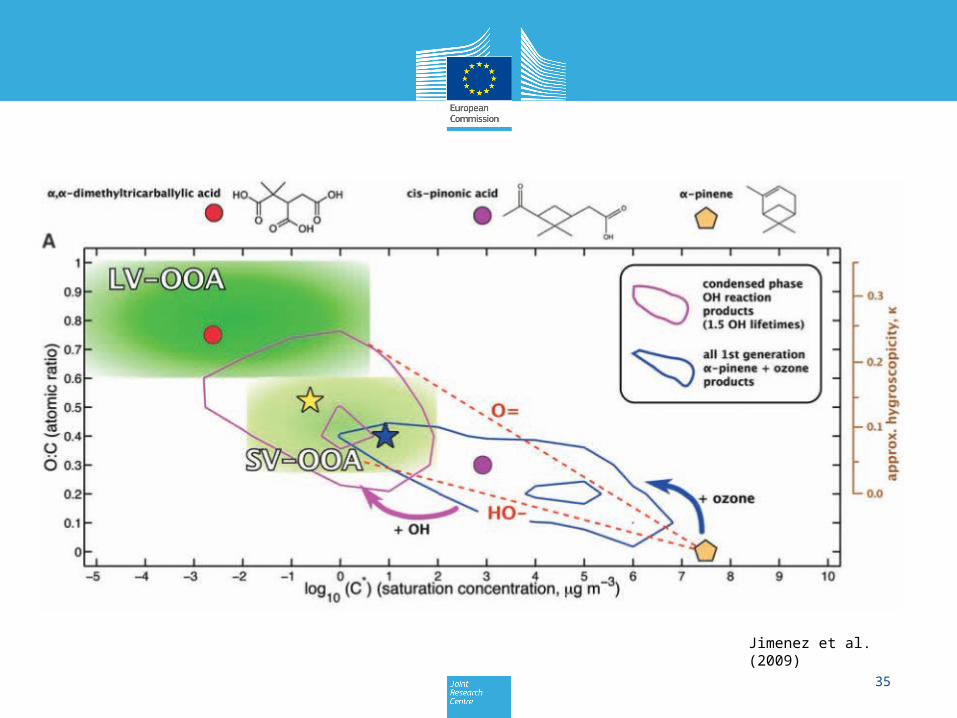
Jimenez et al. (2009)
35

36
Kroll et al. (2011)

37
Kroll et al. (2011)

Courtesy of A. Prevot
38

39
Comparison between BBOA1 (Factor 5) and BBOA2 (Factor 4) factor profiles
40
Comparison between LVOOA1 (Factor 6) and LVOOA2 (Factor 2) factor profiles

41