Embed Size (px)
Citation preview
ENVIRONMENTAL MONITORING
M-203|2014
Monitoring of long-range
transported air pollutants in
Norway, annual report 2013

COLOPHON
Executive institution ISBN-no
NILU – Norsk institutt for luftforskning, Postboks 100, 2027 Kjeller 978-82-425-2692-2 (print)
978-82-425-2693-9 (electronic)
Project manager for the contractor Contact person in the Norwegian Environment Agency
Wenche Aas Tor Johannessen
M-no Year Pages Contract number
M-203 2014 108 14078036
Publisher The project is funded by
NILU – Norsk institutt for luftforskning
NILU – Norwegian Institute for Air Research
NILU OR 30/2014
NILU project no. O-113007/O113008
Norwegian Environment Agency
Author(s)
Wenche Aas, Sverre Solberg og Karl Espen Yttri
Title – Norwegian and English
Monitoring of long-range transported air pollutants in Norway, annual report 2013
Overvåking av langtransportert forurenset luft og nedbør. Atmosfæriske tilførsler 2013
Summary – sammendrag
The present report presents results from the monitoring of atmospheric composition and deposition
of air pollution in 2013 in the Norwegian rural background environment, and focuses on particulate
and gaseous phase of inorganic constituents, particulate carbonaceous matter, ground level ozone
and particulate matter.
Denne rapporten omhandler resultater fra overvåkningsprogrammet for langtransportert forurenset
luft og nedbør, og atmosfæriske tilførsler i 2013 på norske bakkgrunnstasjoner. Det fokuseres på
uorganiske hoved¬komponentene i luft og nedbør, partikulært karbonholdig materiale,
partikkelmasse og bakkenær ozon.
4 emneord 4 subject words
Atmosfære og klima
Aerosoler og partikler
Bakkenært ozon
Sur nedbør og overgjødsling
Atmosphere and climate
Aerosols and particles
Ground-level ozone
Acid rain and eutrophication
Front page photo
Birkenes Observatory

Monitoring of long-range transported air pollutants in Norway, annual report 2013 | M-203|2014
1
Preface
This report presents results from the monitoring of atmospheric composition and deposition of air pollution in 2013 in the Norwegian rural background environment, and focuses on particulate and gaseous phase of inorganic constituents, particulate carbonaceous matter, ground level ozone and particulate matter. The observations made are part of the national monitoring programme of long-range transported air pollutants, which is conducted by NILU on behalf of The Norwegian Environment Agency, and the Ministry of Climate and Environment. The present report is one of four reports, which cover the national monitoring of atmospheric composition in the Norwegian rural background environment. The other three reports are published separately, of which the first focuses on persistent organic pollutants and heavy metals, the second covers the monitoring of the ozone layer and UV, whereas the third is on climate gases and aerosol particles influence on climate. Data and results from the national monitoring programme are also included in various international regional programmes, including: EMEP (European Monitoring and Evaluation Programme) under the CLTRAP (Convention on Long-range Transboundary Air Pollution), CAMP (Comprehensive Atmospheric Monitoring Programme) under OSPAR (the Convention for the Protection of the marine Environment of the North-East Atlantic) and AMAP (Arctic Monitoring and Assessment). All measurement data presented in the current report can be received by contacting NILU, or they can be downloaded directly from the database: http://ebas.nilu.no/. A large number of persons have contributed to the current report, including those responsible for sampling, technical maintenance, chemical analysis and quality control. Kristine Aasarød is especially acknowledged for compiling this report. Further, the constructive input and review of the report by the contact persons at the Norwegian Environment Agency is greatly appreciated. Kjeller, June 2014 Wenche Aas Senior Scientist, Atmospheric and Climate Research

Monitoring of long-range transported air pollutants in Norway, annual report 2013 | M-203|2014
2
Monitoring of long-range transported air pollutants in Norway, annual report 2013 | M-203|2014
3
Content
Preface ........................................................................................................ 1
Summary ...................................................................................................... 5
Sammendrag .................................................................................................. 7
1. The monitoring programme, 2013 ..................................................................... 9
2. The weather in Norway 2013 .......................................................................... 12
3. Inorganic components .................................................................................. 13
3.1 Observations in 2013 .............................................................................. 13
3.1.1 Chemical composition in precipitation ................................................. 13
3.1.2 Chemical composition in air ............................................................. 18
3.1.3 Total deposition of sulphur and nitrogen .............................................. 21
3.2 Trends ............................................................................................... 23
4. EC and OC ................................................................................................ 30
4.1 Introduction ........................................................................................ 30
4.2 Concentrations of OC ............................................................................. 30
4.3 Concentrations of EC ............................................................................. 33
4.4 Relative contribution of EC/OC to PM ......................................................... 34
4.4.1 Relative contribution of OC in PM2.5 and OC in PM10-2.5 to OC in PM10 .............. 34
4.4.2 Relative contribution of EC in PM2.5 to EC in PM10 .................................... 34
4.4.3 Relative contribution of OC and EC to TC for PM10 and PM2.5 ....................... 34
4.4.4 Relative contributions of OC and EC to PM10, PM2.5 and PM10-2.5 .................... 35
4.5 Trends for concentrations of EC and OC ....................................................... 35
5. Particulate matter ...................................................................................... 37
5.1 Introduction ........................................................................................ 37
5.2 PM10 .................................................................................................. 42
5.3 PM2.5 ................................................................................................. 42
5.4 PM10-2.5 .............................................................................................. 43
5.5 Relative contribution of PM2.5 and PM10-2.5 to PM10 ........................................... 44
5.6 Trends for PM10, PM2.5 and PM10-2.5 .............................................................. 44
5.7 Compliance with EU limit values and Air-Quality Guidelines for PM10 and PM2.5 ........ 45
5.8 Chemical composition of particulate matter ................................................. 46
6. Ground-level ozone ..................................................................................... 50
6.1 Monitoring network ............................................................................... 50
6.2 Ground-level ozone in Norway .................................................................. 52
6.3 Norwegian ozone levels in 2013 ................................................................. 52
6.4 Exceedances of the limit values for protection of human health ......................... 55
6.5 Exceedance of the threshold values for protection of vegetation ........................ 58

Monitoring of long-range transported air pollutants in Norway, annual report 2013 | M-203|2014
4
7. References ................................................................................................ 61
Results from the monitoring programme ..................................................... 66
Detailed information of the monitoring programme ..................................... 100
Sampling and chemical analysis ............................................................. 104
Monitoring of long-range transported air pollutants in Norway, annual report 2013 | M-203|2014
5
Summary
This report presents the 2013 monitoring results from the rural air- and precipitation chemistry monitoring network in Norway, which in total consist of seventeen sites. In 2013, main components in precipitation were measured at fourteen sites, whereof four had daily measurements the rest weekly. Daily concentrations of inorganic components in air were measured at five sites and ozone concentrations at eight sites. Measurements of PM10 and PM2.5 mass were determined at three sites, including measurements of organic and elemental carbon (OC and EC) with a weekly sampling interval. Daily aerosol mass measurements is in addition, measured at one site. The highest annual mean concentrations for most major components were in 2013 measured at Birkenes, which is the station in Norway most affected by long-range transport of pollutants, except for sulphur, which has a high level in Karpbukt due to emissions from the smelters in Kola Peninsula. The highest wet deposition loads of sulphate, nitrogen components and strong acid occurred along the coast from Aust-Agder to Hordaland. Annual mean concentrations of sulphur dioxide in air was highest in the most southern as well as the most northern sites, the Birkenes and Zeppelin observatories with 0.09 g S/m3. The relatively high levels of sulphur dioxide at Svalbard is due to some high episodes during winter with air masses from Russia, while Birkenes is influenced of air masses from Continental Europe and UK. Highest annual mean concentrations of particulate sulphate, nitrate and ammonium was measured at Birkenes while Hurdal had the highest level of nitrogen dioxide due to influence of the relatively high traffic load in this region of Norway. Both dry and wet deposition of sulphur and nitrogen were higher in the summer period than during winter. Dry deposition of sulphur compounds in 2013 was assessed to be 5–19% of the total deposition during winter and 17–33% during the growing season. For nitrogen, the relative contribution of dry deposition is somewhat higher, 9-27% in winter and 16-46% in summer Since 1980 the content of sulphate in precipitation in Norway has decreased by 76-94%. The reductions in airborne concentrations were between 93%-96% and 80-85% at the Norwegian mainland for sulphur dioxide and sulphate, respectively. Since 1990 the reductions have been between 43-68% (sulphate in precipitation), 60-84% (sulphur dioxide) and 50-68% (sulphate in air). Somewhat lower reductions are observed at Svalbard. The observed reductions in concentration levels are in agreement with reported downwards trends in pollutant emissions in Europe. The nitrate and ammonium concentrations in precipitation have significantly decreased at most sites in southern Norway, 26%-51% for nitrate and 47%-50% for ammonium since 1980. For nitrate in precipitation, the sites in southern Norway show a significant decrease of about 30% from 1990-2013. There is also a decrease in the observed ammonium in air for the four sites at the mainland, between 30-55% since 1993, but for sum nitrate and sum of ammonium, it has rather been a significant increase, partly maybe due to changes in local emissions. The NO2 concentration has decreased between 38-73% for the three sites with significant trends. The concentration of the base cation calcium has been reduced at several sites.

Monitoring of long-range transported air pollutants in Norway, annual report 2013 | M-203|2014
6
The annual mean concentration of OC ranged from 0.75 – 1.05 µg C/m3 for PM10 and from 0.53 – 0.76 µg C/m3 for PM2.5. A significant downward trend was observed for the annual mean concentration of OC in PM10 (**; 35%) and OC in PM2.5 (*; 39%) for the time period 2001 – 2013 at the Birkenes Observatory. The annual mean concentration of EC ranged from 0.06 – 0.14 µg C/m3 for both PM10 and PM2.5. The annual mean EC concentration in PM2.5 at the Birkenes Observatory was the lowest value observed since the measurements started in 2001, equalling that of 2008 and 2012. A significant downward trend was observed for the annual mean concentration of EC in PM10 (+; 33%) and EC in PM2.5 (*; 39%) for the time period 2001 – 2013 at the Birkenes Observatory. The annual mean concentration of aerosol mass ranged from 3.1 – 4.9 µg/m3 for PM10 and from 2.2 – 3.1 µg/m3 for PM2.5. The annual mean concentration of PM10 and PM2.5 observed at Birkenes for 2013 were the lowest values observed since the measurements started. There is a significant downward trend for the annual mean concentration of PM10 (+; 24%) and PM2.5 (+; 36%) for the time period 2000/1 – 2013 at the Birkenes Observatory. The EU limit value, the WHO AQG and the National AQG for PM10 and PM2.5 were all met by a wide margin on an annual basis, as was the 24-hours EU limit values and the WHO AQG. (24-hours measurements available at the Birkenes Observatory only). The 24-hours National AQG (30 µg/m3 for PM10 and 15 µg/m3 for PM2.5) was violated on 2 days for PM10, and on 8 days for PM2.5 at the Birkenes Observatory. The sea salt species (sum of Na+, Cl-, and Mg2+) were the major contributors to PM10 at the Birkenes Observatory in 2013, accounting for 23%. For the sites Hurdal and Kårvatn OC was the major contributor, accounting for 23% and 24% of PM10, respectively. When converting OC to OM (Organic Matter), OM was the major fraction all sites; i.e., 26% (Birkenes), 39% (Hurdal), and 41% (Kårvatn). There is a significant downward trend for the relative contribution of SO4
2- (*; 37%) to PM10 at the Birkenes Observatory for the time period 2001 – 2013, whereas there is a significant upward trend for the relative contribution of NO3
- (*; 74%) and the sea salts species (*; 88%). EU's target value for ozone is met in Norway while the long-term objective (no days with a running 8-hour value> 120 µg/m3) was broken at one station (Tustervatn) in 2013. There were no exceedances of UN-ECE’s critical level for plant growth (three-month’s AOT40) or forests (six-months’ AOT40) at the Norwegian stations in 2013. The maximum hourly average in 2013 was 124 µg/m3 at Tustervatn, and EU's information threshold of 180 µg/m3 was thus not exceeded. This is the lowest annual peak value registered in the country since the ozone monitoring started. This corresponds with data from EEA’s monitoring in the summer 2013 which showed few exceedances and generally low levels in Northern Europe.
Monitoring of long-range transported air pollutants in Norway, annual report 2013 | M-203|2014
7
Sammendrag
Denne rapporten omhandler målinger fra totalt sytten stasjoner. Måling av kjemiske hovedkomponenter i nedbør ble i 2013 utført på døgnbasis på fire stasjon og på ukebasis på ti stasjoner. De uorganiske hovedkomponentene i luft er bestemt på fem stasjoner med døgnoppløsning. Kontinuerlige målinger av ozonkonsentrasjoner i luft er utført på åtte stasjoner. Partikkelmålinger av PM10 og PM2.5 er utført på tre stasjoner der både partikkelmasse og organisk og elementært karbon (OC og EC) er bestemt med ukentlige målinger. Døgnmålinger av partikkelmasse ble i tillegg er utført på én stasjon. De høyeste årsmiddelkonsentrasjoner for de fleste hovedkomponentene ble i 2013 målt på Birkenes i Sør-Norge som er mest påvirket av langtransporterte luftforurensinger, utenom for sulfat hvor det observeres høye nivåer på Karbukt pga. utslipp fra smelteverkene på Kolahalvøya. Våtavsetningen av sulfat, nitrat, ammonium og sterk syre var høyest langs kysten fra Aust-Agder til Hordaland. Årsmiddelkonsentrasjonene av svoveldioksid var like høye i sør Norge (Birkenes Observatoriet) som på Svalbard (Zeppelin Observatoriet) i 2013 med 0,09 µg S/m3. Det relativt høye nivået av svoveldioksid på Svalbard skyldes flere høye episoder gjennom vinteren med luftmasser fra Russland. Birkenes er påvirket av luftmasser fra det Europeiske kontinentet og Storbritannia. Birkenes har også de høyeste nivåene av partikulært sulfat, nitrat og ammonium, mens på Hurdal observeres den høyeste konsentrasjonen i 2013 av nitrogendioksid som skyldes utslipp fra biltrafikken i denne regionen. Både tørr- og våtavsetning av svovel- og nitrogenkomponenter var større om sommeren enn om vinteren. Bidraget av tørravsatt svovel til den totale avsetning var 17–33% om sommeren og 5–19% om vinteren. Tørravsetningen for nitrogenkomponenter bidrar relativt mer til den totale avsetningen enn for svovelforbindelser, 9-27% på vinteren og 16-46% i sommerhalvåret. Årsmiddelkonsentrasjonene av sulfat i nedbør har siden 1980 blitt redusert mellom 76-94%. Reduksjonene for svoveldioksid med 1980 som referanseår er beregnet til å være mellom 93-96%, og for sulfat i luft mellom 80-85% på fastlands-Norge. Med 1990 som referanseår er også reduksjonene betydelige, 43-68% for sulfat i nedbør, 60-84% for svoveldioksid og 50-68% for sulfat i luft. Disse observasjonene er i samsvar med utslippsreduksjoner i Europe i denne perioden Fra 1980 har årsmiddelkonsentrasjonene av nitrat i nedbør blitt redusert med 26-51% på stasjonene i Sør-Norge og mellom 47-50% for ammonium. Fra 1990 har reduksjonen vært ca. 30%. Årsmiddelkonsentrasjonen av ammonium i luft viser en signifikant reduksjon på 30-55% på fastlandsstasjonene siden 1993. For summen nitrat+salpetersyre og sum ammoniakk+ammonium har det derimot vært en økning i konsentrasjonsnivået på flere stasjoner, muligens pga av endringer i lokale utslipp. Det har imidlertid vært en tydelig og signifikant nedgang for NO2 (38-73%) på de tre fastlandsstasjonene med målinger fra 1990. Innholdet av basekationet kalsium er redusert ved flere stasjoner.

Monitoring of long-range transported air pollutants in Norway, annual report 2013 | M-203|2014
8
Årsmidlet for OC på tre stasjonene med partikkelovervåkning varierte fra 0.75 – 1.05 µg C/m3 i PM10 og fra 0.53 – 0.76 µg C/m3 i PM2.5. Det er en signifikant nedadgående trend for årsmidlet av OC in PM10 (**; 35%) og OC in PM2.5 (*; 39%) på Birkenes for perioden 2001 – 2013. Årsmidlet for EC varierte fra 0.06 – 0.14 µg C/m3 for både PM10 og PM2.5. Årsmidlet for EC i PM2.5 ved Birkenes i 2013 er identisk med det som ble observert i 2008 og 2012, og er således en tangering av det laveste årsmidlet som er observert siden målingene startet. Det er en signifikant nedadgående trend for årsmidlet av EC i PM10 (+; 33%) and EC i PM2.5 (*; 39%) ved Birkenes for perioden 2001 - 2013. Årsmidlet for PM10 varierte fra 3.1 – 4.9 µg/m3, mens det for PM2.5 varierte fra 2.2 – 3.1 µg/m3. Årsmidlet for PM10 og PM2.5 på Birkenes Observatoriet i 2013 er det laveste som er observert siden målingene startet. Det er en signifikant nedadgående trend for årsmidlet av PM10 (+; 24%) og PM2.5 (+; 36%) ved Birkenes for perioden 2000/1 – 2013. De observerte årsmidlene lå langt under EUs grenseverdier, samt under WHOs og de nasjonale AQG for PM10 and PM2.5. Observerte 24 timers konsentrasjoner av PM10 og PM2.5 (kun målt på Birkenes) lå under EUs 24 timers grenseverdi, samt under WHO 24 timers AQG. De nasjonale 24 timers AQG (30 µg/m3 for PM10 and 15 µg/m3 for PM2.5) ble overskredet 2 dager for PM10 og 8 dager for PM2.5. Sjøsaltpartikler (her: summen av Na+, Cl-, and Mg2+) bidro mest til PM10 ved Birkenes Observatoriet i 2013 med 23%. Ved stasjonene i Hurdal og Kårvatn dominerte OC (organisk karbon) med henholdsvis 23% og 24% av PM10. Ved å konvertere OC til OM (Organisk Materiale), ble OM den dominerende bidragsyteren for alle lokalitetene med 26% (Birkenes), 39% (Hurdal), and 41% (Kårvatn). Det er en signifikant nedadgående trend for det relative bidraget av SO4
2- (*; 37%) til PM10 ved Birkenes Observatoriet for perioden 2001 – 2013, mens det er en signifikant oppadgående trend for det relative bidraget av NO3
- (*; 74%) og sjøsaltpartikler (*; 88%). EUs luftkvalitetsmål («target value») for ozon er oppfylt i Norge, mens langtidsmålet (ingen dager med en løpende 8-timers verdi over 120 µg/m3) ble brutt på en stasjon (Tustervatn) i 2013. Det var ingen overskridelser av UNECEs grenseverdi for planter (tre måneders AOT40) eller skog (seks-måneders AOT40) på norske stasjoner i 2013. Maksimal timeverdi i 2013 var 124 µg/m3 på Tustervatn, og EUs terskelverdi på 180 µg/m3 ble dermed ikke overskredet. Dette er det laveste årsmaksimum observert i landet siden ozonovervåkingen startet. Dette samsvarer med data fra EEAs overvåking sommeren 2013 som viste få overskridelser og generelt lave nivåer i Nord-Europa.

Monitoring of long-range transported air pollutants in Norway, annual report 2013 | M-203|2014
9
1. The monitoring programme, 2013
The atmospheric monitoring programme presented in this report focuses on particulate and gaseous phase inorganic constituents, particulate carbonaceous matter, ground level ozone and particulate matter in the Norwegian rural background environment. The main objective is to quantify the levels of these pollutants and to document any changes in the supply of atmospheric long-range transported pollution. Hence, the monitoring sites are located in areas where the influence of local sources are minimal, and thus the site being representative for a wider region. Regular sampling of precipitation on a daily basis in Southern Norway dates back to 1973. After that, the measurement program and the monitoring network was expanded to provide improved information on atmospheric contribution of air pollution for all of Norway. After the conclusion of the SNSF ("acid rain’s effects on forest and fish") project in 1979, a national monitoring program organized by the Norwegian Environment Agency was initiated in 1980. Several changes in the content of the measurement programme, as well as in the number and distribution of monitoring sites, has taken place during the 40 years life-time of this monitoring programme, although only small changes since 2011. The measurements presented in the current report are part of different national projects and programmes: The National monitoring programme on behalf of The Norwegian Environment Agency:
o Ozone at four sites (Birkenes, Tustervatn, Kårvatn, Zeppelin) o Daily measurements of NO2 at four sites (Birkenes, Hurdal, Tustervatn, Kårvatn) o Weekly measurements of particulate matter and EC/OC at three sites (Birkenes,
Hurdal, Kårvatn) o High time-resolution measurements of PM at Birkenes o Daily measurements of particulate and gaseous inorganic compounds in air and
precipitation at two sites (Birkenes and Zeppelin; weekly for precipitation at Ny-Ålesund)
o Meteorology at three sites (Birkenes, Zeppelin and Hurdal) Measurement programme to preserve long-time data series on behalf of the Ministry of
Climate and Environment, co-financed by NILUs internal monitoring programme: o Daily measurements of particulate and gaseous inorganic compounds in air and
precipitation at three sites (Hurdal, Kårvatn and Tustervatn) o Weekly measurements of main inorganic ions in precipitation at eight sites (Vikedal,
Treungen, Haukeland, Brekkebygda, Høylandet, Nausta, Vatnedalen, Løken) o Ozone at three sites (Hurdal, Sandve and Prestebakke)
Norway-Russia programme on behalf of The Norwegian Environment Agency: o Weekly measurements of main inorganic ions in air and precipitation at Karpbukt
Local air pollution program, co-financed by the municipalities in Porsgrunn, Skien and
Bamble: o Ozone at Haukenes
Data and results from the national monitoring programme of air pollutants are also included in various international regional programmes. Five of the sites are part of EMEP (European Monitoring and Evaluation Programme) under the CLTRAP (Convention on Long-range

Monitoring of long-range transported air pollutants in Norway, annual report 2013 | M-203|2014
10
Transboundary Air Pollution, http://www.unece.org/env/lrtap). Data from several of the sites are also being reported to CAMP (Comprehensive Atmospheric Monitoring Programme) under OSPAR (the Convention for the Protection of the marine Environment of the North-East Atlantic, http://www.ospar.org); AMAP (Arctic Monitoring and Assessment http://www.amap.no) and WMO/GAW (The World Meteorological Organization, Global Atmosphere Watch programme, http://www.wmo.int). A subset of the data are also reported to EEA (European Environmental Agency, http://www.eea.europa.eu/) as required in the EU air quality directive (EU, 2008). All the data are openly available from http://ebas.nilu.no. Results from previous monitoring are being published in a series of annual reports: 1980 (SFT 26/81), 1981 (SFT 64/82), 1982 (SFT 108/83), 1983 (SFT 162/84), 1984 (SFT 201/85), 1985 (SFT 256/86), 1986 (SFT 296/87), 1987 (SFT 333/88), 1988 (SFT 375/89), 1989 (SFT 437/91), 1990 (SFT 466/91), 1991 (SFT 506/92), 1992 (SFT 533/93), 1993 (SFT 583/94), 1994 (SFT 628/95), 1995 (SFT 663/96), 1996 (SFT 703/97), 1997 (SFT 736/98), 1998 (SFT 768/99), 1999 (SFT 797/00), 2000 (SFT 828/01), 2001 (SFT 847/02), 2002 (SFT 877/03), 2003 (SFT 903/04), 2004 (SFT 929/05), 2005 (SFT 955/06), 2006 (SFT 985/07), 2007 (SFT 1033/08), 2008 (SFT 1051/2009), 2009 (Klif 1074/2010), 2010 (Klif 1099/2011), 2011 (Klif 1126/2012) and 2012 (Klif-Miljødirektoratet M3/2013). The site locations and key information on the monitoring programme at the actual sites are illustrated in Figure 1.1. Detailed station information, monitoring program and measurement frequencies are provided in Annex 2, whereas sampling methods and chemical analysis are described in Annex 3.

Monitoring of long-range transported air pollutants in Norway, annual report 2013 | M-203|2014
11
Figure 1.1: Norwegian background sites and their measurement programme 2013. Details are found in Annex 2. The
colour codes indicate the different regions/zones used for the EU’s ozone directive (Chapter 6, Table 6.1).

Monitoring of long-range transported air pollutants in Norway, annual report 2013 | M-203|2014
12
2. The weather in Norway 2013
The variation in meteorological conditions from year to year are decisive for the observed concentrations of pollutants in air and precipitation. The atmospheric state, i.e. the large-scale synoptic situation with distribution of high- and low-pressure systems, temperature, stability, humidity etc. are controlling the pollutant levels in air as well as the surface dry deposition and wash-out at the Norwegian monitoring stations. For the country as a whole the annual average temperature was 1.0°C above the normal while the precipitation was 110 % of the normal (Met.no, 2014). The first months of the year (Jan-Mar) were characterized by cold and dry conditions in many parts of South Norway and milder and wetter conditions in the north. In January some areas in the north experienced a mean temperature 6° above normal and some areas in the south 4° below normal. In February and March the monthly precipitation was only 0-25% of the normal at various sites in South Norway, whereas areas in the north experienced a precipitation amount twice the normal. In March the mean temperature for the country as a whole was 3° below the normal and the NAO index, measuring the strength of the westerly flow over the Atlantic, was extremely low corresponding with prevailing easterly winds that month. June was one of the wettest June-months ever measured in Norway, mainly due to the extreme weather “Geir” with the highest precipitation in the western part of the country. July and August was dry and hot in South Norway with the country’s max temperature of 33.4°C observed in Aust-Agder. August and September were warm in many parts of the country and some parts of South Norway had twice the monthly precipitation in August. The last two months of 2013 were characterized by mild, windy and wet conditions in many parts of the country. The mean temperature was higher than normal; in December 4.2°C above the normal and even 6-8°C above normal for sites in South Norway. The extreme weather “Hilde” lead to very strong winds and precipitation amounts 200-250 % of the normal in Nordland and coastal areas of Møre and Trøndelag in November. December was a very wet month in Østfold, Agder and Rogaland with precipitation amounts 3-4 times the normal.

Monitoring of long-range transported air pollutants in Norway, annual report 2013 | M-203|2014
13
3. Inorganic components
There were only minor changes in the monitoring programme in 2013 compared to 2012, except for changes in the financial structure. A large fraction of the monitoring programme earlier financed by the Norwegian Environmental Agency, is in currently part of the long-term data series programme under the Ministry of Climate and Environment. Measurements of inorganic ions at Svanvik reported for 2012 was only one year measurement campaign in support of the UNECE ICP Material programme, thus, no such measurements are reported for Svanvik for 2013. Only one site (Birkenes) reported measurements of precipitation on a daily basis for 2012, which is not in accordance with the recommendations made by of EMEP and WMO/GAW. Hence, daily measurements were restarted at the other three EMEP sites at the Norwegian mainland (i.e., Hurdal, Kårvatn and Tustervatn). Not all sites changed from January, but during spring all the EMEP sites had started daily measurements.
3.1 Observations in 2013
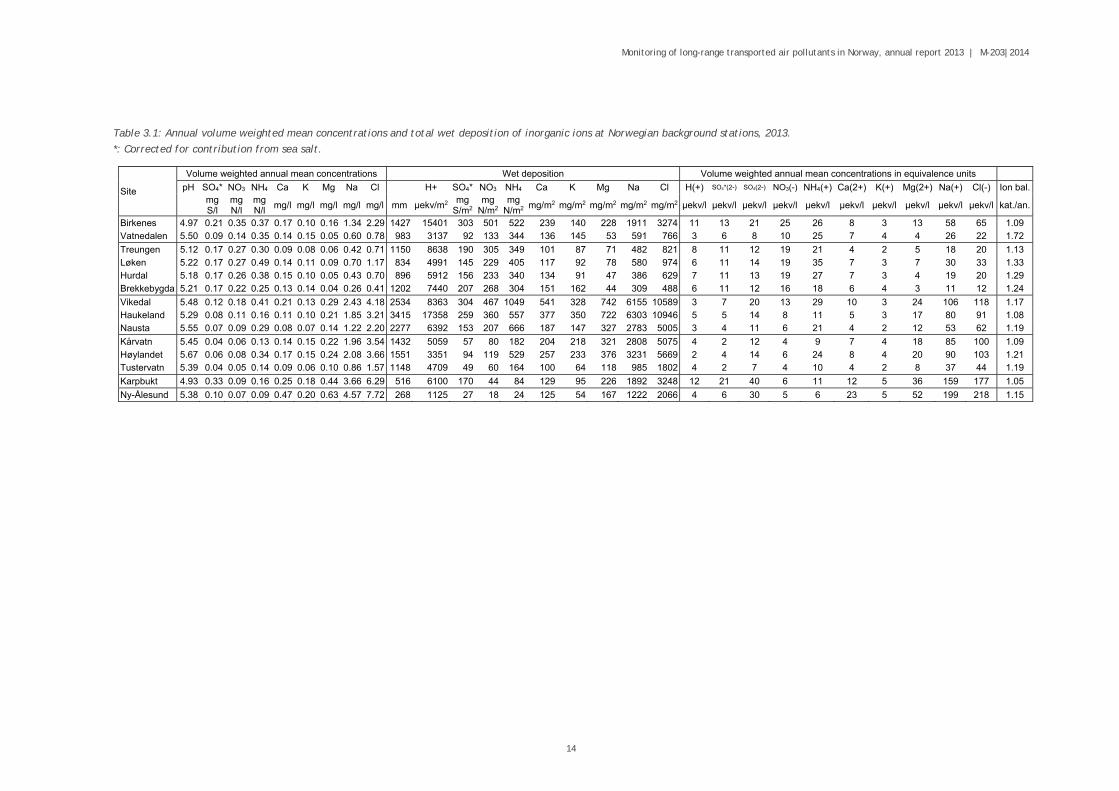
3.1.1 Chemical composition in precipitation All sulphate values given in the present report are adjusted for the contribution of sulphate associated with sea salt. The sea-salt sulphate content is preferably calculated based on the ratio of sodium, or magnesium and chloride, to sulphate in seawater, and is according to the procedures suggested by EMEP (EMEP/CCC, 1995). Monthly and annual concentrations, and wet depositions for all sites are listed in Annex A.1.1-A.1.19, and all years in A.1.21, while Table 3.1 lists the annual mean concentrations and depositions at all stations for 2013. Regional distribution of mean concentrations and wet depositions are shown in Figure 3.1 and Figure 3.2. Table 3.1, Figure 3.1 and Figure 3.2 show that the ion content decreases along a South to North transect and that the lowest levels are observed for the counties reaching from Møre og Romsdal to Troms. The site in Finnmark is influenced by emissions from Russia and the content of sulphate is particularly high. Table 3.1 shows that all regions, except the most continental parts of southern Norway and Finnmark, observed significant amounts of sea salts. At most sites there was an excess of cations, which probably is due to the content of bicarbonate or other anions of weak acids that are not determined. A particularly poor ion balance was observed for Vatnedalen in 2013; the relationship between the sea salt ions was not as expected, and it appears to be an excess of sodium. The reason for this finding is unclear, but it could be speculated that with a weekly sampling frequency, dry deposition of dust of miscellaneous origin, and chemical transformation in the sample is more likely to occur and thus to affect the ion balance and the chemical composition. From 2013, measurements of precipitation on a daily basis, as recommended by EMEP and WMO/GAW is conducted at the four EMEP sites on the Norwegian main land.
Monitoring of long-range transported air pollutants in Norway, annual report 2013 | M-203|2014
14
Table 3.1: Annual volume weighted mean concentrations and total wet deposition of inorganic ions at Norwegian background stations, 2013.
*: Corrected for contribution from sea salt.
Site
Volume weighted annual mean concentrations Wet deposition Volume weighted annual mean concentrations in equivalence units
pH SO4* NO3 NH4 Ca K Mg Na Cl H+ SO4* NO3 NH4 Ca K Mg Na Cl H(+) SO4*(2-) SO4(2-) NO3(-) NH4(+) Ca(2+) K(+) Mg(2+) Na(+) Cl(-) Ion bal.
mg S/l
mg N/l
mg N/l
mg/l mg/l mg/l mg/l mg/l mm µekv/m2 mg S/m2
mg N/m2
mg N/m2 mg/m2 mg/m2 mg/m2 mg/m2 mg/m2 µekv/l µekv/l µekv/l µekv/l µekv/l µekv/l µekv/l µekv/l µekv/l µekv/l kat./an.
Birkenes 4.97 0.21 0.35 0.37 0.17 0.10 0.16 1.34 2.29 1427 15401 303 501 522 239 140 228 1911 3274 11 13 21 25 26 8 3 13 58 65 1.09 Vatnedalen 5.50 0.09 0.14 0.35 0.14 0.15 0.05 0.60 0.78 983 3137 92 133 344 136 145 53 591 766 3 6 8 10 25 7 4 4 26 22 1.72
Treungen 5.12 0.17 0.27 0.30 0.09 0.08 0.06 0.42 0.71 1150 8638 190 305 349 101 87 71 482 821 8 11 12 19 21 4 2 5 18 20 1.13 Løken 5.22 0.17 0.27 0.49 0.14 0.11 0.09 0.70 1.17 834 4991 145 229 405 117 92 78 580 974 6 11 14 19 35 7 3 7 30 33 1.33 Hurdal 5.18 0.17 0.26 0.38 0.15 0.10 0.05 0.43 0.70 896 5912 156 233 340 134 91 47 386 629 7 11 13 19 27 7 3 4 19 20 1.29 Brekkebygda 5.21 0.17 0.22 0.25 0.13 0.14 0.04 0.26 0.41 1202 7440 207 268 304 151 162 44 309 488 6 11 12 16 18 6 4 3 11 12 1.24
Vikedal 5.48 0.12 0.18 0.41 0.21 0.13 0.29 2.43 4.18 2534 8363 304 467 1049 541 328 742 6155 10589 3 7 20 13 29 10 3 24 106 118 1.17 Haukeland 5.29 0.08 0.11 0.16 0.11 0.10 0.21 1.85 3.21 3415 17358 259 360 557 377 350 722 6303 10946 5 5 14 8 11 5 3 17 80 91 1.08 Nausta 5.55 0.07 0.09 0.29 0.08 0.07 0.14 1.22 2.20 2277 6392 153 207 666 187 147 327 2783 5005 3 4 11 6 21 4 2 12 53 62 1.19
Kårvatn 5.45 0.04 0.06 0.13 0.14 0.15 0.22 1.96 3.54 1432 5059 57 80 182 204 218 321 2808 5075 4 2 12 4 9 7 4 18 85 100 1.09 Høylandet 5.67 0.06 0.08 0.34 0.17 0.15 0.24 2.08 3.66 1551 3351 94 119 529 257 233 376 3231 5669 2 4 14 6 24 8 4 20 90 103 1.21 Tustervatn 5.39 0.04 0.05 0.14 0.09 0.06 0.10 0.86 1.57 1148 4709 49 60 164 100 64 118 985 1802 4 2 7 4 10 4 2 8 37 44 1.19
Karpbukt 4.93 0.33 0.09 0.16 0.25 0.18 0.44 3.66 6.29 516 6100 170 44 84 129 95 226 1892 3248 12 21 40 6 11 12 5 36 159 177 1.05
Ny-Ålesund 5.38 0.10 0.07 0.09 0.47 0.20 0.63 4.57 7.72 268 1125 27 18 24 125 54 167 1222 2066 4 6 30 5 6 23 5 52 199 218 1.15

Monitoring of long-range transported air pollutants in Norway, annual report 2013 | M-203
15
Sulphate
concentration in
precipitation,
2013
mg S/L
Sulphate –
wet
deposition.
2013
mg S/m2
pH
2013
Strong acid (H+)
wet deposition,
2013
ekv/m2

Monitoring of long-range transported air pollutants in Norway, annual report 2013 | M-203
16
Figure 3.1: Annual volume weighted mean concentrations and total wet deposition of sulphate (sea salt corrected)
and strong acid (pH), 2013.
Nitrate
concentration in
precipitation, 2013
mg N/l
Ammonium
concentration in
precipitation,
2013
mg N/l
Sum nitrate and
ammonium wet
deposition
2013
mg N/m2
Chloride
concentration in
precipitation,
2013

Monitoring of long-range transported air pollutants in Norway, annual report 2013 | M-203
17
Figure 3.2: Annual volume weighted mean concentrations of nitrate, ammonium, chloride and total wet deposition
of nitrogen (nitrate + ammonium), 2013.
As seen for previous years, the highest annual mean concentrations for the major components were observed at the Birkenes site (Table 3.1); the exceptions were observed for sulphate, which was higher for Karpbukt due to the influence of emissions from Nikel (Russia) and for ammonium where individual sites are influenced of the regional agricultural activities. Being situated only 20 km from the Skagerrak coastline, Birkenes is the site in Norway being the most influenced by long-range transport from the European Continent and UK, hence this finding is to be expected. Figure 3.3 shows monthly volume weighted mean concentrations and wet deposition of sulphate, nitrate and, ammonium in different parts of Norway, 2013. All the monthly data are given in Annex 1. Wet deposition of sulphate during the highest 10 days, shows that about 30% of the annual total deposition arrives during these ten days (Table A1.20) at the two sites with daily measurements during the whole year (Birkenes and Hurdal). Further, som sites are more influenced of sea salt than Birkenes.
0.0
0.1
0.2
0.3
0.4
0.5
JAN FEB MAR APR MAY JUN JUL AUG SEP OCT NOV DEC
mg S/L
conc. xSO42‐
S, SW E NW N
0
10
20
30
40
50
JAN FEB MAR APR MAY JUN JUL AUG SEP OCT NOV DEC
mg S/m
2
wet dep xSO42‐
S, SW E NW N
0.0
0.3
0.6
0.9
1.2
JAN FEB MAR APR MAY JUN JUL AUG SEP OCT NOV DEC
mg N/L
conc. NO3‐
S, SW E NW N
0
20
40
60
80
JAN FEB MAR APR MAY JUN JUL AUG SEP OCT NOV DEC
mg S/m
2
wet dep NO3‐
S, SW E NW N

Monitoring of long-range transported air pollutants in Norway, annual report 2013 | M-203
18
Figure 3.3: Monthly volume weighted mean concentrations (left) and wet deposition (right) of sea salt corrected
sulphate (top) nitrate (middle), ammonium (bottom) in different parts of Norway, 2013, S, SW: South and South
west is the average of the sites Birkenes, Vatnedalen, Treungen and Vikedal; E: East (Løken, Hurdal, Brekkebygda);
NW: Northwest (Haukeland, Nausta and Kårvatn); N: North (Høylandet and Tustervatn).
3.1.2 Chemical composition in air Daily measurements of inorganic components in air was measured at five sites in 2013. All EMEP sites, Figure 1.1. Table 3.2 shows the annual mean concentrations while the monthly data are given in A.1.22-A.1.33, though the monthly means of the sulphur and nitrogen components are illustrated in Figure 3.5. The maximum and percentile concentrations of SO2, SO4
2-, sum of (NO3- + HNO3), NH4+ and sum of (NH3 + NH4
+) are given in Table 3.3 to Table 3.8. Annual mean concentrations of sulphur dioxide in air was highest in the most southern as well as the most northern sites, the Birkenes and Zeppelin observatories with 0.09 g S/m3. Highest daily average for sulphur dioxide was measured at Zeppelin with 2.7 g S/m3 at the 7 December 2013. Trajectories for that day showed that air masses are coming from Russia. In general, the highest concentrations at Zeppelin are, for most components, seen during winter (Figure 3.5), when it is more favorable meteorological conditions for transport of air masses into the Arctic.
Figure 3.4: Air mass trajectories for air reaching the Zeppelin Mountain 7 Dec. 2013, calculated using the Flextra
model.
0.0
0.3
0.6
0.9
1.2
JAN FEB MAR APR MAY JUN JUL AUG SEP OCT NOV DEC
mg N/L
conc. NH5+
S, SW E NW N
0
30
60
90
120
JAN FEB MAR APR MAY JUN JUL AUG SEP OCT NOV DEC
mg N/m
2
wet dep NH4+
S, SW E NW N

Monitoring of long-range transported air pollutants in Norway, annual report 2013 | M-203
19
The Highest annual mean particulate sulphate was measured at Birkenes (0.25 g S/m3), which also had the highest episode with 1.8 g S/m3, and the trajectories show that the air masses were coming from Eastern Europe that day . Highest NO2 levels were observed in Hurdal with an annual mean of 0.69 g N/m3. This station is influenced of the relatively high traffic emissions in this region. The highest daily mean of NO2 was also measured at Hurdal with 8.4g N/m3 the 26 November. Concentrations of NO2 show an expected temporal pattern with a winter maxima and summer minima. During winter, the atmospheric residence time is longer due to low photochemically activity and reduced vertical mixing. Highest annual mean values for sum of nitrate (NO3
- + HNO3), and NH4+ were observed at
Birkenes with 0.29 g N/m3 and 0.23 g N/m3 respectively. Highest annual average of sum of ammonium (NH3 + NH4
+) was observed at Tustervatn due to the relatively high influence of agricultural activity in the area. Also Kårvatn has high levels of sum of ammonium (NH3 + NH4
+).
Table 3.2: Annual mean concentrations of inorganic components in air at Norwegian background stations, 2013.
SO2 SO4
2- NO2 sum
NO3 NO3
sum
NH4 NH4 Mg Ca K Cl Na
µg-S/m3 µg-S/m3 µg-N/m3 µg-N/m3 µg-N/m3 µg-N/m3 µg-N/m3 µg/m3 µg/m3 µg/m3 µg/m3 µg/m3
Birkenes II 0.09 0.25 0.28 0.29 0.21 0.47 0.23 0.06 0.06 0.06 0.57 0.51
Hurdal 0.04 0.17 0.69 0.18 0.12 0.37 0.15 0.02 0.05 0.06 0.14 0.17
Kårvatn 0.02 0.09 0.16 0.13 0.09 0.57 0.09 0.02 0.04 0.04 0.16 0.15
Tustervatn 0.03 0.08 0.13 0.13 0.09 0.69 0.09 0.03 0.04 0.03 0.25 0.20
Zeppelin 0.09 0.16 - 0.18 0.13 0.28 0.11 0.04 0.04 0.04 0.32 0.25
Table 3.3: Number of daily, observations 50-, 75-, 90-percentile concentrations, max and annual mean
concentrations for SO2 in air at Norwegian background station in 2013.
Site No. of
observations
SO2 (µg S/m3)
Percentile conc. Max
concentration Date
Annual mean
concentration 50% 75% 90%
Birkenes II 364 0.05 0.11 0.23 0.78 27.07.2013 0.09
Kårvatn 358 0.01 0.02 0.04 0.24 22.03.2013 0.02
Tustervatn 328 0.01 0.03 0.06 0.89 19.03.2013 0.03
Zeppelin 310 0.01 0.07 0.25 2.74 07.12.2013 0.09
Hurdal 364 0.01 0.05 0.11 0.49 29.05.2013 0.04

Monitoring of long-range transported air pollutants in Norway, annual report 2013 | M-203
20
Table 3.4: Number of daily, observations 50-, 75-, 90-percentile concentrations, max- and annual mean
concentrations for SO4 in aerosols at Norwegian background station in 2013.
Site No. of
observations
SO4 (µg S/m3)
Percentile conc. Max
concentration Date
Annual mean
concentration 50% 75% 90%
Birkenes II 364 0.18 0.35 0.53 1.8 17.02.2013 0.25
Kårvatn 358 0.06 0.14 0.23 0.55 18.05.2013 0.09
Tustervatn 329 0.06 0.1 0.18 0.69 03.03.2013 0.08
Zeppelin 309 0.11 0.23 0.36 0.72 23.05.2013 0.16
Hurdal 364 0.11 0.22 0.39 1.38 27.01.2013 0.17
Table 3.5: Number of daily, observations 50-, 75-, 90-percentile concentrations, max and annual mean
concentrations for NO2 in air at Norwegian background station in 2013.
Site No. of
observations
NO2 (µg N/m3)
Percentile conc. Max
concentration Date
Annual mean
concentration 50% 75% 90%
Birkenes II 365 0.20 0.33 0.56 2.64 12.12.2013 0.28
Kårvatn 363 0.12 0.18 0.26 1.47 05.03.2013 0.16
Tustervatn 363 0.12 0.17 0.21 1.39 21.01.2013 0.13
Hurdal 363 0.44 0.84 1.52 8.39 26.11.2013 0.69
Table 3.6: Number of daily, observations 50-, 75-, 90-percentile concentrations, max- and annual mean
concentrations of the sum of nitrate and nitric acid in air at Norwegian background station in 2013.
Site No. of
observations
NO3+HNO3 (µg N/m3)
Percentile conc. Max
concentration Date
Annual mean
concentration 50% 75% 90%
Birkenes II 363 0.16 0.31 0.63 3.01 13.01.2013 0.29
Kårvatn 349 0.07 0.14 0.32 2.10 03.01.2013 0.13
Tustervatn 329 0.05 0.10 0.23 3.18 02.01.2013 0.13
Zeppelin 303 0.06 0.16 0.46 2.18 02.04.2013 0.18
Hurdal 363 0.10 0.21 0.43 1.17 19.12.2013 0.18
Table 3.7: Number of daily, observations 50-, 75-, 90-percentile concentrations, max- and annual mean
concentrations of ammonium in aerosols at Norwegian background station in 2013.
Site No. of
observations
NH4 (µg N/m3)
Percentile conc. Max
concentrationDate
Annual mean
concentration50% 75% 90%
Birkenes II 363 0.11 0.28 0.56 2.41 13.01.2013, 05.03.2013 0.23
Kårvatn 351 0.03 0.13 0.22 1.55 27.12.2013 0.09
Tustervatn 329 0.02 0.09 0.20 2.53 02.01.2013 0.09
Zeppelin 302 0.04 0.11 0.30 1.75 02.04.2013 0.11
Hurdal 363 0.08 0.21 0.42 1.15 07.05.2013 0.15

Monitoring of long-range transported air pollutants in Norway, annual report 2013 | M-203
21
Table 3.8: Number of daily, observations 50-, 75-, 90-percentile concentrations, max- and annual mean
concentrations of the sum of ammonium and ammonia in air at Norwegian background station in 2013.
Site No. of
observations
NH4 +NH3 (µg N/m3)
Percentile conc. Max
concentrationDate
Annual mean
concentration50% 75% 90%
Birkenes II 363 0.32 0.57 0.97 2.84 05.03.2013 0.47
Kårvatn 350 0.45 0.72 1.17 3.49 03.03.2013 0.57
Tustervatn 329 0.50 0.84 1.38 6.58 03.03.2013 0.69
Zeppelin 290 0.21 0.32 0.60 1.99 02.04.2013 0.28
Hurdal 341 0.30 0.48 0.78 1.33 07.05.2013, 19.12.2013 0.37
Figure 3.5: Monthly mean concentrations of sulphur and nitrogen components in air at the five EMEP sites in Norway
in 2013. Unit: g(S or N)/m3.
3.1.3 Total deposition of sulphur and nitrogen Table 3.9 and Figure 3.6 present estimates of the total dry deposition of sulphur and nitrogen compounds and measured wet deposition, in the growing season from May to October (summer) and winter months from January to April and November to December. Dry deposition is calculated on the basis of the mean concentrations of SO2, SO4
2 -, NO2, sum of nitrate (NO3
- + HNO3), and sum of ammonium (NH3 + NH4+) and deposition velocities given in
table text (Dovland and Eliassen, 1976; Dollard and Vitols, 1980; Fowler, 1980; Garland, 1978; Voldner and Sirois, 1986; Hicks et al., 1987). In the sum of nitrate (NO3
- + HNO3), it is believed that HNO3 contributes with 25 % and NO3- by
75 %. And in sum of ammonium (NH3 + NH4+) NH3 is believed to contribute with 8% and NH4
+ by

Monitoring of long-range transported air pollutants in Norway, annual report 2013 | M-203
22
92% (Ferm, 1988). The dry deposition velocities of gases and particles are highly variable and uncertain quantities. The deposition of particles (SO4
2 -, NO3-, and NH4
+) increases with wind speed and with the ground's roughness (forest coverage etc.). The deposition of gases (SO2, NO2, HNO3, and NH3) depends on the biological activity of the vegetation, and surface type (water, mountains, etc.). The deposition is for most gases far greater on wet surfaces than when the surfaces are dry. In winter, the deposition is small because of low biological activity, and the surface is often covered in snow and ice. The stable layer of air close to the ground in winter also reduces the transport of contaminants to the ground. The wet deposition contribute most to the total deposition at all the sites on the main land, for both nitrogen and sulphur, and the total deposition is highest in southern Norway (Figure 3.6 and Table 3.9). Dry deposition of sulphur contributes to the total deposition with 17-33 % in summer and 5-19 % in winter except at Svalbard where dry deposition is relatively much higher due low precipitation amount. For nitrogen, the dry deposition is relativity more important than for sulphur. Dry deposition of nitrogen contributes between 16-46% in summer in 9-27% in winter to the total nitrogen load.
Table 3.9: Estimated dry deposition and measured wet deposition of sulphur and nitrogen at Norwegian background
stations 2013.
Dry deposition = measured air concentrations · dry deposition velocity from literature
Dry deposition velocities used: SO2: 0.1 cm/s (winter) - 0.7 cm/s (summer). SO4: 0.2-0.6 cm/s, NO2: 0.1-
0.5 cm/s, HNO3: 1.5-2.5 cm/s, NO3: 0.2-0.6 cm/s, NH4: 0.2-0.6 cm/s, NH3: 0.1-0.7 cm/s. Sum nitrate =
25% HNO3 + 75% NO3. Sum ammonium = 8% NH3 + 92% NH4.
The %- values indicate the estimated contributed of dry deposition to the total deposition for winter (W)
and summer (S) Summer = May - October, winter = January - April and November - December.
For Zeppelin, wet deposition is taken from Ny-Ålesund.
Sulphur (mg S/m²) Nitrogen (mg N/m²)
Dry deposition Wet deposition %
dry depositionDry deposition Wet deposition
% dry deposition
Winter Summer Winter Summer % W % S Winter Summer Winter Summer % V % S
Birkenes 8 37 143 163 5 18 50 103 497 532 9 16
Hurdal 5 23 44 113 11 17 28 154 196 386 12 29
Kårvatn 3 14 11 46 19 23 38 72 102 161 27 31
Tustervatn 3 13 22 27 12 33 36 101 105 120 26 46
Zeppelin 8 11 4 24 68 31 - - 12 31 - -

Monitoring of long-range transported air pollutants in Norway, annual report 2013 | M-203
23
Figure 3.6: Total deposition (wet+ dry) of sulphur-S (SO2, SO42-) and nitrogen-N (NO2, NH4
+, NH3, NO3-, HNO3) at
Norwegian background stations 2013.
3.2 Trends An important goal of the monitoring programme is to measure the effectiveness of the protocols. Since Norway is downwind of the major emission sources in Continental Europe, the monitoring programme in Norway can indicate on the total emission reductions in Europe. The most relevant protocol is the Gothenburg Protocol (UN/ECE, 1999). This is a multicomponent protocol where the objective was to reduce European emissions of sulphur by 63% in 2010 compared to 1990. Similarly, the target for nitrogen oxides and ammonia were a reduction of respectively 41% and 17%. In 2012, the Gothenburg Protocol was revised and it was set new emissions targets for 2020 with 2005 as the base year. The 27 EU countries (Norway in brackets) has made the following commitments in emission reductions SO2: 59% (10%), NOx: 43% (23%), nmVOC: 28% (40%), ammonia: 6%, (8%) and PM2.5: 22% (30%). Figure 3.7-Figure 3.9 show the time series of annual mean concentrations of main ions in precipitation, in air and total deposition at selected sites in Norway with long time series. Table 3.10 and 3.11 shows the statistical trends for three different periods, 1980-, 1990-, and 2000-2013 for all sites with measurements in these respective periods. For the statistical analysis, the non-parametric “Mann-Kendall Test” has been used on annual means for detecting and estimating trends (Gilbert, 1987). The Mann-Kendall test has become a standard method when missing values occurs and when data are not normally distributed. In parallel to this, the Sen’s slope estimator has been used to quantify the magnitude of potential trends. Thus, the Sen’s slope is used to estimate the percent reduction in the
0
300
600
900
1200
mg/m2Nitrogen-N Sulphur-S
Dry deposition
Wet deposition
Dry deposition
Wet deposition

Monitoring of long-range transported air pollutants in Norway, annual report 2013 | M-203
24
concentration level while the Mann-Kendall test is used to indicate the significance level of the trend. Statistical calculations have been carried out using the MAKESENS software (Salmi et al., 2002). For sulphur, there has been a significant reduction at all the sites for all the sulphur components in air and precipitation from both 1980 and 1990 to 2013. Since 1980, the content of sulphate in precipitation in Norway has decreased by 76-94%. The reductions in airborne concentrations were similar, between 93%-96% and 80-85% at the Norwegian mainland for sulphur dioxide and sulphate, respectively. Somewhat lower reductions are observed at the Zeppelin Observatory, 86% for sulphur dioxide and 63% for sulphate, Table 3.11. Since 1990, the reductions have been between 43-68% (sulphate in precipitation), 60-84% (sulphur dioxide) and 50-68% (sulphate in air). From 2000, all the sites except Tustervatn observe a significant reduction of sulphate in precipitation, between 24-36%. For sulphur dioxide, there is significant reduction at three of the five sites with about 30% reduction, similar trends for sulphate in air though significant at four sites. The nitrate and ammonium concentrations in precipitation have significantly decreased at most sites in southern Norway, 26%-51% for nitrate and 47%-60% for ammonium since 1980. At Tustervatn it has been an increase in ammonium in precipitation since 1980 maybe due to increased local influence. The air measurements did not start as early as the ones for precipitation, thus trend analysis for these have only been done from 1990. For nitrate in precipitation, the sites south of Haukeland shows a significant decrease of about 30% from 1990-2013. Most of the sites also show a decrease of ammonium, but some with a significant increase. There is also a decrease in the observed ammonium in air for two of the sites at the mainland, between 29%-55% since 1990, but for sum nitrate and sum of ammonium it has rather been a significant increase maybe due to changes in local emissions. The NO2 concentration has decreased between 38%-72% for the three sites with significant trends. The observed reductions in concentration levels of sulphur and nitrogen species are in agreement with reported downwards trends in pollutant emissions in Europe (Tørseth et al., 2012). Calcium is significantly reduced at most sites since 1980, which is consistent with emission reduction from anthropogenic sources in Europe (Hellsten et al., 2007). The contribution of sea salts are influence by meteorological conditions and vary from year to year. A significant reduction is seen at Løken from 1980-2013 and at Vatnedalen from 1990-2013.

Monitoring of long-range transported air pollutants in Norway, annual report 2013 | M-203
25
Table 3.10: Trends in annual mean concentrations of inorganic ions in precipitation using. Mann-Kendall test and Sen
slope estimates; *** is significant level 0.001; ** significant level 0.01; * significant level 0.05, + significant level 0.1.
1980-2013
site SO4 % NO3 % NH4 % Ca % Mg %
change Change change change change Birkenes *** -86 % *** -37 % *** -50 % *** -51 % Treungen *** -87 % *** -36 % *** -47 % *** -46 % Vatnedalen *** -85 % ** -31 % Løken *** -94 % *** -51 % *** -60 % *** -56 % * -35 % Gulsvik/Brekkebygda *** -91 % *** -48 % *** -58 % * -29 % Haukeland 1) *** -88 % *** -37 % ** -48 % ** -38 % Kårvatn *** -76 % * -26 % ** -41 % Tustervatn *** -86 % * 48 % ** -40 % Ny-Ålesund 2) *** -81 % 1)From 1982 2) From 1981
1990-2013
site SO4 % NO3 % NH4 % Ca % Mg %
change change change change change Birkenes *** -56 % *** -28 % ** -29 % Treungen *** -58 % *** -32 % ** -32 % Vatnedalen *** -57 % * -27 % ** -48 % Nordmoen/Hurdal *** -68 % *** -28 % + 64 % Løken *** -61 % *** -37 % * -35 % Gulsvik/Brekkebygda *** -58 % *** -38 % * -36 % Vikedal *** -66 % ** -22 % Nausta *** -66 % * -25 % ** 105 % Høylandet *** -65 % *** 125 % Haukeland *** -62 % * -30 % * -36 % + -26 % Kårvatn *** -43 % * 56 % Tustervatn *** -52 % + -29 % Ny-Ålesund *** -60 %
2000-2013
site SO4 % NO3 % NH4 % Ca % Mg %
change change change change change Birkenes ** -27 % * 347 % Treungen *** -29 % Vatnedalen + -28 % Nordmoen/Hurdal ** -30 % + 867 % Løken ** -28 % * -15 % Gulsvik/Brekkebygda ** -27 % * -26 % Vikedal ** -35 % + -18 % + 371 % Nausta ** -36 % ** 200 % Høylandet * -36 % ** 163 % Haukeland ** -34 % * -22 % Kårvatn * -24 % * 260 % Tustervatn Ny-Ålesund * -32 % + -32 %
Monitoring of long-range transported air pollutants in Norway, annual report 2013 | M-203
26
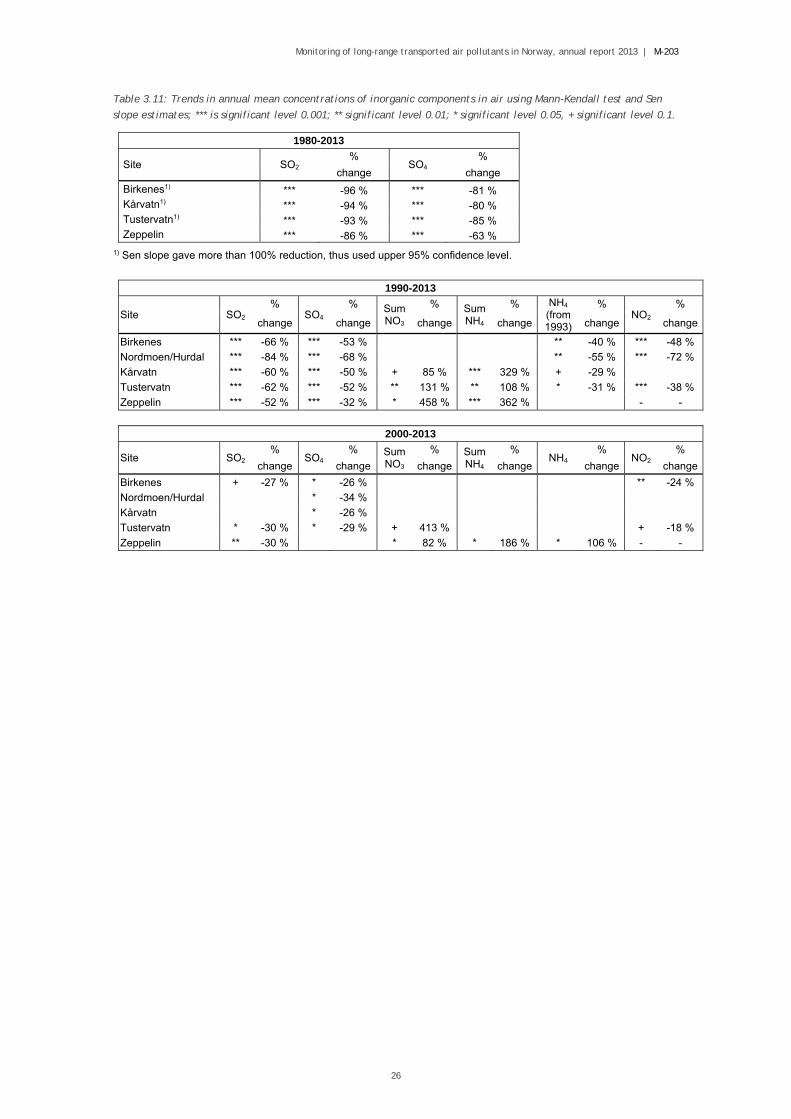
Table 3.11: Trends in annual mean concentrations of inorganic components in air using Mann-Kendall test and Sen
slope estimates; *** is significant level 0.001; ** significant level 0.01; * significant level 0.05, + significant level 0.1.
1980-2013
Site SO2 %
SO4 %
change change
Birkenes1) *** -96 % *** -81 % Kårvatn1) *** -94 % *** -80 % Tustervatn1) *** -93 % *** -85 % Zeppelin *** -86 % *** -63 %
1) Sen slope gave more than 100% reduction, thus used upper 95% confidence level.
1990-2013
Site SO2 %
SO4 % Sum
NO3
% Sum NH4
% NH4
(from 1993)
% NO2
%
change change change change change change
Birkenes *** -66 % *** -53 % ** -40 % *** -48 %
Nordmoen/Hurdal *** -84 % *** -68 % ** -55 % *** -72 %
Kårvatn *** -60 % *** -50 % + 85 % *** 329 % + -29 %
Tustervatn *** -62 % *** -52 % ** 131 % ** 108 % * -31 % *** -38 %
Zeppelin *** -52 % *** -32 % * 458 % *** 362 % - -
2000-2013
Site SO2 %
SO4 % Sum
NO3 % Sum
NH4 %
NH4 %
NO2 %
change change change change change change
Birkenes + -27 % * -26 % ** -24 %
Nordmoen/Hurdal * -34 %
Kårvatn * -26 %
Tustervatn * -30 % * -29 % + 413 % + -18 %
Zeppelin ** -30 % * 82 % * 186 % * 106 % - -

Monitoring of long-range transported air pollutants in Norway, annual report 2013 | M-203
27
Figure 3.7: Volume weighted annual mean concentrations (top), precipitation amount (middle) and wet deposition)
for sea salt corrected sulphate, nitrate and ammonium at five representative sites in southern Norway (Birkenes,
Vatnedalen, Treungen, Gulsvik and Løken), 1974-2013.
0.0
0.2
0.4
0.6
0.8
1.0
1.2
Vol.w. annual mean concentrations (mg/L)
SO4-S
NH4-N
NO3-N
0
500
1000
1500
2000
mm precipitation
0
500
1000
1500
1974 1977 1980 1983 1986 1989 1992 1995 1998 2001 2004 2007 2010 2013
Wet depostion (mg/m2)
SO4-S
NO3-N + NH4-N

Monitoring of long-range transported air pollutants in Norway, annual report 2013 | M-203
28
Figure 3.8: Annual mean concentrations of sulphur and nitrogen components in air at four Norwegian EMEP sites,
1973-2012.
0.0
0.4
0.8
1.2
1.619
73
197
5
197
7
197
9
198
1
198
3
198
5
198
7
198
9
199
1
199
3
199
5
199
7
199
9
200
1
200
3
200
5
200
7
200
9
201
1
201
3
g S
/m3
Sulphate
0.0
0.4
0.8
1.2
1.6
2.0
197
7
197
9
198
1
198
3
198
5
198
7
198
9
199
1
199
3
199
5
199
7
199
9
200
1
200
3
200
5
200
7
200
9
201
1
201
3
g S
/m3
Sulphur dioxide
0.0
0.2
0.4
0.6
198
7
198
9
199
1
199
3
199
5
199
7
199
9
200
1
200
3
200
5
200
7
200
9
201
1
201
3
N N
/m3
Sum nitrat (HNO3 + NO3)
0.0
0.4
0.8
1.2
1.6
198
7
198
9
199
1
199
3
199
5
199
7
199
9
200
1
200
3
200
5
200
7
200
9
201
1
201
3
N N
/m3
Nitrogen dioxide
0.0
0.2
0.4
0.6
199
3
199
5
199
7
199
9
200
1
200
3
200
5
200
7
200
9
201
1
201
3
N N
/m3
Ammonium
0.0
0.5
1.0
1.5
198
7
198
9
199
1
199
3
199
5
199
7
199
9
200
1
200
3
200
5
200
7
200
9
201
1
201
3
N N
/m3
Sum ammonium (NH3 + NH4)

Monitoring of long-range transported air pollutants in Norway, annual report 2013 | M-203
29
Figure 3.9: Trends in total deposition (wet + dry) of sulphur at three Norwegian EMEP sites, 1987-2013.
0
500
1000
1500
2000
1987
1988
1989
1990
1991
1992
1993
1994
1995
1996
1997
1998
1999
2000
2001
2002
2003
2004
2005
2006
2007
2008
2009
2010
2011
2012
2013
mgS/m
2Birkenes
Kårvatn
Tustervatn

Monitoring of long-range transported air pollutants in Norway, annual report 2013 | M-203
30
4. EC and OC
4.1 Introduction Elemental (EC) and organic (OC) carbon are abundant fractions of the ambient aerosol particle, thus contributing to the aerosol particle influence on the radiation budget both directly, by scattering and absorption of sunlight, and indirectly, by cloud formation. Likewise does the carbonaceous fraction contribute to the adverse health effects observed; i.e., respiratory and cardiovascular diseases. EC enters the atmosphere exclusively as a primary (i.e., direct particulate) emission, whereas OC includes both primary aerosol particles and secondary aerosol particles, of which the latter is formed from gaseous precursors oxidized in the atmosphere. The carbonaceous fraction can be of both anthropogenic and natural origin; e.g., EC and OC from incomplete combustion of fossil fuel (e.g. vehicular tailpipe emissions) and biomass (residential wood burning and wild fires), OC from oxidation of gaseous emissions from coniferous and deciduous trees, and OC associated with primary biological aerosol particles (PBAP). EC and OC are typically associated with the fine aerosol particle, although OC can appear in the coarse fraction as well, e.g. the PBAPs or due to condensation of OC on coarse aerosol particles. Despite the importance of the carbonaceous aerosol, detailed apportionment and quantification of its sources is still difficult due to the large number of sources, the complexity of atmospheric formation and the vast number of organic compounds associated with the aerosol. EC and OC are simply operational definitions, and do not provide information about the source pr. se, thus additional measurements to EC and OC are required to provide information about the carbonaceous aerosol sources and their relative share. Source apportionment studies (Yttri et al., 2011a, b), using a combination of 14C and organic tracers, show that natural sources dominates OC in PM10 at Norwegian rural background sites in summer, of which OC associated with the biogenic secondary organic aerosol (BSOA) is the major source followed by OC associated with PBAP. In winter, anthropogenic sources dominates OC in PM10, i.e., emissions from fossil fuel combustion and residential wood burning. The picture is rather similar for OC in PM1, except that OC associated with PBAP is of much less importance in summer than seen for PM10. Combustion of fossil fuel appears to be the major source of EC regardless of season and size fraction, but EC from residential wood burning increases substantially in winter. Monitoring of ambient aerosol EC and OC in PM10 and PM2.5 are currently taking place at three rural background sites; i.e., the Birkenes Observatory and the Hurdal and Kårvatn sites. The time series at the Birkenes Observatory dates back to 2001, whereas at the Hurdal and Kårvatn sites measurements were initiated in 2010.
4.2 Concentrations of OC PM10 The annual mean concentration of OC in PM10 ranged from 0.75 µg C m3 (Kårvatn) to 1.05 µg C m3 (Hurdal), being approximately 40% higher at Hurdal compared to Kårvatn and Birkenes (Table 4.1). The annual mean concentration of OC in PM10 was within one standard deviation (SD) of the long-term mean at all sites. For Birkenes, the annual mean OC concentration in

Monitoring of long-range transported air pollutants in Norway, annual report 2013 | M-203
31
PM10 was the second lowest value observed since the measurements started in 2001 (Figure 4.1).
Table 4.1: Annual mean concentrations of OC, EC and TC in PM10 and PM2.5 at the Birkenes Observatory and the sites
Hurdal and Kårvatn for the period 2001 - 2013.
Year PM10 PM2.5
OC EC TC OC EC TC Birkenes
2001 1.10 0.13 1.3 1.00 0.16 1.20 2002 1.00 0.14 1.2 0.92 0.12 1.00 2003 1.00 0.11 1.2 0.86 0.12 0.98 2004 0.84 0.10 0.94 0.59 0.09 0.68 2005 0.93 0.15 1.10 0.64 0.12 0.75 2006 1.20 0.13 1.30 0.89 0.13 1.00 2007 0.84 0.14 0.98 0.63 0.12 0.75 2008 0.8 0.09 0.89 0.57 0.08 0.65 2009 0.79 0.10 0.89 0.58 0.09 0.67 2010 0.9 0.11 1.00 0.67 0.10 0.78 2011 0.92 0.12 1.00 0.68 0.11 0.8 2012 0.57 0.08 0.64 0.50 0.08 0.58 2013 0.76 0.09 0.84 0.57 0.08 0.65
Hurdal 2010 1.30 0.16 1.40 0.87 0.15 1.00 2011 1.30 0.17 1.50 0.89 0.17 1.10 2012 0.86 0.13 0.99 0.60 0.12 0.73 2013 1.05 0.14 1.19 0.76 0.14 0.90
Kårvatn 2010 0.98 0.06 1.00 0.85 0.07 0.92 2011 0.88 0.07 0.95 0.67 0.07 0.74 2012 0.72 0.05 0.78 0.56 0.05 0.62 2013 0.75 0.06 0.81 0.53 0.06 0.59
Figure 4.1: Annual mean time series of EC and OC, as observed at the Birkenes Observatory during the period 2001 -
2013.

Monitoring of long-range transported air pollutants in Norway, annual report 2013 | M-203
32
The summertime (April - September) mean concentration of OC in PM10 was 2 (Birkenes and Hurdal) and 3 (Kårvatn) times higher than the wintertime (October - March) mean (Table 4.2). Increased levels of OC in summer are typically associated with increased levels of SOA, and BSOA in particular, and for Norwegian and Nordic rural background sites, PBAP is demonstrated to be a major contributor to the coarse fraction of PM10 (PM10-2.5) as well. See Yttri et al. (2011 a, b) for a quantitative source apportionment of the carbonaceous aerosol particle in the Norwegian and Nordic rural background environment.
Table 4.2: Annual and monthly mean concentrations of OC, EC and TC in PM10 and PM2.5 at the sites Birkenes, Hurdal
and Kårvatn for 2013.
Month PM10 PM2,5
OC EC TC OC EC TC
Birkenes
January 0.50 0.11 0.61 0.55 0.09 0.65 February 0.65 0.14 0.79 0.53 0.10 0.63 March 0.56 0.11 0.67 0.51 0.10 0.60 April 0.44 0.08 0.52 0.36 0.07 0.43 May 1.37 0.11 1.48 1.03 0.10 1.13 June 1.36 0.05 1.42 0.92 0.07 0.99 July 1.14 0.07 1.22 0.85 0.08 0.93 August 0.95 0.06 1.02 0.58 0.06 0.64 September 0.79 0.10 0.89 0.49 0.09 0.58 October 0.66 0.09 0.75 0.41 0.09 0.50 November 0.28 0.05 0.33 0.24 0.05 0.29 December 0.36 0.07 0.43 0.28 0.07 0.35
Annual mean 0.76 0.09 0.84 0.57 0.08 0.65
Hurdal
January 0.72 0.19 0.91 0.82 0.20 1.0 February 0.81 0.20 1.02 0.74 0.18 0.92 March 0.61 0.15 0.76 0.59 0.14 0.73 April 0.44 0.09 0.53 0.36 0.09 0.46 May 1.70 0.14 1.83 1.29 0.15 1.45 June 1.89 0.10 1.99 1.38 0.11 1.49 July 1.43 0.08 1.51 1.05 0.08 1.13 August 1.23 0.09 1.32 0.67 0.08 0.75 September 1.54 0.14 1.68 0.69 0.13 0.82 October 0.98 0.16 1.14 0.49 0.15 0.64 November 0.70 0.18 0.88 0.58 0.18 0.76 December 0.51 0.15 0.66 0.49 0.15 0.63
Annual mean 1.05 0.14 1.19 0.76 0.14 0.90
Kårvatn
January 0.34 0.08 0.42 0.32 0.08 0.39 February 0.40 0.07 0.47 0.37 0.07 0.44 March 0.33 0.07 0.40 0.32 0.07 0.39 April 0.27 0.03 0.29 0.26 0.03 0.29 May 1.45 0.07 1.52 1.14 0.08 1.23 June 1.36 0.06 1.39 0.89 0.08 0.97 July 1.31 0.06 1.36 0.94 0.05 0.99 August 1.01 0.07 1.08 0.65 0.07 0.72 September 1.24 0.07 1.32 0.66 0.08 0.74 October 0.63 0.06 0.69 0.33 0.06 0.39 November 0.34 0.04 0.38 0.21 0.04 0.24 December 0.22 0.03 0.24 0.25 0.03 0.28
Annual mean 0.75 0.06 0.81 0.53 0.06 0.59

Monitoring of long-range transported air pollutants in Norway, annual report 2013 | M-203
33
Observed concentrations of OC, and EC, were higher at the Hurdal site compared to the Birkenes Observatory and the Kårvatn site regardless of season and size fraction (PM10 and PM2.5), and the differences was larger in winter compared to summer. We speculate that the more densely populated region surrounding the Hurdal site, compared to those surrounding the two other sites, largely can explain the actual observation. Incidences of higher monthly mean concentrations for OC and EC in PM2.5 than for PM10 seen in Table 4.1 are typically attributed to a deviating number of samples for the two size fractions or very low concentrations (typically for EC). PM2.5
The annual mean concentration of OC in PM2.5 ranged from 0.53 µg C m3 (Kårvatn) to 0.76 µg C m3 (Hurdal), being 43% higher at Hurdal compared to Kårvatn and 33% higher at Hurdal compared to Birkenes (Table 4.1). The annual mean concentration of OC in PM10 was within the long-term mean at all sites. For Birkenes, the annual mean OC concentration in PM10 was the second lowest value observed since the measurements started in 2001 (Figure 4.1). The summertime (April - September) mean concentration of OC in PM2.5 was 1.5 (Hurdal), 1.7 (Birkenes) and 2.5 (Kårvatn) times higher than the wintertime (October - March) mean (Table 4.2). As already described, (B)SOA is a major contributor to OC in summer; PBAP, however, is not likely to contribute particularly to the observed seasonality of OC in PM2.5 as it mainly reside in the PM10-2.5 fraction. PM10-2.5
OC in PM10-2.5 can be obtained by subtracting OC in PM2.5 from that of OC in PM10. The annual mean concentration of OC in PM10-2.5 ranged from 0.19 µg C m3 (Birkenes) to 0.29 µg C m3 (Hurdal), being 53% higher at Hurdal compared to Birkenes and 32% higher at Hurdal compared to Kårvatn (Figure 4.1The annual mean concentration of OC in PM10-2.5 was within 1SD of the long-term mean at all sites. The summertime (April - September) mean concentration of OC in PM10-2.5 was 2.8 (Birkenes) to 3.6 (Kårvatn) times higher than the wintertime (October - March) mean. The pronounced seasonality of OC in PM10-2.5 strongly suggests that it is dominated by PBAP, which peaks during the vegetative season (see Yttri et al., 2007a; Yttri et al., 2011a, b).
4.3 Concentrations of EC PM10 The annual mean concentration of EC in PM10 ranged from 0.06 µg C m3 (Kårvatn) to 0.14 µg C m3 (Hurdal), being 56% higher at Hurdal compared to Birkenes and 133% higher at Hurdal compared to Kårvatn (Table 4.1). The annual mean concentration of EC in PM10 for 2013 was within 1 SD of the long-term mean at all sites. For Birkenes, the annual mean EC concentration in PM10 was the second lowest value observed since the measurements started in 2001 (Figure 4.1). The wintertime (October - March) mean concentration of EC in PM10 was 1.2 and 1.6 times higher than the summertime (April - September ) mean at the sites Birkenes and Hurdal,

Monitoring of long-range transported air pollutants in Norway, annual report 2013 | M-203
34
respectively, whereas no seasonality was observed for Kårvatn (Table 4.2). Increased levels of EC in winter could be associated with increased emissions from e.g. residential wood burning, but also meteorological inversion, preventing dispersion could play an important role. PM2.5 The annual mean concentration of EC in PM2.5 ranged from 0.06 µg C m3 (Kårvatn) to 0.14 µg C m3 (Hurdal), being 75% higher at Hurdal compared to Birkenes and 133% higher at Hurdal compared to Kårvatn (Table 4.1). The annual mean concentration of EC in PM10 for 2013 was within 1 SD of the long-term mean at all sites. The annual mean EC concentration in PM2.5 observed at Birkenes for 2013 (i.e., 0.08 µg C/m3) was the lowest value observed since the measurements started in 2001, equalling that of 2008 and 2012 (Figure 4.1). The wintertime (October - March) mean concentration of EC in PM10 was 1.1 and 1.5 times higher than the summertime (April - September ) mean at the sites Birkenes and Hurdal, respectively, whereas for Kårvatn the summertime mean was slightly higher than for the wintertime mean; i.e. 1.1 times higher (Table 4.2).
4.4 Relative contribution of EC/OC to PM
4.4.1 Relative contribution of OC in PM2.5 and OC in PM10-2.5 to OC in PM10 On an annual basis, 71% (Kårvatn) to 75% (Birkenes) of OC in PM10 was attributed to OC residing in the fine fraction of PM10, i.e., the PM2.5 fraction, which is within 1SD of the long-term mean at all sites. These numbers reflect that OC mainly is associated with fine aerosol particles, as it is emitted from combustion processes or is a result of gas to particle conversion, by either formation of new particles or by condensation on existing ones. A 25% (Birkenes) to 29% (Kårvatn) contribution of OC in PM10-2.5 to OC in PM10 on an annual basis is considered substantial, and during the vegetative season, OC in PM10-2.5 can even be the major contributor to OC in PM10, considered on a monthly basis. The pronounced seasonal variation of OC in PM10-2.5, with increased levels during the vegetative season, suggest that this fraction is dominated by PBAP. This has also been documented in peer reviewed papers (Yttri et al., 2007a, b and 2011a, b).
4.4.2 Relative contribution of EC in PM2.5 to EC in PM10 On an annual basis, 89% (Birkenes) to 100% (Hurdal and Hurdal) of EC in PM10 was attributed to EC residing in the fine fraction of PM10, i.e., the PM2.5 fraction, which is within 1SD of the long-term mean at all sites. EC is exclusively emitted as primary aerosol particles during combustion of fossil fuel and biomass, hence their presence in the fine fraction of PM10 is as expected.
4.4.3 Relative contribution of OC and EC to TC for PM10 and PM2.5 OC was the major contributor to TC at all sites, ranging from 88% (Hurdal) to 93% (Kårvatn) for PM10, and from 84% (Hurdal) to 90% (Kårvatn) for PM2.5, on an annual basis. The relative share of EC and OC to TC had a pronounced seasonal variation, with the OC fraction increasing in summer and EC during winter. The observed seasonality largely reflects a change in sources according to season. Increased SOA formation and PBAP emissions in summer, and residential wood burning emissions in winter are the main drivers of the observed pattern. The larger fraction of OC seen for PM10 compared to PM2.5 is attributed to

Monitoring of long-range transported air pollutants in Norway, annual report 2013 | M-203
35
PBAP, which typically resides in the coarse fraction of PM10, and that EC, being a result of combustion, is associated mainly with the fine fraction of PM2.5.
4.4.4 Relative contributions of OC and EC to PM10, PM2.5 and PM10-2.5 The relative contribution of OC to PM10 ranged from 16% (the Birkenes Observatory) to 24% (Kårvatn) on an annual basis. OC was a more abundant fraction of PM10 in summer (18-25%) compared to winter (14-22%) at all sites. A non-significant decrease in the relative contribution of OC to PM10 was observed for the time period 2001 – 2013 at the Birkenes Observatory, corresponding to a decrease of 0.2% yr-1 (17%). The relative contribution of OC to PM2.5 ranged from 20% (the Birkenes Observatory) to 25% (Kårvatn) on an annual basis. OC was a more abundant fraction of PM2.5 in summer (21%) at the Birkenes Observatory compared to winter (16%), whereas it was the other way around at Hurdal; i.e., 23% in summer versus 25% in winter. No seasonal variability was observed for Kårvatn; i.e., 24%. A non-significant decrease in the relative contribution of OC to PM2.5 was observed for the time period 2001 – 2013 at the Birkenes Observatory, corresponding to a decrease of 0.12% yr-1 (8%). The relative contribution of OC to PM10-2.5 ranged from 10% (the Birkenes Observatory) to 24% (Kårvatn) on an annual basis. OC was a more abundant fraction of PM10-2.5 in summer (15-36%) compared to winter (8-14%) at all sites. A non-significant decrease in the relative contribution of OC to PM10-2.5 was observed for the time period 2001 – 2013 at the Birkenes Observatory, corresponding to a decrease of 0.14% yr-1 (20%). The relative contribution of EC to PM10 ranged from 1.8% (the Birkenes Observatory) to 3.0% (Hurdal) on an annual basis. EC was a more abundant fraction of PM10 in winter (2.6-4.7%) compared to summer (1.3-2.0%) at all sites; this seasonality was particularly pronounced at the sites Hurdal and Kårvatn. A non-significant decrease in the relative contribution of EC to PM10 was observed for the time period 2001 – 2013 at the Birkenes Observatory, corresponding to a decrease of 0.02% yr-1 (-11%). The relative contribution of EC to PM2.5 ranged from 2.8% (the Birkenes Observatory and Kårvatn) to 4.5% (Hurdal) on an annual basis. EC was a more abundant fraction of PM2.5 in winter (3.4-6.8%) compared to summer (2.1-3.1%) at all sites; this seasonality was particularly pronounced at the site Hurdal. A non-significant decrease in the relative contribution of EC to PM2.5 was observed for the time period 2001 – 2013 at the Birkenes Observatory, corresponding to a decrease of 0.004% yr-1 (-2%).
4.5 Trends for concentrations of EC and OC The Mann Kendall method described in Chapter 3.2 is used also for trend analysis of concentrations of EC and OC. The shorter time series for the sites Hurdal and Kårvatn (4 years) allow for an assessment of the trend of EC and OC for the Birkenes site only. The time series of OC in PM10, PM2.5 and PM10-2.5, and that of EC in PM10 and PM2.5 at the Birkenes Observatory, are shown in Figure 4.1. A significant downward trend in the observed annual mean concentration of OC in PM10 was seen for the time period 2001 – 2013 at the Birkenes Observatory, corresponding to a

Monitoring of long-range transported air pollutants in Norway, annual report 2013 | M-203
36
decrease of 0.029 µg C/m3 yr-1 (**; 35%). For the same time period, a significant downward trend in the observed annual mean concentration of OC in PM2.5 was also observed, corresponding to a decrease of 0.028 µg C/m3 yr-1 (*; 39%). A non-significant increase was observed for the annual mean concentration of OC in PM10-2.5 for the actual time period, corresponding to an increase of 0.004 µg C/m3 yr-1 (30%). A significant downward trend in the observed annual mean concentration of EC in PM10 was seen for the time period 2001 – 2013 at Birkenes, corresponding to a decrease of 0.003 µg C/m3 yr-1 (+; 33%). For the same time period, a significant downward trend in the observed annual mean concentration of EC in PM2.5 was also seen, corresponding to a decrease of 0.004 µg C/m3 yr-1 (*; 39%).

Monitoring of long-range transported air pollutants in Norway, annual report 2013 | M-203
37
5. Particulate matter
5.1 Introduction Size is the most fundamental parameter describing an aerosol, being decisive for transport and removal, and essential for understanding the effects of the ambient aerosol. Aerosol are most commonly defined by their equivalent aerodynamic diameter, defined as, that of a spherical particle of unit density (1 g cm-3), having a settling velocity equal to that of the particle in question. The size distribution of the tropospheric aerosol is commonly divided into three major modes (Whitby, 1978); the nuclei mode, the accumulation mode and the coarse mode, all having different formation processes, leading to different characteristics of the aerosol. Tropospheric aerosols are either emitted directly (primary) or formed in the trophosphere by oxidation of precursor gases (secondary) (Seinfeld and Pandis, 1998). The sources of tropospheric aerosols are both natural (e.g. windborne dust, sea spray, volcanic activity, biomass burning) and anthropogenic (fuel combustion, industrial processes, non-industrial fugitive sources and transportation sources), and hence its chemical composition is highly diverse, including amongst others: sulphate (SO4
2-), nitrate (NO3-), ammonium (NH4
+), organic carbon (OC), which is a bulk fraction of numerous organic molecules, light absorbing/refractory carbon (BC/EC), aluminum and silicon (major constituents of mineral dust), inorganic cations (e.g., K+, Na+, Ca2+ Mg2+) and anions (e.g., Cl-). The adverse health effects of the ambient aerosol is well recognized (e.g., Dockery et al., 1993; Schwarz et al., 1996), causing various types of cardiopulmonary diseases, e.g., chronical obstructive pulmonary disease, ischemic heart disease, lung cancer and pneumonia. Although the statistical evidence between ambient air particulate mass (e.g., PM10 and PM2.5) and adverse health effects are well documented, there is considerable doubt concerning the causal relationship. Thus, other relevant parameters such as the particle number size distribution, the surface and the chemical composition of the aerosol must be considered when addressing this issue. There is strong evidence that fine particles are more hazardous than coarse ones (Schwartz et al., 1996, Schwartz and Neas, 2000), although coarse particles are associated with adverse health effects as well (Castillejos et al., 2000; Ostro et al., 2000). An increasing number of experimental studies have been devoted to the number of ultrafine particles (dp< 100 nm), which potentially play a role in the cardiovascular effects commonly associated with exposure to particulate matter (Donaldson et al., 2001). Concerning the chemical composition, WHO has given the general advice that that primary combustion derived particles are particularly important as they “are often rich in transition metals and organic compounds, and also have a relatively high surface area”. However, more knowledge is needed concerning the ambient aerosol chemical composition and its contribution to the adverse effects seen on human health. The tropospheric aerosol has an influence on the radiation budget both directly, by scattering and absorption of sunlight and terrestrial radiation, and indirectly, by influencing cloud reflectivity and lifetime. Both effects lead to a mostly cooling effect for the Earth's surface. The particle size distribution is essential for quantifying the magnitude of both direct and indirect aerosol climate effect, whereas particle chemical composition influences aerosol absorption and the lower size limit of particles acting as cloud condensation nuclei.

Monitoring of long-range transported air pollutants in Norway, annual report 2013 | M-203
38
The tropospheric aerosol also plays an important role when it comes to acidification and eutrophication of water bodies. This is attributed to the content of secondary inorganic species such as SO4
2-, NO3- and NH4
+, which typically are associated with accumulation mode particles, enabling long-range transport and deposition in regions far from where the precursors where emitted. Monitoring of the PM10 and PM2.5 mass concentration are currently taking place at three rural background sites; i.e., the Birkenes Observatory and the Hurdal and Kårvatn sites. The time series at the Birkenes Observatory dates back to 2000/1, whereas at the Hurdal and Kårvatn sites measurements were initiated in 2010. At the Birkenes Observatory, high time resolution measurement of PM10, PM2.5 and PM1 was initiated in 2010. Annual and monthly mean mass concentrations of PM10, PM10-2,5 and PM2.5, obtained by gravimetric measurements, are shown in Table 5.1, whereas annual mean mass concentrations for PM10, PM10-2,5 and PM2.5 for the time period 2000 – 2013 are listed in

Monitoring of long-range transported air pollutants in Norway, annual report 2013 | M-203
39
Table 5.2. Note that PM10-2,5 is derived from the observed values of PM10 and PM2.5. Time series of PM10 and PM2.5 for 2013 are shown in Figure 5.1.
Table 5.1: Annual and monthly mean concentrations of PM10, PM10-2.5 and PM2.5 at the Birkenes Observatory and the
sits Hurdal and Kårvatn for 2013.
Month Birkenes Hurdal Kårvatn
PM2,5 PM10-2,5 PM10 PM2,5 PM10-2,5 PM10 PM2,5 PM10-2,5 PM10
JAN 2.5 3.6 0.5 4.1 1.1 0.2 1.2
FEB 3.4 0.7 4.2 3.0 0.6 3.5 1.4 0.4 1.8
MAR 3.6 1.9 5.4 3.1 1.4 4.5 1.9 0.5 2.4
APR 2.7 3.5 6.3 2.4 1.6 3.9 1.6 0.7 2.3
MAY 4.7 2.9 7.6 5.1 1.9 6.9 4.4 0.3 4.7
JUN 3.8 1.8 5.6 4.9 1.4 6.3 3.8 1.1 4.9
JUL 3.6 2.0 5.7 4.2 1.8 5.9 4.3 1.6 6.0
AUG 2.7 2.2 4.9 2.7 1.4 4.1 2.9 1.6 4.5
SEP 2.1 1.7 3.8 2.9 2.4 5.3 2.4 1.6 4.0
OCT 1.8 1.7 3.6 1.8 1.7 3.5 1.0 0.9 1.9
NOV 1.8 1.6 3.3 2.0 1.1 3.0 1.0 1.0 2.0
DEC 1.7 2.3 4.0 2.2 1.5 3.7 1.0 0.5 1.4
2013 2.9 2.0 4.9 3.1 1.5 4.6 2.2 0.9 3.1
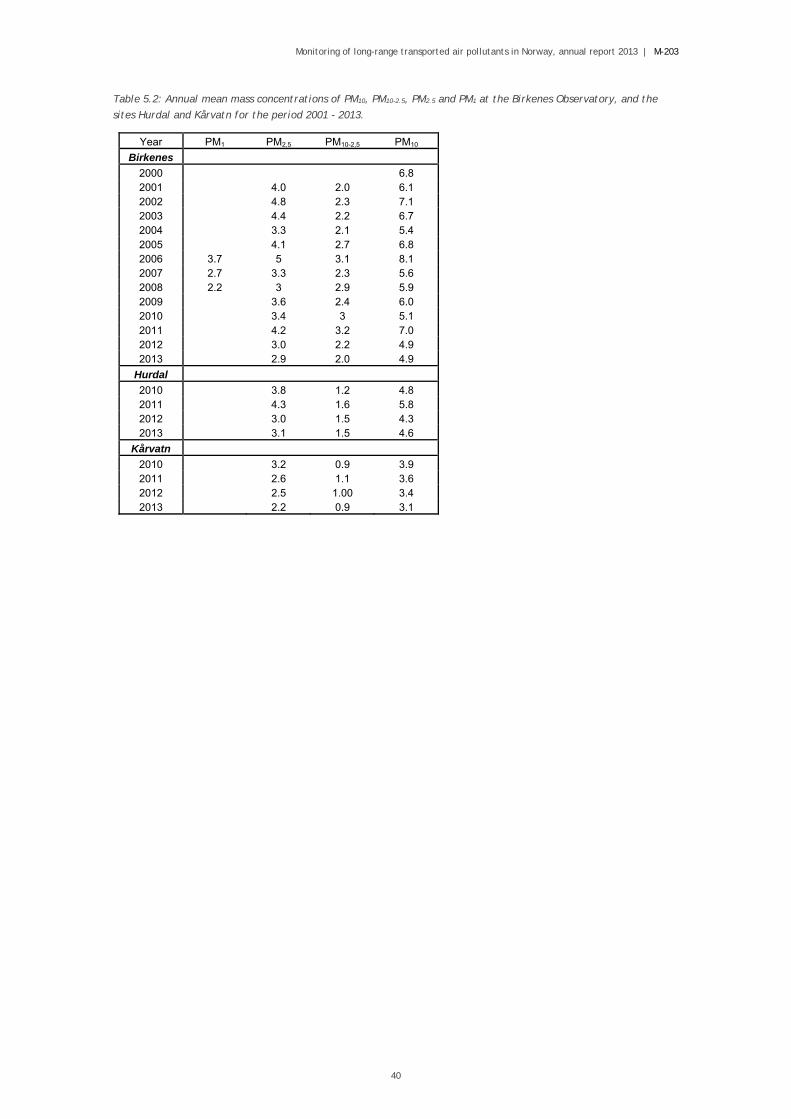
Monitoring of long-range transported air pollutants in Norway, annual report 2013 | M-203
40
Table 5.2: Annual mean mass concentrations of PM10, PM10-2.5, PM2.5 and PM1 at the Birkenes Observatory, and the
sites Hurdal and Kårvatn for the period 2001 - 2013.
Year PM1 PM2,5 PM10-2,5 PM10
Birkenes
2000 6.8 2001 4.0 2.0 6.1 2002 4.8 2.3 7.1 2003 4.4 2.2 6.7 2004 3.3 2.1 5.4 2005 4.1 2.7 6.8 2006 3.7 5 3.1 8.1 2007 2.7 3.3 2.3 5.6 2008 2.2 3 2.9 5.9 2009 3.6 2.4 6.0 2010 3.4 3 5.1 2011 4.2 3.2 7.0 2012 3.0 2.2 4.9 2013 2.9 2.0 4.9
Hurdal
2010 3.8 1.2 4.8 2011 4.3 1.6 5.8 2012 3.0 1.5 4.3 2013 3.1 1.5 4.6
Kårvatn
2010 3.2 0.9 3.9 2011 2.6 1.1 3.6 2012 2.5 1.00 3.4 2013 2.2 0.9 3.1
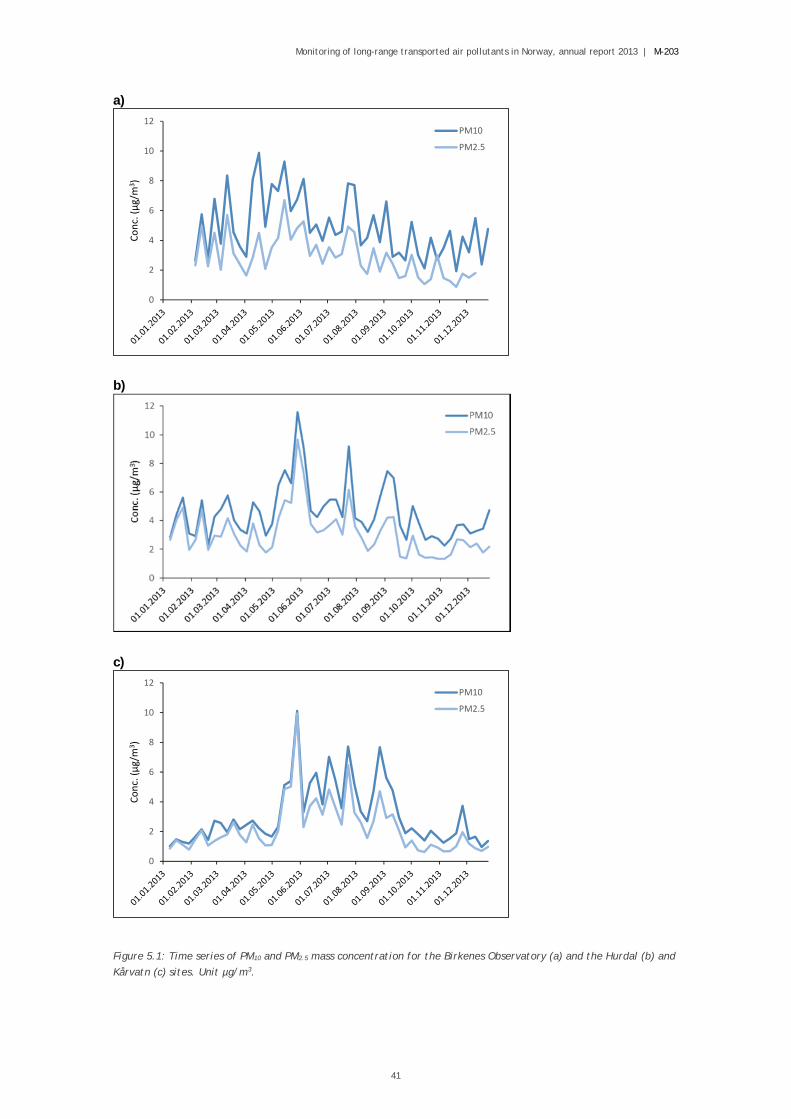
Monitoring of long-range transported air pollutants in Norway, annual report 2013 | M-203
41
a)
b)
c)
Figure 5.1: Time series of PM10 and PM2.5 mass concentration for the Birkenes Observatory (a) and the Hurdal (b) and
Kårvatn (c) sites. Unit µg/m3.
0
2
4
6
8
10
12
Conc. (µg/m
3 )PM10
PM2.5
0
2
4
6
8
10
12
Conc. (µg/m
3 )
PM10
PM2.5

Monitoring of long-range transported air pollutants in Norway, annual report 2013 | M-203
42
5.2 PM10 The annual mean mass concentration of PM10 ranged from 3.1 µg/m3 (Kårvatn) to 4.9 µg/m3 (Birkenes), thus annual mean mass concentrations of PM10 (and PM2.5) observed in the Norwegian rural background environment are considered amongst the lowest in Europe. The higher observed annual mean concentration of PM10 at Birkenes compared to Hurdal (4.6 µg/m3) and Kårvatn is consistent with the pattern seen during the 4 years of concurrent measurements at these 3 sites. At all sites, the summertime (April - September) mean concentration of PM10 was higher than the wintertime mean (October - March); i.e., 1.5 times higher at Birkenes and Hurdal and 2.7 times higher at Kårvatn. The annual mean concentration PM10 was within – 1SD of the long-term mean at Hurdal and Kårvatn, whereas it was slightly below this range at the Birkenes site. The annual mean concentration of PM10 observed at Birkenes for 2013, was the lowest value observed since the measurements started in 2000, equaling that of 2012. The highest weekly mean concentrations of PM10 at the three sites ranged from 10 – 12 µg m-3. Secondary inorganic constituents contributed the most to peak values at the Birkenes Observatory, indicating that long-range transported air pollution dominated the observed levels. For the sites Hurdal and Kårvatn, peak values appeared during the vegetative season and OC was the major fraction. Which source(s) making the largest contribution to these peak concentrations, is unknown. Source apportionment studies (Yttri et al., 2011a, b), using a combination of 14C and organic tracers, show that natural sources dominates OC in PM10 at Norwegian rural background sites in summer, with BSOA being the major source followed by PBAP, whereas wild fires occasionally make a noticeable contribution.
5.3 PM2.5 The annual mean mass concentration of PM2.5 ranged from 2.2 µg/m3 (Kårvatn) to 3.1 µg/m3 (Hurdal). The higher observed annual mean concentration of PM2.5 at Hurdal compared to Birkenes (2.9 µg/m3) and Kårvatn is consistent with the pattern seen during the 4 years of concurrent measurements at these 3 sites. The difference observed between Hurdal and Birkenes, however, is particularly small. At all sites, the summertime (April - September) mean concentration of PM2.5 was higher than the wintertime (October - March) mean; i.e., 1.3 (Birkenes), 1.5 (Hurdal) and 2.9 (Kårvatn) times higher. The annual mean concentration PM2.5 was within – 1SD of the long-term mean at Hurdal and Kårvatn, whereas it was slightly below this range at the Birkenes site. The annual mean concentration of PM2.5 observed at Birkenes for 2013, was the lowest value observed since the measurements started in 2001. The higher levels of PM2.5 observed at the Hurdal site compared to the Kårvatn site appears to be explained by higher levels of OC and SIA (i.e., SO4
2-, NO3-, NH4
+) (typically residing in the fine fraction of PM10) at the Hurdal site. While SIA is a result of gas to particle conversion during long-range transport, OC emissions might be both primary and secondary, and of both regional and local origin. Annual mean concentrations of OC (and EC) in PM2.5 were noticeable

Monitoring of long-range transported air pollutants in Norway, annual report 2013 | M-203
43
higher at the Hurdal site (0.76 µg C/m3) compared to that observed at the Birkenes Observatory (0.57 µg C/m3, see Chapter 4). For SIA, however, it was the other way around; i.e., the annual mean concentration of SIA at the Birkenes Observatory was 2.0 µg/m3 compared to 1.2 µg/m3 at the Hurdal site. One should notice that the measurements of SIA have no size cut off, but are estimated to be around PM10, see Chapter 3. The most apparent explanation for at least a part of this discrepancy is that a larger fraction of the NO3
- is associated with the coarse fraction of PM10 at the Birkenes Observatory, following from the reaction between gaseous HNO3 and NaCl. Differences in the OC to OM conversion factor, a factor used to account for other elements than carbon associated with OC, between the two sites could contribute as well, but remains speculative. The higher concentrations of PM2.5 in summer compared to winter at all sites is reflected by the secondary inorganic constituents, as well as by fine mode OC.
5.4 PM10-2.5 The annual mean mass concentration of PM10-2.5 ranged from 0.9 µg/m3 (Kårvatn) to 2.0 µg/m3 (Birkenes). The higher observed annual mean concentration of PM10-2.5 at Birkenes compared to Hurdal and Kårvatn is consistent with the pattern seen during the 4 years of concurrent measurements at these 3 sites. At all sites the summertime (April - September) mean concentration of PM10-2.5 was higher than the wintertime mean (October - March) (
Monitoring of long-range transported air pollutants in Norway, annual report 2013 | M-203
44
Table 5.2); 1.3 (Birkenes) 1.5 (Hurdal) and 2.3 (Kårvatn) times higher. The annual mean concentration of PM10-2.5 was within 1 SD of the long-term mean at Kårvatn, whereas it was slightly below this range at the Birkenes site. At Hurdal the annual mean concentration of PM10-2.5 for 2013 equaled the long term mean. The annual mean concentration of PM10-2.5 observed at Birkenes for 2013, was the lowest value observed since concurrent measurements of PM10 and PM2.5 started in 2001, equaling that of 2001. The higher levels at Birkenes compared to the two other sites is consistent both during summer and winter and is largely attributed to the presence of a stronger sea salt aerosol source, typically residing in the coarse fraction of PM10, as the Birkenes Observatory is situated only 20 km from the coastline. Indeed the, the annual mean concentration of the sum of the sea salt species sodium (Na+), chloride (Cl-) and magnesium (Mg2+) (1.1 µg/m3) was 3.5 times higher at the Birkenes Observatory compared to the sites Hurdal and Kårvatn (both 0.33 µg/m3). Coarse mode OC, which likely is dominated by PBAP, appears to be the other major source contributing to PM10-2.5 at the three sites. By assuming an OC to OM (organic matter) conversion factor of 1.75 (see Yttri et al., 2011a) for coarse mode OC, this source would amount to approximately 0.3 µg/m3 (Birkenes), 0.4 µg/m3 (Kårvatn) and 0.5 µg/m3 (Hurdal). Part of NO3
- can be present in the coarse fraction of PM10 following from the reaction between gaseous HNO3 and coarse mode NaCl. Hence, NO3
- could be another species contributing noticeably to PM10-2.5, particularly at Birkenes. The higher concentrations of PM10-2.5 in summer compared to winter at all sites is consistent with the seasonality of coarse mode OC, and thus PBAP. For sea salt species, however, concentrations are higher in winter compared to summer. Any potential seasonality of coarse mode nitrate and mineral dust are not known.
5.5 Relative contribution of PM2.5 and PM10-2.5 to PM10
PM2.5 was the major fraction of PM10 at all sites on an annual basis, accounting for 59% at Birkenes, 67% at Kårvatn, and 71% at Hurdal. This picture was consistent also as a function of season. Birkenes was the only site at which PM10-2.5 was the major fraction of PM10 on a monthly basis, i.e. for April and December, and was likely attributed to sea salt aerosol.
5.6 Trends for PM10, PM2.5 and PM10-2.5 The shorter time series for the sites Hurdal and Kårvatn (4 years) allow for an assessment of the trend of PM10, PM2.5 and PM10-2.5 for the Birkenes Observatory only. A significant downward trend in the observed annual mean concentration of PM10 was seen for the time period 2000 – 2013 at Birkenes, corresponding to a decrease of 0.12 µg/m3 yr-1 (+; 24%). For the same time period, a significant downward trend in the observed annual mean concentration of PM2.5 was observed, corresponding to a decrease of 0.13 µg/m3 yr-1 (+; 36%). A non-significant increase was observed for the annual mean concentration of PM10-2.5 for the actual time period, corresponding to an increase of 0.04 µg/m3 yr-1 (26%).

Monitoring of long-range transported air pollutants in Norway, annual report 2013 | M-203
45
5.7 Compliance with EU limit values and Air-Quality Guidelines for PM10 and PM2.5
The EU annual limit value for PM10 and PM2.5 (See Table 5.3 for EU limit values and Air-Quality Guidelines for PM10 and PM2.5) was far from being violated at any of the three sites; the highest annual mean concentrations observed being just in excess of 10% of the annual limit values. This was also the case when compared to the WHO Air-Quality Guidelines (AQG). The National Air-Quality Guidelines (Nasjonalt folkehelseinstitutt, 2013), revised in 2013, are even more stringent than the WHOs with respect to PM2.5, still, the highest annual mean observed for PM10 and PM2.5 in the Norwegian rural background environment in 2013 accounted for less than 25% and 40% of the PM10 and PM2.5 National AQG, respectively.

Monitoring of long-range transported air pollutants in Norway, annual report 2013 | M-203
46
Table 5.3: EU limit values and Air-Quality Guidelines for PM10 and PM2.5.
24-hours Annual
EU limit values PM10 50 µg/m3 (< 35 days yr-1) 40 µg/m3 PM2.5 25 µg/m3 WHO Air-Quality Guidelines PM10 50 µg/m3 20 µg/m3 PM2.5 25 µg/m3 (the 99th percentile) 10 µg/m3 National Air-Quality Guidelines PM10 30 µg/m3 20 µg/m3 PM2.5 15 µg/m3 8 µg/m3
24-hours mean mass concentrations of PM10 and PM2.5 at Birkenes were derived from high time-resolution measurements, showing maximum values of 30.8 µg/m3 for PM10 and 29.8 µg/m3 for PM2.5. Hence, no violation of the 24-hour EU limit value for PM10 was observed. When comparing the daily values of PM2.5 for 2013 with that of the WHO 24-hour AQG, no violation was observed. The 24-hour National AQG (Nasjonalt folkehelseinstitutt, 2013), revised in 2013, are more stringent than the WHO AQG, and for PM10 it was violated on two days (i.e., 5 – 6 March (30.1 µg m-3) and 26 - 27 of January (30.8 µg m-3)), but by a minimal margin only. For PM2.5, the 24-hour National AQG was violated on 8 days, all during the period January 26th to May 18th, with observed concentrations ranging from 15.1 – 29.8 µg m-3 Noticeable, violations of the National AQG all occurred during the first 5 months of the year, a period of the year that has been associated with an increased frequency of episodes with high concentrations of PM, associated with long-range transported pollution. Indeed, SIA were major constituents of PM on most of the days during which the National AQG were violated in 2013.
5.8 Chemical composition of particulate matter EC and OC are measured in the PM10 and PM2.5 size fraction at the Birkenes Observatory and at the Hurdal and Kårvatn sites, whereas the major inorganic anions (SO4
2-, NO3-, Cl-) and cations
(Ca2+, Mg2+, K+, Na+ NH4+) are obtained from open filter face samplers with a cut-off size in
excess of 10 µm equivalent aerodynamic diameter (EAD). However, most of these species reside within the PM10 fraction, and even within PM2.5, such as the secondary inorganic aerosol (SIA) constituents (SO4
2-, NO3-, NH4
+). Occasionally, sea salt particles larger than PM10 could be collected, i.e., during stormy weather conditions at the Birkenes Observatory, at a southerly wind direction. In order to attempt a mass closure for the particulate mass concentration, the data obtained from the monitoring program appear to be well suited for PM10, except that species representing mineral dust are not included. Mass closure of PM2.5 and PM10-2.5 would include a larger degree of uncertainty, as default assumptions would be made according the size distribution of the inorganic species analyzed, of which the largest uncertainty would be associated with that of NO3
-. The chemical mass composition of PM10 is shown in Figure 5.2. Based on annual means, the speciated mass accounted for 82% of the annual mean concentration of PM10 at the Birkenes Observatory in 2013. SO4
2- accounted for 15% of PM10,
Monitoring of long-range transported air pollutants in Norway, annual report 2013 | M-203
47
which is, within the long-term mean (18 ± 3%). A significant downward trend was observed concerning SO4
2- relative contribution to PM10 for the time period 2001 – 2013, corresponding to a decrease of 0.62 % yr-1 (*; 37%). A substantial decrease in the relative contribution of NO3
- (19%) to PM10 was observed for 2013 compared to the previous year (28%). Still, it was the second highest contribution observed for NO3
- for the period 2001 – 2013, and it made NO3
- the most abundant single species contributing to PM10 in 2013. A significant upward trend was observed for NO3
- concerning its relative contribution to PM10 for the time period 2001 – 2013, corresponding to an increase of 0.6 % yr-1 (*; 74%). The relative contribution of NH4
+ to PM10 (6.1%) was within the long-term mean (5.7 ± 1.7%). A substantial 23% contribution to PM10 was observed for the sea-salt species (Na+, Cl-, Mg2+), which is the highest relative contribution observed for the period 2001 – 2013, and well above the long-term mean of 14 ± 4%. A significant upward trend was observed for the sea-salt species with respect to their relative contribution to PM10 for the time period 2001 – 2013, corresponding to an increase of 0.64 % yr-1 (*; 88%). OC accounted for 16% of PM10, which is within the long term mean for the period 2001 – 2013 (15 ± 2%). By applying an OC to OM conversion factor of 1.7 (see Yttri et al., 2007a), the relative contribution of OM to PM10 was 26%. The relative contribution of EC to PM10 (1.8%) was within the long-term mean (1.9 ± 0.3%). By applying a conversion factor of 1.1, the relative contribution of EC to PM10 was 2.0%. When accounting for OM and EC x 1.1, instead of OC and EC, in the mass closure of PM10, the speciated mass accounted for 93% of PM10. Based on annual means, the speciated mass accounted for 61% of the annual mean concentration of PM10 at the Hurdal site in 2013. SO4
2- and NO3- both accounted for 11% of
PM10, thus sharing the position of being the most abundant single species contributing to PM10 in 2013. The OC fraction dominated PM10 by a 23% contribution, which increased to a substantial 39% when applying an OC to OM conversion factor of 1.7. The contribution of the sea salt species (7.1%), NH4
+ (4.3%) and EC (3.0%), were all less than 10%. The relative contribution of EC to PM10 increased to 3.3% when applying a conversion factor of 1.1. When accounting for OM and EC x 1.1, instead of OC and EC, in the mass closure of PM10, the speciated mass accounted for 77% PM10.

Monitoring of long-range transported air pollutants in Norway, annual report 2013 | M-203
48
a)
b)
c)
Figure 5.2: Annual mean chemical composition of PM10 at the Birkenes Observatory a), the Hurdal site b) and the
Kårvatn site c) for 2013. The annual mean mass concentration for PM10 in 2013 was 4.9 µg/m3 at the Birkenes
Observatory, 4.6 µg/m3 at the Hurdal site, and 3.1 µg/m3 at the Kårvatn site.
SO42‐
15%
NO3‐
19%
NH4+
6.1%Na+, Cl‐, Mg2+
23%
Ca2+, K+
1.3%
OC 16%
EC1.8%
Unknown 18%
SO42‐
11%
NO3‐
11%
NH4+
4.3%
Na+, Cl‐, Mg2+
7.1%
Ca2+, K+
1.3%
OC 23%
EC3.0%
Unknown 39%
SO42‐
9.1%
NO3‐
12%
NH4+
3.9%
Na+, Cl‐, Mg2+
11%
Ca2+, K+
1.2%
OC24%
EC2.1%
Unknown37%
Monitoring of long-range transported air pollutants in Norway, annual report 2013 | M-203
49
Based on annual means, the speciated mass accounted for 63% of the annual mean concentration of PM10 at the Kårvatn site in 2013. NO3
- accounted for 12% of PM10, thus being the most abundant single species contributing to PM10 in 2013, followed by SO4
2- (9.1%). The OC fraction dominated PM10 by a 24% contribution, which increased to a substantial 41% when applying an OC to OM conversion factor of 1.7. The contribution of the sea salt species was 11%, whereas NH4
+ (3.9%), and EC (1.9%) accounted for less than 4%. The relative contribution of EC to PM10 increased to 2.1% when applying a conversion factor of 1.1. When accounting for OM and EC x 1.1, instead of OC and EC, in the mass closure of PM10, the speciated mass accounted for 80% PM10. The major features separating the relative chemical composition of PM10 at the three sites was the noticeably larger contribution of OC at the sites Hurdal (23%) and Kårvatn (24%), compared to the Birkenes Observatory (16%). Further, the sea salt species accounted for a substantial 23% at the Birkenes Observatory, whereas they constituted no more than 11% (Kårvatn) and 7.1% (Hurdal) at the two other sites. The higher relative contribution of EC at the Hurdal site (3.0%) compared to Kårvatn (1.9%) and Birkenes (1.8%) is also worth noting. The relative contribution of SIA to PM10 was noticeable higher at the Birkenes Observatory (40%) compared to Hurdal (27%) and Kårvatn (25%) sites.

Monitoring of long-range transported air pollutants in Norway, annual report 2013 | M-203
50
6. Ground-level ozone
Ozone in the troposphere originates from photo-chemical reactions between volatile organic compounds and nitrogen oxides under the influence of solar radiation, as well as from the transport of stratospheric ozone down into the atmosphere. Volatile organic compounds are emitted from both anthropogenic sources such as road and ship traffic, leakage of natural gas, use of solvent and chemicals etc. as well as from biogenic sources (trees and plants). Nitrogen oxides are mainly emitted from anthropogenic sources such as e.g. traffic and power plants although a small fraction is emitted microbiological activity in soils and by lightning. Thus, tropospheric ozone is the sum of what is produced by both natural and man-made processes. Once formed, tropospheric ozone is only slowly degraded by chemical reactions with OH, HO2 and NO2 (lifetime of the order of several weeks). Surface dry deposition and uptake in vegetation is, however, an effective loss mechanism for ozone. Ozone dry deposition is determined by the local topography and land use and could be important for the surface concentrations observed at some of the sites, particularly at the inland stations. This influence will be most apparent during nights with stable atmospheric conditions while the daytime values will be less affected due to a deeper atmospheric mixing layer. Ozone has negative impacts on health, vegetation and materials. The health effects regards particularly asthmatics and people with chronic respiratory disorders. Effects on the vegetation regards particularly crops but also forests and natural vegetation. Prolonged exposure have shown negative impacts on forests. As opposed to other pollutants, the baseline level of ozone is close to the limits for effects on human health and vegetation. Materials such as rubber and other polymer compounds can also be damaged by ozone.
6.1 Monitoring network Measurements of ozone has been going on in Norway since 1975, first in Telemark and from 1977 also around the Oslo fjord and in subsequent years extended to the whole country. EU's air quality directive (AQD) (EU, 2008: Directive 2008/50/EC) which is implemented in Norwegian legislation contains the thresholds and objectives regarding ozone levels and the requirements as to the number of monitoring sites. According to the directive, the country should be divided into a number of zones, and the zones presently used in Norway are shown in Figure 1.1. The stations in the individual zones as of 2013 are indicated in the map and the details regarding the zone characteristics are given in Table 6.1. As seen from Table 6.1 there is a small shortage of stations for ozone and VOC relative to the directive’s requirements. The ozone monitoring network in 2013 consisted of eight stations. Seven of these were operated by NILU, while the Porsgrunn municipality was operating the station at Haukenes. The station at Haukenes can be classified as suburban while the rest are rural background stations which implies that the sites are not affected by local emissions. The data from Haukenes was reported to NILU and checked here. In addition there were a few urban sites relevant for the AQD, but not presented in this work, but indicated in Table 6.1.

Monitoring of long-range transported air pollutants in Norway, annual report 2013 | M-203
51
Table 6.2 shows the monitoring sites and data capture for 2013. The measuring method and principles are given in Annex 3. Except for Birkenes which experienced extended periods with technical problems, the data capture was 95% or higher at the stations.
Table 6.1: The Norwegian zones and the requirements as to the number of monitoring sites based on EU’s ozone
directive. The situation in 2013 is also shown.
Zone Region Type Area (km2)Population
(1000) Ozone 1) NO2 1) VOC 1) Stations
1 Greater Oslo Urban/suburban 1030 2 (3) 1 0 (1) Lommedalen2)
Grønland2)
2 Bergen Urban/suburban 270 1 (1) 1 Rådhuset2)
3 Trondheim Urban/suburban 180 0 (0)
4 Østlandet Rural 110 000 1800 4 (4) 3
Prestebakke
Hurdal
Haukenes
Birkenes
5
Rogaland,
Hordaland, Sogn-
og Fjordane
Rural 43 000 790 1 (2) 0 Sandve
6
Møre og Romsdal,
S- og N-
Trøndelag,
Nordland
Rural 94 000 760 2 (2) 2 Kårvatn
Tustervatn
7 Troms, Finnmark Rural 74 000 230 0 (1)
Whole country Rural
background 385 000 7 (7) 4
Prestebakke
Hurdal
Birkenes
Sandve
Kårvatn
Tustervatn
Zeppelin
Total 18 (20) 11 (10) 0 (1) 1) The present number of stations with the EU directive’s requirements in brackets. 2) Urban stations not discussed in this report
Table 6.2: Ozone monitoring sites and data capture based on hourly values in 2013.
St.nr. Station name Period Data capture
NO0043 Prestebakke 01.01.13 - 31.12.13 99 %
NO0056 Hurdal 01.01.13 - 31.12.13 100 %
NO0489 Haukenes 01.01.13 - 31.12.13 99 %
NO0002 Birkenes II 01.01.13 - 31.12.13 81 %
NO0052 Sandve 01.01.13 - 31.12.13 95 %
NO0039 Kårvatn 01.01.13 - 31.12.13 99 %
NO0015 Tustervatn 01.01.13 - 31.12.13 99 %
NO0042 Zeppelin 01.01.13 - 31.12.13 100 %

Monitoring of long-range transported air pollutants in Norway, annual report 2013 | M-203
52
6.2 Ground-level ozone in Norway In the scientific literature one often distinguishes between the “background” and the “baseline” level (e.g. Oltmans et al., 2013), in which the former refers to the pre-historic levels in an unpolluted atmosphere whereas the latter refers to the present levels in the northern hemisphere, far away from any emission areas. The northern hemispheric ozone baseline level varies between 40 and 80 g/m3 throughout the year and is typically highest in spring. On top of this baseline level, episodes with long-range transport of more polluted air masses to Norway increase the ozone levels regularly during the summer half year. During winter the situation is the opposite, i.e. the transport of polluted air masses from the European continent leads to reduced ozone levels due to the titration reaction O3 + NO → NO2. This difference between winter and summer is explained by the intensity of the solar UV-radiation which leads to a fast photochemistry in summer and a corresponding slow and inefficient photochemistry in winter. The ozone levels at a monitoring site is also influenced by local effects near the station such as dry deposition to the surface and episodes of local NOx emissions. In general, the Norwegian rural ozone stations are not much influenced by nearby emissions, but occasional short-term episodes of ozone degradation due to local NOx sources cannot be ruled out totally. These local effects will result in a reduction in ozone and thus an underestimation of the regional ozone exposure. Hence, in summary, the level of ozone is the net result of a hemispheric, a regional and a local component. In Norway summertime episodes of elevated ozone are often associated with a high pressure located over the European continent, typically over Central or Eastern parts, setting up a southerly or southwesterly transport of warm, polluted air masses to the country. Ozone episodes are typically a fair-weather phenomenon associated with hot and sunny days. Furthermore, the highest ozone levels are often experienced just at the end of such fair-weather periods which is explained by an approaching cold front setting up an effective transport of photochemically processed air masses from the continent.
6.3 Norwegian ozone levels in 2013 The seasonal cycles in ground-level ozone in 2013 are shown in Figure 6.2 together with the mean seasonal cycles for the period 2000-2012 for each site as a reference. These figures give the 14 days centred running mean concentrations. It should be noted that for Birkenes the time series are not directly comparable since the 2013 data are based on measurements from the new observatory while the 2000-2012 data are based on measurements at the old location which gave systematically lower levels due to stronger surface dry deposition. These time series show that mean ozone levels in 2013 peaked relative to the 2000-2012 mean in March-April at most sites in S-Norway; Prestebakke, Hurdal, Haukenes, Birkenes and Kårvatn. The 14 days running mean values were close to 100 µg/m3 at several sites in this period. Most of these sites also show a peak in late July, most noticeable at Haukenes, Sandve and Kårvatn. The data from sites in the north, Tustervatn and Zeppelin Mountain, indicate a seasonal cycle in 2013 close to the 2000-2012 mean levels without any strong episodes.

Monitoring of long-range transported air pollutants in Norway, annual report 2013 | M-203
53
The hourly annual maximum values for each of the stations are given in Table 6.4. The dates of the occurrence of the peak values range from 13 April (Haukenes) to 2 August (Sandve). This is somewhat unusual since the peak values are most often observed during the same episodes and normally in May-June. Furthermore, the highest observed level in 2013 was very low; 124 µg/m3 (Tustervatn 17 May), which is the lowest annual maximum value observed since the monitoring started in Norway. The low peak concentrations and the few exceedances (see below) in 2013 is in line with the summer ozone data from North Europe as reported by EEA (EEA, 2014). According to that report the summer in Europe was characterised by a very low incidence of exceedances prior to mid-June and after August, but with frequent incidences in Central and South Europe during July and the first days of August.

Monitoring of long-range transported air pollutants in Norway, annual report 2013 | M-203
54
Figure 6.1: The 14 days’ running mean ozone concentrations in 2013 (red) together with the corresponding mean
concentrations based on all years 2000-2012 (blue).
In the summer season the ozone concentrations at many stations vary systematically over the day, particularly on days without strong winds. The concentration is low during stable night-time conditions, e.g. when inversions develop, and then rises quickly in the morning when the

Monitoring of long-range transported air pollutants in Norway, annual report 2013 | M-203
55
heating of the ground leads to the ozone rich air being mixed down. The highest levels are typically observed in the afternoon. This diurnal cycle is the result of ozone deposition to the ground combined with the daily cycle in vertical atmospheric exchange. The mean diurnal cycle in ozone in during April-September 2013 are shown for three selected sites in Figure 6.2. The strongest cycle is seen at Kårvatn, a valley inland station with a strong cycle in the height of the atmospheric mixed layer. A less pronounced ozone cycle is seen at Sandve, a coastal station where night-time inversions as less frequent. In contrast to this, the ozone values at the Zeppelin Mountain shows no diurnal cycle.
Figure 6.2: The mean diurnal cycle in ozone at three of the monitoring sites; Sandve, Kårvatn and Zeppelin Mountain
during April-September 2013.
6.4 Exceedances of the limit values for protection of human health
Ground-level ozone can cause health problems, and the concentration level should not exceed certain limit values. Various air quality criteria for ozone for the protection of health are given in Table 6.3. Norway has implemented EU’s air quality directive and information and warning bulletins are broadcasted to the public in case of exceedance of the information threshold (180 g/m3) and alert threshold (240 g/m3), respectively. EU's third daughter directive was derived in 2002 (EU, 2002), and in 2008 a new air quality directive was adopted (EU, 2008). WHO has also defined certain air quality guidelines and provided a global update of these levels including a new guideline for ground-level ozone in 2005 (WHO, 2006). In 2013 a new set of national air quality guidelines were defined for ozone and other species. The national and the WHO guidelines as well as the EU directive values are given in Table 6.3.

Monitoring of long-range transported air pollutants in Norway, annual report 2013 | M-203
56
Table 6.3: Limit values for ground-level ozone for the protection of human health.
Value (µg/m3)
Averaging time (hours) Ref Description
180 1 EU (2008) EU’s information threshold
240 1 EU (2008) EU’s alert threshold
120 81) EU (2008) EU’s target value. 8-hour mean value not to be exceeded on more than 25 days per year averaged over 3 years. To be fulfilled by 1.1.2010
120 81) EU (2008) EU’s long-term objective.
100 81) WHO (2006) WHO’s air quality guideline (global update 2005)
100 1 FHI (2013) National air quality guideline (update 2013)
80 81 FHI (2013) National air quality guideline (update 2013)
1) The highest 8-hour running mean value for each day calculated such that the 8-hour periods are
assigned to the day on which the period ends.
The exceedances of the limit values for health are given in Table 6.4. The table shows the number of days with exceedance of WHO’s air quality guideline of 100 g/m3 and EU’s long-term objective of 120 g/m3. The number of hours with exceedance of EU’s information threshold of 180 g/m3 is also given as well as the annual hourly max value together with the date(s) that value occurred. The total number of hours with ozone data and days with at least 75 % data capture through the year is given for reference. The exceedances based on the 8-hour mean values were only calculated for days with at least 75 % data capture. Ozone concentrations above EU’s alert threshold (240 g/m3) are never experienced in Norway and values above the information threshold (180 g/m3) is experienced only occasionally. The limit was not exceeded in 2013. EU’s long-term objective was exceeded on two days at Tustervatn in 2013 while WHO’s air quality guideline was exceeded at all sites on the Norwegian mainland, most frequently at Kårvatn with 31 days of exceedances.
Table 6.4: For all sites in 2013 the number of hours with data and the number of days with at least 75% data
capture together with the exceedances of health related air quality limits; national guidelines, WHO guideline and
EU’s limit values as given in Table 6.3 as well as the annual maximum and the date when it occurred.
National guidelines WHO EU directive
Station Hours
Days Days Hours Days Days Hours Max. hourly
value
(g/m3)
Date >75%
8h >
80 µg/m3
1h >
100 µg/m3
8h >
100 µg/m3
8h >
120 µg/m3
1h >
180 µg/m3
Prestebakke 8703 365 118 177 14 0 0 118 08.05.13
Hurdal 8731 365 82 123 17 0 0 116 26.07.13
Haukenes 8625 363 135 238 25 0 0 117 13.04.13
Birkenes II 6946 292 109 154 13 0 0 120 07.07.13
Sandve 8325 352 132 140 15 0 0 121 02.08.13
Kårvatn 8666 364 122 371 31 0 0 120 14.04.13
Tustervatn 8684 365 134 246 18 2 0 124 17.05.13
Zeppelin 8648 364 87 0 0 0 0 100 24.04.13

Monitoring of long-range transported air pollutants in Norway, annual report 2013 | M-203
57
EU’s target value for the protection of human health are met in Norway with a very good margin. The long-term objective (and thereby also WHO’s and Norwegian guidelines) is on the other hand exceeded to a variable extent every year. The EU directive does not give any deadline to achieve this goal. In 2013 it was broken only at Tustervatn, and in 2012 at Birkenes and Sandve. In 2011, however, all stations except Tustervatn exceeded this limit. This reflects that the ozone levels vary strongly from year to year which is also indicated by Figure 6.3, showing the time trend of the number of days with exceedance of the 8-hour mean value of 120 g/m3. Table 6.5 gives the annual peak values and number of days with exceedance from 2001 to 2013. The main reason for the inter-annual variations is variations in the large scale weather conditions from one year to another. Over time, long-term changes in the European emissions of NOx and VOC as well as gradual trends in the hemispheric baseline level of ozone will be important.
Table 6.5: The maximum hourly ozone value each year and the number of days exceeding EU’s long-term objective.
2001 2002 2003 2004 2005 2006 2007 2008 2009 2010 2011 2012 2013
Annual hourly max. (µg/m3)
144 151 162 150 144 186 139 160 142 145 168 130 124
Number of dates with exceedance of EU’s long-term objective of 120 µg/m3 a)
5 18 15 21 7 28 8 16 9 3 12 2 2
a) Running 8-h mean
EU’s long-term objective for the protection of health is the governing air quality requirement for ozone in Norway. The directive requires the countries to sustain monitoring stations in all air quality zones where the long-term objective has been broken in the last five years. As shown in Figure 6.3, this limit value has been exceeded at all stations the last five years. The updated national guidelines (FHI, 2013) are even stricter than the WHO guideline (Table 6.3) and both the 80 µg/m3 (8-h mean) and 100 µg/m3 (1-h mean) are exceeded for long periods of the year in the whole country (except on Spitsbergen) as shown by Table 6.4.
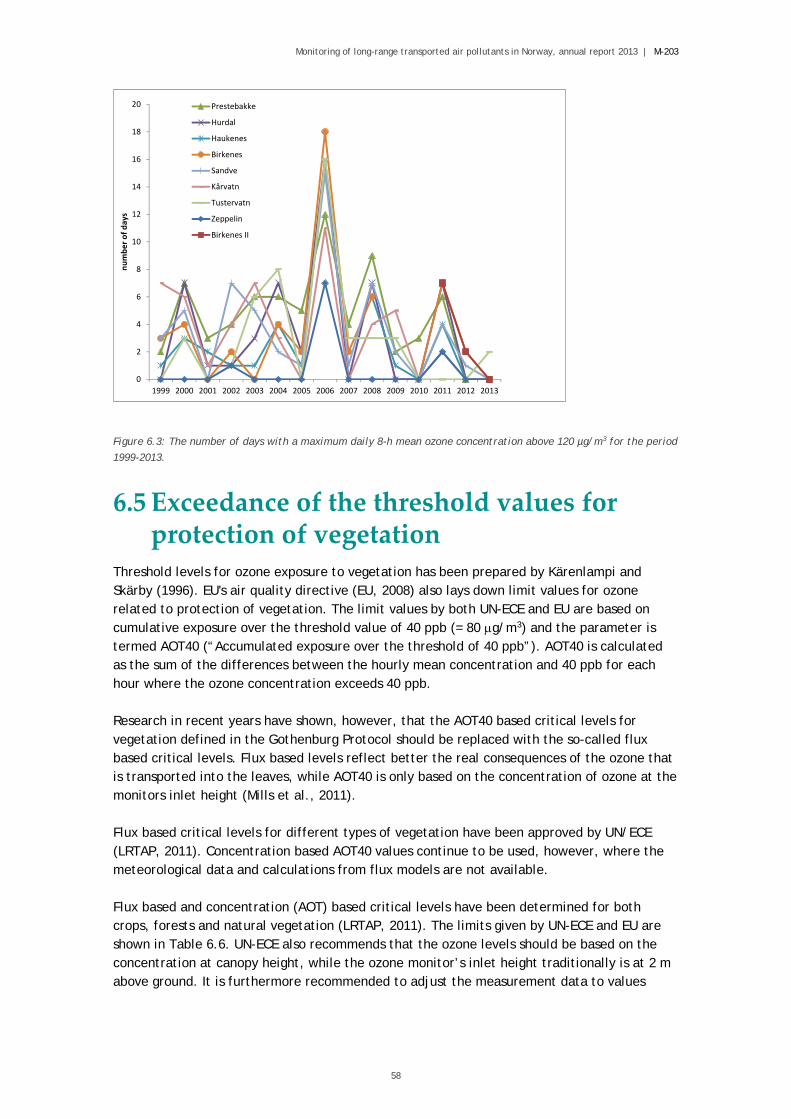
Monitoring of long-range transported air pollutants in Norway, annual report 2013 | M-203
58
Figure 6.3: The number of days with a maximum daily 8-h mean ozone concentration above 120 µg/m3 for the period
1999-2013.
6.5 Exceedance of the threshold values for protection of vegetation
Threshold levels for ozone exposure to vegetation has been prepared by Kärenlampi and Skärby (1996). EU's air quality directive (EU, 2008) also lays down limit values for ozone related to protection of vegetation. The limit values by both UN-ECE and EU are based on cumulative exposure over the threshold value of 40 ppb (= 80 g/m3) and the parameter is termed AOT40 (“Accumulated exposure over the threshold of 40 ppb”). AOT40 is calculated as the sum of the differences between the hourly mean concentration and 40 ppb for each hour where the ozone concentration exceeds 40 ppb. Research in recent years have shown, however, that the AOT40 based critical levels for vegetation defined in the Gothenburg Protocol should be replaced with the so-called flux based critical levels. Flux based levels reflect better the real consequences of the ozone that is transported into the leaves, while AOT40 is only based on the concentration of ozone at the monitors inlet height (Mills et al., 2011). Flux based critical levels for different types of vegetation have been approved by UN/ECE (LRTAP, 2011). Concentration based AOT40 values continue to be used, however, where the meteorological data and calculations from flux models are not available. Flux based and concentration (AOT) based critical levels have been determined for both crops, forests and natural vegetation (LRTAP, 2011). The limits given by UN-ECE and EU are shown in Table 6.6. UN-ECE also recommends that the ozone levels should be based on the concentration at canopy height, while the ozone monitor’s inlet height traditionally is at 2 m above ground. It is furthermore recommended to adjust the measurement data to values
0
2
4
6
8
10
12
14
16
18
20
1999 2000 2001 2002 2003 2004 2005 2006 2007 2008 2009 2010 2011 2012 2013
number of days
Prestebakke
Hurdal
Haukenes
Birkenes
Sandve
Kårvatn
Tustervatn
Zeppelin
Birkenes II

Monitoring of long-range transported air pollutants in Norway, annual report 2013 | M-203
59
relevant for the canopy height by assumptions about the vertical distribution of ozone near the ground for different land use categories. This report only presents AOT40 values based on the actual measurements of ozone. EU's air quality directive (EU, 2008) includes a 3-month’s target value for AOT40 of 9 000 ppb hours (May-July) averaged over 5 years and a long-term objective of 3 000 ppb hours for the protection of vegetation. As opposed to UN-ECE’s limit values the EU directive does not contain separate threshold values for crops and forests. Table 6.6 shows the various limit values for protection of vegetation.
Table 6.6: Limit values for the protection of vegetation from ozone exposure.
AOT40 (ppb hours) Period Reference Comment
3000 15 May - 15 Aug UN-ECE (1996) Growing season for agricultural crops adjusted to Nordic conditions. 1)
5000 1 April - 1 Oct UN-ECE (1996) Growing season for forests 1,2) 9000 1 May – 1 Aug EU (2008) EU’s target value for vegetation 3) 3000 1 May - 1 Aug EU (2008) EU’s long-term objective for vegetation 3)
1) ECE’s AOT values should be based on the hours with global incoming radiation > 50 W/m2
2) Changed from 10 000 to 5000 ppb hours according to the Mapping manual (Mills et al., 2011)
3) EU’s AOT values should be based on the period 08-20 CET
Table 6.7 shows the 3 months AOT40 values for daylight hours (global radiation > 50 W/m2) for the period 15 May - 15 August (referring to Table 6.6). The limit value for agricultural crops of 3000 ppb hours was not exceeded at any of the sites in 2013. The highest value occurred at Birkenes with 1425 ppb hours. Table 6.8 shows the 6 months AOT40 values for daylight hours (April-September). The limit value of 5000 ppb hours for forests was not exceeded in 2013. The highest value occurred at Kårvatn with 4361 ppb hours.
Table 6.7: Data capture and 3-month’s AOT40 values for agricultural crops for the period 15 May - 15 August 2013
(unit: ppb hours).
Station Data capture
(%) AOT40
(corrected for data capture)
Prestebakke 99 1417 Hurdal 99 683 Haukenes 99 1292
Birkenes 99 1425 Sandve 99 1292 Kårvatn 98 1126
Tustervatn 98 1103 Zeppelin Mountain. 95 100
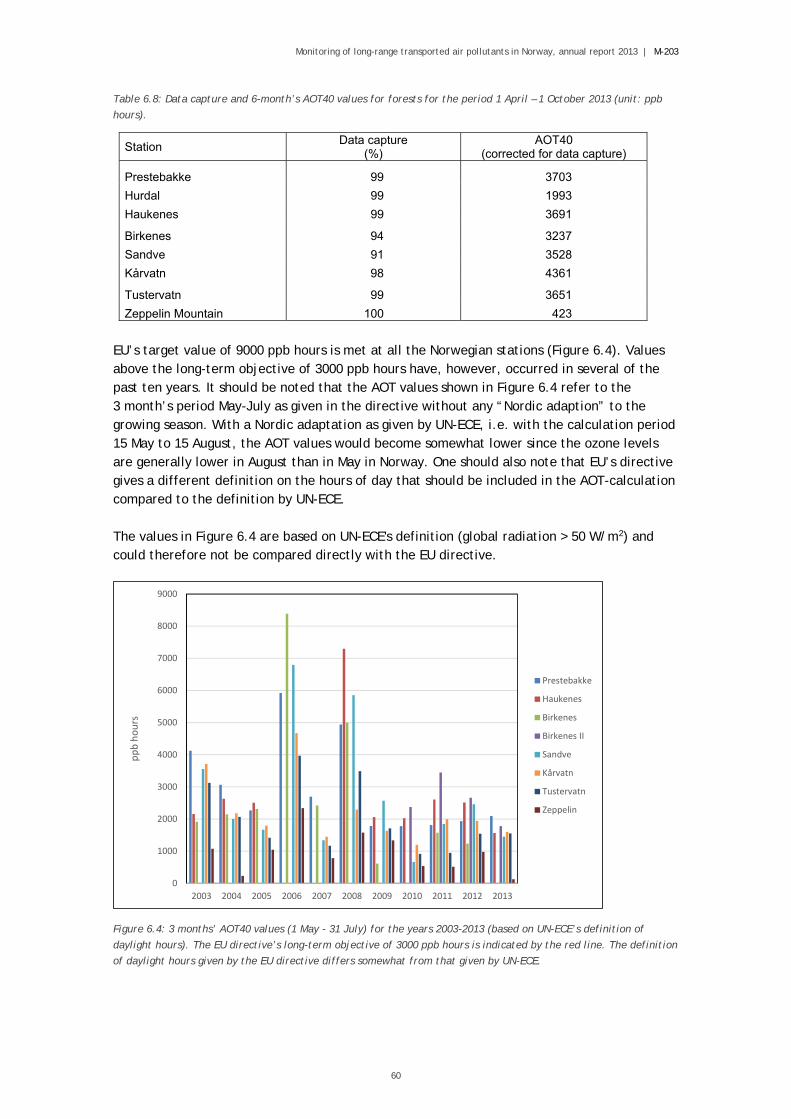
Monitoring of long-range transported air pollutants in Norway, annual report 2013 | M-203
60
Table 6.8: Data capture and 6-month’s AOT40 values for forests for the period 1 April – 1 October 2013 (unit: ppb
hours).
Station Data capture
(%) AOT40
(corrected for data capture)
Prestebakke 99 3703
Hurdal 99 1993
Haukenes 99 3691
Birkenes 94 3237
Sandve 91 3528
Kårvatn 98 4361
Tustervatn 99 3651
Zeppelin Mountain 100 423
EU’s target value of 9000 ppb hours is met at all the Norwegian stations (Figure 6.4). Values above the long-term objective of 3000 ppb hours have, however, occurred in several of the past ten years. It should be noted that the AOT values shown in Figure 6.4 refer to the 3 month’s period May-July as given in the directive without any “Nordic adaption” to the growing season. With a Nordic adaptation as given by UN-ECE, i.e. with the calculation period 15 May to 15 August, the AOT values would become somewhat lower since the ozone levels are generally lower in August than in May in Norway. One should also note that EU’s directive gives a different definition on the hours of day that should be included in the AOT-calculation compared to the definition by UN-ECE. The values in Figure 6.4 are based on UN-ECE's definition (global radiation > 50 W/m2) and could therefore not be compared directly with the EU directive.
Figure 6.4: 3 months’ AOT40 values (1 May - 31 July) for the years 2003-2013 (based on UN-ECE’s definition of
daylight hours). The EU directive’s long-term objective of 3000 ppb hours is indicated by the red line. The definition
of daylight hours given by the EU directive differs somewhat from that given by UN-ECE.
0
1000
2000
3000
4000
5000
6000
7000
8000
9000
2003 2004 2005 2006 2007 2008 2009 2010 2011 2012 2013
ppb hours
Prestebakke
Haukenes
Birkenes
Birkenes II
Sandve
Kårvatn
Tustervatn
Zeppelin

Monitoring of long-range transported air pollutants in Norway, annual report 2013 | M-203
61
7. References
Castillejos, M., Borja-Aburto, V.H., Dockery, D.W., Gold, D.R., Loomis, D. (2000) Airborne coarse particles and mortality. Inhal. Toxicol., 12, 61-72.
Cavalli, F., Viana, M., Yttri, K.E., Genberg, J., Putaud, J.-P. (2010) Toward a standardised thermal-optical protocol for measuring atmospheric organic and elemental carbon: the EUSAAR protocol. Atmos. Meas. Tech., 3, 79–89, doi:10.5194/amt-3-79-2010.
Dockery, D.W., Pope, C.A., Xu, X.P., Spengler, J.D., Ware, J.H., Fay, M.E., Ferris, B.G., Speizer, F.E. (1993) An association between air-pollution and mortality in 6 United-States cities. New Engl. J. Med., 329, 1753-1759.
Dollard, G.J., Vitols, V. (1980) Wind tunnel studies of dry deposition of SO2 and H2SO4 aerosols. In: Internat. conf. on impact of acid precipitation. Sandefjord 1980. Ed. by D. Drabløs and A. Tollan. Oslo-Ås (SNSF-prosjektet), pp. 108-109.
Donaldson, K., Stone, V., Seaton A., MacNee, W. (2001) Ambient particle inhalation and the cardiovascular system: Potential mechanisms. Environ. Health Perspect., 109, 523-527.
Dovland, H., Eliassen, A. (1976) Dry deposition on snow surface. Atmos. Environ., 10, 783-785.
EEA (2014) Air pollution by ozone across Europe during summer 2013. Overview of exceedances of EC ozone threshold values: April–September 2013. København, European Environment Agency (EEA Technical report 3/2014).
EMEP/CCC (2014) Manual for sampling and chemical analysis. Kjeller, Norwegian Institute for Air Research (EMEP/CCC Report 1/95) (Last rev. February 2014). URL: http://www.nilu.no/projects/ccc/manual/index.html.
EU (2002) Directive 2002/3/EC of the European Parliament and of the Council of 12 February 2002 relation to ozone in ambient air. Off. J. Eur. Com., L 067, 09/03/2002, 14-30.
EU (2008) Directive 2008/50/EC of the European Parliament and of the Council of 21 May 2008 on ambient air quality and cleaner air for Europe. Off. J. Eur. Com., L 141, 11/06/2008, 1-44.
Ferm, M. (1988) Measurements of gaseous and particulate NH3 and HNO3 at a background station: interpretation of the particle composition from the gas phase concentrations. Proceeding from Cost 611 Workshop Villefrance sur Mer, 3-4 May 1988, pp.4-13.
Fowler, D. (1980) Removal of sulphur and nitrogen compounds from the atmosphere in rain and by dry deposition. In: Internat. conf. on impact of acid precipitation. Sandefjord 1980. Ed. by D. Drabløs and A. Tollan. Oslo-Ås (SNSF-prosjektet), pp. 22-32.
Garland, J.A. (1978) Dry and wet removal of sulfur from the atmosphere. Atmos. Environ., 12, 349-362.
Gilbert, R.O. (1987) Statistical methods for environmental pollution monitoring. New York, Van Nostrand Reinhold Co.
Hellsten, S., van Loon, M., Tarrason, L., Vestreng, V., Tørseth, K., Kindbom, K., Aas, W. (2007) Base cations deposition in Europe. Stockholm, Swedish Environmental Research Institute (IVL Report B1722).

Monitoring of long-range transported air pollutants in Norway, annual report 2013 | M-203
62
Hicks, B.B., Baldocchi, D.D., Meyers, T.P., Hosker Jr., R.P., Matt, D.R. (1987) A preliminary multiple resistance routine for deriving dry deposition velocities from measured quantities. Water, Air, Soil Pollut., 36, 311-329.
Kärenlampi, L., Skärby, L. (Eds) (1996) Critical levels for ozone in Europe: testing and finalising the concepts. UNECE Workshop Report. University of Kuopio, Department of Ecology and Environmental Science.
Klima- og forurensningstilsynet (2010) Overvåking av langtransportert forurenset luft og nedbør. Atmosfærisk tilførsel, 2009. Oslo (Statlig program for forurensningsovervåking. Rapport 1074/2010) (in Norwegian).
Klima- og forurensningstilsynet (2011) Overvåking av langtransportert forurenset luft og nedbør. Atmosfærisk tilførsel, 2010. Oslo (Statlig program for forurensningsovervåking. Rapport 1099/2011) (in Norwegian).
Klima- og forurensningstilsynet (2012) Overvåking av langtransportert forurenset luft og nedbør. Atmosfæriske tilførsler, 2011. Oslo (Statlig program for forurensningsovervåking. Rapport 1126/2012) (in Norwegian).
Klima- og forurensningstilsynet/Miljødirektoratet (2013) Overvåking av langtransportert forurenset luft og nedbør. Atmosfæriske tilførsler, 2012. Oslo (Statlig program for forurensningsovervåking. Rapport M 3/2012) (in Norwegian).
LRTAP (2011) Mapping critical levels for vegetation. In: Manual on methodologies and criteria for modelling and mapping critical loads and levels and air pollution effects, risks and trend, chapter 3. URL: http://icpvegetation.ceh.ac.uk/manuals/mapping_manual.html.
Met.no (2014) Været i Norge. Klimatologisk oversikt året 2013. Oslo, Meteorologisk institutt (met.no info 13/2013).
Mills, G., Pleijel, H., Braun, S., Büker, P., Bermejo, V., Calvo, E., Danielsson, H., Emberson, L., González Fernández, I., Grünhage L., Harmens, H., Hayes, F., Karlsson, P.-E., Simpson, D. (2011) New stomatal flux-based critical levels for ozone effects on vegetation. Atmos. Environ., 45, 5064-5068. doi:10.1016/j.atmosenv.2011.06.009.
Nasjonalt folkehelseinstitutt (2013) Luftkvalitetskriterier. Virkninger av luftforurensning på helse. Oslo (Folkehelseinstituttet, rapport 2013:9) (in Norwegian).
Oltmans, S.J., Lefohn, A.S., Shadwick, D., Harris, J.M., Scheel, H.E., Galbally, I., Tarasick, D.W., Johnson, B.J., Bunke, E.-G., Claude, H., Zeng, H., Nichol, S., Schmidlin, F., Davies, J., Cuevas, E., Redondas, A., Naoe, H., Nakano, T., Kawasato, T. (2013) Recent tropospheric ozone changes – A pattern dominated by slow or no growth. Atmos. Environ., 67, 331–351, doi:10.1016/j.atmosenv.2012.10.057.
Ostro, B.D., Broadwin, R., Lipsett, M.J. (2000) Coarse and fine particles and daily mortality in the Coachella Valley, California: a follow-up study. J. Expo. Anal. Environ. Epidemiol., 10, 412-419.
Salmi, T., Määttä, A., Anttila, P., Ruoho-Airola, T., Amnell, T. (2002) Detecting trends of annual values of atmospheric pollutants by the Mann-Kendall test and Sen’s slope estimates – the Excel template application MAKESENS. Helsinki, Finnish Meteorological Institute (Report code FMI-AQ-31).
Schwartz, J., Dockery, D.W, Neas, L.M. (1996) Is daily mortality associated specifically with fine particles? J. Air Waste Manag. Assoc., 46, 927-939.

Monitoring of long-range transported air pollutants in Norway, annual report 2013 | M-203
63
Schwartz, J., Neas, L.M. (2000) Fine particles are more strongly associated than coarse particles with acute respiratory health effects in schoolchildren. Epidemiology, 11, 6-10.
Seinfeld, J.H., Pandis, S.N. (1998) Atmospheric chemistry and physics. New York, Wiley.
Statens forurensningstilsyn (1981) Overvåking av langtransportert forurenset luft og nedbør. Årsrapport 1980. Oslo (Statlig program for forurensningsovervåking. Rapport 26/81).
Statens forurensningstilsyn (1982) Overvåking av langtransportert forurenset luft og nedbør. Årsrapport 1981. Oslo (Statlig program for forurensningsovervåking. Rapport 64/82).
Statens forurensningstilsyn (1983) Overvåking av langtransportert forurenset luft og nedbør. Årsrapport 1982. Oslo (Statlig program for forurensningsovervåking. Rapport 108/83).
Statens forurensningstilsyn (1984) Overvåking av langtransportert forurenset luft og nedbør. Årsrapport 1983. Oslo (Statlig program for forurensningsovervåking. Rapport 162/84).
Statens forurensningstilsyn (1985) Overvåking av langtransportert forurenset luft og nedbør. Årsrapport 1984. Oslo (Statlig program for forurensningsovervåking. Rapport 201/85).
Statens forurensningstilsyn (1986) Overvåking av langtransportert forurenset luft og nedbør. Årsrapport 1985. Oslo (Statlig program for forurensningsovervåking. Rapport 256/86).
Statens forurensningstilsyn (1987) Overvåking av langtransportert forurenset luft og nedbør. Årsrapport 1986. Oslo (Statlig program for forurensningsovervåking. Rapport 296/87).
Statens forurensningstilsyn (1988) Overvåking av langtransportert forurenset luft og nedbør. Årsrapport 1987. Oslo (Statlig program for forurensningsovervåking. Rapport 333/88).
Statens forurensningstilsyn (1989) Overvåking av langtransportert forurenset luft og nedbør. Årsrapport 1988. Oslo (Statlig program for forurensningsovervåking. Rapport 375/89).
Statens forurensningstilsyn (1991a) Overvåking av langtransportert forurenset luft og nedbør. Årsrapport 1989. Oslo (Statlig program for forurensningsovervåking. Rapport 437/91).
Statens forurensningstilsyn (1991b) Overvåking av langtransportert forurenset luft og nedbør. Årsrapport 1990. Oslo (Statlig program for forurensningsovervåking. Rapport 466/91).
Statens forurensningstilsyn (1992a) Overvåking av langtransportert forurenset luft og nedbør. Årsrapport 1991. Oslo (Statlig program for forurensningsovervåking. Rapport 506/92).
Statens forurensningstilsyn (1992b) Virkninger av luftforurensning på helse og miljø: Anbefalte luftkvalitetskriterier. Oslo (SFT-rapport 92:16).
Statens forurensningstilsyn (1993) Overvåking av langtransportert forurenset luft og nedbør. Årsrapport 1992. Oslo (Statlig program for forurensningsovervåking. Rapport 533/93).
Statens forurensningstilsyn (1994) Overvåking av langtransportert forurenset luft og nedbør. Årsrapport 1993. Oslo (Statlig program for forurensningsovervåking. Rapport 583/94).
Statens forurensningstilsyn (1995) Overvåking av langtransportert forurenset luft og nedbør. Årsrapport 1994. Oslo (Statlig program for forurensningsovervåking. Rapport 628/95).
Statens forurensningstilsyn (1996) Overvåking av langtransportert forurenset luft og nedbør. Atmosfærisk tilførsel, 1995. Oslo (Statlig program for forurensningsovervåking. Rapport 663/96).
Statens forurensningstilsyn (1997) Overvåking av langtransportert forurenset luft og nedbør. Atmosfærisk tilførsel, 1996. Oslo (Statlig program for forurensningsovervåking. Rapport 703/97).
Monitoring of long-range transported air pollutants in Norway, annual report 2013 | M-203
64
Statens forurensningstilsyn (1998) Overvåking av langtransportert forurenset luft og nedbør. Atmosfærisk tilførsel, 1997. Oslo (Statlig program for forurensningsovervåking. Rapport 736/98).
Statens forurensningstilsyn (1999) Overvåking av langtransportert forurenset luft og nedbør. Atmosfærisk tilførsel, 1998. Oslo (Statlig program for forurensningsovervåking. Rapport 768/99).
Statens forurensningstilsyn (2000) Overvåking av langtransportert forurenset luft og nedbør. Atmosfærisk tilførsel, 1999. Oslo (Statlig program for forurensningsovervåking. Rapport 797/00).
Statens forurensningstilsyn (2001) Overvåking av langtransportert forurenset luft og nedbør. Atmosfærisk tilførsel, 2000. Oslo (Statlig program for forurensningsovervåking. Rapport 828/01).
Statens forurensningstilsyn (2002) Overvåking av langtransportert forurenset luft og nedbør. Atmosfærisk tilførsel, 2001. Oslo (Statlig program for forurensningsovervåking. Rapport 847/02).
Statens forurensningstilsyn (2003) Overvåking av langtransportert forurenset luft og nedbør. Atmosfærisk tilførsel, 2002. Oslo (Statlig program for forurensningsovervåking. Rapport 877/03).
Statens forurensningstilsyn (2004) Overvåking av langtransportert forurenset luft og nedbør. Atmosfærisk tilførsel, 2003. Oslo (Statlig program for forurensningsovervåking. Rapport 903/04).
Statens forurensningstilsyn (2005) Overvåking av langtransportert forurenset luft og nedbør. Atmosfærisk tilførsel, 2004. Oslo (Statlig program for forurensningsovervåking. Rapport 929/05).
Statens forurensningstilsyn (2006) Overvåking av langtransportert forurenset luft og nedbør. Atmosfærisk tilførsel, 2005. Oslo (Statlig program for forurensningsovervåking. Rapport 955/06).
Statens forurensningstilsyn (2007) Overvåking av langtransportert forurenset luft og nedbør. Atmosfærisk tilførsel, 2006. Oslo (Statlig program for forurensningsovervåking. Rapport 985/07).
Statens forurensningstilsyn (2008b) Grenseområdene i Norge og Russland. Luft- og nedbørkvalitet, april 2007-mars 2008. Oslo (Statlig program for forurensningsovervåking. Rapport 1037/08).
Statens forurensningstilsyn (2008a) Overvåking av langtransportert forurenset luft og nedbør. Atmosfærisk tilførsel, 2007. Oslo (Statlig program for forurensningsovervåking. Rapport 1033/08).
Statens forurensningstilsyn (2009) Overvåking av langtransportert forurenset luft og nedbør. Atmosfærisk tilførsel, 2008. Oslo (Statlig program for forurensningsovervåking. Rapport 1051/09).
Tørseth, K., Aas, W., Breivik, K., Fjæraa, A.M., Fiebig, M., Hjellbrekke, A.G., Myhre, C.L., Solberg, S., Yttri, K.E. (2012) Introduction to the European Monitoring and Evaluation Programme (EMEP) and observed atmospheric composition change during 1972–2009. Atmos. Chem. Phys. 12, 5447-5481

Monitoring of long-range transported air pollutants in Norway, annual report 2013 | M-203
65
UN/ECE (1999) The 1999 Gothenburg Protocol to the 1979 convention on long-range transboundary air pollution to abate acidification, eutrophication and ground-level ozone. URL: http://www.unece.org/env/lrtap/multi_h1.htm.
UN-ECE (1996) Manual on methodologies and criteria for mapping critical levels/loads and geographical areas where they are exceeded. Berlin, Umweltbundesamt (UBA Texte 71/96).
Voldner, E.C., Sirois, A. (1986) Monthly mean spatial variations of dry deposition velocities of oxides of sulphur and nitrogen. Water, Air, Soil Pollut., 30, 179-186.
Whitby, K.T. (1978) Physical characteristics of sulphur aerosols. Atmos. Environ., 12, 135-159.
WHO (2006) Air quality guidelines for particulate matter, ozone, nitrogen dioxide and sulfur dioxide. Global update 2005. Summary of risk assessment. Geneva, World Health Organization.
Yttri, K.E., Aas, W., Bjerke, A., Cape, J.N., Cavalli, F., Ceburnis, D., Dye, C., Emblico, L., Facchini, M.C., Forster, C., Hanssen, J.E., Hansson, H.C., Jennings, S.G., Maenhaut, W., Putaud, J.P., Tørseth, K. (2007b) Elemental and organic carbon in PM10: a one year measurement campaign within the European Monitoring and Evaluation Programme EMEP. Atmos. Chem. Phys., 7, 5711–5725, doi:10.5194/acp-7-5711-2007.
Yttri, K.E., Dye, C., Kiss, G. (2007a) Ambient aerosol concentrations of sugars and sugar-alcohols at four different sites in Norway. Atmos. Chem. Phys., 7, 4267–4279, doi:10.5194/acp-7-4267-2007.
Yttri, K.E., Simpson, D., Nøjgaard, J.K., Kristensen, K., Genberg, J., Stenström, K., Swietlicki, E., Hillamo, R., Aurela, M., Bauer, H., Offenberg, J.H., Jaoui, M., Dye, C., Eckhardt, S., Burkhart, J.F., Stohl, A., Glasius, M. (2011b) Source apportionment of the summer time carbonaceous aerosol at Nordic rural background sites. Atmos. Chem. Phys., 11, 13339–13357, doi:10.5194/acp-11-13339-2011.
Yttri, K.E., Simpson, D., Stenström, K., Puxbaum, H., Svendby, T. (2011a) Source apportionment of the carbonaceous aerosol in Norway quantitative estimates based on 14C, thermal-optical and organic tracer analysis. Atmos. Chem. Phys., 11, 9375–9394, doi:10.5194/acp-11-9375-2011.

Monitoring of long-range transported air pollutants in Norway, annual report 2013 | M-203
66
Results from the monitoring programme

Monitoring of long-range transported air pollutants in Norway, annual report 2013 | M-203
67
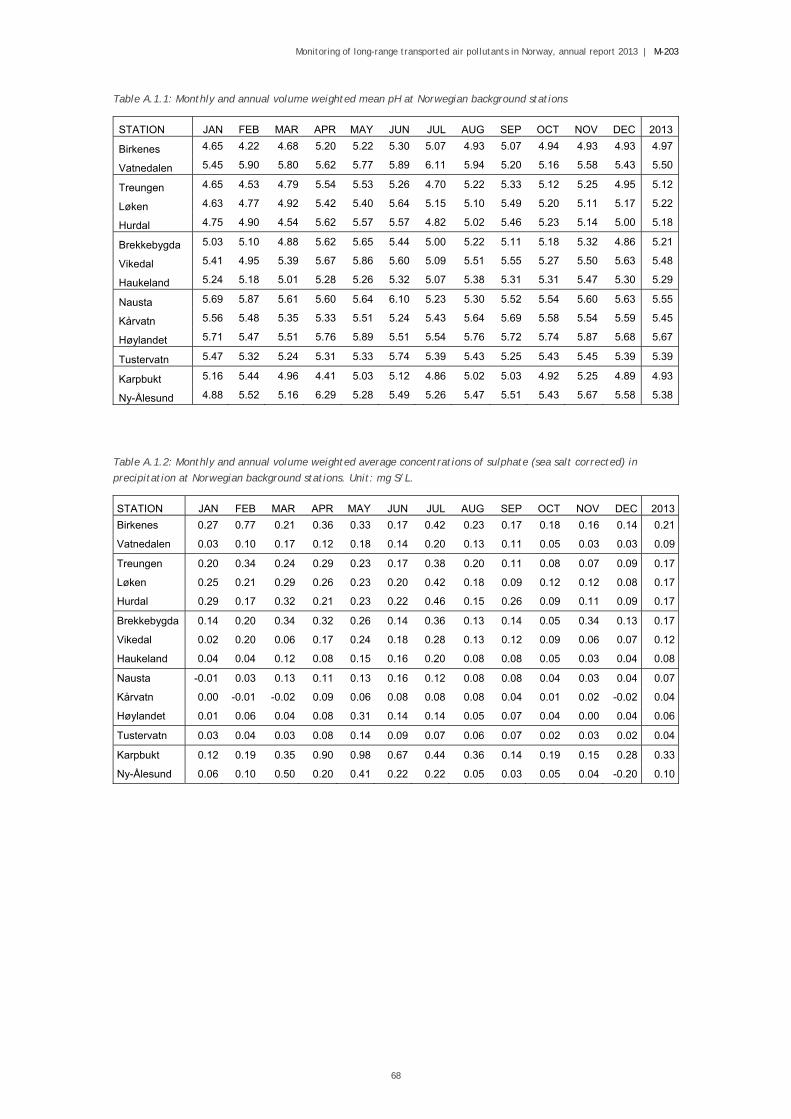
Monitoring of long-range transported air pollutants in Norway, annual report 2013 | M-203
68
Table A.1.1: Monthly and annual volume weighted mean pH at Norwegian background stations
STATION JAN FEB MAR APR MAY JUN JUL AUG SEP OCT NOV DEC 2013
Birkenes 4.65 4.22 4.68 5.20 5.22 5.30 5.07 4.93 5.07 4.94 4.93 4.93 4.97
Vatnedalen 5.45 5.90 5.80 5.62 5.77 5.89 6.11 5.94 5.20 5.16 5.58 5.43 5.50
Treungen 4.65 4.53 4.79 5.54 5.53 5.26 4.70 5.22 5.33 5.12 5.25 4.95 5.12
Løken 4.63 4.77 4.92 5.42 5.40 5.64 5.15 5.10 5.49 5.20 5.11 5.17 5.22
Hurdal 4.75 4.90 4.54 5.62 5.57 5.57 4.82 5.02 5.46 5.23 5.14 5.00 5.18
Brekkebygda 5.03 5.10 4.88 5.62 5.65 5.44 5.00 5.22 5.11 5.18 5.32 4.86 5.21
Vikedal 5.41 4.95 5.39 5.67 5.86 5.60 5.09 5.51 5.55 5.27 5.50 5.63 5.48
Haukeland 5.24 5.18 5.01 5.28 5.26 5.32 5.07 5.38 5.31 5.31 5.47 5.30 5.29
Nausta 5.69 5.87 5.61 5.60 5.64 6.10 5.23 5.30 5.52 5.54 5.60 5.63 5.55
Kårvatn 5.56 5.48 5.35 5.33 5.51 5.24 5.43 5.64 5.69 5.58 5.54 5.59 5.45
Høylandet 5.71 5.47 5.51 5.76 5.89 5.51 5.54 5.76 5.72 5.74 5.87 5.68 5.67
Tustervatn 5.47 5.32 5.24 5.31 5.33 5.74 5.39 5.43 5.25 5.43 5.45 5.39 5.39
Karpbukt 5.16 5.44 4.96 4.41 5.03 5.12 4.86 5.02 5.03 4.92 5.25 4.89 4.93
Ny-Ålesund 4.88 5.52 5.16 6.29 5.28 5.49 5.26 5.47 5.51 5.43 5.67 5.58 5.38
Table A.1.2: Monthly and annual volume weighted average concentrations of sulphate (sea salt corrected) in
precipitation at Norwegian background stations. Unit: mg S/L.
STATION JAN FEB MAR APR MAY JUN JUL AUG SEP OCT NOV DEC 2013
Birkenes 0.27 0.77 0.21 0.36 0.33 0.17 0.42 0.23 0.17 0.18 0.16 0.14 0.21
Vatnedalen 0.03 0.10 0.17 0.12 0.18 0.14 0.20 0.13 0.11 0.05 0.03 0.03 0.09
Treungen 0.20 0.34 0.24 0.29 0.23 0.17 0.38 0.20 0.11 0.08 0.07 0.09 0.17
Løken 0.25 0.21 0.29 0.26 0.23 0.20 0.42 0.18 0.09 0.12 0.12 0.08 0.17
Hurdal 0.29 0.17 0.32 0.21 0.23 0.22 0.46 0.15 0.26 0.09 0.11 0.09 0.17
Brekkebygda 0.14 0.20 0.34 0.32 0.26 0.14 0.36 0.13 0.14 0.05 0.34 0.13 0.17
Vikedal 0.02 0.20 0.06 0.17 0.24 0.18 0.28 0.13 0.12 0.09 0.06 0.07 0.12
Haukeland 0.04 0.04 0.12 0.08 0.15 0.16 0.20 0.08 0.08 0.05 0.03 0.04 0.08
Nausta -0.01 0.03 0.13 0.11 0.13 0.16 0.12 0.08 0.08 0.04 0.03 0.04 0.07
Kårvatn 0.00 -0.01 -0.02 0.09 0.06 0.08 0.08 0.08 0.04 0.01 0.02 -0.02 0.04
Høylandet 0.01 0.06 0.04 0.08 0.31 0.14 0.14 0.05 0.07 0.04 0.00 0.04 0.06
Tustervatn 0.03 0.04 0.03 0.08 0.14 0.09 0.07 0.06 0.07 0.02 0.03 0.02 0.04
Karpbukt 0.12 0.19 0.35 0.90 0.98 0.67 0.44 0.36 0.14 0.19 0.15 0.28 0.33
Ny-Ålesund 0.06 0.10 0.50 0.20 0.41 0.22 0.22 0.05 0.03 0.05 0.04 -0.20 0.10

Monitoring of long-range transported air pollutants in Norway, annual report 2013 | M-203
69
Table A.1.3: Monthly and annual volume weighted average concentrations of nitrate in precipitation at Norwegian
background stations. Unit: mg N/L.
STATION JAN FEB MAR APR MAY JUN JUL AUG SEP OCT NOV DEC 2013
Birkenes 0.47 0.61 0.50 0.63 0.54 0.23 0.57 0.38 0.23 0.30 0.33 0.28 0.35
Vatnedalen 0.11 0.23 0.58 0.16 0.21 0.13 0.26 0.20 0.19 0.07 0.05 0.08 0.14
Treungen 0.45 0.45 0.71 0.50 0.35 0.20 0.43 0.33 0.16 0.14 0.18 0.19 0.27
Løken 0.50 0.33 1.37 0.55 0.25 0.23 0.53 0.29 0.10 0.22 0.27 0.21 0.27
Hurdal 0.55 0.24 0.99 0.41 0.28 0.24 0.47 0.23 0.17 0.16 0.25 0.25 0.26
Brekkebygda 0.33 0.30 1.19 0.54 0.32 0.15 0.34 0.15 0.11 0.05 0.20 0.28 0.22
Vikedal 0.13 0.23 0.12 0.23 0.31 0.25 0.37 0.20 0.23 0.15 0.08 0.13 0.18
Haukeland 0.10 0.20 0.67 0.12 0.16 0.18 0.20 0.09 0.16 0.06 0.03 0.07 0.11
Nausta 0.04 0.06 0.12 0.11 0.13 0.14 0.15 0.11 0.16 0.05 0.04 0.07 0.09
Kårvatn 0.03 0.03 0.04 0.07 0.10 0.07 0.07 0.08 0.05 0.05 0.04 0.05 0.06
Høylandet 0.09 0.10 0.07 0.09 0.13 0.11 0.14 0.06 0.06 0.05 0.02 0.07 0.08
Tustervatn 0.07 0.07 0.03 0.17 0.14 0.09 0.06 0.06 0.08 0.04 0.01 0.03 0.05
Karpbukt 0.08 0.12 0.07 0.12 0.18 0.12 0.12 0.09 0.08 0.05 0.06 0.08 0.09
Ny-Ålesund 0.04 0.06 0.05 0.11 0.24 0.10 0.11 0.06 0.07 0.03 0.03 0.10 0.07
Table A.1.4: Monthly and annual volume weighted average concentrations of ammonium in precipitation at
Norwegian background stations. Unit: mg N/L.
STATION JAN FEB MAR APR MAY JUN JUL AUG SEP OCT NOV DEC 2013
Birkenes 0.39 0.61 0.41 1.11 0.76 0.31 0.69 0.39 0.19 0.22 0.18 0.19 0.37
Vatnedalen 0.30 0.51 1.25 0.27 0.50 1.00 0.76 0.74 0.16 0.01 0.05 0.09 0.35
Treungen 0.33 0.40 0.71 0.76 0.54 0.41 0.35 0.33 0.13 0.07 0.16 0.11 0.30
Løken 0.35 0.27 1.30 0.82 0.91 0.78 1.50 0.19 0.20 0.23 0.21 0.19 0.49
Hurdal 0.43 0.23 0.68 0.75 0.53 0.75 0.58 0.23 0.37 0.13 0.19 0.16 0.38
Brekkebygda 0.20 0.25 1.17 0.68 0.48 0.20 0.28 0.12 0.09 0.05 0.57 0.16 0.25
Vikedal 0.31 0.47 0.34 0.52 0.68 0.83 0.95 0.37 0.64 0.20 0.17 0.25 0.41
Haukeland 0.09 0.20 0.51 0.32 0.26 0.54 0.23 0.09 0.15 0.05 0.09 0.11 0.16
Nausta 0.24 0.33 0.53 0.39 0.24 1.23 0.25 0.18 0.37 0.13 0.17 0.20 0.29
Kårvatn 0.09 0.13 0.21 0.17 0.22 0.11 0.12 0.29 0.18 0.10 0.06 0.05 0.13
Høylandet 0.33 0.37 0.32 0.47 1.13 0.54 0.17 0.32 0.35 0.35 0.33 0.24 0.34
Tustervatn 0.10 0.34 0.25 0.28 0.55 0.80 0.10 0.05 0.07 0.05 0.03 0.01 0.14
Karpbukt 0.09 0.40 0.23 0.26 0.38 0.44 0.15 0.15 0.13 0.06 0.22 0.16 0.16
Ny-Ålesund 0.04 0.08 0.15 0.96 0.49 0.10 0.12 0.05 0.06 0.05 0.05 0.09 0.09

Monitoring of long-range transported air pollutants in Norway, annual report 2013 | M-203
70
Table A.1.5: Monthly and annual volume weighted average concentrations of calcium in precipitation at Norwegian
background stations. Unit: mg/L.
STATION JAN FEB MAR APR MAY JUN JUL AUG SEP OCT NOV DEC 2013
Birkenes 0.10 0.09 0.11 0.12 0.15 0.09 0.25 0.16 0.17 0.20 0.29 0.22 0.17
Vatnedalen 0.08 0.16 0.14 0.12 0.15 0.12 0.20 0.21 0.08 0.07 0.18 0.13 0.14
Treungen 0.03 0.04 0.06 0.15 0.10 0.05 0.15 0.14 0.09 0.07 0.10 0.08 0.09
Løken 0.08 0.07 0.56 0.14 0.10 0.07 0.59 0.16 0.15 0.15 0.13 0.18 0.14
Hurdal 0.09 0.06 0.22 0.23 0.21 0.10 0.21 0.11 0.24 0.16 0.20 0.11 0.15
Brekkebygda 0.16 0.14 0.23 0.27 0.13 0.08 0.30 0.10 0.16 0.05 0.09 0.16 0.13
Vikedal 0.23 0.17 0.09 0.17 0.10 0.06 0.12 0.07 0.39 0.16 0.26 0.31 0.21
Haukeland 0.13 0.18 0.25 0.11 0.12 0.07 0.06 0.04 0.05 0.07 0.12 0.18 0.11
Nausta 0.07 0.03 0.11 0.10 0.08 0.04 0.05 0.04 0.08 0.02 0.13 0.15 0.08
Kårvatn 0.06 0.11 0.19 0.12 0.09 0.04 0.06 0.05 0.15 0.16 0.32 0.25 0.14
Høylandet 0.06 0.07 0.11 0.07 0.26 0.13 0.10 0.24 0.15 0.20 0.34 0.14 0.17
Tustervatn 0.04 0.02 0.04 0.05 0.17 0.06 0.03 0.04 0.03 0.14 0.17 0.10 0.09
Karpbukt 0.17 0.15 0.24 0.16 0.98 0.48 0.16 0.11 0.33 0.26 0.26 0.11 0.25
Ny-Ålesund 0.34 0.25 0.43 0.68 0.83 0.59 0.67 0.18 0.42 0.42 0.56 2.13 0.47
Table A.1.6: Monthly and annual volume weighted average concentrations of potassium in precipitation at
Norwegian background stations. Unit: mg/L.
STATION JAN FEB MAR APR MAY JUN JUL AUG SEP OCT NOV DEC 2013
Birkenes 0.10 0.13 0.02 0.10 0.06 0.09 0.14 0.08 0.07 0.07 0.17 0.14 0.10
Vatnedalen 0.15 0.13 0.20 0.10 0.11 0.10 0.19 0.27 0.09 0.11 0.10 0.18 0.15
Treungen 0.04 0.05 0.07 0.10 0.11 0.09 0.08 0.03 0.05 0.06 0.10 0.09 0.08
Løken 0.09 0.08 0.22 0.10 0.09 0.06 0.45 0.11 0.25 0.12 0.08 0.12 0.11
Hurdal 0.12 0.12 0.17 0.13 0.11 0.14 0.14 0.04 0.06 0.09 0.12 0.10 0.10
Brekkebygda 0.19 0.12 0.22 0.25 0.05 0.16 0.17 0.06 0.32 0.18 0.12 0.15 0.14
Vikedal 0.22 0.17 0.14 0.17 0.08 0.07 0.10 0.05 0.04 0.10 0.14 0.20 0.13
Haukeland 0.09 0.14 0.16 0.07 0.04 0.06 0.04 0.04 0.13 0.11 0.12 0.17 0.10
Nausta 0.10 0.02 0.20 0.09 0.04 0.04 0.04 0.04 0.04 0.02 0.09 0.09 0.07
Kårvatn 0.02 0.13 0.21 0.08 0.10 0.06 0.07 0.21 0.23 0.26 0.27 0.16 0.15
Høylandet 0.14 0.13 0.13 0.12 0.30 0.08 0.12 0.07 0.17 0.12 0.32 0.11 0.15
Tustervatn 0.03 0.03 0.03 0.04 0.03 0.04 0.05 0.05 0.04 0.05 0.11 0.05 0.06
Karpbukt 0.06 0.11 0.18 - 0.11 0.18 0.16 0.11 0.35 0.27 0.27 0.07 0.18
Ny-Ålesund 0.37 0.13 0.21 0.25 0.17 0.14 0.07 0.07 0.29 0.19 0.22 1.88 0.20

Monitoring of long-range transported air pollutants in Norway, annual report 2013 | M-203
71
Table A.1.7: Monthly and annual volume weighted average concentrations of magnesium in precipitation at
Norwegian background stations. Unit: mg/L.
STATION JAN FEB MAR APR MAY JUN JUL AUG SEP OCT NOV DEC 2013
Birkenes 0.16 0.07 0.20 0.11 0.04 0.03 0.06 0.07 0.08 0.11 0.29 0.37 0.16
Vatnedalen 0.10 0.05 0.04 0.07 0.02 0.01 0.05 0.04 0.02 0.03 0.09 0.10 0.05
Treungen 0.06 0.04 0.05 0.05 0.06 0.01 0.06 0.03 0.03 0.04 0.13 0.15 0.06
Løken 0.08 0.04 0.13 0.08 0.03 0.02 0.15 0.06 0.05 0.05 0.14 0.31 0.09
Hurdal 0.04 0.01 0.06 0.06 0.03 0.02 0.08 0.03 0.05 0.04 0.08 0.12 0.05
Brekkebygda 0.04 0.02 0.12 0.05 0.02 0.02 0.06 0.03 0.05 0.03 0.17 0.07 0.04
Vikedal 0.61 0.37 0.16 0.27 0.13 0.03 0.08 0.08 0.06 0.17 0.37 0.56 0.29
Haukeland 0.36 0.37 0.14 0.20 0.11 0.03 0.05 0.08 0.05 0.10 0.30 0.42 0.21
Nausta 0.19 0.07 0.24 0.23 0.06 0.03 0.04 0.06 0.04 0.04 0.29 0.25 0.14
Kårvatn 0.11 0.32 0.56 0.12 0.08 0.02 0.03 0.02 0.08 0.07 0.64 0.30 0.22
Høylandet 0.10 0.18 0.24 0.15 0.27 0.03 0.11 0.09 0.09 0.21 0.72 0.22 0.24
Tustervatn 0.09 0.04 0.07 0.12 0.04 0.01 0.04 0.05 0.01 0.09 0.31 0.07 0.10
Karpbukt 0.42 0.30 0.61 0.19 0.11 0.30 0.11 0.06 0.89 0.71 0.66 0.22 0.44
Ny-Ålesund 1.14 0.42 0.68 0.63 0.61 0.41 0.26 0.19 0.84 0.70 0.76 5.18 0.63
Table A.1.8: Monthly and annual volume weighted average concentrations of sodium in precipitation at Norwegian
background stations. Unit: mg/L.
STATION JAN FEB MAR APR MAY JUN JUL AUG SEP OCT NOV DEC 2013
Birkenes 1.42 0.58 1.74 1.10 0.36 0.27 0.42 0.53 0.63 0.86 2.42 3.12 1.34
Vatnedalen 1.11 0.45 0.66 0.99 0.57 0.52 0.84 0.46 0.16 0.18 0.76 0.89 0.60
Treungen 0.47 0.32 0.44 0.43 0.19 0.10 0.44 0.20 0.22 0.23 1.08 1.23 0.42
Løken 0.74 0.40 2.45 0.78 0.18 0.09 0.64 0.33 0.38 0.36 1.16 2.40 0.70
Hurdal 0.43 0.20 0.73 0.63 0.19 0.10 0.49 0.16 0.28 0.28 0.90 1.09 0.43
Brekkebygda 0.52 0.23 0.91 0.51 0.11 0.16 0.29 0.10 0.37 0.25 1.09 0.53 0.26
Vikedal 5.64 3.17 1.60 2.55 1.07 0.23 0.54 0.67 0.40 1.35 3.04 4.48 2.43
Haukeland 3.16 3.96 4.35 1.89 0.91 0.27 0.40 0.63 0.37 0.70 2.56 3.59 1.85
Nausta 1.99 0.72 2.45 2.20 0.48 0.26 0.28 0.44 0.28 0.34 2.41 1.93 1.22
Kårvatn 0.77 2.86 5.17 1.10 0.75 0.17 0.24 0.29 0.70 0.71 5.16 2.96 1.96
Høylandet 1.14 1.96 2.29 1.67 2.84 0.20 0.64 0.69 0.59 1.61 6.13 1.74 2.08
Tustervatn 0.73 0.49 0.75 1.02 0.43 0.12 0.29 0.42 0.07 0.81 2.52 0.56 0.86
Karpbukt 3.55 2.76 5.15 1.44 0.49 2.50 0.47 0.45 7.79 6.24 5.64 1.61 3.66
Ny-Ålesund 9.13 3.67 5.35 6.97 4.15 1.98 0.75 1.46 6.96 4.91 5.13 42.47 4.57

Monitoring of long-range transported air pollutants in Norway, annual report 2013 | M-203
72
Table A.1.9: Monthly and annual volume weighted average concentrations of chloride in precipitation at Norwegian
background stations. Unit: mg N/L.
STATION JAN FEB MAR APR MAY JUN JUL AUG SEP OCT NOV DEC 2013
Birkenes 2.51 1.10 2.74 1.91 0.63 0.41 0.61 0.80 1.08 1.48 4.35 5.35 2.29
Vatnedalen 1.67 0.86 1.06 1.40 0.47 0.35 0.60 0.38 0.24 0.24 1.23 1.46 0.78
Treungen 0.90 0.66 0.74 0.77 0.35 0.18 0.50 0.28 0.35 0.39 1.90 2.13 0.71
Løken 1.31 0.74 3.46 1.40 0.28 0.16 0.84 0.47 0.59 0.66 2.02 4.03 1.17
Hurdal 0.76 0.42 1.00 0.99 0.30 0.19 0.65 0.22 0.49 0.45 1.52 1.79 0.70
Brekkebygda 0.77 0.39 1.25 0.89 0.17 0.25 0.43 0.14 0.41 0.46 1.80 0.90 0.41
Vikedal 9.72 5.76 2.68 4.35 1.96 0.40 0.82 1.06 0.69 2.37 5.35 7.63 4.18
Haukeland 5.26 6.70 7.27 3.29 1.57 0.45 0.70 1.09 0.63 1.22 4.48 6.29 3.21
Nausta 3.35 1.30 4.45 4.25 0.94 0.43 0.48 0.75 0.50 0.61 4.24 3.37 2.20
Kårvatn 1.39 4.70 8.56 2.12 1.38 0.30 0.44 0.53 1.25 1.21 9.89 5.18 3.54
Høylandet 1.89 3.57 3.69 3.08 4.99 0.35 1.09 1.20 1.06 2.87 10.70 3.11 3.66
Tustervatn 1.35 0.93 1.32 1.94 0.83 0.22 0.48 0.68 0.11 1.43 4.69 1.04 1.57
Karpbukt 6.40 5.09 9.21 2.55 0.77 4.55 0.65 0.63 13.60 10.44 9.60 2.83 6.29
Ny-Ålesund 16.12 6.59 10.11 12.69 6.68 3.14 1.18 2.56 12.21 8.38 9.21 64.57 7.72
Table A.1.10: Monthly and annual precipitation amount at Norwegian background stations. Unit: mm.
STATION JAN FEB MAR APR MAY JUN JUL AUG SEP OCT NOV DEC 2013
Vatnedalen 33 7 2 68 112 111 11 161 85 101 97 195 983
Treungen 37 12 23 49 212 172 25 121 120 154 45 185 1150
Løken 17 21 2 58 150 140 19 107 38 112 35 137 834
Hurdal 24 16 2 64 151 131 18 129 48 109 43 163 896
Brekkebygda 43 21 8 36 264 234 39 137 157 101 10 162 1202
Vikedal 143 70 14 284 205 123 111 243 248 230 296 575 2534
Haukeland 108 121 24 354 205 158 270 345 165 491 457 720 3415
Nausta 66 110 40 273 111 112 241 272 83 309 220 444 2277
Kårvatn 45 146 73 100 62 193 184 119 48 116 241 105 1432
Høylandet 108 148 82 80 50 78 151 123 71 173 222 267 1551
Tustervatn 32 80 84 59 15 72 104 67 78 129 186 244 1148
Karpbukt 51 14 50 22 23 15 70 40 37 131 19 44 516
Ny-Ålesund 19 12 2 4 6 34 31 67 27 36 24 6 268

Monitoring of long-range transported air pollutants in Norway, annual report 2013 | M-203
73
Table A.1.11: Monthly and annual wet deposition of strong acid (H+) at Norwegian background stations. Unit:
µekv/m2.
STATION JAN FEB MAR APR MAY JUN JUL AUG SEP OCT NOV DEC 2013
Birkenes 1705 1425 876 608 778 1119 32 1354 1154 1989 1100 3690 15401
Vatnedalen 119 9 3 163 191 141 8 185 530 695 253 721 3137
Treungen 819 345 375 142 632 944 490 736 568 1176 256 2084 8638
Løken 398 360 23 218 597 319 132 852 121 700 276 937 4991
Hurdal 424 196 69 151 405 351 267 1238 169 644 306 1610 5912
Brekkebygda 403 167 100 87 596 847 390 826 1230 667 48 2230 7440
Vikedal 561 773 56 602 285 309 907 756 699 1226 928 1351 8363
Haukeland 619 798 234 1853 1137 753 2278 1432 811 2384 1531 3568 17358
Nausta 135 150 98 687 251 89 1425 1369 251 883 546 1047 6392
Kårvatn 122 478 324 463 191 1110 676 272 97 304 692 271 5059
Høylandet 208 502 256 140 65 240 435 214 134 312 300 557 3351
Tustervatn 110 389 479 285 68 131 421 247 441 481 666 986 4709
Karpbukt 353 49 558 866 218 114 962 386 342 1571 106 567 6100
Ny-Ålesund 252 35 16 2 33 110 171 223 84 132 51 17 1125
Table A.1.12: Monthly and annual wet deposition of sulphate (sea salt corrected) at Norwegian background stations.
Unit: mg S/m2.
STATION JAN FEB MAR APR MAY JUN JUL AUG SEP OCT NOV DEC 2013
Birkenes 20 18 9 35 43 38 2 26 23 31 15 46 303
Vatnedalen 1 1 0 8 20 15 2 21 9 5 3 6 92
Treungen 7 4 6 14 50 30 9 25 14 12 3 17 190
Løken 4 5 1 15 34 28 8 19 3 13 4 11 145
Hurdal 7 3 1 13 35 28 8 20 12 10 5 15 156
Brekkebygda 6 4 3 12 68 33 14 18 22 5 3 21 207
Vikedal 2 14 1 49 49 22 31 31 29 21 17 41 304
Haukeland 4 5 3 30 31 25 53 26 13 24 14 32 259
Nausta -1 3 5 29 14 18 29 22 6 11 6 16 153
Kårvatn 0 -1 -1 9 3 15 14 10 2 2 6 -2 57
Høylandet 0 9 3 6 16 10 21 6 5 6 -1 11 94
Tustervatn 1 3 3 5 2 6 7 4 6 2 6 4 49
Karpbukt 6 3 17 20 23 10 31 14 5 25 3 12 170
Ny-Ålesund 1 1 1 1 3 8 7 3 1 2 1 -1 27

Monitoring of long-range transported air pollutants in Norway, annual report 2013 | M-203
74
Table A.1.13: Monthly and annual wet deposition of nitrate at Norwegian background stations. Unit: mg N/m2.
STATION JAN FEB MAR APR MAY JUN JUL AUG SEP OCT NOV DEC 2013
Birkenes 36 14 21 61 69 52 2 44 31 53 31 89 501
Vatnedalen 4 2 1 11 23 15 3 32 16 7 5 16 133
Treungen 16 5 16 25 74 34 11 40 19 22 8 35 305
Løken 9 7 3 31 38 33 10 31 4 25 9 30 229
Hurdal 13 4 2 26 43 31 8 30 8 17 11 41 233
Brekkebygda 14 6 9 19 85 34 13 20 17 5 2 46 268
Vikedal 18 16 2 64 63 30 41 49 56 34 23 74 467
Haukeland 11 24 16 44 33 29 54 30 26 31 14 47 360
Nausta 3 6 5 31 15 15 36 30 13 17 10 33 207
Kårvatn 1 4 3 7 6 13 12 9 3 6 10 5 80
Høylandet 10 15 6 7 7 9 22 8 4 9 5 18 119
Tustervatn 2 5 2 10 2 6 6 4 6 5 2 7 60
Karpbukt 4 2 4 3 4 2 8 4 3 6 1 4 44
Ny-Ålesund 1 1 0 0 2 3 3 4 2 1 1 1 18
Table A.1.14: Monthly and annual wet deposition of ammonium at Norwegian background stations. Unit: mg N/m2.
STATION JAN FEB MAR APR MAY JUN JUL AUG SEP OCT NOV DEC 2013
Birkenes 30 14 17 108 99 70 3 45 26 38 17 59 522
Vatnedalen 10 4 3 19 56 110 8 120 14 1 5 17 344
Treungen 12 5 17 37 114 70 9 39 15 11 7 21 349
Løken 6 6 2 47 136 109 28 20 8 26 8 27 405
Hurdal 10 4 2 48 80 98 10 29 18 14 8 27 340
Brekkebygda 9 5 9 24 128 46 11 17 13 5 6 26 304
Vikedal 44 33 5 148 140 102 105 89 158 46 52 142 1049
Haukeland 10 24 12 113 54 86 61 31 24 22 43 77 557
Nausta 16 37 21 105 27 138 59 49 31 39 37 90 666
Kårvatn 4 18 15 17 14 22 21 35 9 11 13 5 182
Høylandet 36 55 26 37 57 42 26 39 25 61 74 64 529
Tustervatn 3 27 21 17 8 57 10 4 5 7 6 3 164
Karpbukt 5 5 12 6 9 7 11 6 5 8 4 7 84
Ny-Ålesund 1 1 0 4 3 3 4 3 1 2 1 1 24
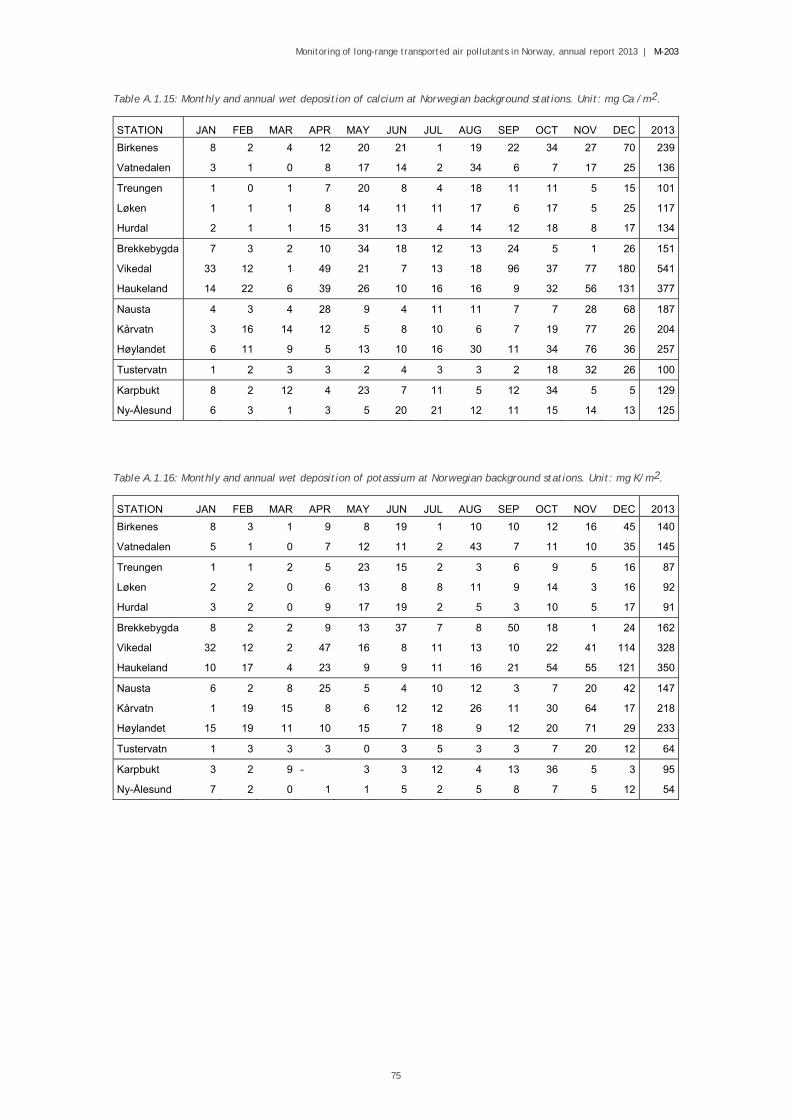
Monitoring of long-range transported air pollutants in Norway, annual report 2013 | M-203
75
Table A.1.15: Monthly and annual wet deposition of calcium at Norwegian background stations. Unit: mg Ca /m2.
STATION JAN FEB MAR APR MAY JUN JUL AUG SEP OCT NOV DEC 2013
Birkenes 8 2 4 12 20 21 1 19 22 34 27 70 239
Vatnedalen 3 1 0 8 17 14 2 34 6 7 17 25 136
Treungen 1 0 1 7 20 8 4 18 11 11 5 15 101
Løken 1 1 1 8 14 11 11 17 6 17 5 25 117
Hurdal 2 1 1 15 31 13 4 14 12 18 8 17 134
Brekkebygda 7 3 2 10 34 18 12 13 24 5 1 26 151
Vikedal 33 12 1 49 21 7 13 18 96 37 77 180 541
Haukeland 14 22 6 39 26 10 16 16 9 32 56 131 377
Nausta 4 3 4 28 9 4 11 11 7 7 28 68 187
Kårvatn 3 16 14 12 5 8 10 6 7 19 77 26 204
Høylandet 6 11 9 5 13 10 16 30 11 34 76 36 257
Tustervatn 1 2 3 3 2 4 3 3 2 18 32 26 100
Karpbukt 8 2 12 4 23 7 11 5 12 34 5 5 129
Ny-Ålesund 6 3 1 3 5 20 21 12 11 15 14 13 125
Table A.1.16: Monthly and annual wet deposition of potassium at Norwegian background stations. Unit: mg K/m2.
STATION JAN FEB MAR APR MAY JUN JUL AUG SEP OCT NOV DEC 2013
Birkenes 8 3 1 9 8 19 1 10 10 12 16 45 140
Vatnedalen 5 1 0 7 12 11 2 43 7 11 10 35 145
Treungen 1 1 2 5 23 15 2 3 6 9 5 16 87
Løken 2 2 0 6 13 8 8 11 9 14 3 16 92
Hurdal 3 2 0 9 17 19 2 5 3 10 5 17 91
Brekkebygda 8 2 2 9 13 37 7 8 50 18 1 24 162
Vikedal 32 12 2 47 16 8 11 13 10 22 41 114 328
Haukeland 10 17 4 23 9 9 11 16 21 54 55 121 350
Nausta 6 2 8 25 5 4 10 12 3 7 20 42 147
Kårvatn 1 19 15 8 6 12 12 26 11 30 64 17 218
Høylandet 15 19 11 10 15 7 18 9 12 20 71 29 233
Tustervatn 1 3 3 3 0 3 5 3 3 7 20 12 64
Karpbukt 3 2 9 - 3 3 12 4 13 36 5 3 95
Ny-Ålesund 7 2 0 1 1 5 2 5 8 7 5 12 54

Monitoring of long-range transported air pollutants in Norway, annual report 2013 | M-203
76
Table A.1.17: Monthly and annual wet deposition of magnesium at Norwegian background stations. Unit: mg /m2.
STATION JAN FEB MAR APR MAY JUN JUL AUG SEP OCT NOV DEC 2013
Birkenes 13 2 8 11 5 7 0 8 11 19 27 118 228
Vatnedalen 3 0 0 5 2 1 1 7 2 3 8 20 53
Treungen 2 0 1 2 13 2 1 4 4 7 6 28 71
Løken 1 1 0 5 4 3 3 6 2 6 5 43 78
Hurdal 1 0 0 4 5 3 1 3 3 4 3 20 47
Brekkebygda 2 1 1 2 6 4 2 4 8 3 2 12 44
Vikedal 88 26 2 75 27 3 9 20 14 39 110 324 742
Haukeland 39 45 3 70 23 4 14 26 9 48 138 304 722
Nausta 12 7 10 63 6 3 9 16 3 13 64 110 327
Kårvatn 5 46 41 11 5 4 5 2 4 8 153 32 321
Høylandet 11 27 20 12 13 2 16 11 6 36 160 59 376
Tustervatn 3 4 6 7 1 1 4 3 1 12 58 18 118
Karpbukt 21 4 31 4 2 4 8 2 33 94 13 9 226
Ny-Ålesund 22 5 2 3 4 14 8 13 23 25 18 33 167
Table A.1.18: Monthly and annual wet deposition of sodium at Norwegian background stations. Unit: mg /m2.
STATION JAN FEB MAR APR MAY JUN JUL AUG SEP OCT NOV DEC 2013
Birkenes 109 14 74 107 47 60 2 61 86 149 225 985 1911
Vatnedalen 37 3 1 68 64 57 9 74 13 18 73 172 591
Treungen 17 4 10 21 41 17 11 25 26 35 49 228 482
Løken 13 9 5 45 27 13 12 35 14 41 41 328 580
Hurdal 10 3 2 40 29 13 9 20 13 30 38 178 386
Brekkebygda 22 5 7 19 30 37 11 13 58 25 11 85 309
Vikedal 808 221 22 724 220 28 60 163 98 310 900 2577 6155
Haukeland 341 477 105 670 187 42 107 217 61 345 1169 2584 6303
Nausta 131 79 97 600 53 28 67 119 23 105 529 859 2783
Kårvatn 34 417 379 110 47 33 44 34 34 83 1240 311 2808
Høylandet 123 290 188 133 142 16 97 85 42 278 1358 463 3231
Tustervatn 24 39 63 60 6 8 30 28 6 105 470 138 985
Karpbukt 180 37 260 32 11 37 33 18 288 820 107 70 1892
Ny-Ålesund 173 42 12 29 26 68 23 97 188 175 124 268 1222

Monitoring of long-range transported air pollutants in Norway, annual report 2013 | M-203
77
Table A.1.19: Monthly and annual wet deposition of chloride at Norwegian background stations. Unit: mg /m2.
STATION JAN FEB MAR APR MAY JUN JUL AUG SEP OCT NOV DEC 2013
Birkenes 193 26 116 186 82 93 2 92 146 257 406 1687 3274
Vatnedalen 56 6 2 95 52 39 6 61 20 24 120 284 766
Treungen 33 8 17 38 73 30 12 34 42 60 86 392 821
Løken 22 16 7 80 42 22 16 51 22 74 72 553 974
Hurdal 18 7 2 63 45 25 12 28 24 49 65 291 629
Brekkebygda 33 8 10 32 46 59 17 19 64 46 18 145 488
Vikedal 1393 401 37 1235 402 49 91 258 172 544 1583 4387 10589
Haukeland 568 809 175 1163 322 70 190 378 105 598 2047 4533 10946
Nausta 221 144 177 1157 104 48 115 205 42 189 932 1498 5005
Kårvatn 62 684 626 212 86 58 81 64 60 140 2379 544 5075
Høylandet 204 528 303 245 250 27 165 148 76 496 2369 829 5669
Tustervatn 43 75 111 114 12 16 50 46 8 185 874 253 1802
Karpbukt 325 69 464 57 18 68 46 25 503 1371 181 124 3248
Ny-Ålesund 305 76 23 52 41 108 37 170 330 299 222 407 2066
Table A.1.20: The 10 highest daily wet deposition of sea salt corrected sulphate, 2013.
SO4 wet dep Precip % av annual
Site Date mgS/m2 mm' SO4 dep pH
Birkenes 15.05.2013 13.8 37.7 4.6 5.43
08.05.2013 11.5 35.8 3.8 5.37
14.04.2013 11.2 26.4 3.7 6.37
15.02.2013 10.5 4.3 3.5 3.96
26.01.2013 10.1 8.9 3.3 4.10
22.10.2013 8.4 28.0 2.8 4.97
12.06.2013 7.1 32.2 2.4 5.59
11.04.2013 6.5 15.8 2.2 4.98
21.06.2013 6.4 46.7 2.1 5.19
30.12.2013 6.3 36.5 2.1 4.87
sum 30.4
Hurdal 14.09.2013 7.5 21.3 4.8 5.81
21.06.2013 5.5 11.3 3.5 5.66
08.08.2013 5.0 40.9 3.2 4.91
28.04.2013 4.6 24.2 3.0 5.75
08.05.2013 4.6 11.8 2.9 5.96
21.05.2013 4.2 30.6 2.7 5.58
14.04.2013 4.2 11.6 2.7 6.06
20.05.2013 4.0 18.9 2.6 -
03.05.2013 3.9 15.3 2.5 5.89
02.06.2013 3.8 22.9 2.5 5.58
sum 30.3

Monitoring of long-range transported air pollutants in Norway, annual report 2013 | M-203
78
Table A.1.21a: Volume weighted annual mean concentrations and wet deposition of main components in
precipitation at Norwegian background stations in 1973-2013, and estimated dry deposition of sulphur and nitrogen
for the 1987-2013.
Site Year Annual vol. weighted mean concentrations Annual
precipAnnual total wet deposition
Dry deposition
SO4-S NO3-N NH4-N Ca Mg pH SO4-S NO3-N NH4-N H+ S N mg/l mg/l mg/l mg/l mg/l mm mg/m2 mg/m2 mg/m2 mekv/m² mg/m2 mg/m2
Birkenes 1973 1.06 0.11 4.27 1072 1136 58 1974 1.11 0.50 0.52 0.23 0.19 4.25 1563 1735 782 813 88 1975 1.01 0.49 0.45 0.19 0.17 4.27 1341 1354 657 603 72 1976 1.18 0.63 0.50 0.17 0.12 4.21 1434 1692 903 717 88 1977 1.04 0.54 0.54 0.17 0.17 4.27 1597 1661 862 862 86 1978 1.17 0.62 0.57 0.17 0.12 4.11 1242 1453 770 708 96 1979 1.25 0.57 0.65 0.22 0.15 4.09 1560 1950 889 1014 127 1980 1.23 0.57 0.63 0.22 0.11 4.16 1160 1427 661 731 80 1981 1.04 0.52 0.53 0.20 0.13 4.21 1316 1369 684 697 81 1982 1.05 0.56 0.72 0.22 0.21 4.27 1592 1663 887 1140 86 1983 0.91 0.49 0.50 0.24 0.17 4.33 1313 1195 646 650 62 1984 1.09 0.57 0.63 0.21 0.19 4.24 1603 1755 905 1003 93 1985 0.98 0.58 0.57 0.16 0.09 4.24 1409 1375 810 805 80 1986 1.01 0.60 0.69 0.19 0.15 4.26 1613 1622 966 1108 88 1987 0.74 0.43 0.46 0.13 0.13 4.38 1576 1168 671 719 65 159 248 1988 0.83 0.58 0.61 0.15 0.13 4.25 1986 1649 1159 1211 113 159 257 1989 0.90 0.76 0.63 0.19 0.19 4.27 1228 1106 934 776 67 136 238 1990 0.71 0.47 0.46 0.14 0.21 4.37 1861 1325 869 852 79 167 254 1991 0.75 0.57 0.50 0.14 0.19 4.33 1247 930 710 618 59 170 232 1992 0.74 0.52 0.44 0.12 0.13 4.37 1344 991 703 589 57 138 188 1993 0.77 0.55 0.51 0.15 0.23 4.37 1245 960 683 634 54 96 158 1994 0.63 0.55 0.51 0.15 0.12 4.48 1397 886 768 707 46 128 212 1995 0.53 0.48 0.42 0.09 0.14 4.47 1411 743 684 589 47 115 213 1996 0.60 0.53 0.47 0.12 0.15 4.42 1192 714 630 563 45 123 205 1997 0.52 0.50 0.45 0.10 0.13 4.50 1244 648 618 559 40 100 207 1998 0.52 0.44 0.41 0.10 0.12 4.50 1596 836 710 649 53 74 143 1999 0.47 0.43 0.36 0.11 0.15 4.59 1843 856 794 659 48 83 171
2000 0.40 0.45 0.34 0.10 0.19 4.56 2415 949 1083 823 67 78 164 2001 0.43 0.42 0.39 0.08 0.10 4.63 1604 673 680 629 38 75 177
2002 0.35 0.33 0.32 0.10 0.12 4.72 1574 558 516 497 30 83 204 2003 0.46 0.50 0.47 0.12 0.11 4.59 1375 630 693 644 35 74 171
2004 0.36 0.36 0.33 0.12 0.14 4.69 1700 615 617 567 35 63 178 2005 0.43 0.47 0.42 0.13 0.18 4.68 1241 531 586 522 26 86 226 2006 0.32 0.42 0.34 0.10 0.15 4.70 1833 582 775 624 36 96 269
2007 0.30 0.33 0.28 0.11 0.12 4.75 1441 439 471 400 26 45 122 2008 0.26 0.35 0.29 0.13 0.20 4.77 1990 511 692 570 34 46 141 2009 0.33 0.44 0.36 0.10 0.15 4.72 1807 591 792 660 34 43 - 2010 0.38 0.46 0.36 0.10 0.08 4.69 1113 421 511 401 23 53 106 2011 0.26 0.39 0.42 0.12 0.19 4.86 1779 461 685 752 25 60 162 2012 0.23 0.38 0.33 0.16 0.13 4.86 1989 448 756 648 28 43 215 2013 0.21 0.35 0.37 0.17 0.16 4.97 1427 303 501 522 15 45 152
Vatnedalen 1974 0.54 0.06 4.59 884 477 23 1975 0.53 0.17 0.22 0.09 4.85 994 527 169 219 14 1976 0.50 0.20 0.36 0.12 0.10 4.85 715 358 143 257 10 1977 0.44 0.21 0.25 0.13 0.06 4.71 761 335 160 190 15 1978 0.41 0.17 0.23 0.14 0.10 4.62 862 353 147 198 21 1979 0.56 0.22 0.20 0.20 0.06 4.38 948 531 209 190 40 1980 0.45 0.16 0.10 0.14 0.06 4.55 799 360 128 80 23 1981 0.49 0.19 0.18 0.14 0.09 4.49 900 441 171 162 29 1982 0.38 0.18 0.17 0.13 0.08 4.62 967 366 174 159 23 1983 0.29 0.13 0.10 0.14 0.08 4.76 1249 363 166 130 22 1984 0.40 0.18 0.13 0.16 0.08 4.59 762 306 138 102 20 1985 0.43 0.22 0.18 0.15 0.04 4.57 794 343 173 145 21 1986 0.51 0.21 0.19 0.13 0.07 4.54 987 506 212 183 29 1987 0.41 0.17 0.15 0.12 0.04 4.60 732 298 122 107 19 1988 0.37 0.23 0.20 0.13 0.08 4.55 898 334 207 182 25 1989 0.34 0.22 0.29 0.13 0.08 4.78 980 337 218 285 16 1990 0.27 0.14 0.12 0.14 0.11 4.71 1465 394 203 169 28 1991 0.32 0.20 0.17 0.29 0.12 4.69 865 280 172 147 18

Monitoring of long-range transported air pollutants in Norway, annual report 2013 | M-203
79
Table A.1.21a, cont.
Site Year Annual vol. weighted mean concentrations Annual
precipAnnual total wet deposition
Dry deposition
SO4-S NO3-N NH4-N Ca Mg pH SO4-S NO3-N NH4-N H+ S N mg/l mg/l mg/l mg/l mg/l mm mg/m2 mg/m2 mg/m2 mekv/m² mg/m2 mg/m2
Vatnedalen 1992 0.29 0.17 0.11 0.15 0.10 4.75 1055 301 175 112 19 cont. 1993 0.23 0.18 0.10 0.23 0.44 4.82 891 203 159 92 13 1994 0.28 0.22 0.15 0.08 0.08 4.75 1006 286 217 155 18 1995 0.25 0.18 0.13 0.11 0.10 4.82 823 206 147 108 12 1996 0.32 0.23 0.21 0.16 0.04 4.78 601 191 140 124 10 1997 0.24 0.15 0.14 0.22 0.10 4.95 858 204 130 121 10 1998 0.25 0.18 0.28 0.13 0.06 5.01 903 232 163 260 9
1999 0.24 0.16 0.24 0.12 0.08 5.05 1132 265 184 277 10 2000 0.15 0.14 0.15 0.11 0.08 5.02 1296 199 184 189 12 2001 0.15 0.09 0.10 0.12 0.05 5.27 709 103 65 73 4
2002 0.22 0.14 0.17 0.15 0.08 5.02 590 129 82 98 6 2003 0.17 0.17 0.14 0.16 0.06 4.97 802 140 132 117 9 2004 0.16 0.12 0.20 0.19 0.06 5.30 970 158 122 192 5 2005 0.18 0.15 0.14 0.16 0.05 5.17 1071 197 161 148 7 2006 0.12 0.16 0.12 0.12 0.06 5.17 1011 119 163 116 7 2007 0.10 0.11 0.13 0.17 0.10 5.31 845 84 89 110 4 2008 0.10 0.17 0.13 0.24 0.14 5.35 1016 104 171 135 5 2009 0.17 0.18 0.15 0.20 0.04 5.35 815 139 147 120 4 2010 0.19 0.15 0.19 0.17 0.04 5.40 619 115 91 118 2 2011 0.09 0.11 0.24 0.17 0.07 5.51 1225 115 132 294 4 2012 0.08 0.13 0.12 0.15 0.04 5.44 828 67 109 95 3 2013 0.09 0.14 0.35 0.14 0.05 5.50 983 92 133 344 3 Treungen 1974 0.94 0.38 0.33 0.14 0.07 4.27 1039 977 395 343 56 1975 0.91 0.37 0.34 0.15 0.06 4.26 894 814 331 304 49 1976 1.05 0.50 0.42 0.11 0.06 4.20 706 741 353 297 45 1977 0.81 0.44 0.39 0.11 0.05 4.32 1165 944 513 454 56 1978 0.87 0.38 0.41 0.14 0.04 4.21 945 822 359 387 58 1979 1980 0.88 0.37 0.39 0.14 0.04 4.23 759 668 281 296 45 1981 0.86 0.39 0.46 0.12 0.05 4.29 949 816 370 437 49 1982 0.84 0.45 0.50 0.14 0.07 4.32 1130 948 504 563 54 1983 0.83 0.40 0.43 0.18 0.05 4.35 1091 908 431 471 48 1984 0.77 0.36 0.27 0.15 0.05 4.27 1196 919 436 325 64 1985 0.68 0.39 0.37 0.13 0.04 4.33 892 608 350 333 41 1986 1.07 0.57 0.63 0.14 0.07 4.19 1030 1097 582 650 66 1987 0.68 0.37 0.37 0.13 0.07 4.39 1133 768 424 418 46 1988 0.75 0.50 0.45 0.10 0.05 4.27 1348 1006 670 612 73 1989 0.76 0.61 0.44 0.10 0.06 4.26 754 572 456 329 41 1990 0.63 0.42 0.37 0.06 0.07 4.37 1184 747 503 433 51 1991 0.59 0.42 0.34 0.13 0.06 4.42 811 480 343 278 31 1992 0.60 0.40 0.34 0.08 0.05 4.44 923 556 365 310 33 1993 0.59 0.41 0.32 0.11 0.09 4.46 803 472 329 258 28 1994 0.54 0.44 0.35 0.08 0.05 4.49 1016 544 448 356 33 1995 0.50 0.44 0.40 0.09 0.08 4.48 903 452 394 361 30 1996 0.49 0.40 0.37 0.10 0.05 4.49 838 408 335 312 27 1997 0.41 0.37 0.32 0.12 0.06 4.56 887 364 330 282 24 1998 0.48 0.40 0.41 0.09 0.04 4.53 959 462 386 397 28
1999 0.35 0.32 0.31 0.06 0.06 4.67 1329 463 427 406 28 2000 0.33 0.36 0.31 0.08 0.07 4.59 1563 510 566 483 40 2001 0.30 0.28 0.27 0.05 0.04 4.77 1141 346 324 314 19
2002 0.32 0.27 0.28 0.08 0.04 4.79 933 295 251 262 15 2003 0.35 0.36 0.35 0.09 0.04 4.67 1002 349 366 350 22 2004 0.31 0.30 0.26 0.10 0.06 4.79 1271 393 379 336 21 2005 0.34 0.38 0.37 0.11 0.06 4.75 897 308 338 329 16 2006 0.23 0.28 0.20 0.09 0.05 4.79 1522 355 433 310 25 2007 0.23 0.24 0.18 0.08 0.04 4.82 1006 226 243 178 15 2008 0.21 0.28 0.26 0.11 0.08 4.93 1150 239 318 294 13 2009 0.21 0.34 0.25 0.07 0.06 4.82 1213 260 408 302 18 2010 0.28 0.34 0.32 0.07 0.03 4.79 849 241 289 271 14 2011 0.19 0.26 0.23 0.09 0.05 4.95 1177 227 308 270 13 2012 0.15 0.28 0.23 0.07 0.05 4.96 1092 167 307 247 12 2013 0.17 0.27 0.30 0.09 0.06 5.12 1150 190 305 349 9

Monitoring of long-range transported air pollutants in Norway, annual report 2013 | M-203
80
Table A.1.21a, cont.
Site Year Annual vol. weighted mean concentrations Annual
precipAnnual total wet deposition
Dry deposition
SO4-S NO3-N NH4-N Ca Mg pH SO4-S NO3-N NH4-N H+ S N mg/l mg/l mg/l mg/l mg/l mm mg/m2 mg/m2 mg/m2 mekv/m² mg/m2 mg/m2
Løken 1973 1.03 0.06 4.48 569 586 19
1974 0.94 0.08 4.43 831 781 31 1975 1.03 0.41 0.42 0.08 4.32 657 677 269 276 31 1976 1.20 0.49 0.50 0.40 0.09 4.39 533 640 261 267 22 1977 0.96 0.41 0.43 0.22 0.07 4.41 699 671 287 301 27 1978 1.10 0.48 0.52 0.24 0.07 4.25 597 657 287 310 34 1979 1.03 0.49 0.57 0.30 0.07 4.22 784 808 384 447 47 1980 0.97 0.39 0.49 0.25 0.08 4.33 695 674 271 341 33 1981 0.77 0.36 0.51 0.20 0.06 4.48 700 539 252 357 23 1982 1.06 0.60 0.79 0.24 0.11 4.33 885 908 515 679 40 1983 0.91 0.47 0.62 0.28 0.10 4.42 656 595 311 404 25 1984 0.91 0.49 0.76 0.30 0.10 4.45 747 678 365 567 27 1985 0.86 0.47 0.51 0.30 0.09 4.36 894 768 421 459 39 1986 0.96 0.57 0.56 0.26 0.08 4.31 701 671 399 391 34 1987 0.79 0.40 0.45 0.17 0.06 4.40 861 679 348 387 35 1988 0.76 0.49 0.49 0.20 0.08 4.31 882 669 435 429 43 1989 0.92 0.69 0.57 0.18 0.10 4.26 421 389 292 239 55 1990 0.74 0.47 0.44 0.12 0.08 4.36 719 530 337 313 31 1991 0.65 0.50 0.44 0.18 0.09 4.41 722 467 359 320 28 1992 0.61 0.44 0.38 0.11 0.05 4.46 686 418 302 261 24 1993 0.66 0.44 0.38 0.18 0.05 4.46 714 468 316 270 25 1994 0.43 0.37 0.29 0.30 0.06 4.64 740 316 277 213 17 1995 0.52 0.43 0.36 0.24 0.09 4.56 656 340 282 235 18 1996 0.51 0.39 0.39 0.28 0.09 4.62 673 344 264 264 16 1997 0.42 0.40 0.41 0.16 0.06 4.63 549 229 220 223 13 1998 0.45 0.39 0.38 0.14 0.07 4.63 717 319 278 272 17
1999 0.38 0.36 0.35 0.10 0.06 4.71 1011 383 362 353 20 2000 0.33 0.33 0.24 0.07 0.06 4.60 1053 332 349 249 26 2001 0.33 0.31 0.26 0.13 0.04 4.75 818 265 253 213 14 2002 0.26 0.29 0.25 0.12 0.04 4.84 856 226 244 215 12 2003 0.33 0.37 0.34 0.15 0.05 4.72 651 212 244 221 12 2004 0.23 0.28 0.20 0.13 0.07 4.80 953 222 267 189 15 2005 0.34 0.38 0.32 0.14 0.06 4.77 686 236 260 217 12 2006 0.21 0.34 0.30 0.09 0.06 4.79 967 205 324 287 16 2007 0.24 0.30 0.28 0.16 0.06 4.92 727 177 216 204 9 2008 0.19 0.28 0.22 0.13 0.09 4.90 997 192 283 223 13 2009 0.17 0.32 0.29 0.11 0.06 5.06 837 140 267 247 7 2010 0.23 0.29 0.24 0.12 0.04 4.95 664 150 193 158 8 2011 0.21 0.25 0.41 0.14 0.08 5.12 1100 228 278 452 8 2012 0.16 0.27 0.23 0.12 0.05 5.04 762 124 204 173 7 2013 0.17 0.27 0.49 0.14 0.09 5.22 834 145 229 405 5 Nordmoen 1987 0.72 0.37 0.33 0.14 0.03 4.34 1016 727 375 335 46 148 348 1988 0.88 0.48 0.46 0.13 0.04 4.25 1085 960 519 500 61 171 357 1989 0.88 0.57 0.40 0.14 0.05 4.26 816 719 463 328 44 144 356 1990 0.77 0.44 0.35 0.10 0.05 4.31 822 636 366 286 40 137 332 1991 0.59 0.40 0.31 0.09 0.04 4.43 781 459 312 240 29 117 284 1992 0.58 0.40 0.27 0.10 0.03 4.42 821 473 327 218 31 99 276 1993 0.56 0.37 0.25 0.08 0.03 4.45 927 517 340 236 33 84 246 1994 0.45 0.39 0.29 0.07 0.03 4.55 828 373 326 242 23 97 280 1995 0.53 0.37 0.33 0.12 0.06 4.49 791 415 292 257 25 88 279 1996 0.43 0.34 0.23 0.14 0.04 4.52 837 358 286 195 25 91 303 1997 0.33 0.31 0.26 0.07 0.02 4.63 775 254 240 202 18 1998 0.36 0.28 0.21 0.11 0.03 4.64 817 293 224 173 19 1999 0.37 0.31 0.26 0.08 0.03 4.65 1014 376 316 262 22 Hurdal 1998 0.38 0.29 0.28 0.09 0.03 4.68 853 325 249 236 18 54 172
1999 0.39 0.33 0.31 0.08 0.03 4.67 1110 434 367 344 24 64 169 2000 0.31 0.31 0.24 0.07 0.05 4.64 1336 418 408 314 30 57 170 2001 0.33 0.36 0.29 0.08 0.03 4.69 961 318 347 275 20 52
2002 0.25 0.27 0.26 0.09 0.03 4.79 732 183 197 187 12 60 2003 0.32 0.35 0.32 0.09 0.04 4.66 830 263 289 268 18 63 2004 0.24 0.27 0.28 0.11 0.03 4.84 903 219 241 248 13 53 189

Monitoring of long-range transported air pollutants in Norway, annual report 2013 | M-203
81
Table A.1.21a, cont.
Site Year Annual vol. weighted mean concentrations Annual
precipAnnual total wet deposition
Dry deposition
SO4-S NO3-N NH4-N Ca Mg pH SO4-S NO3-N NH4-N H+ S N mg/l mg/l mg/l mg/l mg/l mm mg/m2 mg/m2 mg/m2 mekv/m² mg/m2 mg/m2
Hurdal 2005 0.35 0.43 0.44 0.12 0.05 4.89 739 258 317 324 9 65 268 cont. 2006 0.23 0.33 0.35 0.15 0.05 5.06 1043 245 348 370 9 74 273 2007 0.26 0.28 0.36 0.23 0.05 5.13 809 208 228 295 6 37 195 2008 0.20 0.32 0.31 0.19 0.06 5.10 1068 219 338 335 8 32 189 2009 0.21 0.27 0.24 0.14 0.04 5.09 909 188 249 222 7 29 - 2010 0.28 0.35 0.36 0.09 0.02 4.88 809 224 283 291 11 34 144 2011 0.23 0.32 0.47 0.13 0.04 5.04 1300 295 415 605 12 49 203 2012 0.17 0.27 0.21 0.07 0.03 4.93 1129 186 308 239 13 35 230 2013 0.17 0.26 0.38 0.15 0.05 5.18 896 156 233 340 6 28 182 Gulsvik 1974 0.81 0.38 0.28 0.13 0.04 4.28 783 634 298 219 41 1975 0.89 0.40 0.34 0.21 0.05 4.36 560 498 224 190 24 1976 0.85 0.38 0.30 0.10 0.03 4.35 641 545 244 192 29 1977 0.77 0.39 0.35 0.13 0.03 4.35 683 526 266 239 31 1978 0.94 0.40 0.38 0.16 0.03 4.22 693 651 277 263 42 1979 1.27 0.53 0.62 0.23 0.04 4.11 790 1003 419 490 61 1980 0.78 0.25 0.27 0.13 0.03 4.33 667 520 167 180 31 1981 0.86 0.35 0.40 0.13 0.03 4.30 628 540 220 251 31 1982 0.89 0.44 0.52 0.22 0.05 4.38 778 696 346 408 33 1983 0.94 0.40 0.58 0.25 0.05 4.39 664 623 263 384 27 1984 0.87 0.40 0.58 0.25 0.04 4.41 946 819 382 547 37 1985 0.73 0.35 0.72 0.16 0.04 4.55 686 499 240 492 20 1986 0.89 0.48 0.51 0.15 0.04 4.30 804 711 382 409 40 1987 0.74 0.37 0.46 0.14 0.03 4.42 916 679 337 421 35 1988 0.67 0.41 0.38 0.09 0.03 4.33 1023 688 420 386 48 136 1989 0.76 0.54 0.55 0.15 0.06 4.42 668 507 360 369 25 88 1990 0.75 0.45 0.53 0.09 0.03 4.43 753 562 338 398 28 100 1991 0.60 0.42 0.46 0.13 0.04 4.58 506 302 212 235 13 97 1992 0.56 0.35 0.38 0.13 0.03 4.60 666 371 235 255 17 83 1993 0.50 0.33 0.40 0.12 0.03 4.66 680 343 222 269 15 60 1994 0.50 0.43 0.39 0.23 0.03 4.61 643 320 277 249 16 72 1995 0.56 0.39 0.42 0.12 0.04 4.54 634 354 249 268 18 64 1996 0.48 0.37 0.51 0.16 0.06 4.71 657 318 241 335 13 67 1997 0.35 0.32 0.33 0.12 0.04 4.74 704 247 225 232 13 52 Brekkebygda 1998 0.38 0.29 0.25 0.08 0.02 4.62 886 336 256 224 21 36
1999 0.38 0.30 0.27 0.09 0.02 4.71 845 318 254 227 16 41 2000 0.37 0.29 0.23 0.17 0.06 4.69 1261 451 363 285 26 40
2001 0.31 0.25 0.29 0.08 0.04 4.81 865 269 223 265 13 2002 0.25 0.18 0.30 0.15 0.04 5.10 839 208 155 255 7 2003 0.30 0.26 0.28 0.17 0.06 4.89 852 257 224 242 11 2004 0.26 0.19 0.21 0.22 0.07 5.03 851 218 159 180 8 2005 0.36 0.33 0.35 0.12 0.03 4.87 754 275 249 267 10 2006 0.26 0.26 0.29 0.12 0.04 4.92 934 243 247 268 11 2007 0.18 0.18 0.16 0.13 0.03 4.98 1093 201 196 175 11 2008 0.23 0.31 0.32 0.12 0.03 4.94 950 220 298 299 11 2009 0.25 0.33 0.25 0.09 0.03 4.96 924 233 308 228 10 2010 0.24 0.24 0.33 0.07 0.02 5.03 831 200 203 272 8 2011 0.23 0.28 0.45 0.09 0.03 5.04 1387 320 388 629 13 2012 0.15 0.26 0.27 0.16 0.03 5.17 1086 165 282 289 7 2013 0.17 0.22 0.25 0.13 0.04 5.21 1202 207 268 304 7 Vikedal 1984 0.51 0.24 0.27 0.24 0.25 4.57 1932 985 465 516 52 1985 0.63 0.30 0.33 0.21 0.20 4.45 2223 1390 672 734 79 1986 0.56 0.25 0.30 0.15 0.26 4.53 3017 1680 752 898 89 1987 0.54 0.27 0.34 0.13 0.18 4.51 1943 1059 519 663 60 1988 0.43 0.26 0.25 0.13 0.24 4.51 2694 1163 712 684 84 1989 0.53 0.32 0.23 0.14 0.26 4.46 2998 1582 949 704 104 1990 0.44 0.22 0.31 0.15 0.35 4.58 3341 1463 724 1036 88 1991 0.44 0.26 0.27 0.14 0.33 4.60 2962 1293 764 797 75 1992 0.40 0.22 0.24 0.12 0.22 4.70 3214 1281 710 771 64 1993 0.41 0.24 0.27 0.22 0.48 4.69 2009 818 484 545 41 1994 0.47 0.28 0.30 0.15 0.36 4.64 2744 1277 780 833 63 1995 0.35 0.23 0.23 0.13 0.24 4.72 2635 914 607 609 50 1996 0.31 0.23 0.28 0.16 0.16 4.78 1819 556 416 513 30

Monitoring of long-range transported air pollutants in Norway, annual report 2013 | M-203
82
Table A.1.21a, cont.
Site Year Annual vol. weighted mean concentrations Annual
precipAnnual total wet deposition
Dry deposition
SO4-S NO3-N NH4-N Ca Mg pH SO4-S NO3-N NH4-N H+ S N mg/l mg/l mg/l mg/l mg/l mm mg/m2 mg/m2 mg/m2 mekv/m² mg/m2 mg/m2
Vikedal 1997 0.35 0.20 0.28 0.24 0.39 4.75 2472 870 504 684 44 cont. 1998 0.32 0.24 0.25 0.11 0.21 4.77 2690 872 646 678 46
1999 0.27 0.22 0.22 0.12 0.27 4.82 3108 840 689 675 47 2000 0.25 0.22 0.22 0.12 0.26 4.82 2918 734 645 631 45 2001 0.26 0.22 0.28 0.11 0.20 4.96 2353 616 529 652 26 2002 0.29 0.26 0.39 0.14 0.24 4.94 2239 658 574 878 26
2003 0.26 0.25 0.29 0.11 0.21 4.86 2792 714 708 805 38 2004 0.17 0.19 0.29 0.12 0.23 5.08 2816 488 532 819 23 2005 0.21 0.21 0.29 0.15 0.31 5.07 3033 639 646 888 26 2006 0.18 0.22 0.24 0.15 0.28 5.10 2771 500 607 679 22 2007 0.14 0.17 0.28 0.22 0.40 5.24 3147 435 532 865 18 2008 0.14 0.17 0.20 0.22 0.42 5.24 2986 434 506 612 17 2009 0.17 0.20 0.26 0.10 0.20 5.33 2545 430 500 673 12 2010 0.29 0.28 0.31 0.28 0.12 5.26 1834 529 506 569 10 2011 0.11 0.18 0.37 0.15 0.34 5.33 3319 364 612 1224 16 2012 0.10 0.17 0.28 0.12 0.21 5.34 2557 268 427 724 12 2013 0.12 0.18 0.41 0.21 0.29 5.48 2534 304 467 1049 8 Haukeland 1974 0.31 0.13 0.15 0.17 0.29 4.70 3901 1207 522 582 78 1975 0.36 0.10 0.17 0.17 0.37 4.73 4551 1636 431 753 85 1976 0.59 0.23 0.45 0.18 0.25 4.59 1808 1060 417 813 46 1982 0.48 0.18 0.20 0.14 0.24 4.56 3688 1756 674 722 101 1983 0.32 0.14 0.14 0.15 0.26 4.70 4769 1536 647 687 96 1984 0.42 0.16 0.28 0.20 0.22 4.63 2792 1157 454 783 65 1985 0.44 0.21 0.26 0.13 0.15 4.61 2930 1276 606 768 71 1986 0.36 0.16 0.20 0.12 0.20 4.71 4009 1459 621 796 77 1987 0.44 0.20 0.28 0.16 0.18 4.61 2493 1100 498 692 61 1988 0.35 0.21 0.28 0.14 0.24 4.63 3123 1096 642 872 74 1989 0.32 0.18 0.15 0.13 0.26 4.71 4525 1426 798 691 88 1990 0.27 0.13 0.15 0.11 0.29 4.79 5017 1364 665 744 82 1991 0.30 0.16 0.18 0.15 0.29 4.75 3744 1126 617 678 66 1992 0.32 0.17 0.17 0.14 0.22 4.77 4436 1421 768 771 76 1993 0.34 0.19 0.26 0.26 0.65 4.77 2891 974 556 760 50 1994 0.30 0.18 0.20 0.16 0.28 4.83 3670 1108 668 751 55 1995 0.21 0.14 0.17 0.11 0.22 4.89 3631 766 505 616 47 1996 0.27 0.19 0.26 0.11 0.14 4.85 2201 586 416 566 31 1997 0.17 0.14 0.12 0.08 0.14 4.87 3569 769 550 844 36 1998 0.22 0.15 0.19 0.09 0.17 4.93 3492 760 513 649 41 1999 0.21 0.15 0.17 0.11 0.23 4.99 4315 864 641 743 44 2000 0.20 0.15 0.15 0.13 0.28 4.95 3692 752 557 539 41 2001 0.18 0.15 0.22 0.09 0.18 5.08 2865 518 442 637 24 2002 0.23 0.19 0.22 0.16 0.25 4.97 2644 603 496 576 29 2003 0.15 0.14 0.13 0.11 0.18 4.96 3624 540 496 476 40 2004 0.12 0.12 0.10 0.09 0.19 5.01 3669 436 452 372 36 2005 0.19 0.14 0.14 0.11 0.17 5.06 4394 818 624 610 39 2006 0.15 0.17 0.13 0.12 0.17 5.03 3454 504 594 462 32 2007 0.09 0.09 0.10 0.12 0.23 5.18 4124 367 374 424 27 2008 0.09 0.13 0.12 0.15 0.31 5.16 3649 342 475 441 25 2009 0.11 0.12 0.11 0.07 0.15 5.20 3105 335 362 328 19 2010 0.17 0.19 0.16 0.05 0.08 5.13 2355 407 438 375 18 2011 0.08 0.11 0.20 0.11 0.25 5.22 4196 343 465 823 25 2012 0.07 0.10 0.09 0.09 0.19 5.27 3707 254 383 336 20 2013 0.08 0.11 0.16 0.11 0.21 5.29 3415 259 360 557 17 Nausta 1985 0.29 0.13 0.09 0.09 0.12 4.70 1943 561 246 177 39 1986 0.27 0.10 0.08 0.09 0.16 4.74 2314 614 227 176 42 1987 0.27 0.12 0.11 0.09 0.11 4.72 1969 523 236 213 37 1988 0.21 0.13 0.09 0.14 0.23 4.68 2253 476 302 193 47 1989 0.21 0.12 0.07 0.10 0.23 4.80 3330 708 407 227 53 91 1990 0.23 0.11 0.07 0.09 0.23 4.78 3549 808 380 254 58 72 1991 0.19 0.12 0.09 0.12 0.30 4.83 2411 470 291 219 35 80 1992 0.21 0.13 0.07 0.09 0.15 4.80 2962 633 373 205 47 73
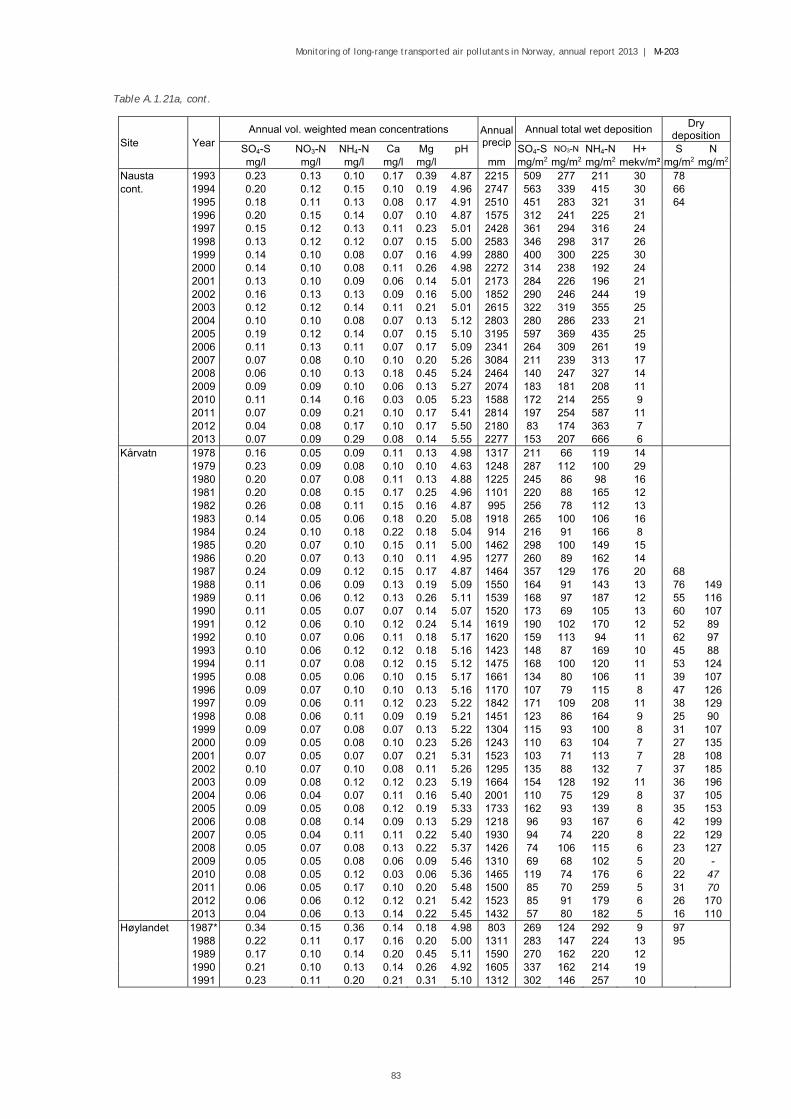
Monitoring of long-range transported air pollutants in Norway, annual report 2013 | M-203
83
Table A.1.21a, cont.
Site Year Annual vol. weighted mean concentrations Annual
precipAnnual total wet deposition
Dry deposition
SO4-S NO3-N NH4-N Ca Mg pH SO4-S NO3-N NH4-N H+ S N mg/l mg/l mg/l mg/l mg/l mm mg/m2 mg/m2 mg/m2 mekv/m² mg/m2 mg/m2
Nausta 1993 0.23 0.13 0.10 0.17 0.39 4.87 2215 509 277 211 30 78 cont. 1994 0.20 0.12 0.15 0.10 0.19 4.96 2747 563 339 415 30 66 1995 0.18 0.11 0.13 0.08 0.17 4.91 2510 451 283 321 31 64 1996 0.20 0.15 0.14 0.07 0.10 4.87 1575 312 241 225 21 1997 0.15 0.12 0.13 0.11 0.23 5.01 2428 361 294 316 24 1998 0.13 0.12 0.12 0.07 0.15 5.00 2583 346 298 317 26
1999 0.14 0.10 0.08 0.07 0.16 4.99 2880 400 300 225 30 2000 0.14 0.10 0.08 0.11 0.26 4.98 2272 314 238 192 24 2001 0.13 0.10 0.09 0.06 0.14 5.01 2173 284 226 196 21
2002 0.16 0.13 0.13 0.09 0.16 5.00 1852 290 246 244 19 2003 0.12 0.12 0.14 0.11 0.21 5.01 2615 322 319 355 25 2004 0.10 0.10 0.08 0.07 0.13 5.12 2803 280 286 233 21 2005 0.19 0.12 0.14 0.07 0.15 5.10 3195 597 369 435 25 2006 0.11 0.13 0.11 0.07 0.17 5.09 2341 264 309 261 19 2007 0.07 0.08 0.10 0.10 0.20 5.26 3084 211 239 313 17 2008 0.06 0.10 0.13 0.18 0.45 5.24 2464 140 247 327 14 2009 0.09 0.09 0.10 0.06 0.13 5.27 2074 183 181 208 11 2010 0.11 0.14 0.16 0.03 0.05 5.23 1588 172 214 255 9 2011 0.07 0.09 0.21 0.10 0.17 5.41 2814 197 254 587 11 2012 0.04 0.08 0.17 0.10 0.17 5.50 2180 83 174 363 7 2013 0.07 0.09 0.29 0.08 0.14 5.55 2277 153 207 666 6 Kårvatn 1978 0.16 0.05 0.09 0.11 0.13 4.98 1317 211 66 119 14 1979 0.23 0.09 0.08 0.10 0.10 4.63 1248 287 112 100 29 1980 0.20 0.07 0.08 0.11 0.13 4.88 1225 245 86 98 16 1981 0.20 0.08 0.15 0.17 0.25 4.96 1101 220 88 165 12 1982 0.26 0.08 0.11 0.15 0.16 4.87 995 256 78 112 13 1983 0.14 0.05 0.06 0.18 0.20 5.08 1918 265 100 106 16 1984 0.24 0.10 0.18 0.22 0.18 5.04 914 216 91 166 8 1985 0.20 0.07 0.10 0.15 0.11 5.00 1462 298 100 149 15 1986 0.20 0.07 0.13 0.10 0.11 4.95 1277 260 89 162 14 1987 0.24 0.09 0.12 0.15 0.17 4.87 1464 357 129 176 20 68 1988 0.11 0.06 0.09 0.13 0.19 5.09 1550 164 91 143 13 76 149 1989 0.11 0.06 0.12 0.13 0.26 5.11 1539 168 97 187 12 55 116 1990 0.11 0.05 0.07 0.07 0.14 5.07 1520 173 69 105 13 60 107 1991 0.12 0.06 0.10 0.12 0.24 5.14 1619 190 102 170 12 52 89 1992 0.10 0.07 0.06 0.11 0.18 5.17 1620 159 113 94 11 62 97 1993 0.10 0.06 0.12 0.12 0.18 5.16 1423 148 87 169 10 45 88 1994 0.11 0.07 0.08 0.12 0.15 5.12 1475 168 100 120 11 53 124 1995 0.08 0.05 0.06 0.10 0.15 5.17 1661 134 80 106 11 39 107 1996 0.09 0.07 0.10 0.10 0.13 5.16 1170 107 79 115 8 47 126 1997 0.09 0.06 0.11 0.12 0.23 5.22 1842 171 109 208 11 38 129 1998 0.08 0.06 0.11 0.09 0.19 5.21 1451 123 86 164 9 25 90
1999 0.09 0.07 0.08 0.07 0.13 5.22 1304 115 93 100 8 31 107 2000 0.09 0.05 0.08 0.10 0.23 5.26 1243 110 63 104 7 27 135 2001 0.07 0.05 0.07 0.07 0.21 5.31 1523 103 71 113 7 28 108
2002 0.10 0.07 0.10 0.08 0.11 5.26 1295 135 88 132 7 37 185 2003 0.09 0.08 0.12 0.12 0.23 5.19 1664 154 128 192 11 36 196 2004 0.06 0.04 0.07 0.11 0.16 5.40 2001 110 75 129 8 37 105 2005 0.09 0.05 0.08 0.12 0.19 5.33 1733 162 93 139 8 35 153 2006 0.08 0.08 0.14 0.09 0.13 5.29 1218 96 93 167 6 42 199 2007 0.05 0.04 0.11 0.11 0.22 5.40 1930 94 74 220 8 22 129 2008 0.05 0.07 0.08 0.13 0.22 5.37 1426 74 106 115 6 23 127 2009 0.05 0.05 0.08 0.06 0.09 5.46 1310 69 68 102 5 20 - 2010 0.08 0.05 0.12 0.03 0.06 5.36 1465 119 74 176 6 22 47 2011 0.06 0.05 0.17 0.10 0.20 5.48 1500 85 70 259 5 31 70 2012 0.06 0.06 0.12 0.12 0.21 5.42 1523 85 91 179 6 26 170 2013 0.04 0.06 0.13 0.14 0.22 5.45 1432 57 80 182 5 16 110 Høylandet 1987* 0.34 0.15 0.36 0.14 0.18 4.98 803 269 124 292 9 97 1988 0.22 0.11 0.17 0.16 0.20 5.00 1311 283 147 224 13 95 1989 0.17 0.10 0.14 0.20 0.45 5.11 1590 270 162 220 12 1990 0.21 0.10 0.13 0.14 0.26 4.92 1605 337 162 214 19 1991 0.23 0.11 0.20 0.21 0.31 5.10 1312 302 146 257 10

Monitoring of long-range transported air pollutants in Norway, annual report 2013 | M-203
84
Table A.1.21a, cont.
Site Year Annual vol. weighted mean concentrations Annual
precipAnnual total wet deposition
Dry deposition
SO4-S NO3-N NH4-N Ca Mg pH SO4-S NO3-N NH4-N H+ S N mg/l mg/l mg/l mg/l mg/l mm mg/m2 mg/m2 mg/m2 mekv/m² mg/m2 mg/m2
Høylandet 1992 0.15 0.09 0.15 0.16 0.36 5.16 1415 214 122 215 10 cont. 1993 0.20 0.12 0.20 0.17 0.35 5.10 1145 230 138 234 9 1994 0.15 0.09 0.22 0.12 0.25 5.23 1182 175 107 265 7 1995 0.17 0.10 0.22 0.17 0.27 5.20 1509 259 153 332 9 1996 0.16 0.10 0.21 0.16 0.26 5.11 813 132 84 167 6 1997 0.14 0.10 0.22 0.17 0.32 5.25 1418 196 145 308 8 1998 0.12 0.08 0.22 0.13 0.19 5.46 1456 173 123 316 5 1999 0.14 0.10 0.27 0.13 0.19 5.41 1195 171 125 342 5 2000 0.12 0.08 0.21 0.18 0.35 5.36 1183 150 95 248 5 2001 0.14 0.08 0.24 0.17 0.38 5.37 1282 177 107 314 5 2002 0.14 0.11 0.27 0.16 0.22 5.40 855 117 91 233 3 2003 0.11 0.10 0.23 0.22 0.37 5.25 1536 170 154 359 9 2004 0.06 0.08 0.21 0.21 0.35 5.57 1390 87 105 298 4 2005 0.15 0.10 0.26 0.16 0.29 5.44 1786 263 180 470 7 2006 0.11 0.14 0.32 0.17 0.33 5.47 1182 131 160 381 4 2007 0.08 0.12 0.38 0.25 0.49 5.88 1070 85 126 407 1 2008 0.11 0.11 0.33 0.32 0.51 5.78 1030 117 109 337 2 2009 0.07 0.11 0.27 0.11 0.18 5.68 1152 85 122 315 2 2010 0.13 0.09 0.31 0.07 0.10 5.68 926 124 83 284 2 2011 0.06 0.07 0.49 0.19 0.35 5.86 1632 101 111 797 2 2012 0.04 0.11 0.32 0.21 0.33 5.83 1360 61 155 440 2 2013 0.06 0.08 0.34 0.17 0.24 5.67 1551 94 119 529 3
Tustervatn 1973 0.24 0.18 4.94 1336 321 15
1974 0.28 0.11 4.88 695 195 9
1975 0.25 0.33 4.91 1756 439 22
1976 0.27 0.16 4.97 1064 287 11 1977 0.30 0.09 0.11 0.17 0.16 4.91 1111 333 100 122 14 1978 0.23 0.08 0.10 0.16 0.16 4.85 1128 259 90 113 16 1979 0.28 0.08 0.13 0.15 0.11 4.73 1168 327 93 152 22 1980 0.27 0.08 0.14 0.47 0.16 4.98 858 229 71 122 9 1981 0.18 0.07 0.10 0.21 0.15 5.00 1099 198 77 110 11 1982 0.16 0.08 0.09 0.22 0.47 4.98 1385 227 109 121 15 1983 0.20 0.06 0.09 0.16 0.22 4.90 1665 337 101 142 21 1984 0.24 0.09 0.09 0.12 0.10 4.85 1056 250 94 89 15 1985 0.22 0.08 0.10 0.12 0.15 4.93 1344 298 107 132 16 1986 0.26 0.09 0.12 0.12 0.15 4.88 1060 278 94 131 14 1987 0.22 0.08 0.11 0.12 0.12 4.89 1163 253 98 133 15 96 1988 0.13 0.07 0.09 0.13 0.15 5.04 1159 145 83 106 10 88 131 1989 0.19 0.08 0.10 0.18 0.40 5.00 1825 346 137 178 18 40 119 1990 0.16 0.09 0.14 0.11 0.21 4.99 1508 245 133 214 16 65 125 1991 0.17 0.10 0.14 0.14 0.21 5.04 1400 242 137 197 13 62 148 1992 0.15 0.08 0.15 0.19 0.37 5.12 1507 223 126 221 11 49 123 1993 0.14 0.08 0.16 0.24 0.50 5.19 1340 182 111 209 9 44 126 1994 0.10 0.08 0.13 0.12 0.15 5.24 1117 114 87 144 6 48 147 1995 0.09 0.06 0.12 0.13 0.21 5.22 1515 136 96 186 9 47 132 1996 0.12 0.09 0.16 0.15 0.18 5.11 1084 132 97 176 8 44 139 1997 0.08 0.06 0.18 0.17 0.30 5.34 1528 121 98 271 7 44 199 1998 0.07 0.06 0.16 0.11 0.18 5.39 1407 100 90 230 6 30 178
1999 0.09 0.08 0.17 0.07 0.08 5.38 1133 96 90 191 5 34 180 2000 0.10 0.06 0.15 0.11 0.20 5.33 1313 116 80 191 6 29 164 2001 0.08 0.06 0.15 0.10 0.19 5.36 1449 107 94 223 6 31 182
2002 0.09 0.07 0.14 0.11 0.17 5.38 1162 103 82 157 5 38 207 2003 0.07 0.07 0.18 0.16 0.26 5.32 1513 111 112 274 7 35 196 2004 0.04 0.07 0.17 0.20 0.23 5.50 1428 62 97 243 5 34 167 2005 0.12 0.08 0.18 0.15 0.19 5.39 1302 163 109 241 5 39 185 2006 0.08 0.10 0.13 0.12 0.20 5.30 1208 97 119 153 6 37 219 2007 0.07 0.08 0.14 0.13 0.26 5.28 1293 91 106 174 7 24 163 2008 0.07 0.08 0.09 0.16 0.22 5.33 1165 80 93 101 5 22 172 2009 0.05 0.06 0.11 0.06 0.10 5.40 1155 63 71 126 5 22 -
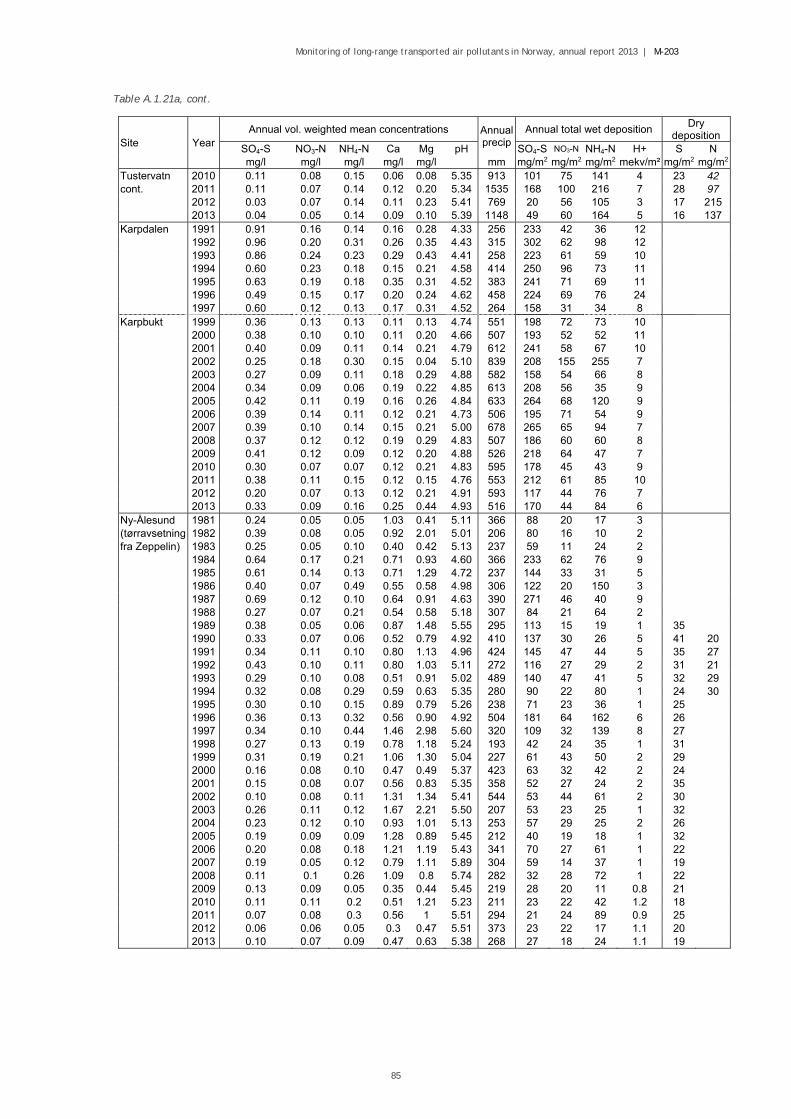
Monitoring of long-range transported air pollutants in Norway, annual report 2013 | M-203
85
Table A.1.21a, cont.
Site Year Annual vol. weighted mean concentrations Annual
precipAnnual total wet deposition
Dry deposition
SO4-S NO3-N NH4-N Ca Mg pH SO4-S NO3-N NH4-N H+ S N mg/l mg/l mg/l mg/l mg/l mm mg/m2 mg/m2 mg/m2 mekv/m² mg/m2 mg/m2
Tustervatn 2010 0.11 0.08 0.15 0.06 0.08 5.35 913 101 75 141 4 23 42 cont. 2011 0.11 0.07 0.14 0.12 0.20 5.34 1535 168 100 216 7 28 97 2012 0.03 0.07 0.14 0.11 0.23 5.41 769 20 56 105 3 17 215 2013 0.04 0.05 0.14 0.09 0.10 5.39 1148 49 60 164 5 16 137 Karpdalen 1991 0.91 0.16 0.14 0.16 0.28 4.33 256 233 42 36 12 1992 0.96 0.20 0.31 0.26 0.35 4.43 315 302 62 98 12 1993 0.86 0.24 0.23 0.29 0.43 4.41 258 223 61 59 10 1994 0.60 0.23 0.18 0.15 0.21 4.58 414 250 96 73 11 1995 0.63 0.19 0.18 0.35 0.31 4.52 383 241 71 69 11 1996 0.49 0.15 0.17 0.20 0.24 4.62 458 224 69 76 24 1997 0.60 0.12 0.13 0.17 0.31 4.52 264 158 31 34 8 Karpbukt 1999 0.36 0.13 0.13 0.11 0.13 4.74 551 198 72 73 10 2000 0.38 0.10 0.10 0.11 0.20 4.66 507 193 52 52 11 2001 0.40 0.09 0.11 0.14 0.21 4.79 612 241 58 67 10 2002 0.25 0.18 0.30 0.15 0.04 5.10 839 208 155 255 7 2003 0.27 0.09 0.11 0.18 0.29 4.88 582 158 54 66 8 2004 0.34 0.09 0.06 0.19 0.22 4.85 613 208 56 35 9 2005 0.42 0.11 0.19 0.16 0.26 4.84 633 264 68 120 9 2006 0.39 0.14 0.11 0.12 0.21 4.73 506 195 71 54 9 2007 0.39 0.10 0.14 0.15 0.21 5.00 678 265 65 94 7 2008 0.37 0.12 0.12 0.19 0.29 4.83 507 186 60 60 8 2009 0.41 0.12 0.09 0.12 0.20 4.88 526 218 64 47 7 2010 0.30 0.07 0.07 0.12 0.21 4.83 595 178 45 43 9 2011 0.38 0.11 0.15 0.12 0.15 4.76 553 212 61 85 10 2012 0.20 0.07 0.13 0.12 0.21 4.91 593 117 44 76 7 2013 0.33 0.09 0.16 0.25 0.44 4.93 516 170 44 84 6 Ny-Ålesund 1981 0.24 0.05 0.05 1.03 0.41 5.11 366 88 20 17 3 (tørravsetning 1982 0.39 0.08 0.05 0.92 2.01 5.01 206 80 16 10 2 fra Zeppelin) 1983 0.25 0.05 0.10 0.40 0.42 5.13 237 59 11 24 2 1984 0.64 0.17 0.21 0.71 0.93 4.60 366 233 62 76 9 1985 0.61 0.14 0.13 0.71 1.29 4.72 237 144 33 31 5 1986 0.40 0.07 0.49 0.55 0.58 4.98 306 122 20 150 3 1987 0.69 0.12 0.10 0.64 0.91 4.63 390 271 46 40 9 1988 0.27 0.07 0.21 0.54 0.58 5.18 307 84 21 64 2 1989 0.38 0.05 0.06 0.87 1.48 5.55 295 113 15 19 1 35 1990 0.33 0.07 0.06 0.52 0.79 4.92 410 137 30 26 5 41 20 1991 0.34 0.11 0.10 0.80 1.13 4.96 424 145 47 44 5 35 27 1992 0.43 0.10 0.11 0.80 1.03 5.11 272 116 27 29 2 31 21 1993 0.29 0.10 0.08 0.51 0.91 5.02 489 140 47 41 5 32 29 1994 0.32 0.08 0.29 0.59 0.63 5.35 280 90 22 80 1 24 30 1995 0.30 0.10 0.15 0.89 0.79 5.26 238 71 23 36 1 25 1996 0.36 0.13 0.32 0.56 0.90 4.92 504 181 64 162 6 26 1997 0.34 0.10 0.44 1.46 2.98 5.60 320 109 32 139 8 27 1998 0.27 0.13 0.19 0.78 1.18 5.24 193 42 24 35 1 31 1999 0.31 0.19 0.21 1.06 1.30 5.04 227 61 43 50 2 29 2000 0.16 0.08 0.10 0.47 0.49 5.37 423 63 32 42 2 24 2001 0.15 0.08 0.07 0.56 0.83 5.35 358 52 27 24 2 35 2002 0.10 0.08 0.11 1.31 1.34 5.41 544 53 44 61 2 30 2003 0.26 0.11 0.12 1.67 2.21 5.50 207 53 23 25 1 32 2004 0.23 0.12 0.10 0.93 1.01 5.13 253 57 29 25 2 26 2005 0.19 0.09 0.09 1.28 0.89 5.45 212 40 19 18 1 32 2006 0.20 0.08 0.18 1.21 1.19 5.43 341 70 27 61 1 22 2007 0.19 0.05 0.12 0.79 1.11 5.89 304 59 14 37 1 19 2008 0.11 0.1 0.26 1.09 0.8 5.74 282 32 28 72 1 22 2009 0.13 0.09 0.05 0.35 0.44 5.45 219 28 20 11 0.8 21 2010 0.11 0.11 0.2 0.51 1.21 5.23 211 23 22 42 1.2 18 2011 0.07 0.08 0.3 0.56 1 5.51 294 21 24 89 0.9 25 2012 0.06 0.06 0.05 0.3 0.47 5.51 373 23 22 17 1.1 20 2013 0.10 0.07 0.09 0.47 0.63 5.38 268 27 18 24 1.1 19

Monitoring of long-range transported air pollutants in Norway, annual report 2013 | M-203
86
Table A.1.21b: Volume weighted annual mean concentrations and wet deposition of main components in
precipitation and estimated dry deposition of sulphur and nitrogen at Norwegian background stations which has
been closed down.
Site Year Annual vol. weighted mean concentrations Annual
precip Annual total wet deposition Dry deposition
SO4-S NO3-N NH4-N Ca Mg pH SO4-S NO3-N NH4-N H+ S N mg/l mg/l mg/l mg/l mg/l mm mg/m2 mg/m2 mg/m2 mekv/m² mg/m2 mg/m2
Lista 1973 1.01 1.31 4.33 851 860 40
1974 1.06 1.00 4.28 1208 1280 63
1975 1.10 1.06 4.30 1109 1220 56
1976 1.37 1.21 4.23 922 1263 54
1977 0.95 1.09 4.34 1114 1058 51 1978 1.01 0.50 0.45 0.51 1.07 4.27 931 940 466 419 50 1979 1.27 0.63 0.57 0.53 1.04 4.09 1157 1469 729 659 94 1980 1.05 0.59 0.54 0.47 1.00 4.22 953 1001 562 515 57 1981 0.90 0.47 0.50 0.60 1.36 4.34 1037 933 487 519 47 1982 1.09 0.65 0.60 0.85 1.82 4.29 1070 1161 699 645 55 1983 0.88 0.49 0.40 0.77 1.69 4.36 1198 1051 584 480 53 1984 0.92 0.61 0.47 0.86 2.12 4.28 1002 923 613 474 53 1985 1.11 0.80 0.68 0.76 1.74 4.20 996 1110 793 681 63 1986 0.95 0.63 0.57 1.06 2.66 4.30 1293 1230 816 739 65 1987 0.86 0.55 0.55 0.65 1.48 4.35 1169 1004 647 638 52 1988 0.75 0.67 0.57 0.82 2.02 4.28 1585 1189 1054 895 84 1989 0.83 0.86 0.52 1.21 3.23 4.30 1053 877 904 552 53 1990 0.74 0.55 0.42 1.07 3.01 4.38 1565 1156 856 653 65 1991 0.75 0.83 0.60 1.36 3.76 4.32 1031 771 858 615 49 1992 0.72 0.60 0.41 1.02 2.54 4.38 1376 985 826 561 57 1993 0.81 0.80 0.68 2.10 1.79 4.39 845 686 673 579 34 1994 0.56 0.57 0.52 0.91 2.37 4.56 1180 659 678 615 33 1995 0.67 0.73 0.62 1.15 3.05 4.48 896 599 658 555 30 1996 0.62 0.74 0.67 0.88 2.20 4.42 910 564 673 607 35 1997 0.55 0.55 0.56 0.94 2.54 4.52 1219 666 666 682 37 1998 0.59 0.62 0.53 0.97 2.44 4.46 1240 637 767 661 43 1999 0.44 0.60 0.48 1.11 3.00 4.63 1273 547 762 614 30 2000 0.45 0.64 0.49 1.28 3.45 4.54 1651 711 1064 808 47
2001 0.45 0.59 0.55 0.63 1.55 4.77 1428 639 847 787 24 2002 0.47 0.71 0.56 0.99 2.18 4.69 1132 534 808 628 23 Søgne 1989 1.12 0.93 0.91 0.31 0.43 4.34 1151 1289 1067 1050 53 212 1990 0.79 0.60 0.48 0.25 0.52 4.33 1807 1425 1084 872 85 237 612 1991 0.94 0.66 0.58 0.23 0.47 4.30 1133 1063 750 662 57 245 559 1992 0.79 0.59 0.49 0.19 0.34 4.33 1280 1011 752 623 60 192 365 1993 0.95 0.71 0.63 0.26 0.26 4.33 1112 1061 786 699 52 148 326 1994 0.76 0.62 0.54 0.19 0.31 4.39 1441 1092 894 781 58 173 349 1995 0.61 0.54 0.45 0.19 0.34 4.45 1213 735 651 552 43 151 350 1996 0.87 0.75 0.69 0.31 0.36 4.32 1044 910 786 725 50 175 305 1997 0.67 0.60 0.63 0.20 0.34 4.46 1215 809 733 760 42 123 304 1998 0.70 0.60 0.55 0.24 0.39 4.45 1333 939 812 740 45 110 268 1999 0.63 0.57 0.50 0.21 0.34 4.50 1667 1 053 947 840 53 112 249 2000 0.47 0.54 0.48 0.21 0.38 4.53 2029 980 1100 975 60 96 245 2001 0.48 0.52 0.47 0.14 0.21 4.61 1569 756 816 737 38 106 2002 0.44 0.42 0.34 0.20 0.28 4.64 1608 704 679 552 37 114 2003 0.59 0.68 0.68 0.29 0.28 4.59 1271 749 863 865 32 101 2004 0.43 0.47 0.45 0.24 0.36 4.72 1601 697 760 717 30 89 2005 0.46 0.59 0.55 0.28 0.44 4.64 1176 535 700 644 27 99 2006 0.41 0.52 0.41 0.23 0.37 4.68 1714 707 884 707 35 156 2007 0.31 0.43 0.29 0.23 0.40 4.80 1237 379 538 362 20 70 2008 0.36 0.40 0.35 0.28 0.54 4.83 1697 610 676 601 25 62 2009 0.36 0.47 0.43 0.25 0.38 4.77 1633 592 763 699 27 63
Skreådalen 1973 0.50 0.19 4.60 2185 1093 55
1974 0.55 0.18 4.47 2460 1350 83 1975 0.57 0.18 0.17 0.19 4.55 2436 1389 438 414 69 1976 0.60 0.24 0.23 0.17 4.55 1687 1012 405 388 48 1977 0.57 0.27 0.28 0.15 0.13 4.55 2057 1174 550 569 57 1978 0.49 0.20 0.26 0.20 0.29 4.52 1769 867 354 460 53 1979 0.61 0.26 0.28 0.16 0.14 4.33 2311 1410 601 647 108 1980 0.48 0.21 0.21 0.15 0.17 4.54 1949 936 409 409 56

Monitoring of long-range transported air pollutants in Norway, annual report 2013 | M-203
87
Table A.1.21b, cont.
Site Year Annual vol. weighted mean concentrations Annual
precip Annual total wet deposition Dry deposition
SO4-S NO3-N NH4-N Ca Mg pH SO4-S NO3-N NH4-N H+ S N mg/l mg/l mg/l mg/l mg/l mm mg/m2 mg/m2 mg/m2 mekv/m² mg/m2 mg/m2
Skreådalen 1981 0.49 0.20 0.28 0.16 0.18 4.58 2260 1107 452 633 59 cont. 1982 0.57 0.28 0.37 0.17 0.22 4.52 2519 1436 709 933 76 1983 0.43 0.19 0.26 0.18 0.23 4.70 2843 1221 551 734 57 1984 0.46 0.24 0.23 0.16 0.21 4.59 1762 802 415 401 46 1985 0.59 0.32 0.33 0.15 0.12 4.48 1895 1117 610 616 63 1986 0.53 0.29 0.30 0.15 0.19 4.51 2439 1289 698 734 75 1987 0.47 0.28 0.29 0.14 0.16 4.54 1639 767 451 471 48 152 1988 0.41 0.28 0.28 0.12 0.14 4.55 2255 926 622 632 64 153 1989 0.43 0.28 0.28 0.15 0.20 4.56 2519 1087 704 696 70 143 355 1990 0.39 0.23 0.22 0.13 0.26 4.61 3346 1293 775 732 82 170 415 1991 0.41 0.27 0.25 0.15 0.24 4.61 2172 894 583 547 53 125 279 1992 0.37 0.24 0.23 0.12 0.16 4.70 2728 1017 647 627 55 118 254 1993 0.29 0.22 0.25 0.30 0.56 4.81 2006 586 437 493 31 82 256 1994 0.38 0.28 0.31 0.31 0.25 4.77 2214 842 619 695 37 104 330 1995 0.30 0.24 0.24 0.16 0.21 4.75 2083 624 510 500 37 96 257 1996 0.30 0.28 0.31 0.14 0.12 4.78 1463 438 404 455 25 91 329
1997 0.25 0.23 0.29 0.21 0.33 4.92 2071 508 472 609 25 73 280 1998 0.32 0.27 0.31 0.17 0.15 4.83 1961 636 525 621 29 53 254 1999 0.25 0.23 0.24 0.14 0.23 4.93 2521 618 583 606 30 60 229 2000 0.23 0.24 0.25 0.14 0.21 4.90 2997 671 705 750 37 58 225
2001 0.23 0.23 0.33 0.12 0.11 5.10 1887 424 435 619 15 56 260 2002 0.22 0.23 0.35 0.19 0.20 5.17 1996 443 461 698 14 63 270 2003 0.24 0.26 0.28 0.14 0.14 4.89 2115 501 545 600 27 48 165 2004 0.16 0.19 0.21 0.14 0.15 5.07 2531 401 487 528 22 50 239 Valle 1990 0.40 0.27 0.20 0.07 0.11 4.51 1504 607 409 306 46 1991 0.47 0.32 0.25 0.14 0.10 4.52 912 432 287 227 28 1992 0.46 0.28 0.22 0.13 0.10 4.59 1120 519 318 242 29 1993 0.42 0.26 0.23 0.19 0.27 4.66 1052 445 276 243 23
1994 0.49 0.37 0.30 0.17 0.11 4.58 1230 608 461 373 32 1995 0.33 0.28 0.20 0.13 0.11 4.63 926 303 256 183 22 1996 0.38 0.33 0.25 0.17 0.07 4.60 836 316 273 206 21 1997 0.30 0.26 0.20 0.12 0.11 4.70 1085 323 280 220 22 1998 0.33 0.28 0.29 0.09 0.05 4.67 1179 393 330 336 25 1999 0.28 0.22 0.15 0.08 0.07 4.74 1284 335 281 192 23 2000 0.26 0.29 0.24 0.10 0.07 4.70 1618 422 467 395 32
Solhomfjell 1991 0.63 0.44 0.40 0.14 0.08 4.44 878 552 389 355 32 1992 0.69 0.47 0.39 0.12 0.07 4.44 958 662 447 376 35 1993 0.66 0.45 0.38 0.15 0.08 4.47 920 611 412 347 31 1994 0.60 0.48 0.38 0.12 0.06 4.50 1150 686 550 442 36 1995 0.55 0.45 0.43 0.14 0.08 4.51 1073 590 484 464 33 1996 0.61 0.45 0.41 0.17 0.07 4.46 908 551 410 377 31 Møsvatn 1993 0.28 0.22 0.14 0.07 0.07 4.69 699 194 155 99 14 1994 0.32 0.27 0.17 0.07 0.02 4.66 788 250 209 136 17 1995 0.28 0.22 0.14 0.06 0.02 4.65 660 186 147 92 15 1996 0.30 0.27 0.21 0.07 0.02 4.66 592 178 161 126 13 1997 0.21 0.22 0.18 0.08 0.03 4.77 705 150 155 129 12
1998 0.24 0.20 0.15 0.07 0.02 4.79 783 188 154 114 13 1999 0.22 0.21 0.16 0.08 0.03 4.89 777 171 169 125 10 2000 0.19 0.21 0.16 0.06 0.03 4.79 1000 189 212 159 16
Lardal 1990 0.70 0.45 0.35 0.09 0.07 4.33 1340 938 599 469 62 99 199 1991 0.72 0.47 0.36 0.12 0.08 4.38 847 609 401 306 35 144 231 1992 0.68 0.47 0.38 0.13 0.07 4.42 892 610 421 338 34 91 154 1993 0.65 0.42 0.32 0.09 0.05 4.45 967 625 402 313 35 66 134 1994 0.52 0.45 0.35 0.08 0.05 4.53 1216 631 542 429 36 78 159 1995 0.65 0.47 0.42 0.11 0.09 4.42 1179 764 556 497 45 1996 0.50 0.36 0.29 0.11 0.06 4.49 940 472 341 269 30 1997 0.58 0.45 0.43 0.31 0.17 4.61 640 373 288 276 16 1998 0.52 0.42 0.36 0.12 0.07 4.50 975 505 414 362 31
1999 0.43 0.36 0.31 0.08 0.05 4.61 1371 581 492 424 33 2000 0.39 0.38 0.30 0.09 0.09 4.54 1809 703 693 550 53 2001 0.36 0.33 0.31 0.09 0.05 4.71 1224 442 408 381 24
2002 0.34 0.25 0.25 0.10 0.04 4.82 1142 383 285 288 17

Monitoring of long-range transported air pollutants in Norway, annual report 2013 | M-203
88
Table A.1.21b, cont.
Site Year Annual vol. weighted mean concentrations Annual
precip Annual total wet deposition Dry deposition
SO4-S NO3-N NH4-N Ca Mg pH SO4-S NO3-N NH4-N H+ S N mg/l mg/l mg/l mg/l mg/l mm mg/m2 mg/m2 mg/m2 mekv/m² mg/m2 mg/m2
Prestebakke 1986 1.08 0.54 0.47 0.23 0.19 4.20 699 753 380 328 44 1987 0.78 0.42 0.37 0.16 0.08 4.37 830 650 349 307 35 212 343 1988 0.77 0.47 0.37 0.16 0.15 4.25 989 758 466 370 55 219 307 1989 0.97 0.69 0.47 0.18 0.21 4.22 697 678 478 330 42 191 301 1990 0.87 0.57 0.42 0.18 0.18 4.28 816 710 465 342 42 157 252 1991 0.79 0.55 0.43 0.20 0.25 4.37 805 638 445 346 35 98 190 1992 0.83 0.60 0.47 0.16 0.15 4.35 832 687 497 392 37 140 154 1993 0.74 0.47 0.36 0.17 0.13 4.41 775 573 364 278 30 119 228 1994 0.53 0.39 0.24 0.17 0.13 4.48 892 477 352 216 29 138 234 1995 0.65 0.54 0.46 0.18 0.17 4.45 746 487 406 346 26 126 1996 0.64 0.56 0.43 0.27 0.18 4.42 656 419 368 283 25 126 1997 0.42 0.39 0.29 0.08 0.06 4.52 813 338 317 237 24 97 1998 0.53 0.45 0.38 0.32 0.20 4.66 842 449 377 328 18 77
1999 0.50 0.48 0.34 0.15 0.17 4.52 1182 590 564 394 36 90 2000 0.36 0.40 0.30 0.20 0.15 4.60 1181 449 474 351 30 84
Fagernes 1990 0.41 0.22 0.16 0.10 0.02 4.53 550 228 119 86 16 1991 0.38 0.21 0.24 0.22 0.04 4.75 395 150 84 94 7 1992 0.43 0.24 0.19 0.10 0.01 4.63 656 279 160 126 15 1993 0.26 0.15 0.12 0.08 0.02 4.77 619 162 95 74 10 1994 0.28 0.25 0.15 0.08 0.02 4.70 586 166 146 88 12 1995 0.32 0.22 0.29 0.14 0.07 4.81 465 151 101 134 7 1996 0.25 0.23 0.20 0.17 0.03 4.78 635 159 145 124 11 1997 0.21 0.15 0.16 0.09 0.02 4.89 565 116 83 92 6 1998 0.21 0.17 0.16 0.13 0.03 4.87 583 125 97 92 8
1999 0.20 0.18 0.12 0.08 0.01 4.86 633 125 113 75 9 2000 0.19 0.19 0.19 0.10 0.02 4.85 757 150 147 145 11 2001 0.16 0.16 0.14 0.12 0.02 5.01 649 103 104 92 6
2002 0.19 0.15 0.15 0.13 0.02 4.99 632 119 94 96 6 Osen 1988 0.53 0.31 0.26 0.13 0.02 4.43 832 442 254 215 31 139 1989 0.52 0.27 0.15 0.14 0.03 4.47 786 410 214 122 27 95 145 1990 0.55 0.28 0.27 0.23 0.03 4.48 711 393 198 192 23 90 123 1991 0.34 0.26 0.20 0.08 0.02 4.58 647 222 168 129 17 77 107 1992 0.44 0.37 0.18 0.13 0.02 4.55 725 318 207 133 20 68 103 1993 0.37 0.26 0.18 0.10 0.02 4.62 764 283 195 140 18 53 94 1994 0.30 0.27 0.19 0.08 0.02 4.69 636 192 172 120 13 69 112 1995 0.44 0.27 0.26 0.12 0.03 4.59 612 271 167 157 16 62 108 1996 0.32 0.26 0.26 0.14 0.03 4.71 574 183 147 151 11 64 112 1997 0.22 0.20 0.18 0.10 0.02 4.83 708 158 139 126 11 48 108 1998 0.30 0.23 0.24 0.09 0.02 4.77 655 198 152 155 11 35 97 1999 0.26 0.24 0.20 0.08 0.02 4.83 750 191 182 149 11 46 114 2000 0.22 0.20 0.17 0.06 0.03 4.72 971 229 198 165 18 38 118 2001 0.20 0.20 0.20 0.07 0.01 4.95 768 150 152 153 9 38 137 2002 0.25 0.19 0.25 0.11 0.03 4.91 738 182 140 184 9 44 157 2003 0.20 0.22 0.20 0.09 0.02 4.87 661 135 146 133 9 41 138 Valdalen 1994 0.32 0.29 0.19 0.10 0.03 4.70 536 172 153 103 11 1995 0.43 0.30 0.37 0.13 0.04 4.68 518 221 153 194 11 1996 0.27 0.20 0.29 0.11 0.03 4.91 724 193 142 211 9 1997 0.26 0.21 0.22 0.13 0.03 4.89 710 185 152 154 9 1998 0.22 0.19 0.16 0.08 0.02 4.88 700 156 130 115 9
1999 0.21 0.22 0.19 0.12 0.02 5.05 692 147 150 131 8 2000 0.20 0.19 0.20 0.07 0.03 4.92 817 165 154 165 10
Ualand 1992 0.49 0.30 0.22 0.16 0.31 4.53 2404 1171 714 530 71 1993 0.49 0.32 0.24 0.22 0.56 4.53 1531 745 492 365 46 1994 0.52 0.38 0.30 0.15 0.33 4.51 2125 1106 802 630 65 1995 0.45 0.37 0.27 0.14 0.31 4.51 1838 824 682 499 57
1996 0.40 0.32 0.24 0.14 0.23 4.54 1561 631 496 375 45 1997 0.44 0.33 0.32 0.19 0.36 4.58 1948 855 648 622 51 1998 0.47 0.38 0.29 0.16 0.31 4.52 1992 928 761 584 59
1999 0.32 0.30 0.20 0.16 0.37 4.65 2487 798 736 509 55 2000 0.31 0.31 0.21 0.19 0.41 4.65 2681 819 832 572 61

Monitoring of long-range transported air pollutants in Norway, annual report 2013 | M-203
89
Table A.1.21b, cont.
Site Year Annual vol. weighted mean concentrations Annual
precip Annual total wet deposition Dry deposition
SO4-S NO3-N NH4-N Ca Mg pH SO4-S NO3-N NH4-N H+ S N mg/l mg/l mg/l mg/l mg/l mm mg/m2 mg/m2 mg/m2 mekv/m² mg/m2 mg/m2
Voss 1990 0.29 0.15 0.08 0.10 0.15 4.68 2053 595 300 169 43 1991 0.28 0.18 0.11 0.10 0.18 4.67 1214 342 213 130 26 1992 0.27 0.16 0.07 0.06 0.07 4.70 1627 436 255 110 32 1993 0.24 0.13 0.08 0.16 0.31 4.82 1162 282 148 96 17 1994 0.28 0.16 0.12 0.21 0.14 4.79 1473 408 234 178 24 1995 0.21 0.14 0.12 0.08 0.11 4.82 1439 303 208 168 22 1996 0.26 0.20 0.19 0.08 0.05 4.76 869 222 174 163 15 1997 0.22 0.15 0.24 0.16 0.34 5.00 1275 220 181 152 17 1998 0.18 0.14 0.11 0.06 0.10 4.87 1411 250 204 159 19 1999 0.18 0.13 0.09 0.06 0.11 4.88 1641 178 211 157 22 2000 0.16 0.14 0.12 0.08 0.13 4.91 1844 296 249 214 23
2001 0.15 0.13 0.11 0.06 0.07 5.02 1256 183 164 137 12 2002 0.18 0.14 0.13 0.08 0.10 4.92 1078 191 149 140 13
Selbu 1990 0.16 0.06 0.02 0.06 0.10 4.84 1339 220 83 31 19 1991 0.18 0.09 0.06 0.11 0.22 4.94 1336 240 125 80 15 1992 0.14 0.07 0.03 0.11 0.20 4.95 1402 193 103 45 16 1993 0.15 0.09 0.06 0.11 0.17 5.01 1290 193 117 80 13 1994 0.16 0.09 0.11 0.07 0.12 5.02 1143 179 105 129 11 1995 0.15 0.08 0.12 0.08 0.13 5.01 1411 206 113 166 14 1996 0.13 0.08 0.13 0.19 0.18 5.15 1039 132 86 131 7 1997 0.11 0.06 0.10 0.16 0.20 5.26 1682 183 105 172 9 1998 0.10 0.06 0.10 0.09 0.13 5.20 1333 139 80 131 8
1999 0.10 0.07 0.06 0.09 0.10 5.17 1303 133 93 82 9 2000 0.14 0.08 0.09 0.15 0.26 5.11 1138 162 87 98 9 2001 0.11 0.05 0.06 0.15 0.22 5.19 1540 166 84 86 10
Namsvatn 1991 0.18 0.11 0.20 0.08 0.12 5.13 1014 181 115 198 8 1992 0.14 0.10 0.12 0.12 0.19 5.12 1081 155 105 129 8 1993 0.14 0.10 0.17 0.15 0.16 5.20 1004 144 98 172 6 1994 0.14 0.10 0.17 0.29 0.11 5.18 902 129 94 152 6 1995 0.16 0.10 0.20 0.11 0.15 5.18 1201 188 121 243 8 1996 0.17 0.12 0.20 0.11 0.11 5.10 697 117 86 139 6 Øverbygd 1987* 0.23 0.05 0.08 0.12 0.14 4.92 424 100 23 35 5 1988 0.20 0.06 0.05 0.09 0.10 4.84 555 112 33 30 8 1989 0.16 0.06 0.06 0.09 0.18 4.98 794 125 45 51 8 1990 0.22 0.06 0.07 0.10 0.15 4.90 708 152 44 52 9 1991 0.25 0.09 0.07 0.11 0.18 4.90 706 176 60 49 9 1992 0.17 0.07 0.06 0.12 0.18 5.08 662 109 44 38 6 1993 0.17 0.07 0.07 0.26 0.43 5.06 680 117 48 45 6 1994 0.20 0.10 0.13 0.12 0.14 5.03 538 108 56 68 5 1995 0.11 0.06 0.11 0.14 0.11 5.13 659 73 42 74 5 1996 0.14 0.07 0.10 0.10 0.15 5.01 527 72 35 52 5 1997 0.10 0.06 0.11 0.16 0.28 5.13 603 59 37 69 4 1998 0.13 0.05 0.06 0.08 0.07 5.13 576 73 32 34 4
1999 0.13 0.05 0.07 0.06 0.07 5.13 811 103 44 53 6 2000 0.10 0.04 0.05 0.06 0.09 5.18 750 76 33 39 5 2001 0.11 0.04 0.05 0.09 0.15 5.24 721 75 30 38 4 2002 0.12 0.05 0.07 0.15 0.15 5.30 654 79 33 47 3 2003 0.07 0.04 0.08 0.14 0.16 5.25 907 65 40 72 5 2004 0.10 0.04 0.05 0.08 0.10 5.23 818 82 35 44 5 2005 0.16 0.06 0.14 0.08 0.06 5.26 745 118 43 105 4 2006 0.11 0.07 0.10 0.10 0.15 5.26 671 76 47 68 4 Jergul 1977 0.45 0.13 0.11 0.20 0.04 4.75 344 155 45 38 6 1978 0.43 0.10 0.11 0.13 0.02 4.52 351 151 35 39 11 1979 0.59 0.18 0.13 0.14 0.03 4.33 306 181 55 40 14 1980 0.42 0.12 0.09 0.12 0.03 4.57 262 110 31 24 7 1981 0.46 0.13 0.12 0.11 0.02 4.57 434 200 56 52 12 1982 0.36 0.13 0.14 0.10 0.03 4.65 473 172 62 65 11 1983 0.41 0.11 0.11 0.13 0.04 4.60 382 156 41 43 10 1984 0.50 0.15 0.22 0.14 0.03 4.50 342 172 50 76 11 1985 0.43 0.12 0.34 0.13 0.05 4.63 406 174 49 137 10 1986 0.49 0.16 0.14 0.12 0.04 4.60 250 122 40 34 6 1987 0.41 0.12 0.10 0.11 0.03 4.67 296 121 35 29 6 180
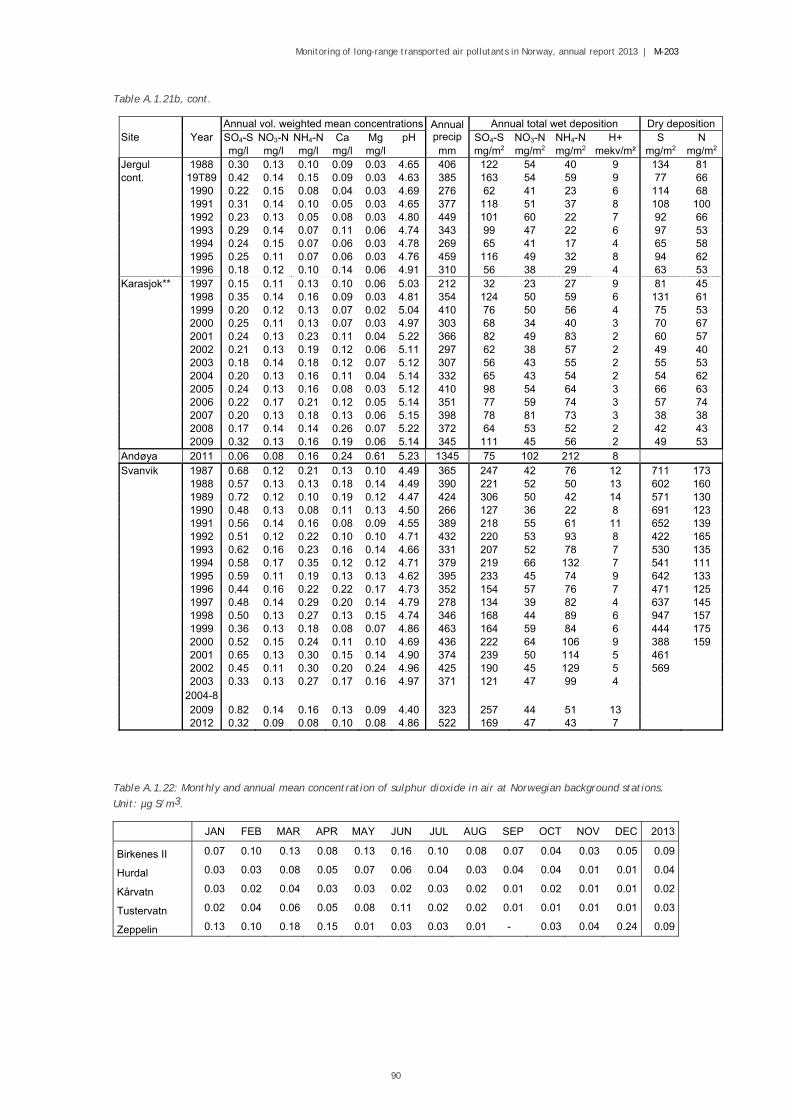
Monitoring of long-range transported air pollutants in Norway, annual report 2013 | M-203
90
Table A.1.21b, cont.
Site Year Annual vol. weighted mean concentrations Annual
precip Annual total wet deposition Dry deposition
SO4-S NO3-N NH4-N Ca Mg pH SO4-S NO3-N NH4-N H+ S N mg/l mg/l mg/l mg/l mg/l mm mg/m2 mg/m2 mg/m2 mekv/m² mg/m2 mg/m2
Jergul 1988 0.30 0.13 0.10 0.09 0.03 4.65 406 122 54 40 9 134 81 cont. 19T89 0.42 0.14 0.15 0.09 0.03 4.63 385 163 54 59 9 77 66 1990 0.22 0.15 0.08 0.04 0.03 4.69 276 62 41 23 6 114 68 1991 0.31 0.14 0.10 0.05 0.03 4.65 377 118 51 37 8 108 100 1992 0.23 0.13 0.05 0.08 0.03 4.80 449 101 60 22 7 92 66 1993 0.29 0.14 0.07 0.11 0.06 4.74 343 99 47 22 6 97 53 1994 0.24 0.15 0.07 0.06 0.03 4.78 269 65 41 17 4 65 58 1995 0.25 0.11 0.07 0.06 0.03 4.76 459 116 49 32 8 94 62 1996 0.18 0.12 0.10 0.14 0.06 4.91 310 56 38 29 4 63 53 Karasjok** 1997 0.15 0.11 0.13 0.10 0.06 5.03 212 32 23 27 9 81 45 1998 0.35 0.14 0.16 0.09 0.03 4.81 354 124 50 59 6 131 61 1999 0.20 0.12 0.13 0.07 0.02 5.04 410 76 50 56 4 75 53 2000 0.25 0.11 0.13 0.07 0.03 4.97 303 68 34 40 3 70 67 2001 0.24 0.13 0.23 0.11 0.04 5.22 366 82 49 83 2 60 57 2002 0.21 0.13 0.19 0.12 0.06 5.11 297 62 38 57 2 49 40 2003 0.18 0.14 0.18 0.12 0.07 5.12 307 56 43 55 2 55 53 2004 0.20 0.13 0.16 0.11 0.04 5.14 332 65 43 54 2 54 62 2005 0.24 0.13 0.16 0.08 0.03 5.12 410 98 54 64 3 66 63 2006 0.22 0.17 0.21 0.12 0.05 5.14 351 77 59 74 3 57 74 2007 0.20 0.13 0.18 0.13 0.06 5.15 398 78 81 73 3 38 38 2008 0.17 0.14 0.14 0.26 0.07 5.22 372 64 53 52 2 42 43 2009 0.32 0.13 0.16 0.19 0.06 5.14 345 111 45 56 2 49 53 Andøya 2011 0.06 0.08 0.16 0.24 0.61 5.23 1345 75 102 212 8 Svanvik 1987 0.68 0.12 0.21 0.13 0.10 4.49 365 247 42 76 12 711 173 1988 0.57 0.13 0.13 0.18 0.14 4.49 390 221 52 50 13 602 160 1989 0.72 0.12 0.10 0.19 0.12 4.47 424 306 50 42 14 571 130 1990 0.48 0.13 0.08 0.11 0.13 4.50 266 127 36 22 8 691 123 1991 0.56 0.14 0.16 0.08 0.09 4.55 389 218 55 61 11 652 139 1992 0.51 0.12 0.22 0.10 0.10 4.71 432 220 53 93 8 422 165 1993 0.62 0.16 0.23 0.16 0.14 4.66 331 207 52 78 7 530 135 1994 0.58 0.17 0.35 0.12 0.12 4.71 379 219 66 132 7 541 111 1995 0.59 0.11 0.19 0.13 0.13 4.62 395 233 45 74 9 642 133 1996 0.44 0.16 0.22 0.22 0.17 4.73 352 154 57 76 7 471 125 1997 0.48 0.14 0.29 0.20 0.14 4.79 278 134 39 82 4 637 145 1998 0.50 0.13 0.27 0.13 0.15 4.74 346 168 44 89 6 947 157 1999 0.36 0.13 0.18 0.08 0.07 4.86 463 164 59 84 6 444 175 2000 0.52 0.15 0.24 0.11 0.10 4.69 436 222 64 106 9 388 159 2001 0.65 0.13 0.30 0.15 0.14 4.90 374 239 50 114 5 461 2002 0.45 0.11 0.30 0.20 0.24 4.96 425 190 45 129 5 569 2003 0.33 0.13 0.27 0.17 0.16 4.97 371 121 47 99 4 2004-8 2009 0.82 0.14 0.16 0.13 0.09 4.40 323 257 44 51 13 2012 0.32 0.09 0.08 0.10 0.08 4.86 522 169 47 43 7
Table A.1.22: Monthly and annual mean concentration of sulphur dioxide in air at Norwegian background stations.
Unit: µg S/m3.
JAN FEB MAR APR MAY JUN JUL AUG SEP OCT NOV DEC 2013
Birkenes II 0.07 0.10 0.13 0.08 0.13 0.16 0.10 0.08 0.07 0.04 0.03 0.05 0.09
Hurdal 0.03 0.03 0.08 0.05 0.07 0.06 0.04 0.03 0.04 0.04 0.01 0.01 0.04
Kårvatn 0.03 0.02 0.04 0.03 0.03 0.02 0.03 0.02 0.01 0.02 0.01 0.01 0.02
Tustervatn 0.02 0.04 0.06 0.05 0.08 0.11 0.02 0.02 0.01 0.01 0.01 0.01 0.03
Zeppelin 0.13 0.10 0.18 0.15 0.01 0.03 0.03 0.01 - 0.03 0.04 0.24 0.09

Monitoring of long-range transported air pollutants in Norway, annual report 2013 | M-203
91
Table A.1.23: Monthly and annual mean concentration of sulphate in aerosol at Norwegian background stations.
Unit: µg S/m3.
JAN FEB MAR APR MAY JUN JUL AUG SEP OCT NOV DEC 2013
Birkenes II 0.26 0.32 0.25 0.19 0.31 0.36 0.29 0.28 0.20 0.19 0.09 0.25 0.25
Hurdal 0.17 0.24 0.18 0.18 0.12 0.26 0.21 0.19 0.21 0.11 0.06 0.12 0.17
Kårvatn 0.06 0.10 0.12 0.10 0.17 0.16 0.15 0.11 0.09 0.04 0.03 0.02 0.09
Tustervatn 0.04 0.12 0.11 0.12 0.13 0.09 0.11 0.09 0.09 0.04 0.03 0.04 0.08
Zeppelin 0.22 0.14 0.28 0.26 0.21 0.07 0.06 0.06 - 0.07 0.08 0.20 0.16
Table A.1.24: Monthly and annual mean concentration of nitrogen dioxide in air at Norwegian background stations.
Unit: µg N/m3.
JAN FEB MAR APR MAY JUN JUL AUG SEP OCT NOV DEC 2013
Birkenes II 0.46 0.34 0.29 0.34 0.29 0.18 0.19 0.17 0.21 0.35 0.14 0.40 0.28
Hurdal 1.13 1.17 0.77 0.57 0.50 0.26 0.27 0.31 0.41 0.76 1.23 0.97 0.69
Kårvatn 0.19 0.25 0.23 0.10 0.09 0.14 0.13 0.16 0.12 0.19 0.12 0.16 0.16
Tustervatn 0.26 0.14 0.15 0.12 0.15 0.15 0.14 0.13 0.09 0.10 0.05 0.09 0.13
Table A.1.25: Monthly and annual mean concentration of sum of nitrate and nitric acid in air at Norwegian
background stations. Unit: µg N/m3.
JAN FEB MAR APR MAY JUN JUL AUG SEP OCT NOV DEC 2013
Birkenes II 0.71 0.15 0.36 0.40 0.24 0.25 0.23 0.39 0.21 0.13 0.10 0.25 0.29
Hurdal 0.17 0.15 0.14 0.32 0.05 0.21 0.16 0.16 0.22 0.11 0.11 0.32 0.18
Kårvatn 0.23 0.05 0.08 0.13 0.16 0.15 0.09 0.21 0.06 0.03 0.12 0.21 0.13
Tustervatn 0.52 0.09 0.16 0.16 0.22 0.05 0.09 0.10 0.08 0.05 0.02 0.05 0.13
Zeppelin 0.14 0.10 0.41 0.38 0.12 0.12 0.15 0.11 - 0.06 0.16 0.16 0.18
Table A.1.26: Monthly and annual mean concentration of nitrate in aerosol at Norwegian background stations. Unit:
µg N/m3.
JAN FEB MAR APR MAY JUN JUL AUG SEP OCT NOV DEC 2013
Birkenes II 0.56 0.06 0.27 0.34 0.16 0.19 0.15 0.23 0.15 0.10 0.08 0.21 0.21
Hurdal 0.11 0.09 0.11 0.25 0.02 0.14 0.09 0.10 0.13 0.07 0.09 0.23 0.12
Kårvatn 0.17 0.03 0.06 0.07 0.12 0.10 0.06 0.11 0.04 0.02 0.08 0.16 0.09
Tustervatn 0.44 0.05 0.10 0.12 0.16 0.04 0.05 0.06 0.05 0.03 0.01 0.04 0.09
Zeppelin 0.11 0.07 0.30 0.27 0.10 0.10 0.09 0.08 - 0.03 0.09 0.11 0.13
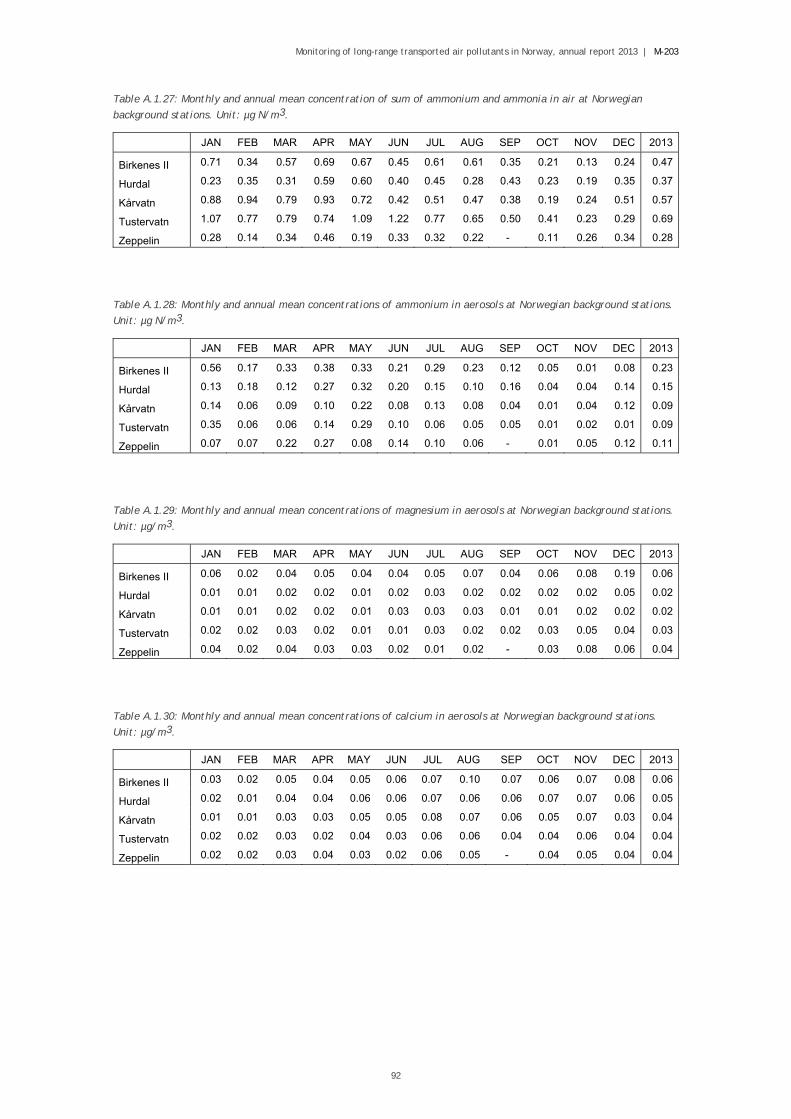
Monitoring of long-range transported air pollutants in Norway, annual report 2013 | M-203
92
Table A.1.27: Monthly and annual mean concentration of sum of ammonium and ammonia in air at Norwegian
background stations. Unit: µg N/m3.
JAN FEB MAR APR MAY JUN JUL AUG SEP OCT NOV DEC 2013
Birkenes II 0.71 0.34 0.57 0.69 0.67 0.45 0.61 0.61 0.35 0.21 0.13 0.24 0.47
Hurdal 0.23 0.35 0.31 0.59 0.60 0.40 0.45 0.28 0.43 0.23 0.19 0.35 0.37
Kårvatn 0.88 0.94 0.79 0.93 0.72 0.42 0.51 0.47 0.38 0.19 0.24 0.51 0.57
Tustervatn 1.07 0.77 0.79 0.74 1.09 1.22 0.77 0.65 0.50 0.41 0.23 0.29 0.69
Zeppelin 0.28 0.14 0.34 0.46 0.19 0.33 0.32 0.22 - 0.11 0.26 0.34 0.28
Table A.1.28: Monthly and annual mean concentrations of ammonium in aerosols at Norwegian background stations.
Unit: µg N/m3.
JAN FEB MAR APR MAY JUN JUL AUG SEP OCT NOV DEC 2013
Birkenes II 0.56 0.17 0.33 0.38 0.33 0.21 0.29 0.23 0.12 0.05 0.01 0.08 0.23
Hurdal 0.13 0.18 0.12 0.27 0.32 0.20 0.15 0.10 0.16 0.04 0.04 0.14 0.15
Kårvatn 0.14 0.06 0.09 0.10 0.22 0.08 0.13 0.08 0.04 0.01 0.04 0.12 0.09
Tustervatn 0.35 0.06 0.06 0.14 0.29 0.10 0.06 0.05 0.05 0.01 0.02 0.01 0.09
Zeppelin 0.07 0.07 0.22 0.27 0.08 0.14 0.10 0.06 - 0.01 0.05 0.12 0.11
Table A.1.29: Monthly and annual mean concentrations of magnesium in aerosols at Norwegian background stations.
Unit: µg/m3.
JAN FEB MAR APR MAY JUN JUL AUG SEP OCT NOV DEC 2013
Birkenes II 0.06 0.02 0.04 0.05 0.04 0.04 0.05 0.07 0.04 0.06 0.08 0.19 0.06
Hurdal 0.01 0.01 0.02 0.02 0.01 0.02 0.03 0.02 0.02 0.02 0.02 0.05 0.02
Kårvatn 0.01 0.01 0.02 0.02 0.01 0.03 0.03 0.03 0.01 0.01 0.02 0.02 0.02
Tustervatn 0.02 0.02 0.03 0.02 0.01 0.01 0.03 0.02 0.02 0.03 0.05 0.04 0.03
Zeppelin 0.04 0.02 0.04 0.03 0.03 0.02 0.01 0.02 - 0.03 0.08 0.06 0.04
Table A.1.30: Monthly and annual mean concentrations of calcium in aerosols at Norwegian background stations.
Unit: µg/m3.
JAN FEB MAR APR MAY JUN JUL AUG SEP OCT NOV DEC 2013
Birkenes II 0.03 0.02 0.05 0.04 0.05 0.06 0.07 0.10 0.07 0.06 0.07 0.08 0.06
Hurdal 0.02 0.01 0.04 0.04 0.06 0.06 0.07 0.06 0.06 0.07 0.07 0.06 0.05
Kårvatn 0.01 0.01 0.03 0.03 0.05 0.05 0.08 0.07 0.06 0.05 0.07 0.03 0.04
Tustervatn 0.02 0.02 0.03 0.02 0.04 0.03 0.06 0.06 0.04 0.04 0.06 0.04 0.04
Zeppelin 0.02 0.02 0.03 0.04 0.03 0.02 0.06 0.05 - 0.04 0.05 0.04 0.04
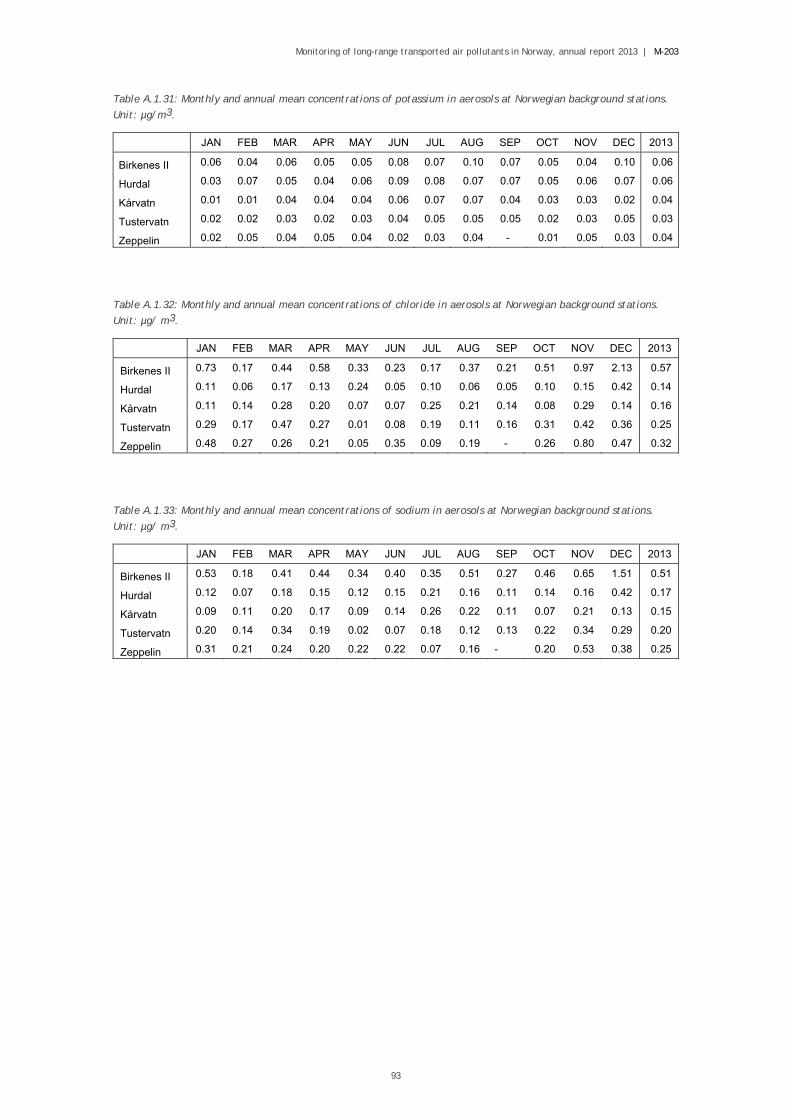
Monitoring of long-range transported air pollutants in Norway, annual report 2013 | M-203
93
Table A.1.31: Monthly and annual mean concentrations of potassium in aerosols at Norwegian background stations.
Unit: µg/m3.
JAN FEB MAR APR MAY JUN JUL AUG SEP OCT NOV DEC 2013
Birkenes II 0.06 0.04 0.06 0.05 0.05 0.08 0.07 0.10 0.07 0.05 0.04 0.10 0.06
Hurdal 0.03 0.07 0.05 0.04 0.06 0.09 0.08 0.07 0.07 0.05 0.06 0.07 0.06
Kårvatn 0.01 0.01 0.04 0.04 0.04 0.06 0.07 0.07 0.04 0.03 0.03 0.02 0.04
Tustervatn 0.02 0.02 0.03 0.02 0.03 0.04 0.05 0.05 0.05 0.02 0.03 0.05 0.03
Zeppelin 0.02 0.05 0.04 0.05 0.04 0.02 0.03 0.04 - 0.01 0.05 0.03 0.04
Table A.1.32: Monthly and annual mean concentrations of chloride in aerosols at Norwegian background stations.
Unit: µg/ m3.
JAN FEB MAR APR MAY JUN JUL AUG SEP OCT NOV DEC 2013
Birkenes II 0.73 0.17 0.44 0.58 0.33 0.23 0.17 0.37 0.21 0.51 0.97 2.13 0.57
Hurdal 0.11 0.06 0.17 0.13 0.24 0.05 0.10 0.06 0.05 0.10 0.15 0.42 0.14
Kårvatn 0.11 0.14 0.28 0.20 0.07 0.07 0.25 0.21 0.14 0.08 0.29 0.14 0.16
Tustervatn 0.29 0.17 0.47 0.27 0.01 0.08 0.19 0.11 0.16 0.31 0.42 0.36 0.25
Zeppelin 0.48 0.27 0.26 0.21 0.05 0.35 0.09 0.19 - 0.26 0.80 0.47 0.32
Table A.1.33: Monthly and annual mean concentrations of sodium in aerosols at Norwegian background stations.
Unit: µg/ m3.
JAN FEB MAR APR MAY JUN JUL AUG SEP OCT NOV DEC 2013
Birkenes II 0.53 0.18 0.41 0.44 0.34 0.40 0.35 0.51 0.27 0.46 0.65 1.51 0.51
Hurdal 0.12 0.07 0.18 0.15 0.12 0.15 0.21 0.16 0.11 0.14 0.16 0.42 0.17
Kårvatn 0.09 0.11 0.20 0.17 0.09 0.14 0.26 0.22 0.11 0.07 0.21 0.13 0.15
Tustervatn 0.20 0.14 0.34 0.19 0.02 0.07 0.18 0.12 0.13 0.22 0.34 0.29 0.20
Zeppelin 0.31 0.21 0.24 0.20 0.22 0.22 0.07 0.16 - 0.20 0.53 0.38 0.25
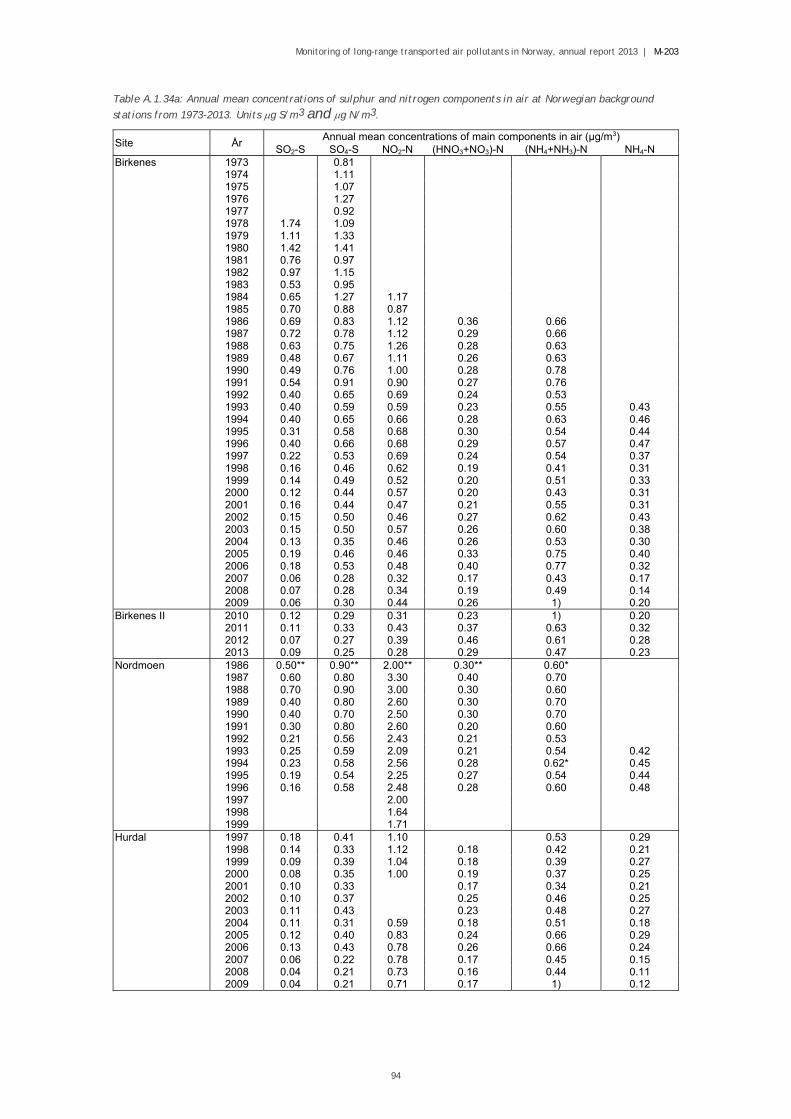
Monitoring of long-range transported air pollutants in Norway, annual report 2013 | M-203
94
Table A.1.34a: Annual mean concentrations of sulphur and nitrogen components in air at Norwegian background
stations from 1973-2013. Units g S/m3 and g N/m3.
Site År Annual mean concentrations of main components in air (µg/m3)
SO2-S SO4-S NO2-N (HNO3+NO3)-N (NH4+NH3)-N NH4-N Birkenes 1973 0.81 1974 1.11 1975 1.07 1976 1.27 1977 0.92 1978 1.74 1.09 1979 1.11 1.33 1980 1.42 1.41 1981 0.76 0.97 1982 0.97 1.15 1983 0.53 0.95 1984 0.65 1.27 1.17 1985 0.70 0.88 0.87 1986 0.69 0.83 1.12 0.36 0.66 1987 0.72 0.78 1.12 0.29 0.66 1988 0.63 0.75 1.26 0.28 0.63 1989 0.48 0.67 1.11 0.26 0.63 1990 0.49 0.76 1.00 0.28 0.78 1991 0.54 0.91 0.90 0.27 0.76 1992 0.40 0.65 0.69 0.24 0.53 1993 0.40 0.59 0.59 0.23 0.55 0.43 1994 0.40 0.65 0.66 0.28 0.63 0.46 1995 0.31 0.58 0.68 0.30 0.54 0.44 1996 0.40 0.66 0.68 0.29 0.57 0.47 1997 0.22 0.53 0.69 0.24 0.54 0.37 1998 0.16 0.46 0.62 0.19 0.41 0.31 1999 0.14 0.49 0.52 0.20 0.51 0.33 2000 0.12 0.44 0.57 0.20 0.43 0.31 2001 0.16 0.44 0.47 0.21 0.55 0.31 2002 0.15 0.50 0.46 0.27 0.62 0.43 2003 0.15 0.50 0.57 0.26 0.60 0.38 2004 0.13 0.35 0.46 0.26 0.53 0.30 2005 0.19 0.46 0.46 0.33 0.75 0.40 2006 0.18 0.53 0.48 0.40 0.77 0.32 2007 0.06 0.28 0.32 0.17 0.43 0.17 2008 0.07 0.28 0.34 0.19 0.49 0.14 2009 0.06 0.30 0.44 0.26 1) 0.20 Birkenes II 2010 0.12 0.29 0.31 0.23 1) 0.20 2011 0.11 0.33 0.43 0.37 0.63 0.32 2012 0.07 0.27 0.39 0.46 0.61 0.28 2013 0.09 0.25 0.28 0.29 0.47 0.23 Nordmoen 1986 0.50** 0.90** 2.00** 0.30** 0.60* 1987 0.60 0.80 3.30 0.40 0.70 1988 0.70 0.90 3.00 0.30 0.60 1989 0.40 0.80 2.60 0.30 0.70 1990 0.40 0.70 2.50 0.30 0.70 1991 0.30 0.80 2.60 0.20 0.60 1992 0.21 0.56 2.43 0.21 0.53 1993 0.25 0.59 2.09 0.21 0.54 0.42 1994 0.23 0.58 2.56 0.28 0.62* 0.45 1995 0.19 0.54 2.25 0.27 0.54 0.44 1996 0.16 0.58 2.48 0.28 0.60 0.48 1997 2.00 1998 1.64 1999 1.71 Hurdal 1997 0.18 0.41 1.10 0.53 0.29 1998 0.14 0.33 1.12 0.18 0.42 0.21 1999 0.09 0.39 1.04 0.18 0.39 0.27 2000 0.08 0.35 1.00 0.19 0.37 0.25 2001 0.10 0.33 0.17 0.34 0.21 2002 0.10 0.37 0.25 0.46 0.25 2003 0.11 0.43 0.23 0.48 0.27 2004 0.11 0.31 0.59 0.18 0.51 0.18 2005 0.12 0.40 0.83 0.24 0.66 0.29 2006 0.13 0.43 0.78 0.26 0.66 0.24 2007 0.06 0.22 0.78 0.17 0.45 0.15 2008 0.04 0.21 0.73 0.16 0.44 0.11 2009 0.04 0.21 0.71 0.17 1) 0.12
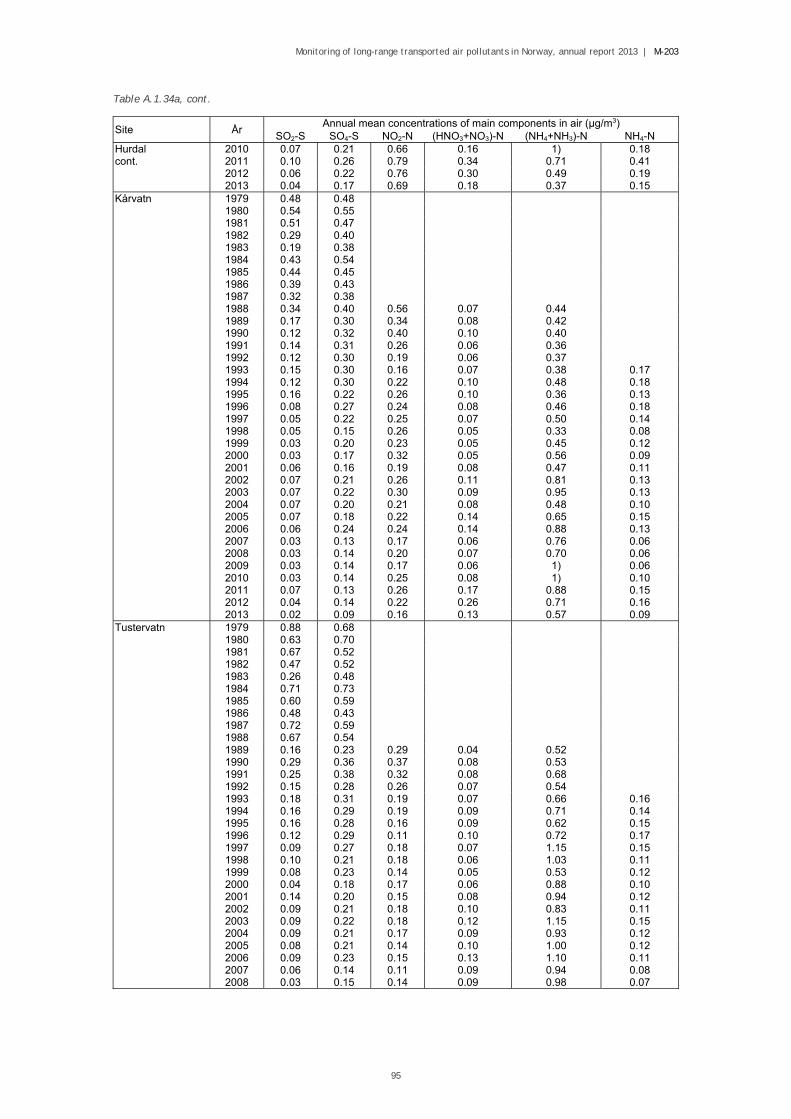
Monitoring of long-range transported air pollutants in Norway, annual report 2013 | M-203
95
Table A.1.34a, cont.
Site År Annual mean concentrations of main components in air (µg/m3)
SO2-S SO4-S NO2-N (HNO3+NO3)-N (NH4+NH3)-N NH4-N Hurdal 2010 0.07 0.21 0.66 0.16 1) 0.18 cont. 2011 0.10 0.26 0.79 0.34 0.71 0.41 2012 0.06 0.22 0.76 0.30 0.49 0.19 2013 0.04 0.17 0.69 0.18 0.37 0.15 Kårvatn 1979 0.48 0.48 1980 0.54 0.55 1981 0.51 0.47 1982 0.29 0.40 1983 0.19 0.38 1984 0.43 0.54 1985 0.44 0.45 1986 0.39 0.43 1987 0.32 0.38 1988 0.34 0.40 0.56 0.07 0.44 1989 0.17 0.30 0.34 0.08 0.42 1990 0.12 0.32 0.40 0.10 0.40 1991 0.14 0.31 0.26 0.06 0.36 1992 0.12 0.30 0.19 0.06 0.37 1993 0.15 0.30 0.16 0.07 0.38 0.17 1994 0.12 0.30 0.22 0.10 0.48 0.18 1995 0.16 0.22 0.26 0.10 0.36 0.13 1996 0.08 0.27 0.24 0.08 0.46 0.18 1997 0.05 0.22 0.25 0.07 0.50 0.14 1998 0.05 0.15 0.26 0.05 0.33 0.08 1999 0.03 0.20 0.23 0.05 0.45 0.12 2000 0.03 0.17 0.32 0.05 0.56 0.09 2001 0.06 0.16 0.19 0.08 0.47 0.11 2002 0.07 0.21 0.26 0.11 0.81 0.13 2003 0.07 0.22 0.30 0.09 0.95 0.13 2004 0.07 0.20 0.21 0.08 0.48 0.10 2005 0.07 0.18 0.22 0.14 0.65 0.15 2006 0.06 0.24 0.24 0.14 0.88 0.13 2007 0.03 0.13 0.17 0.06 0.76 0.06 2008 0.03 0.14 0.20 0.07 0.70 0.06 2009 0.03 0.14 0.17 0.06 1) 0.06 2010 0.03 0.14 0.25 0.08 1) 0.10 2011 0.07 0.13 0.26 0.17 0.88 0.15 2012 0.04 0.14 0.22 0.26 0.71 0.16 2013 0.02 0.09 0.16 0.13 0.57 0.09 Tustervatn 1979 0.88 0.68
1980 0.63 0.70 1981 0.67 0.52 1982 0.47 0.52 1983 0.26 0.48 1984 0.71 0.73 1985 0.60 0.59
1986 0.48 0.43 1987 0.72 0.59 1988 0.67 0.54 1989 0.16 0.23 0.29 0.04 0.52 1990 0.29 0.36 0.37 0.08 0.53 1991 0.25 0.38 0.32 0.08 0.68 1992 0.15 0.28 0.26 0.07 0.54 1993 0.18 0.31 0.19 0.07 0.66 0.16
1994 0.16 0.29 0.19 0.09 0.71 0.14 1995 0.16 0.28 0.16 0.09 0.62 0.15 1996 0.12 0.29 0.11 0.10 0.72 0.17 1997 0.09 0.27 0.18 0.07 1.15 0.15 1998 0.10 0.21 0.18 0.06 1.03 0.11 1999 0.08 0.23 0.14 0.05 0.53 0.12 2000 0.04 0.18 0.17 0.06 0.88 0.10 2001 0.14 0.20 0.15 0.08 0.94 0.12
2002 0.09 0.21 0.18 0.10 0.83 0.11 2003 0.09 0.22 0.18 0.12 1.15 0.15 2004 0.09 0.21 0.17 0.09 0.93 0.12 2005 0.08 0.21 0.14 0.10 1.00 0.12 2006 0.09 0.23 0.15 0.13 1.10 0.11 2007 0.06 0.14 0.11 0.09 0.94 0.08 2008 0.03 0.15 0.14 0.09 0.98 0.07

Monitoring of long-range transported air pollutants in Norway, annual report 2013 | M-203
96
Table A.1.34a, cont.
Site År Annual mean concentrations of main components in air (µg/m3)
SO2-S SO4-S NO2-N (HNO3+NO3)-N (NH4+NH3)-N NH4-N Tustervatn cont. 2009 0.05 0.15 0.11 0.07 1) 0.06 2010 0.08 0.15 0.12 0.10 1) 0.11 2011 0.08 0.13 0.14 0.27 0.94 0.23 2012 0.05 0.12 0.17 0.25 1.07 0.15 2013 0.03 0.08 0.13 0.13 0.69 0.09 Ny-Ålesund 1980 0.32 0.31 1981 0.36 0.23 1982 0.31 0.28 1983 0.42 0.41 1984 0.24 0.34 1985 0.36 0.39 1986 0.27 0.34 1987 0.53 0.40 1988 0.32 0.32 1989 0.21 0.24 1990 0.22 0.27 0.03 Zeppelin 1990 0.21 0.22 0.04 0.09 1991 0.24 0.19 0.02 0.05 0.09 1992 0.19 0.19 0.02 0.04 0.08 1993 0.17 0.20 0.03 0.06 0.09 0.05 1994 0.16 0.15 0.05 0.06 0.09 0.04 1995 0.15 0.17 0.08 0.10 0.05 1996 0.10 0.15 0.08 0.11 0.05 1997 0.13 0.21 0.07 0.13 0.06 1998 0.21 0.17 0.04 0.13 0.05 1999 0.13 0.19 0.03 0.19 0.08 2000 0.12 0.14 0.03 0.11 0.03 2001 0.14 0.18 0.06 0.17 0.04 2002 0.16 0.14 0.06 0.24 0.02 2003 0.23 0.17 0.04 0.27 0.04 2004 0.12 0.16 0.08 0.24 0.04
2005 0.13 0.18 0.15 0.42 0.10 2006 0.10 0.13 0.12 0.43 0.03 2007 0.09 0.11 0.05 0.26 0.04 2008 0.07 0.14 0.10 0.33 0.06 2009 0.09 0.15 0.05 1) 0.04 2010 0.07 0.13 0.06 1) 0.05 2011 0.10 0.12 0.11 0.39 0.07 2012 0.06 0.12 0.22 0.36 0.11
2013 0.09 0.16 0.18 0.28 0.11
1) Due to contamination of ammonia, only ammonium is reported in 2009 and 2010.
* One month missing.
** Two months missing.
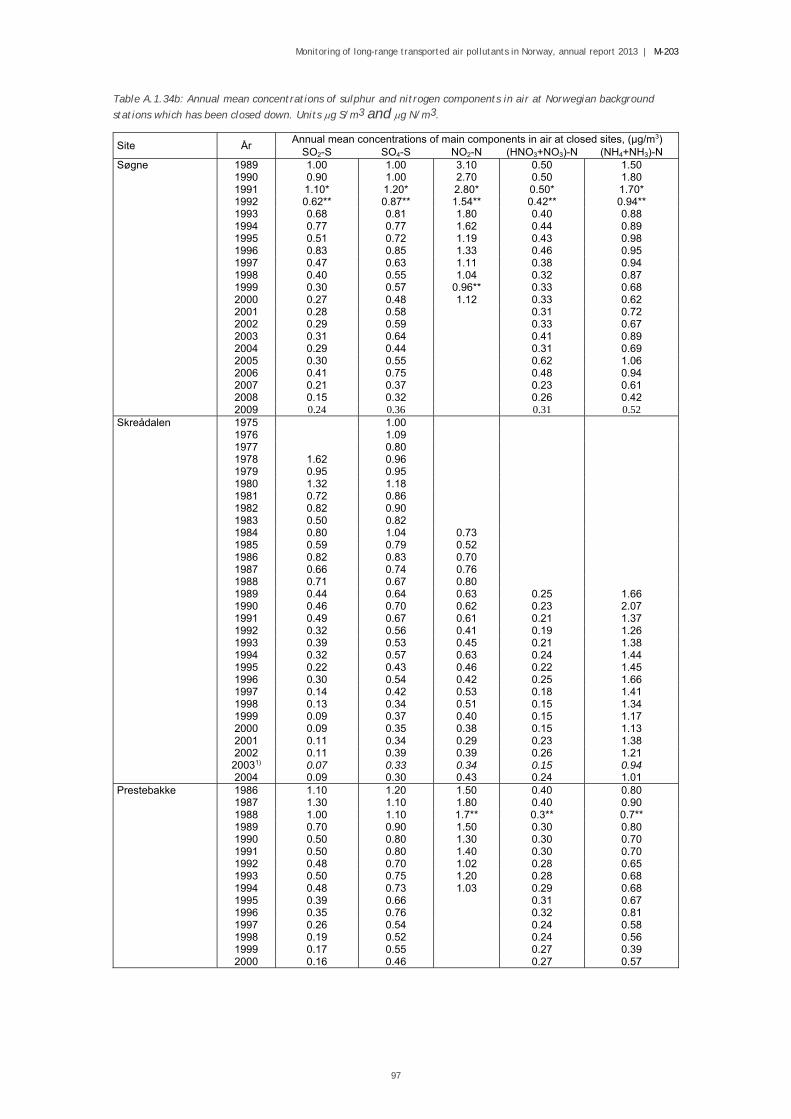
Monitoring of long-range transported air pollutants in Norway, annual report 2013 | M-203
97
Table A.1.34b: Annual mean concentrations of sulphur and nitrogen components in air at Norwegian background
stations which has been closed down. Units g S/m3 and g N/m3.
Site År Annual mean concentrations of main components in air at closed sites, (µg/m3)
SO2-S SO4-S NO2-N (HNO3+NO3)-N (NH4+NH3)-N Søgne 1989 1.00 1.00 3.10 0.50 1.50 1990 0.90 1.00 2.70 0.50 1.80 1991 1.10* 1.20* 2.80* 0.50* 1.70* 1992 0.62** 0.87** 1.54** 0.42** 0.94** 1993 0.68 0.81 1.80 0.40 0.88 1994 0.77 0.77 1.62 0.44 0.89 1995 0.51 0.72 1.19 0.43 0.98 1996 0.83 0.85 1.33 0.46 0.95 1997 0.47 0.63 1.11 0.38 0.94 1998 0.40 0.55 1.04 0.32 0.87 1999 0.30 0.57 0.96** 0.33 0.68 2000 0.27 0.48 1.12 0.33 0.62 2001 0.28 0.58 0.31 0.72 2002 0.29 0.59 0.33 0.67 2003 0.31 0.64 0.41 0.89 2004 0.29 0.44 0.31 0.69 2005 0.30 0.55 0.62 1.06 2006 0.41 0.75 0.48 0.94 2007 0.21 0.37 0.23 0.61 2008 0.15 0.32 0.26 0.42 2009 0.24 0.36 0.31 0.52 Skreådalen 1975 1.00 1976 1.09 1977 0.80 1978 1.62 0.96 1979 0.95 0.95 1980 1.32 1.18 1981 0.72 0.86 1982 0.82 0.90 1983 0.50 0.82 1984 0.80 1.04 0.73 1985 0.59 0.79 0.52 1986 0.82 0.83 0.70 1987 0.66 0.74 0.76 1988 0.71 0.67 0.80 1989 0.44 0.64 0.63 0.25 1.66 1990 0.46 0.70 0.62 0.23 2.07 1991 0.49 0.67 0.61 0.21 1.37 1992 0.32 0.56 0.41 0.19 1.26 1993 0.39 0.53 0.45 0.21 1.38 1994 0.32 0.57 0.63 0.24 1.44 1995 0.22 0.43 0.46 0.22 1.45 1996 0.30 0.54 0.42 0.25 1.66 1997 0.14 0.42 0.53 0.18 1.41 1998 0.13 0.34 0.51 0.15 1.34
1999 0.09 0.37 0.40 0.15 1.17 2000 0.09 0.35 0.38 0.15 1.13 2001 0.11 0.34 0.29 0.23 1.38
2002 0.11 0.39 0.39 0.26 1.21 20031) 0.07 0.33 0.34 0.15 0.94 2004 0.09 0.30 0.43 0.24 1.01 Prestebakke 1986 1.10 1.20 1.50 0.40 0.80 1987 1.30 1.10 1.80 0.40 0.90 1988 1.00 1.10 1.7** 0.3** 0.7** 1989 0.70 0.90 1.50 0.30 0.80 1990 0.50 0.80 1.30 0.30 0.70 1991 0.50 0.80 1.40 0.30 0.70 1992 0.48 0.70 1.02 0.28 0.65 1993 0.50 0.75 1.20 0.28 0.68 1994 0.48 0.73 1.03 0.29 0.68 1995 0.39 0.66 0.31 0.67 1996 0.35 0.76 0.32 0.81 1997 0.26 0.54 0.24 0.58 1998 0.19 0.52 0.24 0.56 1999 0.17 0.55 0.27 0.39 2000 0.16 0.46 0.27 0.57

Monitoring of long-range transported air pollutants in Norway, annual report 2013 | M-203
98
Table A.1.34b, cont.
Site År Annual mean concentrations of main components in air at closed sites, (µg/m3)
SO2-S SO4-S NO2-N (HNO3+NO3)-N (NH4+NH3)-N Osen 1988 0.67 0.72 1989 0.38 0.52 0.88 0.15 0.39 1990 0.22 0.46 0.64 0.12 0.36 1991 0.25 0.49 0.59 0.12 0.36 1992 0.17 0.37 0.50 0.11 0.30 1993 0.22 0.38 0.53 0.11 0.28 1994 0.19 0.42 0.44 0.14 0.34 1995 0.19 0.38 0.41 0.15 0.31 1996 0.13 0.40 0.40 0.14 0.37 1997 0.09 0.30 0.48 0.10 0.35 1998 0.08 0.26 0.45 0.10 0.37 1999 0.06 0.20 0.38 0.08 0.31 2000 0.04 0.24 0.38 0.08 0.29 2001 0.08 0.24 0.33 0.12 0.38 2002 0.07 0.28 0.38 0.11 0.51 2003 0.08 0.29 0.45 0.13 0.46 Svanvik 1987 6.40 0.90 1.00 0.10 0.60 1988 5.80 0.90 0.9** 0.1** 0.5** 1989 5.40 0.60 0.70 0.10 0.40 1990 7.20 0.70 0.80 0.10 0.40 1991 5.90 0.70 0.80 0.10 0.50 1992 3.25 0.57 0.76 0.07 0.67 1993 4.32 0.53 0.57 0.07 0.51 1994 4.15 0.37 0.56 0.07 0.42 1995 5.07 0.48 0.58 0.10 0.49 1996 3.30 0.47 0.54 0.07 0.55 1997 4.85 0.49 0.59 0.07 0.63 1998 6.83 0.54 0.70 0.07 0.78 1999 3.92 0.53 0.53 0.06 0.91 2000 3.15 0.45 0.51 0.05 0.84 2001 4.07 0.52 0.08 0.90 2002 4.31 0.43 0.10 0.75 Jergul 1977 0.58 1978 0.89 0.54 1979 1.52 0.74 1980 1.55 0.75 1981 1.28 0.56 1982 0.79 0.54 1983 0.81 0.65 1984 1.18 0.79 0.43 1985 1.42 0.80 0.29 1986 1.01 0.69 0.46 1987 1.67 0.77 0.51 1988 1.23 0.66 0.45 0.09 0.22 1989 0.40 0.39 0.28 0.08 0.20 1990 0.81 0.45 0.35 0.07 0.19 1991 0.80 0.47 0.31 0.08 0.18 1992 0.53 0.40 0.28 0.07 0.17 1993 0.58 0.44 0.21 0.08 0.17 1994 0.44 0.31 0.16 0.09 0.16 1995 0.59 0.34 0.16 0.11 0.15 1996 0.32 0.30 0.18 0.08 0.15 Karasjok 1997 0.48 0.32 0.20 0.07 0.16 1998 0.91 0.34 0.25 0.06 0.19 1999 0.51 0.36 0.25 0.05 0.18 2000 0.35 0.27 0.25 0.08 0.16 2001 0.40 0.29 0.20 0.06 0.14 2002 0.30 0.24 0.18 0.08 0.11 20031) 0.20 0.26 0.21 0.08 0.14 2004 0.32 0.25 0.19 0.11 0.15 2005 0.31 0.30 0.17 0.11 0.16 2006 0.29 0.28 0.14 0.16 0.12 2007 0.19 0.19 0.14 0.08 0.11 2008 0.35 0.22 0.19 0.07 0.10 2009 0.18 0.25 0.15 0.09 0.12 Andøya 2010 0.11 0.20 0.05 2011 0.05 0.17 0.06 0.11
1) Measured from 25 May 2003. * One month missing. ** Two months missing.

Monitoring of long-range transported air pollutants in Norway, annual report 2013 | M-203
99

Monitoring of long-range transported air pollutants in Norway, annual report 2013 | M-203
100
Detailed information of the monitoring programme

Monitoring of long-range transported air pollutants in Norway, annual report 2013 | M-203
101

Monitoring of long-range transported air pollutants in Norway, annual report 2013 | M-203
102
Table A.2.1: Site locations and station keepers for the background sites in 2013.
Stasjon Fylke m.o.h. Bredde N Lengde E Start dato Stasjonsholder Adresse
Birkenes Aust-Agder 190 58° 23' 8° 15' nov-71 Olav Lien 4760 Birkeland
Birkenes II 219
Vatnedalen Aust-Agder 800 59° 30' 7° 26' nov-73 Lilly Vatnedalen 4694 Bykle
Treungen Telemark 270 59° 01' 8° 32' sep-74 Per Ø. Stokstad 4860 Treungen
Haukenes Telemark 20 59° 12' 9° 31' apr-79
Prestebakke Østfold 160 59° 00' 11° 32' nov-85 NILU 2027 Kjeller
Løken Akershus 135 59° 48' 11° 27' mar-72 Anne Mørch 1960 Løken
Hurdal Akerhus 300 60o 22’ 11o 04’ jan-97 Thomas Sørlien 2090 Hurdal
Brekkebygda Buskerud 390 60° 18' 9° 44' des-97 Anton Brekka 3534 Sokna
Vikedal II Rogaland 60 59° 32' 5° 58' jan-84 Harald Leifsen 4210 Vikedal
Sandve Rogaland 40 59° 12' 5° 12' jun-96 Jan M. Jensen 4272 Sandve
Haukeland Hordaland 204 60° 49' 5° 35' aug-81 Henning Haukeland 5198 Matredal
Nausta Sogn og Fjordane 230 61° 34' 5° 53' des.84 Sverre Ullaland 6043 Naustdal
Kårvatn Møre og Romsdal 210 62° 47' 8° 53' feb-78 Erik Kårvatn 6645 Todalen
Høylandet Nord-Trøndelag 60 64° 39' 12° 19’ feb-87 Jakob Olav Almås 7977 Høylandet
Tustervatn Nordland 439 65° 50' 13° 55' des-71 Are Tustervatn 8647 Bleikvassli
Andøya Nordland 380 69o16’ 16o0’ sep-09 Andøya
Rakettskytefelt
8483 Andenes
Karpbukt Finnmark 20 69o 40’ 30o 22’ okt-98 Roy Hallonen 9900 Kirkenes
Ny-Ålesund Svalbard 8 78° 55' 11° 55' 1974 NP forskningsst. 9173 Ny-Ålesund
Zeppelin Svalbard 474 78° 54' 11° 53' sep-89 NP forskningsst. 9173 Ny-Ålesund

Monitoring of long-range transported air pollutants in Norway, annual report 2013 | M-203
103
Table A.2.2: Measurement programme at Norwegian background stations in 2013, including the environmental
contaminants reported in Nizzetto et al. (2014).
Air precipitation
hourly daily weekly 2d per week
Daily Weekly monthly
Stasjon Metr. Ozone main NO2 PM2,5,
PM10 +
EC/OC HM. POPs main main HM POPs
Birkenes X X X X X Xb Xd X Xb Xe
Vatnedalen X
Treungen X
Haukenes X
Prestebakke X
Løken X
Hurdal X X X X X X Xa
Brekkebygda X
Vikedal X
Sandve X
Haukeland X
Nausta X
Kårvatn X X X X X Xa
Høylandet X
Tustervatn X X X X
Andøya X Xb Xg
Karpbukt X
Svanvik Xb
Zeppelin, Ny-Ålesund
X X X Xc Xg X
Total number 4 7+1 5 4 3 3 3 4 9 4 1
Metr. = meteorology main.precip = amount (mm), pH, conductivity, SO4, NO3, Cl, NH4, Ca, K, Mg, Na main air = SO2, SO4, HNO3 + NO3 ; NH4+ NH3, Ca, K, Mg, Na, Cl HM a = Pb, Cd and Zn
b = Pb, Cd, V, Cr, Co, Ni, Cu, Zn, As and Hg c = Pb, Cd, V, Cr, Mn, Co, Ni, Cu, Zn, As
POPs d = - og -HCH, HCB, DDTs, Chlordanes, PCBs, PBDE, HBCD, PAHs, PFAS
e = - og -HCH, HCB, PCB f = - og -HCH, HCB, HCHs, DDTs, PCBs, PBDEs, PFAS g = - og -HCH, HCB, DDTs, Chlordanes, PCBs, BDE, HBCDs, PAHs, PFAS,
Siloxanes, SCCP, MCCP

Monitoring of long-range transported air pollutants in Norway, annual report 2013 | M-203
104
Sampling and chemical analysis

Monitoring of long-range transported air pollutants in Norway, annual report 2013 | M-203
105
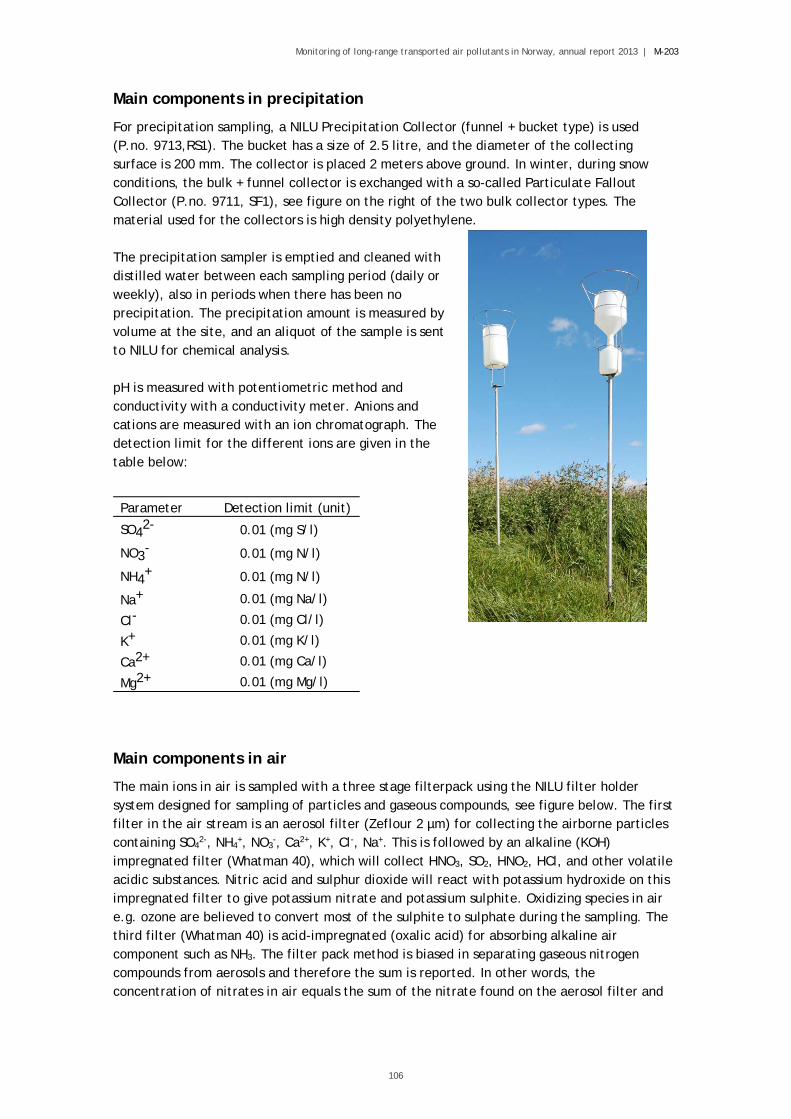
Monitoring of long-range transported air pollutants in Norway, annual report 2013 | M-203
106
Main components in precipitation
For precipitation sampling, a NILU Precipitation Collector (funnel + bucket type) is used (P.no. 9713,RS1). The bucket has a size of 2.5 litre, and the diameter of the collecting surface is 200 mm. The collector is placed 2 meters above ground. In winter, during snow conditions, the bulk + funnel collector is exchanged with a so-called Particulate Fallout Collector (P.no. 9711, SF1), see figure on the right of the two bulk collector types. The material used for the collectors is high density polyethylene. The precipitation sampler is emptied and cleaned with distilled water between each sampling period (daily or weekly), also in periods when there has been no precipitation. The precipitation amount is measured by volume at the site, and an aliquot of the sample is sent to NILU for chemical analysis. pH is measured with potentiometric method and conductivity with a conductivity meter. Anions and cations are measured with an ion chromatograph. The detection limit for the different ions are given in the table below:
Main components in air
The main ions in air is sampled with a three stage filterpack using the NILU filter holder system designed for sampling of particles and gaseous compounds, see figure below. The first filter in the air stream is an aerosol filter (Zeflour 2 µm) for collecting the airborne particles containing SO4
2-, NH4+, NO3
-, Ca2+, K+, Cl-, Na+. This is followed by an alkaline (KOH) impregnated filter (Whatman 40), which will collect HNO3, SO2, HNO2, HCl, and other volatile acidic substances. Nitric acid and sulphur dioxide will react with potassium hydroxide on this impregnated filter to give potassium nitrate and potassium sulphite. Oxidizing species in air e.g. ozone are believed to convert most of the sulphite to sulphate during the sampling. The third filter (Whatman 40) is acid-impregnated (oxalic acid) for absorbing alkaline air component such as NH3. The filter pack method is biased in separating gaseous nitrogen compounds from aerosols and therefore the sum is reported. In other words, the concentration of nitrates in air equals the sum of the nitrate found on the aerosol filter and
Parameter Detection limit (unit)
SO42- 0.01 (mg S/l)
NO3- 0.01 (mg N/l)
NH4+ 0.01 (mg N/l)
Na+ 0.01 (mg Na/l)
Cl- 0.01 (mg Cl/l)
K+ 0.01 (mg K/l)
Ca2+ 0.01 (mg Ca/l)
Mg2+ 0.01 (mg Mg/l)
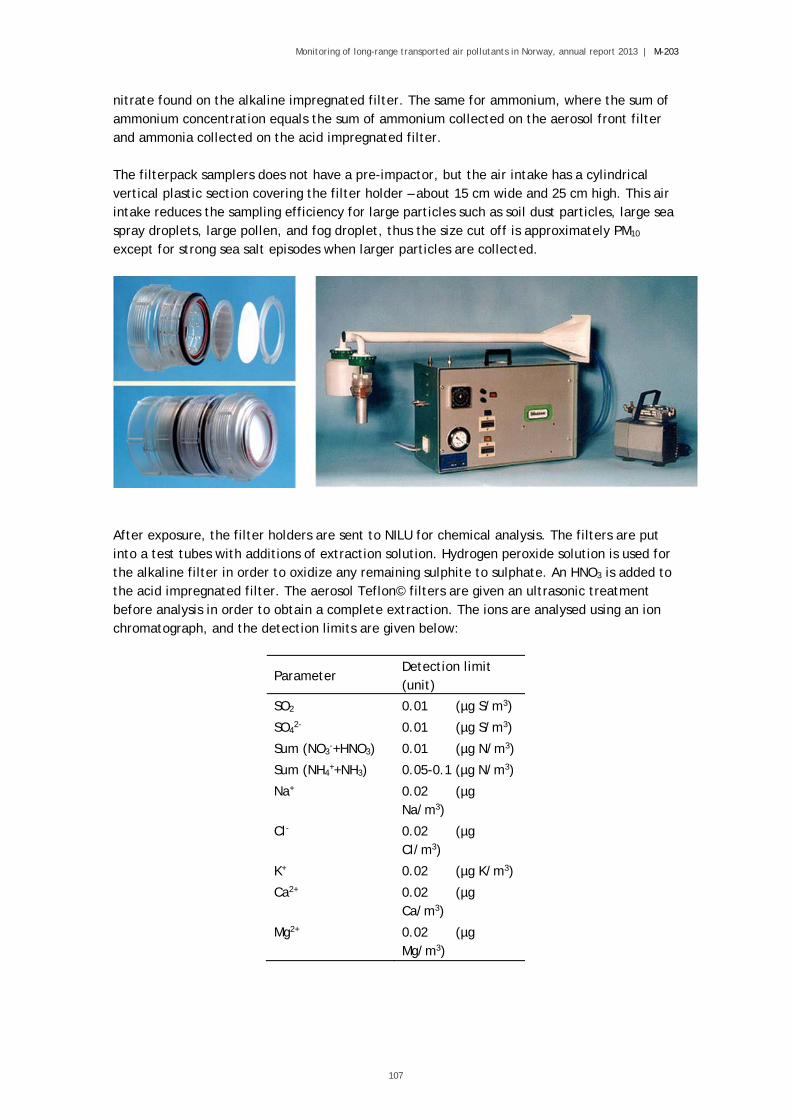
Monitoring of long-range transported air pollutants in Norway, annual report 2013 | M-203
107
nitrate found on the alkaline impregnated filter. The same for ammonium, where the sum of ammonium concentration equals the sum of ammonium collected on the aerosol front filter and ammonia collected on the acid impregnated filter. The filterpack samplers does not have a pre-impactor, but the air intake has a cylindrical vertical plastic section covering the filter holder – about 15 cm wide and 25 cm high. This air intake reduces the sampling efficiency for large particles such as soil dust particles, large sea spray droplets, large pollen, and fog droplet, thus the size cut off is approximately PM10 except for strong sea salt episodes when larger particles are collected.
After exposure, the filter holders are sent to NILU for chemical analysis. The filters are put into a test tubes with additions of extraction solution. Hydrogen peroxide solution is used for the alkaline filter in order to oxidize any remaining sulphite to sulphate. An HNO3 is added to the acid impregnated filter. The aerosol Teflon© filters are given an ultrasonic treatment before analysis in order to obtain a complete extraction. The ions are analysed using an ion chromatograph, and the detection limits are given below:
Parameter Detection limit (unit)
SO2 0.01 (µg S/m3)
SO42- 0.01 (µg S/m3)
Sum (NO3-+HNO3) 0.01 (µg N/m3)
Sum (NH4++NH3) 0.05-0.1 (µg N/m3)
Na+ 0.02 (µg Na/m3)
Cl- 0.02 (µg Cl/m3)
K+ 0.02 (µg K/m3)
Ca2+ 0.02 (µg Ca/m3)
Mg2+ 0.02 (µg Mg/m3)

Monitoring of long-range transported air pollutants in Norway, annual report 2013 | M-203
108
Nitrogen dioxide
NO2 is determined with the manual NaI glass sinter method. Ambient air with a flow rate of about 0.5 l/min is drawn through an air intake (inverted funnel) and a glass filter impregnated with sodium iodide (NaI) and sodium hydroxide (NaOH). Nitrogen dioxide is absorbed in the filter, and the iodide reduces NO2 to nitrite. The nitrite formed on the glass filter is extracted with deionized water. After extraction the nitrite concentration can be determined spectrophotometrically at 540 nm after a reaction with sulphanilamide and N-(1-naphthyl)-ethylenediamine (NEDA). The detection limit for this method is 0.03 µg N/m3. Ozone
Ozone (O3) is determined with the UV-absorption method (UV light at 254 nm) using a monitor with continuous measurements. The results are given in hourly resolution. Particles (Mass and EC/OC)
Daily measurements of PM10 at the Birkenes Observatory started in 1999 using a High-volume sampler. From 2000 – 2005, PM10 was obtained by a Ruprecht and Patashnick Dichotomus Partisol-plus, model 2025, which separated PM10 into its coarse (PM10-2.5) and fine (PM2.5) fraction. From 2006 (the Birkenes Observatory) and from 2010 (the Hurdal and Kårvatn sites), PM10 and PM2.5 (PM1 measurements at the Birkenes Observatory from 2006 - 2008) are obtained using Kleinfiltergerät samplers (one sampler pr. size faction), collecting filter samples on a weekly basis. The ambient aerosol particles are collected on prefired (850 °C for 3 hrs) quartz fibre filters (Whatman QM-A, 47 mm). The quartz fibre filters are conditioned (20 °C; 50% RH; 48 hrs) prior to and after being exposed. The mass concentration of the quartz fibre filters are determined gravimetrically. The uncertainty of the PM mass concentrations obtained for PM10 and PM2.5 is estimated to be around 0.1 – 0.15 µg/m3 for a sampling volume of 386 m3. At Birkenes, high–time resolution measurements of PM10, PM2.5 and PM1 by an OPC (optical particle counter) (GRIMM 190) instrument were started in 2010. The detection limit of the OPC is approximately 0.1 µg/m3. Thermal-Optical Analysis of EC, OC and TC in PM10 and PM2.5 are performed on the same filter samples as the mass concentration of PM10 and PM2.5 are obtained from. The T-O analysis are performed according to the EUSAAR_2 protocol (Cavalli et al., 2010). The analytical detection limit of the TOA instruments is 0.2 µg C/cm2.

The Norwegian Environment Agency’s primary tasks are to reduce greenhouse gas emissions, manage Norwegian nature, and prevent pollution. We are under the Ministry of Climate and Environment and have over 700 employees at our two offices in Trondheim and Oslo and at the Norwegian Nature Inspectorate’s more than sixty local offices. Our principal functions include monitoring the state of the environment, conveying environment-related information, exercising authority, overseeing and guiding regional and municipal authorities, cooperating with relevant industry authorities, acting as an expert advisor, and assisting in international environmental efforts.
Norwegian Environment Agency Telephone: +47 73 58 05 00 | Fax: +47 73 58 05 01 E-mail: [email protected] Web: www.environmentagency.no Postal address: Postboks 5672 Sluppen, N-7485 Trondheim Visiting address Trondheim: Brattørkaia 15, 7010 Trondheim Visiting address Oslo: Strømsveien 96, 0602 Oslo