Embed Size (px)
Citation preview
Lysine and Protein Metabolism in Young WomenSubdivision Based on the Novel Use of Multiple Stable Isotopic Labels
Charles S. Irving, M. Rita Thomas, Edward W. Malphus, Lisa Marks, William W. Wong,Thomas W. Boutton, and Peter D. KleinU. S. Department of Agriculture/Agricultural Research Service, Children's Nutrition Research Center; Department of Pediatrics,Baylor College of Medicine and Texas Children's Hospital, Houston, Texas 77030
Abstract
A multitracer stable isotope study of lysine kinetics was carriedout in fasted adult female volunteers to determine whether amulticompartmental model that partitions protein synthesis andbreakdown into at least two types of tissue components can beconstructed from plasma and breath data. Five female subjects,maintained on formula diets, received L-113CIlysine (27 Mmol/kg) as an i.v. bolus and L-1I5N2Ilysine (27 Atmol/kg) as an oralbolus 4 h postprandially. Plasma and breath samples were col-lected for 6 h. Onan alternate day, subjects received NaH'3C03(10 Atmol/kg) as an i.v. bolus and breath samples were collectedfor 6 h. Plasma tracer lysine levels were determined by gas chro-matography-mass spectrometry isotope ratiometry, and breath13C02 levels were measured by mass spectrometric gas isotoperatiometry. The tracer data could be fitted to a mammillary mul-ticompartmental model that consisted of a lysine central com-partment and slow- and fast-exchanging peripheral compart-ments containing 37, 38, and 324 gmol/kg, respectively. Therates of lysine oxidation, incorporation into protein, and releaseby protein breakdown were 21, 35, and 56 mmol/kg/h, respec-tively, in the fast-exchanging compartment, whereas the ratesof protein synthesis and breakdown in the slow compartmentwere both 53 mmol/kg/min. These values corresponded to awhole-body lysine flux of 106 mmol/kg/h. The kinetic param-eters were in excellent agreement with reported values obtainedby constant-infusion methods. The measurements indicated thatit will be possible to detect changes in amino acid pool sizes andprotein synthesis and breakdown associated with the mobilizationof protein stores from plasma and breath measurements in mul-titracer stable isotope experiments.
Introduction
Tracer studies of whole-body protein turnover in humans havecharacterized the alterations in whole-body protein synthesis andbreakdown that account for the changes in nitrogen balanceassociated with reduced protein and energy intakes, trauma,sepsis, burns, and cancer (1, 2). Because whole-body proteinturnover rates integrate the metabolism of all proteins throughoutall body tissues, they cannot answer questions about the parti-tioning of amino acid pools and protein synthesis and breakdownin relation to body size, age, metabolic rate, meal ingestion,long-term dietary intake, or trauma. Tissue sampling (3, 4) and
Receivedfor publication 10 December 1984 and in revisedform 2 De-cember 1985.
arteriovenous (5) catherization techniques, used extensively inanimal studies to characterize protein metabolism in specifictissues, are not applied easily in human investigations (5-8). Anoninvasive tracer method, based on plasma and breath sampling(9-1 1), that could resolve protein synthesis and breakdown indifferent body compartments in human subjects would facilitatethe investigation of the mobilization of protein stores in responseto nutritional, metabolic, and pathophysiologic challenges. Amultitracer stable isotope study of lysine kinetics was carriedout in fasted adult female subjects to determine whether it waspossible to construct an identifiable multicompartmental modelfrom plasma and breath isotopic data that could partition proteinsynthesis and breakdown into at least two different types of bodycompartments. Wereport the characteristics of the first multi-compartmental model of lysine metabolism in humans, whichincludes resolution of protein synthesis and breakdown in twoperipheral pools with properties that correspond to reported val-ues of muscle and viscera, respectively.
Methods
Materials. NaH'3CO3 (Merck Sharp & DohmeCanada Ltd., Montreal,Quebec), which contained 90 atom percent excess (APE)' "3C as assayedby gas isotope ratio-mass spectrometry, was made up at a concentrationof 200 mMin saline and sterilized by filtration. L-[carboxyl-'3C]lysine/HCI (Merck Sharp & Dohme Canada Ltd.), which contained 99 APE'3C, was assayed by gas chromatography-mass spectrometry and madeup to a concentration of 100 mg/ml in water. L-['5N2]lysine/HCl (96APE '5N) was prepared by microbial fermentation from '5NH4S04 ( 1)and purified before use. It was dissolved in Gatoraid (Stokely Van Camp,Minneapolis, MN) immediately before ingestion. D8-Lysine (Merck Sharp& Dohme) contained 98 APE deuterium and was used as an internalstandard in the analytical procedures without further purification. Allsolutions administered intravenously were tested for sterility and absenceof pyrogens before use.
Subjects. Healthy, nulliparous, women (23-33 yr old), whose weightswere within 95-120% of ideal body weight and whose diets included atleast 50% of the recommended dietary allowances (12), were recruitedinto the study. The characteristics of the five subjects are given in TableI. Each subject underwent a physical examination and review of medicalhistory. After a thorough explanation of the purpose of the study, thediet regimen, and the protocol for the kinetic measurements, informedconsent was obtained from each subject. The study was approved by theInstitutional Review Boards for Human Research of Baylor College ofMedicine and Texas Children's Hospital.
Dietary intakes. Protein, carbohydrate, and fat dietary intakes priorto the study (Table II) were calculated from dietary histories. On day 1of the study, subjects were placed on a Sustacal formula diet (MeadJohnson, Evansville, IN) designed to provide intakes of protein, carbo-hydrate, and fat composition (Table II) that approximated prestudy in-takes. In addition to the liquid formula, fruits and vegetables were addedto the diet up to the level of 5% of protein intake and 150-200 kcal/d.
1. Abbreviations used in this paper: APE, atom percent excess.
Lysine and Protein Metabolism in Young Women 1321
J. Clin. Invest.©) The American Society for Clinical Investigation, Inc.0021-9738/86/04/1321/11 $ 1.00Volume 77, April 1986, 1321-1331
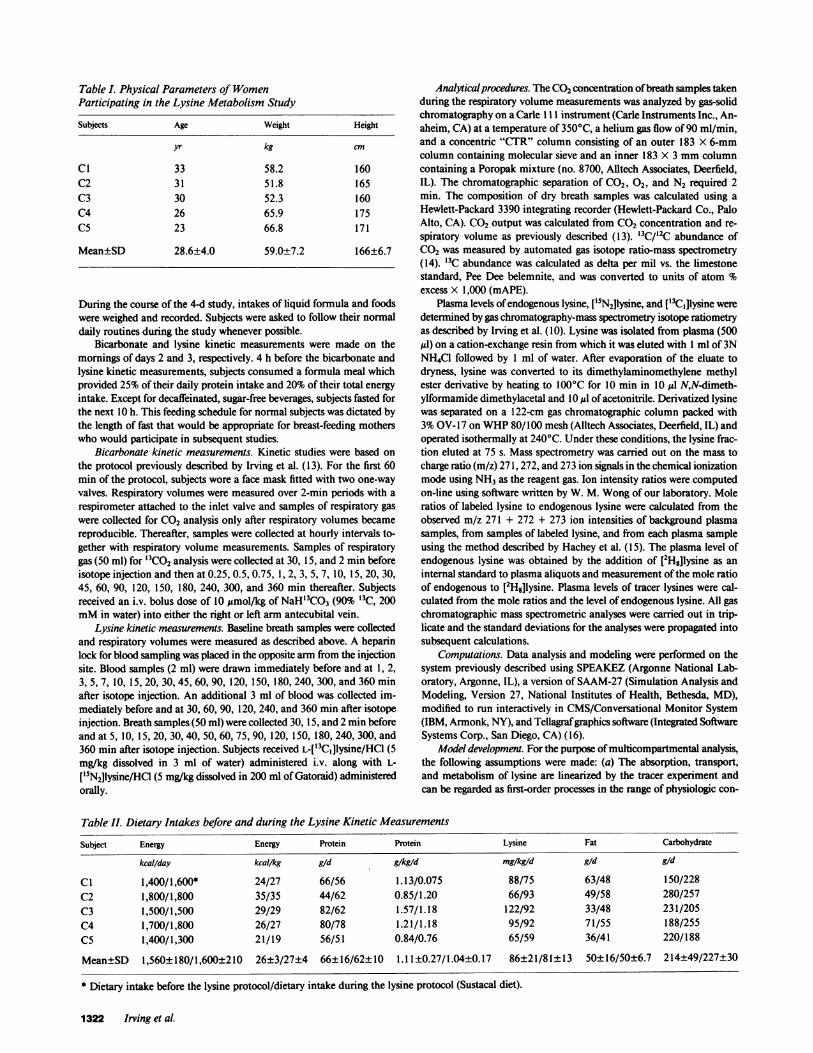
Table L Physical Parameters of WomenParticipating in the Lysine Metabolism Study
Subjects Age Weight Height
yr kg cm
Cl 33 58.2 160C2 31 51.8 165C3 30 52.3 160C4 26 65.9 175C5 23 66.8 171
Mean±SD 28.6±4.0 59.0±7.2 166±6.7
During the course of the 4-d study, intakes of liquid formula and foodswere weighed and recorded. Subjects were asked to follow their normaldaily routines during the study whenever possible.
Bicarbonate and lysine kinetic measurements were made on themornings of days 2 and 3, respectively. 4 h before the bicarbonate andlysine kinetic measurements, subjects consumed a formula meal whichprovided 25% of their daily protein intake and 20% of their total energyintake. Except for decaffeinated, sugar-free beverages, subjects fasted forthe next 10 h. This feeding schedule for normal subjects was dictated bythe length of fast that would be appropriate for breast-feeding motherswho would participate in subsequent studies.
Bicarbonate kinetic measurements. Kinetic studies were based onthe protocol previously described by Irving et al. (13). For the first 60min of the protocol, subjects wore a face mask fitted with two one-wayvalves. Respiratory volumes were measured over 2-min periods with arespirometer attached to the inlet valve and samples of respiratory gaswere collected for CO2 analysis only after respiratory volumes becamereproducible. Thereafter, samples were collected at hourly intervals to-gether with respiratory volume measurements. Samples of respiratorygas (50 ml) for 13C02 analysis were collected at 30, 15, and 2 min beforeisotope injection and then at 0.25, 0.5, 0.75, 1, 2, 3, 5, 7, 10, 15, 20, 30,45, 60, 90, 120, 150, 180, 240, 300, and 360 min thereafter. Subjectsreceived an i.v. bolus dose of 10 Amol/kg of NaH"3CO3 (90% 13C, 200mMin water) into either the right or left arm antecubital vein.
Lysine kinetic measurements. Baseline breath samples were collectedand respiratory volumes were measured as described above. A heparinlock for blood sampling was placed in the opposite arm from the injectionsite. Blood samples (2 ml) were drawn immediately before and at 1, 2,3, 5, 7, 10, 15, 20, 30, 45, 60, 90, 120, 150, 180, 240, 300, and 360 minafter isotope injection. An additional 3 ml of blood was collected im-mediately before and at 30, 60, 90, 120, 240, and 360 min after isotopeinjection. Breath samples (50 ml) were collected 30, 15, and 2 min beforeand at 5, 10, 15, 20, 30, 40, 50, 60, 75, 90, 120, 150, 180, 240, 300, and360 min after isotope injection. Subjects received L-['3C,]lysine/HCI (5mg/kg dissolved in 3 ml of water) administered i.v. along with L-[m5N2]lysine/HCl (5 mg/kg dissolved in 200 ml of Gatoraid) administeredorally.
Analytical procedures. The CO2concentration of breath samples takenduring the respiratory volume measurements was analyzed by gas-solidchromatography on a Carle I I I instrument (Carle Instruments Inc., An-aheim, CA) at a temperature of 350'C, a helium gas flow of 90 ml/min,and a concentric "CTR" column consisting of an outer 183 X 6-mmcolumn containing molecular sieve and an inner 183 X 3 mmcolumncontaining a Poropak mixture (no. 8700, Alltech Associates, Deerfield,IL). The chromatographic separation of C02, 02, and N2 required 2min. The composition of dry breath samples was calculated using aHewlett-Packard 3390 integrating recorder (Hewlett-Packard Co., PaloAlto, CA). CO2output was calculated from CO2concentration and re-spiratory volume as previously described (13). '3C/12C abundance ofCO2 was measured by automated gas isotope ratio-mass spectrometry(14). '3C abundance was calculated as delta per mil vs. the limestonestandard, Pee Dee belemnite, and was converted to units of atom %excess X 1,000 (mAPE).
Plasma levels of endogenous lysine, ['5N2]1ysine, and [m3C1]lysine weredetermined by gas chromatography-mass spectrometry isotope ratiometryas described by Irving et al. (10). Lysine was isolated from plasma (500Ml) on a cation-exchange resin from which it was eluted with 1 ml of 3NNH4CI followed by 1 ml of water. After evaporation of the eluate todryness, lysine was converted to its dimethylaminomethylene methylester derivative by heating to 100IC for 10 min in 10 ul NN-dimeth-ylformamide dimethylacetal and 10 ,ul of acetonitrile. Derivatized lysinewas separated on a 122-cm gas chromatographic column packed with3%OV- 17 on WHP80/100 mesh (Alltech Associates, Deerfield, IL) andoperated isothermally at 240°C. Under these conditions, the lysine frac-tion eluted at 75 s. Mass spectrometry was carried out on the mass tocharge ratio (m/z) 271, 272, and 273 ion signals in the chemical ionizationmode using NH3as the reagent gas. Ion intensity ratios were computedon-line using software written by W. M. Wongof our laboratory. Moleratios of labeled lysine to endogenous lysine were calculated from theobserved m/z 271 + 272 + 273 ion intensities of background plasmasamples, from samples of labeled lysine, and from each plasma sampleusing the method described by Hachey et al. (15). The plasma level ofendogenous lysine was obtained by the addition of [2H8]lysine as aninternal standard to plasma aliquots and measurement of the mole ratioof endogenous to [2H8]lysine. Plasma levels of tracer lysines were cal-culated from the mole ratios and the level of endogenous lysine. All gaschromatographic mass spectrometric analyses were carried out in trip-licate and the standard deviations for the analyses were propagated intosubsequent calculations.
Computations. Data analysis and modeling were performed on thesystem previously described using SPEAKEZ(Argonne National Lab-oratory, Argonne, IL), a version of SAAM-27 (Simulation Analysis andModeling, Version 27, National Institutes of Health, Bethesda, MD),modified to run interactively in CMS/Conversational Monitor System(IBM, Armonk, NY), and Tellagraf graphics software (Integrated SoftwareSystems Corp., San Diego, CA) (16).
Model development. For the purpose of multicompartmental analysis,the following assumptions were made: (a) The absorption, transport,and metabolism of lysine are linearized by the tracer experiment andcan be regarded as first-order processes in the range of physiologic con-
Table II. Dietary Intakes before and during the Lysine Kinetic Measurements
Subject Energy Energy Protein Protein Lysine Fat Carbohydrate
kcal/day kcal/kg gid g/kg/d mg/kg/d g/d g/d
Cl 1,400/1,600*C2 1,800/1,800C3 1,500/1,500C4 1,700/1,800CS 1,400/1,300
24/2735/3529/2926/2721/19
66/5644/6282/6280/7856/51
1.13/0.0750.85/1.201.57/1.181.21/1.180.84/0.76
88/7566/93
122/9295/9265/59
63/4849/5833/4871/5536/41
150/228280/257231/205188/255220/188
Mean±SD 1,560±180/1,600±210 26±3/27±4 66±16/62±10 1.11±0.27/1.04±0.17 86±21/81±13 50±16/50±6.7 214±49/227±30
* Dietary intake before the lysine protocol/dietary intake during the lysine protocol (Sustacal diet).
1322 Irving et al.

centrations encountered in normal subjects. (b) In subjects who wereequilibrated on a liquid formula diet for at least 3 d and who were receivingfour feedings per day, the period of 4-10 h after a liquid formula mealrepresented a period of "quasi-stationary" metabolism during which allkinetic parameters were time invariant, even though the system wasnonstationary over a longer period of time. (c) Labeled CO2generatedinside a cell will enter the capillary bed rapidly and be converted tolabeled bicarbonate, which will have the same distribution throughoutbody pools and metabolites as intravenously administered bicarbonate.(d) Labeled lysine administered orally as an isotonic solution will beabsorbed in a first-order kinetic process and will pass through thesplanchnic bed before appearing in plasma. (e) The decarboxylation oflysine occurs exclusively in the splanchnic tissues and not in muscle orextracellular spaces. (f ) Protein synthesis does not occur in extracellularspaces. (g) [13C1]- and ['5N2]lysine are eliminated from the circulationat the same rate.
The uptake of amino acids into extracellular spaces and their incor-poration into protein are nonlinear processes when measured over awide range of intra- and extracellular concentrations (17). The hepaticextraction of enterally administered amino acids is also nonlinear andincreases with increasing protein intake ( 18). However, all tracer methodscurrently used to estimate protein synthesis in the whole animal arebased on the linearization (19) by the tracer experiment of a nonlinearsystem (assumption a), i.e., a doubling of the incorporation of endogenousamino acid into protein will be accompanied by a doubling in the amountof tracer incorporated into protein, provided the tracer dose is smallenough. Analysis of oral tracer data (assumption d) presumes the absenceof portal-systemic shunting and saturation of intestinal absorption bythe tracer lysine dose, which appears to be reasonable for the normalsubjects who were studied.
Determination of the minimum number of pools in the system.Two-, three-, and four-multiexponential equations were fitted to the levelsof ['3C]lysine observed after i.v. bolus injection in each of the five subjectsstudied. The two-exponential equation could not account for the shapeof the disappearance curves, whereas the use of the four-exponentialequation resulted in large uncertainties in the estimated parameters. Whenthe three-exponential equation was fitted to the disappearance curves of['3C1]lysine, coefficients of variation of less than 0.05 and standard de-viations of < 15% of the estimated parameters were obtained for each ofthe five subjects. These figures indicated that the compartmental modelorder was three, and that the lysine system contained at least three re-solvable compartments. Had the number of resolvable compartmentsbeen only two, it would not have been possible to partition lysine me-tabolism into pools with fast and slow turnover. Estimated parameterswere obtained from Eq. 1,
C,7v = A le-k + A2e-kQ' + A3e-ky,
corrected by the term Cdt, which is the negative area under the curvefrom time 0 to t0, that arises from the fit of a multiexponential equationto the delayed appearance of an orally administered tracer.
AUCIV = (A,/ki) + (A2/k2) + (A3/k3)
AUC° = (A4/k4) + (A5/k5) + (A6/k6) - C,°dt
SA = AUCO/AUCiv
Cov= Al + A2 + A3
CJV = doseiv/Co&vVTiV = doselv/(k3AUCIV)
VT° = doseo/(k6AUC0)
tfiv = 0.693/k3
to= 0.693/k3
tr = tma to
(3)
(4)
(5)
(6)
(7)
(8)
(9)
(10)
(11)
(12)
Development of the multicompartmental model. The objective of themodel building process was to derive a model of lysine kinetics in humansfrom the plasma and breath kinetic data that embodied the essentialfeatures of the multicompartmental model of lysine kinetics derived fromanimal studies. The special feature of the model was independent esti-mates of liver and muscle protein synthesis. Aub and Waterlow (20)assembled a multicompartmental model for lysine kinetics in the ratfrom literature values of protein synthetic rates and amino acid transport.Their model consisted of a central plasma compartment connected to aliver extracellular fluid compartment and to a muscle extracellular fluidcompartment. The extracellular compartments were connected, respec-tively, to the liver and muscle intracellular free amino acid compartments.A reasonable approximation of their model is a three-compartment modelin which plasma and extracellular compartments are combined in a singlecentral compartment. Thus the core of all multicompartmental modelsof lysine kinetics consists of a central compartment that contains a plasmapool connected to fast- and to slow-exchanging peripheral pools.
The first step in the model-building process was to fit a mammillarythree-compartment model (model 1, Fig. 1) to the plasma levels of i.v.administered ['3C,]lysine. The central pool is labeled c, the peripheralpool whose free lysine rapidly exchanges with the central compartmentis labeledfand the peripheral pool which exchanges more slowly is labeled
Model 1 Model 2
(1)where C, is the plasma level of labeled lysine at time t, A, is the preex-ponential term, and ki is the decay term.
Multiexponential analysis of ["N2]1ysine data. The plasma levels oforally administered ['5N2]lysine were fitted to two-, three-, and four-exponential equations. Best fits, judged by coefficients of variation andthe percent standard deviations of the estimated parameters, were ob-tained from the use of the three-exponential equation given by Eq. 2,
C,t = A4ek + Asekv + A6e-k. (2)
Determination of noncompartmental kinetic parameters. A numberof descriptive parameters, such as the systemic availability of orally ad-ministered lysine (SA), initial space (Va), total half-life (t), and time (4)required for orally administered lysine to rise to maximum plasma levelsstarting at the time of the first detectable level of labeled lysine in plasma(to), can be derived for i.v. administered ["C,]lysine (iv) and orally ad-ministered ['5NI]lysine (o) using Eqs. 3-12 (11): where AUCis the areaunder the respective plasma disappearance curve, C0 is the extrapolatedplasma level of labeled lysine at zero time, t,, is the time that maximalplasma levels of labeled lysine are achieved, and to and t,,,, are estimatedby visual inspection of the curves. In Eq. 4, the area under the curve is
Figure 1. Model 1: three-compartment mammillary model describingthe plasma disappearance data of i.v. administered L-["C,]lysine.Model 2: four-compartment linear model describing the plasma disap-pearance data of both i.v. administered L-["C,]lysine and orally ad-ministered L-['3N2]lysine. Central, fast-exchanging peripheral, andslowly exchanging peripheral compartments are denoted by c, f and s,respectively.
Lysine and Protein Metabolism in Young Women 1323
s. The irreversible loss of tracer was allowed to occur from compartmentf The three-compartment model could be fitted to the plasma data ofall five subjects.
The next step in the model building process was to partition irre-versible loss of tracer between the f and s peripheral compartments byfitting the model to plasma levels of i.v. administered ['3C1]lysine andorally-administered ['5N2Jlysine (model 2, Fig. 1). Orally administeredlysine was admitted to a single compartment, labeled o, which emptiedinto compartment f(see assumption d) in which lysine was either irre-versibly lost via metabolism (oxidation and protein synthesis) or exportedto the central compartment. The ratio of metabolism to export was fixedby the reduction in the circulating levels of orally administered comparedwith i.v. administered lysine. Because both lysine tracers shared the sameset of systemic fractional rate constants (see assumptionf ), the rate con-stant for the irreversible loss of i.v. administered lysine from compartments was estimated from the observed plasma elimination and the eliminationrate constant for compartmentf The four-compartment model accountedfor both the gastrointestinal absorption and systemic metabolism of lysine.
Model 2 can be shown to fulfill the two requirements described byCobelli et al. (21, 22) that are necessary for a multicompartmental modelto be system identifiable. First, the system is output-input connectable,because the sites of oral and i.v. administration of tracers are connectedto the site of plasma sampling by defined pathways. Second, the numberof unknown model parameters, seven rate constants, and one commonvolume of dilution for the orally and i.v. administered tracers does notexceed the maximum number of estimable parameters, which is eightfor model 2. This number was determined in the following manner usingthe method described by Cobelli et al. (21, 22). The number of com-partments (n) in model 2 is four. The tracer experiment was designedso that there were two input-output subsystems, i.e., i.v. administrationinto the central pool (c) with i.v. sampling from the central pool (c)denoted by cc, and oral administration into the oral pool (o) with i.v.sampling from the central pool (c) denoted by oc. For the cc subsystem,the term Wa, which is the number of compartments in the subsystemminus the length of the shortest path minus 1, is 3 - 0 - 1. For the ocsubsystem, the term WO, which is the number of compartments minusthe length of the shortest path, is 4 - 2. The maximum number ofestimable parameters is given (21, 22) by n + Was + WO,which is 4 + 2+ 2. The small fractional standard deviations obtained for eight modelparameters when fitted to plasma data indicated that model 2 was alsoparameter identifiable. Model 2 is not unique in the respect that variantsof the model could be fitted to the plasma data. However, model 2 wasthe only configuration that was consistent with the goals of the modeldevelopment process and partitioned lysine elimination between the twoperipheral pools.
The next step in the model building process was the partitioning oflysine metabolism into oxidation and protein synthesis. The incorporationof breath '3CO2 data into the calculations required the use of a bicarbonatesubsystem that accounted for the losses and delays in 3CO2 excretionassociated with the passage of labeled carbon through metabolic carbonand bicarbonate pools.
Determination of the bicarbonate subsystem. Bicarbonate kineticsare affected by diet, metabolic status, and level of activity. Wepreviouslyhad determined bicarbonate subsystems for young adult volunteers ineither the overnight-fasted state ( 13) or the continuously fed state (23).These systems, however, were not appropriate for the formula-fed femalevolunteers for the 4-10-h postprandial period required in this study.Therefore, a new set of bicarbonate kinetic parameters was obtained forthese subjects.
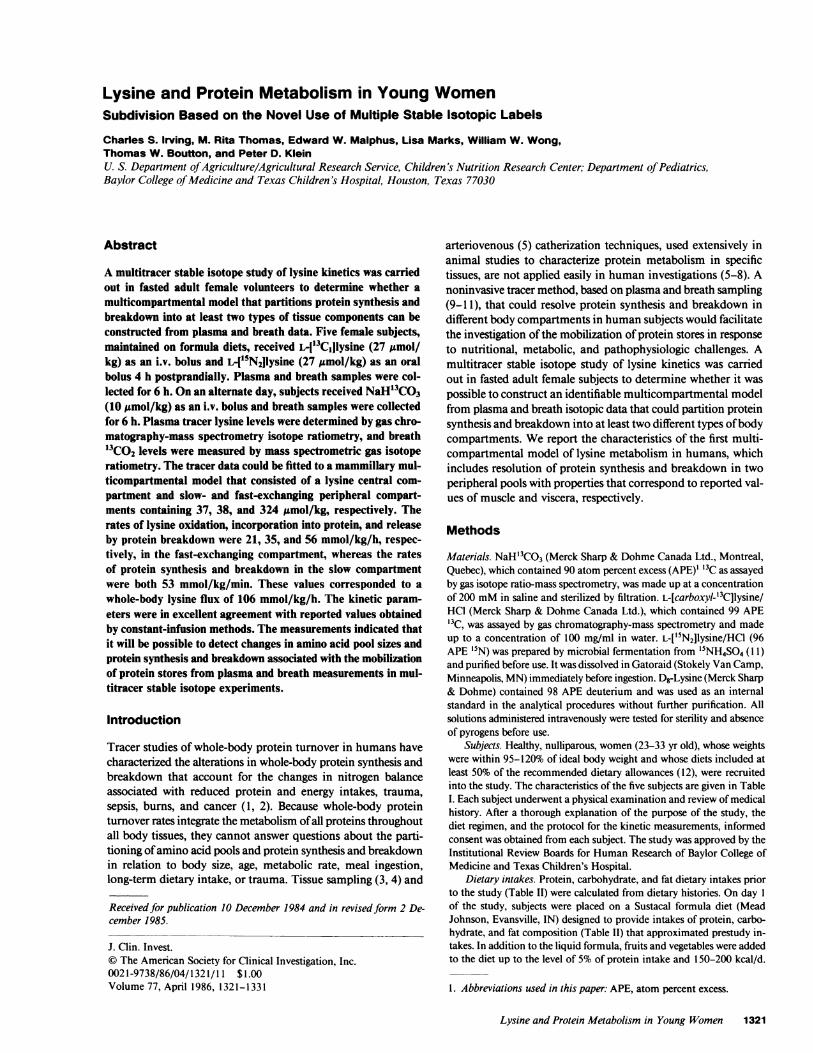
The three-compartment model previously described (13) for adultmale volunteers, who were fasted overnight and were in a resting state,was fitted to the levels of '3CO2 in breath obtained during the bicarbonatekinetic measurements. It was expected that the qualitative features ofthe bicarbonate/CO2 system would be the same in male and female sub-jects, but that quantitative differences would be found in the rates ofelimination and transfer of bicarbonate between compartments, consis-tent with a postprandial period of 4 h in the female volunteers. As seenin Fig. 2, the bicarbonate model consisted of a central compartment, c,
Il Ll Figure 2. Three-compartment main-millary model used to describe the
iLV. _t c ) t b ) output of '3CO2 in breath followingthe i.v. bolus administration ofNaH'3CO3. Central, fast-exchangingperipheral, and slowly exchanging pe-
Ss ) ripheral are denoted by c, f and s andbreath is denoted by b.
that included the plasma into which the labeled bicarbonate was intro-duced. Labeled bicarbonate in the central compartment underwent afast exchange with one peripheral compartment,f and a slower exchangewith a second peripheral compartment, s. Labeled bicarbonate could belost from the central compartment either by elimination in the form ofbreath CO2 or by exchange of labeled CO2 with nonlabeled carboxylgroups of metabolic intermediates, by exchange with a large pool ofbicarbonate undergoing slow turnover as in bone, or by renal excretion.The latter three processes have been summedtogether and are representedby the irreversible loss of labeled bicarbonate from the central com-partment. These transfer processes are described by six fractional rateconstants. Estimates of pool sizes were obtained by steady-state solutionusing each subject's measured CO2output rate. Convergence, as definedby Berman and Weiss (24), was obtained in each case.
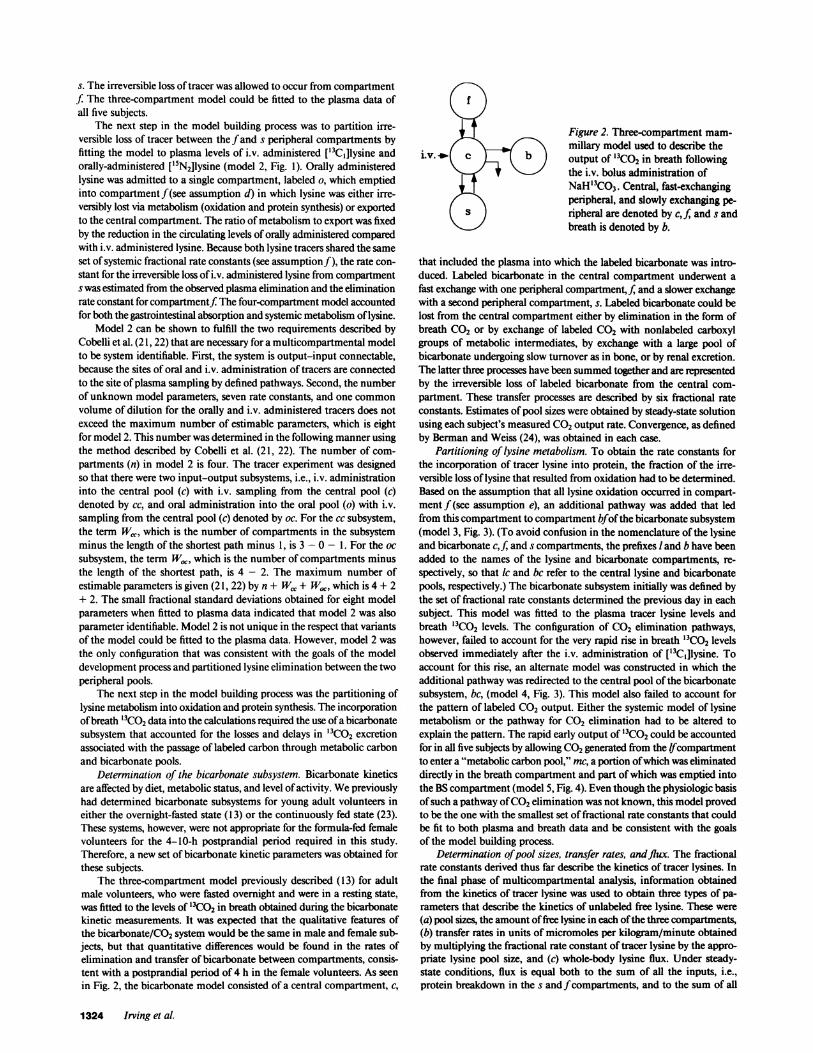
Partitioning of lysine metabolism. To obtain the rate constants forthe incorporation of tracer lysine into protein, the fraction of the irre-versible loss of lysine that resulted from oxidation had to be determined.Based on the assumption that all lysine oxidation occurred in compart-ment f (see assumption e), an additional pathway was added that ledfrom this compartment to compartment bfof the bicarbonate subsystem(model 3, Fig. 3). (To avoid confusion in the nomenclature of the lysineand bicarbonate c, f and s compartments, the prefixes land b have beenadded to the names of the lysine and bicarbonate compartments, re-spectively, so that Ic and bc refer to the central lysine and bicarbonatepools, respectively.) The bicarbonate subsystem initially was defined bythe set of fractional rate constants determined the previous day in eachsubject. This model was fitted to the plasma tracer lysine levels andbreath '3CO2 levels. The configuration of CO2 elimination pathways,however, failed to account for the very rapid rise in breath 13CO2 levelsobserved immediately after the i.v. administration of ['3C,]lysine. Toaccount for this rise, an alternate model was constructed in which theadditional pathway was redirected to the central pool of the bicarbonatesubsystem, bc, (model 4, Fig. 3). This model also failed to account forthe pattern of labeled CO2 output. Either the systemic model of lysinemetabolism or the pathway for CO2 elimination had to be altered toexplain the pattern. The rapid early output of "3CO2 could be accountedfor in all five subjects by allowing CO2generated from the lfcompartmentto enter a "metabolic carbon pool," mc, a portion of which was eliminateddirectly in the breath compartment and part of which was emptied intothe BS compartment (model 5, Fig. 4). Even though the physiologic basisof such a pathway of CO2elimination was not known, this model provedto be the one with the smallest set of fractional rate constants that couldbe fit to both plasma and breath data and be consistent with the goalsof the model building process.
Determination ofpool sizes, transfer rates, andflux. The fractionalrate constants derived thus far describe the kinetics of tracer lysines. Inthe final phase of multicompartmental analysis, information obtainedfrom the kinetics of tracer lysine was used to obtain three types of pa-rameters that describe the kinetics of unlabeled free lysine. These were(a) pool sizes, the amount of free lysine in each of the three compartments,(b) transfer rates in units of micromoles per kilogram/minute obtainedby multiplying the fractional rate constant of tracer lysine by the appro-priate lysine pool size, and (c) whole-body lysine flux. Under steady-state conditions, flux is equal both to the sum of all the inputs, i.e.,protein breakdown in the s andf compartments, and to the sum of all
1324 Irving et al.
the outputs, i.e., protein synthesis in the s and fcompartments and ox-idation. Estimates of flux obtained in this manner from multicompart-mental analysis parameters are equivalent to the value for flux calculatedfrom plateau enrichments obtained during the constant infusion of labeledlysine. The calculation of pool sizes, transfer rates, and flux required twoadditional types of information. These were (a) the size of the centrallysine pool obtained by multiplying the plasma lysine level by the volumeof the central pool and (b) the sites and relative rates of protein breakdown.Solutions were calculated for the boundary conditions in which proteinbreakdown occurred exclusively either in the fast- or the slow-exchangingpool. Various intermediate solutions were also calculated. Lysine poolsizes and kinetic parameters reported here were calculated for the con-dition of balanced protein synthesis and breakdown in the slow-exchangecompartment. This condition is characterized by no net lysine uptakeor release across muscle. The choice of this condition seemed reasonablebecause measurements of arteriovenous differences across muscle ofplasma free amino acid levels have shown lysine uptake by muscle hasfallen to near zero values by 3-4 h after a protein meal (7, 8).
Figure 3. Combined lysine and bicarbonate models that could not befitted to breath '3C02 levels obtained after the i.v. administration of L-
['3C,]lysine. Lysine central, fast-exchanging peripheral, slowly ex-
changing peripheral, and oral compartments are denoted by Ic, If, Is,and lo, respectively. Bicarbonate central, fast-exchanging peripheral,and slowly exchanging peripheral are denoted by bc, bf, and bs, andbreath is denoted by b.
Model 5
Figure 4. Combined lysine and bicarbonate models that were fitted si-multaneously to breath 13CO2 levels obtained after the i.v. administra-tion of L-['3Cl]lysine, breath '3CO2 levels obtained after the i.v. ad-ministration of NaHW3CO3,and the plasma levels of tracer lysines.The lysine component of the "metabolic carbon pool" is denoted bymc. Other abbreviations are given in Fig. 3.
Results
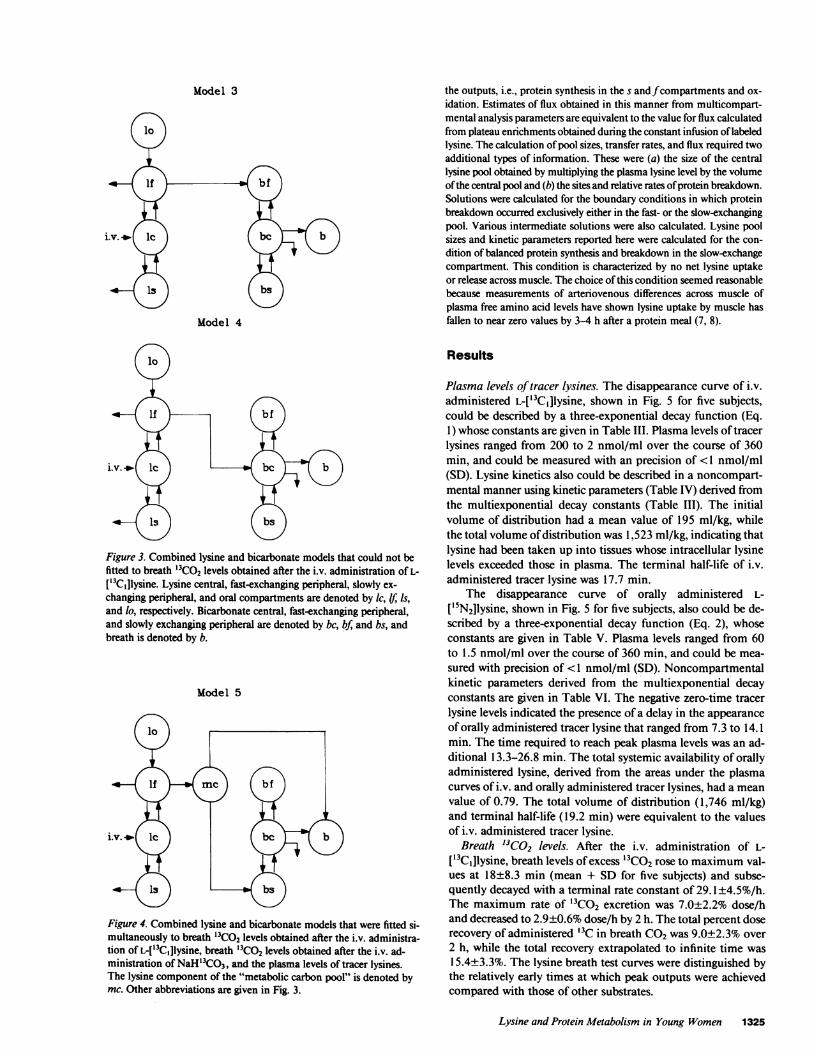
Plasma levels of tracer lysines. The disappearance curve of i.v.administered L-['3Cl]lysine, shown in Fig. 5 for five subjects,could be described by a three-exponential decay function (Eq.1) whose constants are given in Table III. Plasma levels of tracerlysines ranged from 200 to 2 nmol/ml over the course of 360min, and could be measured with an precision of <1 nmol/ml(SD). Lysine kinetics also could be described in a noncompart-mental manner using kinetic parameters (Table IV) derived fromthe multiexponential decay constants (Table III). The initialvolume of distribution had a mean value of 195 ml/kg, whilethe total volume of distribution was 1,523 ml/kg, indicating thatlysine had been taken up into tissues whose intracellular lysinelevels exceeded those in plasma. The terminal half-life of i.v.administered tracer lysine was 17.7 min.
The disappearance curve of orally administered L-['5N2]lysine, shown in Fig. 5 for five subjects, also could be de-scribed by a three-exponential decay function (Eq. 2), whoseconstants are given in Table V. Plasma levels ranged from 60to 1.5 nmol/ml over the course of 360 min, and could be mea-sured with precision of <1 nmol/ml (SD). Noncompartmentalkinetic parameters derived from the multiexponential decayconstants are given in Table VI. The negative zero-time tracerlysine levels indicated the presence of a delay in the appearance
of orally administered tracer lysine that ranged from 7.3 to 14.1min. The time required to reach peak plasma levels was an ad-ditional 13.3-26.8 min. The total systemic availability of orallyadministered lysine, derived from the areas under the plasmacurves of i.v. and orally administered tracer lysines, had a meanvalue of 0.79. The total volume of distribution (1,746 ml/kg)and terminal half-life (19.2 min) were equivalent to the valuesof i.v. administered tracer lysine.
Breath '3Co2 levels. After the i.v. administration of L-
['3C,]lysine, breath levels of excess '3CO2 rose to maximum val-ues at 18±8.3 min (mean + SD for five subjects) and subse-quently decayed with a terminal rate constant of 29.1±4.5%/h.The maximum rate of '3C02 excretion was 7.0±2.2% dose/hand decreased to 2.9±0.6% dose/h by 2 h. The total percent doserecovery of administered '3C in breath CO2was 9.0±2.3% over
2 h, while the total recovery extrapolated to infinite time was
15.4±3.3%. The lysine breath test curves were distinguished bythe relatively early times at which peak outputs were achievedcompared with those of other substrates.
Lysine and Protein Metabolism in Young Women 1325
Model 3
Model 4

0E0
0.as
0._
0
Esa
0
4-0L_0
0
0~
360 0 120 210 360 0
Time (minutes)Figure 5. Observed (.) and calculated ( ) values of (A) plasma ['3CI]lysine, (B) ['5NI]lysine, (C) breath '3CO2 after [(3CI]lysine, and (D) breath'3Co2 after NaH'3CO3 for subjects, Cl-C5, and the set of averaged subjects' curves (Cav) Calculated values were obtained using the complete setof fractional rate constants given in Table VII and model 5 shown in Fig. 4.
Bicarbonate kinetic parameters. The bicarbonate multicom-partment model previously applied to adult subjects, who werein the resting state and who had fasted overnight, could be fittedwithout difficulty to the levels of excess "3CO2 in breath afterthe administration of NaH3CO3 to subjects in this study. Female
subjects in a resting state over the period of 4-10 h after a formulameal were found to have central, fast-exchanging peripheral,and slow-exchanging peripheral pools containing 2,564±1,410,5,280±2,699, and 6,875±1,714 Atmol/kg, respectively, of bicar-bonate/CO2/metabolic carbon. The total flux was 187±16 ,mol/
1326 Irving et al.
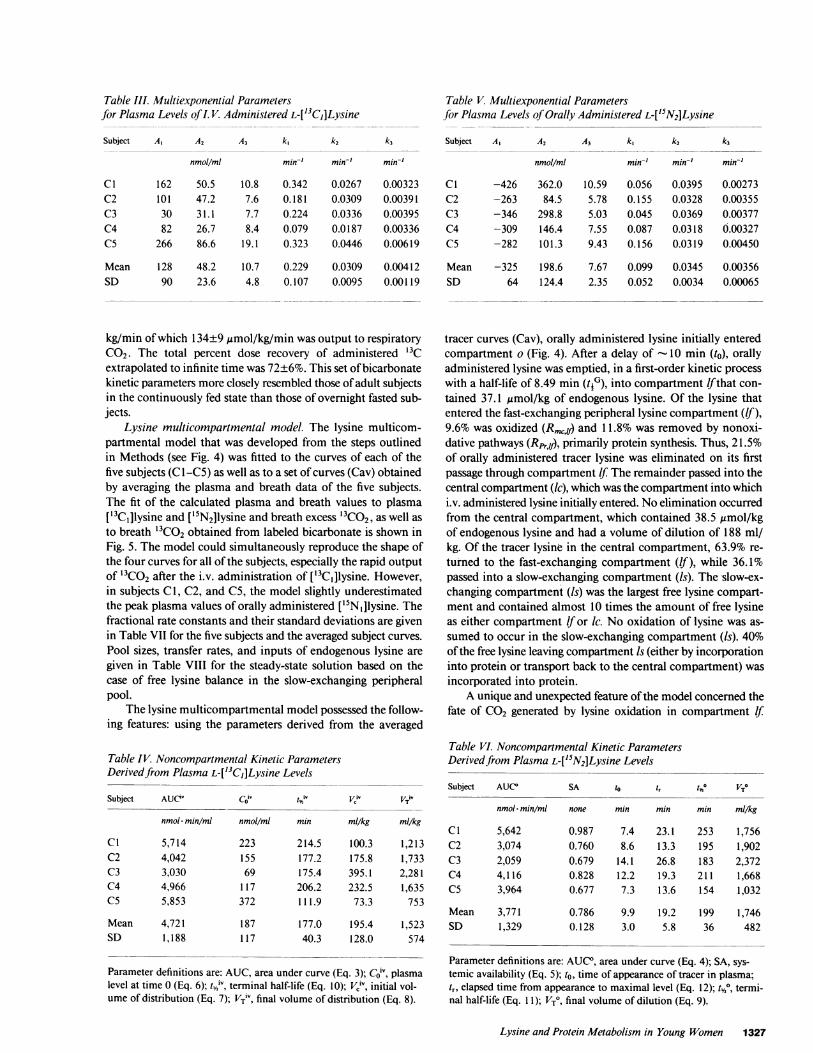
Table III. Multiexponential Parametersfor Plasma Levels of I. V. Administered L-['3C,]Lysine
Subject A, A2 A3 k, k1 k3
nmol/ml min-' min' min-'
C1 162 50.5 10.8 0.342 0.0267 0.00323C2 101 47.2 7.6 0.181 0.0309 0.00391C3 30 31.1 7.7 0.224 0.0336 0.00395C4 82 26.7 8.4 0.079 0.0187 0.00336C5 266 86.6 19.1 0.323 0.0446 0.00619
Mean 128 48.2 10.7 0.229 0.0309 0.00412SD 90 23.6 4.8 0.107 0.0095 0.00119
kg/min of which 134±9 Amol/kg/min was output to respiratoryCO2. The total percent dose recovery of administered '3Cextrapolated to infinite time was 72±6%. This set of bicarbonatekinetic parameters more closely resembled those of adult subjectsin the continuously fed state than those of overnight fasted sub-jects.
Lysine multicompartmental model. The lysine multicom-partmental model that was developed from the steps outlinedin Methods (see Fig. 4) was fitted to the curves of each of thefive subjects (C 1-C5) as well as to a set of curves (Cav) obtainedby averaging the plasma and breath data of the five subjects.The fit of the calculated plasma and breath values to plasma[13CI]lysine and ['5N21lysine and breath excess '3CO2, as well asto breath '3CO2 obtained from labeled bicarbonate is shown inFig. 5. The model could simultaneously reproduce the shape ofthe four curves for all of the subjects, especially the rapid outputof '3CO2 after the i.v. administration of ['3Cl]lysine. However,in subjects Cl, C2, and C5, the model slightly underestimatedthe peak plasma values of orally administered ['5N1]lysine. Thefractional rate constants and their standard deviations are givenin Table VII for the five subjects and the averaged subject curves.Pool sizes, transfer rates, and inputs of endogenous lysine aregiven in Table VIII for the steady-state solution based on thecase of free lysine balance in the slow-exchanging peripheralpool.
The lysine multicompartmental model possessed the follow-ing features: using the parameters derived from the averaged
Table IV. Noncompartmental Kinetic ParametersDerived from Plasma L-['3C,]Lysine Levels
Subject AUC" v t iv VC, VTiV
nmol- min/ml nmol/ml min mil/kg ml/kg
C1 5,714 223 214.5 100.3 1,213C2 4,042 155 177.2 175.8 1,733C3 3,030 69 175.4 395.1 2,281C4 4,966 117 206.2 232.5 1,635C5 5,853 372 111.9 73.3 753
Mean 4,721 187 177.0 195.4 1,523SD 1,188 117 40.3 128.0 574
Parameter definitions are: AUC, area under curve (Eq. 3); Co0v, plasmalevel at time 0 (Eq. 6); m,,'v, terminal half-life (Eq. 10); VC', initial vol-ume of distribution (Eq. 7); VTiV, final volume of distribution (Eq. 8).
Table V. Multiexponential Parametersfor Plasma Levels of Orally Administered L-[lSN2]Lysine
Subject A, A2 A3 k, k2 k3
nmol/ml min' min-' min'
C1 -426 362.0 10.59 0.056 0.0395 0.00273C2 -263 84.5 5.78 0.155 0.0328 0.00355C3 -346 298.8 5.03 0.045 0.0369 0.00377C4 -309 146.4 7.55 0.087 0.0318 0.00327C5 -282 101.3 9.43 0.156 0.0319 0.00450
Mean -325 198.6 7.67 0.099 0.0345 0.00356SD 64 124.4 2.35 0.052 0.0034 0.00065
tracer curves (Cav), orally administered lysine initially enteredcompartment o (Fig. 4). After a delay of - 10 min (to), orallyadministered lysine was emptied, in a first-order kinetic processwith a half-life of 8.49 min (tG), into compartment If that con-tained 37.1 ,umol/kg of endogenous lysine. Of the lysine thatentered the fast-exchanging peripheral lysine compartment (If),9.6% was oxidized (Rm,#) and 11.8% was removed by nonoxi-dative pathways (Rpr,/#), primarily protein synthesis. Thus, 21.5%of orally administered tracer lysine was eliminated on its firstpassage through compartment If The remainder passed into thecentral compartment (kc), which was the compartment into whichi.v. administered lysine initially entered. No elimination occurredfrom the central compartment, which contained 38.5 Armol/kgof endogenous lysine and had a volume of dilution of 188 ml/kg. Of the tracer lysine in the central compartment, 63.9% re-turned to the fast-exchanging compartment (If), while 36.1%passed into a slow-exchanging compartment (is). The slow-ex-changing compartment (Is) was the largest free lysine compart-ment and contained almost 10 times the amount of free lysineas either compartment If or kc. No oxidation of lysine was as-sumed to occur in the slow-exchanging compartment (Is). 40%of the free lysine leaving compartment Is (either by incorporationinto protein or transport back to the central compartment) wasincorporated into protein.
A unique and unexpected feature of the model concerned thefate of CO2 generated by lysine oxidation in compartment If
Table VI. Noncompartmental Kinetic ParametersDerived from Plasma L-[5N2]Lysine Levels
Subject AUCO SA 10 tr th½ VTO
nmol- min/ml none min min min mil/kg
C1 5,642 0.987 7.4 23.1 253 1,756C2 3,074 0.760 8.6 13.3 195 1,902C3 2,059 0.679 14.1 26.8 183 2,372C4 4,116 0.828 12.2 19.3 211 1,668C5 3,964 0.677 7.3 13.6 154 1,032
Mean 3,771 0.786 9.9 19.2 199 1,746SD 1,329 0.128 3.0 5.8 36 482
Parameter definitions are: AUC0, area under curve (Eq. 4); SA, sys-temic availability (Eq. 5); to, time of appearance of tracer in plasma;tr, elapsed time from appearance to maximal level (Eq. 12); t4,0, termi-nal half-life (Eq. 11); VT0, final volume of dilution (Eq. 9).
Lysine and Protein Metabolism in Young Women 1327
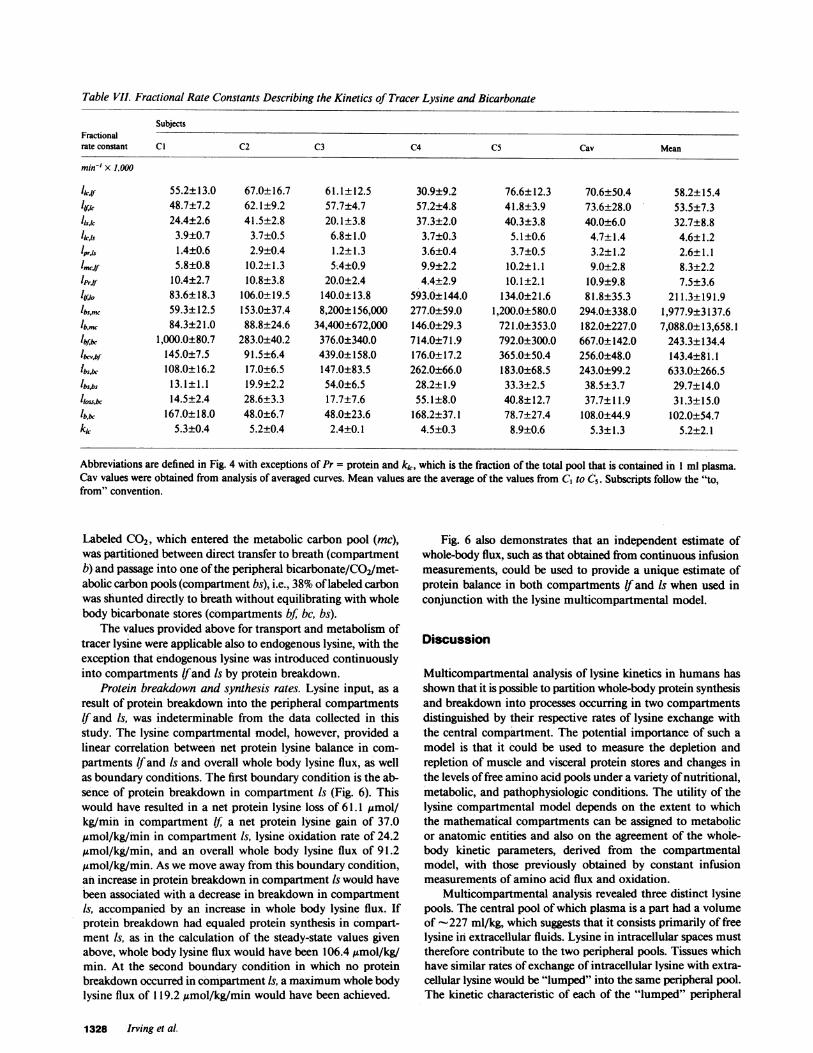
Table VII. Fractional Rate Constants Describing the Kinetics of Tracer Lysine and Bicarbonate
SubjectsFractionalrate constant Cl C2 C3 C4 C5 Cav Mean
min-' X 1,000
licaf 55.2±13.0 67.0±16.7 61.1±12.5 30.9±9.2 76.6±12.3 70.6±50.4 58.2±15.448.7±7.2 62.1±9.2 57.7±4.7 57.2±4.8 41.8±3.9 73.6±28.0 53.5±7.3
Is,l 24.4±2.6 41.5±2.8 20.1±3.8 37.3±2.0 40.3±3.8 40.0±6.0 32.7±8.8hCA5 3.9±0.7 3.7±0.5 6.8±1.0 3.7±0.3 5.1±0.6 4.7±1.4 4.6±1.2lprjs 1.4±0.6 2.9±0.4 1.2±1.3 3.6±0.4 3.7±0.5 3.2±1.2 2.6±1.1Imw 5.8±0.8 10.2±1.3 5A4±0.9 9.9±2.2 10.2±1.1 9.0±2.8 8.3±2.2
Prfto 10.4±2.7 10.8±3.8 20.0±2.4 4.4±2.9 10.1±2.1 10.9±9.8 7.5±3.6ll10o 83.6±18.3 106.0±19.5 140.0±13.8 593.0±144.0 134.0±21.6 81.8±35.3 211.3±191.91bs,mc 59.3±12.5 153.0±37.4 8,200±156,000 277.0±59.0 1,200.0±580.0 294.0±338.0 1,977.9±3137.6lbin. 84.3±21.0 88.8±24.6 34,400±672,000 146.0±29.3 721.0±353.0 182.0±227.0 7,088.0±13,658.1Ibf* 1,000.0±80.7 283.0±40.2 376.0±340.0 714.0±71.9 792.0±300.0 667.0±142.0 243.3±134.4
lb,,,bf 145.0±7.5 91.5±6.4 439.0±158.0 176.0±17.2 365.0±50.4 256.0±48.0 143.4±81.1'bs,bc 108.0±16.2 17.0±6.5 147.0±83.5 262.0±66.0 183.0±68.5 243.0±99.2 633.0±266.5'bsis 13.1±1.1 19.9±2.2 54.0±6.5 28.2±1.9 33.3±2.5 38.5±3.7 29.7±14.0
lloss,bc 14.5±2.4 28.6±3.3 17.7±7.6 55.1±8.0 40.8±12.7 37.7±11.9 31.3±15.0167.0±18.0 48.0±6.7 48.0±23.6 168.2±37.1 78.7±27.4 108.0±44.9 102.0±54.7
kk 5.3±0.4 5.2±0.4 2.4±0.1 4.5±0.3 8.9±0.6 5.3±1.3 5.2±2.1
Abbreviations are defined in Fig. 4 with exceptions of Pr = protein and kk, which is the fraction of the total pool that is contained in 1 ml plasma.Cav values were obtained from analysis of averaged curves. Mean values are the average of the values from C, to C5. Subscripts follow the "to,from" convention.
Labeled C02, which entered the metabolic carbon pool (mc),was partitioned between direct transfer to breath (compartmentb) and passage into one of the peripheral bicarbonate/CO2/met-abolic carbon pools (compartment bs), i.e., 38%of labeled carbonwas shunted directly to breath without equilibrating with wholebody bicarbonate stores (compartments bf, bc, bs).
The values provided above for transport and metabolism oftracer lysine were applicable also to endogenous lysine, with theexception that endogenous lysine was introduced continuouslyinto compartments Wand Is by protein breakdown.
Protein breakdown and synthesis rates. Lysine input, as aresult of protein breakdown into the peripheral compartmentsIf and Is, was indeterminable from the data collected in thisstudy. The lysine compartmental model, however, provided alinear correlation between net protein lysine balance in com-partments Wand is and overall whole body lysine flux, as wellas boundary conditions. The first boundary condition is the ab-sence of protein breakdown in compartment Is (Fig. 6). Thiswould have resulted in a net protein lysine loss of 61.1 gmol/kg/min in compartment If a net protein lysine gain of 37.0,jmol/kg/min in compartment Is, lysine oxidation rate of 24.2,gmol/kg/min, and an overall whole body lysine flux of 91.2,gmol/kg/min. As we move away from this boundary condition,an increase in protein breakdown in compartment Is would havebeen associated with a decrease in breakdown in compartmentIs, accompanied by an increase in whole body lysine flux. Ifprotein breakdown had equaled protein synthesis in compart-ment Is, as in the calculation of the steady-state values givenabove, whole body lysine flux would have been 106.4 ,mol/kg/min. At the second boundary condition in which no proteinbreakdown occurred in compartment Is, a maximum whole bodylysine flux of 119.2 Amol/kg/min would have been achieved.
Fig. 6 also demonstrates that an independent estimate ofwhole-body flux, such as that obtained from continuous infusionmeasurements, could be used to provide a unique estimate ofprotein balance in both compartments Wand Is when used inconjunction with the lysine multicompartmental model.
Discussion
Multicompartmental analysis of lysine kinetics in humans hasshown that it is possible to partition whole-body protein synthesisand breakdown into processes occurring in two compartmentsdistinguished by their respective rates of lysine exchange withthe central compartment. The potential importance of such amodel is that it could be used to measure the depletion andrepletion of muscle and visceral protein stores and changes inthe levels of free amino acid pools under a variety of nutritional,metabolic, and pathophysiologic conditions. The utility of thelysine compartmental model depends on the extent to whichthe mathematical compartments can be assigned to metabolicor anatomic entities and also on the agreement of the whole-body kinetic parameters, derived from the compartmentalmodel, with those previously obtained by constant infusionmeasurements of amino acid flux and oxidation.
Multicompartmental analysis revealed three distinct lysinepools. The central pool of which plasma is a part had a volumeof -227 ml/kg, which suggests that it consists primarily of freelysine in extracellular fluids. Lysine in intracellular spaces musttherefore contribute to the two peripheral pools. Tissues whichhave similar rates of exchange of intracellular lysine with extra-cellular lysine would be "lumped" into the same peripheral pool.The kinetic characteristic of each of the "lumped" peripheral
1328 Irving et al.
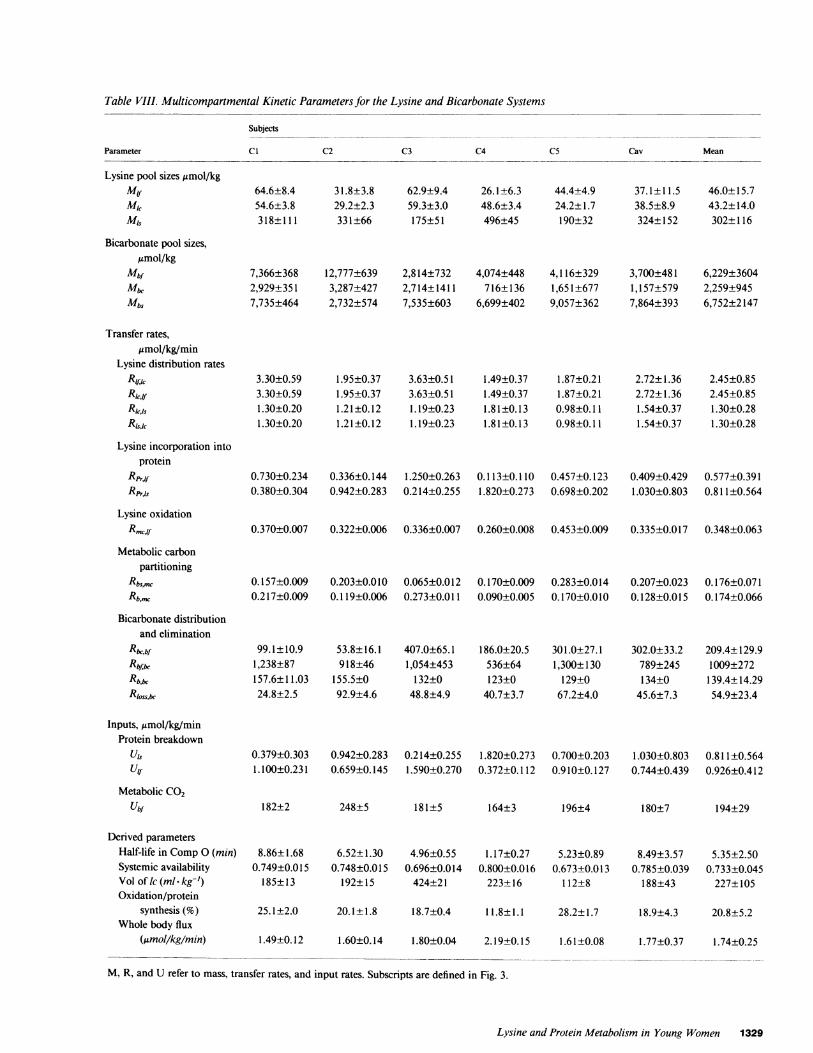
Table VIII. Multicompartmental Kinetic Parameters for the Lysine and Bicarbonate Systems
Subjects
Parameter CI C2 C3 C4 C5 Cav Mean
Lysine pool sizesgamol/kgMyml,
Bicarbonate pool sizes,,gmol/kg
Mbf
Mb&
Mbs
Transfer rates,Amol/kg/min
Lysine distribution rates
RU~kRl,1.
R~ksRlcsk
Lysine incorporation intoprotein
RprfilfRprils
Lysine oxidation
Metabolic carbonpartitioning
Rbsmc
Rb,,,
Bicarbonate distributionand elimination
RbcbfRbf,bcRb,&-Rloss,bc
Inputs, umol/kg/minProtein breakdown
U'sUyf
Metabolic CO2Ubf
64.6±8.454.6±3.8318±111
7,366±3682,929±3517,735±464
3.30±0.593.30±0.591.30±0.201.30±0.20
31.8±3.829.2±2.3331±66
12,777+6393,287±4272,732±574
1.95±0.371.95±0.371.21±0.121.21±0.12
62.9±9.459.3±3.0175±51
2,814+7322,714+14117,535±603
3.63±0.513.63±0.511.19±0.231.19±0.23
26.1±6.348.6±3.4496±45
4,074+448716±136
6,699+402
1.49±0.371.49±0.371.81±0.131.81±0.13
44.4±4.924.2± 1.7190±32
4,116±3291,651±6779,057±362
1.87±0.211.87±0.210.98±0.110.98±0.11
37.1±11.538.5±8.9324±152
3,700+4811,157±5797,864+393
2.72±1.362.72±1.361.54±0.371.54±0.37
46.0±15.743.2±14.0302±116
6,229±36042,259±9456,752±2147
2.45±0.852.45±0.851.30±0.281.30±0.28
0.730±0.234 0.336±0.144 1.250±0.263 0.113±0.110 0.457±0.123 0.409±0.429 0.577±0.3910.380±0.304 0.942±0.283 0.214±0.255 1.820±0.273 0.698±0.202 1.030±0.803 0.811±0.564
0.370±0.007 0.322±0.006 0.336±0.007 0.260±0.008 0.453±0.009 0.335±0.017 0.348±0.063
0.157±0.009 0.203±0.010 0.065±0.012 0.170±0.009 0.283±0.014 0.207±0.023 0.176±0.0710.217±0.009 0.119±0.006 0.273±0.011 0.090±0.005 0.170±0.010 0.128±0.015 0.174±0.066
99.1±10.91,238±87157.6±11.0324.8±2.5
53.8±16.1918±46
155.5±092.9±4.6
407.0±65.11,054+453
132±048.8±4.9
186.0±20.5536±64123±0
40.7±3.7
301.0±27.11,300±130
129±067.2±4.0
302.0±33.2789±245134±0
45.6±7.3
209.4±129.91009±272
139.4±14.2954.9±23.4
0.379±0.303 0.942±0.283 0.214±0.255 1.820±0.273 0.700±0.203 1.030±0.803 0.811±0.5641.100±0.231 0.659±0.145 1.590±0.270 0.372±0.112 0.910±0.127 0.744±0.439 0.926±0.412
182±2 248±5 181±5 164±3 196±4 180±7 194±29
Derived parametersHalf-life in Comp0 (min)Systemic availabilityVol of lc (ml - kg-')Oxidation/protein
synthesis (%)Whole body flux
(Mmol/kg/min)
8.86±1.680.749±0.015
185±13
25. 1±2.0
6.52±1.300.748±0.015
192±15
4.96±0.550.696±0.014
424±21
1.17±0.270.800±0.016
223± 16
5.23±0.890.673±0.013
112±8
20.1±1.8 18.7±0.4 11.8±1.1 28.2±1.7
8.49±3.570.785±0.039
188±43
5.35±2.500.733±0.045
227±105
18.9±4.3 20.8±5.2
1.49±0.12 1.60±0.14 1.80±0.04 2.19±0.15 1.61±0.08 1.77±0.37 1.74±0.25
M, R, and U refer to mass, transfer rates, and input rates. Subscripts are defined in Fig. 3.
Lysine and Protein Metabolism in Young Women 1329
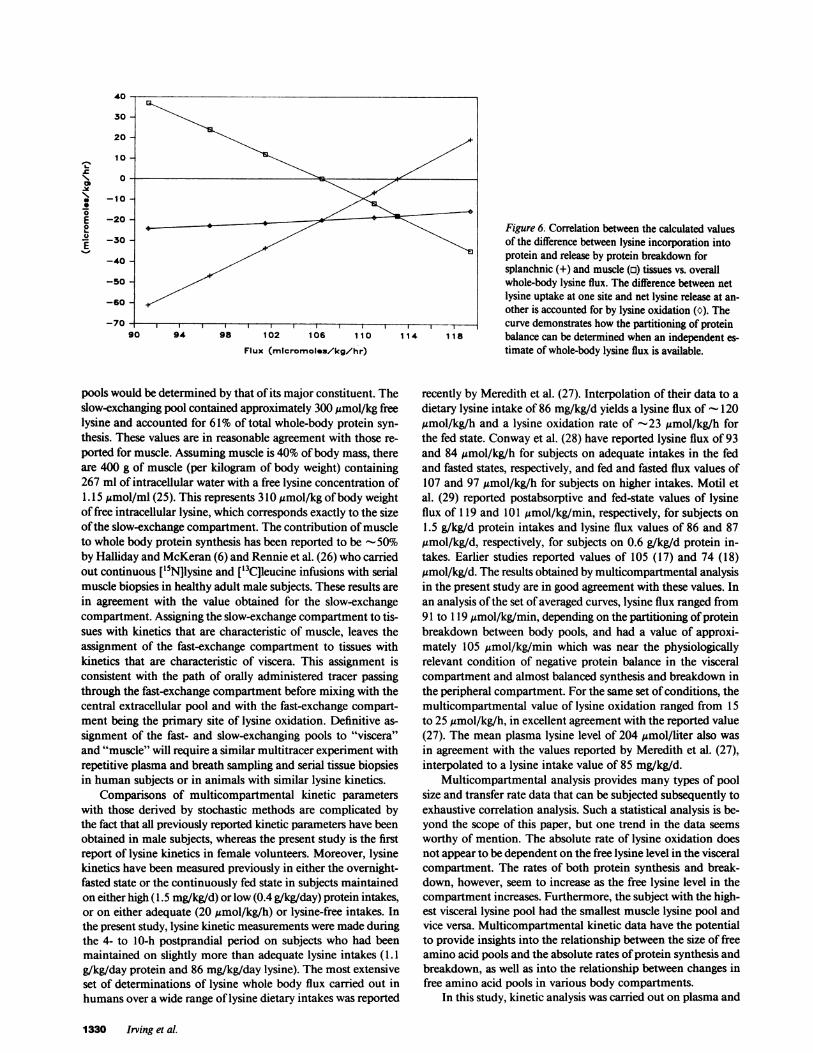
Figure 6. Correlation between the calculated values
of the difference between lysine incorporation into
protein and release by protein breakdown forsplanchnic (+) and muscle (o) tissues vs. overall
whole-body lysine flux. The difference between netlysine uptake at one site and net lysine release at an-
other is accounted for by lysine oxidation (C). The_ l~41,8 curve demonstrates how the partitioning of protein90 94 98 102 106 1 10 1 14 1 18 balance can be determined when an independent es-
Flux (mlcromoleu/kg/hr) timate of whole-body lysine flux is available.
pools would be determined by that of its major constituent. Theslow-exchanging pool contained approximately 300 ,gmol/kg freelysine and accounted for 61% of total whole-body protein syn-
thesis. These values are in reasonable agreement with those re-
ported for muscle. Assuming muscle is 40%of body mass, thereare 400 g of muscle (per kilogram of body weight) containing267 ml of intracellular water with a free lysine concentration of1.15 Mmol/ml (25). This represents 310 gmol/kg of body weightof free intracellular lysine, which corresponds exactly to the sizeof the slow-exchange compartment. The contribution of muscleto whole body protein synthesis has been reported to be -50%by Halliday and McKeran (6) and Rennie et al. (26) who carriedout continuous ['5N]lysine and [13C]leucine infusions with serialmuscle biopsies in healthy adult male subjects. These results are
in agreement with the value obtained for the slow-exchangecompartment. Assigning the slow-exchange compartment to tis-sues with kinetics that are characteristic of muscle, leaves theassignment of the fast-exchange compartment to tissues withkinetics that are characteristic of viscera. This assignment isconsistent with the path of orally administered tracer passingthrough the fast-exchange compartment before mixing with thecentral extracellular pool and with the fast-exchange compart-ment being the primary site of lysine oxidation. Definitive as-
signment of the fast- and slow-exchanging pools to "viscera"and "muscle" will require a similar multitracer experiment withrepetitive plasma and breath sampling and serial tissue biopsiesin human subjects or in animals with similar lysine kinetics.
Comparisons of multicompartmental kinetic parameterswith those derived by stochastic methods are complicated bythe fact that all previously reported kinetic parameters have beenobtained in male subjects, whereas the present study is the firstreport of lysine kinetics in female volunteers. Moreover, lysinekinetics have been measured previously in either the overnight-fasted state or the continuously fed state in subjects maintainedon either high (1.5 mg/kg/d) or low (0.4 g/kg/day) protein intakes,or on either adequate (20 ,mol/kg/h) or lysine-free intakes. Inthe present study, lysine kinetic measurements were made duringthe 4- to 10-h postprandial period on subjects who had beenmaintained on slightly more than adequate lysine intakes (1.1g/kg/day protein and 86 mg/kg/day lysine). The most extensiveset of determinations of lysine whole body flux carried out inhumans over a wide range of lysine dietary intakes was reported
recently by Meredith et al. (27). Interpolation of their data to a
dietary lysine intake of 86 mg/kg/d yields a lysine flux of - 120,gmol/kg/h and a lysine oxidation rate of -23 ,umol/kg/h forthe fed state. Conway et al. (28) have reported lysine flux of 93and 84 ,umol/kg/h for subjects on adequate intakes in the fedand fasted states, respectively, and fed and fasted flux values of107 and 97 gmol/kg/h for subjects on higher intakes. Motil etal. (29) reported postabsorptive and fed-state values of lysineflux of 1 19 and 101 gmol/kg/min, respectively, for subjects on
1.5 g/kg/d protein intakes and lysine flux values of 86 and 87,gmol/kg/d, respectively, for subjects on 0.6 g/kg/d protein in-takes. Earlier studies reported values of 105 (17) and 74 (18),gmol/kg/d. The results obtained by multicompartmental analysisin the present study are in good agreement with these values. Inan analysis of the set of averaged curves, lysine flux ranged from
91 to 1 19 Atmol/kg/min, depending on the partitioning of proteinbreakdown between body pools, and had a value of approxi-mately 105 gmol/kg/min which was near the physiologicallyrelevant condition of negative protein balance in the visceralcompartment and almost balanced synthesis and breakdown inthe peripheral compartment. For the same set of conditions, themulticompartmental value of lysine oxidation ranged from 15to 25 ,umol/kg/h, in excellent agreement with the reported value(27). The mean plasma lysine level of 204 Amol/liter also was
in agreement with the values reported by Meredith et al. (27),interpolated to a lysine intake value of 85 mg/kg/d.
Multicompartmental analysis provides many types of poolsize and transfer rate data that can be subjected subsequently toexhaustive correlation analysis. Such a statistical analysis is be-yond the scope of this paper, but one trend in the data seems
worthy of mention. The absolute rate of lysine oxidation doesnot appear to be dependent on the free lysine level in the visceralcompartment. The rates of both protein synthesis and break-down, however, seem to increase as the free lysine level in thecompartment increases. Furthermore, the subject with the high-est visceral lysine pool had the smallest muscle lysine pool andvice versa. Multicompartmental kinetic data have the potentialto provide insights into the relationship between the size of freeamino acid pools and the absolute rates of protein synthesis andbreakdown, as well as into the relationship between changes infree amino acid pools in various body compartments.
In this study, kinetic analysis was carried out on plasma and
1330 Irving et al.
o
EU
E
breath tracer levels achieved after the input bolus of tracer lysines.During the multicompartmental analysis of these data, a greatpotential synergy between bolus input and continuous infusionkinetic data became apparent. The exact partitioning of proteinsynthesis and breakdown between visceral and muscle com-partments was indeterminable when only bolus input data wereanalyzed. Simulation calculations, however, indicated that whenan independent estimate of whole-body lysine flux, such as thatobtained from the primed constant-infusion method (30), wascombined with the bolus input-response data, the partitioningof protein synthesis and breakdown between visceral and musclecompartments could be fixed. From future studies that utilizeprimed constant infusion and bolus i.v. injections of variousforms of stable isotope-labeled lysine, it should be possible todetermine whether the lysine multicompartment kinetic modelcorrectly predicts the expected changes in protein balance in theviscera and muscle on going from the fasted to the fed state.
Acknowledgments
Weare indebted to Tina McClellan, Becky Hethcock, and Kim Evansfor nursing support, to E. R. Klein for editorial supervision of this manu-script, and to Sheri Wahl and Sandy Perez for manuscript preparation.
This work was supported by the U. S. Department of Agriculture/Agricultural Research Service Children's Nutrition Research Center, theDepartment of Pediatrics, Baylor College of Medicine, Texas Children'sHospital, and by grant AM-28 129 from the National Institutes of Health.
References
1. Young, V. R., R. D. Yang, C. Meredith, D. E. Matthews, andD. M. Bier. 1983. Modulation of amino acid metabolism by protein andenergy intakes. In Amino Acids Metabolism and Medical Application.G. L. Blackburn, J. P. Grant, and V. R. Young, editors. John WrightPSG, Inc., Littleton, MA. 13-28.
2. Waterlow, J. C., P. J. Garlick, and D. J. Millward. 1978. ProteinTurnover in Mammalian Tissues and in the Whole Body. North-HollandPublishing Company, Amsterdam.
3. Garlick, P. J., D. J. Millward, and W. P. T. James. 1973. Diurnalresponse of muscle and liver protein synthesis in vivo in meal-fed rats.Biochem. J. 136:935-945.
4. Garlick, P. J., M. A. Nurland, and V. R. Preedy. 1980. A rapidand convenient method for measuring the rate of protein synthesis intissues by injection of [3HJ-phenylalanine. Biochem. J. 192:719-723.
5. Elwyn, D. H., H. C. Parikh, and W. C. Shoemaker. 1968. Aminoacid movements between gut, liver and periphery in unanesthetized dogs.Am. J. Physiol. 226:1428-1433.
6. Halliday, D., and R. 0. McKeran. 1975. Measurement of muscleprotein synthetic rate from serial muscle biopsies and total protein turn-over in man by continuous intravenous infusion of L-[a-`5N]lysine. Clin.Sci. Mol. Med. 49:581-590.
7. Aoki, T. T., M. F. Brennan, W. A. Muller, J. S. Soeldner, J. S.Alpert, S. B. Saltz, R. L. Kaufmann, M. H. Tan, and G. F. Cahill. 1976.Amino acid levels across normal forearm muscle and splanchnic bedafter a protein meal. Am. J. Clin. Nutr. 29:340-350.
8. Wahren, J., P. Felig, and L. Hagenfeldt. 1976. Effect of proteiningestion on splanchnic and leg metabolism in normal man and in pa-tients with diabetes mellitus. J. Clin. Invest. 57:987-999.
9. Matthews, D. E., K. J. Motil, D. K. Rohrbaugh, J. F. Burke,V. R. Young, and D. M. Bier. 1980. Measurement of leucine metabolismin man from a primed, continuous infusion of L-[l-_3C]leucine. Am. J.Physiol. 238(Endocrinol. Metab. I):E473-E479.
10. Irving, C. S., C. L. Cooney, L. T. Brown, D. Gold, J. Gordon,
and P. D. Klein. 1983. Microbial fermentative preparation of L-di-'5Nlysine and its application to serum amino acid kinetic studies. Anal.Biochem. 131:93-98.
11. Klein, P. D. 1982. Clinical applications of "3C02 measurements.Fed. Proc. 41:84-87.
12. The National Research Council. 1980. Recommended DietaryAllowances. National Academy of Sciences, Washington, D. C.
13. Irving, C. S., W. W. Wong, R. J. Shulman, E. 0. Smith, andP. D. Klein. 1983. "3C bicarbinate kinetics in man: intra vs interindividualdifferences. Am. J. Physiol. 245:R190-202.
14. Schoeller, D. A., and P. D. Klein. 1979. A microprocessor con-trolled mass spectrometer for the fully automated purification and isotopicanalysis of breath CO2. Biomed. Mass Spectrom. 6:350-355.
15. Hachey, D. L., J.-C. Blais, and P. D. Klein. 1980. High precisionisotopic ratio of analysis of volatile metal chelates. Anal. Chem. 52:1131-1135.
16. Irving, C. S., D. A. Schoeller, K.-I. Nakamura, A. L. Baker, andP. D. Klein. 1982. The aminopyrine breath test as a measure of liverfunction: a quantitative description of its metabolic basis in normal sub-jects. J. Lab. Clin. Med. 100:356-373.
17. Segal, G. B., W. Simon, and M. A. Lichtman. 1983. A multi-component analysis of amino acid transport systems in human lym-phocytes. 1. Kinetic parameters of the A and L systems and pathwaysof uptake of naturally occurring amino acids in blood lymphocytes. J.Cell. Physiol. 116:372-378.
18. Elwyn, D. 1970. The role of liver in regulation of amino acidand protein metabolism. In Mammalian Protein Metabolism. Vol. 4.H. Munro, ed. Academic Press, Inc., NewYork. 523-556.
19. DiStefano, J. J. III, and E. M. Landaw. 1984. Multiexponential,multicompartmental, and noncompartmental modeling. I. Method-ological limitations and physiological interpretations. Am. J. Physiol.246(Regul. Integrat. Comp. Physiol. 15):R65 1-R664.
20. Aub, M. B., and J. C. Waterlow. 1970. Analysis of a five com-partment system with continuous infusion and its application to thestudy of amino acid turnover. J. Theor. Biol. 26:243-250.
21. Cobelli, C., A. Pepschy, and G. R. Jacur. 1980. Identifiability intracer experiments. Fed. Proc. 39:91-96.
22. Cobelli, C., and J. J. DiStefano, III. 1980. Parameter and structuralidentifiability concepts and ambiguities: a critical review and analysis.Am. J. Physiol. 239(Regul. Integrat. Comp. Physiol. 8):R7-R24.
23. Yang, R. D., C. S. Irving, W. W. Wong, J. H. Hoffer, V. R.Young, and P. D. Klein. 1983. The effect of diet and meal ingestion onwhole body "3C-bicarbonate kinetics in young men. Fed. Proc. 42:825.(Abstr.)
24. Berman, M., and M. F. Weiss. 1978. SAAMManual, U. S. DHEWPub. No. (NIH) 78-180.
25. Vinnar, E., J. Bergstom, and P. Furst. 1976. Influence of thepostoperative state on the intracellular free amino acids in human muscletissue. Ann. Surg. 182:665-671.
26. Rennie, M. J., R. H. T. Edwards, D. Halliday, D. E. Matthews,S. L. Wolman, and D. J. Millward. 1982. Muscle protein synthesis mea-sured by stable isotope techniques in man: the effects of feeding andfasting. Clin. Sci. (Lond.). 63:519-523.
27. Meredith, C. N., Z-M Wen, D. M. Bier, D. Matthews, and V. R.Young. 1985. Whole body lysine metabolism in young men at gradedlevels of dietary lysine. Am. J. Clin. Nutr. In press.
28. Conway, J. C., D. M. Bier, K. J. Motil, J. F. Burke, and V. R.Young. 1980. Whole body lysine flux in young adult men: effects ofreduced total protein and of lysine intake. Am. J. Physiol. 239(Endocrinol.Metab. 2):E192-E200.
29. Motil, K. J., D. E. Matthews, D. M. Bier, J. F. Burke, H. N.Munro, and V. R. Young. 1981. Whole body leucine and lysine metab-olism: response to dietary protein intake in young men. Am. J. Physiol.240(Endrocrinol. Metab. 2):E712-721.
30. Waterlow, J. C. 1967. Lysine turnover in man measured by in-travenous infusion of L-[U-`4C1lysine. Clin. Sci. (Oxf). 33:507-515.
Lysine and Protein Metabolism in Young Women 1331