Embed Size (px)
Citation preview

Lynch, Ailsa S. (2014) Base-metal catalysis for the hydrogenation of acetic acid. PhD thesis. http://theses.gla.ac.uk/5162/
Copyright and moral rights for this work are retained by the author
A copy can be downloaded for personal non-commercial research or study, without prior permission or charge
This work cannot be reproduced or quoted extensively from without first obtaining permission in writing from the author
The content must not be changed in any way or sold commercially in any format or medium without the formal permission of the author
When referring to this work, full bibliographic details including the author, title, awarding institution and date of the thesis must be given
Enlighten:Theses http://theses.gla.ac.uk/

Base – Metal Catalysis for the Hydrogenation of Acetic
Acid
Ailsa S. Lynch
A Thesis Presented to the University of Glasgow for the Degree of Doctor of Philosophy

2
Abstract
Increasing global ethanol consumption has revived research into a variety of
route for the synthesis of ethanol. One such route is via the hydrogenation of
acetic acid, for which a catalyst with significant acid tolerance is required. The
objective of finding an active, acid tolerant base metal catalyst was central to
this project.
In this study, a commercial methanol synthesis catalyst was initially investigated
for its viability as an acid hydrogenation catalyst, following the production of
ethanol when acetic acid was passed over it in a different study [1]. The
methanol synthesis catalyst was not a viable option due to deactivation, but the
use of a copper based system was shown to be active, in line with other studies
[2].
Copper based catalysts were tested in both integral and differential reactor
systems. The copper catalysts, with metal loadings of 5 wt.% and 10 wt.%,
showed some activity towards the production of ethanol, but not in comparable
quantities to those observed with the high copper content methanol synthesis
catalyst.
The effect of higher acetic acid concentrations, up to 20 mol.%, within an
atmospheric fixed bed system were investigated, and showed that copper based
catalysts were physically compromised by the presence of acetic acid.
Deactivation and degradation of this catalyst upon exposure to acetic acid,
especially at higher concentrations, meant that it was not appropriate for this
process.
The propensity of the copper catalysts to degrade in the presence of acetic acid
led to other base metal systems being investigated, in the form of nickel and
cobalt catalysts. All three base metal systems were investigated within a
differential reactor to show direct comparisons of each catalyst at 10 wt.% and
20 wt.% metal loadings. This research showed that cobalt based systems were
the most active of the metals tested at the two separate loadings.

3
A study into the effect of the catalyst support using an 10 wt.% cobalt loading,
on a range of supports, showed that alumina was the superior support for the
selective hydrogenation of acetic acid to ethanol. The other supports
investigated were silica, titania and zinc oxide.
Comprehensive testing of the catalysts prepared with cobalt, copper and nickel,
identified that the 20 wt.% cobalt on alumina was the most stable, in terms of
activity and catalyst integrity, and active catalyst of those investigated at an
optimal reaction temperature of 250 ⁰C.
4
Table of Contents
List of Tables ................................................................................ 7
List of Figures ............................................................................... 9
Acknowledgements ........................................................................ 12
Author’s Declaration ...................................................................... 13
Abbreviations .............................................................................. 14
1 Introduction ........................................................................... 15
1.1 Ethanol ............................................................................ 15
1.1.1 Fermentation ................................................................ 17
1.1.2 Synthesis ..................................................................... 18
1.2 Acetic Acid Hydrogenation ..................................................... 18
1.3 Acetic Acid Production .......................................................... 23
1.4 Catalysts .......................................................................... 23
1.4.1 Precious Metal Catalysts ................................................... 23
1.4.2 Base-Metal Catalysts ....................................................... 24
1.4.3 Supports ...................................................................... 25
1.5 Catalyst Deactivation ........................................................... 26
1.6 Project Background ............................................................. 27
1.7 Project Aims ...................................................................... 28
2 Experimental ......................................................................... 30
2.1 Catalyst Preparation ............................................................ 30
2.1.1 Supports ...................................................................... 30
2.1.2 Preparation Procedures .................................................... 30
2.1.3 Commercial Catalysts ...................................................... 36
2.2 Catalyst Characterisation ...................................................... 37
2.2.1 Surface Area Determination .............................................. 37
2.2.2 Thermogravimetric Analysis ............................................... 39
2.2.3 Powder X-Ray Diffraction .................................................. 39
2.2.4 Microanalysis (CHN) ........................................................ 40
2.2.5 Nuclear Magnetic Resonance Spectroscopy ............................. 40
2.3 Catalyst Testing .................................................................. 40
2.3.1 Berty Reactor ............................................................... 40
2.3.2 Low Pressure Microreactor ................................................ 44
2.3.3 HRTC Atmospheric Fixed Bed Reactor ................................... 48
2.3.4 Materials ..................................................................... 54
3 Results and Discussion ............................................................... 56
3.1 Copper Catalysts ................................................................. 56

5
3.1.1 Methanol Synthesis Catalyst .............................................. 56
3.1.2 Impregnated Copper Catalysts ............................................ 65
3.1.3 Catalytic Testing: BERTY reactor ........................................ 78
3.1.4 10 wt.% Copper Catalyst ................................................... 90
3.1.5 Catalyst Testing: Low pressure microreactor .......................... 90
3.1.6 Copper Chromite catalysts ............................................... 101
3.1.7 Summary .................................................................... 102
3.2 High Acetic Acid Concentration Reactions .................................. 104
3.2.1 Reduction Conditions ..................................................... 104
3.2.2 Reactions ................................................................... 105
3.2.3 Liquid Samples ............................................................. 105
3.2.4 Gas Samples ................................................................ 112
3.2.5 ICP-MS Results .............................................................. 114
3.2.6 Post reaction characterisation: MeOHSC ............................... 119
3.2.7 Post-reaction characterisation .......................................... 122
3.2.8 Conclusions ................................................................. 125
3.3 Alternative Base Metal Catalysts ............................................. 127
3.3.1 10 wt.% Nickel catalyst ................................................... 127
3.3.2 10 wt.% Cobalt catalyst ................................................... 129
3.3.3 Comparing 10 wt.% catalysts ............................................. 130
3.3.4 Conclusions ................................................................. 133
3.4 20 wt.% Metal Catalysts ....................................................... 135
3.4.1 Alumina SA6X75 ............................................................ 135
3.4.2 20 wt.% Nickel Catalyst ................................................... 136
3.4.3 20 wt.% Cobalt Catalyst .................................................. 138
3.4.4 20 wt.% Copper Catalyst .................................................. 139
3.4.5 Comparing 20 wt.% catalysts ............................................. 139
3.4.6 Bimetallic catalysts ....................................................... 143
3.4.7 Conclusions ................................................................. 145
3.5 Optimisation Studies ........................................................... 148
3.5.1 Temperature Dependence ................................................ 148
3.5.2 Sintering .................................................................... 160
3.5.3 Bed Profiling ................................................................ 164
3.5.4 Effect of Support Study ................................................... 165
3.5.5 Supports ..................................................................... 166
3.5.6 Comparison of 10 wt.% cobalt catalysts ................................ 167
3.5.7 Post-reaction characterisation .......................................... 172
3.5.8 Summary .................................................................... 181
4 Conclusions .......................................................................... 183

6
References ................................................................................. 186

7
List of Tables
Table 2-1: Support pore volume values used for impregnated catalyst preparation ................................................................................. 31
Table 2-2: Impregnated catalysts prepared ........................................... 32
Table 2-3: Mono- and bi-metallic precipitation catalysts prepared ............... 34
Table 2-4: Mono-metallic and bi-metallic precipitation catalysts prepared ...... 36
Table 2-5: Composition of typical Methanol Synthesis Catalyst [44] .............. 37
Table 2-6: Percentage of components in Sud-Chemie copper chromite .......... 37
Table 2-7: Standard reduction parameters for glassline reactions ................. 46
Table 2-8: Standard reaction conditions for Glassline reactions ................... 46
Table 2-9: Standard reduction conditions for HRTC atmospheric fixed bed reactions .................................................................................... 51
Table 2-10: Standard reaction conditions for Hull Glassware reactions ........... 52
Table 2-11: Gases used for the reactions, calibrations and characterisation techniques .................................................................................. 54
Table 2-12: Reactants and products used for reactions and GC calibrations ..... 54
Table 2-13: Materials used for the preparation of catalysts and the supplied catalyst supports used .................................................................... 55
Table 2-14: Commercially available catalysts used within the project ........... 55
Table 3-1: BET analysis of commercial methanol synthesis catalyst .............. 57
Table 3-2: Conditions for the reduction of methanol synthesis catalyst .......... 60
Table 3-3: Reaction conditions for MeOHSC tested in BERTY reactor (B1) ....... 60
Table 3-4: Conversion and selectivities from reaction B1 ........................... 61
Table 3-5: BET data for comparison of pre- and post- reaction samples ......... 64
Table 3-6: Silica Q10 BET data .......................................................... 66
Table 3-7: Reduction conditions for CuAQ10c and CuNQ10c ........................ 73
Table 3-8:Standard reaction conditions for testing in the BERTY reactor ........ 78
Table 3-9: Selectivities and conversions of the 5 wt.% Cu catalysts ............... 80
Table 3-10: Selectivities .................................................................. 85
Table 3-11: Selectivities for CuNQ10rB9 (CuNQ10 at 30 barg) ...................... 88
Table 3-12:Standard reaction conditions for microreactor reactions with copper catalysts .................................................................................... 92
Table 3-13: Selectivities and conversions of copper catalysts in low pressure microreactor ............................................................................... 92
Table 3-14: BET data of copper catalyst, pre and post reaction ................... 97
Table 3-15: Conversion and selectivities of 10 wt.% copper on silica catalyst ... 99
Table 3-16: BET analysis of pre- and post-reaction 10 wt.% copper catalyst .... 100
Table 3-17: Copper catalysts conversions and selectivities ........................ 102
Table 3-18: Universal reduction conditions for all copper catalyst in the low pressure fixed bed reactor .............................................................. 105
Table 3-19: Reaction conditions for all materials tested in low pressure HRTC reactor ..................................................................................... 105
Table 3-20: GC analysis high level results (% m/m) ................................. 106
Table 3-21: GC analysis low level results (ppm m/m) .............................. 107
Table 3-22: Numerical comparison of the ethanol production values between the methanol synthesis catalyst reactions ................................................. 111
Table 3-23: Gas sample GC results ..................................................... 113
Table 3-24: ICP-MS values ............................................................... 114
Table 3-25: BET data for post reaction samples from HRTC ....................... 123
Table 3-26: Reaction data for 10 wt.% catalysts ..................................... 131
Table 3-27: BET data for Alumina SA6X75 ............................................ 136

8
Table 3-28: Conversions and selectivities for bimetallic catalysts ................ 144
Table 3-29: Conversions and selectivities of the most active catalysts .......... 147
Table 3-30: Selectivities on day averages at end and start of reaction .......... 150
Table 3-31: BET data for 20CoSA6X75c tested at a range of temperatures ..... 154
Table 3-32: BET data of post-reaction 20CoSA6X75, reactions at varying temperatures .............................................................................. 159
Table 3-33: HS XRD particle sizes for CuNQ10 ....................................... 161
Table 3-34: HS XRD particle sizes for 10 wt.% Ni on silica catalyst ............... 162
Table 3-35: 10 wt.% cobalt catalysts with different supports ..................... 166
Table 3-36: Reduction conditions for cobalt based catalysts in catalyst support study ....................................................................................... 167
Table 3-37: Table of reaction conditions for 10 wt.% cobalt catalysts ........... 168
Table 3-38: Table of results for each 10 wt.% Co catalyst on days one and four .............................................................................................. 169
Table 3-39: BET results pre- and post-reaction for 10 wt.% Co on alumina SA6X75 .............................................................................................. 173
Table 3-40: BET results pre- and post-reaction for 10 wt.% Co on silica Q10 ... 175
Table 3-41: BET results for pre- and post-reaction 10 wt.% Co on titania ST61120 catalyst .................................................................................... 177
Table 3-42: BET results for pre-and post-reactions for 10 wt.% Co on ZnO ...... 180

9
List of Figures
Figure 1-1: Global ethanol production by type [7] ................................... 16
Figure 1-2: Global ethanol production by country or region [4] .................... 16
Figure 1-3: Possible routes from Syn-Gas to ethanol ................................. 20
Figure 2-1 Schematic of BERTY reactor system ....................................... 41
Figure 2-2: Method from BERTY GC ..................................................... 43
Figure 2-3: GC Calibration graph ........................................................ 43
Figure 2-4: Schematic of low pressure microreactor system ........................ 45
Figure 2-5: Schematic of HRTC glass atmospheric fixed bed reactor system ..... 50
Figure 2-6: Photo of HRTC atmospheric fixed bed reactor (when loaded) (40 mm diameter, 1 m length quartz tube) ..................................................... 51
Figure 3-1: XRD pattern of commercial methanol synthesis catalyst .............. 57
Figure 3-2: TPR of commercial methanol synthesis catalyst ........................ 58
Figure 3-3: MS Summary for Methanol Synthesis catalyst TPR ...................... 59
Figure 3-4: Reaction profile of B1....................................................... 61
Figure 3-5: TPO of post-reaction MeOHSCrB1 ......................................... 62
Figure 3-6: MS (44) for methanol synthesis catalyst post-reaction B1 ............. 63
Figure 3-7: XRD pattern and assignment for post-reaction MeOHSCrB1 ........... 64
Figure 3-8: XRD pattern of uncalcined silica Q10 ..................................... 66
Figure 3-9: TPR profile of silica Q10 .................................................... 67
Figure 3-10: TGA profile of uncalcined CuAQ10 ...................................... 68
Figure 3-11: TGA-MS profile of uncalcined CuAQ10 .................................. 69
Figure 3-12: TGA profile of uncalcined CuNQ10 ...................................... 70
Figure 3-13: TGA-MS profile of uncalcined CuNQ10 .................................. 71
Figure 3-14: TPR profile of calcined CuAQ10 .......................................... 72
Figure 3-15: TPR of calcined CuNQ10 .................................................. 73
Figure 3-16: XRD pattern of uncalcined and calcined CuNQ10 ..................... 74
Figure 3-17: Hot-Stage XRD patterns of CuNQ10c at 25⁰C, 100⁰C, 200⁰C, 300⁰C and 400⁰C ................................................................................... 75
Figure 3-18: XRD patterns of uncalcined and calcined CuAQ10 samples .......... 76
Figure 3-19: Hot-stage XRD patterns of CuAQ10c at 25 ⁰C, 100 ⁰C, 200 ⁰C, 300 ⁰C and 400 ⁰C .................................................................................. 77
Figure 3-20: Copper reduction routes ................................................. 77
Figure 3-21: Reaction profile for CuNQ10 BERTY reaction .......................... 79
Figure 3-22: Reaction profile for CuNQ10 BERTY reaction, normalised to nitrogen feed marker ................................................................................ 79
Figure 3-23: TPO analysis of post reaction CuNQ10 .................................. 81
Figure 3-24: XRD pattern of post-reaction CuNQ10 .................................. 82
Figure 3-25: TPO analysis of post-reaction CuAQ10 .................................. 83
Figure 3-26: XRD pattern of post-reaction CuAQ10 ................................... 83
Figure 3-27: Reaction profile for CuNQ10 with n-octane (B6) ...................... 84
Figure 3-28: TPO analysis of post-reaction CuAQ10 .................................. 86
Figure 3-29: XRD analysis of post-reaction CuAQ10 .................................. 87
Figure 3-30: Reaction profile for CuNQ10 at 30 barg. ............................... 88
Figure 3-31: TPO analysis of CuNQ10 (reaction at 30barg) .......................... 89
Figure 3-32: TPO profile of post-reaction silica Q10 ................................. 94
Figure 3-33: MS data for Q10rG4 ........................................................ 94
Figure 3-34: TPO profile of CuN2Q10rG2 ............................................... 95
Figure 3-35: MS data of CuN2Q10rG2 ................................................... 96
Figure 3-36: XRD pattern of CuN2Q10rG2 .............................................. 96
Figure 3-37: TPO profile of MeOHSCrG5 ................................................ 98

10
Figure 3-38: XRD pattern of MeOHSCrG5 ............................................... 99
Figure 3-39: XRD pattern for 10 wt.% copper on silica catalyst ................... 100
Figure 3-40: GC analysis results for all materials tested and acetic acid reference .............................................................................................. 108
Figure 3-41: GC analysis results for supports and lab prepped copper catalysts 109
Figure 3-42: Liquid sample data for two methanol synthesis catalyst reactions 110
Figure 3-43: All ICP-MS data (ppb) above the standard <25 ppb threshold for all elements analysed. ....................................................................... 115
Figure 3-44: ICP-MS data (ppb)(zinc removed) ....................................... 116
Figure 3-45: ICP-MS data for expected elemental contributions from the catalysts .............................................................................................. 117
Figure 3-46: ICP-MS for Al, Cu and Mg contributions ................................ 118
Figure 3-47: ICP-MS data for aluminium and copper ................................ 119
Figure 3-48: Photograph of cooled inverted HRTC glass reactor tube (40 mm diameter, 1 m length quartz tube) .................................................... 120
Figure 3-49: XRD patter of zinc acetate hydrate sample ........................... 122
Figure 3-50: XRD pattern of post-reaction CuN(10)Q10 ............................. 124
Figure 3-51: XRD pattern of post-reaction methanol synthesis catalyst ......... 124
Figure 3-52: TPR analysis of 10 wt.% nickel on silica catalyst ..................... 128
Figure 3-53: XRD patterns of 10 wt.% nickel on silica catalysts ................... 128
Figure 3-54: XRD analysis of uncalcined and calcined 10 wt.% cobalt on silica catalyst .................................................................................... 129
Figure 3-55: Rates of ethanol production for 10 wt.% catalysts ................... 130
Figure 3-56: XRD patterns for pre and post reaction 10 wt.% nickel on silica catalyst .................................................................................... 132
Figure 3-57: XRD patterns of calcined and post-reaction 10 wt.% cobalt on silica133
Figure 3-58: XRD pattern of SA6X75 alumina ......................................... 136
Figure 3-59: HS XRD patterns for 20 wt.% Ni catalyst ............................... 137
Figure 3-60: TPR profile of 20NiSA6X75c .............................................. 137
Figure 3-61: TPR analysis of 20 wt.% Co catalyst .................................... 138
Figure 3-62: Rates of ethanol production for 20 wt.% catalysts ................... 139
Figure 3-63: XRD patterns of calcined and post reaction 20CuSA6X75 ........... 140
Figure 3-64: XRD patterns for post reaction 20 wt.% alumina catalysts ......... 141
Figure 3-65: TPO analysis of 20 wt.% Co catalyst .................................... 142
Figure 3-66: TPO analysis of 20 wt.% Cu catalyst .................................... 142
Figure 3-67: TPO analysis of 20 wt.% Ni catalyst .................................... 143
Figure 3-68: Rates of ethanol production for bimetallic catalysts ................ 144
Figure 3-69: Lines of best fit for all 20 wt.% mono and bimetallic catalysts ... 145
Figure 3-70: Best of each category for rates of ethanol production .............. 146
Figure 3-71: Best fits for temperature study for rates of ethanol production... 149
Figure 3-72: MS data for day one of 20CoSA6X75c 250 ⁰C reaction ............... 151
Figure 3-73: MS data for day one of 20CoSA6X75c 300 ⁰C reaction ............... 151
Figure 3-74: MS data for day four of 20CoSA6X75c 300 ⁰C reaction ............... 152
Figure 3-75: XRD patterns of the various temperature samples post-reaction .. 153
Figure 3-76: TPO data of post-reaction 20CoSA6X75 for 250 and 300 ⁰C reactions .............................................................................................. 154
Figure 3-77: MS data of post-reaction 20CoSA6X75 for 250 and 300 ⁰C reactions .............................................................................................. 155
Figure 3-78: MS data of 20CoSA6X75 reaction at 300 ⁰C ............................ 156
Figure 3-79: XRD patterns of post-reaction 20CoSA6X75, reactions at varying temperatures .............................................................................. 157
Figure 3-80: TPO profile of post 300 ⁰C reaction 20CoSA6X75 ..................... 158

11
Figure 3-81: HS XRD patterns for CuNQ10c ........................................... 161
Figure 3-82: HS XRD patterns for 10 wt.% Ni on silica catalyst .................... 162
Figure 3-83: Hot-Stage XRD patterns for 20CuSA6X75 .............................. 163
Figure 3-84: Bed profile relating bed depth to conversion to ethanol using 20CoSA6X75 catalyst ..................................................................... 164
Figure 3-85: Bed profile summary using 20CoSA6X75 ............................... 165
Figure 3-86: Trend lines for the rates of ethanol production for 10 wt.% cobalt catalysts ................................................................................... 168
Figure 3-87: Day one of reaction MS data for CoA(10)Q10c ........................ 170
Figure 3-88: Day one of reaction MS data for CoN(10)SA6X75c .................... 170
Figure 3-89: Day one of reaction MS data for CoN(10)ST61120c .................. 171
Figure 3-90: Day one of reaction MS data for CoZnO ................................ 171
Figure 3-91: TPO of post-reaction 10 wt.% Co on SA6X75 .......................... 172
Figure 3-92: TPO-MS of post-reaction 10 wt.% Co on SA6X75 ...................... 173
Figure 3-93: XRD patterns of calcined and post-reaction 10 wt.%Co on silica catalyst samples .......................................................................... 174
igure 3-94: XRD patterns of 10 wt.% Co on titania; calcined and post-reaction 175
Figure 3-95: TPO for post-reaction 10 wt.% Co on ST61120 ........................ 176
Figure 3-96: TPO-MS for post-reaction 10 wt.% Co on ST61120 .................... 177
Figure 3-97: XRD patterns for 10% Co on Zinc Oxide; calcined and post-reaction .............................................................................................. 178
Figure 3-98: TPO of post-reaction 10% Co on ZnO ................................... 179
Figure 3-99: TPO-MS of post-reaction 10 wt.% Co on ZnO .......................... 179

12
Acknowledgements
My thanks go to Professor S. David Jackson for the PhD opportunity to begin with
and his unwavering help, guidance and patience throughout the project.
I would also like to thank my industrial supervisor, Dr. Jon Deeley, for the effort
he put into this project, our helpful discussions and for organising for me to visit
and complete some of my research at the BP Research Centre in Hull.
There are a few people within the University of Glasgow without whom this
research would not have been possible; Ron Spence, Andy Monaghan, Jim
Gallagher and Jim Bannon. I thank them for their help, expertise and for always
making time to show me the way to fix things.
This PhD thesis is not just the product of four years of my life but is also the
support and guidance offered to me by my friends and family, especially my
parents and Scott. For that, I will be ever grateful.

13
Author’s Declaration
This work contained in this thesis, submitted for the degree of Doctor of
Philosophy, is my own work except where due reference is made to other
authors. No material within this thesis has been previously submitted for a
degree at this or any other university.
Ailsa S. Lynch

14
Abbreviations
Av. Average BERTY Stationary Basket Catalytic Testing Reactor produced by
Autoclave Engineers BET Brunauer, Emmett and Teller theory CHN Carbon,Hydrogen and Nitrogen Content, determined by
microanalysis DSC Differential Scanning Calorimetry ESS European Spectroscopy Systems (MS manufacturer) GC Gas Chromatography GHSV Gas Hour Space Velocity FID Flame Ionisation Detector HPLC High Pressure Liquid Chromatography HRTC Hull Research and Technology Centre ICDD International Centre for Diffraction Data ICP-MS Inductively Coupled Plasma – Mass Spectrometry ICP-OES Inductively Coupled Plasma – Optical Emission Spectroscopy MFCs Mass Flow Controllers m/m % Mass/Mass % MS Mass Spectrometry m/z Mass/Charge Ratio NMR Nuclear Magnetic Resonance Spectroscopy TCD Thermal Conductivity Detector TGA Thermo-Gravimetric Analysis TPO Temperature Programmed Oxidation TPR Temperature Programmed Reduction v/v % Volume/Volume % XRD X-Ray Diffraction (HS XRD – Hot- Stage X-Ray Diffraction)

15
1 Introduction
“The reduction of carboxylic acid and their derivatives to alcohols, diols, and
lactones under high pressure is of considerable commercial importance” [3] and
has long been recognised as such. There are a range of chemicals that can be
produced from the reduction of carboxylic acids, and the production of ethanol
from acetic acid is one such commercially important process.
1.1 Ethanol
Ethanol is a primary alcohol, with a chemical formula of CH3CH2OH, which can
be produced via traditional fermentation methods or synthetic routes. The
traditional route for alcohol production by the fermentation of sugars works well
for the food and manufacturing industry. However, the needs of the
manufacturing and chemical industry require large quantities of a purer,
cleaner, analytical grade ethanol. As such, synthetic routes, such as the direct
hydration of ethene, are used to produce a purer, more desirable product.
These synthetic routes tend to use precious metal catalysts as opposed to the
enzymatic catalysts used in fermentation.
Ethanol was produced on a global scale of 21,812 million gallons in 2012 [4] and
is most commonly viewed as a solvent, chemical intermediate or fuel. Ethanol is
frequently used as a chemical intermediate, second only to water as a solvent,
and as a raw material in the manufacture of drugs, plastics, lacquers,
plasticizers, perfumes, cosmetics, detergents and rubber accelerators [5].
By far, the largest use of ethanol is within automotive fuel, especially in South
American countries such as Brazil. Ethanol, as a low molecular weight alcohol,
is replacing other additives as an octane booster in automotive fuels in most
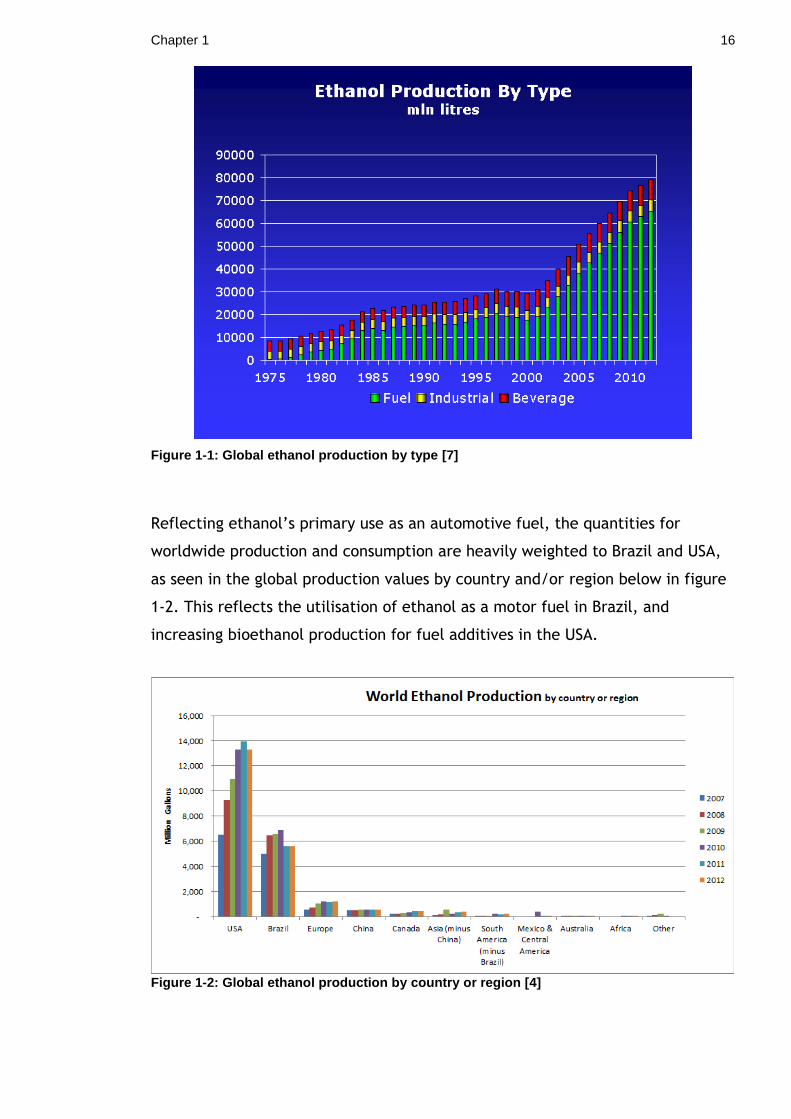
economies [6]. Figure 1-1 shows that ethanol production for industrial and
beverage purposes has remained relatively consistent between 1975 and 2010,
whilst the production of ethanol for fuel has been steadily increasing over the
same period.
Chapter 1 16
Figure 1-1: Global ethanol production by type [7]
Reflecting ethanol’s primary use as an automotive fuel, the quantities for
worldwide production and consumption are heavily weighted to Brazil and USA,
as seen in the global production values by country and/or region below in figure
1-2. This reflects the utilisation of ethanol as a motor fuel in Brazil, and
increasing bioethanol production for fuel additives in the USA.
Figure 1-2: Global ethanol production by country or region [4]

Chapter 1 17
The steady increase seen between 1975 and 2010 is also visible in the production
values from 2007 to 2010 in figure 1-2 for the USA, Brazil and to a lesser extent
Europe. The slight dip and stagnation in production from 2010 onwards can be
explained as a response to the global economic events of 2008 but more
significantly as a direct consequence of a sharp increase in the price of sugar
(beet and cane) and grains (corn, rye, and wheat) at this time, that are used for
the production of fermented ethanol [6]. The volatility of the feedstock
markets for the traditional fermentation route prompted an increase in the
production of alcohols, including ethanol, from developments in petroleum
chemistry [6, 7].
Industrial ethanol is a mature market, although the markets are mobile and
dynamic given the shift and increase in the use of ethanol within traditional
automotive fuel blends. Suppliers in the industrial ethanol market include a
range of synthetic and fermentation operators and ethanol synthesis will remain
of particular interest due to increasing petroleum prices, environmental
concerns and automotive fuel octane additive demands.
1.1.1 Fermentation
Fermentation can be used to produce ethanol through microbial conversion of
natural products, such as carbohydrates. This can be done in two major ways
via the fermentation of sugar, the source of which is either sugar crops or grain
starches such as wheat [6]. In addition the fermentation of non-sugar ligno-
cellulose fractions of crops also produces ethanol and is more colloquially
described as ‘surplus wine ethanol’.
Producers are aware that given the sharp increase in the demand for ethanol,
both fermentation and synthetic routes are required to feed the market.
Maintained global commitment to the production of ethanol originates from the
desire to reduce greenhouse gases within the automotive sector, with legislation
necessitating its inclusion in Europe [8] and the USA [9].
Fermentation, despite its many benefits, is often seen as a volatile process given
the direct link to feedstock prices, combined with the often reduced product
purity continuing to be an issue for certain uses.

Chapter 1 18
1.1.2 Synthesis
There are various examples of synthetic ethanol producers and processes. Each
fuelled by a growing demand for an industrial process that can synthesise
ethanol both cheaply and efficiently.
The first synthetic route to ethanol was developed by Michael Faraday in 1825
which used the acid-catalysed hydration of ethene.
The catalyst used was phosphoric acid absorbed onto diatomaceous earth or
charcoal. This phosphoric acid catalyst was used in the first large scale ethanol
production by the Shell Oil Company in 1947. The reaction was carried out with
an excess of high pressure steam at 300 ⁰C. In the USA, the process was used on
an industrial scale by Union Carbide Corporation and others; Lyondell Basell
continues to use it commercially. Today, Ineos Enterprises is the world’s largest
producer of synthetic and fermentation ethanol with over 300,000 tonnes
produced per annum at the plants in Grangemouth [10]. Here, synthetic ethanol
production is via the direct gas phase hydration of ethene.
Furthermore, Sasol manufactures ethanol through the direct catalytic hydration
of ethene in the presence of steam, using phosphoric acid adsorbed onto silica as
a catalyst [11]. In addition, a significant amount of ethanol is produced from
Sasol’s Fischer-Tropsch process as a co-product.
1.2 Acetic Acid Hydrogenation
There are current catalytic processes for the hydrogenation of acetic acid
conversion on an industrial scale [12]. However, the catalysts used in those
reactions involve the use of precious metals, specifically palladium and
platinum. These precious metal catalytic reactions were heavily researched by
BP in the 1980s and resulted in patents relating directly to catalyst composition
and process technology [13-15].
Chapter 1 19
The research into non-precious metal catalysis for this process and specifically
the use of base metals has been investigated too, although the significant
volume of literature related to the reduction of acetic acid to acetaldehyde
rather than to ethanol.
Initial consideration of the thermodynamics of the reaction is important in order
to establish viability of the system and some reaction parameters. The
hydrogenation of acetic acid to ethanol can be expressed as:
CH3COOH + 2H2 CH3CH2OH + H2O ΔG⁰523 = -3.9 kJmol-1
The thermodynamics tell us that the reaction is spontaneous at low
temperatures and exothermic with a ΔH⁰ value of -41.8 kJ mol-1. As the reaction
is exothermic, and proceeds with a reduction in the number of moles, the
highest yields of ethanol are obtained at low temperatures and high pressures.
The literature and patent reviews reveal that most of the catalyst studies
performed have used Group VIII metals supported on oxides [13, 14, 16, 17] and
specifically used palladium systems. The aim of this project, however, was to
investigate viable catalyst alternatives to the traditional precious metals used
for the selective hydrogenation of acetic acid to ethanol. The use of palladium
or platinum catalysts for hydrogenation roles provide high selectivity to the
processes, using catalysts with high surface areas through the use of silica or
alumina support materials and low metal loadings. The cost implications of
using a precious metal however, even at low loadings, can make the use of a
base-metal an attractive alternative. For the current routes to ethanol from
acetic acid, the patent literature reveals that Celanese [12] have a process using
a platinum/tin (Pt/Sn) catalyst.

Chapter 1 20
Figure 1-3: Possible routes from Syn-Gas to ethanol
An alternative synthetic route for ethanol is the production of the acetate
species (methyl acetate or ethyl acetate) through the esterification of acetic
acid, and then synthesis of ethanol through catalytic hydrogenation of the
acetate, as seen in figure 1-3.
The production of ethanol as a significant product was observed within a study
by Blain et al. [1] when acetic acid was passed over a commercial methanol
synthesis catalyst under a reducing atmosphere. This observation automatically
posed a question regarding the ability of copper catalysts, and this methanol
synthesis catalyst in particular, as acetic acid hydrogenation catalysts. The
production of ethanol over copper catalysts had been previously observed and
reported by Cressely et al. [2], along with other products such as acetaldehyde
and ethyl acetate.
Acetic acid is commonly used as a model system which can then be expanded to
other C2+ oxygenates studies. Decomposition studies have frequently taken
place on single crystal systems and also the decomposition of adsorbed acetate
groups were investigated [16]. The authors concluded that the acetic acid was
able to adsorb onto both the alumina support component and the rhodium
surface. They also identified that three types of acetates were present on the

Chapter 1 21
rhodium surface, with each being responsible for a unique acetic acid
decomposition route.
As well as vapour-phase hydrogenation, acetic acid hydrogenation has been
looked at within the aqueous phase [18]. Olcay et al. [18] observed that the
activity for the hydrogenation of acetic acid to ethanol decreased with the
following trend: Ru> Rh≈ Pt> Pd ≈Ir> Ni> Cu. The ethanol selectivity of Ru was
highest when it reached above 80 % with temperatures below 175 ⁰C. The
reaction side products were identified were as ethyl acetate, acetaldehyde and
the alkane product plus CO2. The Cu and Ni catalysts investigated were in the
form of Raney catalysts to avoid sintering and dissolution, and also to maintain
the high surface area required for activity with these base metal catalysts.
Variations in the mechanisms for hydrogenation and decomposition are
suggested to be dependent upon the active metal phase [18-20].
Base metals, in particular, have grown as an area of development, from when
this process was initially being published by Cressely [2] in 1984. In this paper,
the activities and selectivities of Cu, Co and Fe based catalyst systems in the
form of impregnated metal catalysts using a silica support, generally from the
metal nitrate salt, were investigated. The research clearly identifies the
activity of base metal systems, with a range of reaction temperatures and metal
loadings investigated.
The copper based catalysts were calcined at temperatures ranging within 300 ⁰C
to 1050 ⁰C. The copper catalysts heated to above 1050 ⁰C were seen to exhibit
increased selectivity to acetaldehyde with the product range severely
diminishing compared to the 300, 500 and 850 ⁰C counterparts. Each reaction
was carried out at a reactor temperature of 350 ⁰C, which is above the 300 ⁰C
limitation used within this project’s testwork for copper based catalysts. The
data in the Cressely’s work does not display any information as to the
deactivation of the catalyst either from the presence of the acetic acid or the
temperatures used.
It was with a 6.85 % Co/SiO2 catalyst at 200 ⁰C that ethanol was identified as the
primary product within the same paper. Significant conversion to methane was
also observed, ranging from 33.5 to 75.8 % depending on metal loading and

Chapter 1 22
temperature, but was observed for both the bulk cobalt and supported cobalt
catalysts. A significant decrease in activity and shift towards methane
production was seen when cobalt acetate salt was used instead of the nitrate
salt in the production of the supported catalysts.
The iron based systems were active for the production of acetone from acetic
acid and the desired ethanol production was only observed at higher
temperatures. With the use of higher temperatures, up to 400 ⁰C, the amount
of methanation increased, giving equal amounts of ethanol and methane
production of 3 % at 400 ⁰C.
The three base metals investigated by Cressely [2] showed variance in their
product profiles which was postulated to be due to the acetate species forming
on the metal surfaces. Research into base metal catalysts was further continued
by Cressely et al. who subsequently published a paper [21] which commented
upon the effect of the support used, alkalisation and the use of bimetallic
systems.
Recent patents [12] pertaining to acetic acid hydrogenation have shown that this
is an area of expanding research. Celanese International Corporation [12] have
patented significantly in the area of acetic acid hydrogenation, detailing the use
of Pt/Sn and cobalt based catalyst systems [22-25]. The patent [12] states that
‘the catalyst employed in the process comprises at least one metal, a silicaceous
support, and at least one support modifier.’ This varied scope included the use
of alkali promoter such as those investigated by Cressely [21] but the use of
promoters was not encompassed by the remit of the research completed for this
project. In addition, Celanese have also patented the use of a stacked bed
reactor system using a combination of a Pt/Sn catalyst system in the first bed
and a copper catalyst in the second bed [25]. Process developments such as
these and improvements to product separation and tolerance for recycle streams
have also been heavily patented within the last four years [25-27].
The Pt/Sn catalysts, as outlined in the Celanese patents [23, 25], are
traditionally used as dehydrogenation catalysts, but in this instance are
highlighted for their activity in the production of ethanol and ethyl acetate. The
figures quoted in US Patent 2010/0197485 [23], show that the selectivity of the

Chapter 1 23
catalyst toward ethanol is high with an ethanol selectivity of ~95 % over a 1m
catalyst bed at 225 ⁰C. The catalyst quoted in terms of productivity and
selectivity was doped with CaSiO3, and the effect of doping within the range of 0
–10 wt.% was demonstrated at both 250 ⁰C and 275 ⁰C. The optimal doping to
produce the highest selectivity to ethanol was 5 wt.% CaSiO3 at 275⁰C.
Recent literature also starts to look at more complex systems using novel
Cu2In/Al2O3 catalysts [28]. The indium doping appears to be highly efficient for
the reduction of acetic acid to ethanol through the formation of the Cu2In alloy
within the catalyst. Additionally carbide based catalysts have also proved to be
effective for the hydrogenation of acetic acid to ethanol with molybdenum
carbide recently being identified by Celanese [29] as active.
1.3 Acetic Acid Production
It is unsurprising that the companies researching the hydrogenation of acetic
acid to ethanol are also the major acetic acid manufacturers, namely BP and
Celanese. Virtually all new acetic acid production routes make use of the
homogeneous methanol carbonylation technology developed by Monsanto [30] in
the 1970s. Acetic acid itself is used for a variety of applications: for example, as
a raw material for vinyl acetate monomer and acetic anhydride synthesis, and as
a solvent for purified terephthalic acid production [30].
1.4 Catalysts
The main scope of this study was to look at the gas-phase hydrogenation of
acetic acid under relatively mild catalytic conditions for a selective reaction to
ethanol.
1.4.1 Precious Metal Catalysts
Significant research has gone into investigating precious metals as hydrogenation
catalysts. Palladium systems, both single crystal faces and supported metal
catalyst systems [12, 17] have been published showing significant activity for the
selective hydrogenation of acetic acid to ethanol.

Chapter 1 24
The viability of palladium has been researched for the upstream processes such
as methanol synthesis from syngas. The high cost of the palladium metal and its
slow rate of reaction relative to commercial Cu/ZnO/Al2O3 alternatives, have
stopped further use.
Supported platinum catalysts with a range of supports were tested to probe the
kinetic behaviour of carboxylic acid hydrogenation [31, 32]. Rhodium based
catalysts have shown significant promise for alcohol production, where
selectivity to ethanol is favoured [33].
1.4.2 Base-Metal Catalysts
Cressely et al. studied the hydrogenation over Cu/SiO2 catalysts and reported
results of high ethanol yields, along with the detection of additional products
such as acetaldehyde and ethyl acetate [2]. Ethyl acetate is produced as a
result of the esterification reaction between the ethanol and acetic acid.
Furthermore, both the hydrogenation and esterification reactions produce water
as a side product.
Commercial methanol synthesis catalysts have been extensively characterised
and well documented in many papers. A review of the development on
industrial methanol synthesis catalysts shows the catalyst originally used was
Fe/K/Al2O3 [34]. The activity of ZnO was realised and investigated but not
utilised until in 1966 when ICI developed a high content copper methanol
synthesis catalyst with the formulation Cu/ZnO/Al2O3 via a co-precipitation
method [34-36].
Optimisation of a catalyst can be particularly difficult when the preparation
technique and metal precursor used can have a profound effect on activity.
Examples of this are seen with cobalt catalysts for Fischer-Tropsch synthesis.
Techniques for preparation and activation can have a significant impact on the
activity of the catalyst [37]. Interestingly, attempts to modify the behaviour of
base metals to mimic the catalytic abilities of their precious metal counterparts
have been successful, involving nickel with a Sn coating to act like platinum
[38].

Chapter 1 25
Acetic acid reduction over iron catalysts has shown very high selectivities to
acetaldehyde [39, 40]. Iron oxide has regularly been reported and used for the
hydrogenation of carboxylic acids to their corresponding aldehydes. One of the
first industrial examples of this was by GAF Corporation in 1935 [41].
Research into bimetallic base metal catalyst systems for acetic acid
hydrogenation has its precedent established by Cressely [21]. He observed that
of the couplings made between Co, Cu and Fe, the Fe-Co coupling displayed a
surprising selectivity to reduction, where the individual metal catalysts directed
the reaction towards methanation and ketonisation respectively. Additional
synergistic effects were not observed with the other metal couplings tested.
1.4.3 Supports
A catalyst support for this system will need to offer a high surface area to allow
significant distribution of the metal particles over the support area. The texture
and surface acidity of a support can influence metal dispersion and ability to be
reduced, as well as the interaction between the metal and the support [6].
There are specific desirable characteristics with a support. It is pertinent to
highlight the importance of the stability of the support as part of its role and the
contribution this gives to the viability of a catalyst. Additionally, within this
reducing system, hydrogen uptake is an important issue as a readily-available
hydrogen supply to the active metal sites is required. Within the context of an
acidic system, the use of a basic support would be counter-productive to the
acid-based process.
Other systems have seen significant differences with changes in the catalyst
support. Conversely to the studies performed by Cressely et al. on the effect of
metals, Vannice et al. [32] studied acetic acid hydrogenation over a range of
supported platinum catalysts on various supports (TiO2, SiO2 , η-Al2O3 and Fe2O3).
Dependence of the product selectivity was seen to be directly linked to the
oxide support used for the platinum catalysts. Other support studies included
looking at SiO2, Al2O3, La2O3 and ZnO for the reduction of acetic acid with base
metal catalysts [21], for which only the silica supported catalysts did not show
an increase in the amount of ketonisation at the expense of acid reduction.

Chapter 1 26
Traditional support options include silica, which in its amorphous form does not
crystallize upon annealing, and is acidic in nature. Other widely used metal
oxide support options include alumina and titania.
1.5 Catalyst Deactivation
The structural engineering of a catalyst plays a large part in controlling the
vulnerabilities of a catalyst. A successful catalyst must not only be capable of
catalysing the desired reactions selectively but it must also display mechanical
robustness.
Ideal catalyst attributes include:
High Activity
Adequate Porosity
High Specific Surface Area
Stable Structure
Long Life
Strong Pellet Bonding
Optimum Pellet Shape
Correct fluid-flow properties
When acknowledging the requirements of the catalyst composition, structure
and design, a variety of potential causes for deactivation are identified. This
includes: mechanical causes including erosion and attrition, specifically pellet
attrition; integrity of the pellet both in terms of structure and shape; and a
structure’s stability in the presence of reactants and products.
Thermal deactivation causes include crystallite growth and pore collapse caused
by sintering. This is particularly pertinent when working with copper containing
catalysts as the upper operating temperature limit is often indicated as 300 ⁰C
[6]. Chemical transformations occurring within the catalyst can include
integration of the metal species into the bulk and typically the production of
metal –aluminate or silicate species. Extreme thermal activity can also induce
the degradation of the stabiliser component of a catalyst.
Chapter 1 27
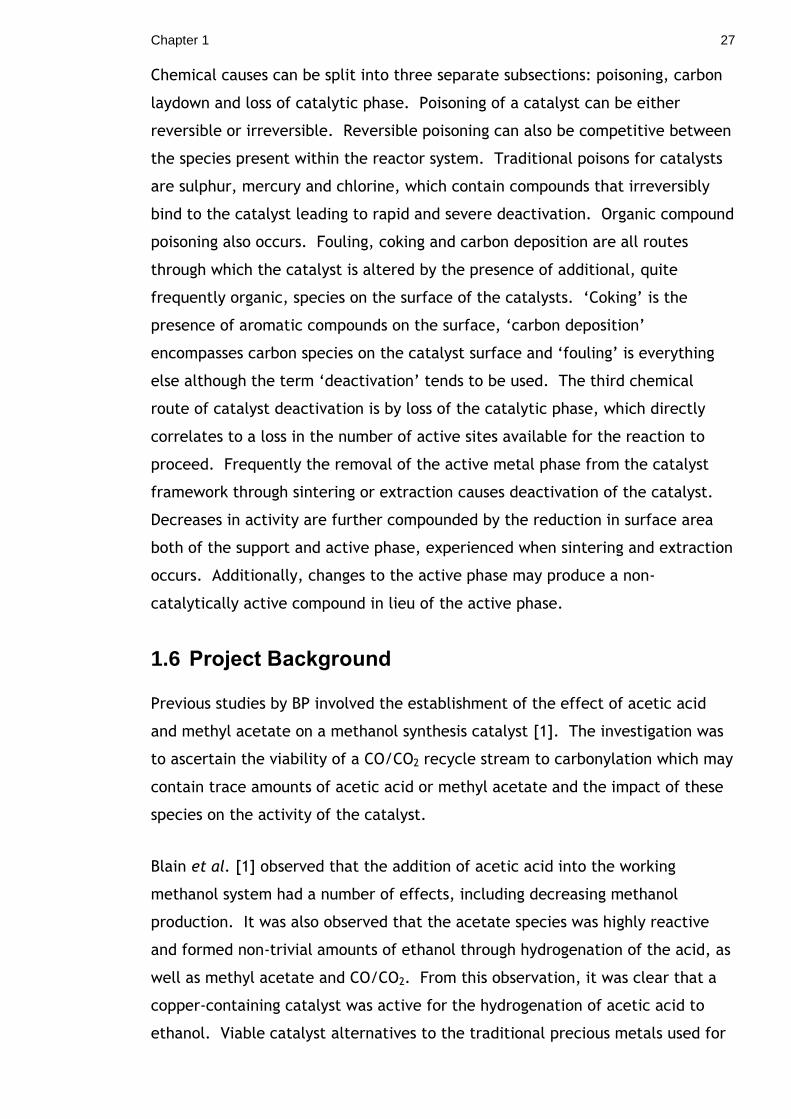
Chemical causes can be split into three separate subsections: poisoning, carbon
laydown and loss of catalytic phase. Poisoning of a catalyst can be either
reversible or irreversible. Reversible poisoning can also be competitive between
the species present within the reactor system. Traditional poisons for catalysts
are sulphur, mercury and chlorine, which contain compounds that irreversibly
bind to the catalyst leading to rapid and severe deactivation. Organic compound
poisoning also occurs. Fouling, coking and carbon deposition are all routes
through which the catalyst is altered by the presence of additional, quite
frequently organic, species on the surface of the catalysts. ‘Coking’ is the
presence of aromatic compounds on the surface, ‘carbon deposition’
encompasses carbon species on the catalyst surface and ‘fouling’ is everything
else although the term ‘deactivation’ tends to be used. The third chemical
route of catalyst deactivation is by loss of the catalytic phase, which directly
correlates to a loss in the number of active sites available for the reaction to
proceed. Frequently the removal of the active metal phase from the catalyst
framework through sintering or extraction causes deactivation of the catalyst.
Decreases in activity are further compounded by the reduction in surface area
both of the support and active phase, experienced when sintering and extraction
occurs. Additionally, changes to the active phase may produce a non-
catalytically active compound in lieu of the active phase.
1.6 Project Background
Previous studies by BP involved the establishment of the effect of acetic acid
and methyl acetate on a methanol synthesis catalyst [1]. The investigation was
to ascertain the viability of a CO/CO2 recycle stream to carbonylation which may
contain trace amounts of acetic acid or methyl acetate and the impact of these
species on the activity of the catalyst.
Blain et al. [1] observed that the addition of acetic acid into the working
methanol system had a number of effects, including decreasing methanol
production. It was also observed that the acetate species was highly reactive
and formed non-trivial amounts of ethanol through hydrogenation of the acid, as
well as methyl acetate and CO/CO2. From this observation, it was clear that a
copper-containing catalyst was active for the hydrogenation of acetic acid to
ethanol. Viable catalyst alternatives to the traditional precious metals used for

Chapter 1 28
the selective hydrogenation of acetic acid to ethanol were therefore of interest
and were to be investigated. An acetic acid concentration of 1 mol.% was
frequently used by Blain, and although a significant decrease in the methanol
production was observed with this acid content, the more profound effect on the
deactivation of the catalyst was observed with 5 mol.% acetic acid in the
system.
There are a variety of points relating specifically to the acetic acid
hydrogenation system that need to be considered when investigating this
reaction.
The hydrogenation of acetic acid can lead to a variety of products
including, and not exclusively, methanol, ethanol, ethyl acetate, methyl
acetate, acetaldehyde and methyl formate. From this range of short
chain hydrocarbon derivative products, ethanol was the only desired
product, making selectivity as well as activity important.
The corrosive nature of using an acetic acid feed would have a limiting
factor in the amount used. Continued use at high concentrations would
damage the reactor system and associated analytical equipment.
Testing of the catalysts by varying both the pressures used and reactor
types, leading to optimisation of parameters such as temperature and
pressure.
The type of catalyst support used can have a significant effect on both
catalyst activity but also catalyst stability.
Investigate overall catalyst stability, including the effect of acetic acid on
the catalyst sample post reaction. The requirement for this reaction is an
active acid tolerant catalyst.
1.7 Project Aims
The aims of this project were:

Chapter 1 29
Develop an understanding of why copper catalysts have been found to be
unsuitable for acetic acid hydrogenation to ethanol.
Investigate the role of the catalyst support and determine the stability to
acetic acid of a variety of catalyst supports.
Investigate the ability of base metal supported catalysts to facilitate the
hydrogenation of acetic acid to produce ethanol and to ultimately design
and synthesise novel acetic acid tolerant base metal hydrogenation
catalysts.

30
2 Experimental
A key aspect of this investigation was the development, preparation and
characterisation of alternative base-metal catalysts and comparing those to
commercially available alternatives. As such, a number of catalysts were
prepared via a range of methods described below, and subsequently
characterised.
2.1 Catalyst Preparation
A series of base-metal catalysts were prepared via either an impregnation
method using metal salt precursors, or a precipitation method.
2.1.1 Supports
A variety of supports were used for the different catalyst preparations. The
majority of catalysts were prepared with either Θ-alumina or amorphous silica,
as supplied by BP. The Θ-alumina used was Saint-Gobain Norpro SA6X75 and the
silica was Fuji-Silysia CARiACT Q10. Additionally Saint-Gobain Norpro Titania
ST61120 was also supplied. The titania support was used for the preparation of
an impregnated 10 wt.% cobalt catalyst. The alumina and titania were provided
as pellets and the silica was provided in sphere form.
The supports were characterised prior to metal loading to allow for analysis and
comparison of the supports at the pre- and post-reaction stages. Depending
upon the reactor system being used for catalytic testing, the catalysts were left
as either the preformed structures or crushed to a particle size range of 250-425
µm. All catalysts were crushed for characterisation.
2.1.2 Preparation Procedures
The technique employed for catalyst preparation was dependent upon the total
metal loading. For total metal loadings of ≤ 10 wt.%, a spray impregnation
technique was used, whilst for higher total metal loadings of 20 wt.% a
precipitation technique was used. The prepared catalysts were all calcined to
the metal oxide and activated by reduction to the metal prior to testing.

Chapter 2 31
2.1.2.1 Impregnation Procedure
Two different nominal metal loaded catalysts, 5 wt.% and 10 wt.%, were
prepared via the impregnation route. The impregnated catalysts were prepared
using a spray impregnation technique [42], where the volume of the metal
solution matched that of the support pore volume. Surface area analysis was
performed on the supports prior to calcination to determine the pore volumes
for use in the impregnation catalyst preparation. The pore volume values used
can be seen in table 2-1.
Table 2-1: Support pore volume values used for impregnated catalyst preparation
Silica Q10 Alumina SA6X75 Titania ST61120
Pore Volume (cm3/g)
1.0 0.71 0.38
The catalysts were prepared in batches of 100 g. Depending upon the support
pore volume, the corresponding volume in water to the total pore volume was
used to dissolve the metal precursor in an aqueous solution. For example, a 5
wt.% copper on silica catalyst was prepared by dissolving copper (II) nitrate
hemipentahydrate (18.3 g) precursor in 95 ml of H2O. The silica support (95 g)
was placed into the drum of a Pascall Lab-Mixer (Model 1664_00_A), which was
rotated to agitate the catalyst support, whilst the metal precursor solution was
sprayed onto the support using a battery operated Desaga Sarstedt-Gruppe SG1
spray gun fitted with a 50 mL Schott Duran flask. Once all of the aqueous
solution had been added, the catalyst was left in the tumbling drum for an
additional 30 minutes to aid full and even dispersion of the metal precursor
solution. After being removed from the mixer, the catalysts were dried
overnight in an oven at 115 ⁰C.
The catalysts prepared are listed in table 2-2, along with their metal loading,
the metal precursor and support used in the preparation. In addition, the given
names used throughout the results section for the prepared catalysts are listed.

Chapter 2 32
Table 2-2: Impregnated catalysts prepared
Metal Loading (%) Metal Precursor Support Name
Copper 5 Copper Nitrate
Hemipentahydrate
Silica Q10 CuNQ10
Copper 5 Copper Acetate
Tetrahydrate
Silica Q10 CuAQ10
Copper 10 Copper Nitrate
Hemipentahydrate
Silica Q10 CuN(10)Q10
Nickel 5 Nickel Nitrate
Hexahydrate
Silica Q10 NiNQ10
Nickel 10 Nickel Nitrate
Hexahydrate
Silica Q10 NiN(10)Q10
Cobalt 5 Cobalt Acetate
Tetrahydrate
Silica Q10 CoAQ10
Cobalt 10 Cobalt Acetate
Tetrahydrate
Silica Q10 CoA(10)Q10
Cobalt 10 Cobalt Nitrate
Hexahydrate
Alumina
SA6X75
CoN(10)SA6X75
Cobalt 10 Cobalt Nitrate
Hexahydrate
Titania
ST61120
CoN(10)ST61120
The calcination and reduction steps are described for each catalyst in the results
and discussion sections.
2.1.2.2 Precipitation Procedure
An alternative catalyst preparation technique used was for the production of 20
wt.% catalysts. The precipitation technique used was the HDC or ‘Highly
Dispersed Catalyst’ production method [43], which was adapted to either mono-

Chapter 2 33
or bi-metallic catalyst preparation. The technique describes the preparation of
high dispersion cobalt catalysts and uses laboratory prepared metal hexamine
solutions.
Metal Ammine Solution Preparation
The cobalt hexammine solution was prepared with a cobalt content of ∼2.9 w/w
% Co by the following method. Ammonium hydroxide solution (ca. 25 v/v % NH3)
(1.918 L) and deionised water (1.877 L) were combined and mixed in a large
conical flask with the use of a stirrer plate and magnetic stirrer bar. Once
thoroughly mixed, ammonium carbonate chip (198 g) was added to the solution
and left to stir until all the chips had completely dissolved. Subsequently,
cobalt (II) carbonate (218 g) was then added in small portions of ~25 g over
several hours to allow for full dissolution. The solution was left to stir overnight
and subsequently filtered to remove any undissolved material. The solution
produced was a crimson red colour attributable to the cobalt hexammine
complex.
The nickel hexammine and copper tetrammine solutions were prepared by a
similar route. The production of the copper tetrammine solution used
ammonium hydroxide solution (ca. 25 v/v % NH3) (0.688 L), deionised water
(2.997 L), ammonium carbonate chip (233 g) and copper (II) carbonate (177 g).
The resulting solution, prepared by the same method as for Co, was a blue
attributable to the copper ammine complex and corresponded to a copper
content of ∼2.36 w/w % Cu.
The corresponding nickel hexammine solution with a content of ∼2.5 w/w % Ni
was also prepared. The constituent parts for the preparation of the solution
were ammonium hydroxide solution (ca. 25 v/v % NH3) (0.563 L), water
(1.877 L), ammonium carbonate chip (152 g) and nickel (II) carbonate hydroxide
tetrahydrate (205 g). The same method was employed as for the cobalt and
copper complex solutions outlined above. The nickel complex formation was
observable through a colour change from green to blue during the solution
preparation.

Chapter 2 34
Preparation of the HDC catalysts
The catalysts were prepared with the pelletized Saint-Gobain Norpro SA6X75
alumina which was desiccated prior to catalyst preparation. Three single metal
and three mixed metal catalysts were prepared using the alumina support and
are listed in table 2-3. For both the mono-metallic and bi-metallic catalysts, the
total metal loading was fixed to 20 % by weight, and the methodology was
maintained for each preparation.
Table 2-3: Mono- and bi-metallic precipitation catalysts prepared
1st Metal 2nd Metal
Support
Name Metal Loading (%) Metal Loading (%)
Copper 20 Alumina
SA6X75
20CuSA6X75
Cobalt 20 Alumina
SA6X75
20CoSA6X75
Nickel 20 Alumina
SA6X75
20NiSA6X75
Copper 20 Silica Q10 20CuQ10
Nickel 20 Silica Q10 20NiQ10
Cobalt 20 Silica Q10 20CoQ10
Copper 10 Cobalt 10 Alumina
SA6X75
10Cu-10Co-SA6X75
Cobalt 10 Nickel 10 Alumina
SA6X75
10Co-10Ni-SA6X75
Nickel 10 Copper 10 Alumina
SA6X75
10Ni-10Cu-SA6X75
Preparation Method
The catalysts were prepared in batches of 100 g, using 80 g of SA6X75 alumina.
Volumes of the prepared metal ammine solutions, calculated for a metal
contribution equivalent to 20 g (or 20 wt. %), were measured out and added to a

Chapter 2 35
5 litre round-bottomed flask. For the bi-metallic catalysts, the volume of each
of the two desired metal hexamine solutions was calculated for a 10 wt.% (or
10 g) contribution. The two solutions were then combined in the round-
bottomed flask. The round-bottomed flask was attached to a rotary evaporator
and placed within a water bath set to 35 ⁰C. The flask was set to rotate and the
alumina support added in small batches over the space of an hour. The metal
ammine solution and support mixture was then refluxed under vacuum at 40-45
⁰C to allow for the evaporation of the ammonia and the subsequent metal
deposition on the support material. The completion of the metal deposition
during the catalyst preparation was visible by a distinctive change in the colour
of the solution. The pH of the solution was also checked using a pH meter both
prior to the reaction and once metal deposition was indicated to be complete.
Following full metal deposition, the mixture was further refluxed for 15 minutes
to age the mixture. The reaction mixtures were then removed from the rotary
evaporator and filtered using a Buchner flask. The coloured metal supported
catalysts were then washed repeatedly and left to dry on the Buchner apparatus
for 30 minutes. Once air dry, the catalysts were then dried in the oven
overnight at 200 ⁰C.

Chapter 2 36
Table 2-4: Mono-metallic and bi-metallic precipitation catalysts prepared
Catalyst Metal(s) Initial Solution Colour
pH Catalyst colour post deposition
pH
20CuSA6X75 20% copper on alumina
Blue 12.1 Light blue 9.2
20CoSA6X75 20% cobalt on alumina
Crimson Red 11.6 Red/purple 9.4
20NiSA6X75 20% nickel on alumina
Green 11.8 Light green 9.5
10Cu-10Co-SA6X75
10% copper and 10% cobalt on
alumina
Deep Purple (Blue)
11.9 Red-Purple 9.4
10Co-10Ni-SA6X75
10% cobalt and 10% nickel on
alumina
Deep Purple (Fuschia)
11.7 Red - Brown 9.9
10Ni-10Cu-SA6X75
10% nickel and 10% copper on
alumina
Deep Blue 11.9 Blue/Green 9.5
Once each catalyst was dry, a small sample was crushed and analysed on the
TGA-DSC-MS to establish the appropriate calcination temperature for that
catalyst. For the calcination step, the catalyst was placed in a quartz weighing
boat within a quartz tube and was heated within a Carbolite (MTF 12/38/400)
tube furnace. An Interpet Airvolution Mini 2505 peristaltic pump was attached
to the quartz furnace tube to push an air supply over the catalyst throughout the
calcination programme, with the exit flow being vented externally.
2.1.3 Commercial Catalysts
2.1.3.1 Katalco 51-8 (Methanol Synthesis Catalyst)
The commercial methanol synthesis catalyst tested was Johnson Matthey’s
Katalco 51-8 which was provided as 5 mm pellets. The typical formulation for
methanol synthesis catalysts is Cu/ZnO/Al2O3 [34, 44] . Methanol synthesis
catalysts often contain additional stabilisers such as magnesium oxide [34] or are
doped with rare-earth metals [45].

Chapter 2 37
Table 2-5: Composition of typical Methanol Synthesis Catalyst [44]
Component Amount (wt.%)
Copper 40-80
Zinc Oxide 10-30
Aluminum Oxide (Alumina) 5-10
2.1.3.2 Copper Chromite
Three copper chromite catalysts were tested, including two modified Na doped
species. The two modified catalysts were copper chromite with 120 ppm Na and
copper chromite modified with 1600 ppm. Their compositions as reported by
Sud-Chemie are shown in table 2-6.
Table 2-6: Percentage of components in Sud-Chemie copper chromite
Component Concentration (wt%)
Copper oxide 40-50
Chromium (III) oxide 40-50
Manganese dioxide <5
Barium chromate 3-4
Chromia (VI) compounds, with the exception of barium chromate
<0.2
Additionally, another copper chromite catalyst was tested. This catalyst was
also an industrial catalyst and was available in pelletized form. The catalyst
was crushed to produce a particle fraction of 250-425 µm.
2.2 Catalyst Characterisation
2.2.1 Surface Area Determination
The Brunauer, Emmett and Teller (BET) analysis technique was used to
determine the total surface area, pore volume and average pore diameter of the
catalysts. The equipment used for analysis was a Micrometritics Gemini III 2375
surface area analyser. Prior to analysis, a catalyst sample of approximately

Chapter 2 38
0.05 g, was placed in a glass tube and purged overnight under a flow of nitrogen
at 110 ⁰C.
This gas volumetric method takes a known quantity of N2 admitted to the sample
tube containing the absorbent at a constant temperature of -196 ⁰C. As the N2
adsorbs to the sample, the pressure within the sample tube drops until
equilibrium is established. Helium is added to the vessel to equal the pressure
within both the sample tube and the reference tube. This method uses
multipoints for free space analysis including the volume of the solid and also the
volume of the reactor tube. The equation below is the final expression which
gives the summation of the assumptions of the BET method over an infinite
number of adsorbed layers [44] linking together the volume of gas adsorbed and
the pressure.
00
)1(1
)( CPV
PC
CVPPV
P
mm
Equation 1: Brunauer, Emmett and Teller (BET) adsorption isotherm equation
Where: V = volume of gas adsorbed at pressure P
Vm = volume of gas adsorbed in monolayer, same units as V
P0 = saturation pressure of adsorbate gas at the experimental
temperature
C = a constant related exponentially to the heats of adsorption and
liquefaction of the gas (C = e(q1-qL)/RT)
Where q1 = heat of adsorption on the first layer
qL = heat of liquefaction of adsorbed gas on all other layers
R = gas constant
When equation 1 is used, plotting the P/V(P0-P) against P/P0 should yield a
straight line, specifically in the P/P0 range of 0.05 – 0.3 where the slope is given
by (C-1)/VmC and the intercept by 1/VmC. These calculations are completed
internally by the Micrometritics software.

Chapter 2 39
2.2.2 Thermogravimetric Analysis
Thermogravimetric analysis was performed the catalysts at various stages of
preparation and testing. The analysis was carried out using a combined
TGA/DSC SDT Q600 thermal analyser coupled to an ESS mass spectrometer for
evolved gas analysis. Temperature programmed analyses (TGAs) were carried
out using argon, temperature programmed reductions (TPRs) were carried out
using a 5 % H2/N2 gas mix and temperature programmed oxidations (TPOs) were
carried out using a 2 % O2/Ar gas mix. For each analysis, a standard ramp rate of
10 ⁰C min-1 was used for the heating profile.
For the mass spectroscopic analysis, various relevant mass fragments were
monitored. Typical values included, 2 (H2), 14 (CH2), 15 (CH3), 16 (CH4), 28
(CO), 32 (O2), 44 (CO2), 45 (CH3OH), and 60 (CH3COOH).
2.2.3 Powder X-Ray Diffraction
X-ray diffraction patterns were obtained using a Siemens D5000 X-ray
diffractometer (40 kV, 40 mA, monochromatised) with a CuK alpha source
(1.5418 Å). The scanning range was 5 - 85⁰ 2Θ with a scanning rate of 1
second/step and a step size of 0.02⁰.
Hot-stage XRD analysis was also carried out on the D5000. The same process
conditions were used for the flat plate analysis, however the sample was heated
in a 5 % H2/N2 atmosphere (flow rate 20 ml min-1). Scans of the sample were
taken at room temperature and then at subsequent 100 ⁰C increments with a
ramp rate of 12 ⁰C min-1.
All assignments for XRD patterns were completed using the ICDD relational
database (PDF-4+ 2007).
Average particle sizes were calculated using the Scherrer equation:
)cos/( kDv
Equation 2: Scherrer Equation

Chapter 2 40
Where: λ = 1.54 Å Cu Kα = wavelength of radiation (X-Ray wavelength)
Dv = crystallite size weighted by volume (average dimension of
crystallites)
k = Scherrer constant
Β = integral breadth of peak (in radians 2θ) located at angle θ
(intergral reflection of a reflection in radians at 2θ)
Θ = Bragg angle
2.2.4 Microanalysis (CHN)
Catalyst samples were submitted for microanalysis or elemental analysis on an
Exeter Analytical CE-440 Elemental Analyser for the quantification of the
carbon, hydrogen and nitrogen contents.
2.2.5 Nuclear Magnetic Resonance Spectroscopy
NMR spectra were recorded on a Bruker 400 MHz Spectrospin spectrometer (1H
NMR at 400 MHz and 13C NMR at 400 MHz or 500 MHz). Chemical shifts are
reported in ppm. 1H NMR spectra were recorded with DMSO as solvent using (δ
=2.50) as internal standard, and for 13C NMR spectra, the chemical shifts are
reported relative to the central resonance of DMSO (δ = 39.52).
2.3 Catalyst Testing
Catalyst testing for the process of acetic acid hydrogenation was carried out in a
variety of reactor types. These included a range of low and high pressure
reactor systems, with both differential and integral reactor designs.
2.3.1 Berty Reactor
2.3.1.1 Apparatus
A 300 ml Berty reactor (Autoclave Engineers) fitted with a magnedrive 075-MKII
impeller for agitation was used for catalyst testing and is depicted in the
schematic below. The allied pipework was constructed of 316 stainless steel ¼”
piping. The Berty reactor vessel combined an integrated heater unit, with dual
thermocouples positioned within the reactor vessel and an additional trip
thermocouple placed on the exterior of the heater unit. WEST temperature

Chapter 2 41
controllers were used for the integration of the reactor heater unit, the trace
heated sections and the thermocouples and trips within the central control unit.
Gases were fed to the reactor via Brooks SMART 5805S mass flow controllers and
at pressures of up to 50 barg, which were achieved within the reactor by use of
a gas booster system and limited and controlled by a proportional relief valve.
An acetic acid liquid feed was introduced into the system prior to the reactor via
a Gynkotek High Precision HPLC pump, model 480. The feed was vapourised
upon introduction to the inlet pipework that was trace heated to 150 ⁰C. All
post-reactor pipework was trace heated to 190 ⁰C to prevent condensation of
products in the exit stream prior to gas chromatographic (GC) analysis. Product
analysis was achieved through the use of an online GC system with the GC
sampling valves being heated within a purpose built oven.
Figure 2-1 Schematic of BERTY reactor system
Safety features of the high pressure system included the integration of bursting
discs with values of 100 barg within the system at various points. In addition,
for the monitoring of gas leaks, there were CO monitors present under the
workbench by the booster unit and within the vented cabinet. Safe shutdown of

Chapter 2 42
the reactor system would occur upon activation of the CO monitors, any high
temperature trip sensors and high or low gas flow trip sensors.
Catalyst (1.3 ml) was placed in the reactor basket, using a wire mesh base to
hold the catalyst within the basket. The reactor lid was inserted and bolted
down using a torque wrench to a pressure of 50 lb/in2. The copper catalyst
samples tested were reduced in situ at 250 ⁰C for 3 hours under atmospheric
pressure and at a flow of 50 ml min-1 H2. Once reduction was complete, the gas
flow was changed to a N2/H2 mix of 190 ml min-1 H2 and 60 ml min-1 N2. The
booster system was used to increase the reactor pressure to the desired level of
up to 50 barg. The pressure in the reactor system was controlled throughout the
reaction with the use of a proportional relief valve system.
Once stable at the desired pressure and temperature, the acetic acid feed was
started and in turn the GC analysis. The HPLC was set to a flow of 10 µl min-1.
This relates to a 1.5 mol.% acid feed as a percentage of the total gas feed into
the BERTY reactor.
2.3.1.2 Gas Chromatography
Online product analysis was carried out using a ThermoFinnigan ThermoQuest CE
Instruments Trace GC fitted with a dual sampling, column and TCD detectors
systems. The two columns used were:
1. Supelco Mol Sieve 5A Plot Fused Silica Cap column, 50 m x 0.53 mm used
for methane, CO, nitrogen and ethane separation and identification.
2. HP Plot Q (Divinylbenzene/styrene porous polymer), 30 m x 0.53 mm x
40.0 µm Film thickness used for all other reaction product separation and
identification.
The sample loop volume was 1 ml. The temperature profile for the GC is
depicted below in figure 2-2.

Chapter 2 43
Figure 2-2: Method from BERTY GC
Prior to analysis the GC was calibrated for CO, CO2, ethane, methane, nitrogen,
acetaldehyde, acetic acid, acetone, ethanol, ethyl acetate, methanol, methyl
acetate, n-octane and water. The calibration values for the major products and
reactants are shown in figure 2-3.
Figure 2-3: GC Calibration graph

Chapter 2 44
2.3.2 Low Pressure Microreactor
2.3.2.1 Apparatus
The glassline pipework was made from Boro 3.3 Pyrex. The glassline
microreactor itself was a combination of the same Boro 3.3 Pyrex, with a
Quartz-boro transition just above the heated section of the reactor tube. The
bottom section of the reactor tube was naturally fused quartz with a 0.52
expansion rating, with a quartz sinter. The reactor tube had an internal
diameter of 22 mm.
Due to the nature of the reactor system, only the reactor itself was heated with
the use of a LPC Elements 240V tube furnace. Control of the tube furnace was
via WEST control box with a thermocouple placed within a central catalyst bed
thermowell and a trip thermocouple positioned within the tube furnace. The
exit glass tubing was connected to metal pipework link to a 6-way valve sample
loop which connected to the GC. The metal pipe work was heated to 100 ⁰C to
help prevent condensation of the products prior to the GC sample loop. This
trace heating temperature of 120 ⁰C was maintained at all times.
A single gas flow of (usually) hydrogen controlled by a rotameter was fed into
the reactor at atmospheric pressure. The H2 flow for the reduction and reaction
stages was checked each day with a digital flowmeter.
The system used a bubbler for temperature controlled introduction of the acetic
acid starting material. The feed was situated in bubbler 2 in the schematic in
figure 2-4 and the bubbler could be isolated from the rest of the system.

Chapter 2 45
Figure 2-4: Schematic of low pressure microreactor system
The bubbler contained the liquid feed, through which the gas feed was sparged
through at a rate of 60 ml min-1 H2. Control of the temperature to ~20 ⁰C was
achieved and maintained through the use of a water bath. The temperature of
the water bath was monitored throughout the reaction with the use of a digital
thermometer.
2.3.2.2 Reaction Procedure
Crushed catalyst samples (1 mL) of the fraction 250-425 µm was used for each
experiment. The catalyst sample was loaded on top of the quartz sinter, with
the gas feed flowing up through the catalyst. The reactor tube was then sealed
into the glassline with the use of black wax and the joints were leak tested to
ensure complete sealing of the system. The tube furnace was then placed
around the reactor tube and the top section insulated with glasswool.
Catalyst activation was carried out in-situ and standard reduction conditions are
shown below in table 2-7. The catalyst reduction temperatures and holds were
individually assessed for each catalyst from its TPR data. The temperatures and
holds are discussed for each reaction within the results chapters.
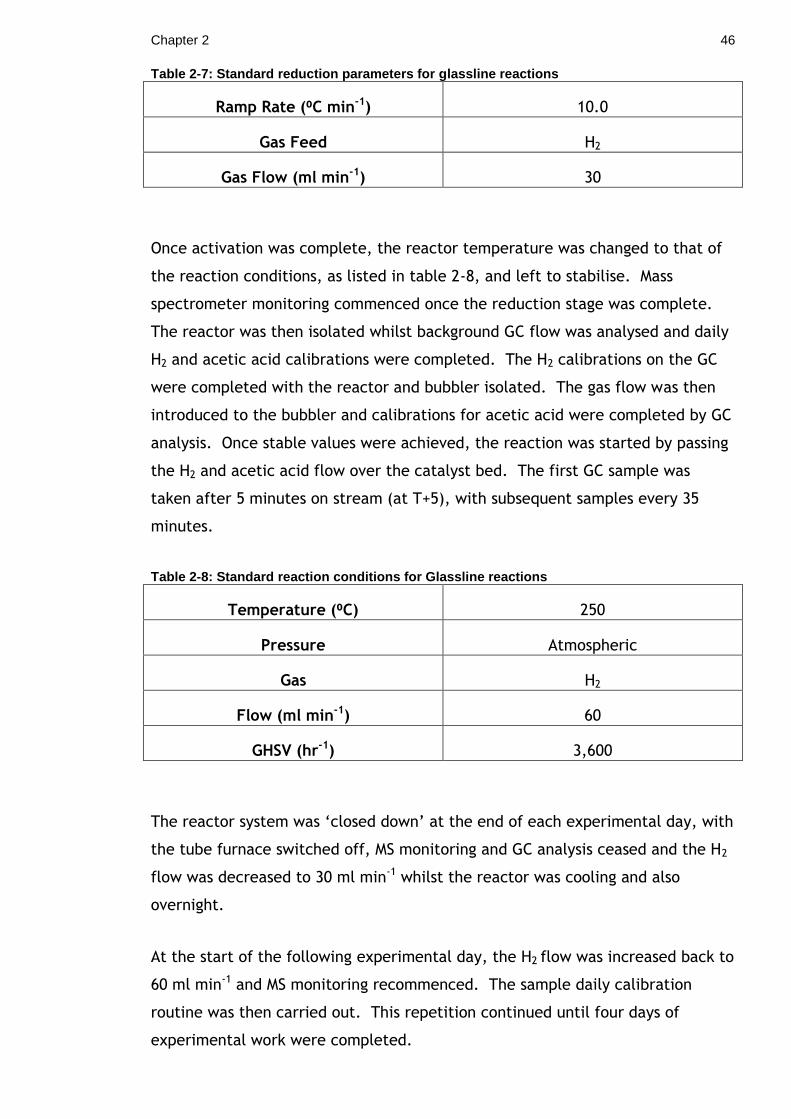
Chapter 2 46
Table 2-7: Standard reduction parameters for glassline reactions
Ramp Rate (⁰C min-1) 10.0
Gas Feed H2
Gas Flow (ml min-1) 30
Once activation was complete, the reactor temperature was changed to that of
the reaction conditions, as listed in table 2-8, and left to stabilise. Mass
spectrometer monitoring commenced once the reduction stage was complete.
The reactor was then isolated whilst background GC flow was analysed and daily
H2 and acetic acid calibrations were completed. The H2 calibrations on the GC
were completed with the reactor and bubbler isolated. The gas flow was then
introduced to the bubbler and calibrations for acetic acid were completed by GC
analysis. Once stable values were achieved, the reaction was started by passing
the H2 and acetic acid flow over the catalyst bed. The first GC sample was
taken after 5 minutes on stream (at T+5), with subsequent samples every 35
minutes.
Table 2-8: Standard reaction conditions for Glassline reactions
Temperature (⁰C) 250
Pressure Atmospheric
Gas H2
Flow (ml min-1) 60
GHSV (hr-1) 3,600
The reactor system was ‘closed down’ at the end of each experimental day, with
the tube furnace switched off, MS monitoring and GC analysis ceased and the H2
flow was decreased to 30 ml min-1 whilst the reactor was cooling and also
overnight.
At the start of the following experimental day, the H2 flow was increased back to
60 ml min-1 and MS monitoring recommenced. The sample daily calibration
routine was then carried out. This repetition continued until four days of
experimental work were completed.

Chapter 2 47
2.3.2.3 Gas Chromatography
Analysis of reaction samples was carried out by gas chromatography, with
samples taken at 35 minute intervals. The GC used was a Varian 330 with a TCD
detector. The column used for analysis was a CB Wax 52 (capillary column)
(30m, 0.53 mm). The chromatography data was integrated and printed out using
a HP 3396 Series II Integrator. Calibrations were carried out daily for both the
H2 and acetic acid to demonstrate stability and have reference values for the
reaction.
The calibrations for the reactants and products on the low pressure microreactor
were achieved through the temperature control of the bubbler and the
corresponding vapour pressure calculations.
Calculation of the vapour pressures of each reactant and product was completed
using the Clausius - Clapeyron relationship seen below in equation 3.
2
1
1
1
1
2ln
TTR
H
P
P vap
Equation 3: Clausius – Clapeyron Equation
Where: R = Universal gas constant ΔHvap = Enthalpy of vapourisation P1 = Known vapour pressure (kPa) at temperature T1 P2 = Unknown vapour pressure (kPa) T1 = Known temperature (K) at vapour pressure P1 T2 = Recorded temperature of bubbler (K)
The vapour pressures were calculated for each reactant and products at three
different temperatures using literature data [46] and were included into the
Clausius-Clapeyron equation. The ideal gas equation (equation 4) was then used
to number of moles corresponding to that vapour pressure. All this data was
combined for the calibration step on the low pressure microreactor.
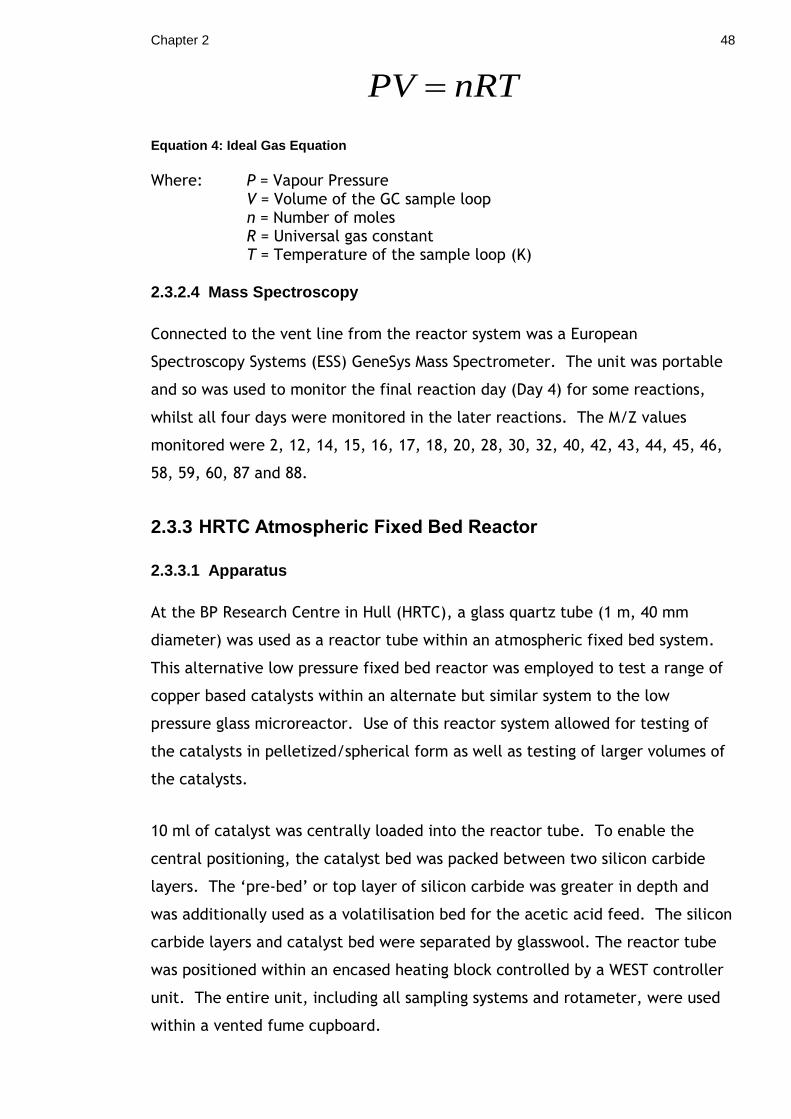
Chapter 2 48
nRTPV
Equation 4: Ideal Gas Equation Where: P = Vapour Pressure V = Volume of the GC sample loop n = Number of moles R = Universal gas constant T = Temperature of the sample loop (K)
2.3.2.4 Mass Spectroscopy
Connected to the vent line from the reactor system was a European
Spectroscopy Systems (ESS) GeneSys Mass Spectrometer. The unit was portable
and so was used to monitor the final reaction day (Day 4) for some reactions,
whilst all four days were monitored in the later reactions. The M/Z values
monitored were 2, 12, 14, 15, 16, 17, 18, 20, 28, 30, 32, 40, 42, 43, 44, 45, 46,
58, 59, 60, 87 and 88.
2.3.3 HRTC Atmospheric Fixed Bed Reactor
2.3.3.1 Apparatus
At the BP Research Centre in Hull (HRTC), a glass quartz tube (1 m, 40 mm
diameter) was used as a reactor tube within an atmospheric fixed bed system.
This alternative low pressure fixed bed reactor was employed to test a range of
copper based catalysts within an alternate but similar system to the low
pressure glass microreactor. Use of this reactor system allowed for testing of
the catalysts in pelletized/spherical form as well as testing of larger volumes of
the catalysts.
10 ml of catalyst was centrally loaded into the reactor tube. To enable the
central positioning, the catalyst bed was packed between two silicon carbide
layers. The ‘pre-bed’ or top layer of silicon carbide was greater in depth and
was additionally used as a volatilisation bed for the acetic acid feed. The silicon
carbide layers and catalyst bed were separated by glasswool. The reactor tube
was positioned within an encased heating block controlled by a WEST controller
unit. The entire unit, including all sampling systems and rotameter, were used
within a vented fume cupboard.

Chapter 2 49
The acetic acid feed to the reaction was controlled by a syringe pump where the
acetic acid was introduced into the reactor through a stainless steel needle at a
rate of 4 ml hr-1 for the 20 mol.% acetic acid feed reactions. The tip of the
syringe needle was positioned touching the silicon carbide ‘pre-bed’ so
volatilisation occurred on silicon carbide. In this study, the silicon carbide was
used as an inert packing material within the reactor system. Silicon carbide, or
carborundum, is often labelled as a non-microporous ‘inert’ material [44]. Gas
flow rates were controlled using a rotameter which was calibrated using a digital
flow meter. The standard flow was 100 ml min-1 for the H2 flow.
No online GC analysis was available with this reactor system, so alternatively a
daily liquid sample was collected using a condenser at 19 ⁰C and the exit gas
flow was collected in a SKC Quality sample bag for offline analysis.
The syringes and gas bags were checked for compatibility with acetic acid and
showed suitable viability within the system. A new syringe was used each day
for the acetic acid to minimise degradation and the possibility of failure.
2.3.3.2 Reaction Procedure
Figure 2-8 shows a schematic diagram for the setup of the reactor apparatus. 10
ml of the catalyst was loaded into the reactor tube which was centrally
positioned between two layers of silicon carbide packing material and glasswool,
as shown in figure 2-5.
The syringe feed was positioned so that it touched the surface of the silicon
carbide pre-bed to allow for complete volatilisation of the acetic acid feed.

Chapter 2 50
Figure 2-5: Schematic of HRTC glass atmospheric fixed bed reactor system

Chapter 2 51
Figure 2-6: Photo of HRTC atmospheric fixed bed reactor (when loaded) (40 mm diameter, 1 m length quartz tube)
In-situ activation of the catalyst was carried out with a H2 flow. The activation
conditions for all the catalysts tested are shown in table 2-9. No sampling
occurred during the reduction step, with the H2 exit flow vented at the rear of
the fume cupboard.
Table 2-9: Standard reduction conditions for HRTC atmospheric fixed bed reactions
Flow rate (ml min-1 H2) 100
Temperature (⁰C) 250
Ramp Rate (⁰C min-1) 10
Dwell (mins) 60

Chapter 2 52
Once the activation stage was complete the reaction could be started
immediately, as the temperature and gas flow rate were the same for the
reduction and reaction stages. The gas sample bag was attached to the exit
vent and the syringe pump was started to introduce acetic acid to the system.
The reaction was then run for four hours under the conditions stated in table 2-
10.
Table 2-10: Standard reaction conditions for Hull Glassware reactions
Temperature (⁰C) 250
Pressure Atmospheric
Gas Flow (ml min-1 H2) 100
Volume of catalyst (ml) 10
GHSV (hr-1) ~ 750
Acetic Acid Feed (ml hr-1)
(via syringe pump)
4
(20 mol.% acetic Acid)
(Except for AL6, which was 10 mol.% acetic acid, so 2 ml hr-1)
Once the four hour reaction period was completed, the acetic acid feed was
stopped. Subsequently, the gas flow was changed to 100 ml min-1 N2, the
heating block was turned off and the reactor was left to cool overnight.
2.3.3.3 Product Analysis
Liquid Samples
The liquid samples were analysed by GC and ICP-MS at HRTC. GC analysis
required two different methods for the major and minor component analysis. To
determine the major components a polar column was utilised under temperature
programmed conditions and detection was by TCD. Quantification for this
method was by the addition of an internal standard and the limit of
quantification was 0.1 % m/m. To determine minor and low level components, a
more polar column was used under temperature programmed conditions, and

Chapter 2 53
detection was by FID. Quantification for this method is by external standard
with a typical limit of quantification of 10 ppm m/m.
Gas Samples
The gas samples from the sampling bags were also submitted for analysis. The
GC compositional analysis included identification of various hydrocarbons at low
percentage levels. The analysis was performed on two different GC systems
incorporating a variety of columns capable of analysing vapour streams.
Detection is by FID and TCD, and the limit of quantification for most components
is 0.05 % v/v, but this is dependent on the particular method in question.
ICP-MS Analysis
Additionally the liquid samples were submitted for multi-element analysis by
ICP-MS for quantification of the potential leaching of metals from the catalysts
during the reactions.
Fully quantitative simultaneous multi-element quantification was performed by
inductively coupled plasma mass spectrometry (ICP-MS 7500ce, Agilent
Technologies). ICP-MS analysis was carried out using Octapole Reaction System
(ORS) technology for the simple removal of spectral interferences. This is
achieved by the introduction of hydrogen (reaction mode) and/or helium
(collision mode). The ICP-MS was tuned prior to analysis using a certified tune
solution to ensure satisfactory instrument performance.
Sample solutions (2 %) were prepared. Approximately 1 g sample was weighed
directly into Sarstedt polypropylene sample tubes. Samples were made up to a
known volume using 2 % nitric acid (Romil-SpA Super Purity Acid) in high purity
water (Milli-Q, 18 MΩ.cm).
Calibration standards (0, 5, 10, 20 & 100 ppb) were prepared using traceable
certified calibrations standards. Any instrumental drift occurring during the
analysis was corrected for using a certified internal standard solution. Quality
control samples of known concentration were analysed at regular intervals to
assess ICP-MS performance. The results were reported in ppb. The high zinc

Chapter 2 54
values observed with the ICP-MS analysis were confirmed by ICP-OES analysis
(Thermo Scientific, iCAP 6500 Duo).
2.3.4 Materials
The table below displays the chemicals used in the reactions, for GC calibration
standards and for catalyst preparation. In addition, it also lists the
commercially available catalysts that were tested in this investigation. The
chemicals listed were used without any additional purification.
Table 2-11: Gases used for the reactions, calibrations and characterisation techniques
Compound Purity (%) Supplier
2%O2/Ar --- BOC
2% CO/Ar --- BOC
2% CO2/Ar --- BOC
5%H2/N2 --- BOC
Air --- BOC
Argon 99.998 BOC
Carbon Dioxide 99.99 BOC
Carbon Monoxide 99.99 BOC
Deuterium >99.9 (99.8 isotopic) BOC
Dimethyl Ether (DME) 99+ Sigma Aldrich
Ethane 100 BOC
Helium 100 BOC
Hydrogen 99.995 minimum BOC
Methane 99.5 BOC
Nitrogen 100 BOC
Table 2-12: Reactants and products used for reactions and GC calibrations
Compound Purity (%) Supplier
Acetaldehyde 99 Aldrich
Acetic Acid 100 AnalaR NORMAPUR
Acetone HPLC Grade Fisher Scientific
Ethanol 99.99 Fisher Scientific
Ethyl Acetate 99.5 minimum Sigma Aldrich
Methanol 99.99 Fisher Scientific
Methyl Acetate 99 Sigma Aldrich
Methyl Formate 99 Sigma Aldrich
Water HPLC Gradient Grade Fisher Scientific
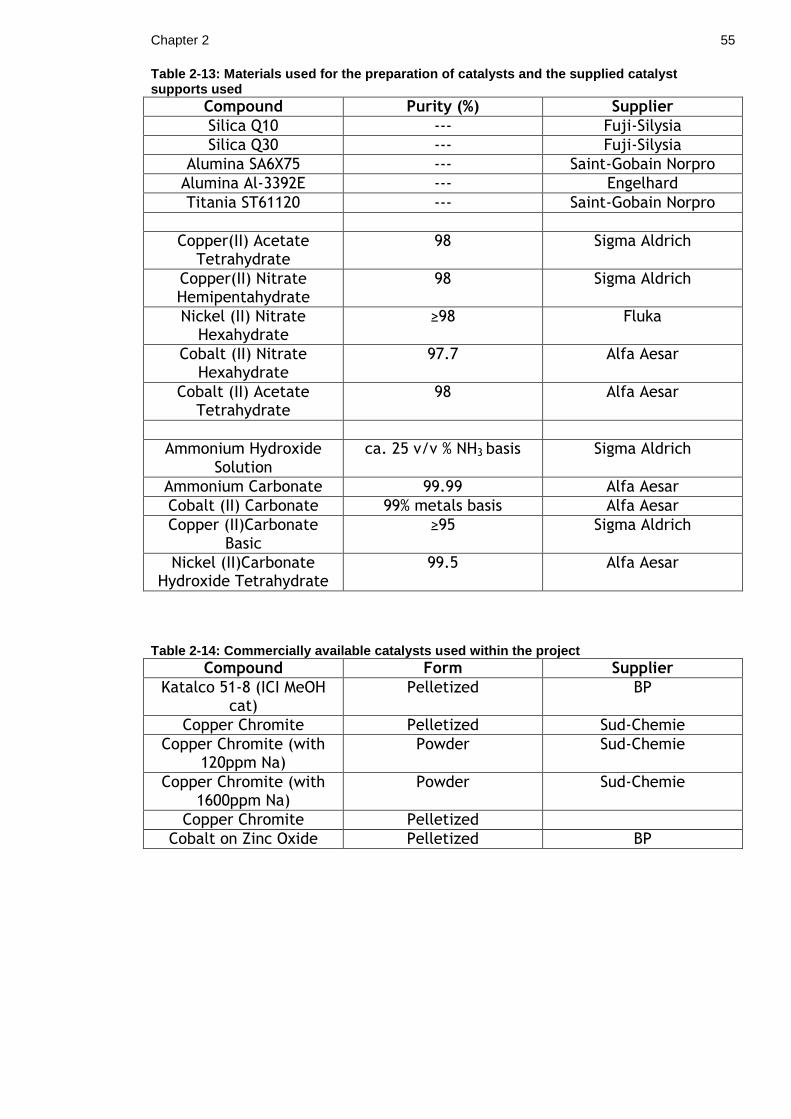
Chapter 2 55
Table 2-13: Materials used for the preparation of catalysts and the supplied catalyst supports used
Compound Purity (%) Supplier
Silica Q10 --- Fuji-Silysia
Silica Q30 --- Fuji-Silysia
Alumina SA6X75 --- Saint-Gobain Norpro
Alumina Al-3392E --- Engelhard
Titania ST61120 --- Saint-Gobain Norpro
Copper(II) Acetate Tetrahydrate
98 Sigma Aldrich
Copper(II) Nitrate Hemipentahydrate
98 Sigma Aldrich
Nickel (II) Nitrate Hexahydrate
≥98 Fluka
Cobalt (II) Nitrate Hexahydrate
97.7 Alfa Aesar
Cobalt (II) Acetate Tetrahydrate
98 Alfa Aesar
Ammonium Hydroxide Solution
ca. 25 v/v % NH3 basis Sigma Aldrich
Ammonium Carbonate 99.99 Alfa Aesar
Cobalt (II) Carbonate 99% metals basis Alfa Aesar
Copper (II)Carbonate Basic
≥95 Sigma Aldrich
Nickel (II)Carbonate Hydroxide Tetrahydrate
99.5 Alfa Aesar
Table 2-14: Commercially available catalysts used within the project
Compound Form Supplier
Katalco 51-8 (ICI MeOH cat)
Pelletized BP
Copper Chromite Pelletized Sud-Chemie
Copper Chromite (with 120ppm Na)
Powder Sud-Chemie
Copper Chromite (with 1600ppm Na)
Powder Sud-Chemie
Copper Chromite Pelletized
Cobalt on Zinc Oxide Pelletized BP

56
3 Results and Discussion
3.1 Copper Catalysts
Copper based catalysts were the first range of catalysts tested for use as acetic
acid hydrogenation catalysts. Initial testing started with a commercially
available methanol synthesis catalyst. Subsequent testing looked at other
supported copper systems, at a variety of metal loadings by impregnation, and
copper chromite catalysts. Each of these will be discussed within this chapter.
3.1.1 Methanol Synthesis Catalyst
The choice of a methanol synthesis catalyst followed on from research into the
effect of acetic acid within a feed stream over a methanol synthesis catalyst [1].
The specific methanol synthesis industrial catalyst that was used for this study
was Johnson Matthey’s co-precipitated Katalco 51-8, and hereafter is referred to
as MeOHSC. The methanol synthesis catalyst is a copper based catalyst using an
alumina support and zinc oxide stabiliser/ promoter component.
3.1.1.1 Characterisation
X-Ray Diffraction (XRD)
The pelletized catalyst was received pre-calcined and subsequently was crushed
for XRD analysis. This allowed for the determination of the composite
compounds and the copper phase in the calcined catalyst form.

Chapter 3.1 57
Figure 3-1: XRD pattern of commercial methanol synthesis catalyst
Features that were attributable to the presence of CuO and ZnO were visible
within the XRD pattern in figure 3-1. The peaks at 35.5⁰ and 38.8⁰ are
attributable to CuO. Using the Scherrer equation, the CuO average particle size
was calculated to be 4.6 nm using the CuO peak at 35.5⁰. Other components of
the Katalco 51-8 catalyst are aluminium oxide and zinc oxide. Features
corresponding to zinc oxide were also identified in the XRD pattern in figure 3-1
with peaks seen at 31.8⁰, 47.6⁰ and 62.8⁰.
BET Analysis
Surface area determination analysis was carried out on the methanol synthesis
catalyst prior to reduction and is shown in table 3-1.
Table 3-1: BET analysis of commercial methanol synthesis catalyst
Catalyst Surface Area (m2/g) Pore Volume (cm3/g) Pore Diameter (nm)
MeOHSC 86 0.25 11.7
Thermogravimetric Analysis
TPR analysis of the catalysts was used to determine the temperature range over
which the copper oxide content of the catalyst was reduced to copper. The TPR
profile in figure 3-2, of the Katalco 51-8 methanol synthesis catalyst shows a

Chapter 3.1 58
large broad peak centred at 287 ⁰C with a shoulder at 374 ⁰C. With the peak
spread between 200 ⁰C and 400 ⁰C. The weight loss in the TPR profile was
calculated to be ~20 % of the total weight and was the only event seen within
the 25 ⁰C to 600 ⁰C temperature range. This weight loss corresponds to the full
reduction of the copper oxide content to metallic copper, assuming the highest
copper value of the catalyst composition of 80 %, taken from table 2-5.
Reduction and reaction temperatures greater than 300 ⁰C cannot be used with
the methanol synthesis catalyst due to the sintering of copper content [47]. This
temperature limitation is extended to all copper containing catalysts, if the
integrity of the copper particle size is to be maintained.
Figure 3-2: TPR of commercial methanol synthesis catalyst
DSC monitoring of the TPR profile shows that the event between 200-400 ⁰C is
actually two shouldering exothermic events. These shouldering events are also

Chapter 3.1 59
seen in the mass spectrometry (MS) data in Figure 3-3.
Figure 3-3: MS Summary for Methanol Synthesis catalyst TPR
Significant hydrogen (MS 2) uptake was observed across the 200 - 400 ⁰C range in
figure 3-3, with a corresponding evolution of water (MS 18). This is the expected
profile for the reduction of the high copper content of the methanol synthesis
catalyst from the copper oxide to the reduced copper metal species. From this
TPR data within a 5 % H2/N2 atmosphere, reduction conditions for the methanol
synthesis catalyst were established. The broad thermal event in the TPR is
centred on 300 ⁰C suggested this is the optimal range for the reduction process
to occur at. However, the reduction temperature was lowered to 250 ⁰C to
minimise the amount of thermal sintering that would occur during the reduction
step, as it is known that increased copper sintering is observed at temperatures
of 300 ⁰C and above [6]. This lowering of the reduction temperature within the
reactor systems is compensated for by the increase in hydrogen concentration to
100 % H2 within the reducing atmosphere compared to 5 % H2 in the TGA. The
differentiation between the availability of hydrogen in the two systems is
important as an increased concentration of hydrogen will produce a more
powerful reducing atmosphere. With a stronger reducing atmosphere, lower
temperatures are often required to achieve the same reduction effect of lower
hydrogen concentrations at higher temperatures.

Chapter 3.1 60
Table 3-2: Conditions for the reduction of methanol synthesis catalyst
Ramp Rate (⁰C min-1) Temperature (⁰C) Hold (mins)
10.0 250 240
3.1.1.2 Catalyst Testing: BERTY
The testing of the methanol synthesis catalyst Katalco 51-8 within the high
temperature, high pressure non-differential BERTY reactor allowed for
comparative work against the previous acetic acid feed study [1], which had
comparable results to those observed within this project. This initial testing was
important to establish the effect of acetic acid on the catalyst, including the
support, stabiliser/promoter and active metal species.
Table 3-3: Reaction conditions for MeOHSC tested in BERTY reactor (B1)
Temperature (⁰C) 250
Flow (ml min-1) 190 (H2), 60 (N2)
Feed 1.5 mol.% Acetic Acid via HPLC pump
(9 µl/min)
Catalyst Weight (g)
Catalyst Volume (ml)
1.3
3.3
Pressure (barg) 50
GHSV (hr-1) ~11,000
The reaction profile in figure 3-4 shows that the methanol synthesis catalyst is
selective to ethanol. The major product from the methanol synthesis catalyst
was ethanol, with a selectivity of 34 %. A small amount of ethyl acetate is also
seen to be produced during the reaction. The production of ethyl acetate can
be viewed as a secondary reaction of the system and was expected given that an
internal recycle reactor was used.

Chapter 3.1 61
Figure 3-4: Reaction profile of B1
The averages taken from the results of the methanol synthesis catalyst over the 24 hour
reaction period can be seen in table 3-4.
Table 3-4: Conversion and selectivities from reaction B1
Sele
cti
vit
ies
(%) Ethanol 34.7
Ethyl Acetate 3.5
Acetaldehyde 0
Conversion(%) 98.8
The production of ethanol as the primary product and in high yield shows a
positive start for the investigation into copper based catalysts for acetic acid
hydrogenation. However, from the results in table 3-4, it is clear that there is a
significant proportion of the acetic acid feed that is unaccounted for within the
reaction. This observation is compounded by an average carbon balance value
of 0.3 seen throughout the reaction. One possibility is that acid laydown is
occurring on the catalyst surface, or decomposition leading to carbon laydown.

Chapter 3.1 62
The oxygen balance, however, is centred on a value of 1 throughout the
reaction. Therefore, the oxygen content within the system appears to be
accounted by the production of water throughout the reaction.
3.1.1.3 Post-Reaction Characterisation
Post-reaction characterisation was performed on crushed catalyst samples. Prior
to crushing the pellets, there was visible physical degradation of the catalyst
with cracks observed on the pellet surfaces that were not visible pre-reaction.
An additional observation was the increased ease with which the post-reaction
pellets crushed compared to those analysed pre-reaction. An adverse effect of
the acetic acid on any catalyst was to be expected given the corrosive nature of
the reactant. However, the active phase stability and the integrity of the
catalyst as a whole are important factors within a potential acetic acid
hydrogenation catalyst.
TPO analysis of the methanol synthesis catalyst post-reaction in figure 3-5 shows
the combustion of the organic species on the surface of the catalyst upon
exposure to a 2 % O2/Ar atmosphere with increasing temperature.
Figure 3-5: TPO of post-reaction MeOHSCrB1

Chapter 3.1 63
The post-reaction catalyst was analysed by TPO and TPO-DSC. The TPO profile
shown in figure 3-5 displays three separate events. The TPO-DSC analysis
showed that the events at 300 ⁰C and 420 ⁰C were mildly exothermic. The three
events identified on the TPO profile correspond to evolutions of CO2 in the MS
data, seen in figure 3-6, which is the full combustion product of organic species
on the catalyst.
Figure 3-6: MS (44) for methanol synthesis catalyst post-reaction B1
The MS data and TPO profile show distinct groupings for the CO2 evolutions: two
lower and one higher temperature event. This difference in the temperature at
which the carbon dioxide is evolved suggests separate types of carbonaceous
species on the catalyst. The strength of their adsorption to the catalyst will
determine the temperature at which combustion and subsequent CO2 evolution
occurs.
Further post-reaction characterisation of the catalyst included XRD analysis, the
pattern of which is shown in figure 3-7.

Chapter 3.1 64
Figure 3-7: XRD pattern and assignment for post-reaction MeOHSCrB1
Peaks in the post-reaction XRD pattern in figure 3-7 were attributable to Cu and
ZnO. Cu peaks were visible at 43.3⁰, 50.5⁰ and 74.1⁰. The Scherrer equation
was used to calculate an average Cu particle size of 9.5 nm. This is a significant
increase when compared to the pre-reaction CuO particle size which was
calculated as 3.9 nm. ZnO peaks are visible at 31.8⁰, 36.3⁰, 56.6⁰, 62.8⁰ and
67.9⁰. The particle size calculations for ZnO particles using the peak at 36.3⁰
give a value of 3.9 nm. The peaks attributable to zinc oxide display increased
peak intensity compared to the pre-reaction sample, which indicates that
increase in the crystal long range order has occurred during the reaction.
Chemical deactivation of the catalyst through sintering was expected in the
reaction given the reactivity of the acetic acid feed.
Table 3-5: BET data for comparison of pre- and post- reaction samples
Surface Area (m2/g)
Pore Volume (cm3/g)
Av. Pore Diameter (nm)
Methanol synthesis catalyst
86 0.25 11.7
MeOHSCrB1 69 0.21 12.8

Chapter 3.1 65
The characterisation data of the catalysts pre- and post-reaction by BET
significant changes in the physical characteristics of the catalyst are seen, that
may detrimentally affect the activity of the methanol synthesis catalyst. A loss
of surface area and a growth in the metal particle size was observed within the
catalyst through BET and XRD characterisation. However, these changes in the
physical parameters of the catalyst do not appear to translate into a decrease in
activity seen with the catalyst. This can be explained by the large quantity of
copper within the methanol synthesis catalyst compared to the acetic acid feed
within the system. The amount of copper that would need to be sintered or
removed from the catalyst before deactivation was observed would be much
larger than the amount currently affected by the low levels of acetic acid in the
reactor system. The results in table 3-5 show a decrease surface area which
would correspond to the collapse of the porous structure and a reduction in the
catalyst surface area due to sintering of the copper metal particles and the
anticipated reaction of the zinc oxide component with the acetic acid feed. A
possible explanation for the poor mass balance within these reactions is that the
acetic acid has reacted with the ZnO stabiliser component and produced
alternative products, such as zinc acetate, within the catalyst pellets.
3.1.2 Impregnated Copper Catalysts
Following the testing of the methanol synthesis catalyst and data from the
literature [2, 18], copper based catalysts have been identified as hydrogenators
of acetic acid. Initially, the copper catalysts being tested contained low metal
loadings to order minimise the metal content of the catalyst whilst trying to
maximise the catalytic activity. The first impregnated copper catalysts were
prepared with a nominal loading of 5 wt.% copper on a silica support (CARiACT
Q10). Characterisation and testing of the silica Q10 support and impregnated 5
wt.% and 10 wt.% copper catalysts was completed and compared to the
previously discussed methanol synthesis catalyst.
3.1.2.1 Silica Support
The silica support used was Fuji-Silysia CARiACT Q10, which was supplied as 1-2
mm spheres. XRD analysis of the silica Q10 support, shown in Figure 3-8, shows

Chapter 3.1 66
a large broad peak attributable to amorphous silica. No other features are
visible on the XRD pattern.
Figure 3-8: XRD pattern of uncalcined silica Q10
BET analysis data of the silica support is shown in table 3-6.
Table 3-6: Silica Q10 BET data
Catalyst Surface Area (cm2/g)
Pore Volume (cm3/g)
Average Pore Diameter (nm)
Q10 284 1.0 14
TPR analysis of the support was completed to identify any thermal events that
were unique to the silica support and that may also have been observed in the
impregnated catalysts.

Chapter 3.1 67
Figure 3-9: TPR profile of silica Q10
The TPR profile in figure 3-9 shows some small weight loss events around the
expected values of 100 ⁰C and further on at 367 ⁰C, the corresponding MS data
for the TPR analysis showed small peaks relating to the evolution of water (MS
17 and 18) and the uptake of hydrogen (MS 2). Importantly, the scale of the
weight loss observed with the silica support at <0.01 %/⁰C is significantly lower
than any observed with the supported metal catalysts.
XRD analysis of the calcined support gives an identical XRD pattern to that of the
uncalcined support seen in figure 3-8.
3.1.2.2 5wt. % Copper Catalysts
5 wt.% copper catalysts were the first catalysts prepared for this study. Copper
salts were impregnated on a preformed high surface area silica support. These
were the first laboratory prepared catalysts of this project. The silica support
used was Fuji-Silysia CARiACT Q10 with a surface area of around 300 m2 g-1 and a
pore volume of 1 ml g-1, described in section 3.1.2.1. Two 5 wt.% copper
catalysts were produced using two different copper salt precursors; one using
the acetate salt and the other from the nitrate salt.

Chapter 3.1 68
Characterisation
The two supported copper catalysts used were all prepared via the same method
and exhibit similar profiles for characterisation, with variation for the different
copper precursors used in the catalyst preparation step.
The initial TGA was to determine the temperature required for catalyst
calcination; the process by which the catalyst is heated in air to convert the
precursor to the metal oxide. Subsequent analysis in a reducing environment of 5
% H2/N2 for the TPR was to determine the temperature at which reduction and
activation of the catalyst occurs. The two 5 wt.% copper supported on silica
catalysts showed profiles for the TGA and TPR analysis that centre around
similar temperature events.
Figure 3-10: TGA profile of uncalcined CuAQ10
The TGA analysis of the 5 wt.% copper on silica catalyst from the acetate salt
(CuAQ10) is shown in figure 3-10. A weight loss event at 273 ⁰C, has an initial
shoulder at ~240 ⁰C which corresponds to the literature values for the
decomposition event of CuII acetate [46]. The corresponding MS data from the
TGA analysis is shown in figure 3-11. The decomposition of acetate groups has
been extensively documented in the literature: for example, Bowker et al.

Chapter 3.1 69
showed the autocatalytic decomposition of acetate groups in on oxidised
surfaces and Rh (110) and Pd (110) crystals [16, 33, 48].
Figure 3-11: TGA-MS profile of uncalcined CuAQ10
The TGA event in figure 3-10, prior to 100 ⁰C corresponds to the loss of H2O from
the catalyst. The shoulder at the start of the acetate decomposition profile
correlates to the uptake of O2 by the catalyst and the corresponding evolution of
H2O, CO2 and the MS fraction 2. The same analysis was completed with the 5
wt.% copper on silica catalyst produced using the nitrate salt (CuNQ10) and can
be observed in the figures 3-12 and 3-13.

Chapter 3.1 70
Figure 3-12: TGA profile of uncalcined CuNQ10
In figure 3-12, the TGA profile of CuNQ10 shows a sharp event at 227 ⁰C. The
corresponding MS data, in figure 3-12, shows that the small event prior to 100 ⁰C
is the evolution of water as would be expected. The sharp peak at 227 ⁰C
corresponds to peaks for the evolution of H2, NO, N2O and H2O. A MS peak for
NO (MS 30), seen in figure 3-13, is the predominant feature for the shoulder
observed at 267 ⁰C.

Chapter 3.1 71
Figure 3-13: TGA-MS profile of uncalcined CuNQ10
Calcination of the catalysts was carried out in the tube furnace to a temperature
of 250 ⁰C as identified from the TGA profiles. The slightly different breakdown
patterns are in line with the degradation observed for nitrates and acetates.
Temperature-Programmed Reduction
Analysis of the calcined catalysts via TPR on the TGA-DSC-MS was used to obtain
appropriate reduction conditions for each of the catalysts. The two copper
supported on silica catalysts showed similar TPR profiles as expected due to the
reduction being the conversion of the copper oxide species to copper. TPR
analysis of CuAQ10 is shown in figure 3-14.

Chapter 3.1 72
Figure 3-14: TPR profile of calcined CuAQ10
The corresponding MS profile only shows a small uptake of H2 at the event at 278
⁰C and the evolution of H2O (MS 17 and 18) for the two shouldering events
around 300 ⁰C. The expectation is that the events observed are the two stage
reduction of Cu2O and CuO on to metallic copper.
TPR analysis was also completed for CuNQ10. The profile showed a sharp weight
loss event at 280 ⁰C in figure 3-15.

Chapter 3.1 73
Figure 3-15: TPR of calcined CuNQ10
MS data showed that the small weight loss at around 100 °C had corresponding
MS peaks for the evolution of H2O (MS 17 and 18). The sharp weight loss event
at 280⁰C corresponds with an exothermic event with an uptake of H2 (MS 2).
This uptake of hydrogen corresponds to the reduction of the copper oxide
species to the metallic reduced copper species and the corresponding evolution
of H2O (MS 17 and 18) was observed. From the TPR profiles seen in figures 3-14
and 3-15, the reduction conditions were established for the two 5 wt.% copper
on silica catalysts. The conditions are tabulated in table 3-7.
Table 3-7: Reduction conditions for CuAQ10c and CuNQ10c
Catalyst Max Temp (⁰C) Ramp Rate (⁰C/min) Hold (mins)
CuAQ10c 250 10.0 180
CuNQ10c 250 10.0 180
In much of the TGA analysis described above, changes in the copper species in
the catalyst were expected as a consequence of either the oxidising or reducing
atmosphere that the catalyst is subjected to. XRD analysis was used to
characterise the copper species present with the catalyst at the uncalcined and

Chapter 3.1 74
calcined stages. XRD analysis of the CuNQ10 catalyst in figure 3-16 shows the
presence of copper nitrate species within the uncalcined catalyst sample, as
expected. This is because the nitrate salt was used for the preparation of this
catalyst. The pattern in figure 3-16 of the calcined CuNQ10 sample shows a
change in the copper species present in the catalyst. The features attributable
to the copper nitrate salt are no longer visible, whilst features attributable to
CuO are visible against the silica background post-calcination. This oxidation of
the copper nitrate species to CuO corresponds to the transformation of the
copper species upon calcination.
Figure 3-16: XRD pattern of uncalcined and calcined CuNQ10
Further analysis of the calcined CuNQ10 by hot-stage XRD under a 5 % H2/N2
atmosphere, which was used to determine the phases present in the catalyst
after reduction. The profiles are shown in figure 3-17.

Chapter 3.1 75
Figure 3-17: Hot-Stage XRD patterns of CuNQ10c at 25⁰C, 100⁰C, 200⁰C, 300⁰C and 400⁰C
The hot-stage XRD patterns show the temperature dependent reduction of the
copper oxide species (CuO) in CuNQ10 to metallic copper (Cu). A large broad
peak centring around 22⁰, which was previously assigned to the amorphous silica
support, is the other consistent peak within each temperature scan. The analysis
was completed with the CuAQ10 catalyst at both the uncalcined and calcined
stages and is shown in figure 3-18.

Chapter 3.1 76
Figure 3-18: XRD patterns of uncalcined and calcined CuAQ10 samples
The XRD pattern of the uncalcined CuAQ10 catalyst sample had no observable
peaks, possibly due to their amorphous nature or the small crystallite size of the
copper species. Post calcination features, attributable to Cu2O, became visible
demonstrating the expected oxidation of the copper content. Subsequent hot-
stage analysis of the CuAQ10 sample, shown in figure 3-19, shows the reduction
of the Cu2O species to Cu metal under a heated reducing atmosphere.

Chapter 3.1 77
Figure 3-19: Hot-stage XRD patterns of CuAQ10c at 25 ⁰C, 100 ⁰C, 200 ⁰C, 300 ⁰C and 400 ⁰C
By looking at the two different precursor salts used in the preparation of the 5
wt.% copper catalysts, two separate thermal decomposition routes producing
two different copper oxides at the post-calcination stage are visible. These
different copper oxides (Cu2O and CuO) reduce at slightly different
temperatures, as can be seen previously in the TPR profiles in figures 3-14 and 3-
15. The copper species observed, dependent upon the precursor used, are
shown below in figure 3-20.
Figure 3-20: Copper reduction routes

Chapter 3.1 78
3.1.3 Catalytic Testing: BERTY reactor
After identifying that the 5 wt.% impregnated copper catalysts would be active
due to the presence of copper within the catalyst, an initial check was made on
the activity of the silica support within the reactor system too. The catalyst
support, Q10, underwent the same calcination and reduction conditions as the
copper based catalysts to ensure consistency in experimental parameters. The
standard reaction conditions, shown in table 3-8, are the same conditions as
those used for testing of the methanol synthesis catalyst in section 3.1.1.2.
Table 3-8:Standard reaction conditions for testing in the BERTY reactor
Temperature (⁰C) 250
Flow (ml min-1) 190 (H2), 60 (N2)
Feed 1.5 mol.% Acetic Acid via HPLC pump
(9 µl/min)
Catalyst Weight (g)
Catalyst Volume (ml)
1.3
3.3
Pressure (barg) 50
GHSV (hr-1) ~4,500
It can be observed from the reaction profile in figure 3-21, that the major
product for the CuNQ10c catalyst within the BERTY reactor was ethyl acetate.
The product of ethyl acetate is considered as a secondary reaction within this
system, given the need for the initial hydrogenation of acetic acid to ethanol
before the ‘secondary’ esterification reaction can occur. Clearly visible within
the reaction profile is variance in the product concentration that appears almost
cyclical. A reaction profile including the nitrogen marker is seen in figure 3-22.

Chapter 3.1 79
Figure 3-21: Reaction profile for CuNQ10 BERTY reaction
Figure 3-22: Reaction profile for CuNQ10 BERTY reaction, normalised to nitrogen feed marker
The use of nitrogen as an ‘inert’ marker within the system was used to explain
the cyclical variance seen within the reaction profile, over the 24 hour reaction
period. Upon analysis of the nitrogen marker, the nitrogen values mirrored
those of the organic products. The combination of the moles of products and

Chapter 3.1 80
nitrogen gave stable samples sizes throughout the reactions. The CuNQ10
catalyst was selective to ethyl acetate and the level of ethanol that was not
esterified appeared to remain relatively steady throughout the reaction. The
carbon and oxygen balance for the reaction again follows the oscillations of the
reaction profile, but varies within the range of 0.6 - 1.
The same reaction profile approach was employed with the CuAQ10 catalyst. It
was observed that for both 5 wt.% copper catalysts, tested in the BERTY reactor,
ethyl acetate was the major product. The rate of product of ethanol and the
subsequent conversion to ethyl acetate remain relatively consistent through the
reaction. Additionally, it was observed was that the 5 wt.% copper catalysts
gave significantly lower conversions of acetic acid than the methanol synthesis
catalyst.
Table 3-9: Selectivities and conversions of the 5 wt.% Cu catalysts
CuNQ10rB2 CuAQ10rB3
Sele
cti
vit
ies
(%)
Ethanol 5.7 3.3
Ethyl Acetate 67.8 63.3
Acetaldehyde 0 0
Conversion (%) 90.6 88.6
For both reactions, fluctuations were seen in the product stream. One possible
explanation for this oscillation pattern could be linked to the orientation of the
vapouriser. The orientation was top loading, leading to possible dripping of the
feed into the vapourising section rather than a consistent feed rate. The
pulsation of the acetic acid from the HPLC pump or the flash volatilisation of the
acetic acid dripping into the vapourising tube could explain the cyclical results.
To address these issues, the inlet to the feed inlet was orientated at 90⁰ to the
pipe direction, at the side. In addition, n-octane was inserted into the acetic
acid feed as a liquid marker: an additional internal reference within the system.

Chapter 3.1 81
3.1.3.1 Post-reaction characterisation
Post-reaction characterisation of the catalysts was carried out to establish the
effect of the reaction system upon the catalyst. Samples of the post-reaction
CuAQ10 and CuNQ10 catalysts underwent TPO analysis. The TPO profiles can be
seen in figure 3-23 and 3-25.
Figure 3-23: TPO analysis of post reaction CuNQ10
TPO analysis of the CuNQ10 catalyst sample showed a small exothermic event at
281 ⁰C, although the weight loss seen is around 0.01 %/⁰C in figure 3-23. MS
analysis during the TPO showed that the weight loss at <100 ⁰C corresponded to
MS peaks for 18 and 17. The weight loss at 281 ⁰C in figure 3-22 corresponded to
MS peaks for the evolution of 44, 18, 17 and 2 and the uptake of O2 (MS 32). The
weight loss between 400-550 ⁰C corresponds to a broad evolution of CO2 (MS 44).
Figure 3-24 shows the XRD analysis of the CuNQ10 post-reaction catalyst sample,
with features attributable to metallic copper. This reduced form of the copper
was expected in the post-reaction sample, as the reducing reaction atmosphere
was expected to maintain the copper in reduced form throughout the reaction,
following the catalyst activation step.

Chapter 3.1 82
Figure 3-24: XRD pattern of post-reaction CuNQ10
The same analytical techniques were employed for the post-reaction sample of
the CuAQ10 catalyst. The TPO profile in figure 3-25 from the TGA-DSC data
shows a small exothermic event corresponding to the peak at 257 ⁰C. MS
analysis showed that the weight loss at < 100 ⁰C had peaks corresponding to the
evolution of H2O (MS 17 and 18). The weight loss event at peak at 257 ⁰C is an
exothermic event and the MS data showed the evolution of CO2 (MS 44) and H2O
(MS 17 and 18). Similarities in the post-reaction characterisation of the two 5
wt.% copper catalysts, suggests that similar acetate species are present on the
surface of the catalyst which are then oxidised during the TPO temperature
ramp.

Chapter 3.1 83
Figure 3-25: TPO analysis of post-reaction CuAQ10
Mirroring the transformation seen in the hot-stage XRD analysis of both 5 wt.%
copper catalysts, the CuAQ10 catalyst post-reaction contained reduced copper
as features for Cu were clearly visible in figure 3-26, above the silica
background.
Figure 3-26: XRD pattern of post-reaction CuAQ10

Chapter 3.1 84
3.1.3.2 Addition of a liquid marker in the feed
The activity of the CuNQ10c catalyst was also investigated with the system
modified to include the liquid marker, n-octane, in the feed. The results from
the 70 hour reaction are shown below in figure 3-27. Clearly visible from the
product profile is the effect of the introduction of n-octane, which is a decrease
in the production of ethanol, and subsequently ethyl acetate, over the same
catalyst system.
Figure 3-27: Reaction profile for CuNQ10 with n-octane (B6)
Although the inclusion of the n-octane marker in the acetic acid appears to
decrease the activity of the catalyst with respect to ethanol and ethyl acetate,
the variance in the results appears smaller than previously seen with this
catalyst. Stabilisation of the values for ethanol, ethyl acetate and acetic acid
are observed when normalised against the internal standard. The same reaction
conditions were investigated using the CuAQ10. Its major product remained
ethyl acetate as was previously seen, but in diminished levels which mirrored
the effect of the addition of n-octane to the system in the CuNQ10 reaction.
Silica Q10 was also tested and the results are shown in table 3-10 with the use of
the n-octane internal standard. The carbon and oxygen balance for these
reactions remained steady at ~0.5 for the duration of the reactions.

Chapter 3.1 85
Table 3-10: Selectivities
CATALYST
MeO
H S
C (
B1)
Q10 (
B5)
CuN
Q10 (
B2)
CuN
Q10 (
B6)
(wit
h n
-octa
ne)
CuA
Q10 (
B3)
CuA
Q10 (
B8)
(wit
h n
-octa
ne)
Sele
cti
vit
ies
(%)
Ethanol 34.7 0 5.7 0.3 3.3 0.3
Ethyl Acetate 3.5 6.4 67.8 12.2 63.3 7.4
Acetaldehyde 0 0 0 0 0 0
Conversion (%) 98.8 59.3 90.6 58.9 88.6 68.5
The selectivities of the catalysts, seen in table 3-10, showed that the methanol
synthesis catalyst was the better catalyst for the production of ethanol.
However, the 75 % selectivity and 68.5 % conversion are the averages from day
one of the four day reaction period. Over the course of the four days, the
catalyst deactivated significantly losing nearly half of its activity for ethanol
production. Lower conversions of acetic acid were observed with the 5 wt.%
copper catalysts than for the methanol synthesis catalyst. What is clearly visible
from the comparison of data above is that the addition of the n-octane to the
feed, impacts upon the conversion. A significantly increased amount of acetic
acid was seen in the product stream at the end of the reaction.
Post-reaction characterisation of the catalyst, including TPO analysis, was
completed for each of the catalysts tested with the n-octane marker. The TPO
profiles, such as for CuNQ10 in figure 3-28, all show the same sharp weight loss
event at ~287 ⁰C, mirroring what was seen for the reactions completed without
the presence of n-octane.

Chapter 3.1 86
Figure 3-28: TPO analysis of post-reaction CuAQ10
The corresponding DSC analysis showed that the sharp weight loss event at 287
⁰C seen in figure 3-28 was an exothermic event. The weight loss event was
accompanied by the evolution of CO2. This is visible within the MS data as peaks
for MS 44 and an uptake peak of O2 to facilitate the combustion. The small
weight loss at < 100 ⁰C has corresponding peaks for H2O (MS 18 and 17). The
same peak around 300 ⁰C was observed, suggesting that acetate species are also
bound to the surface of the silica support during the reaction with their
combustion is observed in the TPO. Once more, XRD analysis in figure 3-29
displays features identifying Cu as the copper species present within the catalyst
post-reaction. Analysis of the silica Q10 support samples was completed post-
reaction.
Again, XRD analysis of each of the catalyst samples post-reaction was
completed. Each of the XRD patterns for the post-reaction 5wt% copper
catalysts show features that are attributable to metallic copper.
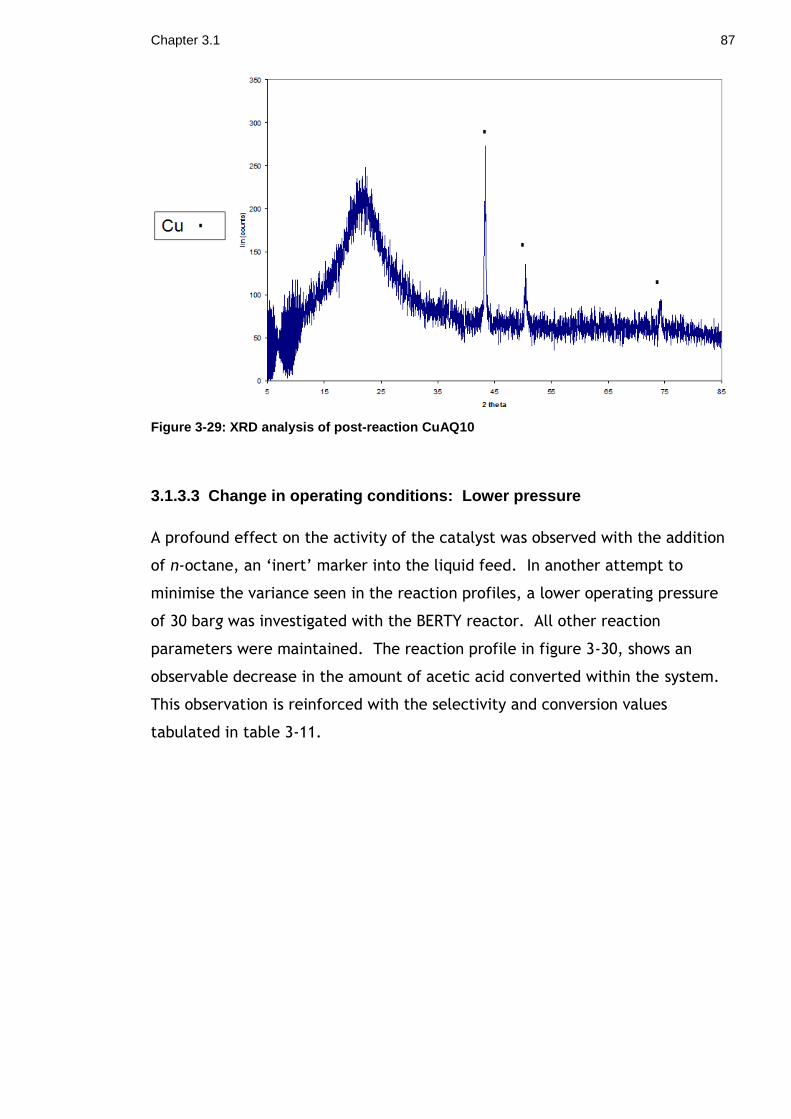
Chapter 3.1 87
Figure 3-29: XRD analysis of post-reaction CuAQ10
3.1.3.3 Change in operating conditions: Lower pressure
A profound effect on the activity of the catalyst was observed with the addition
of n-octane, an ‘inert’ marker into the liquid feed. In another attempt to
minimise the variance seen in the reaction profiles, a lower operating pressure
of 30 barg was investigated with the BERTY reactor. All other reaction
parameters were maintained. The reaction profile in figure 3-30, shows an
observable decrease in the amount of acetic acid converted within the system.
This observation is reinforced with the selectivity and conversion values
tabulated in table 3-11.

Chapter 3.1 88
Figure 3-30: Reaction profile for CuNQ10 at 30 barg.
Table 3-11: Selectivities for CuNQ10rB9 (CuNQ10 at 30 barg)
CATALYST CuNQ10 (B9) (with n-octane)
Conversion (%) 43.2
Acetaldehyde Selectivity (%) 1.8
Ethanol selectivity (%) 0.7
Ethyl Acetate Selectivity (%) 16.8
The testing at a reduced operating pressure of 30 barg appears to give a more
stable reaction. The decreased pressure used in the CuNQ10 reaction means
that ethyl acetate is seen as the major product, but the system also produces
acetaldehyde.
The same post-reaction analysis was completed on the catalysts, as before. And
the results are comparable. TPO analysis in figure 3-31 shows a sharp peak at
287 ⁰C replicating the post-reaction analysis that was seen with the catalyst
when previously tested using this reactor system.

Chapter 3.1 89
Figure 3-31: TPO analysis of CuNQ10 (reaction at 30barg)
The MS analysis shows a weight loss peak at < 100 ⁰C with a corresponding
evolution of H2O. In figure 3-31, the peak at 276 ⁰C is an exothermic event and
has corresponding MS events for the evolution of CO2, CO and the uptake of O2.
Additionally, the same Cu features were observed within the XRD pattern. The
same three peaks as were seen in figure 3-31 are observed in the post-reaction
catalyst of this lower pressure reaction.
3.1.3.4 BERTY Summary
After identifying that the copper catalysts were active, it was important to
compare the activity and the selectivity of the 5 wt.% copper catalysts to that of
the methanol synthesis catalyst which contained about 40 % copper. The
expectation was that the methanol synthesis catalyst would be markedly more
active, if only due to the significantly greater amount of the active metal phase
in the catalyst. Two 5 wt.% copper catalysts, a silica support and a commercial
methanol synthesis catalyst were all tested in a BERTY reactor. Of the catalysts
tested within this system, the methanol synthesis catalyst was the only catalyst
with majority selectivity towards ethanol.
Variance in the reaction profiles for the 5 wt.% copper catalysts lead to the
inclusion of an ‘inert’ liquid marker into the system. When the system was
normalised to the n-octane liquid marker, an effect of the octane is observed

Chapter 3.1 90
where the system appears to lose conversion towards ethanol and ethyl acetate.
This observation shows how the conversion and subsequent selectivities of a
catalytic system can be affected by the presence of additional ‘reactive’
species.
The post-reaction XRDs identify metallic Cu species within each of the catalysts
post-reaction as well as a large peak appropriate for amorphous silica. The Q10
silica support was selective to ethyl acetate. The silica support has acid sites
that may facilitate the conversion of the ethanol produced to ethyl acetate.
3.1.4 10 wt.% Copper Catalyst
Upon seeing the marked increase in activity with the methanol synthesis
catalyst, compared to the 5 wt.% impregnated copper catalysts, an increase in
activity was desired. Increasing the catalyst’s copper content was a route by
which the activity of a catalyst may be increased. As such a 10 wt.% copper
catalyst was prepared via the same impregnation route. The nitrate salt was
used for the impregnation and the same characterisation, calcination and
analysis was completed as for the 5 wt.% copper catalysts.
Decomposition of the nitrate sale precursor in the TGA analysis mirrored that
observed with the CuNQ10 catalyst (seen in figure 3-12). The TPR analysis also
followed the TPR for the CuNQ10 catalyst. The mirroring of the characterisation
profiles between the CuNQ10 and CuN(10)Q10 catalysts was to be expected.
The catalysts were prepared using the same metal precursor and impregnation
technique. The only difference was the metal loading, as the 10 wt.% copper on
silica catalyst had double the quantity of copper deposited on the support as the
5 wt.% copper catalyst.
3.1.5 Catalyst Testing: Low pressure microreactor
The hydrogenation of acetic acid to ethanol over copper based catalysts was
investigated using a low pressure microreactor. The testing procedure is
described in chapter 2.3.2 and the reaction conditions detailed in table 3-12
were maintained for all the catalysts compared in this section.
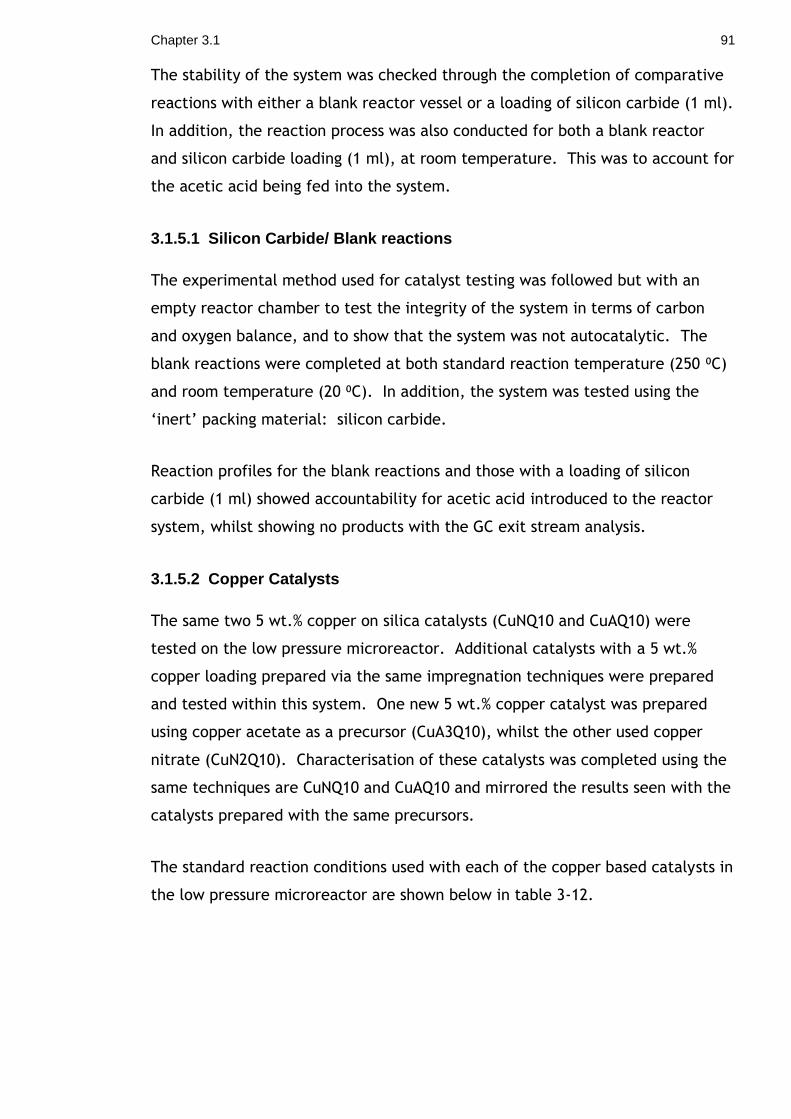
Chapter 3.1 91
The stability of the system was checked through the completion of comparative
reactions with either a blank reactor vessel or a loading of silicon carbide (1 ml).
In addition, the reaction process was also conducted for both a blank reactor
and silicon carbide loading (1 ml), at room temperature. This was to account for
the acetic acid being fed into the system.
3.1.5.1 Silicon Carbide/ Blank reactions
The experimental method used for catalyst testing was followed but with an
empty reactor chamber to test the integrity of the system in terms of carbon
and oxygen balance, and to show that the system was not autocatalytic. The
blank reactions were completed at both standard reaction temperature (250 ⁰C)
and room temperature (20 ⁰C). In addition, the system was tested using the
‘inert’ packing material: silicon carbide.
Reaction profiles for the blank reactions and those with a loading of silicon
carbide (1 ml) showed accountability for acetic acid introduced to the reactor
system, whilst showing no products with the GC exit stream analysis.
3.1.5.2 Copper Catalysts
The same two 5 wt.% copper on silica catalysts (CuNQ10 and CuAQ10) were
tested on the low pressure microreactor. Additional catalysts with a 5 wt.%
copper loading prepared via the same impregnation techniques were prepared
and tested within this system. One new 5 wt.% copper catalyst was prepared
using copper acetate as a precursor (CuA3Q10), whilst the other used copper
nitrate (CuN2Q10). Characterisation of these catalysts was completed using the
same techniques are CuNQ10 and CuAQ10 and mirrored the results seen with the
catalysts prepared with the same precursors.
The standard reaction conditions used with each of the copper based catalysts in
the low pressure microreactor are shown below in table 3-12.

Chapter 3.1 92
Table 3-12:Standard reaction conditions for microreactor reactions with copper catalysts
Reaction Temperature (⁰C) 250
Catalyst Volume (ml) 1
Gas Flow Rate (ml min-1) 60 (H2)
GHSV (hr-1) 3,600
The results for the copper based catalysts within the low pressure microreactor
are shown in table 3-13. It includes acetic acid conversion and selectivity for
each of the products seen.
Table 3-13: Selectivities and conversions of copper catalysts in low pressure microreactor
Catalyst
Q10
CuN
Q10
CuA
Q10
CuN
2Q
10
CuA
3Q
10
MeO
HSC
Sele
cti
vit
ies
(%)
Ethanol 0 0 0.4 0.9 0.3 75
Ethyl Acetate 0 1.3 0 0 0 0
Acetaldehyde 0 0 0 0 0 14.8
Conversion (%) 82.4 77.9 81.4 80.4 81.8 100
The loss of acetic acid within the system, given the initial experimentation
completed with the blank reactions, can confidently be attributed to adsorption
of acetic acid onto the silica support. This conclusion is strengthened by a
similar conversion level of 82 % observed with the silica support reaction but
without any ethanol, acetaldehyde and ethyl acetate observed within the GC
traces.
Catalytic testing of the silica support within the low pressure microreactor gave
a conversion of 82.4 %. No products, however, were observed on the GC traces,
including ethanol and ethyl acetate. The low pressure Q10 reaction yielded no

Chapter 3.1 93
products, whilst the reaction at 50 barg pressure did see the product of ethyl
acetate.
In the reaction using CuN2Q10 catalyst, there was minimal ethanol production
(0.9 %) observed even though it was the singular product in the reaction system
and the conversion of acetic acid within the system was 80.4 %, as shown in
table 3-13. No ethyl acetate or other expected products were observed on the
GC traces. This was a trend observed for all four of the 5 wt.% copper on silica
catalysts.
The data observed for the methanol synthesis catalyst is an average of the four
day reaction given that there is deactivation of the catalyst observed during the
reaction period. The methanol synthesis catalyst displays a much higher
conversion to ethanol that the other catalysts tested, but unlike the others
demonstrates deactivation.
Post-reaction characterisation of the catalyst samples was completed using TPO,
BET and XRD analysis. TPO analysis was of particular interest given that the
majority of the acetic acid being fed into the system was unaccounted for with
the silica based catalysts. Identification of the presence of carbon species on
the catalyst was confirmed by the presence of oxidation products, CO and CO2,
within the MS profile.
3.1.5.3 Silica Support
Post-reaction analysis of the silica support produced a TPO profile with a large
event around 100 ⁰C in figure 3-32. The corresponding MS data is shown in figure
3-33.
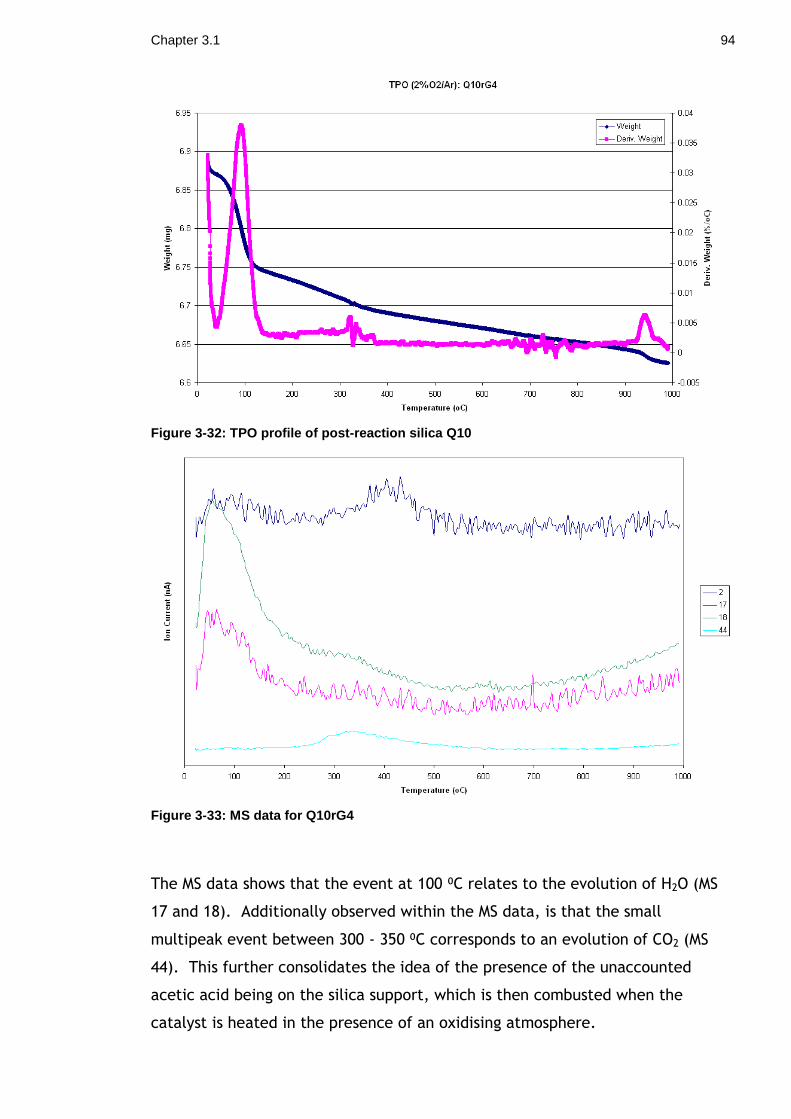
Chapter 3.1 94
Figure 3-32: TPO profile of post-reaction silica Q10
Figure 3-33: MS data for Q10rG4
The MS data shows that the event at 100 ⁰C relates to the evolution of H2O (MS
17 and 18). Additionally observed within the MS data, is that the small
multipeak event between 300 - 350 ⁰C corresponds to an evolution of CO2 (MS
44). This further consolidates the idea of the presence of the unaccounted
acetic acid being on the silica support, which is then combusted when the
catalyst is heated in the presence of an oxidising atmosphere.

Chapter 3.1 95
The XRD pattern for the post-reaction Q10 catalyst shows only the large broad
peak assignable for amorphous silica. No other species were expected to be
present within the post-reaction silica sample.
3.1.5.4 5 wt.% Copper Catalysts
The four 5 wt.% copper catalysts investigated were all characterised individually
but showed the same post-reaction profiles. As such, the post-reaction
characterisation data for CuN2Q10 is shown as an exemplar of the four 5 wt.%
catalysts. The TPO analysis yielded the profile shown below in figure 3-34.
Figure 3-34: TPO profile of CuN2Q10rG2
The TPO analysis of CuN2Q10 post-reaction shows the initial peak at 100 ⁰C in
figure 3-34 with a corresponding evolution of H2O. Additionally, a single sharp
peak was observed at 278 ⁰C. This peak has corresponding features in the MS
data in figure 3-35 for the evolution of CO2, H2O and a MS fragment (2).

Chapter 3.1 96
Figure 3-35: MS data of CuN2Q10rG2
The XRD pattern shown in figure 3-36 identifies the post-reaction copper species
as metallic copper. This is the same XRD pattern observed for the four 5 wt.%
copper catalysts analysed.
Figure 3-36: XRD pattern of CuN2Q10rG2
BET analysis was carried out on the silica Q10 support and the 5 wt.% copper
catalysts post-reaction with the data presented below in table 3-14. All the
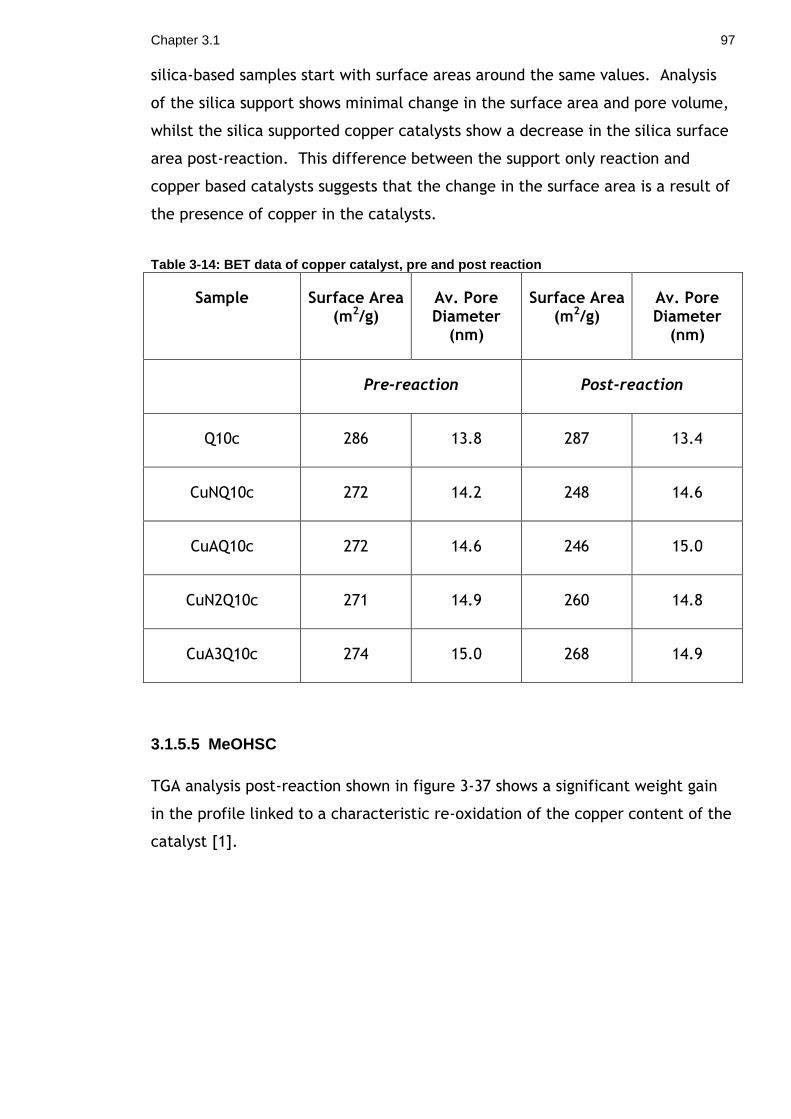
Chapter 3.1 97
silica-based samples start with surface areas around the same values. Analysis
of the silica support shows minimal change in the surface area and pore volume,
whilst the silica supported copper catalysts show a decrease in the silica surface
area post-reaction. This difference between the support only reaction and
copper based catalysts suggests that the change in the surface area is a result of
the presence of copper in the catalysts.
Table 3-14: BET data of copper catalyst, pre and post reaction
Sample Surface Area (m2/g)
Av. Pore Diameter
(nm)
Surface Area (m2/g)
Av. Pore Diameter
(nm)
Pre-reaction Post-reaction
Q10c 286 13.8 287 13.4
CuNQ10c 272 14.2 248 14.6
CuAQ10c 272 14.6 246 15.0
CuN2Q10c 271 14.9 260 14.8
CuA3Q10c 274 15.0 268 14.9
3.1.5.5 MeOHSC
TGA analysis post-reaction shown in figure 3-37 shows a significant weight gain
in the profile linked to a characteristic re-oxidation of the copper content of the
catalyst [1].

Chapter 3.1 98
Figure 3-37: TPO profile of MeOHSCrG5
A significant weight gain is an unusual feature in TPO analysis. The explanation
for this weight gain is the reoxidation of the high levels of copper present in the
catalyst which are in metallic form post-reaction. The corresponding large
uptake of O2 links with copper reoxidation step.
The XRD pattern in figure 3-38 shows post-reaction characterization of the
methanol synthesis catalyst. Features within the pattern are assignable to
metallic copper as would be expected post-reaction, given the reducing reaction
atmosphere.

Chapter 3.1 99
Figure 3-38: XRD pattern of MeOHSCrG5
3.1.5.6 10 wt.% copper catalyst
The 10 wt.% copper catalyst was additionally tested within the low pressure
microreactor. The conversion and selectivities of this catalyst are shown in
table 3-15.
Table 3-15: Conversion and selectivities of 10 wt.% copper on silica catalyst
Conversion (%) 6.0
Acetaldehyde Selectivity (%) 0
Ethanol selectivity (%) 5
Ethyl Acetate Selectivity (%) 8.3
The higher copper loading catalyst appears not to be the same ‘sink’ for acetic
acid as that of the 5 wt.% copper catalysts and the silica support itself. It is,
unsurprisingly, more active for the hydrogenation of acetic acid to ethanol,
although the esterification to ethyl acetate is also facilitated. This similar to

Chapter 3.1 100
the 5 wt.% copper on silica catalysts where the esterification activity can be
attributed to the silica support rather than the copper species.
Figure 3-39: XRD pattern for 10 wt.% copper on silica catalyst
Table 3-16: BET analysis of pre- and post-reaction 10 wt.% copper catalyst
Sample Surface Area
(m2/g)
Av. Pore
Diameter
(nm)
Surface Area
(m2/g)
Av. Pore
Diameter
(nm)
Pre-reaction Post-reaction
CuN(10)Q10rG19 247 14.1 223 14.1
The largest decrease in catalyst surface area was seen for CuN(10)Q10, which
contained the largest amount of copper of the impregnated copper on silica
catalysts. The large amount of copper has the propensity to sinter throughout
the catalyst, causing large changes to the attributes of the catalyst.
3.1.5.7 Summary
The testing completed using the low pressure microreactor encompassed 5 wt.%
and 10 wt.% copper on silica catalysts and a commercial methanol synthesis

Chapter 3.1 101
catalyst. It also included the silica support upon which the copper /silica
catalysts were prepared. The higher copper content of the methanol synthesis
catalyst has shown superior activity for ethanol production, and the link
between copper content and activity is further proven by the increased activity
of the 10 wt.% copper catalyst over that of its 5 wt.% counterparts. Despite this
observed increase in activity, the 10wt% copper on silica catalyst also facilitates
the secondary esterification reaction through to ethyl acetate. Optimisation of
the behaviour would limit its esterification abilities, as well as increasing
activity to the levels of the methanol synthesis catalyst and above. Other
copper based systems that were qualified with respect to higher copper content
were copper chromite systems. These are discussed below.
3.1.6 Copper Chromite catalysts
It was clear from the activities displayed by the 5 wt.% copper catalysts, and the
subsequent increase in activity upon doubling of the metal loading, that there
was a correlation between activity and copper content, as was previously
predicted. Following this trend, another high copper content catalyst was
tested, in addition to the methanol synthesis catalyst, Katalco 51-8. Copper
chromite catalysts were commercially available options that fulfilled the
required criteria of high copper content.
Four different copper chromite catalysts were tested. This included two sodium
doped copper chromite catalysts, as mentioned in section 2.1.3.2. The best
activities were seen with the undoped copper chromite catalyst (CuChr) and the
pelletized copper chromite catalyst (CuCr). The conversions and selectivities of
the copper chromite catalysts, compared to the other copper catalysts, are
shown in table 3-17.

Chapter 3.1 102
Table 3-17: Copper catalysts conversions and selectivities
Catalyst
Q10
CuN
Q10
CuA
Q10
CuN
2Q
10
CuA
3Q
10
MeO
HSC
CuC
hr
CuC
r
Sele
cti
vit
ies
(%)
Acid to Ethanol (%) 0 0 0.4 0.9 0.2 0 6.6 10.5
Acid to Ethyl
Acetate (%)
0 1.3 0 0 0 75 0 0
Acid to
Acetaldehyde (%)
0 0 0 0 0 14.8 0 0
Conversion (%) 82.4 77.9 81.4 80.4 81.8 100 76.9 72.6
The copper chromite and methanol synthesis catalysts are the most active of the
copper catalysts tested, although different product profiles are achieved
dependent upon the catalyst used. The copper chromite catalyst produces
ethanol as its major product, whilst the methanol synthesis further esterifies the
ethanol produced to ethyl acetate.
The copper chromite catalysts displayed significant increases in activity relative
to the impregnated copper catalysts. However, they were not viewed as a
viable option due to issues related to use of chromium compounds within
catalytic systems (CuChr and CuCr contained CuCr2O4), and due to the
pyrophoric nature of the catalysts. Despite not continuing to test these systems
further, the results from the low pressure microreactor further confirmed the
correlation between copper content and activity. Post-reaction analysis of the
copper chromite catalysts was not performed, as the catalysts were re-oxidised
in-situ due to their pyrophoric nature when in the reduced form.
3.1.7 Summary
A range of copper based catalysts were investigated and confirmed the
literature results [2, 18] that copper is catalytically active for the hydrogenation

Chapter 3.1 103
of acetic acid to ethanol. The catalysts were tested in both an integral BERTY
reactor and a differential low pressure fixed bed system. And different reactor
designs influenced the propensity of a catalyst to facilitate the ‘secondary’
esterification reaction to ethyl acetate.
The most interesting result for ethanol production was observed with a standard
industrial methanol synthesis catalyst, Katalco 51-8. Within the BERTY system,
the methanol synthesis catalyst was active for the production of ethanol with a
sustained selectivity of 34 %. When comparing this to testing in the
microreactor, the selectivity of 75 % towards ethanol remained but the catalyst
experienced significant deactivation over the duration of the four day reaction
period.
Despite this interesting result, the pivotal issue of catalyst stability was
problematic with copper sintering and pellet cracking being visible signs of the
degradation of the catalyst. Other indications from the characterisation
techniques such as BET confirmed that changes were seen, with severe
decreases observed in the surface area of the catalyst post-reaction.
The other commercial copper catalyst investigated was in the form of copper
chromite. Initial testing identified that the copper chromite catalysts did not
display an activity for ethanol synthesis that superseded the drawbacks of using
a highly toxic and pyrophoric catalytic system.
A range of 5 wt.% copper catalysts and a 10 wt.% copper catalyst, all supported
on silica Q10 were also investigated. The activity of these impregnated catalysts
remained far below that observed for the methanol synthesis catalyst; a simple
linear relationship was observed between the copper metal content and the
catalyst activity. This is a link that was to be expected, and one that will be
expanded upon in chapter 3.4.

104
3.2 High Acetic Acid Concentration Reactions
A low pressure reactor system at the BP Saltend Hull Research & Technology
Centre (HRTC) site was used to test a variety of copper containing catalysts.
The catalysts tested were the laboratory prepared 5 wt. % and 10 wt.% copper
on silica Q10 catalysts, industrial methanol synthesis catalyst Katalco 51-8 and
comparative tests using the silica support Q10 and silicon carbide packing
material.
As described in the experimental section, the fixed bed reactor tube was packed
with silicon carbide above and below the catalyst bed (10 ml) to aid the central
positioning of the catalyst within the reactor tube, all of which sat upon a quartz
sinter. The zones of silicon carbide packing and catalyst were separated by
plugs of glass wool. The silicon carbide was also tested to rule out any catalytic
activity attributable to the packing material.
3.2.1 Reduction Conditions
Previous TPR analysis of the catalysts, described in chapter 3.1, identified the
required reduction conditions for each of the catalysts in the low pressure fixed
bed reactor. Similarities were visible in the TPR profiles of the copper
containing catalysts, giving a set of universal reduction conditions, seen in table
3-18. These conditions took into account the temperature limitations of using a
copper catalyst (maximum 300 ⁰C) to avoid sintering of the metal. The
reduction ramp rate was maintained at 10 ⁰C min-1, in line with the rate used for
the TGA-DSC-MS analysis and all other catalyst testing. The silicon carbide and
the silica Q10 support reactions also went through the reduction procedure to
allow standardisation of the reduction and reaction method.

Chapter 3.2 105
Table 3-18: Universal reduction conditions for all copper catalyst in the low pressure fixed bed reactor
Ramp Rate (⁰C min-1) 10.0
Temperature (⁰C) 250
Hold (mins) 60
Reduction Gas H2
Flow rate (ml min-1) 100
3.2.2 Reactions
The 5 wt.% copper catalysts (both from the acetate and nitrate precursors), a 10
wt.% copper catalyst and the Q10 support were all tested. As a comparative
reaction, the commercial methanol synthesis catalyst was also tested. Standard
reaction conditions were also used for all the copper catalysts tested and are
described in table 3-19.
Table 3-19: Reaction conditions for all materials tested in low pressure HRTC reactor
Temperature (⁰C) 250
Pressure Atmospheric
Gas Flow (ml min-1 H2) 100
Volume of Catalyst (ml) 10
GHSV (hr-1) ~ 750
Feed 20 mol% Acetic Acid via syringe pump (4 ml/hr)
(except for AL6 which was 10% Acetic Acid (2 ml/hr) with a maintained GHSV)
3.2.3 Liquid Samples
A single liquid sample was collected from each reaction, which was collected in
a condensing coil within a water bath at 19 ⁰C. The liquid samples were
analysed by GC on site at HRTC.

Chapter 3.2 106
Table 3-20: GC analysis high level results (% m/m)
Sample
Aceta
ldehyde
(% m
/m)
Eth
yl A
ceta
te
(% m
/m)
Eth
anol
(% m
/m)
Wate
r
(% m
/m)
Aceti
c A
cid
(% m
/m)
Acetic Acid Reference -- -- -- 0.14 Balance
SiC (AL1) -- -- -- 0.32 Balance
CuN2Q10c (AL2) -- -- -- 0.60 Balance
CuN(10)Q10c (AL3) -- -- -- 0.88 Balance
MeOHSC (AL4) 0.97 10.4 6.6 13.9 Balance
Q10c (AL5) -- -- -- 0.30 Balance
MeOHSC (AL6) 1.6 3.0 29.2 25.4 Balance
CuA3Q10c (AL7) -- -- -- 0.56 Balance
The GC analysis results in table 3-20 identify that the methanol synthesis
catalyst was the only catalyst of those tested within this system that produced
any products in quantities greater than ‘parts per million’ (ppm) levels. The
ppm GC results in table 3-21 account for the results for the rest of the catalysts
tested.

Chapter 3.2 107
Table 3-21: GC analysis low level results (ppm m/m)
Sample
Aceta
ldehyde
(ppm
m/m
)
Aceto
ne
(ppm
m/m
)
Eth
anol
(ppm
m/m
)
Wate
r
(ppm
m/m
)
Acetic Acid Reference <10 <10 <10 <10
SiC (AL1) <10 15 <10 <10
CuN2Q10c (AL2) 390 20 1340 645
CuN(10)Q10c (AL3) 655 20 2690 1605
MeOHSC(1) (AL4) -- 4605 -- --
Q10c (AL5) <10 20 35 20
MeOHSC(2) (AL6) -- 2840 -- --
CuA3Q10c (AL7) 375 30 1230 620
Combining the results from tables 3-20 and 3-21 in figure 3-40 shows the
distinctive difference between the methanol synthesis catalyst and the rest of
the copper catalysts tested. The methanol synthesis catalyst displayed
significantly greater activity for the production of the reduction products,
ethanol, acetone and acetaldehyde and also for the ethanol esterification
product, ethyl acetate.

Chapter 3.2 108
Figure 3-40: GC analysis results for all materials tested and acetic acid reference
The difference between the product values observed with the methanol
synthesis catalyst and the supported copper catalysts means that the results for
these two groupings are best addressed separately. The GC results for the
supported metal catalysts are shown below in figure 3-41 and will be discussed
first. The methanol synthesis catalysts results are shown in figure 3-42, and will
be discussed later.
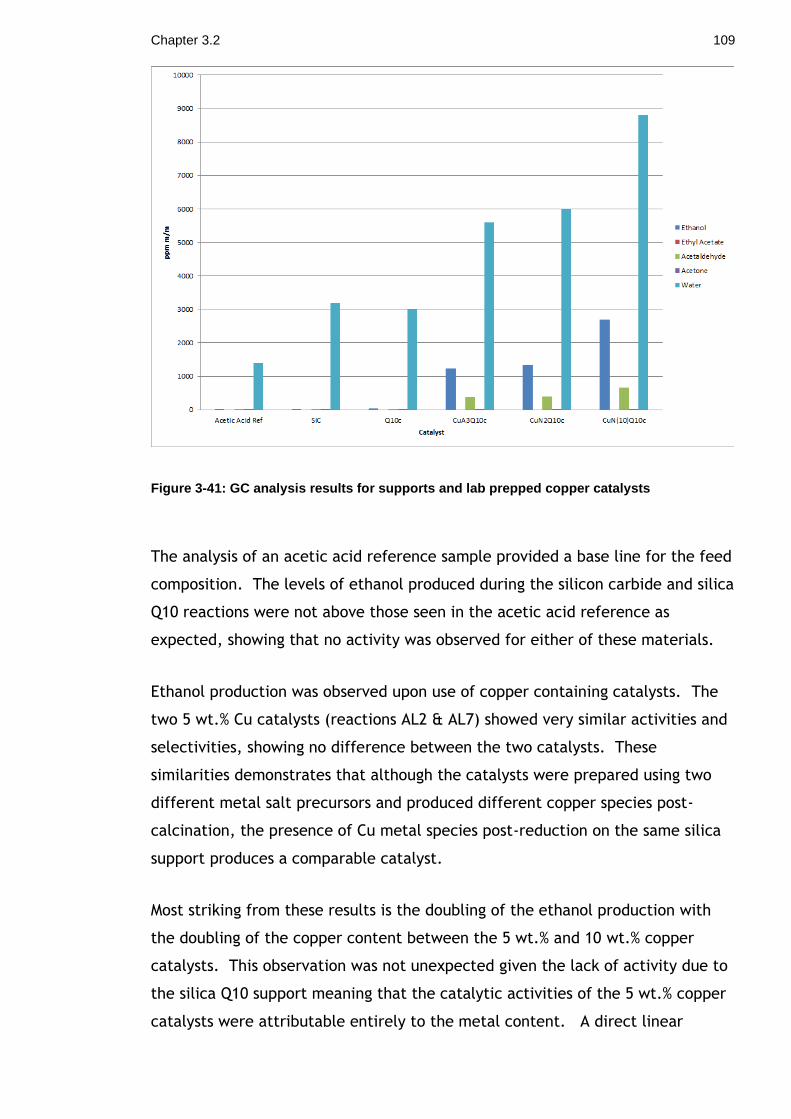
Chapter 3.2 109
Figure 3-41: GC analysis results for supports and lab prepped copper catalysts
The analysis of an acetic acid reference sample provided a base line for the feed
composition. The levels of ethanol produced during the silicon carbide and silica
Q10 reactions were not above those seen in the acetic acid reference as
expected, showing that no activity was observed for either of these materials.
Ethanol production was observed upon use of copper containing catalysts. The
two 5 wt.% Cu catalysts (reactions AL2 & AL7) showed very similar activities and
selectivities, showing no difference between the two catalysts. These
similarities demonstrates that although the catalysts were prepared using two
different metal salt precursors and produced different copper species post-
calcination, the presence of Cu metal species post-reduction on the same silica
support produces a comparable catalyst.
Most striking from these results is the doubling of the ethanol production with
the doubling of the copper content between the 5 wt.% and 10 wt.% copper
catalysts. This observation was not unexpected given the lack of activity due to
the silica Q10 support meaning that the catalytic activities of the 5 wt.% copper
catalysts were attributable entirely to the metal content. A direct linear

Chapter 3.2 110
relationship was seen between the copper content and the amount of ethanol
and acetaldehyde produced during the reaction. The water content of the liquid
samples also reflects this linear relationship, although it was to be expected as
it is also a product of the two reduction reactions.
There was no ethyl acetate observed within the product stream for any of the
copper supported metal catalysts within this system. Although the esterification
product is not desired, this confirms the difference seen between the
differential and integral reactor product profiles for impregnated copper
catalysts, as discussed in chapter 3.1.
Following this, the difference in the product profiles of the methanol synthesis
catalyst reactions, with varying acetic acid amounts in the feed, was of
particular interest. The reduction and reaction conditions of the two reactions
were the same apart from the amount of acetic acid being fed into the system.
For MeOHSC(2), the rate of addition of acetic acid was halved for the duration of
the reaction, with the reaction time being kept the same. The product profiles
for the liquids samples are seen below in figure 3-42.
Figure 3-42: Liquid sample data for two methanol synthesis catalyst reactions

Chapter 3.2 111
In the reaction using MeOHSC(1), a feed stream with 20 mol.% acetic acid was
passed over the catalyst, whereas in the reaction using MeOHSC(2), the feed
stream contained 10 mol.% acetic acid. Intuitively, an increase in the amount of
feed passed over a catalyst would increase the amount of product seen. Such a
simple linear relationship, however, does not take into account limitations in the
activity of a catalyst due to the number of active sites available for reaction. It
also assumes that the catalyst is not affected by the reactants, products or
reaction itself. In fact, as seen in figure 3-42, an increase in the amount of
acetic acid passed over the methanol synthesis catalyst has a detrimental effect
on the amount of ethanol produced.
As ethanol is required for the esterification reaction, the amount of ethanol
produced within the system can also indicated by a combination of the amount
of ethyl acetate and ethanol within the liquid sample. The combined values for
ethyl acetate and ethanol are seen below in table 3-22. These combined ethyl
acetate and ethanol values show a clear difference between the two methanol
synthesis catalyst reactions, confirming the earlier observation of doubling in
catalyst activity upon reduction, by half, of the acetic acid feed.
Table 3-22: Numerical comparison of the ethanol production values between the methanol synthesis catalyst reactions
Ethyl Acetate (ppm) Ethanol (ppm)
Ethyl Acetate and Ethanol (ppm)
Water (ppm)
MeOHSC (1) 104,000
60,000
170,000 139,000
MeOHSC (2) 30,000
292,000
322,000 254,000
This observation indicates a change in the ability of the catalyst as a
consequence of the acetic acid hydrogenation reaction. Copper sintering and
pellet degradation were to be expected with the catalyst in this reaction,
following observations post-reaction with the same catalyst in chapter 3-1. The
expected sintering would decrease the copper surface area within the catalyst
and subsequently decrease the number of metal active sites available for

Chapter 3.2 112
reaction. This in turn would limit the catalyst’s activity, and account for the
reduced ethanol production.
Ethyl acetate production values for these two reactions suggests that the
esterification reaction is enhanced by the increased availability of both acetic
acid and ethanol in the catalyst bed with the higher acetic acid content in the
feed.
3.2.4 Gas Samples
Gas sample bags collected the reaction gas effluent stream for the duration of
the reaction. The gas samples collected were then analysed using GC at the
HRTC site. Analysis of the gas products from the reactions was to ensure the
identification of any highly volatile products that may not be seen in the liquid
sampling.
The GC results for the gas samples are shown below in table 3-23. The lower
quantification limit for methane, ethane and ethylene was 0.001 % v/v, whilst
the limit for nitrogen, carbon monoxide, carbon dioxide, ethanol, acetaldehyde
and ethyl acetate was 0.1 mol %. Acetic acid was not analysed for within the
gas samples. Additional C2, C3, C4 and C5 compounds were analysed for although
no quantifiable peaks were observed for any of those components.

Chapter 3.2 113
Table 3-23: Gas sample GC results
Meth
ane
(% v
/v)
Eth
ane
(% v
/v)
Eth
ene
(% v
/v)
CO
(mol %
)
N2
(mol %
)
CO
2
(mol %
)
Eth
anol
Aceta
ldehyde
Eth
yl A
ceta
te
AL1 <0.001 <0.001 <0.001 <0.1 1.7 <0.1 <0.1 <0.1 <0.1
AL2 0.001 <0.001 <0.001 <0.1 0.8 <0.1 <0.1 <0.1 <0.1
AL3 0.033 0.003 <0.001 <0.1 1.1 <0.1 <0.1 <0.1 <0.1
AL4 0.003 <0.001 <0.001 <0.1 1.8 0.3 0.4 1.2 0.5
AL5 <0.001 <0.001 <0.001 <0.1 0.5 <0.1 <0.1 <0.1 <0.1
AL6 0.021 0.015 0.002 <0.1 19.7 <0.1 0.5 0.4 <0.1
AL7 0.002 <0.001 <0.001 <0.1 1.3 <0.1 <0.1 <0.1 <0.1
The GHSV within the reactor system during the 10 wt.% acetic acid feed reaction
(AL6) was maintained using an additional supplementary nitrogen feed. The
presence of this small amount of nitrogen feed within the system accounts for
the elevated nitrogen values (19.7 mol %) observed for the AL6 results. The 20
mol.% acetic acid feed reactions did not use nitrogen, although there were
small amounts identified in each of the gas samples. This can be explained as
nitrogen was used to clean the gas sampling bags prior to use and the amounts
seen may be residual from this cleaning process.
The two detected values for ethanol were both from the methanol synthesis
catalyst reactions. The highest value for ethanol was 0.5 % v/v detected in AL6
(methanol synthesis reaction with a 10 mol.% acetic acid feed) and is in line with
that being the highest ethanol value within the liquid samples. The gas sample
values are reflective of the liquid sample with respect to ethanol, acetaldehyde
and ethyl acetate.

Chapter 3.2 114
The highest methane value was for AL3 (CuN2Q10) with a value of 0.033 % v/v.
Although this is above the threshold value and was the highest observed for the
methane and ethane values, the quantity observed was severely limited.
3.2.5 ICP-MS Results
ICP-MS analysis was carried out on each of the post-reaction liquid samples
submitted for GC analysis as well as the acetic acid reference sample. No values
above the threshold values of 25 ppb (parts per billion) were found for Ag, As,
Be, Cd, Co, Cs, Ga, Mo, Pb, Rb, Se, Sr and U for any of the samples. These
elements were not expected to be identified by the ICP-MS analysis as they
should not be present within the catalysts, the reactor system and the reactant
feed, and as such should not be present within the product stream. Table 3-24
below shows the results for the elemental analysis where values were observed
above their threshold limits.
Table 3-24: ICP-MS values
Al Ba Cr Cu Fe Mg Mn Ni V Zn
AL1 <250 <25 <25 90 980 130 <25 50 65 1100
AL2 <250 <25 <25 170 200 85 <25 <25 <25 1700
AL3 <250 <25 <25 60 250 60 <25 100 <25 800
AL4 2500 60 35 45 1300 5700 <25 35 40 550000
AL5 <250 <25 <25 35 200 7800 <25 <25 <25 3300
AL6 280 <25 <25 160 4400 720 55 55 40 750000
AL7 <250 30 <25 190 310 4000 <25 <25 <25 10000
AA
ref
<250 <25 <25 <25 <25 30 <25 <25 <25 <250

Chapter 3.2 115
Figure 3-43 shows the data for the values above the ICP-MS methodology 25 ppb
threshold. The only exceptions to this are zinc and aluminium which had a
higher threshold of 250 ppb. Any results below those threshold values are
indicated as zero.
Figure 3-43: All ICP-MS data (ppb) above the standard <25 ppb threshold for all elements analysed.
In figure 3-43, the zinc ppb values for the two methanol synthesis catalyst
reactions are significantly higher than the values seen for any of the other
elements, and dwarf any trends that may be visible on a smaller scale. As such,
the zinc values were removed and the rest of the data is presented below in
figure 3-44. The zinc ICP-MS data will be addressed later when the methanol
synthesis catalyst is directly discussed.

Chapter 3.2 116
Figure 3-44: ICP-MS data (ppb)(zinc removed)
ICP-MS analysis of the acetic acid reference liquid sample clearly demonstrates
that the liquid feed of acetic acid is not the source of many of the elemental
components detected. Its only quantified elemental contribution was
magnesium with a value of 30 ppb, just above the 25 ppb threshold. The
analysis of the liquid samples from the reactions over the silicon carbide packing
material and silica support, Q10, helped determine if there was a significant
elemental contribution from the packing material or catalyst support. The
values for the silica Q10 reaction are low across the board with no obvious
spikes. From the results gained, the SiC reaction shows a relatively high value of
Fe not seen in the Q10 reaction. This suggests that there is iron extraction
occurring from the silicon carbide when it is the only material in the reactor.
This shows that the sources of the major elemental contributions in the liquid
samples are the catalysts themselves and not the reactor or associated
glassware.

Chapter 3.2 117
Figure 3-45: ICP-MS data for expected elemental contributions from the catalysts
Figure 3-45 focuses on the four elemental contributions that were expected in
the methanol synthesis catalyst reactions, due to the catalyst composition.
Referring back to the catalyst composition as described in section 2.1.4.1, we
know that the methanol synthesis catalyst is mainly copper oxide on an alumina
support and zinc oxide framework with a magnesium oxide stabiliser. Each of
those components can be seen in figure 3-44 in the methanol synthesis catalyst
reaction liquid samples. The zinc ICP-MS values were removed in figure 3-45 for
an easier comparison between the aluminium, copper and magnesium values.

Chapter 3.2 118
Figure 3-46: ICP-MS for Al, Cu and Mg contributions
The three elements that are being analysed here are those that were expected
from the methanol synthesis catalyst reactions given the catalyst’s composition.
The presence of aluminium on the methanol synthesis catalysts shows extraction
of the alumina support from the catalyst as well as the other components.
The high value for magnesium in the MeOHSC (1) (AL4) reaction was expected as
the reaction used a 20 mol.% acetic acid feed which was also seen to extract
zinc from the catalyst framework. A lower magnesium value was observed for
the MeOHSC(2) (AL6) reaction which used a decreased acetic acid feed of 10
mol.%. The presence of magnesium and the amounts observed link to the
amount of acetic acid used and the catalyst composition. The unexpected
magnesium results appear in the CuA3Q10 and CuN(10)Q10 reactions where the
results are high and the presence of magnesium is unexpected. An explanation
for the magnesium contents in the CuN(10)Q10 and CuA3Q10 reactions is that
they are in fact residues within the system from the previous methanol
synthesis reactions. The reactions were not carried out in the order that they
were described in the above graphs, but the CuA3Q10 and CuN(10)Q10 catalysts
were both tested after the methanol synthesis catalyst. Removal of the Mg ICP-

Chapter 3.2 119
MS values leaves comparison between the aluminium and copper values below in
the figure 3-47.
Figure 3-47: ICP-MS data for aluminium and copper
No elemental analysis for silicon removed the possibility of determining if the
dissolution of the support material is occurring. Visual inspection of the silica
spheres used in the Q10 only reaction (AL2) did not show any discernible
degradation of the support surface or the sphere as a whole.
3.2.6 Post reaction characterisation: MeOHSC
The two reactions completed using the methanol synthesis catalyst, showed a
decrease in the activity of the catalyst with a higher acetic acid feed. One
explanation for this decrease in activity was changes to the methanol synthesis
catalyst were more severe with a higher acetic acid feed due to the corrosive
nature of acetic acid. Sintering of the copper content and degradation of the
methanol synthesis catalyst pellets was expected as it had previously been seen
after testing on the low pressure microreactor and BERTY systems.

Chapter 3.2 120
Post-reaction there were various visible changes to the methanol synthesis
pellets. The production of a white crystalline product on the exterior of the
catalyst pellets and some degradation of the pellets themselves was observed.
This had been seen to a much lesser extent with the methanol synthesis catalyst
in the BERTY reactor, although there only a 1.5 mol.% acid feed was use and
much greater degradation of the pellets was observed but was attributed to the
reactor design. In addition, within the HRTC glass tube reactor, the formation
of a white crystalline product was seen at the temperature junction at the base
of the reactor tube. This white crystalline product, seen in figure 3-48, was only
visible post-reaction once the reactor system had cooled and that part of the
reactor was accessible.
Figure 3-48: Photograph of cooled inverted HRTC glass reactor tube (40 mm diameter, 1 m length quartz tube)
White crystalline product deposition was also observed for the methanol
synthesis catalyst reaction repeated at a lower acetic acid feed of 10 mol.%,
although the quantity deposited was less. It was postulated that the crystalline
product was zinc acetate produced from the reaction of acetic acid and the zinc
oxide stabiliser within the methanol synthesis catalyst.
As previously stated, the white crystalline substance was thought to be zinc
acetate which is described as a monoclinic and colourless compound that is
soluble in cold water and decomposes at 200 ⁰C [46]. The visual indicators of
the deposited substance agree with the description given for zinc acetate. The
literature describes the route for the production of zinc acetate dihydrate, also
known as E650, as the reaction of acetic acid on zinc carbonate or zinc metal

Chapter 3.2 121
[49] This supports our hypothesis that it was zinc acetate produced from the
reaction of the acetic acid with the zinc oxide stabiliser within the methanol
synthesis catalyst. The hydrated form is zinc acetate dihydrate
(Zn(C2H3O2)2.2H2O) and could also be a possibility for the product as it is also
colourless and monoclinic [46] with a melting point of 237 ⁰C. Presence of the
hydrated species would be expected, at least to some extent given the presence
of water within the system. Various identification techniques were carried out
to ascertain the composition of the crystalline deposits.
Initially melting point analysis was employed. The sample from the reactor tube
had a melting point range of 243-249 oC. The zinc acetate dihydrate reference
had a melting point of 237 oC. This was a value from literature [46] and was
confirmed with analysis of a reference sample on the same melting point kit
apparatus. This variation reference compound could be attributed to impurities
within the crystalline substance. As the reaction with acetic acid extracts the
zinc oxide from the catalyst framework, other components of the catalyst
composition may also be extracted. Previous ICP-MS data shows significant
extraction of magnesium from the methanol synthesis catalysts, which may
account for impurities in the postulated hydrated zinc acetate deposits.
Further attempts to confirm the chemical composition of the crystalline residue
included elemental analysis for carbon, nitrogen and oxygen content. The CHN
data (C: 22.29 %, H: 4.28 %, N: nil) for the crystalline residue produces a C: H
ratio of 1: 2.3. A comparison of the crystalline residue data to the calculated
empirical values for both zinc acetate and zinc acetate dihydrate shows that the
CHN composition and C: H ratio is similar to that of the hydrated zinc acetate
compound. The calculated values for the carbon and hydrogen ratio for
Zn(CH3COO)2 is a C: H ratio of 1: 1.5. with calculated empirical percentages of
C: 26.19 %, H: 3.30 % and N: nil. Falling closer to the observed values, zinc
acetate dihydrate has a calculated C: H ratio of 1: 2.5 and calculated empirical
percentages of C: 21.89 %, H: 4.59 % and N: nil. The similarity in the
composition proportions indicates that the compound could be zinc acetate
dihydrate, as suspected.
XRD analysis of the crystalline residue was not appropriate on the powder X-Ray
diffractometer used for the analysis of the bulk catalyst samples. Alternatively,

Chapter 3.2 122
the Xpert Diffractometer was used in capillary configuration to elucidate a
sharper and clearer XRD pattern, seen in figure 3-49.
Figure 3-49: XRD patter of zinc acetate hydrate sample
The XRD analysis was completed but clear identification remained elusive.
Further analysis by NMR was completed using a 400 MHz spectrometer in DMSO.
The results were as follows; 1H NMR (δH) = 1.81 (3H, CH3). Solvent peaks; DMSO
= 2.50 ppm, H2O = 3.46 ppm. 13C NMR (δC) = 198.8 (C=O), 22.43 (CH3). Solvent
peak; DMSO = 39.58 ppm. The NMR spectra confirmed the presence of acetate
groups within the sample and also showed that there were no other organic
impurities present.
Following analysis of the crystalline product by XRD, microanalysis and NMR, its
identification was still postulated as zinc acetate dihydrate although no
conclusive characterisation data was collated.
3.2.7 Post-reaction characterisation
Analysis of the catalyst samples post-reaction was completed to indicate any
changes in the catalysts as a result of the catalyst testing.

Chapter 3.2 123
Table 3-25: BET data for post reaction samples from HRTC
Sample BET Surface Area (m2/g)
Average Pore Diameter (nm)
SiC (AL1) n/a n/a
CuN2Q10c (AL2) 257 15.4
CuN(10)Q10c (AL3) 265 13.4
MeOHSC (AL4) 24 14.5
Q10c (AL5) 299 14.2
MeOHSC (AL6) 49 23.8
CuA3Q10c (AL7) 258 15.3
BET data in table 3-25 shows that surface area and pore diameter values for the
silica based catalysts remained similar pre and post-reaction. However, the
methanol synthesis catalyst support did not maintain its structural integrity
which is clear when comparing the post-reaction BET data to that of the pre-
reaction methanol synthesis catalyst. Pre-reaction, the catalyst had a surface
area of 86 m2/g and an average pore diameter of 11.7 nm. Post-reaction, the
surface area values were halved for the 10 mol.% acid feed reaction and were a
quarter of the pre-reaction value for the 20 mol.% acid reaction. It is clear that
there was a significant impact on the structural and dispersion properties of the
catalyst after reaction with acetic acid.
XRD analysis was completed with each of the catalyst samples post reaction. As
expected, there was no change in the amorphous silica peak seen for silica Q10
or the corborundum spectrum attributable to silicon carbide reaction. Figure 3-
50, below, shows a typical impregnated copper catalyst spectrum post-reaction
where peaks assignable to copper metal are clearly visible against the wide
amorphous silica peak background.

Chapter 3.2 124
Figure 3-50: XRD pattern of post-reaction CuN(10)Q10
The spectrums for the two methanol synthesis catalyst samples post-reactions
display clear and defined peaks attributable to copper metal and zinc oxide.
Figure 3-51, below, shows the XRD pattern for reaction AL4.
Figure 3-51: XRD pattern of post-reaction methanol synthesis catalyst

Chapter 3.2 125
The copper particle sizes post-reaction, calculated using the Scherrer equation
using the Cu peak at 43.3⁰, range from 21 to 30 nm in size across the copper
catalysts investigated. The particle size calculations pre and post reaction may
be used to give an indication of the level of sintering of the copper metal
particles during the reactions. Increases in the copper particle size will also
have an effect on the stability of the catalyst. Sintering, either by thermal or in
this case more likely by chemical means, will have a distinctive impact upon the
support’s structure and integrity. Degradation of the support structure with the
large scale migration and coalescence of copper particles to the catalyst surface
is not the result of the acid on the silica but by virtue of the metal’s behaviour.
3.2.8 Conclusions
Copper catalysts were seen to be unsuitable for the hydrogenation of acetic
acid. The impregnated copper catalysts displayed low conversions at low metal
loadings where additionally, the copper active phase was leached from the
catalyst support as well as well as sintering of the copper content, through both
chemical and thermal routes. Despite the low activity, the two 5 wt.% Cu
catalysts (from two different precursors) gave similar results whilst the 10 wt.%
Cu catalyst doubled the 5 wt.% Cu catalyst activity, displaying a linearity
between the activity of a impregnated copper catalyst and its metal loading.
The methanol synthesis catalyst outperformed the laboratory prepared catalysts
in terms of activity and selectivity, as it was the only catalyst to produce high
levels of ethanol and any other products. Ethanol was not the only product,
with acetaldehyde and ethyl acetate also being produced. It is clearly visible
from the ethyl acetate quantities that the activity of the catalyst is affected by
the amount of acetic acid being passed over the catalyst (20 mol.% vs. 10
mol.%). Despite its higher activity, the methanol synthesis catalyst was severely
affected by the presence of acetic acid with copper particle sintering, zinc oxide
extraction and pellet degradation all visible post-reaction.
The effects of the higher levels of acetic acid used within this rector system
were visible on the post-reaction catalysts, which displayed a significant level of
degradation. The methanol synthesis catalyst had some of its zinc oxide and
magnesium oxide content extracted from the catalyst framework, depositing a

Chapter 3.2 126
white crystalline substance, suspected to be hydrated zinc acetate, at the base
of the reactor. The sintering of the copper particles into visible particles on the
catalyst surface was especially prominent on the CuN(10)Q10rAL3 catalyst
sample.
The copper catalysts were seen to be unsuitable because of three distinctive
areas that were hoped to be improved upon;
(i) Low conversion at low metal loading
(ii) Leaching of copper from the catalyst
(iii) Sintering of copper on the catalyst surface
In order to address issues (ii) and (iii), an another active phase may be used i.e
an alternative base metal loading or use an alternative loading such as
bimetallic catalysts. A potential answer to this is to increase the metal loading.
For a change to higher metal loadings and for bimetallic catalyst preparation, a
change in the preparation method was necessary. For (iii), acetic acid
degradation of the catalyst support therefore change the support, i.e.
Al2O3/SiO2, ZrO2, TiO2.

127
3.3 Alternative Base Metal Catalysts
Given the observed propensity of copper based catalysts in chapters 3.1 and 3.2
to undergo significant sintering in the presence of acetic acid, especially at
temperature, the scope of experimentation was expanded to include the
preparation and testing of nickel and cobalt based catalysts. The aim was to
investigate alternative active phases for the acetic acid hydrogenation reaction.
Initially, nickel and cobalt catalysts were prepared using the same impregnation
technique used for the 5 and 10 wt.% copper catalysts. For the nickel and cobalt
alternatives, however, only catalysts with a 10 wt.% metal loading were
prepared and tested.
3.3.1 10 wt.% Nickel catalyst
Nickel catalysts are often used in steam reforming [50-52] and have been also
been used as hydrogenation catalysts [53], although their limited selectivity
means that fully hydrogenated alkane product is often achieved.
Characterisation of the nickel and cobalt catalysts was completed in the same
pattern as the impregnated copper catalysts. The initial TGA was to determine
the temperature required for catalyst calcination. This was followed by TPR
analysis to determine the temperature required for reduction. XRD analysis was
also completed at the uncalcined and calcined stages to ascertain the metal
species present within the catalyst at that particular stage of life.
TPR analysis showed the temperature at which the nickel oxide was reduced to
nickel.

Chapter 3.3 128
Figure 3-52: TPR analysis of 10 wt.% nickel on silica catalyst
The large event at 373 ⁰C in figure 3-52 was identified as the reduction step for
nickel oxide to metallic nickel on the catalyst. Mass spectrometer results show
that the species evolved at 62 ⁰C corresponded to water. Therefore, the
reduction temperature used for this catalyst was 375 ⁰C.
Figure 3-53: XRD patterns of 10 wt.% nickel on silica catalysts

Chapter 3.3 129
The XRD data in figure 3-53, shows several features for the uncalcined and
calcined samples. The uncalcined nickel catalyst displays features
corresponding to the nickel nitrate species used in the impregnation technique.
Calcination of the catalyst removes these features and new peaks relating to the
nickel oxide species become visible.
3.3.2 10 wt.% Cobalt catalyst
The third catalyst with a 10 wt.% metal loading contained cobalt , prepared via
impregnation using the metal acetate salt on a silica Q10 support. Cobalt based
catalysts are documented as active hydrogenation catalysts for acetic acid [2,
18], although they are used significantly in the Fischer-Tropsch synthesis sector.
TPR analysis of the catalysts was used to determine that for the reduction of
cobalt oxide to metallic cobalt, a reduction temperature of 350 ⁰C was required.
Figure 3-54: XRD analysis of uncalcined and calcined 10 wt.% cobalt on silica catalyst
The XRD patterns in figure 3-54 of the uncalcined 10 wt.% cobalt catalyst has
features corresponding to cobalt acetate, as would be expected given its use in
the catalyst preparation technique. Calcination of the cobalt catalyst removed
the features attributable to cobalt acetate. The resulting catalyst XRD pattern
post-calcination showed only one feature; a broad band attributed to the

Chapter 3.3 130
amorphous silica support. The lack of features assignable to cobalt species
suggests that the cobalt oxide was amorphous in nature.
3.3.3 Comparing 10 wt.% catalysts
The three 10 wt.% metal catalysts were tested using the low pressure
microreactor. The rates of ethanol production for each catalyst are shown in
figure 3-55.
Figure 3-55: Rates of ethanol production for 10 wt.% catalysts
The rates observed for ethanol production vary significantly between the three
metal catalysts being investigated. In order to understand fully the activity
profile of each catalyst, the selectivities of each catalyst for other products such
as acetaldehyde and ethyl acetate also need to be taken into account. These
are shown in table 3-26.

Chapter 3.3 131
Table 3-26: Reaction data for 10 wt.% catalysts
Catalyst CuN(10)Q10c NiN(10)Q10c CoA(10)Q10c
Reaction Day (4 Day Average)
(4 Day Average) 1 4 Sele
cti
vit
ies
(%)
Ethanol 5 15 57.2 86.5
Ethyl Acetate 2.5 0 22.2 8.0
Acetaldehyde 0 0 0 0
Conversion (%) 6 14 1.8 8.9
The copper catalyst, a previously discussed catalyst, displays the lowest rate of
ethanol production of the three catalysts with a value of ~0.03 µmoles/s/g.
Additionally, the copper catalyst was active for the esterification of ethanol and
acetic acid through to ethyl acetate. Even accounting for the amount of ethanol
esterified to ethyl acetate, the copper catalyst activity for hydrogenation of
acetic acid to ethanol is still lower than the values observed for the alternative
nickel and cobalt catalysts.
The nickel catalyst was seen to be more active for ethanol production than the
10 wt.% copper catalyst, and was not active for esterification through to the
ethyl acetate product. Conversion of acetic acid through to methane/ethane
was suspected, but these products were not identifiable via the GC method and
were not quantified by the mass spectrometry analysis.
The copper and nickel catalysts, despite having limited activity for the ethanol
production reaction, did produce rates that remained relatively steady
throughout the four day reaction period. The 10 wt.% cobalt catalyst appears to
continue to activate during the course of the reaction, increasing from a zero
rate to a value of 0.8 µmoles/s/g by the end of day four. This far exceeds the
rate observed for the nickel and copper catalysts. The data in table 3-26

Chapter 3.3 132
reflects an increase over time in the amount of ethanol and ethyl acetate
produced. The cobalt catalyst, therefore, was observed as the most active
catalyst for ethanol production of the prepared catalysts discussed thus far. The
increasing yield pattern seen with the 10 wt.% cobalt on silica suggests that the
catalyst becomes more active as the reaction progresses. One explanation for
this could be an initial incomplete reduction of the cobalt oxide to cobalt metal
during the reduction stage, and instead the catalyst continues to reduce during
the reaction under the hydrogen atmosphere. Alternatively, the activity could
also be increasing with an increase in the cobalt particle size during the course
of the reaction.
Identification of the metal species in the nickel and cobalt catalysts post-
reaction was completed using XRD analysis. The patterns for both catalysts are
shown in figures 3-56 and 3-57.
Figure 3-56: XRD patterns for pre and post reaction 10 wt.% nickel on silica catalyst
The XRD patterns in figure 3-56 show the calcined and post-reaction samples of
the 10 wt.% nickel on silica catalyst. Features in the XRD pattern of the calcined
sample indicate the presence of NiO. Post reaction, the NiO features had
disappeared and had been replaced with peaks relating to Ni metal. The
disappearance of all peaks relating to nickel oxide shows that the catalyst was
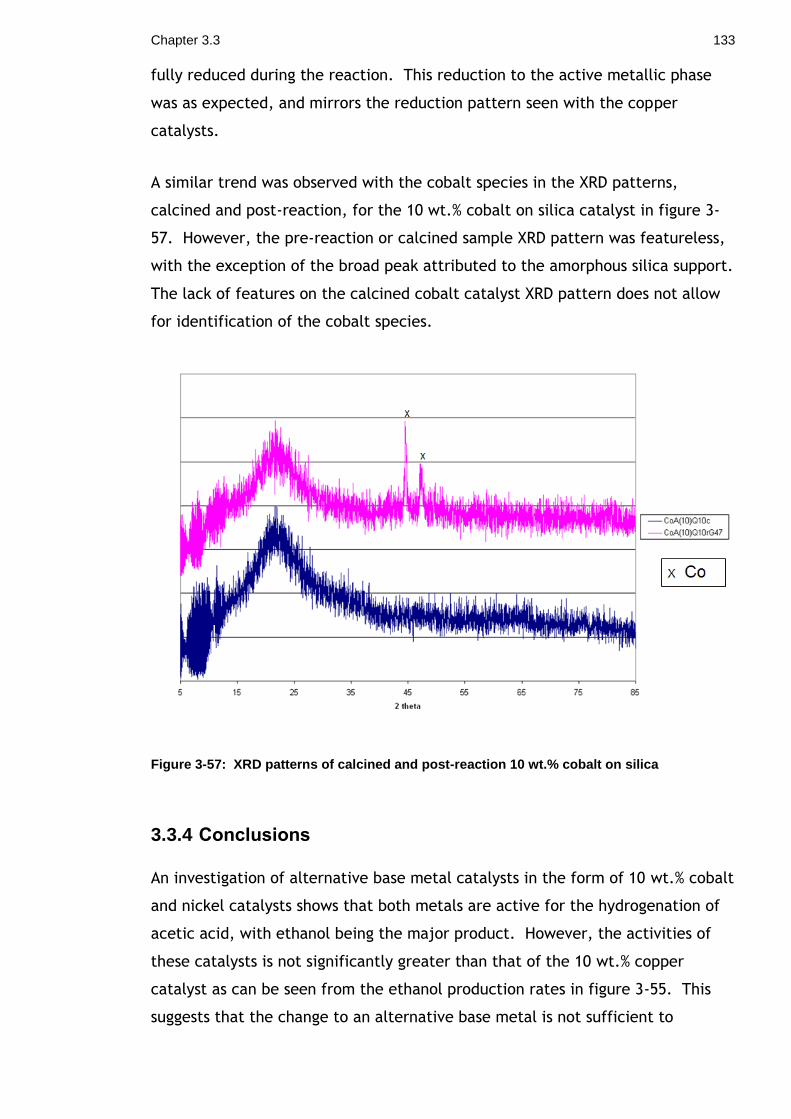
Chapter 3.3 133
fully reduced during the reaction. This reduction to the active metallic phase
was as expected, and mirrors the reduction pattern seen with the copper
catalysts.
A similar trend was observed with the cobalt species in the XRD patterns,
calcined and post-reaction, for the 10 wt.% cobalt on silica catalyst in figure 3-
57. However, the pre-reaction or calcined sample XRD pattern was featureless,
with the exception of the broad peak attributed to the amorphous silica support.
The lack of features on the calcined cobalt catalyst XRD pattern does not allow
for identification of the cobalt species.
Figure 3-57: XRD patterns of calcined and post-reaction 10 wt.% cobalt on silica
3.3.4 Conclusions
An investigation of alternative base metal catalysts in the form of 10 wt.% cobalt
and nickel catalysts shows that both metals are active for the hydrogenation of
acetic acid, with ethanol being the major product. However, the activities of
these catalysts is not significantly greater than that of the 10 wt.% copper
catalyst as can be seen from the ethanol production rates in figure 3-55. This
suggests that the change to an alternative base metal is not sufficient to

Chapter 3.3 134
produce a catalyst that can equal the activity of the methanol synthesis catalyst,
but that an increase in metal content may also be required.
The 10 wt.% cobalt catalyst shows an increasing ethanol yield over time, a
pattern not observed with any other catalysts tested. Two explanations are
hypothesised; (i) the reduction of the cobalt oxide to cobalt metal was
incomplete in the initial reduction step and is instead occurring throughout the
duration of the reaction and (ii) the increase in activity of the cobalt catalyst is
related in an increase in cobalt particle size observed over the course of the
reaction. With either of these explanations, the activity of the cobalt catalyst
far exceeds that of its base metal counterparts.
None of the 10 wt.% catalysts demonstrate a deactivation profile as was seen
with the methanol synthesis catalyst and all show activity towards the
production of ethanol. The lack of deactivation with these catalysts suggested
viability for testing with increased metal contents to yield higher ethanol
activities.

135
3.4 20 wt.% Metal Catalysts
Increasing the catalyst metal loading was a suggestion at the close of chapter
3.2 as a possible route to increase the activity for ethanol production seen with
5 and 10 wt.% copper catalysts. In chapter 3.3, other base metals in the form of
cobalt and nickel catalysts were also investigated and again increased metal
contents were suggested as a possibility to increase ethanol yields. In this
chapter, increased metal loadings to the amount of 20 wt.% were investigated
for copper, nickel and cobalt catalysts.
With an increase in metal content to 20 wt.%, the simple incipient wetness
impregnation technique for catalyst preparation was not seen to be an
appropriate technique, due to the lack of control of crystallite size and
dispersion on the support surface. An alternative preparation technique (HDC)
was employed using an alumina support, the details of which are given in section
2.1.2.2.
3.4.1 Alumina SA6X75
The alumina support used was Saint-Gobain Norpro SA6X75. The alumina was
supplied as 5mm pellets, which was a same size as the Methanol Synthesis
catalyst pellets previously tested.
XRD analysis, shown in figure 3-58, identified Θ-alumina peaks within the
alumina support.

Chapter 3.4 136
Figure 3-58: XRD pattern of SA6X75 alumina
BET analysis data of the alumina support is displayed in table 3-27, with a high
surface area comparable to that of the silica Q10 previously used as a support.
Table 3-27: BET data for Alumina SA6X75
Pore Volume (cm3/g)
Surface Area (m2/g)
Average Pore Diameter (nm)
SA6X75 0.89 251 9
3.4.2 20 wt.% Nickel Catalyst
A 20 wt.% nickel catalyst was prepared on alumina using the HDC preparation
method. Maintenance of the small particle size (<5 nm) appears to have worked
as no nickel species could be identified in the hot stage XRD patterns in figure 3-
59 from room temperature through to 500 ⁰C.

Chapter 3.4 137
Figure 3-59: HS XRD patterns for 20 wt.% Ni catalyst
TPR analysis of the calcined 20NiSA6X75 catalyst was used to investigate an
appropriate reduction temperature for the catalyst.
Figure 3-60: TPR profile of 20NiSA6X75c
Mass spectrometry data for the TPR analysis shows that the weight loss at 100 ⁰C
corresponds to the loss of water, which is most likely in the form of physisorbed

Chapter 3.4 138
water on the catalyst surface. The second weight loss at 297 ⁰C can be
attributed to the reduction of the nickel oxide to the metallic species. A
reduction programme with a temperature of 375 ⁰C with a six hour hold was
identified from this TPR profile. The extension of the hold time at the reduction
temperature compared to the cobalt and copper catalyst is caused by the
difficulty in ensuring complete reduction of nickel.
3.4.3 20 wt.% Cobalt Catalyst
A 20 wt.% cobalt on alumina catalyst was also prepared via the HDC preparation
method. TPR analysis of the catalyst produced a two event profile similar to the
TPR profile observed for 20NiSA6X75c. A reduction temperature of 350 ⁰C with a
four hour hold was used for reduction of the 20 wt.% cobalt on alumina catalyst.
Figure 3-61: TPR analysis of 20 wt.% Co catalyst
The XRD pattern for the calcined 20CoSA6X75c catalyst was as expected with an
alumina background, showing no features relating to the presence of cobalt
species. This is in line with the patterns observed for the 20 wt.% nickel on
alumina catalyst and the preparation technique particle size control.

Chapter 3.4 139
3.4.4 20 wt.% Copper Catalyst
The third 20 wt.% HDC catalyst contained a 20 wt.% copper loading on alumina.
Like the two 20 wt.% catalysts, the 20 wt.% copper catalyst was also analysed by
XRD and TPR. A reduction temperature of 250 ⁰C was maintained for all copper
catalysts, given copper’s propensity for sintering at temperatures above 300 ⁰C.
A hold of four hours was employed for the reduction step.
The XRD pattern for 20CuSA6X75c mirrored the alumina background observed for
both the cobalt and nickel catalysts and was also expected with the copper
option.
3.4.5 Comparing 20 wt.% catalysts
The three metal 20 wt.% catalysts were each tested using standard conditions on
the low pressure glass microreactor with a catalyst loading of 1 ml.
As with the 10 wt%. monometallic catalysts, the rate of ethanol production was
used as the main comparative tool whilst looking at the 20 wt.% catalysts. The
rates of ethanol production for the three 20 wt.% catalysts over the four day
reactions are shown below in figure 3-62.
Figure 3-62: Rates of ethanol production for 20 wt.% catalysts
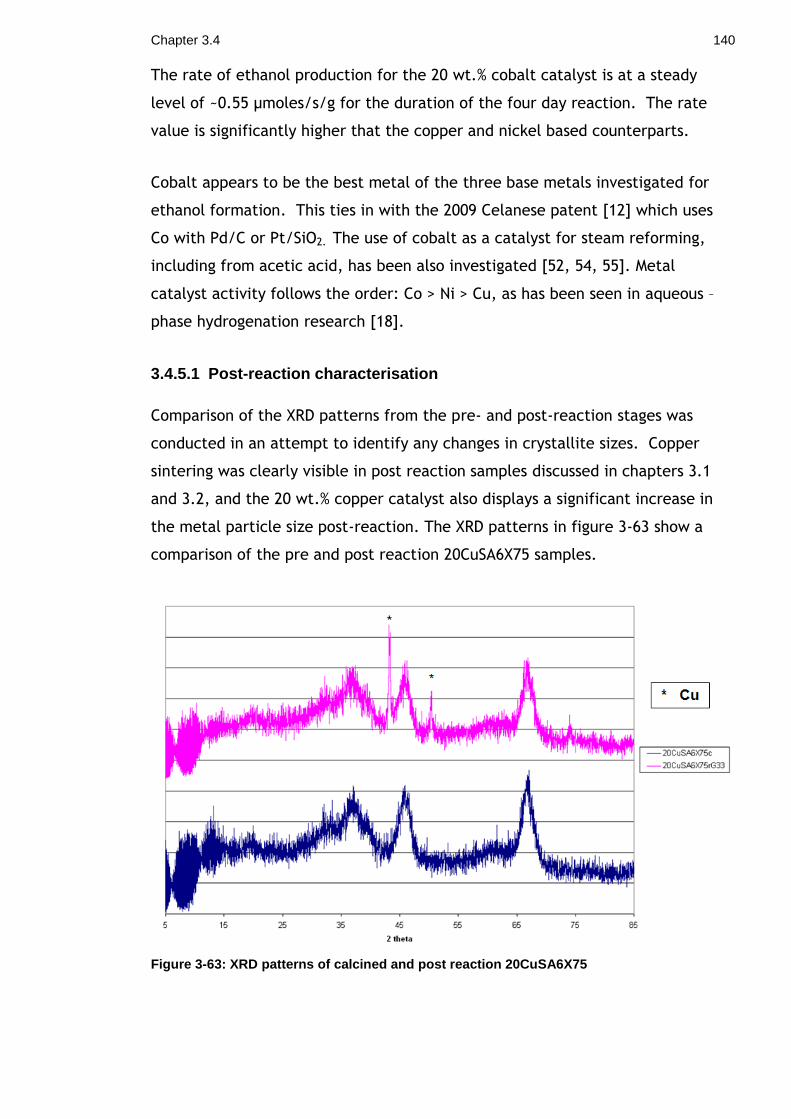
Chapter 3.4 140
The rate of ethanol production for the 20 wt.% cobalt catalyst is at a steady
level of ~0.55 µmoles/s/g for the duration of the four day reaction. The rate
value is significantly higher that the copper and nickel based counterparts.
Cobalt appears to be the best metal of the three base metals investigated for
ethanol formation. This ties in with the 2009 Celanese patent [12] which uses
Co with Pd/C or Pt/SiO2. The use of cobalt as a catalyst for steam reforming,
including from acetic acid, has been also investigated [52, 54, 55]. Metal
catalyst activity follows the order: Co > Ni > Cu, as has been seen in aqueous –
phase hydrogenation research [18].
3.4.5.1 Post-reaction characterisation
Comparison of the XRD patterns from the pre- and post-reaction stages was
conducted in an attempt to identify any changes in crystallite sizes. Copper
sintering was clearly visible in post reaction samples discussed in chapters 3.1
and 3.2, and the 20 wt.% copper catalyst also displays a significant increase in
the metal particle size post-reaction. The XRD patterns in figure 3-63 show a
comparison of the pre and post reaction 20CuSA6X75 samples.
Figure 3-63: XRD patterns of calcined and post reaction 20CuSA6X75

Chapter 3.4 141
Of the post-reaction samples, only the copper catalyst shows any peaks in
addition to those attributed to the alumina support. All post-reaction XRD
patterns for the 20 wt.% catalysts are shown in figure 3-64. The lack of
additional features demonstrates the small crystallite size produced with the
HDC method is maintained in the cobalt and nickel catalysts throughout the
reaction. The observation of copper peaks within the XRD pattern post-reaction
was not unexpected given copper catalyst’s propensity to sinter both at
temperature and in the presence of acetic acid.
Figure 3-64: XRD patterns for post reaction 20 wt.% alumina catalysts
The results for the TPO analysis of the post-reaction 20 wt.% catalyst samples
showed a consistency in the profiles produced. Below, in figures 3-65, 3-66 and
3-67, are the TPO profiles for each of the 20 wt.% catalysts.

Chapter 3.4 142
Figure 3-65: TPO analysis of 20 wt.% Co catalyst
Figure 3-66: TPO analysis of 20 wt.% Cu catalyst

Chapter 3.4 143
Figure 3-67: TPO analysis of 20 wt.% Ni catalyst
The first event in each TPO profile corresponds to the loss of water, as identified
from the MS pattern. The second events, at ~300 ⁰C for 20CuSA6X75 and ~350 ⁰C
for 20CoSA6X75 and 20NiSA6X75, all correspond to weight loss events of 5.8 %,
5.6 % and 4.6 % respectively. The MS profile shows an evolution of CO2
corresponding to each of these events.
3.4.6 Bimetallic catalysts
Following the appreciable increase in the ability of the individual metal 20 wt.%
HDC catalysts to produce ethanol compared to their lower metal loading
counterparts, the next area of interest was bimetallic catalysts. The
investigation into bi-metallic base metal catalysts was to identify any synergistic
effects of the bimetallic options compared to the mono-metallic catalysts.
Bimetallic catalysts were then prepared using combinations of nickel, copper
and cobalt with a 10 wt.% metal loading of each metal to an overall total of 20
wt.%. Preparation of the bimetallic catalysts achieved through co-precipitation
of the metals using the HDC method.
The bimetallic catalysts were characterised in the same way as the mono-
metallic catalysts. The results of the XRD patterns of the calcined catalysts
followed the trend seen with the mono metallic HDC catalysts; where there
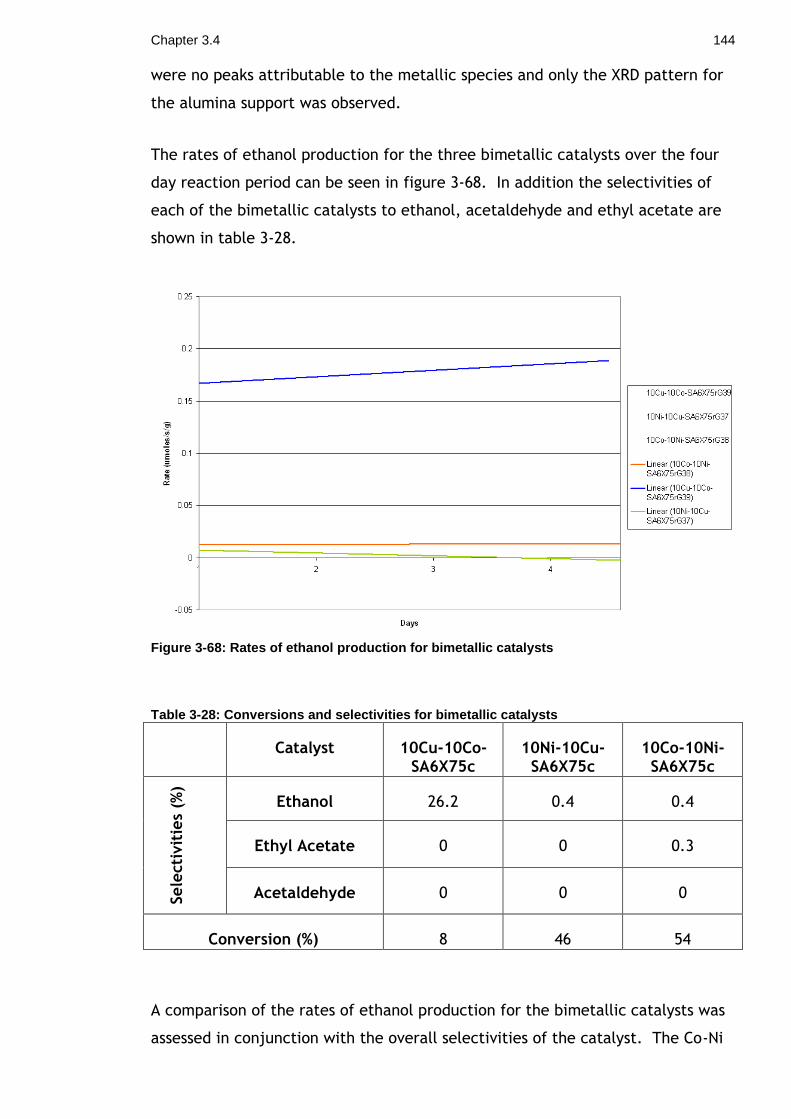
Chapter 3.4 144
were no peaks attributable to the metallic species and only the XRD pattern for
the alumina support was observed.
The rates of ethanol production for the three bimetallic catalysts over the four
day reaction period can be seen in figure 3-68. In addition the selectivities of
each of the bimetallic catalysts to ethanol, acetaldehyde and ethyl acetate are
shown in table 3-28.
Figure 3-68: Rates of ethanol production for bimetallic catalysts
Table 3-28: Conversions and selectivities for bimetallic catalysts
Catalyst 10Cu-10Co-SA6X75c
10Ni-10Cu-SA6X75c
10Co-10Ni-SA6X75c
Sele
cti
vit
ies
(%)
Ethanol 26.2 0.4 0.4
Ethyl Acetate 0 0 0.3
Acetaldehyde 0 0 0
Conversion (%) 8 46 54
A comparison of the rates of ethanol production for the bimetallic catalysts was
assessed in conjunction with the overall selectivities of the catalyst. The Co-Ni

Chapter 3.4 145
bimetallic catalyst not only makes ethanol, but further esterifies the ethanol
produced with acetic acid to ethyl acetate. Neither of the other two bimetallic
catalysts display any activity towards the esterification reaction.
With comparison of the bimetallic catalysts to the mono-metallics, the
expectation would be that with 10 wt.% of two metals, the activity of the
bimetallic catalyst would be positioned between the activities of the two
monometallic catalysts that form its composite. However, there was no
synergistic effect observed for any of them and the monometallic 20 wt.% cobalt
on alumina (20CoSA6X75c) continued to be the best performer of the prepared
catalysts. The rates of ethanol production for the mono-metallic and bi-metallic
catalysts are all compared in figure 3-69.
Figure 3-69: Lines of best fit for all 20 wt.% mono and bimetallic catalysts
3.4.7 Conclusions
Comparisons of the prepared monometallic and bimetallic 20 wt.% catalysts
showed that the highest rate of ethanol production was observed with the 20
wt.% cobalt on alumina catalyst (20CoSA6X75c). The comparison is further
expanded in Figure 3-70, which shows the catalyst with the highest ethanol
production rate from each of the following categories; copper catalysts, 10 wt.%
catalysts, 20 wt.% mono-metallic catalysts and 20wt% bimetallic catalysts.
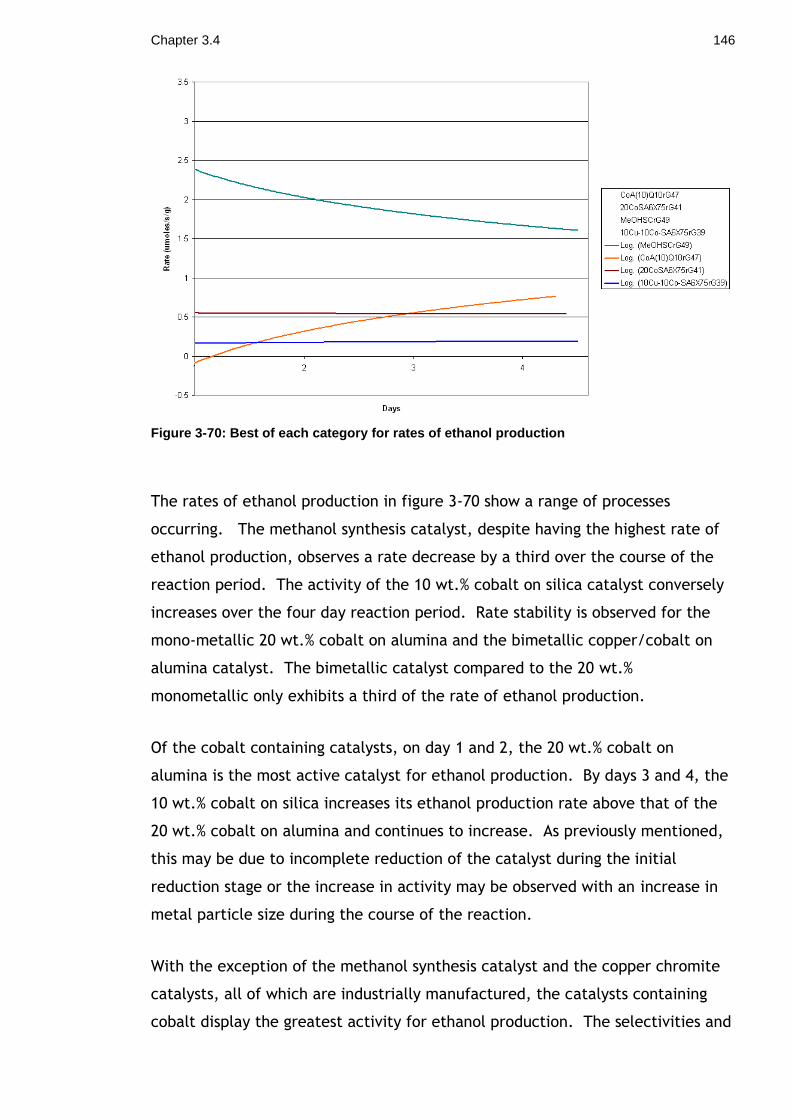
Chapter 3.4 146
Figure 3-70: Best of each category for rates of ethanol production
The rates of ethanol production in figure 3-70 show a range of processes
occurring. The methanol synthesis catalyst, despite having the highest rate of
ethanol production, observes a rate decrease by a third over the course of the
reaction period. The activity of the 10 wt.% cobalt on silica catalyst conversely
increases over the four day reaction period. Rate stability is observed for the
mono-metallic 20 wt.% cobalt on alumina and the bimetallic copper/cobalt on
alumina catalyst. The bimetallic catalyst compared to the 20 wt.%
monometallic only exhibits a third of the rate of ethanol production.
Of the cobalt containing catalysts, on day 1 and 2, the 20 wt.% cobalt on
alumina is the most active catalyst for ethanol production. By days 3 and 4, the
10 wt.% cobalt on silica increases its ethanol production rate above that of the
20 wt.% cobalt on alumina and continues to increase. As previously mentioned,
this may be due to incomplete reduction of the catalyst during the initial
reduction stage or the increase in activity may be observed with an increase in
metal particle size during the course of the reaction.
With the exception of the methanol synthesis catalyst and the copper chromite
catalysts, all of which are industrially manufactured, the catalysts containing
cobalt display the greatest activity for ethanol production. The selectivities and

Chapter 3.4 147
conversions for the 10 wt.% cobalt on silica, 20 wt.% cobalt on alumina and
methanol synthesis catalysts are tabulated below in table 3-29.
Table 3-29: Conversions and selectivities of the most active catalysts
Catalyst CoA(10)Q10c 20CoSA6X75c MeOHSC
DAY 1 4 1 4 1 4
Sele
cti
vit
ies
(%)
Ethanol 57.2 86.5 82.2 19.9 59.3 41.0
Ethyl Acetate 22.2 7.9 --- --- --- 0.44
Acetaldehyde --- --- --- --- 6.5 10.7
Conversion (%) 1.8 8.9 7.9 30.7 100 80.8
Although ethanol production is the primary objective in this project, there is
also interest in the other components produced as side products from the
reaction. Of particular interest is a catalyst with a low selectivity towards ethyl
acetate due to separation challenges. Relatively low conversions to ethyl
acetate are seen with each of the catalysts when tested in the low pressure
microreactor. Of the three catalysts mentioned above, the cobalt supported on
alumina catalyst is the only catalyst not to show any activity towards the
production of ethyl acetate.

148
3.5 Optimisation Studies
This chapter incorporates a number of studies that were completed. These
included investigations into the impact of changes to the reaction temperature
or the impact of using different catalyst supports. Each study was completed
using a cobalt based catalyst.
3.5.1 Temperature Dependence
Following determination of the superior performance of the 20 wt.% cobalt on
alumina catalyst compared to other cobalt, nickel and copper catalysts for the
hydrogenation to ethanol, temperature dependence was investigated using this
catalyst.
The temperature dependence of the catalyst in terms of activity and stability
were of particular interest, especially as a single reaction temperature of 250 ⁰C
had previously been used throughout the investigation. Particle size variation
pre and post-reaction seen with the copper based catalysts was not observed
with the 20CoSA6X75c reaction at 250 ⁰C. An investigation at a higher
temperature of 300 ⁰C was completed to see if there was any thermal sintering
occurring at this elevated temperature.
The same reaction parameters that were used for previous low pressure
microreactor testwork were employed, with the reactor temperature being the
variable which was tested at 200, 250 and 300 ⁰C. The 20CoSA6X75c catalyst
was used for this study because it showed superior activity to its 20 wt.% metal
counterparts, its carbon and acid balances were good compared to other
reactions and for a reaction at 250 ⁰C and it appeared to be stable for the
duration of the four day reaction period.
Figure 3-71 shows the rates of ethanol production for the three temperatures
investigated with 20CoSA6X75c under a reducing atmosphere.

Chapter 3.5 149
Figure 3-71: Best fits for temperature study for rates of ethanol production
Ethanol production is seen to be severely limited at the 200 ⁰C and 300 ⁰C
reactions, especially in comparison to the 250 ⁰C reaction, and does not appear
to produce anywhere near the same levels of ethanol at these temperatures.
Although the graph in figure 3-71 only shows ethanol production, other potential
products from were also monitored for each of these reactions. Table 3-30
shows the selectivity averages for days one and four of the reaction for each of
the temperatures investigated. GC analysis of the product stream did not show
the presence of products such as acetaldehyde and ethyl acetate. Online MS
monitoring of the product stream was continued in this study, although as the MS
was not calibrated, the species are not quantifiable.

Chapter 3.5 150
Table 3-30: Selectivities on day averages at end and start of reaction
Reaction
Temperature
200 ⁰C 250 ⁰C 300 ⁰C
DAY 1 4 1 4 1 4 Sele
cti
vit
ies
(%)
Ethanol 1.8 0.3 82.2 19.8 0.1 0.9
Ethyl Acetate 0 0 0 0 0 0
Acetaldehyde 0 0 0 0 0 0
Conversion (%) 13.7 35.5 7.9 30.7 98.4 98.7
The MS profiles, in figures 3-72, 3-73 and 3-74, show the trends for comparison
of the three different temperature reactions completed. Previous investigations
into acetic acid hydrogenation using cobalt catalysts [2] identified the instability
of acetate species on a cobalt surface and the subsequent decomposition
through an acetic anhydride intermediate route. The systems tested there were
bulk cobalt, or supported on silica. Cressely’s results [2] for cobalt on silica
show conversion of acetic acid to ethanol, but also the decomposition to CH4 and
CO2. These decomposition products were also monitored during the course of
our reaction, with the profiles shown in the figures 3-72 to 3-74.

Chapter 3.5 151
Figure 3-72: MS data for day one of 20CoSA6X75c 250 ⁰C reaction
Figure 3-73: MS data for day one of 20CoSA6X75c 300 ⁰C reaction

Chapter 3.5 152
Figure 3-74: MS data for day four of 20CoSA6X75c 300 ⁰C reaction
The MS data, seen in the above three figures, shows two distinct profiles; with a
seemingly increased CH4 make for the reaction at 300 ⁰C, across the four day
reaction period, compared to the 250 ⁰C reaction. This reflects the pattern seen
with Cressely’s cobalt catalysts [2] where an increase in temperature equated to
an increase in the methane make for his highest loading catalyst.
3.5.1.1 Post-reaction analysis
Post-reaction XRD analysis was carried out on the catalysts from the three
temperatures investigated. Figure 3-75 shows no difference between the
patterns.

Chapter 3.5 153
Figure 3-75: XRD patterns of the various temperature samples post-reaction
The highlighted section shows on the area of the diffraction pattern where peaks
corresponding to cobalt metal or cobalt oxide would be expected. As is clear
from the XRD patterns, there are peaks visible against the alumina background
that are attributable to cobalt at any of the temperatures investigated.
Compared to the copper catalyst patterns seen in chapter 3.4, where the copper
peaks post-reaction are clearly visible, it demonstrates once more that the
amount of metal sintering for cobalt is lower than for copper even at slightly
elevated temperatures.
BET analysis on the post-reaction sample was also employed to help ascertain
any changes in the catalyst as a result of the temperature variance. A consistent
decrease is visible in the BET surface area in the catalyst’s post-reaction,
compared to that of the calcined catalyst. The apparent temperature
independence of the decrease in surface area suggests that the temperatures
tested were not diverse or extreme enough, but also that the decrease in
surface area may be an artefact of acetic acid in the system rather than an
effect of temperature.

Chapter 3.5 154
Table 3-31: BET data for 20CoSA6X75c tested at a range of temperatures
Reaction Temperature Calcined catalyst
200 ⁰C 250 ⁰C 300 ⁰C
BET Surface Area
(m2/g)
237 179 165 188
Pore Volume
(cm3/g)
0.64 0.58 0.55 0.63
Av. Pore Diameter (nm) 11 13 13 13
TPOs were performed on the catalysts post-reaction. The usual decrease of the
catalyst sample upon exposure to the oxidising gas was observed for the three
TPO profiles. Comparison of the 250 ⁰C and 300 ⁰C TPO profiles in figure 3-76
shows the same low temperature evolution corresponding to H2O for both
samples. Additionally a mass decrease event was seen in both profiles centring
around 300 ⁰C.
Figure 3-76: TPO data of post-reaction 20CoSA6X75 for 250 and 300 ⁰C reactions

Chapter 3.5 155
Figure 3-77: MS data of post-reaction 20CoSA6X75 for 250 and 300 ⁰C reactions
The mass decreases seen in both profiles in figure 3-76 centring on 300 ⁰C have
corresponding evolutions of CO2 and CO in figure 3-77 in the same region,
indicative of the combustion of surface carbonaceous species. The TPO and MS
profiles for the 300 ⁰C reaction show a single event for both CO and CO2 at 278
⁰C. The profiles for the 250 ⁰C reaction also show this sharp event but it appears
to be shouldered by a secondary event with the same combustion products at a
slightly higher temperature. This slight variance in the TPO profiles suggests a
difference in the species on the catalyst surface and that different surface
reactions taking place. This combined with the MS monitoring during the
reaction, shows that there is a difference in the surface reactions, the product
profile and the residual surface species between the reactions completed at 250
and 300 ⁰C on samples of the same catalyst.
No high temperature evolutions were seen, suggesting that the carbon present
on the surface of the catalyst post-reaction was in the form of surface acetate
species rather than carbonaceous residues which would combust at a higher
temperature than 300 ⁰C.

Chapter 3.5 156
3.5.1.2 Argon only reactions
Comparative reactions to those described above (catalyst 20CoSA6X75c at a
range of three temperatures) were completed under an inert atmosphere using a
flow of 60 ml min-1 Ar.
The reactions under argon where the same acetic acid feed was used show,
unsurprisingly, no conversion to ethanol or any other reduction product. The
corresponding MS monitoring does however show the presence of decomposition
products: CO, CO2 and CH4 in the exit stream.
Comparing the MS profiles for the two reactions at 300 ⁰C, one under an inert
atmosphere and the other under a reducing atmosphere, seen in figures 3-73 and
3-74, a similarity in the profiles is observed.
Figure 3-78: MS data of 20CoSA6X75 reaction at 300 ⁰C
Once more, the post-reaction catalyst samples were analysed by XRD, and as
previously seen with the samples from the reducing atmosphere, there was no
identification of peaks attributable to cobalt metal or cobalt oxide against the
alumina background. The highlighted box in figure 3-79 shows the degree range

Chapter 3.5 157
in which it would have been expected to observe peaks, if they had been
present.
Figure 3-79: XRD patterns of post-reaction 20CoSA6X75, reactions at varying temperatures
TPO analysis was completed for the three catalyst samples. Similar profiles
were obtained for the three samples and the 300 ⁰C reaction sample is displayed
in figure 3-80 to show a direct comparison to the 300 ⁰C reaction under a
reducing atmosphere in figure 3-77.

Chapter 3.5 158
Figure 3-80: TPO profile of post 300 ⁰C reaction 20CoSA6X75
The TPO profile in figure 3-80 for the 300 ⁰C argon reaction is reminiscent of the
300 ⁰C reducing atmosphere TPO profile, where the major reaction that occurred
was the decomposition of the acetic acid feed. The similarities in the TPO
profiles, in combination with the reaction MS profile, show that acetic acid
decomposition is the reaction occurring under the inert atmospheres.
BET measurements of the post-reaction samples, shown in table 3-32, were
carried out. Here the same post-reaction decrease in surface area was observed
to a similar extent as with the reaction completed under a reducing
environment.

Chapter 3.5 159
Table 3-32: BET data of post-reaction 20CoSA6X75, reactions at varying temperatures
Reaction Temperature Calcined catalyst 200 ⁰C 250 ⁰C 300 ⁰C
BET Surface Area
(m2/g)
236.8 145.9 158.9 166.8
Pore Volume
(cm3/g)
0.64 0.51 0.55 0.54
Av. Pore Diameter (nm) 11 14 13 13
3.5.1.3 Summary
From the temperature dependence study using 20 wt.% cobalt catalyst,
20CoSA6X75c, a reaction temperature of 250 ⁰C appears to be the optimum
temperature for ethanol production of the three temperatures tested. The
reaction temperature used with the 20 wt.% cobalt on alumina catalyst has a
profound impact on the activity of the catalyst and also the product profile
resulting from the reaction.
The optimal temperature was seen to be 250 ⁰C which gave a major selectivity
to ethanol. The 200 ⁰C and 300 ⁰C reactions do not produce similar levels of
ethanol to the 250 ⁰C reaction. The 300 ⁰C reaction showed a much higher
conversion value than the 200 ⁰C and 250 ⁰C. This is not reflected with an
increase in the amount of C2 oxygenate compounds produced, but instead results
in a visible increase in the methane profile in the online MS analysis. With an
increase in temperature, an increase in further hydrogenation to the alkane
products is observed.
A repeat of the reactions under an inert atmosphere of argon, as opposed to the
reducing hydrogen atmosphere, shows decomposition is the primary reaction for
the three temperatures. This is confirmed by the TPO and MS profiles.
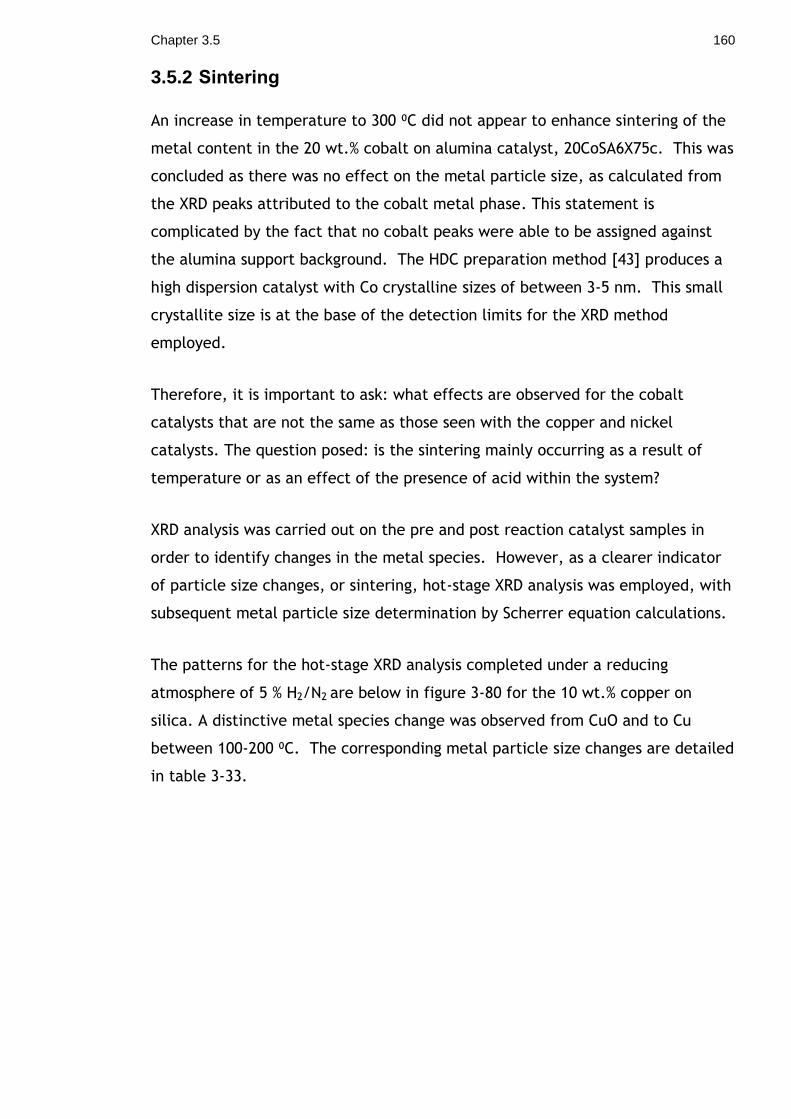
Chapter 3.5 160
3.5.2 Sintering
An increase in temperature to 300 ⁰C did not appear to enhance sintering of the
metal content in the 20 wt.% cobalt on alumina catalyst, 20CoSA6X75c. This was
concluded as there was no effect on the metal particle size, as calculated from
the XRD peaks attributed to the cobalt metal phase. This statement is
complicated by the fact that no cobalt peaks were able to be assigned against
the alumina support background. The HDC preparation method [43] produces a
high dispersion catalyst with Co crystalline sizes of between 3-5 nm. This small
crystallite size is at the base of the detection limits for the XRD method
employed.
Therefore, it is important to ask: what effects are observed for the cobalt
catalysts that are not the same as those seen with the copper and nickel
catalysts. The question posed: is the sintering mainly occurring as a result of
temperature or as an effect of the presence of acid within the system?
XRD analysis was carried out on the pre and post reaction catalyst samples in
order to identify changes in the metal species. However, as a clearer indicator
of particle size changes, or sintering, hot-stage XRD analysis was employed, with
subsequent metal particle size determination by Scherrer equation calculations.
The patterns for the hot-stage XRD analysis completed under a reducing
atmosphere of 5 % H2/N2 are below in figure 3-80 for the 10 wt.% copper on
silica. A distinctive metal species change was observed from CuO and to Cu
between 100-200 ⁰C. The corresponding metal particle size changes are detailed
in table 3-33.

Chapter 3.5 161
Figure 3-81: HS XRD patterns for CuNQ10c
Table 3-33: HS XRD particle sizes for CuNQ10
Temperature (⁰C) Species Particle Size (nm)
400 Cu 21.6
300 Cu 18.8
200 Cu 17
100 CuO 16.7
The hot-stage XRD patterns show a steady increase in metal particle size with
temperature increase, with the largest increase seen between 300 and 400 ⁰C.
This distinction is to be expected given the temperature limitations of using
copper which has an increased propensity for sintering at temperatures above
300 ⁰C.
Similar hot-stage XRD analysis was carried out for the 10wt% nickel on silica
catalyst. In figure 3-82, there is distinctive change in metal species from the
nickel oxide to nickel metal. Although this reduction mirrors that observed with
the 10 wt.% copper on silica catalyst, the temperature range at which this

Chapter 3.5 162
occurs is 100 C higher than for the copper catalyst.
Figure 3-82: HS XRD patterns for 10 wt.% Ni on silica catalyst
Table 3-34: HS XRD particle sizes for 10 wt.% Ni on silica catalyst
Temperature (⁰C) Species Particle Size (nm)
500 Ni 14.0
400 Ni 13.2
300 Ni 13.2
200 NiO 14.0
100 NiO 15.8
RT NiO 16.3
Metal particle sizes were also calculated from the XRD patterns. Despite some
variance, the particle sizes did not appear to increase with temperature for the
nickel catalyst under the hot-stage XRD conditions as opposed to the increase
observed under the same parameters for the 10 wt.% copper on silica catalyst.
The impregnated supported metal catalysts were prepared via a technique that
is not known for strict particle size control. Conversely, the HDC preparation
technique produces catalysts with a strict metal particle size range of 3-5 nm.
Chapter 3.5 163
Hot-stage analysis of the HDC copper catalyst in figure 3-83 gives patterns that
are dominated by the alumina background. The highlighted area is the degree
range in which peaks attributable to copper metal would be observed. However,
no peaks are distinct above the alumina background even at the higher
temperatures of 400 and 500 ⁰C.
Figure 3-83: Hot-Stage XRD patterns for 20CuSA6X75
3.5.2.1 Summary
Metal particle size increases were seen in the 10 wt.% copper on silica catalyst
post reaction samples. The copper catalysts post reaction was subject to high
levels of sintering, which was not seen with the cobalt catalysts.
No peaks attributable to the metal components were visible on the HDC
catalysts on SA6X75 due to the large alumina peaks as a background. In
addition, the preparation method produces particle sizes that should be in the
range of 3-5 nm, which is around the low threshold for visibility on a XRD
pattern.

Chapter 3.5 164
3.5.3 Bed Profiling
Profiling of the 20 wt.% cobalt on alumina catalyst bed was conducted by
changing the bed depth, and in turn, investigating the activity of the bed
profile.
Unlike traditional bed profiling, the standard bed of 1 ml of catalyst was halved
to ½ ml, and also doubled to 2 ml, to produce a range of catalyst bed depths.
This was done to ensure that the thermocouple probe was situated centrally
within the catalyst bed. Reduction to a quarter of the standard depth (¼ ml)
would not have allowed for this central thermocouple positioning and would not
have given sufficient temperature indication of the catalyst bed.
Figure 3-84: Bed profile relating bed depth to conversion to ethanol using 20CoSA6X75 catalyst

Chapter 3.5 165
Figure 3-85: Bed profile summary using 20CoSA6X75
As can be seen from both profiling summaries in figures 3-84 and 3-85, there is a
clear linear relationship between catalyst bed depth and the conversion of
acetic acid to ethanol. The relationship between rate and the catalyst quantity
are as would be expected, given that an increase in catalyst quantity and bed
depth increases the amount of catalytic sites available for reaction. Additionally
an increase in the bed depth would increase the residence time of the acetic
acid over the catalyst bed, increasing the reactant- catalyst contact time.
3.5.4 Effect of Support Study
The effect of the support study ties in directly to the fundamental aims and
objectives of this project. It asks the pertinent question: “Does a particular
support have an increased activity and selectivity, even when using the same
metal and at the same loading levels?” Given the catalysts examined throughout
this research, the activity and stability of the cobalt based catalysts present
cobalt as the best option of the three base metals investigated.
Impregnation catalysts with a 10 wt.% cobalt metal loading were produced on
each of the following supports: silica Q10, alumina SA6X75 and titania ST61120.
Additionally, a BP commercial 10 % Co/ZnO catalyst was also tested. Each of the

Chapter 3.5 166
catalysts (excluding CoZnO) were prepared in the laboratory via an impregnation
technique to a 10 wt.% cobalt loading. Each catalyst was tested in the same low
pressure fixed bed reactor and under the same conditions as in chapter 3.6, for
direct comparison between the supports.
Table 3-35: 10 wt.% cobalt catalysts with different supports
Support Catalyst
Silica CoA(10)Q10c
Alumina CoN(10)SA6X75c
Titania CoN(10)ST61120c
Zinc Oxide CoZnO (BP catalyst)
Each catalyst was prepared onto a pelletized support or was supplied in that
form. Prior to characterization and testing, all catalysts were crushed with the
250-425 µm particle size fraction used.
3.5.5 Supports
As part of the study into the effect of the support on the activity of the catalyst,
it was important to be able to test the supports individually without the
presence of the metal active phase.
3.5.5.1 Silica and Alumina Catalysts (CoN(10)Q10c and CoN(10)SA6X75c)
Of the four supports mentioned in this study, the silica Q10 and alumina SA6X75
have already been described in previous chapters. When previously mentioned
within the context of testing on the low pressure glassline reactor system, the
silica Q10 support displayed no activity for the hydrogenation of acetic acid to
ethanol or to any other products. Following the on-line analysis of the product
stream showed no hydrogenation products or otherwise. Similarly the alumina
SA6X75 support was also tested on the low pressure reactor and also did not
show any activity for the hydrogenation process. And, no individual support
testing was carried out on either the titania or zinc oxide.

Chapter 3.5 167
3.5.5.2 CoN(10)ST61120
The titania support used for the 10 wt.% cobalt on titania catalyst was Saint-
Gobain Norpro ST61120, which was supplied in the form of 3 mm pellets. The
XRD pattern showed sharp defined peaks that corresponded to the anatase form
of titania. BET analysis of the titania support showed a slightly lower surface
area value to that of the silica and alumina supports investigated.
3.5.5.3 CoZnO
The 10 wt.% cobalt on zinc oxide tested was a commercial BP catalyst, primarily
used as in Fischer-Tropsch catalysis. The catalyst was pre-calcined upon receipt
and was subsequently crushed from its pelletised form into the 250-425 µm
fraction. XRD analysis of the CoZnO was completed pre-reaction and is seen in
figure 3-96. The assignable features correspond to the presence of zinc oxide,
as expected. The catalyst had a low surface area calculated by BET
measurements of 11.6 m2/g. This value is significantly lower than that observed
for the alumina, silica and titania support systems also investigated.
3.5.5.4 Summary of Reduction Conditions
Reduction temperatures were identified from the TPR profiles of the calcined
catalysts. A standard set of reduction conditions were employed for the 10 wt.%
cobalt catalysts shown in table 3-36.
Table 3-36: Reduction conditions for cobalt based catalysts in catalyst support study
Temperature (⁰C) 350
Ramp Rate (⁰C/min) 10.0
Hold (mins) 240
3.5.6 Comparison of 10 wt.% cobalt catalysts
Each 10 wt.% cobalt catalyst was tested under the same conditions and using the
same volume of catalyst (1 ml). The reaction conditions, shown in table 3-37,
were the same as for all standard catalyst testing on the low pressure glass
microreactor system.

Chapter 3.5 168
Table 3-37: Table of reaction conditions for 10 wt.% cobalt catalysts
Temperature (⁰C) Ramp Rate (⁰C min-1) H2 Gas Flow (ml min-1)
250 10.0 60
Figure 3-86: Trend lines for the rates of ethanol production for 10 wt.% cobalt catalysts
There is significant variance in the rates of ethanol production between the
catalysts but the trend for each catalyst is quite distinctive. Apart from
ST61220, which has a maintained ethanol production rate registering zero, the
other trends vary quite a lot. Both Q10 and SA6X75 have increasing activity with
time, although is a large disparity between the activities.
The initial high activity of CoZnO is followed by a rapid deactivation of the
catalyst which continues over the four day reaction period. This deactivation
was seen to be a possibility due to the reactivity of the zinc oxide support with
the acetic acid feed. A similar issue had been encountered with acetic acid and
zinc oxide when using the commercial methanol synthesis catalyst, as discussed
in chapter 3.2.

Chapter 3.5 169
A surprising trend was observed with the 10 wt.% cobalt on silica, whose rate of
ethanol production continued to increase throughout the reaction time. This
trend is suggestive of a lack of complete activation of the catalyst post-
reduction. An alternative explanation would be that a change in the catalyst or
specifically changes to the metal active sites which make the catalyst more
active for ethanol production as the reaction progresses. These trends are
observed with the conversions and selectivity values shown in table 3-38.
Table 3-38: Table of results for each 10 wt.% Co catalyst on days one and four
Catalyst CoA(10)Q10c CoN(10)SA6X75c CoN(10)ST61120c CoZnO
DAY 1 4 1 4 1 4 1 4
Acid to
EtOH(%)
1.1 7.7 12.9 17.4 0.3 -- 51.8 25.3
Acid to Ethyl
Acetate (%)
0.4 0.7 -- -- <0.1 -- -- --
Acid to
Acetaldehyde
(%)
-- -- -- -- -- -- -- --
Acid (%) 98.2 91.8 58.4 48.8 69.0 79.0 39.5 48.6
Conversion
(%)
1.8 8.2 41.6 51.2 31.0 21.0 60.5 51.4
Online mass spectroscopy was monitored throughout the reactions. Despite this
online system having no quantification of the results, we are still able to
compare between samples and investigate the ratios. Looking at the MS data in
figures 3-89 to 3-90 for day one for each of the 10 wt.% Co catalysts tested, we
can see similarities between SA6X75, Q10 and ST61120 catalysts.

Chapter 3.5 170
Figure 3-87: Day one of reaction MS data for CoA(10)Q10c
Figure 3-88: Day one of reaction MS data for CoN(10)SA6X75c

Chapter 3.5 171
Figure 3-89: Day one of reaction MS data for CoN(10)ST61120c
Figure 3-90: Day one of reaction MS data for CoZnO
CoZnO has a distinctly different MS pattern, seen in figure 3-90, from the other
catalyst reactions with CH4 product being much more pronounced.

Chapter 3.5 172
3.5.7 Post-reaction characterisation
3.5.7.1 CoA(10)SA6X75
XRD analysis of the 10 wt.% cobalt on alumina catalyst showed no discernable
difference in the patterns between the calcined and post-reaction samples. No
distinctive peaks attributable to cobalt oxide or metallic cobalt were visible
against the alumina background. The same inability to observe metal species
features against the SA6X75 alumina XRD pattern was also encountered in the 20
wt.% base metal catalysts investigated in chapter 3.4.
The post-reaction TPO in figure 3-91 shows an initial loss around 100 ⁰C for H2O
and then an additional single decomposition event.
Figure 3-91: TPO of post-reaction 10 wt.% Co on SA6X75

Chapter 3.5 173
Figure 3-92: TPO-MS of post-reaction 10 wt.% Co on SA6X75
The large singular exothermic event at 287 ⁰C in figure 3-92 has corresponding
evolution events for CO2 and CO. There is also a small corresponding peak for
H2O at the same event.
BET analysis shows no dramatic change in the surface area and pore volume
measurements between the calcined catalyst and a post-reaction sample.
Table 3-39: BET results pre- and post-reaction for 10 wt.% Co on alumina SA6X75
Catalyst Surface Area (m2/g)
Pore Volume (ml/g)
Av. Pore Diameter (nm)
CoN(10)SA6X75c 179.6 0.53 12
CoN(10)SA6X75rG56 186 0.62 13

Chapter 3.5 174
3.5.7.2 CoA(10)Q10c
XRD analysis of the cobalt on silica catalyst shows growth in the cobalt
crystallite size between the calcined catalyst and the post-reaction sample. In
the calcined sample, there are no peaks assignable to cobalt oxide against the
amorphous silica background. Post-reaction, the presence of Co peaks confirms
that the cobalt oxide was fully reduced and remained so throughout the
reaction.
Figure 3-93: XRD patterns of calcined and post-reaction 10 wt.%Co on silica catalyst samples
The post reaction TPO of the catalyst revealed a low temperature evolution of
CO2 at 323 ⁰C in figure 3-93, at a similar temperature to that seen in the TPO for
10 wt.% cobalt on alumina, suggesting similar species decomposition.
BET analysis of the catalyst in table 3-40, shows additional changes to the
catalyst during the reaction with a decrease in surface area, a slight decrease in
pore volume and an increase in the average pore diameter.

Chapter 3.5 175
Table 3-40: BET results pre- and post-reaction for 10 wt.% Co on silica Q10
Catalyst Surface Area
(m2/g)
Pore Volume
(ml/g)
Av. Pore
Diameter (nm)
CoA(10)Q10c 255.2 0.98 13
CoA(10)Q10rG47 201.2 0.81 16
3.5.7.3 CoN(10)ST61120
The 10 wt.% Co on titania showed severely limited activity towards the
production of ethanol when tested on the low pressure glass microreactor.
Despite not showing activity for ethanol, ethyl acetate or acetaldehyde
production, the MS profile in figure 3-89 was not dissimilar to that of the
alumina and silica based 10 wt.% cobalt catalysts.
XRD analysis of the catalyst does not show any significant change in the patterns
between the calcined and post-reaction samples. The highlighted are in figure
3-93, around a value of 45⁰, would be the area in which peaks corresponding
metallic cobalt would be observed.
Figure 3-94: XRD patterns of 10 wt.% Co on titania; calcined and post-reaction

Chapter 3.5 176
Post-reaction TPO analysis reveals a decomposition event at 323 ⁰C in figure 3-
95.
Figure 3-95: TPO for post-reaction 10 wt.% Co on ST61120
The evolution event at 323 ⁰C, seen in figure 3-96, corresponds to an evolution
of CO2 and to a much lesser extent CO. This evolution is at a similar
temperature to that the other 10 wt.% cobalt catalysts and would suggest that
combustion products of similar species are evolving from the catalyst surface.

Chapter 3.5 177
Figure 3-96: TPO-MS for post-reaction 10 wt.% Co on ST61120
BET analysis, shown in table 3-41, of the 10 wt.% cobalt on titania shows a slight
decrease in surface area post-reaction. This decrease is observed even though
the initial surface area of the titania support is lower than that of the alumina
and silica alternatives.
Table 3-41: BET results for pre- and post-reaction 10 wt.% Co on titania ST61120 catalyst
Catalyst Surface Area
(m2/g)
Pore Volume
(ml/g)
Av. Pore
Diameter (nm)
CoN(10)ST61120c 116.5 0.29 10
CoN(10)ST61120rG55 90.1 0.26 12
The amphoteric nature of titania could suggest an explanation for the lack of
activity of the titania based catalyst. We can see that cobalt as a metal is
active for the hydrogenation of acetic acid to ethanol, however this reduction is
severely limited on the titania catalyst, suggesting that the acetic acid reacts

Chapter 3.5 178
with the basic sites on the titania support rather than being hydrogenated
through to the alcohol product.
3.5.7.4 CoZnO
The cobalt on zinc oxide catalyst was seen to deactivate rapidly over the
duration of the hydrogenation reaction and as such changes in the physical
properties of the catalyst would be expected.
XRD analysis in figure 3-97 of the CoZnO catalyst shows a decrease in
crystallinity between the pre- and post- reaction samples, although no peaks are
identifiable as cobalt species.
Figure 3-97: XRD patterns for 10% Co on Zinc Oxide; calcined and post-reaction
The post reaction TPO of the catalyst in figure 3-98 revealed a weight gain
around 300 ⁰C, as opposed to the traditional weight loss seen in the other TPOs
for the alternative 10 wt.% cobalt catalysts.

Chapter 3.5 179
Figure 3-98: TPO of post-reaction 10% Co on ZnO
Interestingly, the uptake of O2 during this 2 % weight gain produces a small
evolution of CO2. No CO evolution was observed within MS data.
Figure 3-99: TPO-MS of post-reaction 10 wt.% Co on ZnO

Chapter 3.5 180
BET analysis of the catalyst gives a clear indication of severe changes in the
catalyst over the course of the reaction, as clear in table 3-42. The 90 %
decrease in the pore volume of the catalyst along with diminished values for
surface area and pore diameter are indicative of a sharp drop in crystallinity of
the zinc oxide support. This is in agreement with the loss of crystallinity also
observed in the XRD patterns in figure 3-97.
Table 3-42: BET results for pre-and post-reactions for 10 wt.% Co on ZnO
Catalyst Surface Area
(m2/g)
Pore Volume
(ml/g)
Av. Pore
Diameter (nm)
CoZnO 11.6 0.1 35
CoZnOrG57 8.8 0.01 13
Significant decreases in the surface area, pore volume and average pore
diameter of the CoZnO catalyst is in line with the activity decrease seen in the
ethanol production rates in figure 3-86. This is in agreement with observations
seen with the methanol synthesis catalyst. As the methanol synthesis catalyst
also contains a zinc oxide component, the removal of ZnO from the catalyst
particle via the reaction of acetic acid and ZnO to produce zinc acetate was
observed. In addition, in the case of CoZnO, we saw the presence of lilac
coloured crystals in the reactor tube post-reaction. The crystals were deposited
around the temperature junction at the edge of the heated section of the
reactor tube, mirroring the crystal deposits observed when using the methanol
synthesis catalyst at HRTC which are discussed in chapter 3.2.
Analysis of the lilac crystals proved difficult due to the small quantity of crystals
formed from the samples, but the colour of the crystals suggests that it is a
cobalt containing complex. The small amount of crystals available, even in a
capillary tube, was not enough for a distinctive diffraction pattern to be gained.
Alternatively the sample was analysed via both 13C and 1H NMR. The results
listed below identify that the product contains acetate groups.

Chapter 3.5 181
NMR analysis was completed using a 400 MHz spectrometer with DMSO as the
solvent. 1H NMR (δH) = 1.80 (3H, CH3). Solvent peaks DMSO = 2.50 ppm, H2O =
3.46 ppm. 13C NMR (δC) = 200.3 (C=O), 22.43 (CH3). Solvent peaks DMSO = 39.58
ppm.
3.5.8 Summary
This direct comparison of catalysts with the same metal loading of 10 wt.%
cobalt but with varying catalyst supports allowed an investigation into the
impact of the support on the activity of the catalyst. The alumina catalyst is
seen to be the best performer for the hydrogenation of acetic acid to ethanol.
The four 10 wt.% cobalt catalysts all produce ethanol as their major or only
product, so the activity of the catalysts can be represented solely by the rates of
ethanol production. The CoA(10)Q10 catalyst shows an encouraging increase in
activity over time, although there was a question about the possibility of an
incomplete reduction of Co during the reduction process. A gradual reduction of
the Co species to the active Co metal species over time might explain the
gradual increase in activity but given that all the catalysts, except CoZnO, gave
similar TPR profiles, this would be unexpected. However, the 10 wt.% Co on
alumina and titania were prepared from the nitrate precursor whilst the 10 wt.%
Co on silica was prepared from the acetate precursor.
There is research [43, 56] that attributes definitive differences in metal particle
size control, metal reduction and intermediate species production differences
dependent on the precursor species used in the preparation techniques,
especially with regard to cobalt catalysts used in Fischer-Tropsch chemistry.
This may be something unique to cobalt, as the studies with the acetate and
nitrate precursors for copper, although they give different intermediates,
appear to display the same end activity.
The titania based catalyst displayed limited activity which may be attributable
to the amphoteric nature of the titania support. CoZnO’s initial rate of ethanol
production is encouraging although its rapid deactivation was not unexpected
due to the reactivity of ZnO and acetic acid. Its rapid and continuing decrease
in rate, below its silica and alumina counterparts, demonstrates the required

Chapter 3.5 182
stability and inertness of a catalyst support, especially in this reaction with a
corrosive reactant.

183
4 Conclusions
Previous literature on the hydrogenation of acetic acid [2] showed activity for
copper based catalysts, which outperformed their base metal counterparts for
the production of ethanol. However, the activity of the copper catalysts was
low in comparison to the precious metal alternatives [18]. The activity of a
copper based catalyst was again observed when acetic acid was hydrogenated to
ethanol over a methanol synthesis catalyst [1] whilst investigating the possible
effects of acetic acid in a carbonylation recycle stream. Following these
observations, this research project aimed to investigate if base metal catalysts
could produce ethanol at the same rates and selectivities as seen with precious
metals. In doing so, it looked to identify potential acid –tolerant base-metal
catalysts for the selective hydrogenation of acetic acid to ethanol.
The first base metal catalyst investigated was the methanol synthesis catalyst
which was highly active for the hydrogenation of acetic acid to ethanol. It also
deactivated rapidly. This deactivation combined with a lack of stability made it
a non-viable option as an acetic acid hydrogenation catalyst. However, the high
initial activity for the methanol synthesis catalyst is attributable to its high
copper content. A linear relationship observed with the low copper loaded
catalysts confirms the link between increased catalyst copper content and
increased activity.
Aside from the catalyst composition, the design of the reactor used for testing
also plays an important role in the product profiles seen. The differential
reactor with its internal recycle increased the opportunities for esterification to
ethyl acetate compared to fixed bed reactors; a trend which was observed
amongst the copper based catalysts. Reactor design impact was observed with
copper on silica catalysts which were much more active for the esterification
reaction in the integral reactor than in the comparative fixed bed system.
Further investigations into reaction variables explored the use of higher acetic
acid feed rates. A consequence of using high acetic acid concentrations was
increased degradation of copper based catalysts. This was observed through
sintering of the copper component into visible metal flakes exterior to the
catalyst. Zinc oxide extraction from the catalyst pellets was observed with the
Chapter 4 184
methanol synthesis catalyst. These physical catalyst degradations show why
copper based catalysts are inappropriate for use with acetic acid.
Following this, alternative catalysts using cobalt and nickel were tested against
a copper based system. Of the three base metals, cobalt was the most active.
However, the activity of the cobalt catalyst increased over time. A possible
explanation for this is the initial incomplete reduction of the catalyst. A gradual
reduction in the cobalt species to the active Co metal species over time may
explain the gradual increase in activity. Alternatively, the activity increase may
be a result of increases in metal particle size due to sintering during the
reaction. This observation demonstrated that either the reduction profile
employed was not appropriate or that stricter control over the cobalt particle
size was necessary to optimise activity.
The data for the 5 wt.% and 10 wt.% copper catalysts clearly shows a link
between activity and metal loading on the catalyst. When the metal loading was
increased to 20 wt.% for each of the base metal investigated, the cobalt catalyst
was again superior. It gave the highest conversion with the highest selectivity to
ethanol, whilst remaining stable over the four day reaction period. The 20 wt.%
cobalt on alumina was the best catalyst investigated for this process.
Optimisation of the conditions for a cobalt catalyst included investigations into
the reaction temperature. It was observed that 200 ⁰C was too low with minimal
activity observed, whilst 300 ⁰C was too high with methane produced. An
optimal temperature of 250 ⁰C yielded the highest ethanol production.
Additional optimisation investigated the impact of supports on the activity of a
cobalt based catalyst. Four supports were tested with a 10 wt.% cobalt loading,
of which alumina was observed as the optimal support. The silica based catalyst
was also active for ethanol production, but like the other silica systems tested
also facilitated the secondary esterification reaction. The titania supported
catalyst exhibited no activity towards the production of ethanol. The
amphoteric nature of titania could be an explanation for the lack of activity, as
the acetic acid would react with the basic sites on the support rather than be
converted to ethanol. CoZnO’s initial rate of ethanol production is encouraging
although its rapid deactivation was not unexpected due to the reactivity of ZnO

Chapter 4 185
and acetic acid. Its rapid and continuing decrease in rate, below its silica and
alumina counterparts, demonstrates the required stability and inertness of a
catalyst support, especially in this reaction with a corrosive reactant.
Comparison of all the base metal catalysts investigated in this project showed
that cobalt based systems gave the most desirable results. The 20 wt.% cobalt
on alumina, specifically, demonstrated the highest stable activity towards
ethanol for the duration of the reaction period at an optimum reaction
temperature of 250 ⁰C. Despite the high metal loading, which is not desirable,
the catalyst still does not achieve the activity expected from an ideal catalyst
for hydrogenation of acetic acid to ethanol. Its stability, however, both in terms
of ethanol production and catalyst integrity offers hope for further research.

186
References
1. Blain, S., Ditzel, E., and Jackson, S. D., A mechanistic study into the effect of acetic acid on methanol synthesis. Catal. Sci., 2012. 2(4): p. 778-783.
2. Cressely, J., Farkhani, D., Deluzarche, A., and Kiennemann, A., The Evolution of Carboxylate Species in the Framework of CO-H2 Synthesis - Reduction of Acetic-Acid on the Co,Cu,Fe System. Mat. Chem. Phys., 1984. 11(5): p. 413-431.
3. Yokoyama, T., Setoyama, T., Fine Chemicals through Heterogenous Catalysis. 2001: Wiley-VCH.
4. Licht, F. O., Renewable Fuels Association, Ethanol Industry Outlook 2008-2013 reports.
5. Monick, J. A., ALCOHOLS: Their Chemistry, Properties and Manufacture. 1968: Reinhold Book Corporation.
6. Surisetty, V. R., Dalai, A. K., and Kozinski, J., Alcohols as alternative fuels: an overview. Appl. Catal., A, 2011. 404(1-2): p. 1-11.
7. Berg, C., World Fuel Ethanol Analysis and Outlook. 2004. 8. Directive 2009/30/EC, in L140/88. 5 June 2009: Official Journal of the
European Union. 9. Energy Policy Act (EPAct) in Public Law 109-58. 2005
http://www.afdc.energy.gov/laws/epact_2005: USA. 10. Ineos Enterprises Ethanol Portfolio. 16 Sep 2013]; Available from:
http://www.ineos.com/en/businesses/INEOS-Enterprises/Portfolio/. 11. Sakuth, M., Lohrengel, G., Maschmeyer, D., and Stochniol, G., US
09/701054: Method for producing a dealuminized catalyst support. 2005, Sasol Germany GmbH (Hamburg, DE): United States.
12. Johnston, V. J., Chen, L., Kimmich, B. F., Chapman, D. J., and Zink, D., US 2010/0197485 A1: Catalysts for making ethanol from acetic acid (Celanese International Corporation), Office, U. S. P., Editor. 2010, Celanese International Corporation: US.
13. Kitson, M. and Williams, P. S., EPO 86302692.8: Alcohols production by hydrogenation of carboxylic acids (BP Chemicals Ltd), Office, E. P., Editor. 1986: GB.
14. Kitson, M. and Williams, P. S., EPO 86302691.0: Alcohols production by hydrogenation of carboxylic acids (BP Chemicals Ltd), Office, E. P., Editor. 1986: GB.
15. Kitson, M. and Williams, P. S., EPO 88302891.2: The catalysed hydrogenation of carboxylic acids and their anhydrides to alcohols and/or esters, Office, E. P., Editor. 1988: GB.
16. Bowker, M. and Cassidy, T. J., Decomposition of Acetate Groups on an Alumina-Supported Rhodium Catalyst. J. Catal., 1998. 174(1): p. 65-71.
17. Bowker, M., Morgan, C., and Couves, J., Acetic acid adsorption and decomposition on Pd(110). Surf. Sci., 2004. 555(1-3): p. 145-156.
18. Olcay, H., Xu, L. J., Xu, Y., and Huber, G. W., Aqueous-Phase Hydrogenation of Acetic Acid over Transition Metal Catalysts. Chemcatchem. 2(11): p. 1420-1424.
19. Alcala, R., Shabaker, J. W., Huber, G. W., Sanchez-Castillo, M. A., and Dumesic, J. A., Experimental and DFT Studies of the Conversion of Ethanol and Acetic Acid on PtSn-Based Catalysts. J. Phys. Chem. B, 2004. 109(6): p. 2074-2085.

187
20. Ferrin, P., Simonetti, D., Kandoi, S., Kunkes, E., Dumesic, J. A., Nørskov, J. K., and Mavrikakis, M., Modeling Ethanol Decomposition on Transition Metals: A Combined Application of Scaling and Brønsted−Evans−Polanyi Relations. J. Am. Chem. Soc., 2009. 131(16): p. 5809-5815.
21. Kiennemann, A., Farkhani, D., Deluzarche, A., and Cressely, J., Evolution des especes carboxylates dans le cadre des syntheses CO-H2. II. Promotion de la formation d'especes acetetates par le choix de supports, de l'alcalinisation et de combinaisons bimetalliques sur systemes Co, Cu, Fe. Mater. Chem. Phys., 1985. 12(5): p. 449-459.
22. US 2011/0282109: Ethanol Production from Acetic Acid Utilizing a Cobalt Catalyst. 2011, Celanese International Corporation: USA.
23. US 2011/0263911: Direct and Selective Production of Ethanol from Acetic Acid Utilizing a Platinum/Tin Catalyst. 2011, Celanese International Corporation: USA.
24. US 2011/0245546: Ethanol Production from Acetic Acid Utilizing a Cobalt Catalyst. 2011, Celanese International Corporation: USA.
25. US 2012/0149949: Process For Producing Ethanol Using A Stacked Bed Reactor. 2012, Celanese International Corporation: USA.
26. US 2012/0178975: Process for Production of Ethanol Using a Mixed Feed Using Copper Containing Catalyst. 2012, Celanese International Corporation: USA.
27. US 2012/0238785: Process For The Production of Ethanol From An Acetic Acid Feed and A Recycled Ethyl Acetate Feed. 2012, Celanese International Corporation: USA.
28. Onyestyák, G., Harnos, S., Klébert, S., Štolcová, M., Kaszonyi, A., and Kalló, D., Selective reduction of acetic acid to ethanol over novel Cu2In/Al2O3 catalyst. Appl. Catal., A, 2013. 464–465(0): p. 313-321.
29. US 2012/0253085: Ethanol Production from Acetic Acid Utilizing a Molybdenum Carbide Catalyst. 2012, Celanese International Corporation: USA.
30. Yoneda, N., Kusano, S., Yasui, M., Pujado, P., and Wilcher, S., Recent advances in processes and catalysts for the production of acetic acid. Appl. Catal., A, 2001. 221(1-2): p. 253-265.
31. Vannice, M. A. and Rachmady, W., Acetic acid hydrogenation over Pt and Fe catalysts. Abstracts of Papers of the American Chemical Society, 2002. 223: p. C7-C8.
32. Rachmady, W. and Vannice, M. A., Acetic acid hydrogenation over supported platinum catalysts. J. Catal., 2000. 192(2): p. 322-334.
33. Bowker, M., On the Mechanism of Ethanol Synthesis on Rhodium. Catal. Today, 1992. 15(1): p. 77-100.
34. Waugh, K. C., Methanol Synthesis. Catal. Lett., 2012. 142: p. 1153-1166. 35. Behrens, M., Kasatkin, I., Kuhl, S., and Weinberg, G., Phase-Pure Cu,Zn,Al
Hydrotalcite-like Materials as Precursors for Copper rich Cu/ZnO/Al2O3 Catalysts. Chem. Mater. 22(2): p. 386-397.
36. Sofianos, A. C., Heveling, J., Scurrell, M. S., Armbruster, A., Guczi, L., Solymosi, F., and TÉTÉNyi, P., Methanol Synthesis Over Copper Based Catalysts: Comparison of Co-Precipitated, Raney-Type and Catalysts Derived from Amorphous Alloy Precursors, in Studies in Surface Science and Catalysis. 1993, Elsevier. p. 2721-2724.
37. Subramanian, N. D., Balaji, G., Kumar, C., and Spivey, J. J., Development of cobalt-copper nanoparticles as catalysts for higher alcohol synthesis from syngas. Catal. Today, 2009. 147(2): p. 100-106.

188
38. Shabaker, J. W., Simonetti, D. A., Cortright, R. D., and Dumesic, J. A., Sn-modified Ni catalysts for aqueous-phase reforming: Characterization and deactivation studies. J. Catal., 2005. 231(1): p. 67-76.
39. Rachmady, W. and Vannice, M. A., Acetic acid reduction to acetaldehyde over iron catalysts I. Kinetic behavior. J. Catal., 2002. 208(1): p. 158-169.
40. Rachmady, W. and Vannice, M. A., Acetic acid reduction to acetaldehyde over iron catalysts II. Characterization by Mossbauer spectroscopy, DRIFTS, TPD, and TPR. J. Catal., 2002. 208(1): p. 170-179.
41. Drossbach, O. and Johannsen, A., U.S. Patent 2018350. 1935. 42. Pinna, F., Supported metal catalysts preparation. Catal. Today, 1998.
41(1-3): p. 129-137. 43. Lok, C. M., Novel highly dispersed cobalt catalysts for improved Fischer-
Tropsch productivity. Stud. Surf. Sci. Catal. , 2004. 147: p. 283-288. 44. Satterfield, C. N., Heterogeneous Catalysis In Industrial Practice. 1991:
McGraw Hill. 45. Nunan, J. G., Bogdan, C. E., Klier, K., Smith, K. J., Young, C.-W., and
Herman, R. G., Higher Alcohol and Oxygenate Synthesis over Cesium-Doped Cu/ZnO Catalysts. J. Catal., 1989. 116: p. 195-221.
46. Handbook of Chemistry and Physics. 90th Edition ed.: CRC. 47. Doesburg, E. B. M., Höppener, R. H., de Koning, B., Xiaoding, X., and
Scholten, J. J. F., Preparation and Characterization of Copper/Zinc Oxide/Alumina Catalysts for Methanol Synthesis, in Studies in Surface Science and Catalysis, B. Delmon, P. G. P. A. J. and Poncelet, G., Editors. 1987, Elsevier. p. 767-783.
48. Aas, N. and Bowker, M., Adsorption and Autocatalytic Decomposition of Acetic-Acid on Pd(110). J. Chem. Soc.-Faraday Trans., 1993. 89(8): p. 1249-1255.
49. von Niekerk, J. N., Acta. Cryst., 1953. 6(8): p. 720-723. 50. Mariño, F. J., Cerrella, E. G., Duhalde, S., Jobbagy, M., and Laborde, M.
A., Hydrogen from steam reforming of ethanol. characterization and performance of copper-nickel supported catalysts. Int. J. Hydrogen Energy, 1998. 23(12): p. 1095-1101.
51. Marino, F., Boveri, M., Baronetti, G., and Laborde, M., Hydrogen production via catalytic gasification of ethanol. A mechanism proposal over copper-nickel catalysts. Int. J.Hydrogen Energy, 2004. 29(1): p. 67-71.
52. Wang, L., Li, D., Koike, M., Watanabe, H., Xu, Y., Nakagawa, Y., and Tomishige, K., Catalytic performance and characterization of Ni–Co catalysts for the steam reforming of biomass tar to synthesis gas. Fuel, 2013. 112(0): p. 654-661.
53. Bridier, B., Lopez, N., and Perez-Ramirez, J., Partial hydrogenation of propyne over copper-based catalysts and comparison with nickel-based analogues. J. Catal. 269(1): p. 80-92.
54. Pant, K. K., Mohanty, P., Agarwal, S., and Dalai, A. K., Steam reforming of acetic acid for hydrogen production over bifunctional Ni–Co catalysts. Catal. Today, 2013. 207(0): p. 36-43.
55. Hu, X. and Lu, G. X., Comparative study of alumina-supported transition metal catalysts for hydrogen generation by steam reforming of acetic acid. Appl. Catal. B. 99(1-2): p. 289-297.
56. Vogelaar, B. M., van Langeveld, A. D., Kooyman, P. J., Lok, C. M., Bonné, R. L. C., and Moulijn, J. A., Stability of metal nanoparticles formed

189
during reduction of alumina supported nickel and cobalt catalysts. Catal. Today, 2011. 163(1): p. 20-26.