Embed Size (px)
Citation preview

lable at ScienceDirect
LWT - Food Science and Technology 63 (2015) 978e984
Contents lists avai
LWT - Food Science and Technology
journal homepage: www.elsevier .com/locate/ lwt
Prediction of various chemical parameters of olive oils with Fouriertransform infrared spectroscopy
Oguz Uncu, Banu Ozen*
Izmir Institute of Technology, Department of Food Engineering, Urla-Izmir, Turkey
a r t i c l e i n f o
Article history:Received 22 December 2014Received in revised form27 April 2015Accepted 2 May 2015Available online 12 May 2015
Keywords:Olive oilPartial least square analysisFTIRQuality parametersOxidative stability
* Corresponding author. Tel.: þ90 232 750 6319; faE-mail address: [email protected] (B. Ozen).
http://dx.doi.org/10.1016/j.lwt.2015.05.0020023-6438/© 2015 Elsevier Ltd. All rights reserved.
a b s t r a c t
Vibrational spectroscopic techniques offer advantages such as rapid and accurate measurements withminimum sample preparation and waste generation. In this study, it was aimed at determining someimportant quality parameters (oxidative stability, colour pigments, fatty acid profile and phenoliccomposition) of olive oils by Fourier transform infrared spectroscopy as one of the vibrational spectro-scopic methods. Partial least square calibration models were constructed in order to reveal any corre-lation between quality parameters and spectral data. Regression coefficients for developed modelsshowed that oxidative stability (0.99), chlorophyll content (0.98), some major fatty acids (palmitic (0.87),oleic (0.94), and linoleic acids (0.97), saturated (0.91), monounsaturated (0.94) and polyunsaturated fattyacids (0.97)), hydroxytyrosol as a phenolic compound (0.97) and total phenolic content (0.99) werepredicted successfully. Variable influence on the projection values indicated that palmitic, vanillic andcinnamic acids and hydroxytyrosol are the most significant contributors to oxidative stability of olive oils.
© 2015 Elsevier Ltd. All rights reserved.
1. Introduction
Olive oil, extracted from the fruit of olive tree, is known for itsprecious nutritional, functional and sensorial qualities. Olive oilconsumption has been increasing in recent years due to its positivehealth effects that are attributed to its balanced unsaturated fattyacid content and the presence of other functional compounds suchas phenolics, tocopherols and chlorophyll (Matos et al., 2007;Temime et al., 2008). Extra virgin olive oil is defined as the oilwhich is produced only by mechanical processes like crushing,malaxation and centrifugation without any further chemicaltreatment. Since no refinement process is involved in its produc-tion, organoleptic and nutritional values of olive oils are well pre-served as well as its defense mechanism against oxidative stress(Perona, Cabello-Moruno, & Ruiz-Gutierrez, 2006). There are manyquality parameters of olive oils that need to be monitored in orderto assure organoleptic and sensorial properties of the final product.One of these parameters is oxidative stability which can provide anidea about the storage history of olive oil. Furthermore, majorcomponents like fatty acid profile and minor components such aspolyphenol content and chlorophyll level are also considered as
x: þ90 232 750 6196.
important contributors to organoleptic and quality properties ofolive oil (Mailer, 2004). Therefore, it is important to determinethese parameters in a fast and a reliable way. For this purpose,spectroscopic methods like near infrared (NIR), mid-infrared (MIR),Raman and NMR have been used in several studies and they haveadvantages compared to time-consuming and expensive traditionalmethods since several analyses could be performed simultaneouslywith minimum waste generation (Moros, Garrigues, & de laGuardia, 2010). For instance, high-resolution 13C NMR was usedto predict oxidative stabilities of different oils including olive oilsuccessfully (Hidalgo, G�omez, Navarro, & Zamora, 2002). Acidityand peroxide index of different types of edible oils were evaluatedby NIR spectroscopy in another study (Armenta, Garrigues, & de laGuardia, 2007). Oxidized fatty acid concentration under differentoxidative status was determined with FTIR (Fourier transforminfrared) spectroscopy in a study by Lerma-García, Sim�o-Alfonso,Bendini, and Cerretani (2011). Also, Raman spectroscopy has beenrecently used in monitoring fatty acid composition of differentvegetable oils with promising results (Dong, Zhang, Zhang,&Wang,2013).
In the literature, FTIR spectroscopy has been mainly used inclassification studies. Moreover, it has also gained popularity on thequantitative analysis due to the fact that the emitted IR energy isdirectly proportional to the concentration of compounds that arepresent in a tested sample (Ismail, van de Voort, & Sedman, 1997).

O. Uncu, B. Ozen / LWT - Food Science and Technology 63 (2015) 978e984 979
FTIR spectroscopy has already been used in peroxide value deter-mination for different vegetable oils (Allendorf, Subramanian, &Rodriguez-Saona, 2012) and in the quantification of fatty acidsand triacylglycerols of olive oils (Galtier et al., 2008).
The aim of the present study is to investigate the ability of FTIRspectroscopy as a fast and a reliable method in the prediction ofsome important quality parameters of olive oils, oxidative stability,colour pigments (chlorophyll and carotenoid), fatty acid profile andphenolic compounds. Moreover, the effect of each measuredchemical constituent on oxidative stability is evaluated.
2. Materials and methods
2.1. Olive oil samples
Sixty four olive oil samples were obtained from the various partsof Karaburun Peninsula of Izmir. Oils were extracted with an in-dustrial scale two phase decanter system (Polat Machinery, Turkey)capable of processing 1.66 tonnes olive/h and located in IzmirInstitute of Technology Campus and Eglenhoca village of Izmir.Samples in glass containers were kept in the dark at refrigerationtemperature (8 �C) after their head spaces were flushed withnitrogen.
2.2. Chemical reagents
All reagents used in the experiments were of analytical gradeand they were obtained from Riedel-de Ha€en (Germany), Sigma-eAldrich (Germany) and Merck (Germany). Phenolic acids (vanillic,syringic, caffeic, p-coumaric, o-coumaric, cinnamic, 4-hydroxyphenyl acetic, 3-hydroxyphenyl acetic and 2, 3-dihydroxybenzoic acids), flavonoids (apigenin, luteolin andvanillin) and phenolic alcohols (tyrosol and hydroxytyrosol) forHPLC analysis were the commercial phenolic standards (Fluka andExtrasynthase). Fatty acid methyl ester (FAME) mixture containingC4eC24 (2e4% relative concentration) was used as a referencestandard (Supelco # 47885-U) for GC analysis.
2.3. Chemical analyses
2.3.1. Oxidative stability (OS)Oxidative stability was determined with Rancimat equipment
(873 Biodiesel, Metrohm, Switzerland) in terms of hour. Tempera-ture range of this equipment is 50e220 �C and temperature sta-bility is less than 0.1 �C. 3 g of olive oil was placed inside the glassreaction vessel for the measurement. Carrier mediumwas selectedas deionized water. Reaction temperature was set to a constantvalue of 120 �C for both columns of Rancimat apparatus with aconstant 20 L/h air flow.
2.3.2. Total phenol content (TPC)FolineCiocalteu spectrophotometric method was used to
determine the total amount of phenolic compounds in the olive oilsamples (Montedoro, Servili, Baldioli, & Miniati, 1992). All the re-sults were calculated in terms of gallic acid (GA) as mg GA/kg oilusing gallic acid standard curve. The measurements were repeatedfor two times for the extracted samples.
2.3.3. High performance liquid chromatography (HPLC) analysis ofphenolic compounds
The procedure from Brenes, García, García, Rios, and Garrido(1999) was used to extract phenolic compounds from olive oilsamples. The extract having gallic acid as an internal standard wasimmediately injected to HPLC.
Amounts of individual phenolic compounds in olive oil weredetermined by an HPLC (Agilent 1200 HPLC, USA) equipped withrefractive index (RI) and photodiode array (DAD) detectors, an autosampler (ALS G1329A) and a column oven. A C18 column(250*4 mm, 5 mm, SGE 8211, Australia) was used in analyses. Col-umn temperature was kept at 35 �C and injection volume was20 mL. Flow rate was adjusted to 1 mL/min. Two different mobilephases were used as water/acetic acid (99.8:0.2 v/v) and methanol.Initial concentrations of mobile phases were 90% for water/aceticacid and 10% for methanol. Concentration of mobile phases wasadjusted over time by the following procedure; firstly, the con-centration of methanol was increased to 30% in 10 min and keptthere for 20 min and at the same time water/acetic acid concen-tration was decreased to 70%. Then, methanol percentage wasincreased to 40% in 10 min, kept for another 5 min, followed byrising up to 50% in 5 min, and kept for 5 min. At last, methanol wasincreased to 60, 70, and 100% in 5 min periods. Finally, initialconditions were attained at the end of 85 min.
Internal standard method was used in order to compensate anyloss of phenolic compounds during the experimental procedures.Gallic acid was chosen as the internal standard. Major phenoliccompounds found in olive oil were determined by using theircommercial standard forms at two different wavelengths of 280and 320 nm. 5-point calibration curves for each standard wereplotted and the results were expressed in terms of mg/kg.
2.3.4. Chlorophyll & carotenoid measurementChlorophyll and carotenoid contents of olive oils were deter-
mined according to a procedure in literature (Mínguez-Mosquera,Rejano-Navarro, Gandul-Rojas, S�anchez G�omez, & Garrido-Fernandez, 1991). 7.5 g of an olive oil sample was weighted into atest tube and filled up to 25 mL with cyclohexane. The absorbancecorresponding to chlorophyll and carotenoid fractions weremeasured by a UV spectrophotometer (Shimadzu UV-2450 Spec-trophotometer, Japan) at 670 nm and 470 nm, respectively.
2.3.5. Fatty acid profile determinationIn order to determine fatty acid profile of the olive oil samples,
firstly methyl esterification reaction was carried out according toEuropean Official Methods of Analysis (European UnionCommission, 1991). After esterification reaction, the solution wasvortexed and centrifuged in order to collect supernatant and thenfiltered into dark brown vials. Immediately after filtration, super-natant was injected into the gas chromatography (GC) device.
Fatty acid profiles of olive oil samples were examined by a GC(Agilent 6890, Agilent Technologies, USA) equipped with an auto-sampler (Agilent 7863 & FID) and a split/splitless (1:50) injector.HP 88 capillary column (Agilent, USA) with dimensions of100 m*0.25 mm ID*0.2 mm was used and helium with 2 mL/minconstant flow rate was selected as a carrier medium. Injectionvolume was 1 mL with the injection temperature of 250 �C whilethe detector temperature was kept at 280 �C. Oven temperaturewas set to 120 �C initially and wasmaintained there for 10min thenincreased with a rate of 3 �C/min until reaching to 220 �C whichwas kept at this temperature for another 5 min. FAME standardpeaks were compared with sample chromatogram and the resultswere expressed as percentage of FAME.
2.4. Fourier-transform infrared (FTIR) spectroscopy analysis
All infrared spectra were recorded in mid-IR (4000e650 cm�1
wavenumber) range by a Perkin Elmer Spectrum 100 FTIR spec-trometer (Perkin Elmer Inc., USA) having a deuterated tri-glycinesulphate (DTGS) detector. The instrument was equipped with ahorizontal attenuated total reflectance (HATR) accessory with ZnSe
O. Uncu, B. Ozen / LWT - Food Science and Technology 63 (2015) 978e984980
crystal. For each spectrum, the number of scans was 64 while theresolution was set to 4 cm�1 and scan speed was 1 cm/s. Back-ground spectra were collected before each measurement. Mea-surements were repeated two times.
2.5. Statistical analysis
All the statistical analyses were performed with SIMCA 13.0.3software (Umetrics, Sweden). The need for multivariate evaluationexists due to chromatographic and spectroscopic methods' multi-variate inheritance since more than one measurement can be madeon a single sample (Brereton, 2003). In data analysis, whole FTIRspectra were used. Partial least squares (PLS) regression as themultivariate statistical analysis tool was applied for the predictionof chemical parameters from FTIR spectra.
PLS is a supervised regression method which aims at predictingY variables (fatty acid content including MUFA, PUFA, SFA, phenoliccomposition, TPC, chlorophyll and carotenoid content and oxidativestability) from X variables (mid-IR spectra) by maximizing thecorrelation between them by a linear multivariate model (Eriksson,Kettaneh-Wold, Trygg, Wikstr€om, & Wold, 2006). In order to in-crease the predictive ability of the PLS model second derivative ofFTIR profile which allows the elimination of noises and shifts wasused. The derivative was calculated from moving quadratic sub-models, each 15 data point long. The distance between each datapoint was 1 and edge effects were excluded.
As the validation technique, cross-validation method was usedto assess how the models generalize to an independent data-set.Several parameters (root mean square error of calibration, RMSECand cross-validation, RMSECV, regression coefficients for calibra-tion, R2
cal and cross-validation, R2cv) were also calculated to
determine the predictive ability of the models. Regression coeffi-cient provides an idea about the prediction efficiency and bothcalibration and validation R2 must be close to one for a good model(Bauer et al., 2008). RMSEC and RMSECV values are related with theerror between measured value and predicted value at each cali-bration step and cross-validation step, respectively. It is expectedthat the differences between RMSEC and RMSECV values should besmall and close to zero since each of these values is attributed to theerror; therefore, the main idea of good prediction is the minimi-zation of the error. Comparison of RMSEC and RMSECV values re-veals whether the calibration model is over-fitted or not (Muik,Lendl, Molina-Díaz, P�erez-Villarejo, & Ayora-Ca~nada, 2004). Whenevaluating the results of a prediction model all of these parametersmust be taken into consideration. RMSECV value is calculated bySIMCA software. RMSEC is calculated according to equation givenby Yucesoy and Ozen (2013).
3. Results and discussions
One of the multivariate statistical analysis tools, PLS regressionwas used to relate the mid-IR spectral data with the analytical re-sults of several important chemical parameters of olive oils. Modelswere constructed for each response separately, only with theexception of chemically similar constituents; phenolic compounds(phenolic alcohols, flavonoids and phenolic acids) and fatty acidswith PUFA, MUFA and SFA were used in a single model. Cross-validation (leave one out) technique, which is generally thepreferred method for medium-size data, was used to evaluate themodel performance. To increase the efficiency of prediction one ofthe spectral filtering techniques, second derivative of the fullspectra (4000e650 cm�1 wavenumber) was applied whereas un-modified spectral data of chlorophyll and carotenoid content, fattyacid profile and phenolic composition were used in oxidative sta-bility prediction. Ranges and averages of the predicted parameters
and statistical analysis results for constructed models are providedin Table 1. Measured ranges for the parameters correspond totypical values of olive oils.
3.1. Oxidative stability
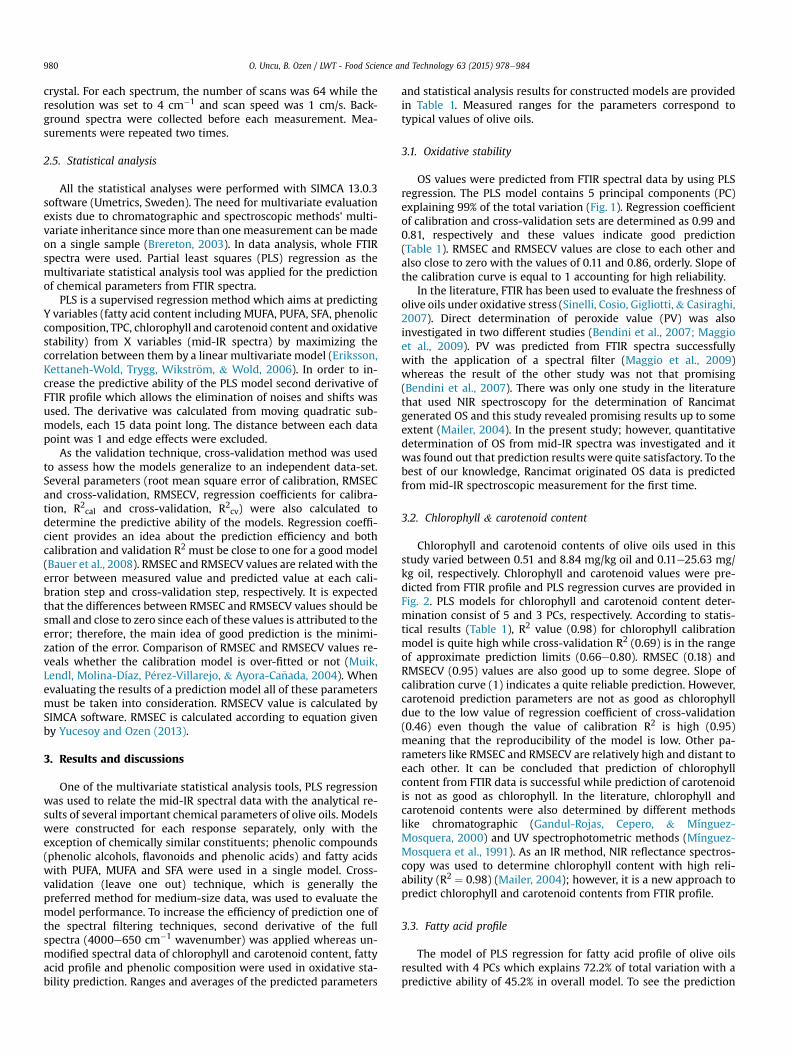
OS values were predicted from FTIR spectral data by using PLSregression. The PLS model contains 5 principal components (PC)explaining 99% of the total variation (Fig. 1). Regression coefficientof calibration and cross-validation sets are determined as 0.99 and0.81, respectively and these values indicate good prediction(Table 1). RMSEC and RMSECV values are close to each other andalso close to zero with the values of 0.11 and 0.86, orderly. Slope ofthe calibration curve is equal to 1 accounting for high reliability.
In the literature, FTIR has been used to evaluate the freshness ofolive oils under oxidative stress (Sinelli, Cosio, Gigliotti,& Casiraghi,2007). Direct determination of peroxide value (PV) was alsoinvestigated in two different studies (Bendini et al., 2007; Maggioet al., 2009). PV was predicted from FTIR spectra successfullywith the application of a spectral filter (Maggio et al., 2009)whereas the result of the other study was not that promising(Bendini et al., 2007). There was only one study in the literaturethat used NIR spectroscopy for the determination of Rancimatgenerated OS and this study revealed promising results up to someextent (Mailer, 2004). In the present study; however, quantitativedetermination of OS from mid-IR spectra was investigated and itwas found out that prediction results were quite satisfactory. To thebest of our knowledge, Rancimat originated OS data is predictedfrom mid-IR spectroscopic measurement for the first time.
3.2. Chlorophyll & carotenoid content
Chlorophyll and carotenoid contents of olive oils used in thisstudy varied between 0.51 and 8.84 mg/kg oil and 0.11e25.63 mg/kg oil, respectively. Chlorophyll and carotenoid values were pre-dicted from FTIR profile and PLS regression curves are provided inFig. 2. PLS models for chlorophyll and carotenoid content deter-mination consist of 5 and 3 PCs, respectively. According to statis-tical results (Table 1), R2 value (0.98) for chlorophyll calibrationmodel is quite high while cross-validation R2 (0.69) is in the rangeof approximate prediction limits (0.66e0.80). RMSEC (0.18) andRMSECV (0.95) values are also good up to some degree. Slope ofcalibration curve (1) indicates a quite reliable prediction. However,carotenoid prediction parameters are not as good as chlorophylldue to the low value of regression coefficient of cross-validation(0.46) even though the value of calibration R2 is high (0.95)meaning that the reproducibility of the model is low. Other pa-rameters like RMSEC and RMSECV are relatively high and distant toeach other. It can be concluded that prediction of chlorophyllcontent from FTIR data is successful while prediction of carotenoidis not as good as chlorophyll. In the literature, chlorophyll andcarotenoid contents were also determined by different methodslike chromatographic (Gandul-Rojas, Cepero, & Mínguez-Mosquera, 2000) and UV spectrophotometric methods (Mínguez-Mosquera et al., 1991). As an IR method, NIR reflectance spectros-copy was used to determine chlorophyll content with high reli-ability (R2 ¼ 0.98) (Mailer, 2004); however, it is a new approach topredict chlorophyll and carotenoid contents from FTIR profile.
3.3. Fatty acid profile
The model of PLS regression for fatty acid profile of olive oilsresulted with 4 PCs which explains 72.2% of total variation with apredictive ability of 45.2% in overall model. To see the prediction
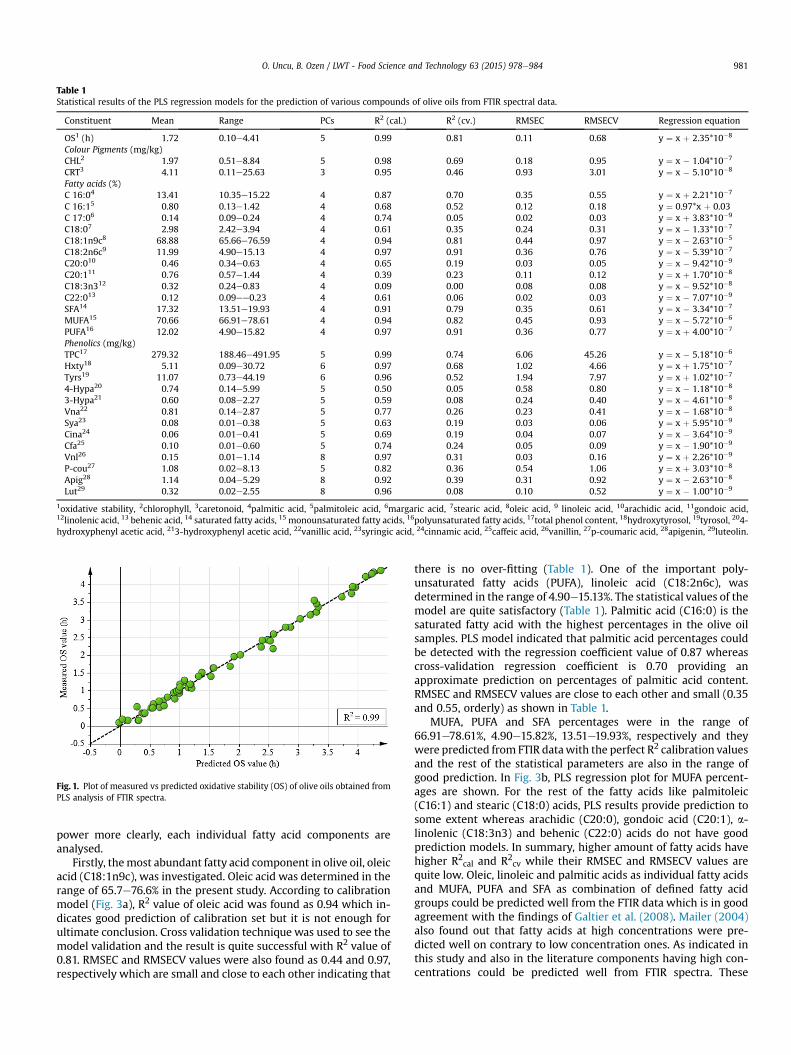
Table 1Statistical results of the PLS regression models for the prediction of various compounds of olive oils from FTIR spectral data.
Constituent Mean Range PCs R2 (cal.) R2 (cv.) RMSEC RMSECV Regression equation
OS1 (h) 1.72 0.10e4.41 5 0.99 0.81 0.11 0.68 y ¼ x þ 2.35*10�8
Colour Pigments (mg/kg)CHL2 1.97 0.51e8.84 5 0.98 0.69 0.18 0.95 y ¼ x � 1.04*10�7
CRT3 4.11 0.11e25.63 3 0.95 0.46 0.93 3.01 y ¼ x � 5.10*10�8
Fatty acids (%)C 16:04 13.41 10.35e15.22 4 0.87 0.70 0.35 0.55 y ¼ x þ 2.21*10�7
C 16:15 0.80 0.13e1.42 4 0.68 0.52 0.12 0.18 y ¼ 0.97*x þ 0.03C 17:06 0.14 0.09e0.24 4 0.74 0.05 0.02 0.03 y ¼ x þ 3.83*10�9
C18:07 2.98 2.42e3.94 4 0.61 0.35 0.24 0.31 y ¼ x � 1.33*10�7
C18:1n9c8 68.88 65.66e76.59 4 0.94 0.81 0.44 0.97 y ¼ x � 2.63*10�5
C18:2n6c9 11.99 4.90e15.13 4 0.97 0.91 0.36 0.76 y ¼ x � 5.39*10�7
C20:010 0.46 0.34e0.63 4 0.65 0.19 0.03 0.05 y ¼ x � 9.42*10�9
C20:111 0.76 0.57e1.44 4 0.39 0.23 0.11 0.12 y ¼ x þ 1.70*10�8
C18:3n312 0.32 0.24e0.83 4 0.09 0.00 0.08 0.08 y ¼ x � 9.52*10�8
C22:013 0.12 0.09ee0.23 4 0.61 0.06 0.02 0.03 y ¼ x � 7.07*10�9
SFA14 17.32 13.51e19.93 4 0.91 0.79 0.35 0.61 y ¼ x � 3.34*10�7
MUFA15 70.66 66.91e78.61 4 0.94 0.82 0.45 0.93 y ¼ x � 5.72*10�6
PUFA16 12.02 4.90e15.82 4 0.97 0.91 0.36 0.77 y ¼ x þ 4.00*10�7
Phenolics (mg/kg)TPC17 279.32 188.46e491.95 5 0.99 0.74 6.06 45.26 y ¼ x � 5.18*10�6
Hxty18 5.11 0.09e30.72 6 0.97 0.68 1.02 4.66 y ¼ x þ 1.75*10�7
Tyrs19 11.07 0.73e44.19 6 0.96 0.52 1.94 7.97 y ¼ x þ 1.02*10�7
4-Hypa20 0.74 0.14e5.99 5 0.50 0.05 0.58 0.80 y ¼ x � 1.18*10�8
3-Hypa21 0.60 0.08e2.27 5 0.59 0.08 0.24 0.40 y ¼ x � 4.61*10�8
Vna22 0.81 0.14e2.87 5 0.77 0.26 0.23 0.41 y ¼ x � 1.68*10�8
Sya23 0.08 0.01e0.38 5 0.63 0.19 0.03 0.06 y ¼ x þ 5.95*10�9
Cina24 0.06 0.01e0.41 5 0.69 0.19 0.04 0.07 y ¼ x � 3.64*10�9
Cfa25 0.10 0.01e0.60 5 0.74 0.24 0.05 0.09 y ¼ x � 1.90*10�9
Vnl26 0.15 0.01e1.14 8 0.97 0.31 0.03 0.16 y ¼ x þ 2.26*10�9
P-cou27 1.08 0.02e8.13 5 0.82 0.36 0.54 1.06 y ¼ x þ 3.03*10�8
Apig28 1.14 0.04e5.29 8 0.92 0.39 0.31 0.92 y ¼ x � 2.63*10�8
Lut29 0.32 0.02e2.55 8 0.96 0.08 0.10 0.52 y ¼ x � 1.00*10�9
1oxidative stability, 2chlorophyll, 3caretonoid, 4palmitic acid, 5palmitoleic acid, 6margaric acid, 7stearic acid, 8oleic acid, 9 linoleic acid, 10arachidic acid, 11gondoic acid,12linolenic acid, 13 behenic acid, 14 saturated fatty acids, 15 monounsaturated fatty acids, 16polyunsaturated fatty acids, 17total phenol content, 18hydroxytyrosol, 19tyrosol, 204-hydroxyphenyl acetic acid, 213-hydroxyphenyl acetic acid, 22vanillic acid, 23syringic acid, 24cinnamic acid, 25caffeic acid, 26vanillin, 27p-coumaric acid, 28apigenin, 29luteolin.
Fig. 1. Plot of measured vs predicted oxidative stability (OS) of olive oils obtained fromPLS analysis of FTIR spectra.
O. Uncu, B. Ozen / LWT - Food Science and Technology 63 (2015) 978e984 981
power more clearly, each individual fatty acid components areanalysed.
Firstly, themost abundant fatty acid component in olive oil, oleicacid (C18:1n9c), was investigated. Oleic acid was determined in therange of 65.7e76.6% in the present study. According to calibrationmodel (Fig. 3a), R2 value of oleic acid was found as 0.94 which in-dicates good prediction of calibration set but it is not enough forultimate conclusion. Cross validation technique was used to see themodel validation and the result is quite successful with R2 value of0.81. RMSEC and RMSECV values were also found as 0.44 and 0.97,respectively which are small and close to each other indicating that
there is no over-fitting (Table 1). One of the important poly-unsaturated fatty acids (PUFA), linoleic acid (C18:2n6c), wasdetermined in the range of 4.90e15.13%. The statistical values of themodel are quite satisfactory (Table 1). Palmitic acid (C16:0) is thesaturated fatty acid with the highest percentages in the olive oilsamples. PLS model indicated that palmitic acid percentages couldbe detected with the regression coefficient value of 0.87 whereascross-validation regression coefficient is 0.70 providing anapproximate prediction on percentages of palmitic acid content.RMSEC and RMSECV values are close to each other and small (0.35and 0.55, orderly) as shown in Table 1.
MUFA, PUFA and SFA percentages were in the range of66.91e78.61%, 4.90e15.82%, 13.51e19.93%, respectively and theywere predicted from FTIR datawith the perfect R2 calibration valuesand the rest of the statistical parameters are also in the range ofgood prediction. In Fig. 3b, PLS regression plot for MUFA percent-ages are shown. For the rest of the fatty acids like palmitoleic(C16:1) and stearic (C18:0) acids, PLS results provide prediction tosome extent whereas arachidic (C20:0), gondoic acid (C20:1), a-linolenic (C18:3n3) and behenic (C22:0) acids do not have goodprediction models. In summary, higher amount of fatty acids havehigher R2
cal and R2cv while their RMSEC and RMSECV values are
quite low. Oleic, linoleic and palmitic acids as individual fatty acidsand MUFA, PUFA and SFA as combination of defined fatty acidgroups could be predicted well from the FTIR data which is in goodagreement with the findings of Galtier et al. (2008). Mailer (2004)also found out that fatty acids at high concentrations were pre-dicted well on contrary to low concentration ones. As indicated inthis study and also in the literature components having high con-centrations could be predicted well from FTIR spectra. These

Fig. 2. Plot of measured vs predicted a) chlorophyll content (mg/kg), b) carotenoidcontent (mg/kg) obtained from PLS analysis of FTIR spectra.
Fig. 3. Plot of measured vs predicted a) oleic acid (%) and b) monounsaturated fattyacids (MUFA) (%) obtained from PLS analysis from FTIR spectra.
O. Uncu, B. Ozen / LWT - Food Science and Technology 63 (2015) 978e984982
findings are also supported by the work of Gurdeniz, Ozen, andTokatli (2010) in which stearic, oleic and linoleic acids were pre-dicted quite well as in the present case. It was also reported suc-cessful predictions of stearic, arachidic and linolenic acids in thesame study. All of these fatty acids individually and as a combina-tion (MUFA, PUFA and SFA) have great importance in olive oil in-dustry and each may also reveal authenticity of olive oil.
3.4. Total phenolic content and individual phenolic compounds
The PLS regression analysis using FTIR data for the prediction ofphenolic compounds; phenolic alcohols, phenolic acids, and fla-vonoids and TPC of olive oils resulted in four different calibrationmodels with 6 PCs which explain 96.9% of total variation with amoderate predictive ability of 61.2% in overall model, with 5 PCsexplaining 67.8% of total variation with an insufficient predictionability of 6.93%, with 8 PCs including 95.3% explanation and lowpredictive ability (29.6%) and 5 PCs explaining large variation (99%)with confident prediction ability (73.8%), respectively. To see theprediction power of FTIR spectra on each variable, PLS statistics forindividual phenolic compounds are examined (Table 1). The bestprediction among the phenolic compounds is observed forhydroxytyrosol with quite well R2 calibration value of 0.97 and R2
cross-validation value of 0.68 which indicates good validation ofthe model (Fig. 4a). This is also supported by the values of tolerabledifferences between RMSEC (1.02) and RMSECV (4.66). It is worthto emphasize that the good predictability of hydroxtyrosol contentof olive oil is crucial due to its important contribution in olive oiloxidative stability (Carrasco-Pancorbo et al., 2005) and also its as-sociation with positive effect on health (Nan et al., 2014).
Furthermore, certain health claims could be done on olive oil labelsdepending on the hydroxytyrosol content according to EFSA(European Food Safety Authority) (2011). Therefore, determina-tion of hydroxtyrosol content of olive oils with FTIR spectroscopy ina shorter analysis time compared to chromatographic techniqueswould be beneficial for the industry. Besides hydroxtyrosol, anotherphenyl alcohol, tyrosol, was also predicted with R2
cal of 0.96 andR2
cv of 0.52. Phenolic acids such as vanillic, cinnamic, caffeic and p-coumaric acids are not predicted as well as hydroxytyrosol andtyrosol due to the lower R2
cal values of 0.77, 0.69, 0.74, and 0.82,respectively. In addition, R2
cv values for these compounds are alsolow (0.26, 0.19, 0.24, and 0.36). For the rest of the phenolic com-pounds, PLS models did not provide any predictions at all. Anotherphenolic compound group, flavonoids were also investigated and itwas concluded that vanillin and apigeninwere predicted with highcalibration and average cross validation values (0.97, 0.92 and 0.31,0.39; orderly). TPC was also tried to be predicted from FTIR spectra(Fig. 4b) and the statistical values (Table 1) are quite promising witha high regression coefficient for calibration of 0.99 and the cross-validation value (0.74). According to another study from the liter-ature (Mailer, 2004), NIR spectroscopy achieved a marginal successin the determination of the TPC while Cerretani et al. (2010) ob-tained promising results for the prediction of total phenol with FTIRspectroscopy.
In the literature, IR spectra were used to determine TPC andphenolic compounds in olive fruit. Bellincontro et al. (2012) usednear infrared (NIR) acousto optically tunable filter (AOTF) spec-troscopy to determine TPC and some important phenolic com-pounds in olive fruit like oleuropein, verbascoside, and 3,4-DHPEA-EDA. However, there is no study that determines the concentration
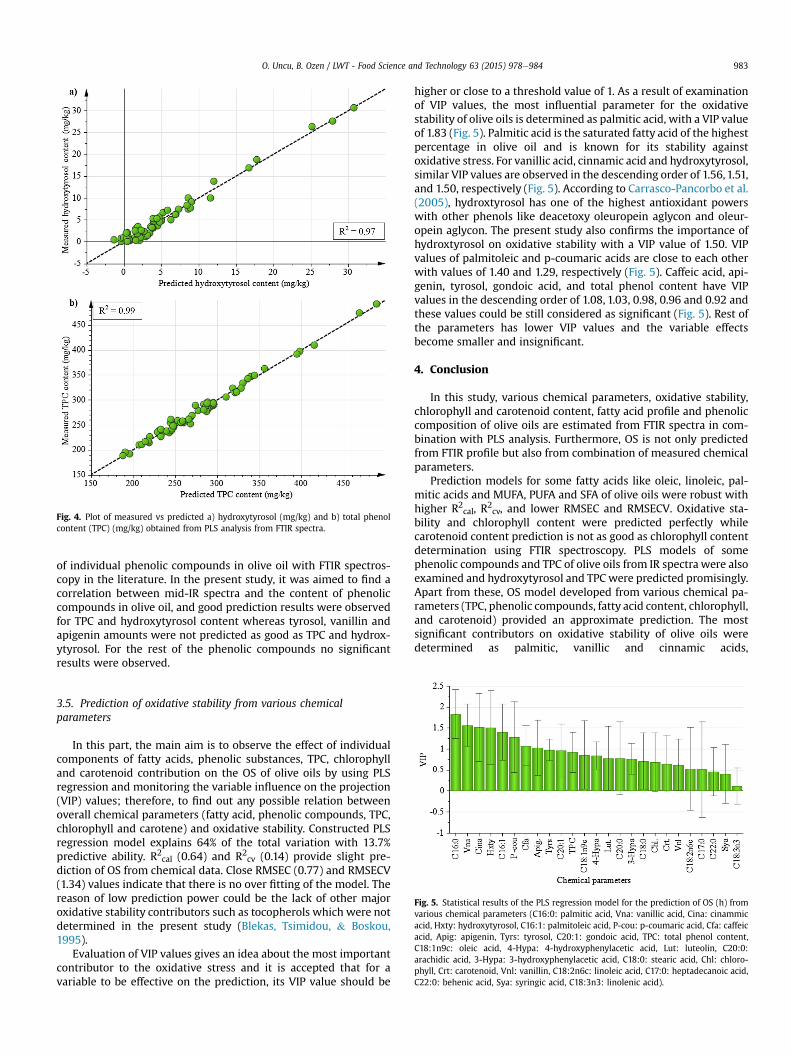
Fig. 4. Plot of measured vs predicted a) hydroxytyrosol (mg/kg) and b) total phenolcontent (TPC) (mg/kg) obtained from PLS analysis from FTIR spectra.
O. Uncu, B. Ozen / LWT - Food Science and Technology 63 (2015) 978e984 983
of individual phenolic compounds in olive oil with FTIR spectros-copy in the literature. In the present study, it was aimed to find acorrelation between mid-IR spectra and the content of phenoliccompounds in olive oil, and good prediction results were observedfor TPC and hydroxytyrosol content whereas tyrosol, vanillin andapigenin amounts were not predicted as good as TPC and hydrox-ytyrosol. For the rest of the phenolic compounds no significantresults were observed.
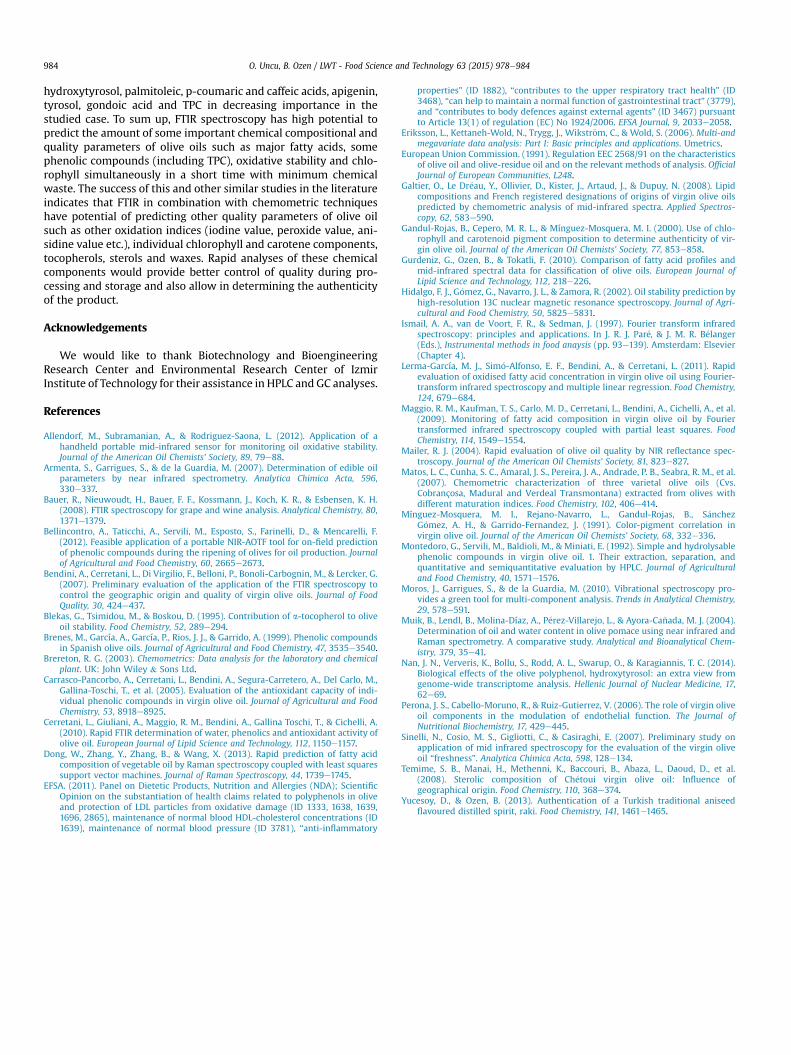
Fig. 5. Statistical results of the PLS regression model for the prediction of OS (h) fromvarious chemical parameters (C16:0: palmitic acid, Vna: vanillic acid, Cina: cinammicacid, Hxty: hydroxytyrosol, C16:1: palmitoleic acid, P-cou: p-coumaric acid, Cfa: caffeicacid, Apig: apigenin, Tyrs: tyrosol, C20:1: gondoic acid, TPC: total phenol content,C18:1n9c: oleic acid, 4-Hypa: 4-hydroxyphenylacetic acid, Lut: luteolin, C20:0:arachidic acid, 3-Hypa: 3-hydroxyphenylacetic acid, C18:0: stearic acid, Chl: chloro-phyll, Crt: carotenoid, Vnl: vanillin, C18:2n6c: linoleic acid, C17:0: heptadecanoic acid,C22:0: behenic acid, Sya: syringic acid, C18:3n3: linolenic acid).
3.5. Prediction of oxidative stability from various chemicalparameters
In this part, the main aim is to observe the effect of individualcomponents of fatty acids, phenolic substances, TPC, chlorophylland carotenoid contribution on the OS of olive oils by using PLSregression and monitoring the variable influence on the projection(VIP) values; therefore, to find out any possible relation betweenoverall chemical parameters (fatty acid, phenolic compounds, TPC,chlorophyll and carotene) and oxidative stability. Constructed PLSregression model explains 64% of the total variation with 13.7%predictive ability. R2
cal (0.64) and R2cv (0.14) provide slight pre-
diction of OS from chemical data. Close RMSEC (0.77) and RMSECV(1.34) values indicate that there is no over fitting of the model. Thereason of low prediction power could be the lack of other majoroxidative stability contributors such as tocopherols which were notdetermined in the present study (Blekas, Tsimidou, & Boskou,1995).
Evaluation of VIP values gives an idea about the most importantcontributor to the oxidative stress and it is accepted that for avariable to be effective on the prediction, its VIP value should be
higher or close to a threshold value of 1. As a result of examinationof VIP values, the most influential parameter for the oxidativestability of olive oils is determined as palmitic acid, with a VIP valueof 1.83 (Fig. 5). Palmitic acid is the saturated fatty acid of the highestpercentage in olive oil and is known for its stability againstoxidative stress. For vanillic acid, cinnamic acid and hydroxytyrosol,similar VIP values are observed in the descending order of 1.56, 1.51,and 1.50, respectively (Fig. 5). According to Carrasco-Pancorbo et al.(2005), hydroxtyrosol has one of the highest antioxidant powerswith other phenols like deacetoxy oleuropein aglycon and oleur-opein aglycon. The present study also confirms the importance ofhydroxtyrosol on oxidative stability with a VIP value of 1.50. VIPvalues of palmitoleic and p-coumaric acids are close to each otherwith values of 1.40 and 1.29, respectively (Fig. 5). Caffeic acid, api-genin, tyrosol, gondoic acid, and total phenol content have VIPvalues in the descending order of 1.08, 1.03, 0.98, 0.96 and 0.92 andthese values could be still considered as significant (Fig. 5). Rest ofthe parameters has lower VIP values and the variable effectsbecome smaller and insignificant.
4. Conclusion
In this study, various chemical parameters, oxidative stability,chlorophyll and carotenoid content, fatty acid profile and phenoliccomposition of olive oils are estimated from FTIR spectra in com-bination with PLS analysis. Furthermore, OS is not only predictedfrom FTIR profile but also from combination of measured chemicalparameters.
Prediction models for some fatty acids like oleic, linoleic, pal-mitic acids and MUFA, PUFA and SFA of olive oils were robust withhigher R2
cal, R2cv, and lower RMSEC and RMSECV. Oxidative sta-
bility and chlorophyll content were predicted perfectly whilecarotenoid content prediction is not as good as chlorophyll contentdetermination using FTIR spectroscopy. PLS models of somephenolic compounds and TPC of olive oils from IR spectra were alsoexamined and hydroxytyrosol and TPC were predicted promisingly.Apart from these, OS model developed from various chemical pa-rameters (TPC, phenolic compounds, fatty acid content, chlorophyll,and carotenoid) provided an approximate prediction. The mostsignificant contributors on oxidative stability of olive oils weredetermined as palmitic, vanillic and cinnamic acids,
O. Uncu, B. Ozen / LWT - Food Science and Technology 63 (2015) 978e984984
hydroxytyrosol, palmitoleic, p-coumaric and caffeic acids, apigenin,tyrosol, gondoic acid and TPC in decreasing importance in thestudied case. To sum up, FTIR spectroscopy has high potential topredict the amount of some important chemical compositional andquality parameters of olive oils such as major fatty acids, somephenolic compounds (including TPC), oxidative stability and chlo-rophyll simultaneously in a short time with minimum chemicalwaste. The success of this and other similar studies in the literatureindicates that FTIR in combination with chemometric techniqueshave potential of predicting other quality parameters of olive oilsuch as other oxidation indices (iodine value, peroxide value, ani-sidine value etc.), individual chlorophyll and carotene components,tocopherols, sterols and waxes. Rapid analyses of these chemicalcomponents would provide better control of quality during pro-cessing and storage and also allow in determining the authenticityof the product.
Acknowledgements
We would like to thank Biotechnology and BioengineeringResearch Center and Environmental Research Center of IzmirInstitute of Technology for their assistance in HPLC and GC analyses.
References
Allendorf, M., Subramanian, A., & Rodriguez-Saona, L. (2012). Application of ahandheld portable mid-infrared sensor for monitoring oil oxidative stability.Journal of the American Oil Chemists' Society, 89, 79e88.
Armenta, S., Garrigues, S., & de la Guardia, M. (2007). Determination of edible oilparameters by near infrared spectrometry. Analytica Chimica Acta, 596,330e337.
Bauer, R., Nieuwoudt, H., Bauer, F. F., Kossmann, J., Koch, K. R., & Esbensen, K. H.(2008). FTIR spectroscopy for grape and wine analysis. Analytical Chemistry, 80,1371e1379.
Bellincontro, A., Taticchi, A., Servili, M., Esposto, S., Farinelli, D., & Mencarelli, F.(2012). Feasible application of a portable NIR-AOTF tool for on-field predictionof phenolic compounds during the ripening of olives for oil production. Journalof Agricultural and Food Chemistry, 60, 2665e2673.
Bendini, A., Cerretani, L., Di Virgilio, F., Belloni, P., Bonoli-Carbognin, M., & Lercker, G.(2007). Preliminary evaluation of the application of the FTIR spectroscopy tocontrol the geographic origin and quality of virgin olive oils. Journal of FoodQuality, 30, 424e437.
Blekas, G., Tsimidou, M., & Boskou, D. (1995). Contribution of a-tocopherol to oliveoil stability. Food Chemistry, 52, 289e294.
Brenes, M., García, A., García, P., Rios, J. J., & Garrido, A. (1999). Phenolic compoundsin Spanish olive oils. Journal of Agricultural and Food Chemistry, 47, 3535e3540.
Brereton, R. G. (2003). Chemometrics: Data analysis for the laboratory and chemicalplant. UK: John Wiley & Sons Ltd.
Carrasco-Pancorbo, A., Cerretani, L., Bendini, A., Segura-Carretero, A., Del Carlo, M.,Gallina-Toschi, T., et al. (2005). Evaluation of the antioxidant capacity of indi-vidual phenolic compounds in virgin olive oil. Journal of Agricultural and FoodChemistry, 53, 8918e8925.
Cerretani, L., Giuliani, A., Maggio, R. M., Bendini, A., Gallina Toschi, T., & Cichelli, A.(2010). Rapid FTIR determination of water, phenolics and antioxidant activity ofolive oil. European Journal of Lipid Science and Technology, 112, 1150e1157.
Dong, W., Zhang, Y., Zhang, B., & Wang, X. (2013). Rapid prediction of fatty acidcomposition of vegetable oil by Raman spectroscopy coupled with least squaressupport vector machines. Journal of Raman Spectroscopy, 44, 1739e1745.
EFSA. (2011). Panel on Dietetic Products, Nutrition and Allergies (NDA); ScientificOpinion on the substantiation of health claims related to polyphenols in oliveand protection of LDL particles from oxidative damage (ID 1333, 1638, 1639,1696, 2865), maintenance of normal blood HDL-cholesterol concentrations (ID1639), maintenance of normal blood pressure (ID 3781), “anti-inflammatory
properties” (ID 1882), “contributes to the upper respiratory tract health” (ID3468), “can help to maintain a normal function of gastrointestinal tract” (3779),and “contributes to body defences against external agents” (ID 3467) pursuantto Article 13(1) of regulation (EC) No 1924/2006. EFSA Journal, 9, 2033e2058.
Eriksson, L., Kettaneh-Wold, N., Trygg, J., Wikstr€om, C., & Wold, S. (2006). Multi-andmegavariate data analysis: Part I: Basic principles and applications. Umetrics.
European Union Commission. (1991). Regulation EEC 2568/91 on the characteristicsof olive oil and olive-residue oil and on the relevant methods of analysis. OfficialJournal of European Communities, L248.
Galtier, O., Le Dr�eau, Y., Ollivier, D., Kister, J., Artaud, J., & Dupuy, N. (2008). Lipidcompositions and French registered designations of origins of virgin olive oilspredicted by chemometric analysis of mid-infrared spectra. Applied Spectros-copy, 62, 583e590.
Gandul-Rojas, B., Cepero, M. R. L., & Mínguez-Mosquera, M. I. (2000). Use of chlo-rophyll and carotenoid pigment composition to determine authenticity of vir-gin olive oil. Journal of the American Oil Chemists' Society, 77, 853e858.
Gurdeniz, G., Ozen, B., & Tokatli, F. (2010). Comparison of fatty acid profiles andmid-infrared spectral data for classification of olive oils. European Journal ofLipid Science and Technology, 112, 218e226.
Hidalgo, F. J., G�omez, G., Navarro, J. L., & Zamora, R. (2002). Oil stability prediction byhigh-resolution 13C nuclear magnetic resonance spectroscopy. Journal of Agri-cultural and Food Chemistry, 50, 5825e5831.
Ismail, A. A., van de Voort, F. R., & Sedman, J. (1997). Fourier transform infraredspectroscopy: principles and applications. In J. R. J. Par�e, & J. M. R. B�elanger(Eds.), Instrumental methods in food anaysis (pp. 93e139). Amsterdam: Elsevier(Chapter 4).
Lerma-García, M. J., Sim�o-Alfonso, E. F., Bendini, A., & Cerretani, L. (2011). Rapidevaluation of oxidised fatty acid concentration in virgin olive oil using Fourier-transform infrared spectroscopy and multiple linear regression. Food Chemistry,124, 679e684.
Maggio, R. M., Kaufman, T. S., Carlo, M. D., Cerretani, L., Bendini, A., Cichelli, A., et al.(2009). Monitoring of fatty acid composition in virgin olive oil by Fouriertransformed infrared spectroscopy coupled with partial least squares. FoodChemistry, 114, 1549e1554.
Mailer, R. J. (2004). Rapid evaluation of olive oil quality by NIR reflectance spec-troscopy. Journal of the American Oil Chemists' Society, 81, 823e827.
Matos, L. C., Cunha, S. C., Amaral, J. S., Pereira, J. A., Andrade, P. B., Seabra, R. M., et al.(2007). Chemometric characterization of three varietal olive oils (Cvs.Cobrançosa, Madural and Verdeal Transmontana) extracted from olives withdifferent maturation indices. Food Chemistry, 102, 406e414.
Mínguez-Mosquera, M. I., Rejano-Navarro, L., Gandul-Rojas, B., S�anchezG�omez, A. H., & Garrido-Fernandez, J. (1991). Color-pigment correlation invirgin olive oil. Journal of the American Oil Chemists' Society, 68, 332e336.
Montedoro, G., Servili, M., Baldioli, M., & Miniati, E. (1992). Simple and hydrolysablephenolic compounds in virgin olive oil. 1. Their extraction, separation, andquantitative and semiquantitative evaluation by HPLC. Journal of Agriculturaland Food Chemistry, 40, 1571e1576.
Moros, J., Garrigues, S., & de la Guardia, M. (2010). Vibrational spectroscopy pro-vides a green tool for multi-component analysis. Trends in Analytical Chemistry,29, 578e591.
Muik, B., Lendl, B., Molina-Díaz, A., P�erez-Villarejo, L., & Ayora-Ca~nada, M. J. (2004).Determination of oil and water content in olive pomace using near infrared andRaman spectrometry. A comparative study. Analytical and Bioanalytical Chem-istry, 379, 35e41.
Nan, J. N., Ververis, K., Bollu, S., Rodd, A. L., Swarup, O., & Karagiannis, T. C. (2014).Biological effects of the olive polyphenol, hydroxytyrosol: an extra view fromgenome-wide transcriptome analysis. Hellenic Journal of Nuclear Medicine, 17,62e69.
Perona, J. S., Cabello-Moruno, R., & Ruiz-Gutierrez, V. (2006). The role of virgin oliveoil components in the modulation of endothelial function. The Journal ofNutritional Biochemistry, 17, 429e445.
Sinelli, N., Cosio, M. S., Gigliotti, C., & Casiraghi, E. (2007). Preliminary study onapplication of mid infrared spectroscopy for the evaluation of the virgin oliveoil “freshness”. Analytica Chimica Acta, 598, 128e134.
Temime, S. B., Manai, H., Methenni, K., Baccouri, B., Abaza, L., Daoud, D., et al.(2008). Sterolic composition of Ch�etoui virgin olive oil: Influence ofgeographical origin. Food Chemistry, 110, 368e374.
Yucesoy, D., & Ozen, B. (2013). Authentication of a Turkish traditional aniseedflavoured distilled spirit, raki. Food Chemistry, 141, 1461e1465.