Embed Size (px)
Citation preview


LWP -1021
December 30, 1971
LANGLEY WORKING PAPER
THE EFFECTS OF PARACHUTE SYSTEM MASS AND SUSPENSION-LINE
ELASTIC PROPERTIES ON THE LADT #3 VIKING PARACHUTE INFLATION LOADS
Prepared By
,4.• Theodore A. T-_-a_ _/
and
Approved by __ "_')'/_+'__"'4/¢Don D. Davis, Jr., Ch_'ef
Space Technology Division
t
Approved for Cl_if__H___ _n
distribution by
_/ " "NDirector ce
LANGLEY RESEARCH CENTER
NATIONAL AERONAUTICS AND SPACE ADMINISTRATION

THE EFFECTS OF PARACHUTE SYSTEM MASS AND SUSPENSION-LINE
ELASTIC PROPERTIES ON THE LADT #3 VIKING PARACHUTE INFLATION LOADS
By Theodore A. Talay and Lamont R. Poole
SUMMARY
Analytical calculations have considered the effects of 1) varying parachute
system mass, 2) suspension-line damping, and 3) alternate suspension-line force-
elongation data on the canopy force history. Results indicate the canopy force
on the LADT #3 parachute did not substantially exceed the recorded vehicle force
reading and that the above factors can have significant effects on the canopy
force history.
INTRODUCTION
Several low altitude decelerator tests (LADT) of the Viking parachute
have been conducted. In LADT #3 the parachute was being tested at 1.5 times
its design load and failed before reaching full-inflation. From a knowledge
of the data from this flight test it is the purpose of this document to investi-
gate the canopy load history as compared to the recorded tensiometer (vehicle
load) readings and specifically to study the effects of I) enclosed and apparent
mass, 2) suspension-line damping, and 3) differences between Langley Research
Center and Goodyear Aerospace Company suspension-line static elastic data on the
canopy load history.
Due to the fact that the LADT #3 decelerator failed before reaching full
inflation, values of the tensiometer readings and projected area ratio have been
extrapolated to a projected full-inflation time for use in this study. No
. attempt has been made to study the conditions past full inflation.
1
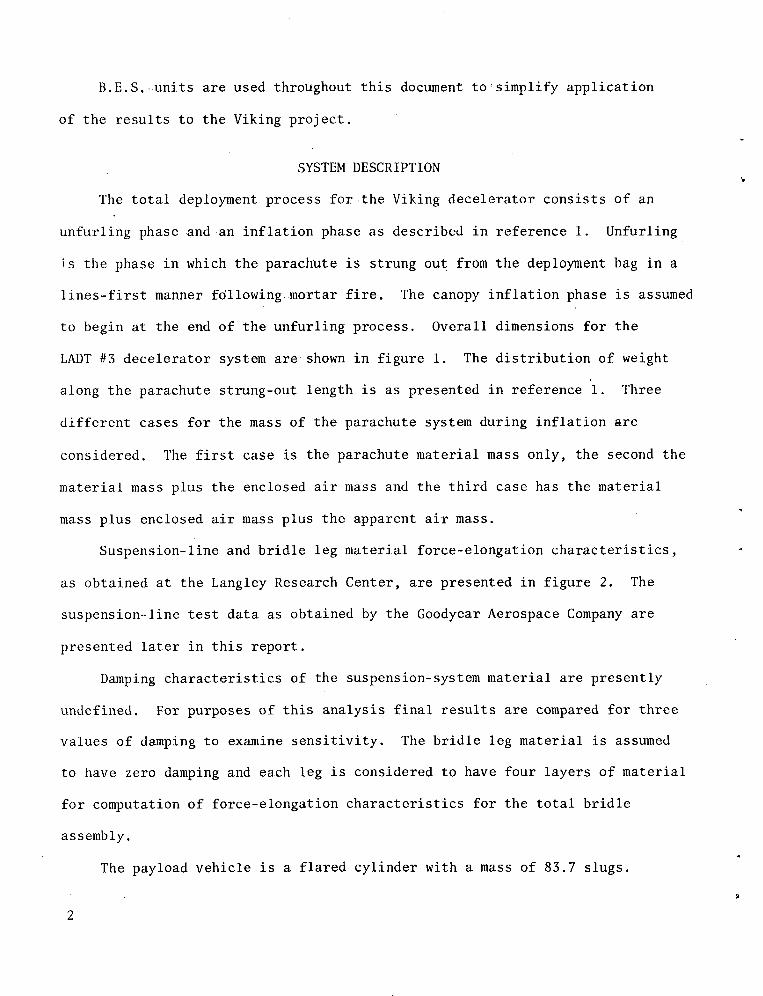
B.E.S. units are used throughout this document to'simplify application
of the results to the Viking project.
SYSTEM DESCRIPTION
The total deployment process for the Viking decelerator consists of an
unfurling phase and an inflation phase as described in reference i. Unfurling
is the phase in which the parachute is strung out from the deployment bag in a
lines-first manner following mortar fire. The canopy inflation phase is assumed
to begin at the end of the unfurling process. Overall dimensions for the
LADT #3 decelerator system are shown in figure i. The distribution of weight
along the parachute strung-out length is as presented in reference i. Three
different cases for the mass of the parachute system during inflation are
considered. The first case is the parachute material mass only, the second the
material mass plus the enclosed air mass and the third case has the material
q
mass plus enclosed air mass plus the apparent air mass.
Suspension-line and bridle leg material force-elongation characteristics,
as obtained at the Langley Research Center, are presented in figure 2. The
suspension-line test data as obtained by the Goodyear Aerospace Company are
presented later in this report.
Damping characteristics of the suspension-system material are presently
undefined. For purposes of this analysis final results are compared for three
values of damping to examine sensitivity. The bridle leg material is assumed
to have zero damping and each leg is considered to have four layers of material
for computation of force-elongation characteristics for the total bridle
assembly.i
The payload vehicle is a flared cylinder with a mass of 83.7 slugs.
2
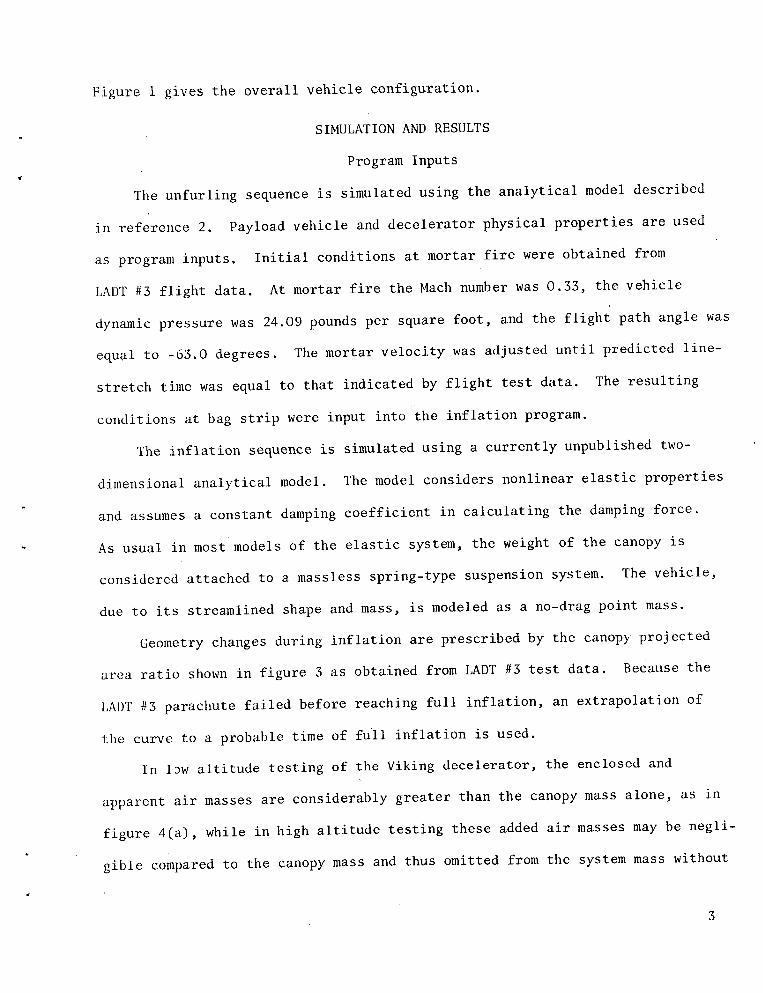
Figure i gives the overall vehicle configuration.
, SIMULATION AND RESULTS
Program Inputs
The unfurling sequence is simulated using the analytical model described
in reference 2. Payload vehicle and decelerator physical properties are used
as program inputs. Initial conditions at mortar fire were obtained from
LADT #3 flight data. At mortar fire the Mach number was 0.33, the vehicle
dynamic pressure was 24.09 pounds per square foot, and the flight path angle was
equal to -63.0 degrees. The mortar velocity was adjusted until predicted line-
stretch time was equal to that indicated by flight test data. The resulting
conditions at bag strip were input into the inflation program.
The inflation sequence is simulated using a currently unpublished two-
dimensional analytical model. The model considers nonlinear elastic properties
and assumes a constant damping coefficient in calculating the damping force.
As usual _n most models of the elastic system, the weight of the canopy is
considered attached to a massless spring-type suspension system. The vehicle,
due to its streamlined shape and mass, is modeled as a no-drag point mass.
Geometry changes during inflation are prescribed by the canopy projected
area ratio shown in figure 3 as obtained from LADT #3 test data. Because the
LADT #3 parachute failed before reaching full inflation, an extrapolation of
the curve to a probable time of full inflation is used.
In l_w altitude testing of the Viking decelerator, the enclosed and
apparent air masses are considerably greater than the canopy mass alone, as in
figure 4(a), while in high altitude testing these added air masses may be negli-
gible compared to the canopy mass and thus omitted from the system mass without

affecting results. The significance of considering or neglecting these air
masses in this low altitude drop test is investigated with three models.
These three models are 1) canopy material mass only, 2) canopy material
mass plus enclosed air mass, and 3) canopy material mass plus enclosed air mass
plus apparent air mass. The enclosed air mass history, the enclosed air mass
plus apparent air mass history, and their time derivative histories for the
_JALIT#3 decelerator as input into the analytical model are presented in figure 4.
A separate program was developed to calculate these histories baaed upon the
LADT #3 test air density and projected-area ratio.
In addition to zero damping for the case of the parachute with enclosed
plus apparent air mass, values of a constant damping coefficient of 25 pound-
seconds per suspension-line and 50 pound-seconds per suspension-line were
employed. This coefficient is the ratio of the force caused by damping to the
strain rate (in percent per second).
The drag area (COS) histories for all of the cases considered were obtained
by using an unpubl_ished prediction t_echnique which, basically, involves a
reversal of the two-dimensional analytical model in which LADT #5 tensiometer
(vehicLe force) data were input and a CDS history was computed. An extrapolation
of the tensiometer flight data from the failure point to the predicted time
of full inflation gave the full inflation tensiometer value. The CDS history
represents that forcing function input necessary to obtain the predicted
vehicle force equal to the flight (tensiometer) vehicle force. As different
models are considered, different CDS histories are required. Separate CDS
histories for the three different parachute system masses, three different
values of damping (including zero damping), and two sets of suspension-line
force-elongation data were computed and used to obtain the resulting canopy
4

load histories.
Program Results
Unfurling sequence.- The time between mortar fire and line stretch is
0.88 seconds. A mortar velocity of 109 ft/sec is required to match program
line-stretch time to flight data as shown in figure 5. The total unfurling
time between mortar fire and bag strip is 1.13 seconds. Inflation is assumed
to begin a!;bag strip.
Infla__tionsequence.- At the beginning of inflation the Mach number is
0.36, the vehicle dynamic pressure 29.25 pounds per square foot, and the flight
path angle -65.70 degrees.
The first effect studied is that of varying the parachute system mass.
Figure 6 presents the CDS histories required to obtain predicted vehicle load
histeri_s equal to the recorded (tensiometer) vehicle load history. These CDS
histories are input into the analytical[ inflation model and the results are
presented in figures 7, 8, and 9. Figure 7 represents the case where only the
canopy material mass i3 employed. Figure 8 represents the canopy material mass
plus enclosed mass case and figure 9 represents the canopy material mass plus
e11closed mass plus apparent mass case. Zero damping is assumed for these three
cases. In all three :zases, figures 7(a), 8(a), and 9(a), the predicted vehicle
dynamic pressure history closely approximates the values obtained from flight
data. The computed vehicle force histories, figures 7(b), 8(b), and 9(b), also
agree well with the flight vehicle force.
The results indicate that up to the point of LADT #3 failure at 1.70 seconds
past mortar fire, the effect of adding additional mass to the parachute system
is to decrease the computed canopy force. This can be explained by the inter-
play between the canopy force and the product of the additional air mass flow
5

rate amd the canopy velocity_ Similar conclusions were reached in reference 4.
In figure 7(b), the case of canopy material mass only, the canopy force
follows the vehicle force closely. At the point of LADT #3 failure, at
1.70 seconds, the canopy force is equal to the vehicle force. In figure 8(b),
the case of canopy material mass plus enclosed air mass, the canopy force is,
at all points up to 1.70 seconds, markedly less than the vehicle force. At
the failure point, the canopy force is approximately 4.1% below the vehicle force.
In figure 9(b), the case of canopy material mass, enclosed air mass, and apparent
air mass, the canopy force is, up to 1.70 seconds, again markedly less than the
vehicle force. At the failure point the canopy force is approximately 0.7%
below the vehicle force. At predicted full inflation the canopy force is
greater than the vehicle force in all cases. The calculated difference is 1.1%,
4.9%, and 5.2% for the three cases respectively in figures 7(b), 8(b), and 9(b).
The second effec_ studied is that of damping. A parachute system mass which
includes the enclosed air mass and apparent air mass is used with constant
damping coefficient values of O, 25, and 50 pound-seconds per suspension-line.
Figure i0 presents the CDS histories required to obtain predicted vehicle
load histories equal to the recorded (tensiometer) vehicle load history. These
CDS histories were input into the analytical inflation model and the results
are presented in figures 9, ii, and 12. Again, as in the varying parachute
system mass cases, the predicted vehicle dynamic pressure histories closely
approximate the values obtained from flight data and the computed vehicle force
agrees well with the flight vehicle force. The major effects of damping are to
change the shape of the canopy force history and to increase the canopy force
at the failure point and at full inflation. Figure 9 was discussed Previously
as the final case in the varying parachute mass study. In figure ll(b), the
6

damping coefficient is 25 pound-seconds per suspension-line. Up to approxi-
mately 1.5 seconds the canopy force history levels out more than that of the no
damping case. The leveling out effect is even more pronounced in figure 12(b),
the case of the damping coefficient equal to 50 pound-seconds per suspension
line. At the LADT #3 failure time of 1.70 seconds the canopy force is 0.8% and
2.4% greater than the vehicle force for the two respective damping coefficients.
At full inflation the canopy force has increased to 7.8% and 10.6% greater than
the vehicle force for the two respective damping coefficients used.
The final effect investigated was that due to differences in the Viking
suspension-line static force-elongation data obtained by Langley Research Center
and Goodyear Aerospace Company and presented in figure 13. The LRC samples tested
were unsterilized while those tested at GAC were sterilized, which may explain
the differences observed. The case used for comparison was that of canopy material
mass plus enclosed air mass plus apparent air mass, with zero damping. The only
change was substituting the GAC suspension-line data for the LRC data. Figure 14
presents the CDS histories required to obtain predicted vehicle load histories
equal to the recorded (tensiometer) vehicle load history. These histories were
input into the analytical inflation model and the results are presented in
figures 9 and 15. The predicted vehicle dynamic pressures, figures 9(a) and 15(a),
are close to the values obtgined from flight data and the computed vehicle
force agrees well with the flight vehicle force. While it is noted that in
comparing the two canopy force histories, figures 9(b) and 15(b), some difference
is present early in the inflation sequence, it is also observed that much lower
values of canopy force occur at the LADT #3 failure point and full inflation
point using GAC data. At the failure point the canopy force is 15.7% below the
vehicle force and at the predicted full inflation point the canopy force is
7
1.8% above the vehicle force.
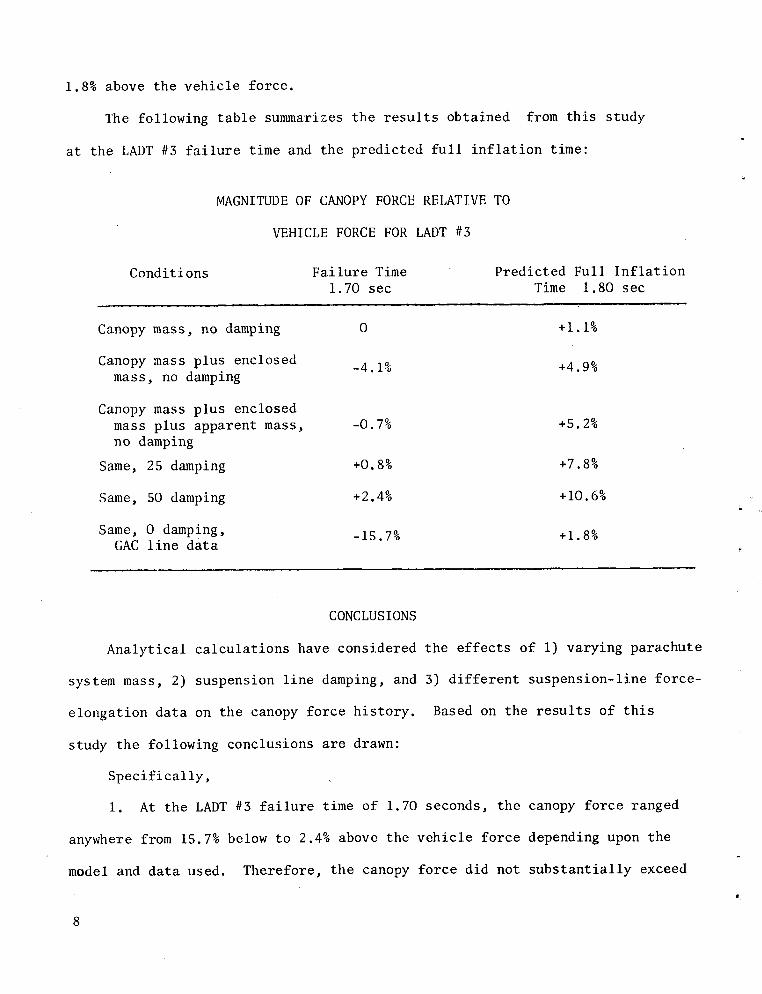
The following table summarizes the results obtained from this study
at the LADT #3 failure time and the predicted full inflation time:
MAGNITUDE OF CANOPY FORCE RELATIVE TO
VEHICLE FORCE FOR LADT #3
Conditions Failure Time Predicted Full Inflation
1.70 sec Time 1.80 sec
Canopy mass, no damping 0 +1,1%
Canopy mass plus enclosed -4.1% +4.9%mass, no damping
Canopy mass plus enclosed
mass plus apparent mass, -0.7% +5.2%
no damping
Same, 25 damping +0.8% +7.8%
Same, 50 damping +2.4% +10.6%
Same, 0 damping, -15.7% +1.8%GAC line data
CONCLUSIONS
Analytical calculations have considered the effects of i) varying parachute
system mass, 2) suspension line damping, and 3) different suspension-line force-
elongation data on the canopy force history. Based on the results of this
study the following conclusions are drawn:
Specifically,
I. At the LADT #3 failure time of 1.70 seconds, the canopy force ranged
anywhere from 15.7% below to 2.4% above the vehicle force depending upon the
model and data used. Therefore, the canopy force did not substantially exceed
m
8

the recorded vehicle force reading.
2. At a predicted full inflation time of 1.80 seconds the canopy force
would be greater than the vehicle force by from 1.1% to 10.6%, again depending
upon the model and data used.
Generally,
3. At low altitudes, enclosed and apparent air mass can significantly
effect the canopy force calculated and should, therefore, not be neglected.
4. The canopy force calculations are sensitive to decelerator physical
properties. In this case changes in the damping and/or force-elongation
characteristics produced significant changes in the canopy force histories.
Accurate prediction of canopy force histories requires accurate inputs in
these areas.
REFERENCES
i. Talay, Theodore A.; Poole, Lamont R.; and Whitlock, Charles H.: The
Effect of Suspension-Line Length on Viking Parachute Inflation Loads.
LWP-985, Sept. 1971.
2. Poole, Lamont R.; and Huckins, Earle K. III: Evaluation of Massless-Spring
Model of Suspension-Line Elasticity during the Parachute Unfurling Process.
Prospective NASA TN.
3. Goodyear Aerospace Corp. Drawings No. 3064130-102 and 3064110-104.
4. Heinrich, H.G.; and Noreen, R.A.: Analysis of Parachute Opening Dynamics
with Supporting Wind-Tunnel Experiments. Journ. of Aircraft, July-August 1970.
9

f •
°
W
I • I


I I, ! i 'I
......... , ..... I
I0 J_o p_-ob_ble JcL_e_.o_ _11 i._glo_'eLon.' \ /
,_ ii /!
,,, ,, , ,,
.8 _ (D Fl_.gh_test dM:_
..t____i......ql ._11
4_ .G t
_1 .5" --
/ILl4a
o .4-I _ _al re& C a _ V e
ll, l .....
D..
O ' "
.?_ ! ; ...... / ....t _ i .
I.... ("
..... i ill.I
,[email protected] ! ....... . illO1.0 I.I 1.2 1,3 1.4 1.5" I,G 1,7 I.S
Time _Y'o_, "_o_-'I:o._- gLre)see_
FCg_v-e_J .- X_p_t: hgst:or_ o{- r.anep_t p_'o._ecte&O..Y'eo. _'_'1:/.0 _v" LAD'r" _3.

II : i ' ' : I ! I _ t ! ! I.i ! i
_ ! , :
-- i : ' i " i...... i .... " / .........
rjI i : :..... : .........
ill "7-- ,i --i /
' : .......... _lb " : ' 'e : 2_cloeecL pl_s _l_pa_e_ m_ss , , i . .. . .i
.....
°'J , ,
_.)
gD 40 I _ iul _ :............ i! iI " r.....
° 13Z \ .......
i,:71i!o'" :I I lll I: :=:i,....................1:l:I"0
_2_ ...... : :........... ,_\
I-0 I.I 1-2. 1.3 l.a, I.E 1.6 1.7 1.8
LADT _i= _.

so I I I .... i.i
Q FI_.._,_ ees-i:'.4o..¢,_.
•+ : Co..Italy.ted bag s_'t F
_'° Z8 _ : (i/i .....!.........
........
_" .........._..... I:'/......
N..26 ,, ," ...... _-=lc=!=_ed__n[.a"l::_-j,_ ....t"_ /_ " : ". _ ! " i " : '
_ ...... :........ i........... ...... :...... : : ................. : "_32ff .
Z4 :o .Z .4 .G .8 I.O I.Z.
. "T'i.,_e ,,i:Y,om _o_"_o._ "(:Lr¢_ _e.,.c.
. _:L_¢e _." Comp_-i._on _f glL_k'L"c.L_'L"o,o.,,_, caleala,feK

I : I t I i I I t _ I I ! ! ! I !
£400 CoLlop.3 _0c_ev'Lo_tw_o.ss ol_i_l
Zg00 i i ! l r I t i I I I il;liJi i : ]1'IIII
: ,. ; . ..... - !I i
2.000 , i : IIrli .....: i', i i'
' ' i
iJIGO0
f-ta _ i .
_400
•.... t
i_ , , "" :
izoo
o I000
L3i .
! .....
_00I
rooo_ i /!: , i , , l / i/
400 i ,
i i i J i i , I / /!
200- ......... i
0 "1.0 I. I I.Z 1.3 1.4 I._- I.G 1.7 1.8
o_ LAD'I- _ 3.


4o_,o_ , , I I 1 ,' j
_ I i--.! _ I ' !:1 t: /• i '
' t I ,,!.... ,..... //
3o i ' i , //j i, _ I
_2s,,_ .---t-- F'k_"_ '_'_";'_'e"_°"_ _ "_'-- /"' l ,0¢ J " I .......
zo ' i 1 r\ /',\-d ,,
.._eI_" , /,._ ! ...... /
, // .,'
Co_p_J:e_[ veh_. I _o_¢ - / ..... : •
I,O I. | I.?. 1,3 1.4- 1.5" I._ 1.7 1.8 .
FL..,q,.,..re.8 .- /_c'{'u.o.I _n& co,. p w_e& h_s_ovLcs.0¢ a_a_4i..c.
_-I:erL_l pl=s e_clos=¢[n_,ss j _,_pk_ coe_[c_en_=O.


i_iii:!i_:! I_! /., I..... f ¸:! I: ! _1 ! f .i / i_:l i / ! f: i.... .i _ •_
-:I ....... :" :"
ZT_'O
Z_'O0
2ZS'O
!,,ii _,_i i, i it _ i i1_i_i J_ :i:!:_:i::-i: :i:-¸_.....,i.......i:........i J:i ' : ,: .....i....:.......i:......:_i t _ i , , , . i I i , _ . : L
: _:::: : : : i : i: ! : i:: : ii :i: I ¸ _: ! i i ¸ ! :
!iii!liiiii!iiliif!fit!iiililiiiiiiliilii!ii!tiiii!!iti!!!i' tlli I!. ,.i i ! _ ! :i: !' :,._ _ I_! _ i _ :i _ ! _i I
iiliiii!iiliiiiilliiiiid
!i-"!: :::Y-: _i!--_!_,! i!_7_:i_i_ ! ' : i ! ! _ ::•! i _t_.;i _:]::"; _:!" i .i :i: / i ! I .... t • i ,
12_o ': .....::_:i-_l!iT:i-_:::.....:::::i ::-I '_t_:I.........:::_T:I::.:T:.....Y:-_/I:/.....i ......::" : "
:.-:L.i:,_..i.:llii:_:ii:iiii_i!i2i:__ii:::i_ii:ii.iL2.ii:i[±:I:-i.l!.-i:.:li_:i.-i'_-:,Z
iooo : !_ " ::_!:_-!__:!_ !:__;_ ::_,_i_:t_ _i_:!::::_T::_:_i_)_O_-Ft-: i_:it:!-:_:• , I . I ..... : I _ : :: , • : ..... ,:..........-!"-|--_,::_:i-i-!:::-i..........:,::-.....!Y :-:_:__i:_/--T-!::I:_-:_-:---':: !--:--_,.........!:: :
.................. _....... 1................... _- ___-_L........ _............... ',............ _.............. , ..... 4 .............
_'oo ! : :li i:.i! i_:i i i l:iii:i: t :ii !: i' : :: i i:.-i--.i:1-:i::: _i: :: .... :: : .-_:-i--i!-::! :::|::::_:: i -:_:!:::t:!ii_,'--::t-- i t ::: _::[- : _+:-_-.--,i-.-_/_ .....F _t.:::::-- :-.-i ........ i ............, i ..:,,,_.,,i,_:, ,:,_:!, i ,_i.__, i ' ' '
• . _ , I : i
0 i _i :i ii .... i .... i: " . i
1,0 _.I I.Z 1.3 I.¢ t.ff I._= 1.7 I._
"FLw_e_%-ommo_'l:_r _cL_-e,sec
3O
Z4
ZO _ :i_ilil._ ;
01.0 I.I hZ 1.5 1.4, 1.5" 1.6 1.7 I.O
" . TL_e T_-ommov-t=v- _:LrP. _ See

30
(4 Z+
U : i . .. ..... ' - '_ i:--4::_ _..... i_....._- i ....... ""-Q.._I " ....
................ : .. [ . I ;.....¢
L:}

300
IOO

t ) 1_:_1 1 _1 ::_:1 1 ;¸ i I _¸I )l :i¸¸l_¸ H
2400 1 .....:i_/ i _i_:-_i_!_ ! _:: _:i: , _: _ . , , _ . , _jCo__op3_4:-e.,-LaLpl_s e_closed.,_ _t:,p_e_'__a_, ...._- N_p_._ -
_zO0 i ....// ........ ,
........_.:. U.¢r.e.r'd_e4-_=_ccv-i=l(LRC JcesJc_ ...................li -. :.: : I i
, _00 .......... i . : ; i .... : " :! " " i .... !_!...... i! " 1/
.ta [ i i....... : i : _ e i !
i L i ; i : ! :1400 _ i
.... !................... ; • II;-00 , ,.
/o IOO0
_o ,, ii: ,-_ _, i !_ _ ' _
, , ,//_oo, , : ,_"-_,!-_-,"i--_,=i>-,:_".i/_,:' ! "ii:"i400 i _ i _ i i i _ i _ i _, _ ! _ ! :i _ i :_
_oo"......i...............:.........i_--_;......_-!........" __/ _ _! : " "
I
; i : , i
LO _.1 I.Z 1.3 1.4- I.S" 1.6 I.T 1.8 .
TL_¢ _cro_ "nto_'_a_r_Lv'I ) sec=
+,wosuspe_s;.,on-It_ee..l_s'_i,ci=l:3 c_es =,_

2G ; •
F_± _es_c ,_-:,: I! ,:i: : _ ...i!....j..:_....
,. I • ..... : : 1::: ::_: : :