Embed Size (px)
Citation preview

Lesotho Food Security and Vulnerability Monitoring Report May
2008
July 30 2008
2
Acknowledgements The Lesotho Vulnerability Assessment Committee (LVAC) would like to thank the following participants and their organisations, which contributed directly and indirectly to fieldwork, analysis and writing up the information in this report. Special thanks also go to the Disaster Management Authority (DMA), World Food Programme (WFP) and Food and Agriculture Organisation (FAO)) who provided transport for the fieldwork and to the Regional Vulnerability Assessment Committee (RVAC) which provided funds for the assessment. Kopano Masilo – Lesotho Council of NGOs (LECONGO) ‘Malerato Tsilo – Ministry of Agriculture and Food Security (MAFS) Likeleli Makhotla – World Food Programme (WFP) ‘Mabatlokoa Maloi – Disaster Management Authority (DMA) Mokotla Ntela – Disaster Management Authority (DMA) Nonkosi Tshabalala – Disaster management Authority (DMA) Tŝepang Maama – Disaster Management Authority (DMA) Ntlisi Mokitimi – Ministry of Agriculture and Food Security (MAFS) Mamonaheng Monoto – Food and Nutrition Coordinating Office (FNCO) Beketsane Ntsebeng - Disaster Management Authority (DMA) Caroline Mohlabane - Disaster Management Authority (DMA Bokang Mantutle – Food and Agriculture Organisation (FAO) Mpethe Tongwane – Lesotho Meteorological Services (LMS) Mokhothoane Ntlaloe – Ministry of Trade, Industry, Cooperatives and Marketing (MTICM) Timothy Shixungileni- Government of Namibia Florian Kadedu - Government of Namibia Peter Muhangi - Lesotho Vulnerability Assessment Committee (LVAC) - UNICEF We would also like to thank all those who participated in the discussions of the draft report and the contributions they made to improve the final report. Special thanks go to the men and women from the 32 villages who took part in the exercise. We hope this report will cause appropriate interventions for the affected communities. Matŝeliso Mojaki Chair, LVAC July 2008

3
Table of Contents
Acknowledgements…………………………………………………………………………………………………………………………
2
Table of contents……………………………………………………………………………………………………………………………
3
List of abbreviations………………………………………………………………………………………………………………………
4
1 Highlights………………………………………………………………………………………………
5 1.1 Summary Outcomes 7
2. Current Year Issues and Analysis…………………………………………………………………………………….
10 2.1 The LVAC Analysis Model
2.2 The Key Parameters Assessed in 2008
2.3 Issues and Analysis
2.3.1 Crop Production
2.3.2 Availability of Casual Labour 2.3.3 Casual labour wages
2.3.4 Price of Food
2.3.5 Price of Livestock and Livestock products
2.3.6 Price of Items in the Minimum Non Staple Basket
2.3.7 Price of Items in the Minimum Essential Expenditure Basket
2.3.8 Nutrition
3. Results by Zone……………………………………………………………………………………………………………………….
16
3.1 Foot Hills
3.3 Mountains
3.4 Peri –Urban
3.5 Southern Lowlands
3.6 Senqu River Valley
4. Conclusion and recommendations……………………………………………………………………………………
23
Appendix A: National Cereal Balance Sheet 2008/2009……………………………………………………………… 25
Appendix B: Sample interview form used in the 2008 Assessment…………………………………………… 27
Appendix C: Analysis Spread sheets………………………………………………………………………………………….…
31
Appendix D: Agro Meteorology Summary Report for 2007/2008.……………………………………………..
39

4
Acronyms and Abbreviations
BOS Bureau of Statistics
CHS Community and Household Survey
DAO District Agricultural Office
DMA Disaster Management Authority
FAO Food and Agriculture Organization
FNCO Food and Nutrition Coordinating Office
HEA Household Economy Approach
FTH Foot Hills
MTN Mountains
SLL Southern Lowlands
NLL Northern Lowlands
SRV Senqu River Valley
PU Peri - Urban
LVAC Lesotho Vulnerability Assessment Committee
LZ Livelihood Zone
MTICM Ministry of Trade, Industry ,Cooperatives and Marketing
NNSS National Nutrition Surveillance System
NGO Non Governmental Organization
RVAC Regional Vulnerability Assessment Committee
RSA Republic of South Africa
SADC Southern African Development Cooperation
WFP World Food Programme

5
Highlights
• Unlike in previous years, only one crop production forecast for 2008 was conducted
led by the Bureau of Statistics (BOS) and with participation of the National Early Warning Unit (NEWU) and Ministry of Agriculture and Food Security (MAFS). Although this is the right way to go in terms of minimizing assessments, it also means there is no opportunity to crosscheck the results with other assessments. The assessment forecast maize production for the 2007/08 season at 69,000 metric tons and sorghum at 8450 metric tons. This represents a 5% drop in maize production from 2006/07 production of 72,600 Metric tons and a 53% increase in sorghum production over the 2006/07 estimate of 5496 metric tons. Although Wheat production was not estimated, an average summer and winter production estimate of 10,330 Metric tons was taken resulting in total cereal production estimate of 88,000 Metric tons. It should be noted however, that the 2006/07 crop production estimates by the BOS were largely dismissed as unrealistically high given the extreme weather conditions in what was described as the ‘worst drought in 30 years’.
• Comparisons with other maize production estimates for 2007, that is, the Rapid Crop
Assessment (RCA) and the Crop and Food Supply Assessment Mission (CFSAM) indicate an increase in 2007/08 production of 11% and 35% respectively and this confirms the community views that 2008 production is certainly higher than in 2007.
• By May 2008, the price of maize flour had increased by 50% over May 2007 prices
and 300% over LVAC baseline year (2004/05) prices i.e. from M2/kg in 2004 to M6/kg in 2008. Between January and May 2008, the price of maize flour increased by 20% (from M5/kg to M6/kg) and is likely to increase further. The price of cooking oil increased by 100% between May 2007 and May 2008 and this has been the most significant increase so far. Lesotho imports approximately 70% of the maize needed in the country and prices in South Africa directly influence prices in Lesotho.
• The Food Balance Sheet for the year 2008/09 produced by the Early Warning Unit of
the Disaster Management Authority (DMA), indicates that of the total national cereal requirement of 344,000 MT, 270,000MT or 78% is made up of commercial stocks and planned (commercial) imports. This means there should be enough food available in the country although the question will be who will and who will not be able to access the food through purchases.
• The LVAC collected data on the prices of other commodities such as paraffin, soap,
matches and Vaseline. All showed increases in the range of 65 – 75% over the baseline prices in the six Livelihood Zones.
• The prices of Livestock have increased significantly although this mainly affects the
‘middle’ and ‘Better – off’ households who own livestock. Price increases were in the range of 75% – 100% over baseline prices across the zones.
• A significant change was in the casual labour rates that had doubled from M10 per
day in May 2007 to M20 per day in May 2008. The casual labour rates had remained at M10 per day since the baseline year (2004/05) and this meant, poor household incomes were remaining stagnant in the face of increasing prices of food and other commodities.
• In situations where no data was available, LVAC made inflationary adjustments on
the May 2007 prices. Plans are underway to improve data collection so that more realistic data sets can be used in future. One area where data collection and price estimates have been difficult is with Wool and Mohair and LVAC will work with the Department of Marketing in MTICM to rectify the problem.

6
• In view of the key issues highlighted above, the LVAC estimates approximately 353,000 people will need humanitarian assistance in 2008/09. Of this population, 229,000 from the Southern Lowlands, Foothills, Peri Urban, Senqu River Valley and the Mountains face both a Food and Expenditure Deficit. This means that, in addition to fore going essential household expenditure such as medical costs and agricultural inputs in order to buy food, they will still not be able to meet their annual food energy requirements. This is the group that is in most need for assistance.
• The remaining 124,000 people in the Mountains face an expenditure deficit of M88
per household. This means part of the essential basket cannot be purchased because the households need to buy more food to meet annual food energy requirements. Although this can be considered a minimal problem at this stage, the increasing food prices or any other minor shock may push the group into severe conditions. Interventions to reduce the risk should be considered e.g. cash for work to increase household incomes.
• The LVAC also estimates 49,000 people mainly from the ‘Very Poor” social economic
group in the Northern Lowlands are currently showing no deficit but are at risk of falling into the category needing humanitarian assistance especially if food prices continue to increase. Close monitoring of the situation of these households is recommended.
• The affected populations are mainly the ‘very poor’ in 5 Livelihood Zones and the
‘poor’ in the Peri Urban, Senqu River Valley and the Mountains Livelihood Zones. The ‘Very poor’ in the Peri Urban will need assistance equivalent to approximately 6 - 8 months while the ‘Very poor’ in the remaining zones and the ‘poor’ in Peri Urban zone will need assistance for 4 – 5 months

7
1. Summary Outcomes
Since 2006 when LVAC updated the Lesotho livelihood baseline profiles and introduced more advanced modeling methods, the LVAC is able to present its results in terms of food deficits and expenditure deficits. In addition, both types of deficit have been expressed in cash terms and maize equivalents for the purpose of aiding intervention options based on cost implications and other considerations. An expenditure deficit occurs when households can afford to purchase the balance
of food required to make up 100% of energy requirements but cannot afford to
purchase all items in the expenditure basket. (Note that the expenditure basket contains essential expenditure such as education, health, agriculture and livestock
inputs, and grinding).
A food deficit occurs when households cannot afford to purchase the balance of food required to make up 100% of energy requirements, on top of not being able
to afford anything in the expenditure basket.
In each Livelihood zone, the LVAC calculates a food deficit, which is expressed as a percentage of the minimum per capita energy requirement based on the requirement of 2100Kcal per person per day. This information has been converted into maize equivalent and cash for ease of interpretation, maize being the staple food in Lesotho. In addition, the LVAC calculates the Expenditure deficit by multiplying the deficit per household with total number of affected households. The total expenditure deficit is also converted into maize equivalent to give an idea of what intervention level is required.
Note: There is a sequence in household response to effects of a shock that has resulted in missing some of their food entitlements. The first response is to draw on normal coping mechanisms such as selling an extra goat. If this does not cover the missing food entitlement the household will draw on discretionary expenditure e.g. transport or clothing. If this does not cover the missing food entitlement then the household will draw on essential expenditure such as education and inputs. This will result in an expenditure deficit and if the missing food entitlement is likely not to be covered even after all essential expenditure is switched to buying food, then the household is going to experience both an expenditure and food deficit.
Foothills - the ‘very poor’ households with a population of 22,339 people are likely to face a food deficit of 33% per person and an expenditure deficit of M570 per household. The maize required to fill the food deficit is 1557MT and cash equivalent is M9,339,818 The total expenditure deficit for the ‘very poor’ households is M2,122,224 or a maize equivalent of 354MT Expressed in cash terms, the combined expenditure and food deficit can be
covered by M11,462,042. Expressed in maize equivalent, the combined food and
expenditure deficit can be covered by 1911MT. Mountains - In this zone the ‘very poor’ households are likely to face food and expenditure deficit while the ‘poor’ households are likely to face a small expenditure deficit. The ‘very poor’ households with a population of 40,528 people are likely to face a food deficit of 37% per person and an expenditure deficit of M477 per household. The maize required to fill the food deficit is 3166MT and cash equivalent is M18,998,356. The total expenditure deficit for the ‘very poor’ households is M2,761,709 or a maize equivalent of 460MT. In addition, the ‘poor’ households with a population of 123,514 people are likely to face an expenditure deficit of M88 per household which translates to M1,358,660 or a maize equivalent of 226MT.
8
Expressed in cash terms, the combined expenditure and food deficit for the ‘very
poor’ and the ‘poor’ can be covered by M23,118,725. Expressed in maize equivalent, the combined food and expenditure deficit can be covered by 3852MT.
Northern Lowlands – the current situation indicates that there are not likely to be any food or expenditure deficits in this zone. However, approximately 49,000 people from the ‘very poor’ households will just be able to cover their minimum food needs assuming no further food price escalation. This group should be closely monitored in light of anticipated food price increases that could push them into the category requiring humanitarian support. Interventions to reduce the risky of this group falling into the category requiring humanitarian support, such as cash for work should be considered. Peri Urban Areas – In this zone both the ‘very poor’ and the ‘poor’ households are likely to face food and expenditure deficit. The ‘very poor’ households with a population of 14,482 people are likely to face a food deficit of 50% per person and an expenditure deficit of M476 per household. The maize required to fill the food deficit is 1529MT and cash equivalent is M7,644,834. The total expenditure deficit for the ‘very poor’ households is M984762 or a maize equivalent of 197MT. The ‘poor’ households with a population of 34,075 people are likely to face a food deficit of 31% per person and an expenditure deficit of M476per household. The maize required to fill the food deficit is 2230MT and cash equivalent is M11,152,463 The total expenditure deficit for the ‘poor’ is M2,317,088 or a maize equivalent of 463MT
Expressed in cash terms, the combined expenditure and food deficit for the ‘very poor’ and the ‘poor’ can be covered by M22,099,147. Expressed in maize
equivalent, the combined food and expenditure deficit can be covered by 4419MT.
Southern Lowlands – In this zone the ‘very poor’ households with a population of 76,785 people are likely to face a food deficit of 33% per person and an expenditure deficit of M457 per household. The maize required to fill the food deficit is 5351MT and cash equivalent is M 32,103,112. The total expenditure deficit for the ‘very poor’ households is M7,018,149 or a maize equivalent of 1170MT. Expressed in cash terms, the combined expenditure and food deficit for the ‘very
poor’ can be covered by M39,121,161. Expressed in maize equivalent, the
combined food and expenditure deficit can be covered by 6521MT.
Senqu River Valley – In this zone both the ‘very poor’ and the ‘poor’ households are likely to face food and expenditure deficit. The ‘very poor’ households with a population of 10,708 people are likely to face a food deficit of 33% per person and an expenditure deficit of M431 per household. The maize required to fill the food deficit is 746MT and cash equivalent is M4,476,879. The total expenditure deficit for the ‘very poor’ households is M923,022 or a maize equivalent of 154MT. The ‘poor’ households with a population of 29982 people are likely to face a food deficit of 9% per person and an expenditure deficit of M464 per household. The maize required to fill the food deficit is 570MT and cash equivalent is M3,418,707. The total expenditure deficit for the ‘poor’ is M2,318,619 or a maize equivalent of 386MT. Expressed in cash terms, the combined expenditure and food deficit for the ‘very poor’ and the ‘poor’ can be covered by M11,137,227. Expressed in maize
equivalent, the combined food and expenditure deficit can be covered by 1856MT.
The National Summary shows approximately 353,000 people will require
humanitarian assistance of varying levels in 2008/09. Out of this population, approximately 229,000 people will face a food deficit equivalent to 15149MT of
maize or M87,134,000 in cash terms.

9
In addition, approximately 59,000 households that make up the overall population in need (353,000) will face an expenditure deficit of approximately M19,804,000
or 3411MT in maize equivalent. The combined food and expenditure deficit in cash terms is approximately
M106,938,000 or a maize equivalent of approximately 18500MT Note that the price of maize used in the above calculation is the village level price of M6 per KG of maize flour in all zones except the Peri –Urban zone where the price is M5/KG of maize flour.

10
2. Current Year Issues and Analysis
2.1 The LVAC Analysis model In January – February 2006, the LVAC carried out livelihood baseline profiling in all the six zones. The Household Economy Approach (HEA) was used to develop the profiles. The basic principle underlying the Household Economy Approach is that analyzing local livelihoods is essential for a proper understanding of the impact (at household level), of shocks such as drought, conflict or market disruption. Crop failure may, for example, leave one group of households without anything to eat because crop production is their main source food, while another group may be able to cope because they have alternative sources of food and income that can make up for the lost crop production. Geography and wealth are key determinants of livelihood patterns and it is for this reason that LVAC focuses on analysis by Livelihood Zone to be able to pick up the specific conditions that affect households in each of the zone. This would not be possible if one used only the administrative units for analysis. The wealth status of the household determines the options available for access to food and income. This is the other reason LVAC goes through the process of defining Wealth Groups in each Livelihood Zone as part of the household economy baseline development. Having grouped households according to where they live and their wealth, the next step is to generate baseline livelihood profiles for typical households in each group for a defined baseline or reference year. Food access is determined by investigating the sum of ways households obtain food i.e. how much food they get from own crop, livestock, gifts and purchases. Information is also collected on how much cash income is earned in a year and what essential needs are met with the earned income. Once the baseline is established, analysis can be made of the likely impact of a shock or hazard in a bad year. This involves assessing how food access will be affected by the shock, what other food sources can be added or expanded to make up for the initial shortfall and what final deficits emerge after exhausting all coping strategies. The LVAC selected 2004/05 as the baseline or reference year and therefore its current analysis reflects the impacts of current
problems on the baseline situation of 2004/05. The LVAC assessment teams spent 7 days in May assessing the current year situation and visited a total of 32 villages in the six Livelihood Zones. In each village interviews were conducted with village leaders and representatives of each of the four wealth groups i.e. the ‘very poor’, ‘poor’, ‘middle’ and ‘better –off’. A total of 122 Wealth Group interviews were conducted each interview having 6 – 8 participants. In addition, 32 village shop interviews were conducted to understand changes in market prices. Informal interviews were also held with relevant District officials and other key informants such as livestock traders. The assessment team spent 5 days analyzing the field data and.
2.2. The Key parameters assessed in May 2008
After the process of establishing the livelihood baseline profiles in 2006, key parameters for monitoring were identified in each zone. Regarding food sources, a source that contributes at least 2% of total annual household minimum food energy required is considered a key parameter for monitoring. All income sources are key parameters as well prices of food, labour, livestock and the price of items in the Minimum Non Staple and Essential Expenditure baskets. The key parameters assessed included;
• Household access to food from own production and how this compares to access in the baseline year (2004/05).
• Household access to food from agricultural labour exchange and how this compares to access in the baseline year.
• Access to food from livestock and livestock products and how this compares to

11
access in the baseline year • Access to income in the current year from crop sales, livestock sales, agricultural
and other casual labour, brewing, sale of livestock products such as wool and mohair, and petty trade. For each of the above parameters we looked at baseline versus current quantities.
• The current prices of maize, livestock (cattle, sheep, pigs chickens, goats) in the current years and compared to 2007 and baseline year prices
• The price of items in the minimum non staple basket (soap, paraffin, matches, Vaseline, beans, cooking oil and salt), and the essential expenditure basket (education, medical, inputs and grinding of maize/ sorghum).
The findings from the key parameter analysis formed the current year problem specification for scenario modeling with the baseline data. In some cases it was difficult to estimate changes in prices due to lack of data and/ or difficulty in estimating quantities especially for Wool and Mohair. In all situations where current year prices could not be established, an inflation adjustment was made using the 2007 prices.
2.3 Issues and Analysis
2.3.1 Crop Production: One crop production forecast exercise for 2008 was conducted led by the Bureau of Statistics (BOS) and with participation of the National Early Warning Unit (NEWU) and Ministry of Agriculture and Food Security (MAFS). The crop production forecast report indicates an increase in area planted with maize which is 196,037ha in 2007/08 compared to 153,751ha in 2006/07 agricultural season representing an increase of 28%. On the other hand, area planted for sorghum in 2007/08 stands at 42,712ha compared to 130,232 ha planted in 2006/07. This represents a decline of 67%. The assessment forecast maize production for the 2007/08 season at 69,000 metric tons and sorghum at 8450 metric tons. This represents a 5% drop in maize production from 2006/07 production of 72,600Metric tons and a 53% increase in sorghum production over the 2006/07 estimate of 5496 metric tones. Although Wheat production was not covered in the forecasting exercise, an average summer and winter production estimate of 10,330 Metric tons was made resulting in total cereal production estimate of 88,000 Metric tons. Despite the increase in area planted for maize, the crop forecasting exercise indicates over all production is slightly lower that last year. Comparisons with other maize production estimates for 2007 by the Rapid Crop Assessment (RCA) and the Crop and Food Supply Assessment Mission (CFSAM) indicate an increase in 2007/08 production of 11% and 35% respectively. The LVAC did not quantify production estimates from the community interviews in respect to 2006/07 and 2007/08 seasons but on the whole, the communities interviewed, expected a better harvest compared to the 2006/07 season. The LVAC assessment compared 2007/08 production figures from BoS with the baseline year (2004) production and the results were largely similar to BoS statistics. Reasons for the expected low production include the following;
• Late planting due to late start of rains especially in the Mountains where normal planting should start in August/ September.
• In other places planting was late due to a combination of factors including late arrival of inputs and sporadic rains in some places.
• According to the Lesotho Meteorological Services (LMS), the last ten days (Dekad) of January and the first ten days of February were dominated by a dry spell which affected crops in some part of the country.
• In cases where farmers had to ‘pool’ their fields in order to access funds meant for

12
block farming, delays related to organising the groups and accessing the funds resulted in late planting. It is claimed that in some parts of Roma, farmers were still planting maize as late as January and such crops were bound to be seriously affected by Frost.
As a result of late planting, crops were damaged by frost in April. This time it cannot be characterised as early frost because that is normal time for frost in winter and in fact it delayed in the Mountains and was on time in the Foothills, though a bit early in the Lowlands. Trends in Maize production Year Production
2000/2001 158,200 Metric Tons 2001/2002 111,200 Metric Tons 2002/2003 85,000 Metric Tons 2003/2004 81,000 Metric Tons 2004/2005 100,700 Metric Tons 2005/2006 86,400 Metric Tons 2006/2007 72,600 Metric Tons 2007/2008 69,000 Metric Tons Average 95,500 Metric Tons
2008 compared to Average 72% 2008 compared to Baseline (2003/2004) 85% The LVAC used the BOS crop production estimates for 2008 and the baseline year production (2003/2004) to calculate percentage changes in production that constitutes the current year maize production problem specification as follows; Foot Hills: 80% of baseline production, Mountains: 65%, Northern lowlands: 115%, Peri – urban:80%, Southern Lowlands:75%, and Senqu River Valley: 80% of baseline production. Similar calculations were made for sorghum and for crops not covered by the forecast exercise, production was assumed to be same as for maize/sorghum. The details of other crop production problem specifications are provided in the specific Livelihood Zone reports. 2.3.2 Availability of Casual labour Normally ‘very poor’ and ‘poor’ households access significant proportions of their annual food intake and annual cash incomes from agricultural activities especially weeding. This year such activities were affected by the problems that have affected crop production in general such as delayed planting and less labour opportunities at harvest time due to the low crop production. As a result, the problem specification for casual labour availability in comparison to the baseline year is; FootHills:80%, Mountains:65%, Northern lowlands:115%, Peri – Urban:80%, Southern Lowlands:75%, and Senqu River Valley:80%. 2.3.3 Casual labour wages Casual labour is an important source of cash income for the ‘very poor’ and ‘poor’ households contributing up to 35% of total annual household income. The daily wage for casual labour (an average of 5 hours’ work) was M10 since the baseline year but the latest assessment found that casual labour rates have doubled to M20 and this means more cash is available for households to spend on food and other commodities. However, the effect of this increase is minimized by the raise in cost of various commodities such as maize flour which is now at 300% of baseline prices.

13
2.3.4 Price of Food
Globally food prices have been soaring in the past twelve months posing a threat to global food and nutrition security. A number of casual factors for the dramatic food price increases have been identified and include; Rapid growth in demand for food coupled with low global food stock levels. It is estimated that global food stocks are currently at the lowest in 20 years and yet demand is ever on the increase for both human and animal feed. Experts claim that the low stock levels and high demand is responsible for 50% of the food price increase growth. Conversion of maize into bio fuel production has also been identified as a major causal factor in the global food price crisis, accounting for approximately 30% of the price increase. In 2007, the United States converted close to 25% of its maize production into ethanol and this represents 7 times the amount converted in 1997. High fuel prices are also responsible for the high food prices by pushing the cost of cultivation, fertilizer and transport. It is estimated the cost of inputs in South Africa has increased by 72 -80% in the past twelve months and high fuel prices are a major contributor to the high input costs.
Extreme weather conditions associated with climate change are also contributing to the low crop production globally. In addition, there is high commodity price speculation and big purchases are being made in anticipation of higher prices. The Malawi VAC has indicated that traders are offering very high prices (higher than price recommended by Government) in anticipation of further price rises. This has the effect of reducing further the available food and putting upward pressure on food prices.
Although the food prices are increasing at a lower pace in Southern Africa compared to the global increase, the pattern indicates that prices are likely to continue rising and this will expose more households to food and nutrition vulnerability. Between January and May 2008 global maize prices increased by 59% while the increase in South Africa in the same period was 35%. An assessment by Catholic Relief Services (CRS) found that the price of maize in one Mountain village (Bobete in Thaba Tseka) had increased by 14% to 20% between January and May 2008. This picture is confirmed by food price monitoring reports produced by WFP which cover selected rural and urban shops in all Districts. By May 2008, the price of maize flour had increased by 50% over May 2007 prices and 300% over LVAC baseline year (2004/05) prices i.e. from M2/kg in 2004 to M6/kg in 2008 in the rural parts of Lesotho. In the same period the price of maize flour in the Peri Urban areas increased by 250% i.e. from M2/kg to M5/kg. Between January and May 2008, the price of maize flour increased by 20% (from M5/kg to M6/kg) and is likely to increase further. The price of cooking oil increased by 100% between May 2007 and May 2008 and this has been the most significant increase so far. Lesotho imports approximately 70% of the maize needed in the country and prices in South Africa will continue to have an effect on the local prices. Catholic Relief Services (CRS) carried out an assessment in June 2008 in Bobete Village in ThabaTseka District to assess the impact of rising price and how people are coping. The assessment focused on the price increase questions on the most important commodities as identified by LVAC such as maize, paraffin, cooking oil and transport. Interviews were held with individual households and shop owners on price increases between January and May 2008. The results of the assessment indicate price increases ranging between 14% and 20% for maize, 32% - 41% for paraffin, 72% - 85% for cooking oil and 42% - 63% for candles. There was discrepancy in the price increases given by individual households and Shop owners and this was similar observation during the LVAC assessment whereby the shop owner interviews indicate the lower percentage increases while the household interviews show much higher percentage increases.
14
The report also gives useful insights on household responses to the high commodity prices since January 2008. For example 36% of the respondents mentioned they had stopped eating beef since January, 50% of adult respondents mentioned they eat smaller meals to ensure there is enough for food for the children and 61% of respondents had borrowed food or money to buy food. Although this was a localised assessment, it provides evidence that can build into the bigger picture of what is likely to be happening in remote and isolated areas of the mountains. These are areas that the National Nutrition Survey and the Nutrition Surveillance System have identified to have highest stunting and underweight levels. Further increases in the price of food can only make such communities more vulnerable to food and nutrition insecurity. 2.3.5 Prices of Livestock and Livestock products
The assessment looked at the prices of livestock and livestock products and compared it with the baseline prices. Price data for cattle, sheep, goats, pigs, chickens and wool and mohair were collected. In general, prices increase over baseline prices of 565 -100% were observed for cattle in all zones, 30%-60% for sheep, 30%- 75% for goats, 100% - 160% for piglets and 50% - 60% for chickens. Specific increases per zone are given in the section on Results by Livelihood Zone. Estimating income from Wool and Mohair has always been difficult and the interviewed households were not in position to quantify sales or estimate income from sales (with exception of a few Livelihood Zones). In all cases where incomes estimations were not possible, adjustments for inflation were made. 2.3.6 Price of Items in the Minimum Non Staple Basket
The Minimum Non Staple Basket is constructed in the baseline to ensure that some minimum expenditure is maintained by households even in the most difficult situations. This basket contains soap, paraffin, matches, Vaseline, beans, cooking oil, vegetables and salt. The amount of money to buy this basket is reserved or locked up during modelling and can therefore not be converted to purchase food even in the worst circumstances. The price of each commodity in the basket was collected and compared to the baseline price and the overall percentage increase was between 66% and 77%. This in effect means more cash is withdrawn and allocated for the basket and therefore less is available for food purchase this year. 2.3.7 Price of Items in the Essential Expenditure Basket
The Essential Expenditure Basket contains average household expenditure on medical, education, grinding and inputs. This expenditure could be switched to food purchase in time of a crisis but it has consequences such as children not attending school or not buying of inputs such as fertilizer that may lead to poor production and so on. It is therefore important to preserve this essential household expenditure. During this assessment, it was not possible to collect reliable price data on the items in the essential expenditure Basket. The team therefore decided to add inflationary adjustments to the 2007 data. As with the minimum non staple basket, the increase in the cost of the minimum essential expenditure basket means more cash is allocated to this basket thus reducing the cash available for purchasing food this year.

15
2.3.8 Nutrition A National Nutrition Survey led by the Food and Nutrition Coordinating Office (FNCO) in November 2007 revealed that Global Acute Malnutrition (GAM) was within ‘Acceptable’ levels according to WHO classification of malnutrition. Stunting levels however, were extremely high with a national average of 41.7%. Thaba Tseka District had the highest Stunting Prevalence of 55%. The National Nutrition Surveillance System (NNSS) also coordinated by FNCO was revitalized in September 2007 to continuously monitor malnutrition levels in country and inform early interventions. The October – December 2007 NNSS Bulletin showed Qachas Nek with the highest underweight prevalence of 31% which is considered ‘Critical’ followed by Thaba Tseka at 18% which is considered ‘Poor’. The January – March 2008 National Nutrition Surveillance bulletin shows an improvement in underweight prevalence with the highest being Qachas Nek at 22% which is considered ‘Serious’ , followed by Mohales Hoek at 15% which is considered ‘poor’ The LVAC has supported the FNCO with market price data to strengthen the analysis and attempt to predict the impact of rising food prices on household vulnerability to food and nutrition security. Efforts to further strengthen this partnership are on going in addition to incorporating other food security related analysis into the nutrition surveillance bulletins.

16
3. Results by Livelihood zone
3.1 Foothills
3.1.1 Main Livelihood Characteristics of ‘very poor’ and ‘poor’ households in this
zone
• Own crop production contributes about 20 -25% of annual food energy consumed • Agricultural labour contributes about 15 -30% of annual food energy consumed • Food purchase contributes about 35 – 45% of annual food energy consumed • Casual labour contributes about 30 -45% of the annual cash income • Remittances contribute about 20 – 40% of annual cash income • The main coping strategy in crisis situations is to look for more casual labour
opportunities. However, the main income activities are agricultural related such as weeding and this year opportunities were depressed compared to baseline year.
3.1.2 Current year situation
Sufficient rains for planting were received in October and November although normal planting time should be august – September. The rains are said to have been too much in November causing water logging. This affected crop conditions as well as opportunities for weeding which are very important for ‘poor’ and ‘very poor’ households. As a result of late planting (the majority claimed to have planted in November – December) much of the crop was affected by frost in April. Livestock conditions were said to be good although sheep scab killed many sheep and the quality of wool was expected to be lower thus earning less income.
3.1.3 Problem specification for the Foothills
Key parameters Percentage change
from baseline
Maize production 80% Sorghum production 70% Beans 70% Price of maize 300% Food from agric labour 80% Cash from agric labour 80% Cash from crop sales 80% Minimum Non staple basket 177% Essential Expenditure Basket 126% Price of cow 200% Price of goat 129% Price of Sheep 160%
NB. 100% = normal baseline quantity or price
The ‘very poor’ and ‘poor’ households in this zone purchase 30% - 45% of their total annual food intake and are therefore very vulnerable to food price increases. In addition, a significant portion of their annual food consumption is derived from labour exchange that is reduced this year due to low crop production. The combination of high food and other commodity prices, constrained casual labour opportunities and low crop production this year, will reduce household capacity to access enough food as well as meet the essential household expenditures. Given the scenario above, the ‘very poor’ households with a population of 22,339 people are likely to face a food deficit of 33% per person and an expenditure deficit of M570 per household. The maize required to fill the food deficit is 1557MT and cash equivalent is M9,339,818 The total expenditure deficit for the ‘very poor’ households is M2,122,224 or a

17
maize equivalent of 354MT Expressed in cash terms, the combined expenditure and food deficit can be
covered by M11,462,042. Expressed in maize equivalent, the combined food and expenditure deficit can be covered by 1911MT.
3.2 The Mountains
3.2.1 Main Livelihood Characteristics of ‘very poor’ and ‘poor’ households in this
zone
• Own crop production contributes about 10- 20% of annual food energy consumed • Agricultural labour contributes about 35 -40% of annual food energy consumed • Food purchase contributes about 20 – 25% of annual food energy consumed • Casual labour contributes about 15 -20% of the annual cash income • Domestic labour contributes about 35 – 40% of annual cash income • The main coping strategy in crisis situations is to look for more casual labour
opportunities. However, the main income activities are agricultural related such as weeding and are depressed in the current year.
• Although domestic labour is a key source of income, expanding on it is not very likely due to the isolation of the zone from other areas that may offer labour opportunities
3.2.2 Current Year situation
Although small amounts of rainfall were received staring in August, they were not sufficient to allow planting. Sufficient rains were in October, November and December but at some point the rains were too heavy and destroyed crops leading to replanting. Unfortunately, the replanted crops were caught up by frost resulting in poor yields. Interviewees indicated that they expected low maize production compared to last year but better sorghum, wheat and been production compared to last year. Interviewees indicated the heavy rains following the 2007 drought period were not favourable to livestock and as a result several cattle died. This contributed to decline in livestock sales and milk production. A few variations were identified for example; bean production was expected to be good in Mokhotlong but quite bad in Thaba Tseka The traders mentioned that they never implemented the subsidy on maize flour due to the escalation fuel prices that would have resulted in selling at a loss. This implies that the intended purpose of the subsidy on the price of maize and selected food items was not achieved.
3.2.3 Problem specification for the Mountains
Key parameters Percentage change from baseline
Maize production 65% Sorghum production 45% Beans 45% Price of maize 300% Food from agric labour 80% Cash from agric labour 80% Cash from crop sales 50% Minimum Non staple basket 166% Essential Expenditure Basket 126% Price of cow 176% Price of goat 140% Price of Sheep 146% Price of a chicken 160%
NB. 100% = normal baseline quantity or price
18
Labour exchange is the most important source of food for the ‘very poor’ and ‘poor’ households in this zone with agricultural labour alone contributing 35 – 40% of total annual food consumption. Given the poor agricultural season, these households may not be in position to meet the food requirements as well as maintain essential household expenditures.
As a consequence of the above, the ‘very poor’ households are likely to face food and expenditure deficit while the ‘poor’ households are likely to face a small expenditure deficit. The ‘very poor’ households with a population of 40,528 people are likely to face a food deficit of 37% per person and an expenditure deficit of M477 per household. The maize required to fill the food deficit is 3166MT and cash equivalent is M18,998,356. The total expenditure deficit for the ‘very poor’ households is M2,761,709 or a maize equivalent of 460MT. In addition, the ‘poor’ households with a population of 123,514 people are likely to face an expenditure deficit of M88 per household which translates to M1,358,660 or a maize equivalent of 226MT.
Expressed in cash terms, the combined expenditure and food deficit for the ‘very
poor’ and the ‘poor’ can be covered by M23,118,725. Expressed in maize equivalent, the combined food and expenditure deficit can be covered by 3852MT.
3.4 The Peri-Urban Areas
3.4.1 Main Livelihood Characteristics of ‘very poor’ and ‘poor’ households in this zone
• Own crop production contributes about 15 - 25% of annual food energy consumed • Agricultural labour contributes about 10 - 15% of annual food energy consumed • Food purchase contributes about 35 – 40% of annual food energy consumed • Casual labour contributes about 15 - 40% of the annual cash income • Sale of vegetables contributes about 15 – 30% of annual cash income • Self employment including brewing contributes 15 -30% of annual cash income. • The main coping strategies in crisis situations are to look for more casual labour
opportunities and increase sale of vegetables. However, the main income activities are agricultural related such as weeding were affected by heavy rains in some months.
3.4.2 Current Year Situation
Given the urban characteristics of the zone, food purchase is the main source of food contributing 35 – 40% of total household food consumed in a year. Food prices impact heavily on these households although compared to the rural areas, food price increases in peri – urban areas have been slightly lower. Although crop production contributes only 15 – 25% of food consumed by the ‘very poor’ and ‘poor’, it is still a significant source and coupled with the contribution of agricultural labour the two sources contribute 25 – 40% of household annual consumption. Like in most of the zones, planting was late and this exposed the crops to frost in April. In addition, there were dry spells in early February at a crucial stage for maize which resulted in some crop damage. In addition, heavy rainfall in some months halted weeding thus denying the poorer households income opportunities

19
3.4.3 Problem specification for the Peri –Urban Areas
Key parameters Percentage change
from baseline
Maize production 80% Sorghum production 70% Beans 70% Price of maize 250% Food from agric labour 80% Cash from agric labour 80% Cash from crop sales 80% Minimum Non staple basket 175% Essential Expenditure Basket 126% Price of Cow 200% Price of Pig 128% Price of Sheep 160%
NB. 100% = normal baseline quantity or price
The ‘very poor’ and ‘poor’ households in this zone rely heavily on casual labour for both food and income and purchase contribute almost 50% of annual food consumed. Although casual labour rates have doubled since 2007, the rises in price of food and other commodities outmatch this increase in labour rates. This means the capacity of the poorer households to access enough food as well as meet the essential household expenditures is reduced. One advantage this zone has is the close proximity to cheaper sources of food and this is reflected in the smaller percentage increase in the price of maize. As a consequence of the above, the ‘very poor’ and the ‘poor’ households are likely to face food and expenditure deficit. The ‘very poor’ households with a population of 14,482 people are likely to face a food deficit of 50% per person and an expenditure deficit of M476 per household. The maize required to fill the food deficit is 1529MT and cash equivalent is M7,644,834. The total expenditure deficit for the ‘very poor’ households is M984762 or a maize equivalent of 197MT. The ‘poor’ households with a population of 34,075 people are likely to face a food deficit of 31% per person and an expenditure deficit of M476per household. The maize required to fill the food deficit is 2230MT and cash equivalent is M11,152,463 The total expenditure deficit for the ‘poor’ is M2,317,088 or a maize equivalent of 463MT
Expressed in cash terms, the combined expenditure and food deficit for the ‘very poor’ and the ‘poor’ can be covered by M22,099,147. Expressed in maize
equivalent, the combined food and expenditure deficit can be covered by 4419MT.

20
3.5 The Southern Lowlands
3.5.1 Main Livelihood Characteristics of ‘very poor’ and ‘poor’ households in this zone
• Own crop production contributes about 20 - 35% of annual food energy consumed • Agricultural labour contributes about 10 - 15% of annual food energy consumed • Food purchase contributes about 20 – 30% of annual food energy consumed • Casual labour contributes about 15 - 20% of the annual cash income • Self employment including brewing contributes 20 -30% of annual cash income. • The main coping strategies in crisis situations are to look for more casual labour
opportunities. The poor also own some goats and increase sales in crisis times. 3.5.2 Current Year situation
In December 2007 – January 2008 the area received very heavy rainfall and some parts of Maseru, Mafeteng and Mohale’s Hoek experienced hailstorms which severely damaged crops. In addition, the heavy rains caused water logging in some places, reducing weeding opportunities as well as leading to poor crop production. There was also an out break of anthrax in February which killed livestock and caused panic in the area and the whole country. Agricultural inputs for block farming arrived late and this resulted in late planting and the consequences that come with it such as frost attack. 3.5.3 Problem specification for the Southern Lowlands
Key parameters Percentage change
from baseline
Maize production 75% Sorghum production 50% Beans 50% Price of maize 300% Food from agric labour 75% Cash from agric labour 75% Cash from crop sales 75% Minimum Non Staple Basket 172% Essential Expenditure Basket 126% Price of Cow 200% Price of Goat 175% Price of Sheep 145%
NB. 100% = normal baseline quantity or price
The low production, coupled with high food and other commodity prices, and limited income opportunities in weeding will have a serious affect on ‘very poor’ households’ access to food and income in 2008/09. Given the reliance of the ‘very poor’ on casual labour for both food and income, and the fact that food purchases constitute close to one quarter of all food consumed annually, the current year problems will severely reduce their capacity to access enough food as well as meet the essential household expenditures. As a consequence, the ‘very poor’ households with a population of 76,785 people are likely to face a food deficit of 33% per person and an expenditure deficit of M457 per household. The maize required to fill the food deficit is 5351MT and cash equivalent is M 32,103,112. The total expenditure deficit for the ‘very poor’ households is M7,018,149 or a maize equivalent of 1170MT.

21
Expressed in cash terms, the combined expenditure and food deficit for the ‘very
poor’ can be covered by M39,121,161. Expressed in maize equivalent, the combined food and expenditure deficit can be covered by 6521MT.
3.6 The Senqu River Valley
3.6.1 Main Livelihood Characteristics of ‘very poor’ and ‘poor’ households in this
zone • Own crop production contributes about 15 - 20% of annual food energy consumed • Agricultural labour contributes about 15 - 20% of annual food energy consumed • Food purchase contributes about 25 – 30% of annual food energy consumed • Casual labour contributes about 15 - 25% of the annual cash income • Piglet and sheep sales contribute 0 -30% of annual cash income. • The main coping strategies in crisis situations are to look for more casual labour
opportunities. The poor also own some pigs and sheep and increase sales in crisis times.
3.5.2 Current Year situation
This zone received rains at the normal starting time (August – September) however the rains were so heavy that it could not allow most of the farmers to cultivate their fields due to water logging. The rains reduced in October allowing for planting to commence but in January there was a short dry spell that affected normal growth of most crops. Households that could afford to purchase inputs were able to plant in early October while those who had to wait for inputs from government and other agencies, started plating later in November and these are the crops most affected by frost in April. Livestock conditions were good at the time of the assessment mainly due to the adequate rains that improved pasture. However, animals used for draught power had not yet fully recovered from the 2007 drought and as such, affected the amount of land cultivated.
3.5.3 Problem specification for the Senqu River valley
Key parameters Percentage change
from baseline
Maize production 80% Sorghum production 80% Beans 80% Price of maize 300% Food from agric labour 80% Cash from agric labour 80% Cash from crop sales 80% Minimum Non staple basket 174% Essential expenditure basket 126% Price of cow 166% Price of piglet 266% Price of sheep 132%
Price of goat 133% Price of Chicken 160%
NB. 100% = normal baseline quantity or price
The ‘very poor’ and ‘poor’ households in this zone purchase 25% - 30% of their total annual food intake and are therefore very vulnerable to food price increases. In addition, a significant portion of their annual food consumption is derived from labour exchange that is reduced this year due to low crop production. The combination of high food and other

22
commodity prices, constrained casual labour opportunities and low crop production this year, will reduce household capacity to access enough food as well as meet the essential household expenditures. As a consequence of the above, the ‘very poor’ and the ‘poor’ households are likely to face food and expenditure deficit. The ‘very poor’ households with a population of 10,708 people are likely to face a food deficit of 33% per person and an expenditure deficit of M431 per household. The maize required to fill the food deficit is 746MT and cash equivalent is M4,476,879. The total expenditure deficit for the ‘very poor’ households is M923,022 or a maize equivalent of 154MT. The ‘poor’ households with a population of 29982 people are likely to face a food deficit of 9% per person and an expenditure deficit of M464 per household. The maize required to fill the food deficit is 570MT and cash equivalent is M3,418,707. The total expenditure deficit for the ‘poor’ is M2,318,619 or a maize equivalent of 386MT. Expressed in cash terms, the combined expenditure and food deficit for the ‘very poor’ and the ‘poor’ can be covered by M11,137,227. Expressed in maize
equivalent, the combined food and expenditure deficit can be covered by 1856MT.

23
Conclusions and Recommendations
• The current year problems of low production, high food and other commodity prices
and reduced opportunities for income associated with agricultural production means that about 350,000 people will not be able to meet their annual food entitlements. Humanitarian assistance of varying levels will be needed to take these people through to the next harvest expected in late May 2009.
• According to the Food Balance Sheet produced by the Disaster Management
Authority (DMA), commercial maize importers are planning to import enough grains to satisfy the national needs. It is therefore recommended that in addition to the food aid programmes that are already underway, cash transfer interventions should be implemented. As the LVAC analysis shows, the affected people will face both a food and expenditure deficit so responses need to address both the food and cash shortfall.
• Food prices are expected to continue rising and this will have serious implications on
Lesotho where over 70% of the total cereal requirement for 2008/09 will be have to be purchased. This report has indicated that more people are likely to fall into the category requiring humanitarian assistance if food prices continue increase. It is therefore recommended that price monitoring activities be strengthened and regular analyses be conducted to check the impact of further price increases on household access to food.
• Crop production estimates in Lesotho is problematic due to several factors including
out dated methods and lack of reliable data on total area planted. This problem was highlighted by the study on food security information systems in Lesotho. The study recommended that Lesotho should adopt the new estimation methods currently being implemented in Malawi and this will entail technical exchange visits and hands on support by a technician from Malawi and FAO. Efforts to harmonise the crop estimation methods should be speeded up to ensure the country has a more robust crop production estimation method to be used in 2009.
• In addition to the LVAC efforts to monitor food prices and impacts on household
access to food, the National Nutrition Surveillance System needs to be strengthened to closely monitor changes in nutrition status of children that may be affected by high increases in food prices.
24
Appendices

25
Appendix A
ANNUAL CEREAL BALANCE SHEET FOR THE 2008/09 MARKETING YEAR Annual Balance sheet as at 30th April, 2008 Figures in (000) Maize Wheat Sorghum Total 1.Domestic Availability 73.09 47.38 8.45 128.91 1.1 Opening stock (01/April/2008) 4.11 37.05 0.00 41.16 Formal (Monitored) 4.11 37.05 0.00 41.16 On farm (Unmonitored) 0.00 0.00 0.00 0.00 1.2 Gross Harvest 68.98 10.33 8.45 87.75 2. Gross Domestic Requirements 241.54 79.88 22.82 344.24 2.1 Human, feed, other and losses 241.54 79.88 22.82 344.24 3. Domestic Short fall/Surplus -168.45 -32.50 -14.38 -215.33 4.Total Planned Imports 134.00 95.00 0.00 229.00 4.1 Commercial Imports 134.00 95.00 0.00 229.00 4.2 Food Aid - Agency 0.00 0.00 0.00 0.00 4.3 Food Aid - Government 0.00 0.00 0.00 0.00 5. Imports Received 9.95 7.20 0.00 17.15 5.1 Commercial Imports Received 9.95 7.20 0.00 17.15 5.2 Food Aid Received - Agency 0.00 0.00 0.00 0.00 5.3 Food Aid- Government 0.00 0.00 0.00 0.00 6. Expected Imports 124.05 87.80 0.00 211.85 6.1 Commercial Imports Expected 124.05 87.80 0.00 211.85 6.2 Food Aid - Agency 0.00 0.00 0.00 0.00 6.3 Food Aid - Government 0.00 0.00 0.00 0.00 7. Uncovered Shortfall/import Gap -34.45 62.50 -14.38 13.67 8.Current Stock Level as at 30th April , 2008 1.29 37.06 0.00 38.35

26
Explanation of the FOOD BALANCE SHEET AS 30th APRIL, 2008
The food Balance sheet is a tool which is used to estimate national cereal availability against the requirement. It is calculated every marketing year (1st April to 31st March.) It is updated monthly using the imports received. 1. Opening stocks: This is the stock held by the major millers at the end of March 2008. This stock becomes the opening stock for the beginning of the following marketing year (1st of April 2008). 2. Gross harvest: This was estimated by the Bureau of Statistics in collaboration with DMA and a team of agronomists from Ministry of Agriculture and Food Security during the crop forecasting conducted in April. These figures might change when the actual harvesting has been completed and the final crop production estimates have been done. 3. Domestic Availability: is made up of opening stock plus gross harvest. 4. Gross Domestic Requirement: has been calculated using kilocalorie required by each person for the period of one year. This year it has been decided to use this methodology so as to avoid inconsistency with other stakeholders particularly the Ministry of Agriculture and Food Security. The minimum kilograms estimated by FAO indicate the need of 127kg of maize, 42kg of wheat and 12 kg of sorghum per person per year as it appears in the Food Security Policy. The total population of 1.9 million has been used in calculating the domestic requirement. An assumption of 0.05% population growth rate has been applied over 1,892,415 estimated during the 2006 census. In the previous years apparent consumption method was used for calculating the cereal requirement. This method is affected by several factors including under reporting of imports received. The ‘Kilo Calorie’ method gives a more realistic picture given that it is based on food energy requirements of 2100Kilocalories per person pre day calculated for the whole year. 6. Domestic Shortfall /surplus; is the difference between domestic availability and the requirement. 7. Planned imports: these are commercial imports planned by the major millers, food aid imports planned by government and food aid agencies to cover the shortfall as in the normal years the country produces cereals which cannot sustain the population for the whole year. 8. Received imports; this section is used for monitoring purposes. It is updated monthly as the millers and food aid agencies receive the imports. 9. Expected imports: This is the difference between the planned imports and the received imports. 10. Uncovered shortfall: balance of the domestic shortfall/surplus and the planned imports. The 2008/09 Food Balance Sheet reflects that food will be available in the country and there will also be a surplus of 13,670mt. However, this food will not be accessible to the vulnerable people because of the escalating food prices. As a result, assistance will still be needed to help the vulnerable groups with the ability to access food available in the market. It is also important to keep close monitoring on the food prices.

27
Appendix B Sample Assessment Form
KEY PARAMETERS AND PROBLEM SPECIFICATION SHEET
1. Village: 2. District: 3. Livelihood Zone: Foot Hills 4. Wealth group:
5. Date: 6. Interviewers: 7. Baseline Year: 2004/2005
KEY PARAMETERS ‘VERY POOR’ ‘POOR’ ‘MIDDLE’ ‘BETTER –
OFF’
FOOD
Maize Maize Maize Maize
Sorghum Sorghum Sorghum Sorghum
Labour Exchange - Weeding
Labour Exchange - Weeding
Beans Beans
Milk
INCOME
Construction Income
Construction Income
Wool & Mohair Wool & Mohair
Brewing Brewing Sale of cattle Sale of cattle
Agric Income Agric Income Sale of goats Sale of goats
Remittances Remittances Sale of Sheep Sale of Sheep
Remittances Remittances
Brewing Hiring out Equip.
8. PROBLEM SPECIFICATION Livestock -
Quantity
Baseline Quantity Current/projected quantity
Current quantity as % of baseline quantity
Cattle (Herd size) Sheep (Herd size) Goats (Herd size) Pigs (Herd size) Notes:
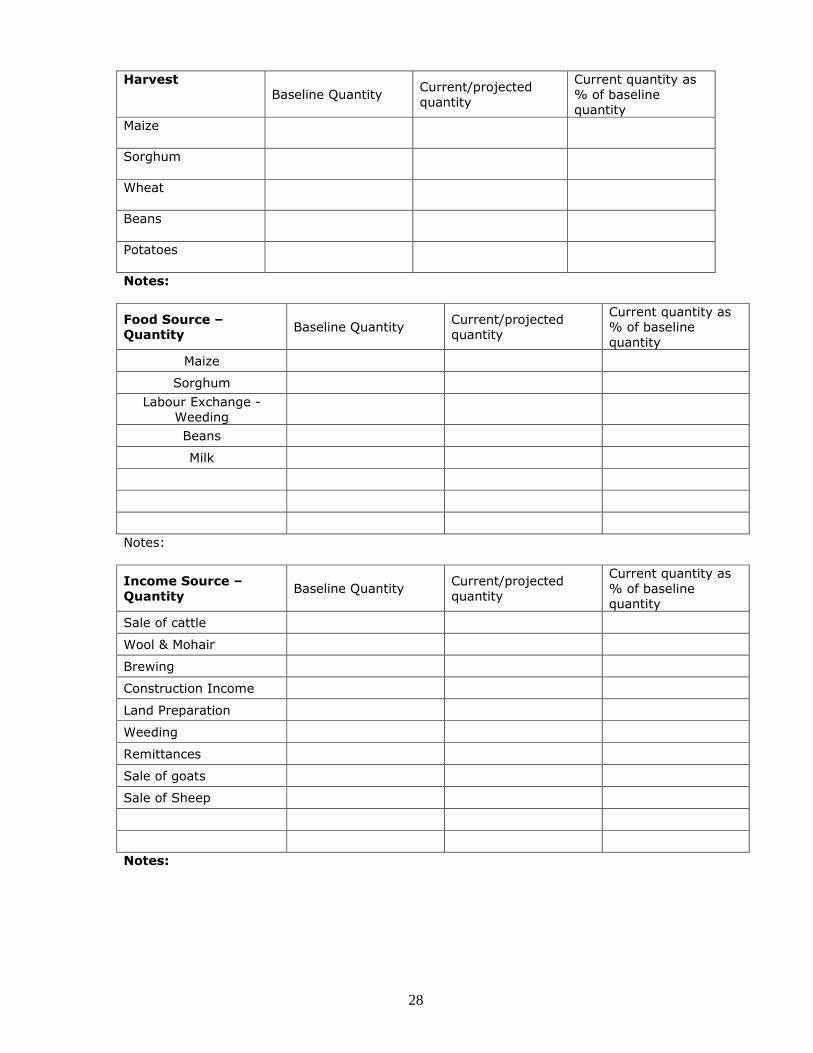
28
Harvest Baseline Quantity
Current/projected quantity
Current quantity as % of baseline quantity
Maize
Sorghum
Wheat
Beans
Potatoes
Notes:
Food Source – Quantity
Baseline Quantity Current/projected quantity
Current quantity as % of baseline quantity
Maize
Sorghum
Labour Exchange - Weeding
Beans
Milk
Notes:
Income Source –
Quantity Baseline Quantity
Current/projected quantity
Current quantity as % of baseline quantity
Sale of cattle
Wool & Mohair
Brewing
Construction Income
Land Preparation
Weeding
Remittances
Sale of goats
Sale of Sheep
Notes:

29
Income Source
– Price Baseline Price
Current/ projected price
Current price % baseline price
Cattle
Wool & Mohair
Brewing
Construction income
Land Preparation
Weeding
Remittances
Goat
Sheep
Notes: Price Data: May 2008
Expenditure Items –
Price of Min. Staple basket
May 2007 Price May 2008 Price Percentage change
Salt
Soap
Kerosene
Grinding
Matches
Vaseline
Notes:
Flour
Measure
Kg
Maize %
Change
Wheat %
Change
Sorghum %
Change
May
2007
May
2008
May
2007
May
2008
May
2007
May
2008
1
12.5
25
50
80
Notes:

30
Livestock
May 2007 May 2008 % Change
Cattle
Sheep
Indigenous chicken
Pig
Piglet
Notes: Which commodities are mostly affected by price increases? Which groups of households are mostly affected? How do these households cope with the current situation? How you bought subsidised maize meal in the past 6 months? If yes, which months? Any comments on the current price situation?

31
Appendix C: Analysis Sheets
Foothills LZ BASELINE ACCESS PROBLEM SPECIFICATION RESPONSE Sources of Food : Very Poor HHs Baseline Expand Max. Problem Food Intake Con.prob Max.curr Curr. Access -ability Access %norm kcals/day %norm Access Access Cows' milk - wet 0% 0% 0% 100% baseline: 100% 0% 0% Own meat 2% 0% 2% 100% 2100 100% 2% 2% Green cons maize 2% 0% 2% 80% for analysis: 80% 2% 2% Maize 8% 0% 8% 80% 2100 80% 6% 6% Sorghum 6% -6% 0% 70% 70% 0% 0% Beans 0% 0% 0% 70% 70% 0% 0% Labour: weeding 12% 0% 12% 80% 80% 9% 9% Labour: other 4% 0% 4% 80% 80% 3% 3% Wild food 1% 0% 1% 100% 100% 1% 1% School feeding 5% 0% 5% 100% 100% 5% 5% Food aid 20% 0% 20% 0% 0% 0% 0% Purchase - non staple 3% 0% 3% 100% 100% 3% 3% Purchase - staple 32% 84% 100% 100% 36% 36% food deficit 33% total 95% -7% 140% 67% Income : Very Poor HHs Baseline Expand Max. Problem Comm. Staple Con.prob Max.curr Curr. Cash Access -ability Access %norm Price Price %norm Access Access Wool/mohair 0 0 0 100% 118% 300% 118% 0 0 Cattle sales 0 0 0 100% 200% 300% 200% 0 0 Goat sale 0 0 0 100% 129% 300% 129% 0 0 Sheep sales 0 0 0 100% 160% 300% 160% 0 0 Maize sales 0 0 0 80% 138% 300% 110% 0 0 Sorghum sales 0 240 240 70% 138% 300% 97% 232 232 Beans sales 0 0 0 70% 138% 300% 97% 0 0 Ag.labour 834 0 834 80% 200% 300% 160% 1,334 1,334 Construction labour 180 27 207 100% 106% 300% 106% 219 219 Domestic labour 150 0 150 100% 106% 300% 106% 159 159 Remittances 420 0 420 100% 117% 300% 117% 491 491 Self-employment 500 0 500 70% 200% 300% 140% 700 700 total: 2,084 267 2,351 3,136 3,136 Expenditure : Very Poor HHs Baseline Problem Comm. Con.prob Max.curr Curr. Cash Expend %norm Price %norm Expend Expend min.non-staple 213 100% 177% 177% 377 377 essential 452 100% 126% 126% 0 0 staple 816 2,759 2,759 other 603 0 total: 2,084 3,136 3,136 exp. deficit 570 570

32
Mountains LZ BASELINE ACCESS PROBLEM SPECIFICATION RESPONSE Sources of Food : Very Poor HHs Baseline Expand Max. Problem Food Intake Con.prob Max.curr Curr. Access -ability Access %norm kcals/day %norm Access Access Cows' milk - wet 0% 0% 0% 100% baseline: 100% 0% 0% Cows' milk - dry 0% 0% 0% 100% 2100 100% 0% 0% Own meat 0% 0% 0% 100% for analysis: 100% 0% 0% Maize 10% 0% 10% 65% 2100 65% 7% 7% Sorghum 0% 0% 0% 45% 45% 0% 0% Wheat 0% 0% 0% 100% 100% 0% 0% Beans 1% 0% 1% 45% 45% 0% 0% Peas 0% 0% 0% 45% 45% 0% 0% Labour: weeding 22% 0% 22% 80% 80% 18% 18% Labour: harvesting 5% 0% 5% 80% 80% 4% 4% Labour: other 7% 0% 7% 80% 80% 6% 6% Gifts 0% 0% 0% 100% 100% 0% 0% Wild food 2% 0% 2% 100% 100% 2% 2% School feeding 7% 0% 7% 100% 100% 7% 7% Food aid 20% 0% 20% 0% 0% 0% 0% Purchase - non 2% 0% 1% 100% 100% 1% 1% Purchase - staple 22% 46% 100% 100% 19% 19% food deficit 37% total 97% 0% 121% 63% Income : Very Poor HHs Baseline Expand Max. Problem Comm. Staple Con.prob Max.curr Curr. Cash Access -ability Access %norm Price Price %norm Access Access Cows' milk sales - 0 0 0 100% 100% 300% 100% 0 0 Wool/mohair 0 0 0 100% 150% 300% 150% 0 0 Cattle sales 0 0 0 100% 176% 300% 176% 0 0 Goat sales 0 0 0 100% 150% 300% 150% 0 0 Sheep sales 0 0 0 100% 146% 300% 146% 0 0 Chicken sales 50 0 50 100% 160% 300% 160% 80 80 Maize sales 0 0 0 65% 160% 300% 104% 0 0 Sorghum sales 0 0 0 45% 160% 300% 72% 0 0 Wheat sales 0 0 0 100% 160% 300% 160% 0 0 Beans sales 160 0 160 45% 160% 300% 72% 115 115 Pea sales 0 0 0 45% 160% 300% 72% 0 0 Potatoes sales 0 0 0 100% 160% 300% 160% 0 0 Vegetables sales 90 0 90 100% 160% 300% 160% 144 144 Ag. Labour 0 0 0 100% 200% 300% 200% 0 0 Construction labour 340 51 391 100% 106% 300% 106% 414 414 Domestic labour 614 74 688 100% 106% 300% 106% 729 729 Employment (and/or 0 0 0 100% 106% 300% 106% 0 0 Self-employment 240 0 240 120% 200% 300% 240% 576 576 total: 1,494 125 1,619 2,059 2,059 Expenditure : Very Poor HHs Baseline Problem Comm. Con.prob Max.curr Curr. Cash Expend %norm Price %norm Expend Expend min.non-staple 248 100% 166% 166% 412 412 essential 379 100% 126% 126% 0 0 staple 640 1,647 1,647 other 227 0 total: 1,494 2,059 2,059 exp. deficit 477 477

33
Mountains LZ BASELINE ACCESS PROBLEM SPECIFICATION RESPONSE Sources of Food : Poor HHs Baseline Expand Max. Problem Food Intake Con.prob Max.curr Curr. Access -ability Access %norm kcals/day %norm Access Access Cows' milk - wet 0% 0% 0% 100% baseline: 100% 0% 0% Cows' milk - dry 0% 0% 0% 100% 2100 100% 0% 0% Own meat 0% 0% 0% 100% for analysis: 100% 0% 0% Maize 21% 0% 21% 65% 2100 65% 13% 13% Sorghum 0% 0% 0% 45% 45% 0% 0% Wheat 0% 0% 0% 100% 100% 0% 0% Beans 2% 0% 2% 45% 45% 1% 1% Peas 0% 0% 0% 45% 45% 0% 0% Labour: weeding 19% 0% 19% 80% 80% 15% 15% Labour: harvesting 4% 0% 4% 80% 80% 3% 3% Labour: other 16% 0% 16% 80% 80% 13% 13% Gifts 4% 0% 4% 100% 100% 4% 4% Wild food 2% 0% 2% 100% 100% 2% 2% School feeding 6% 0% 6% 100% 100% 6% 6% Food aid 0% 0% 0% 0% 0% 0% 0% Purchase - non staple 2% 0% 1% 100% 100% 1% 1% Purchase - staple 22% 86% 100% 100% 46% 41% food deficit 0% total 98% 0% 162% 106% Income : Poor HHs Baseline Expand Max. Problem Comm. Staple Con.prob Max.curr Curr. Cash Access -ability Access %norm Price Price %norm Access Access Cows' milk sales - wet 0 0 0 100% 100% 300% 100% 0 0 Wool/mohair 0 0 0 100% 150% 300% 150% 0 0 Cattle sales 0 0 0 100% 176% 300% 176% 0 0 Goat sales 0 338 338 100% 150% 300% 150% 506 506 Sheep sales 0 750 750 100% 146% 300% 146% 1,095 1,095 Chicken sales 50 0 50 100% 160% 300% 160% 80 80 Maize sales 0 0 0 65% 160% 300% 104% 0 0 Sorghum sales 0 0 0 45% 160% 300% 72% 0 0 Wheat sales 0 0 0 100% 160% 300% 160% 0 0 Beans sales 0 0 0 45% 160% 300% 72% 0 0 Pea sales 0 0 0 45% 160% 300% 72% 0 0 Potatoes sales 0 0 0 100% 160% 300% 160% 0 0 Vegetables sales 200 0 200 100% 160% 300% 160% 320 320 Ag. Labour 387 0 387 100% 200% 300% 200% 774 774 Construction labour 40 6 46 100% 106% 300% 106% 49 49 Domestic labour 786 41 827 100% 106% 300% 106% 876 876 Employment (and/or 0 0 0 100% 106% 300% 106% 0 0 Self-employment 600 0 600 120% 200% 300% 240% 1,440 1,440 total: 2,063 1,134 3,197 5,140 5,140 Expenditure : Poor HHs Baseline Problem Comm. Con.prob Max.curr Curr. Cash Expend %norm Price %norm Expend Expend min.non-staple 284 100% 166% 166% 471 471 essential 516 100% 126% 126% 0 562 staple 733 4,669 4,107 other 530 0 total: 2,063 5,140 5,140 exp. deficit 650 88

34
Peri Urban LZ BASELINE ACCESS PROBLEM SPECIFICATION RESPONSE Sources of Food : Very Poor HHs Baseline Expand Max. Problem Food Intake Con.prob Max.curr Curr. Access -ability Access %norm kcals/day %norm Access Access Cows' milk - wet 0% 0% 0% 100% baseline: 100% 0% 0% Own meat 0% 0% 0% 100% 2100 100% 0% 0% Green cons maize 4% 0% 4% 80% for analysis: 80% 3% 3% Maize 7% 0% 7% 80% 2100 80% 5% 5% Sorghum 2% -2% 0% 70% 70% 0% 0% Beans 0% 0% 0% 70% 70% 0% 0% Pumpkin 0% 0% 0% 100% 100% 0% 0% Vegetables 1 0% 0% 0% 100% 100% 0% 0% Vegetables 2 0% 0% 0% 100% 100% 0% 0% Labour: weeding 10% 0% 10% 80% 80% 8% 8% Labour: harvesting 5% 0% 5% 80% 80% 4% 4% Labour: construction, 0% 0% 0% 100% 100% 0% 0% Gifts 3% 0% 3% 100% 100% 3% 3% School feeding 6% 0% 6% 100% 100% 6% 6% Food aid 35% 0% 35% 0% 0% 0% 0% Purchase - non staple 1% 1% 2% 100% 100% 2% 2% Purchase - staple 24% 38% 100% 100% 18% 18% food deficit 50% total 98% -1% 110% 50% Income : Very Poor HHs Baseline Expand Max. Problem Comm. Staple Con.prob Max.curr Curr. Cash Access -ability Access %norm Price Price %norm Access Access Cattle sales 0 0 0 100% 200% 250% 200% 0 0 Pig sales 0 0 0 100% 128% 250% 128% 0 0 Sheep sales 0 0 0 100% 160% 250% 160% 0 0 Maize sales 0 0 0 80% 138% 250% 110% 0 0 Sorghum sales 0 70 70 70% 138% 250% 97% 68 68 Beans sales 0 0 0 70% 138% 250% 97% 0 0 Vegetable sales 1 245 0 245 100% 138% 250% 138% 338 338 Vegetable sales 2 120 0 120 100% 138% 250% 138% 166 166 Ag. Labour 450 0 450 80% 200% 250% 160% 720 720 Construction labour 100 15 115 100% 106% 250% 106% 122 122 Domestic labour 91 14 105 100% 106% 250% 106% 111 111 Employment (and/or 0 0 0 100% 106% 250% 106% 0 0 Remittances 50 0 50 100% 137% 250% 137% 69 69 Self-employment 180 0 180 80% 110% 250% 88% 158 158 Petty trade 0 0 0 100% 106% 250% 106% 0 0 Gifts / social support 75 0 75 100% 100% 250% 100% 75 75 total: 1,311 99 1,410 1,826 1,826 Expenditure : Very Poor HHs Baseline Problem Comm. Con.prob Max.curr Curr. Cash Expend %norm Price %norm Expend Expend min.non-staple 284 100% 175% 175% 497 497 essential 378 100% 126% 126% 0 0 staple 720 1,329 1,329 other -70 0 total: 1,311 1,826 1,826 exp. deficit 476 476
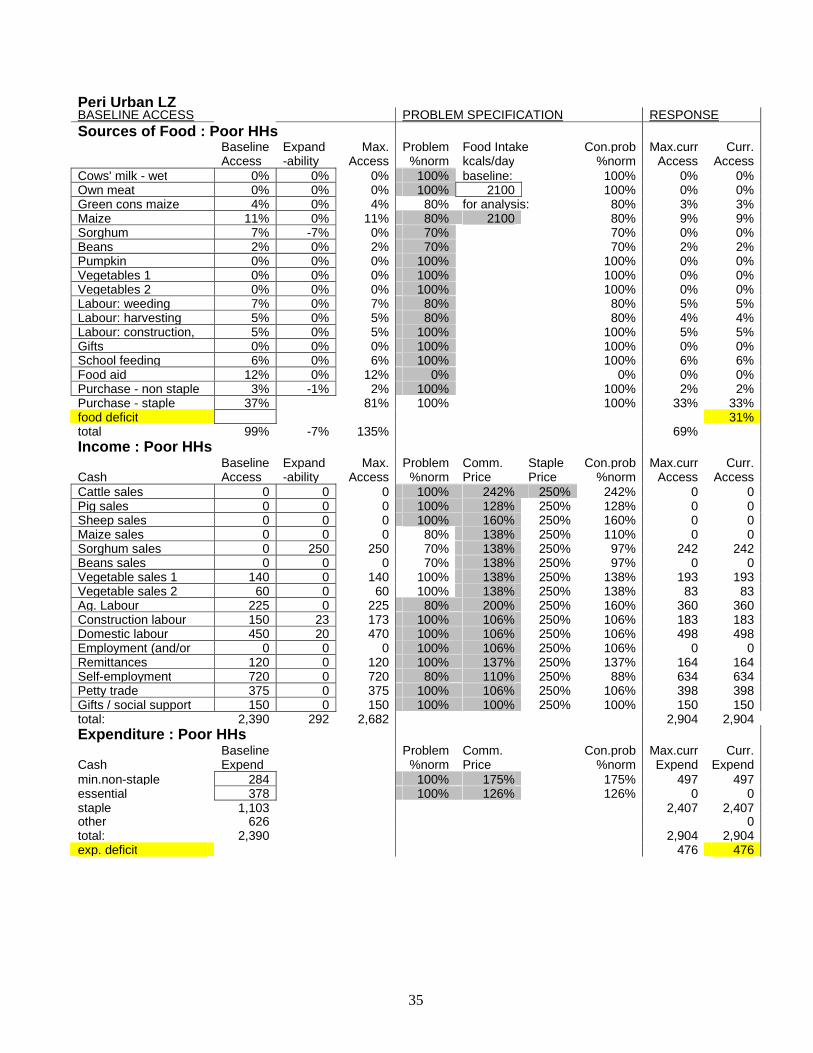
35
Peri Urban LZ BASELINE ACCESS PROBLEM SPECIFICATION RESPONSE Sources of Food : Poor HHs Baseline Expand Max. Problem Food Intake Con.prob Max.curr Curr. Access -ability Access %norm kcals/day %norm Access Access Cows' milk - wet 0% 0% 0% 100% baseline: 100% 0% 0% Own meat 0% 0% 0% 100% 2100 100% 0% 0% Green cons maize 4% 0% 4% 80% for analysis: 80% 3% 3% Maize 11% 0% 11% 80% 2100 80% 9% 9% Sorghum 7% -7% 0% 70% 70% 0% 0% Beans 2% 0% 2% 70% 70% 2% 2% Pumpkin 0% 0% 0% 100% 100% 0% 0% Vegetables 1 0% 0% 0% 100% 100% 0% 0% Vegetables 2 0% 0% 0% 100% 100% 0% 0% Labour: weeding 7% 0% 7% 80% 80% 5% 5% Labour: harvesting 5% 0% 5% 80% 80% 4% 4% Labour: construction, 5% 0% 5% 100% 100% 5% 5% Gifts 0% 0% 0% 100% 100% 0% 0% School feeding 6% 0% 6% 100% 100% 6% 6% Food aid 12% 0% 12% 0% 0% 0% 0% Purchase - non staple 3% -1% 2% 100% 100% 2% 2% Purchase - staple 37% 81% 100% 100% 33% 33% food deficit 31% total 99% -7% 135% 69% Income : Poor HHs Baseline Expand Max. Problem Comm. Staple Con.prob Max.curr Curr. Cash Access -ability Access %norm Price Price %norm Access Access Cattle sales 0 0 0 100% 242% 250% 242% 0 0 Pig sales 0 0 0 100% 128% 250% 128% 0 0 Sheep sales 0 0 0 100% 160% 250% 160% 0 0 Maize sales 0 0 0 80% 138% 250% 110% 0 0 Sorghum sales 0 250 250 70% 138% 250% 97% 242 242 Beans sales 0 0 0 70% 138% 250% 97% 0 0 Vegetable sales 1 140 0 140 100% 138% 250% 138% 193 193 Vegetable sales 2 60 0 60 100% 138% 250% 138% 83 83 Ag. Labour 225 0 225 80% 200% 250% 160% 360 360 Construction labour 150 23 173 100% 106% 250% 106% 183 183 Domestic labour 450 20 470 100% 106% 250% 106% 498 498 Employment (and/or 0 0 0 100% 106% 250% 106% 0 0 Remittances 120 0 120 100% 137% 250% 137% 164 164 Self-employment 720 0 720 80% 110% 250% 88% 634 634 Petty trade 375 0 375 100% 106% 250% 106% 398 398 Gifts / social support 150 0 150 100% 100% 250% 100% 150 150 total: 2,390 292 2,682 2,904 2,904 Expenditure : Poor HHs Baseline Problem Comm. Con.prob Max.curr Curr. Cash Expend %norm Price %norm Expend Expend min.non-staple 284 100% 175% 175% 497 497 essential 378 100% 126% 126% 0 0 staple 1,103 2,407 2,407 other 626 0 total: 2,390 2,904 2,904 exp. deficit 476 476

36
Southern Lowland LZ BASELINE ACCESS PROBLEM SPECIFICATION RESPONSE Sources of Food : Very Poor HHs Baseline Expand Max. Problem Food Intake Con.prob Max.curr Curr. Access -ability Access %norm kcals/day %norm Access Access Cows' milk - wet 0% 0% 0% 100% baseline: 100% 0% 0% Own meat 0% 0% 0% 100% 2100 100% 0% 0% Green cons maize 3% 0% 3% 75% for analysis: 75% 3% 3% Maize 11% 0% 11% 75% 2100 75% 9% 9% Sorghum 4% -4% 0% 50% 50% 0% 0% Beans 2% 0% 2% 50% 50% 1% 1% Labour: weeding 15% 0% 15% 75% 75% 11% 11% Labour: other 3% 0% 3% 75% 75% 2% 2% Gifts 5% 0% 5% 100% 100% 5% 5% Wild food 1% 0% 1% 100% 100% 1% 1% School feeding 5% 0% 5% 100% 100% 5% 5% Food aid 14% 0% 14% 0% 0% 0% 0% Purchase - non staple 4% -1% 2% 100% 100% 2% 2% Purchase - staple 26% 70% 100% 100% 28% 28% food deficit 33% total 93% -5% 132% 67% adj.fact 6.92 Income : Very Poor HHs Baseline Expand Max. Problem Comm. Staple Con.prob Max.curr Curr. Cash Access -ability Access %norm Price Price %norm Access Access Cattle sales 0 0 0 50% 200% 300% 100% 0 0 Goat sales 0 0 0 100% 175% 300% 175% 0 0 Sheep sales 0 0 0 100% 145% 300% 145% 0 0 Sorghum sales 0 120 120 50% 138% 300% 69% 83 83 Beans sales 0 0 0 50% 138% 300% 69% 0 0 Ag. Labour 300 0 300 70% 200% 300% 140% 420 420 Construction labour 150 23 173 100% 106% 300% 106% 183 183 Domestic labour 240 36 276 100% 106% 300% 106% 293 293 Employment and pension 0 0 0 100% 106% 300% 106% 0 0 Remittances 300 0 300 100% 106% 300% 106% 318 318 Self-employment 480 0 480 80% 200% 300% 160% 768 768 Petty trade 0 0 0 100% 106% 300% 106% 0 0 total: 1,470 179 1,649 2,064 2,064 Expenditure : Very Poor HHs Baseline Problem Comm. Con.prob Max.curr Curr. Cash Expend %norm Price %norm Expend Expend min.non-staple 178 100% 172% 172% 306 306 essential 363 100% 126% 126% 0 0 staple 540 1,758 1,758 other 389 0 total: 1,470 2,064 2,064 exp. deficit 457 457

37
Senqu River Valley LZ BASELINE ACCESS PROBLEM SPECIFICATION RESPONSE Sources of Food : Very Poor HHs Baseline Expand Max. Problem Food Intake Con.prob Max.curr Curr. Access -ability Access %norm kcals/day %norm Access Access Cows' milk - wet 0% 0% 0% 100% baseline: 100% 0% 0% Goats' milk - wet 0% 0% 0% 100% 2100 100% 0% 0% Own meat 0% 0% 0% 100% for analysis: 100% 0% 0% Maize 5% 0% 5% 80% 2100 80% 4% 4% Sorghum 6% -6% 0% 80% 80% 0% 0% Beans 1% 0% 1% 80% 80% 1% 1% Vegetables 1% 0% 1% 100% 100% 1% 1% Labour 17% 0% 17% 80% 80% 14% 14% Wild food 2% 0% 2% 100% 100% 2% 2% School feeding 5% 0% 5% 100% 100% 5% 5% Food aid 33% 0% 33% 0% 0% 0% 0% Purchase - non staple 4% -2% 2% 100% 100% 2% 2% Purchase - staple 22% 86% 100% 100% 40% 40% food deficit 33% total 95% -8% 151% 67% adj.fact 3.70 Income : Very Poor HHs Baseline Expand Max. Problem Comm. Staple Con.prob Max.curr Curr. Cash Access -ability Access %norm Price Price %norm Access Access Wool/mohair 0 0 0 100% 118% 300% 118% 0 0 Cattle sales 0 0 0 100% 166% 300% 166% 0 0 Piglet sales 0 0 0 100% 266% 300% 266% 0 0 Goat sales 0 0 0 100% 133% 300% 133% 0 0 Pig sales 0 0 0 100% 100% 300% 100% 0 0 Sheep sales 0 0 0 100% 132% 300% 132% 0 0 Chicken sales 0 0 0 100% 160% 300% 160% 0 0 Sorghum sales 0 244 244 80% 138% 300% 110% 269 269 Beans sales 0 0 0 80% 138% 300% 110% 0 0 Ag. Labour 450 0 450 80% 200% 300% 160% 720 720 Construction labour 400 60 460 100% 135% 300% 135% 621 621 Domestic labour 320 0 320 100% 106% 300% 106% 339 339 Employment/Pension 0 0 0 100% 106% 300% 106% 0 0 Remittances 200 0 200 100% 118% 300% 118% 236 236 Self-employment 320 0 320 100% 200% 300% 200% 640 640 Petty trade 0 0 0 100% 110% 300% 110% 0 0 total: 1,690 304 1,994 2,826 2,826 Expenditure : Very Poor HHs Baseline Problem Comm. Con.prob Max.curr Curr. Cash Expend %norm Price %norm Expend Expend min.non-staple 178 100% 174% 174% 310 310 essential 342 100% 126% 126% 0 0 staple 462 2,516 2,516 other 708 0 total: 1,690 2,826 2,826 exp. deficit 431 431

38
Senqu River Valley LZ BASELINE ACCESS PROBLEM SPECIFICATION RESPONSE Sources of Food : Poor HHs Baseline Expand Max. Problem Food Intake Con.prob Max.curr Curr. Access -ability Access %norm kcals/day %norm Access Access Cows' milk - wet 0% 0% 0% 100% baseline: 100% 0% 0% Goats' milk - wet 0% 0% 0% 100% 2100 100% 0% 0% Own meat 0% 0% 0% 100% for analysis: 100% 0% 0% Maize 12% 0% 12% 80% 2100 80% 9% 9% Sorghum 7% -7% 0% 80% 80% 0% 0% Beans 2% 0% 2% 80% 80% 1% 1% Vegetables 0% 0% 0% 100% 100% 0% 0% Labour 14% 0% 14% 80% 80% 11% 11% Wild food 1% 0% 1% 100% 100% 1% 1% School feeding 5% 0% 5% 100% 100% 5% 5% Food aid 27% 0% 27% 0% 0% 0% 0% Purchase - non 3% -2% 2% 100% 100% 2% 2% Purchase - staple 28% 125% 100% 100% 60% 60% food deficit 9% total 99% -8% 189% 91% adj.fact 1.48 Income : Poor HHs Baseline Expand Max. Problem Comm. Staple Con.prob Max.curr Curr. Cash Access -ability Access %norm Price Price %norm Access Access Wool/mohair 0 0 0 100% 118% 300% 118% 0 0 Cattle sales 0 0 0 100% 166% 300% 166% 0 0 Piglet sales 250 0 250 100% 266% 300% 266% 665 665 Goat sales 0 175 175 100% 133% 300% 133% 233 233 Pig sales 0 0 0 100% 100% 300% 100% 0 0 Sheep sales 500 250 750 100% 132% 300% 132% 990 990 Chicken sales 150 0 150 100% 160% 300% 160% 240 240 Sorghum sales 0 352 352 80% 138% 300% 110% 389 389 Beans sales 0 0 0 80% 138% 300% 110% 0 0 Ag. Labour 360 0 360 80% 200% 300% 160% 576 576 Construction labour 0 0 0 100% 135% 300% 135% 0 0 Domestic labour 0 0 0 100% 106% 300% 106% 0 0 Employment/Pension 0 0 0 100% 106% 300% 106% 0 0 Remittances 200 0 200 100% 118% 300% 118% 236 236 Self-employment 400 0 400 100% 200% 300% 200% 800 800 Petty trade 750 0 750 100% 110% 300% 110% 825 825 total: 2,610 777 3,387 4,953 4,953 Expenditure : Poor HHs Baseline Problem Comm. Con.prob Max.curr Curr. Cash Expend %norm Price %norm Expend Expend min.non-staple 213 100% 174% 174% 371 371 essential 368 100% 126% 126% 0 0 staple 700 4,583 4,583 other 1,329 0 total: 2,610 4,953 4,953 exp. deficit 464 464

39
Appendix D
Agrometeorological Situation for the 2007/08 Agricultural Season (By Lesotho
Meteorological Services. June 3, 2008)) Rainfall Situation Rainfall situation was to a large degree satisfactory during the 2007/08 agricultural season. Onset of rains was during the last week of September 2007. The onset was marked by heavy downpours of rain countrywide. However, it should be noted that the onset was late for planting in the highlands of the country as normally planting in these areas starts as early as August and September. In the other agro ecological zones the onset was timely. Heavy rains in the beginning of the season ended one of the worst droughts Lesotho has experienced in more than three decades. The drought persisted for more than nine consecutive months. Rainfall situation was normal to above normal during both October – December 2007 (OND) and January – March 2008 (JFM) periods. Some parts of the country recorded consistent rainfall for most parts of the season. Land was waterlogged at some places during the onset and sowing was affected, and heavy rains in December hampered with weeding in some parts of the country. Cumulative Rainfall remained above normal during OND and was largely normal during JFM. Last dekad of January and February were dominated by dry spells which affected crops at some parts of the country. Crops were at their critical stages and some of them could not recover fully from damage caused by that dry weather. Hailstorms were experienced in most parts of the country and some of them were quite destructive especially in the southern parts of the country.
Frost and Temperatures Frost came during the beginning of last dekad of April. It was delayed in the highlands, on time in foothills and early in the lowlands and the Senqu River valley. Some crops had not fully matured when frost came and they were thus destroyed before giving potential yields. Mean temperatures dropped to below normal most of the time since the second dekad of March until the end of the season. Otherwise temperatures were good through out the season.