Embed Size (px)
Citation preview

Annual ReportFor the year ended 31 December 2017
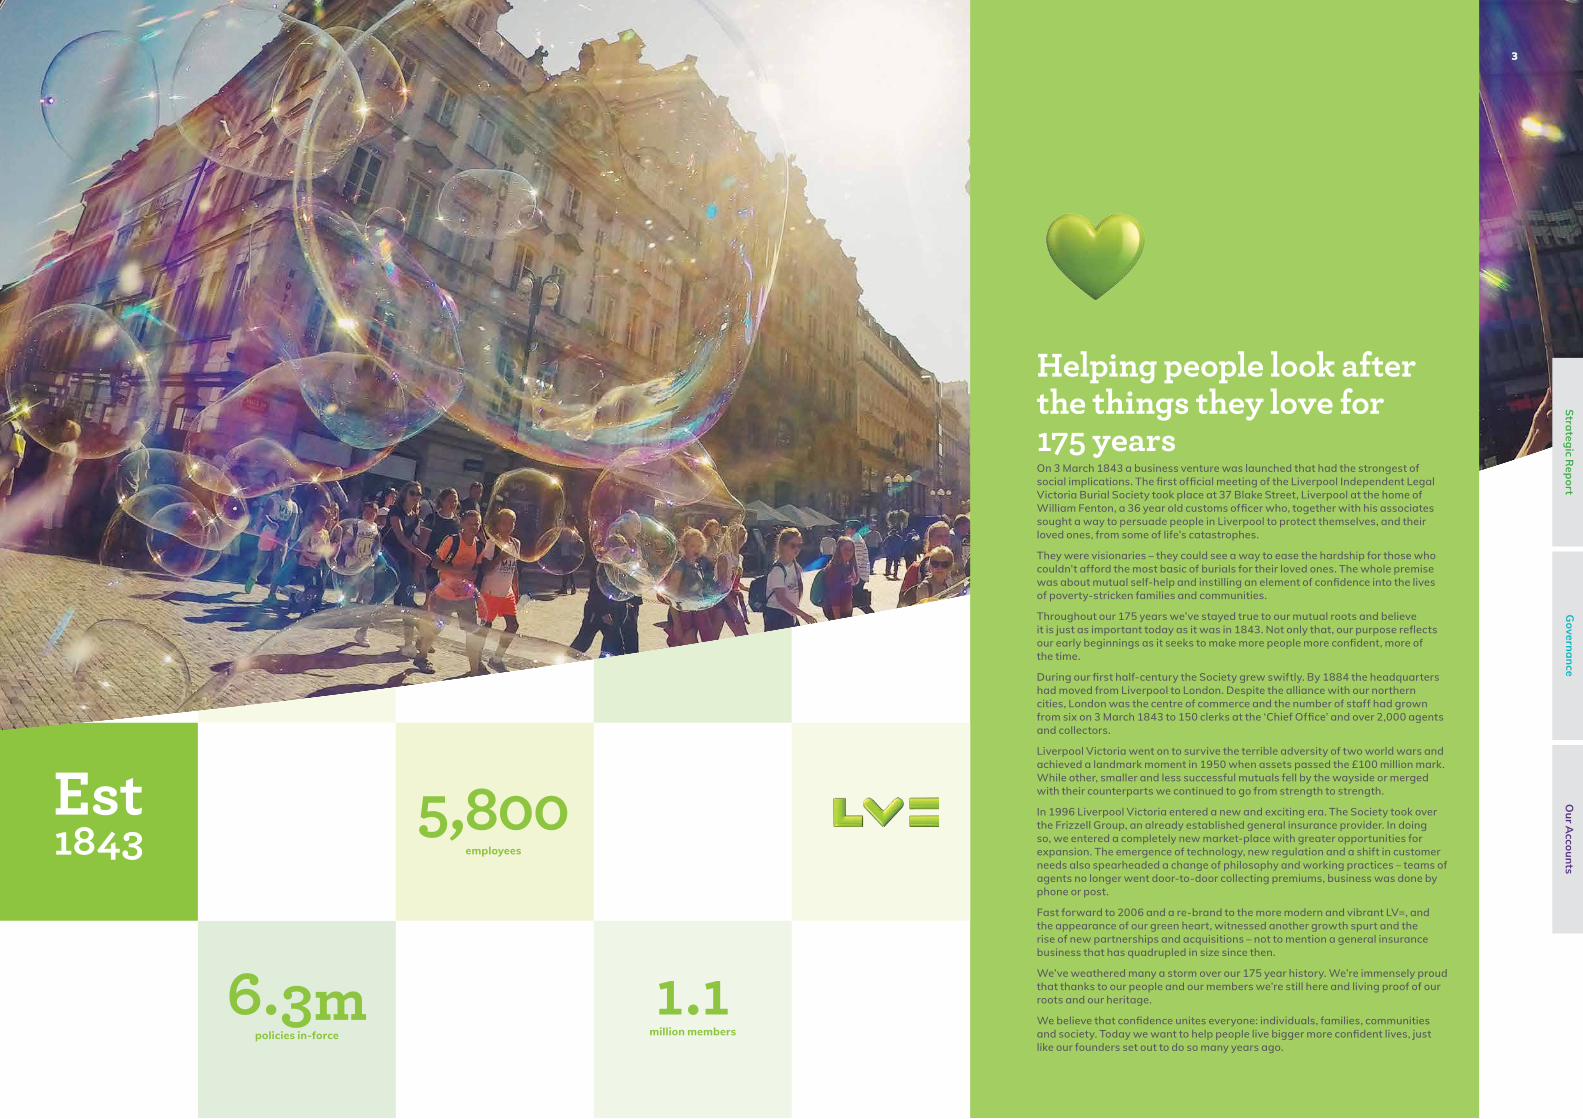
Helping people look after the things they love for 175 yearsOn 3 March 1843 a business venture was launched that had the strongest of social implications. The first official meeting of the Liverpool Independent Legal Victoria Burial Society took place at 37 Blake Street, Liverpool at the home of William Fenton, a 36 year old customs officer who, together with his associates sought a way to persuade people in Liverpool to protect themselves, and their loved ones, from some of life’s catastrophes.
They were visionaries – they could see a way to ease the hardship for those who couldn’t afford the most basic of burials for their loved ones. The whole premise was about mutual self-help and instilling an element of confidence into the lives of poverty-stricken families and communities.
Throughout our 175 years we’ve stayed true to our mutual roots and believe it is just as important today as it was in 1843. Not only that, our purpose reflects our early beginnings as it seeks to make more people more confident, more of the time.
During our first half-century the Society grew swiftly. By 1884 the headquarters had moved from Liverpool to London. Despite the alliance with our northern cities, London was the centre of commerce and the number of staff had grown from six on 3 March 1843 to 150 clerks at the ‘Chief Office’ and over 2,000 agents and collectors.
Liverpool Victoria went on to survive the terrible adversity of two world wars and achieved a landmark moment in 1950 when assets passed the £100 million mark. While other, smaller and less successful mutuals fell by the wayside or merged with their counterparts we continued to go from strength to strength.
In 1996 Liverpool Victoria entered a new and exciting era. The Society took over the Frizzell Group, an already established general insurance provider. In doing so, we entered a completely new market-place with greater opportunities for expansion. The emergence of technology, new regulation and a shift in customer needs also spearheaded a change of philosophy and working practices – teams of agents no longer went door-to-door collecting premiums, business was done by phone or post.
Fast forward to 2006 and a re-brand to the more modern and vibrant LV=, and the appearance of our green heart, witnessed another growth spurt and the rise of new partnerships and acquisitions – not to mention a general insurance business that has quadrupled in size since then.
We’ve weathered many a storm over our 175 year history. We’re immensely proud that thanks to our people and our members we’re still here and living proof of our roots and our heritage.
We believe that confidence unites everyone: individuals, families, communities and society. Today we want to help people live bigger more confident lives, just like our founders set out to do so many years ago.
Est1843
6.3mpolicies in-force
5,800employees
1.1million members
3
Strategic Report
Governance
Our A
ccounts

ContentsGreen Heart Support 6
Strategic Report 8
Key Performance Indicators 10
Chairman’s Review 12
Chief Executive’s Review 13
Our Core Purpose, Strategy and Business Model 15
Group Finance Director’s Review 20
General Insurance Review 30
Life Review 33
Risk Management 36
Corporate Responsibility Report 45
Corporate Governance Report 52
Corporate Governance Statement 54
Directors’ Report 72
Report on Directors’ Remuneration 75
Glossary 92
Our Accounts 94
Independent Auditors’ Report to the Members of 96 Liverpool Victoria Friendly Society Limited
Statement of Comprehensive Income 104
Statement of Financial Position 105
Statement of Cash Flows 106
Notes to the Financial Statements 107
2017 highlights
£122mProfit before tax*
*see definition on p21
180%Solvency II
Capital Coverage Ratio
£26mMutual bonus
£158mOperating profit
7.7%With-profits
investment performance
4 5
Strategic Report
Governance
Our A
ccounts

Green Heart support paid for Bill and Eileen to stay in a
lovely hotel together with their close family. We wanted to
help make one more precious memory for them after their
daughter was diagnosed with a terminal illness and given
only a few weeks to live.
With our purpose to help people live more confident lives we launched Green Heart support in 2017. It was created with the idea of bettering the lives of our own members and customers – the people that trust us to look out for them.
Helping make more people more confident, more of the time
In 2017 Green Heart support made a difference to 193 customers and
members with help valued at £70,000. In 2018 we expect to reach over 2,500
customers and members with help valued at over £400,000.
Richard RowneyChief executive
Our products are designed to provide confidence at a functional level – whether it’s knowing that your personal possessions are protected, peace of mind that you’re looking after your loved ones’ future if something happened to you, or the assurance that you have financial security in your retirement years.
By the very nature of our business we often hear from people when they’re in the midst of some of the most difficult situations they’ll ever face. That’s why we decided to create a way to support customers when they are going through extraordinary or unusual times – giving them a boost that makes a difference to their lives, above and beyond what their policy is there to deliver.
Green Heart support enhances people’s lives when they need it most but least expect it. By empowering our customer facing people to make it feel special for our customers, they can step in with a simple gift or gesture through to truly life changing assistance. For us, recognising when we can make a difference to someone’s life is the essence of Green Heart support. We want our employees to know that by working for us they are helping to make a real difference to thousands of lives. Just as importantly, we want our customers to know we are always looking out for them and we try to do the right thing when someone is going through extraordinary circumstances, stepping in with something extra special whenever we can.
Green Heart Support
“
“
LV= didn’t just go the extra
mile they went an extra 3,000 miles.
“
“
In a time when you feel you are just a number in the industry of
insurance it gave me a boost, a
personal boost.
“
“
We paid for a month’s worth of hospital parking for Jane to visit her fiancé after Keith was struck
down by an unknown illness while they were on holiday. Back home, doctors were
baffled as Keith was still unable to talk or function normally.
We were able to help take some stress and expense away from
Jane by paying the parking fees and sending her a luxury
hamper so she could relax after exhausting days at the hospital.
We sent a luxury throw and some financial support to our
member Carol to provide a sentiment of comfort after
the loss of her daughter who had a life-limiting condition. Once her daughter’s full-time carer, Carol was lonely and
struggling to cope.
Names have been changed to protect identities.
6 7
Strategic Report
Governance
Our A
ccounts
LV= Green Heart Support

Strategic Report
Strategic ReportKey Performance Indicators 10
Chairman’s Review 12
Chief Executive’s Review 13
Our Core Purpose, Strategy and Business Model 15
Group Finance Director’s Review 20
General Insurance Review 30
Life Review 33
Risk Management 36
Corporate Responsibility Report 45
OverviewThe following pages outline our performance during 2017 and give a review of our business areas and our strategy.
We have chosen to observe the requirement of the Department for Business Innovation and Skills (BIS) narrative reporting regulations, which requires the preparation of a strategic report, even though we are not formally required to do this.
£133mOperating capital generation
1stUK best loved
£121mGeneral insurance operating profit
£37mLife operating profit
76%Employee engagement
9
Strategic Report
8

To be Britain’s best loved insurer
Explanation of measureWe use a combination of surveys to assess our performance of delivering consistent green heart experiences to our customers and members.
2017 TargetTo rank in the top five for relevant opinion surveys and deliver excellent customer service levels whilst consistently treating the customer fairly.
Performance
1st UK best loved
Commentary In an independent survey by Opinium of 4,021 customers in the insurance industry, LV= was voted best loved by more of our customers than other brands by their customers surveyed.
As well as the results of opinion surveys our performance is demonstrated through the many awards LV= has won during the year.
2018 Target Our aim is to differentiate ourselves in the market against competitors based on customer and member satisfaction measured against relevant awards and opinion surveys.
Staff engagement
Explanation of measureOur people are a major differentiator for LV= and are crucial to delivering our best loved vision so it is important they are engaged with the work we do. The engagement metric has been updated to ‘Sustainable engagement’ which adds ‘enabled’ and ‘energised’ to traditional engagement. This measure drives greater insight enabling linkage analysis of engagement to business performance.
2017 TargetFocus on retaining engagement scores at or above the UK high performing organisations norm of 81%.
Performance
76% engagement
Commentary 2017 has been a year of significant change across the group and we recognise that the uncertainty that our people have experienced during this time is reflected in the sustainable engagement score of 76%.
2018 Target To focus on delivering strong employee engagement.
At the end of 2017 the group is in a much stronger position and we will work with our people to advance the group forward under our new structure whilst improving engagement and the confidence of our staff.
Grow member value
Operating profit
Explanation of measureOperating profit is the key performance measure for the profitability of the group. This measure represents management’s view of the performance of the ongoing business without distortion from temporary volatility. See page 20 for definition.
Our Operating profit metric has been changed from a trading operations measure which excluded heritage to a total Operating profit measure. This change reflects the incorporation of heritage into the life business segment under John Perks as managing director of the combined life business, in order to align with the future strategic direction of the overall life business.
Performance
£158m
2017 Target To deliver superior returns commensurate with the markets in which we operate. Planned operating profit was £86 million.
Commentary General insurance operating profit at £121 million represents a 7% growth over the 2016 pre-Ogden result. This reflects the strong underwriting discipline employed in writing new business and favourable claims performance experienced. Life operating profit at £37 million includes contribution from new business and has increased from £13 million in 2016, primarily due to favourable current year model and basis changes.
Britain’s best loved insurer
Key Performance Indicators
Achieved target
Progressing towards target
Missed target
Capital Coverage Ratio (CCR)
Explanation of measureTo ensure the sustainability of the group we monitor our Capital Coverage Ratio (CCR). See page 92 for definition.
2017 TargetTo ensure the Solvency II capital coverage ratio is above the group’s risk appetite framework of £350 million (or about 140% as at 31 December 2017).
Performance
180%
Commentary Our group surplus capital has increased by £331 million and capital coverage ratio improved by 40 percentage points to 180%. This includes the positive impact of the general insurance transaction with Allianz (£444 million, 51%), capital generated from the general insurance business over the year (£170 million, 20%) and the adverse impact of a TMTP recalculation at the year-end (£246 million, 28%). We have also implemented various capital initiatives over the year to de-risk the Solvency II balance sheet, including the longevity reinsurance of the OB pensions portfolio, and closure of certain capital intensive product lines in protection.
LVFS main with-profits fund performance
Explanation of measureThis is the pre-tax return made on the main LV= with-profits fund, which is an actively managed investment fund consisting of our with-profits policyholders’ funds that we manage on behalf of policyholders.
2017 TargetTo deliver with-profits fund performance at or above benchmark. For 2017 the benchmark level was 8.6%. See page 26 for definition.
Performance
7.7%
Commentary The return on the with-profits fund is supported by strong equity returns (12.3% UK and 16.6% overseas), offsetting the low gilt yields (2.6%) experienced in the year. The fund underperformed against the benchmark by 0.9% largely because of adverse performance on long-standing investments in property and alternatives.
2018 KPIs and targetsIn 2018 our KPIs will change to reflect our plans for the future of the group. Our operating profit KPI will be replaced with a measure of operating capital generation to reflect the increased focus on capital in the Solvency II regulatory environment. We will continue to measure the performance of our members’ funds against relevant benchmarks.
Our key performance indicators for 2017 measure performance against our goal of growing member value and our vision of being Britain’s best loved insurer. Our board assesses progress against our strategic agenda and also the way we manage risks and a range of other financial and qualitative measures covering the significant aspects of our business.
In 2018 our Operating profit KPI will change to Capital generation to reflect the increasing focus of the board on this measure. Additional performance indicators are reported in the financial review section of this report.
* 2016 Operating profit is before the £139 million adverse impact of the change in the Ogden discount rate.
Key LV= with-profits Benchmark
2013 2014 2015 2016 2017
8.6%11.3%
2.7%
15.5%
8.6%
7.7%
11.1% 11.4%
3.8%14.5%
Key LV= Engagement HPO Norm
2013 2014 2015 2016 2017
78% 76%81% 81%
81%
76%
81%84% 86%
81%
2015 2016 2017
146% 140%
180%
2015 2016* 2017
£190m
£127m
£158m
11
Strategic Report
10 Key Performance Indicators

Chairman’s Review
Alan CookChairman
The group has had a very good financial year in 2017 and has delivered an operating profit of £158 million, up from an operating loss of £12 million the previous year. This performance has enabled the board to allocate a mutual bonus of £26 million to eligible members’ policies this year.
When I joined LV= in January 2017, I joined a business which had many of the fundamentals for success already in place; a well-known and well respected brand, coupled with a strong reputation for excellent customer service.
But the two trading businesses of life and general insurance were constrained due to the relative capital weakness of the group. Improving the capital position and reducing risk has been the number one priority of the board for some time.
As a result of a range of management actions, most notably the creation of the strategic partnership with Allianz, the capital challenges have largely been resolved. Further detail on the rationale and implications of the deal with Allianz can be found in the Group Finance Director’s Review on page 22 and the General Insurance Review on page 31.
That’s not to say we won’t keep looking for ways to continue to de-risk the business and improve the capital position. That is just a prudent way to operate. Addressing the capital weakness is only part of the equation and the board has also been looking to the future.
Since the beginning of the year we’ve seen changes at both the board and executive level as we assemble the right team to take the business forward.
I joined the board in January, taking over as chairman after the AGM in June and would like to acknowledge the work of my predecessor Mark Austen both as chairman for the last four years and as a member of the board for ten.
Andy Parsons joined the executive team as group finance director in June. This was at a critical point in the discussions with Allianz and he played a key role alongside Richard Rowney in negotiating an innovative and financially beneficial deal.
In August, Colin Ledlie joined as a non-executive director. As well as being an experienced non-executive director, Colin also brings a wealth of actuarial and risk experience having previously been chief actuary and chief risk officer at Standard Life.
Following the formation of the strategic partnership with Allianz I also became chairman of the jointly owned general insurance business (LVGIG) from 28 December. At this time, Steve Treloar, chief executive of LVGIG, stood down from the board of LVFS.
There have been further board changes at the beginning of 2018 with Alison Hutchinson and Luke Savage joining as non-executive directors on 1 January and 1 February respectively. Alison is currently chief executive of Fintech charity The Pennies Foundation, a non-executive director of the Yorkshire Building Society and until the end of 2017 was a non-executive director of Aviva Life UK. Luke was most recently group chief financial officer at Standard Life and prior to that, finance director at Lloyd’s of London for ten years.
As we look to the future, we do so with renewed confidence and a focus on three priorities; building a sustainable life business, making the partnership with Allianz work and developing future growth areas.
Throughout the next phase of the evolution of LV= we will always remember that our members not only own LV= products or investments they are also the owners of the business. The values of a mutual; of shared ownership, community and a sense of social purpose over and above pure profit are just as relevant now as they have ever been.
I’d like to conclude by thanking my fellow board members for the support they have given me in my first six months as chairman and the contribution they have made around the board table. I’d also like to thank all our people who work tremendously hard, day in, day out to look after the needs of all of our customers and finally our members for their continued support of the Society.
2017 has been a transformational year in the history of LV= with the creation of the strategic partnership with Allianz. We end the year with a much improved capital position supported by strong trading performance. The life business is well placed to build on its track record of profitable growth and looking to the future we continue to pursue new digital opportunities and explore partnerships to create the next trading business or businesses.
£158mOperating profit
Alan Cook ended his Chairman’s review by stating that 2017 has been a transformative year for the LV= group and I am very proud of what we have achieved.
We have secured a landmark strategic partnership with Allianz which creates the UK’s third largest personal lines insurer, delivered the first stages of our £100 million investment to transform our general insurance product and distribution capability, brought together our protection, retirement and heritage business areas under a single leadership and launched LV= Tomorrow signalling our investment in innovation as we build new revenue streams for the future.
All this is coupled with a very strong trading performance. At a headline level the group’s operating profit was £158 million, up from a £12 million operating loss in 2016 and the profit before tax was £122 million compared to a loss before tax of £49 million in 2016. This greatly improved financial performance was driven by positive contributions from both our general insurance and life businesses.
Throughout 2017 we continued to take a number of actions to improve our capital position and also the performance of our business including the implementation of a strategic cost reduction programme to significantly reduce our cost base. So far this has delivered £33 million of annualised expense savings against planned costs through a combination of a reduction in headcount and stronger discipline on discretionary spend. Our capital coverage ratio has increased to 180% from 140% at the end of 2016, measured on a standard formula basis. I said in last year’s annual report that we were working to get the group back within its capital risk appetite and we have done this.
General insuranceOur general insurance business delivered an operating profit of £121 million for the year and a combined operating ratio of 91.8% reflecting strong underwriting discipline, the impact of cost savings and reduced claims frequency as well as the benefit from market wide post-Ogden rate increases.
Following the disproportionately large decrease in the Ogden discount rate announced by the then Justice Secretary in February 2017 we were pleased that the Government have recently committed to reforming the rate with the publication of its Civil Liability Bill. We have consistently argued for a system that ensures fair payments for those injured while also reducing the cost of car insurance at a time when premiums are at a record high.
At the end of December we completed the planned sale of a 49% stake in our general insurance businesses to Allianz Holdings PLC for a total consideration of £500 million. This deal was originally announced in August 2017 and will see the creation of a strategic partnership between both businesses. Combining LV=’s strong brand, longstanding reputation in personal insurance and excellent customer service with the financial strength, digital expertise and data analytics of Allianz is something for the competition to fear.
Life2017 saw further growth in our life business as we continue to build both top and bottom line momentum. Operating profit of £37 million increased by £24 million over 2016 and new business sales of £2.0 billion, measured as the Present Value of New Business Premiums, were up 9% compared to the previous year, excluding the impact of enhanced annuities which were exited in 2016.
During the year we brought together our protection, retirement and heritage businesses promoting John Perks to the role of managing director for the combined life business.
We have also taken a number of management actions to improve the capital position of our life business including closing capital consumptive products such as lifetime annuities and protection 50+. In December we signed a reinsurance deal with RGA to reinsure around £1 billion of OB pensions deferred annuity liabilities (see page 25), de-risking the balance sheet for the future.
Chief Executive’s Review
Richard RowneyChief Executive
180%Capital Coverage
Ratio
12 13
Strategic Report

BrandOur brand is regarded by many external commentators as one of our strongest assets. It was one of the attractions for Allianz when considering partnering with LV=.
Underpinning our brand is our continued ambition to be ‘Britain’s Best Loved’ insurer. In May, LV= was named Which? Insurance Provider of the Year and in June won the Moneywise Customer Service Awards for Most Trusted Insurer for the second year running and Most Trusted Life Insurer for the fifth year running. In November it was announced that we had moved up 68 places to 32nd place in the KPMG Nunwood Customer Experience Excellence Index, a cross-sector ranking of 295 brands in the UK. In addition we remain YouGov’s ‘Most Recommended’ insurer.
In 2017 we also launched Green Heart support. This exists to support LV= customers when extraordinary things happen and they need help most, but least expect it. We can offer LV= customers and members small or medium sized gestures, right through to life changing support. To date 193 awards of support have been made totalling £70,000 with over £400,000 put aside to support customers and members in 2018.
Gender and diversityFor the first time this year UK companies with more than 250 employees must report on their gender pay gap which is the measurement of the difference between all men and women’s average earnings.
We have reported a 24% median gender pay gap and a mean of 28%. While this is higher than we would like, it is the right side of average compared to peers and competitors. The bonus pay gap is calculated on all bonuses, including LTIP payments and sales incentives paid in the year up to April 2017 and we have reported a median bonus pay gap of 37% and mean of 53%.
We have analysed the data and are confident that the gender pay and bonus gap is not an equal pay issue, but instead driven by the structure of the workforce with fewer women than men in senior leadership roles. Further information can be found on our website LV.com/genderpaygap.
Creating a diverse and inclusive culture is a key priority for LV=. We joined the HM Treasury’s Women in Finance Charter last year and have committed to increasing the female population at senior levels.
StrategyIn February 2017 we launched a clear and simple blueprint for the future of LV=. This established a common purpose of helping our customers, colleagues and communities to ‘Live Confident’.
Our strategic priorities focus on building stronger financial foundations, harnessing digital technologies to improve our core business and explore new profit areas and creating Green Heart Experiences for our customers and colleagues that leave them feeling more confident about life and more confident in LV=.
Underpinning these priorities is the work underway to create a sustainable mutual with a clearly defined social purpose, member reward strategy and an appropriate legal structure to enable the business to prosper in the long term and grow member value. We will update members on this work at this year’s AGM.
The strategic partnership with Allianz allows us to continue to benefit from a growing personal insurance business while also leaving us better placed to maintain the growth of our life business and pursue new digital opportunities.
It also provides a number of opportunities to leverage our joint capabilities through working together and we are keen to explore the possibilities of broadening the relationship beyond general insurance and into the life and health areas.
The Strategic Report on pages 8 to 51 was approved by the board of directors on 28 March 2018 and signed on its behalf by:
Richard Rowney, Chief Executive
STRATEGIC THRUSTS
STRATEGIC THRUSTS
STRATEGIC THRUSTSW
hat we
will deli
ver
We makeevery pound
countWe make it feel special
We fight for better
We don’t wait to be asked
VALUES
How we
will opera
te OUR PURPOSE
LIVE CONFIDENT
Lean & Strong
We will ensure our customers, colleagues and members can remain
confident over the long-term by eradicating waste and building the
strong financial foundations needed to be there for them.
Green HeartExperiences
We will create Green Heart Experiences –propositions, solutions, and customer
journeys – that leave customers, colleagues and members
feeling more confident about life, and more
confident in us.
LV=3.0We will create confidence
in our customers, colleagues and members by helping them
harness the power of the latest digital technologies – evolving how
we operate and bringing in the new talent needed to make sure we do so.
Our Core Purpose, Strategy and Business Model
The world is constantly changing and it is important that we at LV= keep up with it. In order to do this our business needs to evolve. We know that the insurance industry is facing a big transformation with new business models, Fintech, investment in big data and start-ups shifting customer expectations. At the same time, customer lifestyles and working patterns are changing, leading to a range of emerging consumer needs relating to insurance and finances more generally. It is with this in mind that last year we introduced our new strategy. We call it our blueprint and we believe it is the best way to move forward at pace to maintain and grow our business.
VALUES
VALUES
VALUES
LV= moved up 68 places to
in the KPMG Nunwood Customer Experience
Excellence Index
32nd
15
Strategic Report
14 LV= Annual Report 2017

Our Core Purpose, Strategy and Business Model
What it meansWe believe that everyone deserves to Live Confident, and we exist to help people to do that.
For us this means:
●● Being proactive about preventing things going wrong, not just fixing them when they do.
●● Fighting for and leading the way in doing things that are in our members’ and customers’ best interests.
●● Being transparent, well-intentioned and absolutely honest in all that we do.
To deliver on that promise there are three things we must do:
1 Deliver Green Heart Experiences for our customers, colleagues and members by designing and delivering solutions that prevent as well as fix – and inspire total trust.
2 Build a business that is sustainably Lean & Strong so we can achieve our goals over the long term whilst continuing to grow member value.
3 Harness the latest technologies, evolve how we operate and bring in the new talent needed to ensure that we lead the industry today and into the future. We have termed this LV=3.0.
We will only succeed if everyone at LV= truly lives our values every day, so that:
●● We make it feel special
●● We make every pound count
●● We don’t wait to be asked
●● We fight for better
If we do all of this our customers will be able to live bigger lives; our people will be able to fulfil their aspirations; and LV= will be able to make an important and valued difference for longer. People and LV= will be able to Live Confident.
We still believe that our Sharp with a Heart philosophy gives us a clear point of difference and we will continue to do things that combine the competitive performance of a PLC with the trusted behaviours of a mutual.
Future strategic priorities for the groupGreen Heart Experiences 1 Define and nurture the culture we need
to thrive, delivering a highly engaged workforce and equipping us with the talent and capability to drive our strategy forward.
2 Strengthen and reposition our brand to build on its current strength and position as a modern mutual, with broader propositions aligned to our proposed growth strategy.
Lean & Strong 3 Deliver the core strategy to ensure financial
and strategic sustainability, and deliver priority projects (e.g. a new ISA product)
4 Embed a strong risk management framework and culture, and comply with the regulatory changes being implemented within the General Data Protection Regulations (GDPR).
LV= 3.0 5 Build a strong and deep strategic
partnership with Allianz both through the general insurance business and by identifying broader opportunities to leverage capabilities and work together.
6 Develop, agree and execute the strategy to deliver accelerated growth, with new proposition launches to establish the proof points for this strategy, a three year transformation plan defined, and successful development of Wealth Wizards.
Building a sustainable mutual 7 Underpinning these priorities is the
work underway to create a sustainable mutual with a clearly defined social purpose, member reward strategy and an appropriate legal structure to enable the business to prosper in the long term and grow member value.
How we have performed against our strategic agenda in 2017Last year we introduced our blueprint for our future and alongside it our three strategic thrusts, that will provide us with direction as we navigate the challenges and opportunities over the years ahead.
Our strategic agenda for 2017 was aligned to these strategic thrusts: Green Heart Experiences, Lean and Strong and LV= 3.0.
Green Heart ExperiencesGreen Heart Experiences leave customers, colleagues and members feeling more confident about life and more confident in us.
In 2017 we launched Green Heart support to help and comfort our customers and members, when they need it most. We aim to show that LV= is an insurer with a difference – that we act with care and compassion, and provide support to change lives for the better.
So far we’ve helped 193 customers and members and are rolling the programme out across the organisation so we can help more members over the course of 2018.
We also recognise that our employee experience is critical if we are to enable our people to help our members. We are in the process of reviewing our employee value proposition to ensure we recognise our people appropriately for helping our customers and members.
Our continued focus on our customers has again led to numerous awards across our business. We’ve been named Insurance Provider of the Year at the Which? awards 2017, we won the Moneywise Customer Service Awards for ‘Most Trusted Insurer’ for the second year running and the ‘Most Trusted Life Insurance Provider’ for the fifth year in a row. We also remain YouGov’s ‘Most Recommended’ insurer, and in the KPMG Nunwood Customer Experience Excellence Index we have been placed 32nd across all brands and industries, up from 100th place the year before.
Lean and StrongBeing lean and strong ensures our customers, colleagues and members can remain confident in LV= over the long term as we eradicate waste and build on the strong financial foundations needed to be there for them in the future.
The main achievement this year has been the successful negotiation and delivery of the strategic general insurance partnership with Allianz. This has contributed to a significant improvement in our capital strength and hence customer and member security. The deal delivers great value for our members and policyholders, and supports the LV= brand.
We have also achieved the following:
●● Concluded a deal to reinsure our OB pensions business with RGA, significantly reducing our risk exposure and capital requirements;
●● Delivered £33 million of savings against planned costs through our strategic cost programme, which has left us with an expense base that will hopefully allow us to compete with the best in the market; and
●● Implemented systems thinking across the organisation, and investigated the opportunity presented by robotic process automation to streamline our processes and deliver a step change in our risk culture.
LV= 3.0LV=3.0 harnesses the power of the latest digital technologies, evolving how we operate and bringing in new talent so our customers and members can live confident in the future.
2017 has seen delivery of significant milestones on Pioneer, which is transforming our product and distribution capability in the general insurance direct business and it allows us to deliver more competitive and tailored insurance offerings. We have rolled out functionality to our motor, classic car and motorbike books of business, and are working to deliver the improved functionality to our home book in 2018.
We have also continued the rollout of Fastway – our quote and apply system and underwriting rules engine for IFAs selling our protection products.
3.0
16 17
Strategic Report
LV= Annual Report 2017
Our Core Purpose, Strategy and Business Model
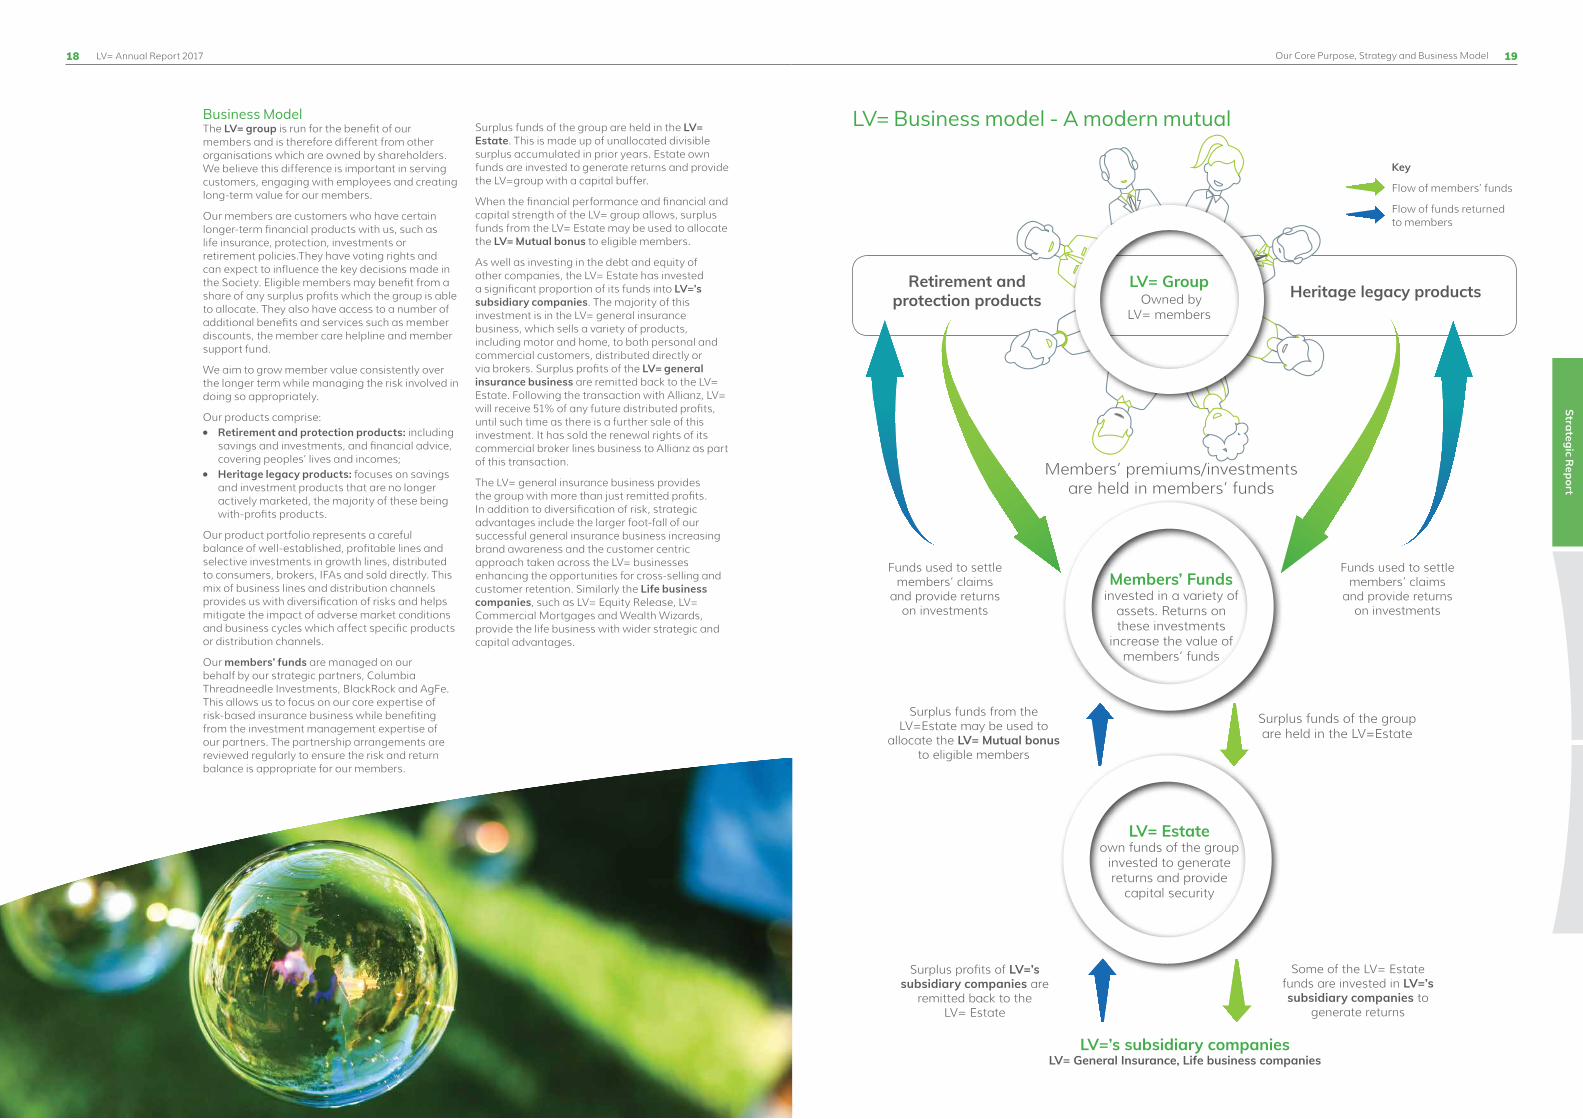
LV=’s subsidiary companiesLV= General Insurance, Life business companies
LV= Business model - A modern mutual
Surplus profits of LV=’s subsidiary companies are
remitted back to the LV= Estate
Surplus funds of the group are held in the LV=Estate
Retirement and protection products Heritage legacy products
Members’ premiums/investments are held in members’ funds
Surplus funds from the LV=Estate may be used to
allocate the LV= Mutual bonus to eligible members
Some of the LV= Estate funds are invested in LV=’s subsidiary companies to
generate returns
Funds used to settle members’ claims
and provide returns on investments
Funds used to settle members’ claims
and provide returns on investments
Members’ Fundsinvested in a variety of
assets. Returns on these investments
increase the value of members’ funds
LV= Estate own funds of the group
invested to generate returns and provide
capital security
Key
Flow of members’ funds
Flow of funds returned to members
Business ModelThe LV= group is run for the benefit of our members and is therefore different from other organisations which are owned by shareholders. We believe this difference is important in serving customers, engaging with employees and creating long-term value for our members.
Our members are customers who have certain longer-term financial products with us, such as life insurance, protection, investments or retirement policies.They have voting rights and can expect to influence the key decisions made in the Society. Eligible members may benefit from a share of any surplus profits which the group is able to allocate. They also have access to a number of additional benefits and services such as member discounts, the member care helpline and member support fund.
We aim to grow member value consistently over the longer term while managing the risk involved in doing so appropriately.
Our products comprise:●● Retirement and protection products: including
savings and investments, and financial advice, covering peoples’ lives and incomes;
●● Heritage legacy products: focuses on savings and investment products that are no longer actively marketed, the majority of these being with-profits products.
Our product portfolio represents a careful balance of well-established, profitable lines and selective investments in growth lines, distributed to consumers, brokers, IFAs and sold directly. This mix of business lines and distribution channels provides us with diversification of risks and helps mitigate the impact of adverse market conditions and business cycles which affect specific products or distribution channels.
Our members’ funds are managed on our behalf by our strategic partners, Columbia Threadneedle Investments, BlackRock and AgFe. This allows us to focus on our core expertise of risk-based insurance business while benefiting from the investment management expertise of our partners. The partnership arrangements are reviewed regularly to ensure the risk and return balance is appropriate for our members.
Surplus funds of the group are held in the LV= Estate. This is made up of unallocated divisible surplus accumulated in prior years. Estate own funds are invested to generate returns and provide the LV=group with a capital buffer.
When the financial performance and financial and capital strength of the LV= group allows, surplus funds from the LV= Estate may be used to allocate the LV= Mutual bonus to eligible members.
As well as investing in the debt and equity of other companies, the LV= Estate has invested a significant proportion of its funds into LV=’s subsidiary companies. The majority of this investment is in the LV= general insurance business, which sells a variety of products, including motor and home, to both personal and commercial customers, distributed directly or via brokers. Surplus profits of the LV= general insurance business are remitted back to the LV= Estate. Following the transaction with Allianz, LV= will receive 51% of any future distributed profits, until such time as there is a further sale of this investment. It has sold the renewal rights of its commercial broker lines business to Allianz as part of this transaction.
The LV= general insurance business provides the group with more than just remitted profits. In addition to diversification of risk, strategic advantages include the larger foot-fall of our successful general insurance business increasing brand awareness and the customer centric approach taken across the LV= businesses enhancing the opportunities for cross-selling and customer retention. Similarly the Life business companies, such as LV= Equity Release, LV= Commercial Mortgages and Wealth Wizards, provide the life business with wider strategic and capital advantages.
LV= Group Owned by
LV= members
18 19
Strategic Report
LV= Annual Report 2017
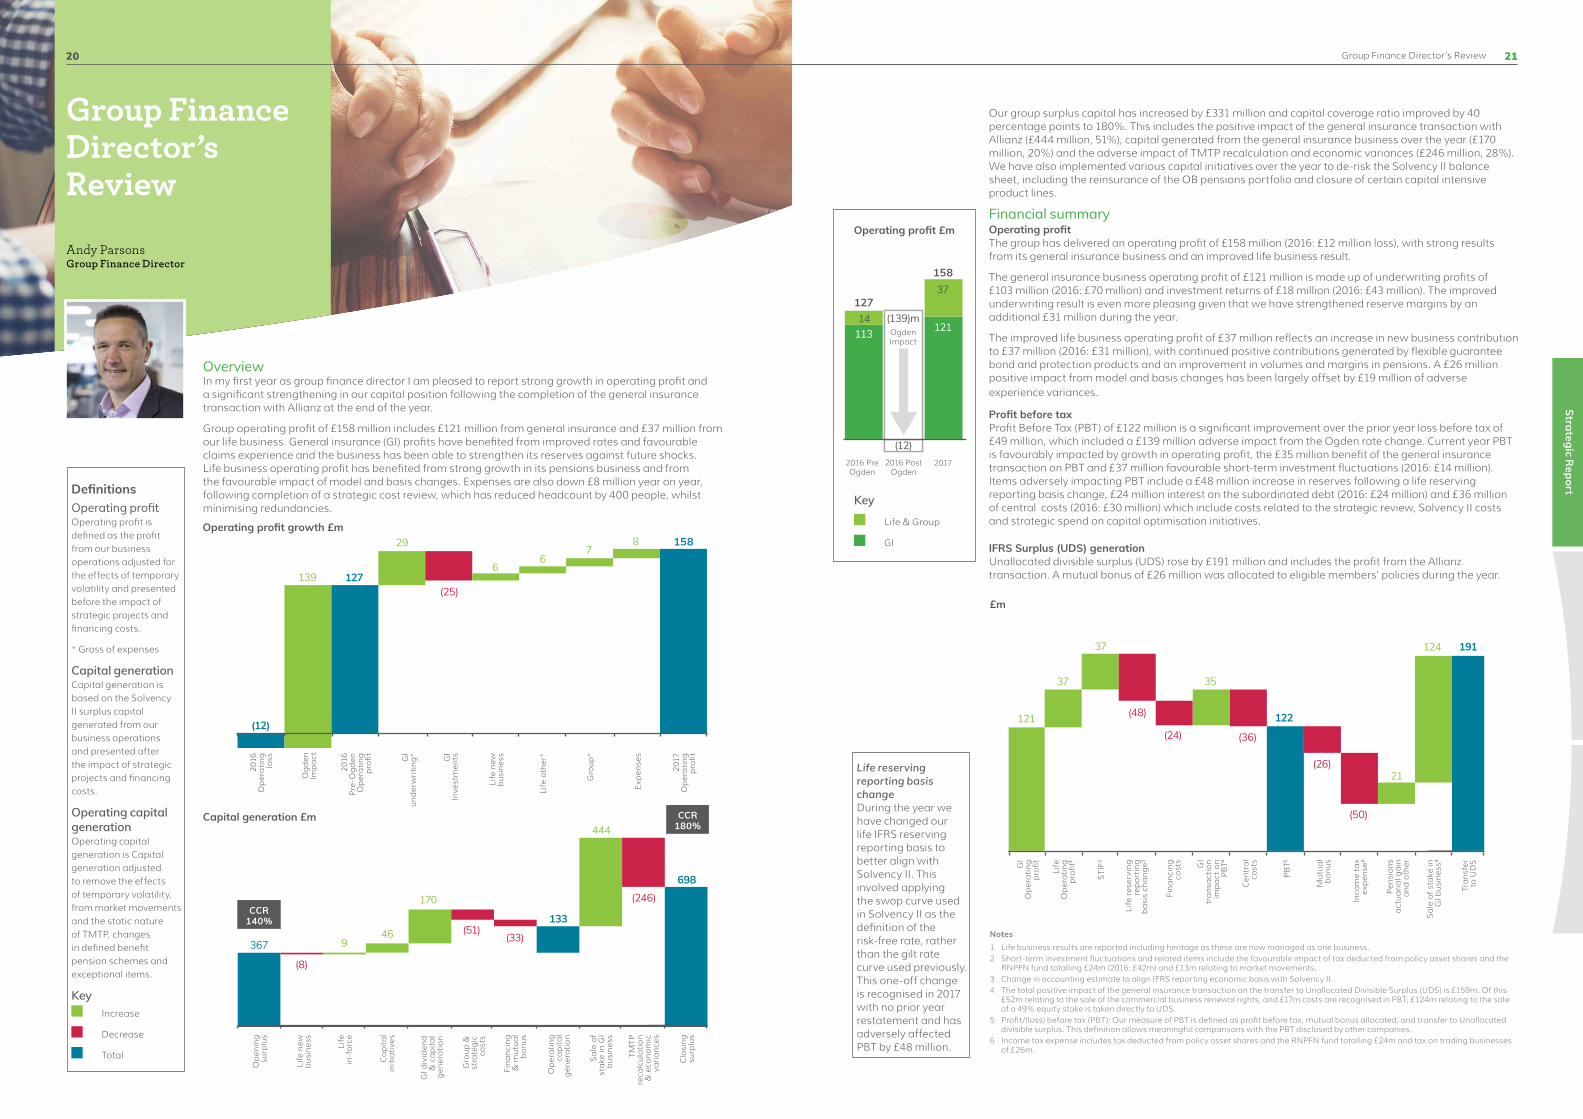
OverviewIn my first year as group finance director I am pleased to report strong growth in operating profit and a significant strengthening in our capital position following the completion of the general insurance transaction with Allianz at the end of the year.
Group operating profit of £158 million includes £121 million from general insurance and £37 million from our life business. General insurance (GI) profits have benefited from improved rates and favourable claims experience and the business has been able to strengthen its reserves against future shocks. Life business operating profit has benefited from strong growth in its pensions business and from the favourable impact of model and basis changes. Expenses are also down £8 million year on year, following completion of a strategic cost review, which has reduced headcount by 400 people, whilst minimising redundancies.
DefinitionsOperating profitOperating profit is defined as the profit from our business operations adjusted for the effects of temporary volatility and presented before the impact of strategic projects and financing costs.
* Gross of expenses
Capital generationCapital generation is based on the Solvency II surplus capital generated from our business operations and presented after the impact of strategic projects and financing costs.
Operating capital generationOperating capital generation is Capital generation adjusted to remove the effects of temporary volatility, from market movements and the static nature of TMTP, changes in defined benefit pension schemes and exceptional items.
Key Increase
Decrease
Total
Group Finance Director’s Review
Our group surplus capital has increased by £331 million and capital coverage ratio improved by 40 percentage points to 180%. This includes the positive impact of the general insurance transaction with Allianz (£444 million, 51%), capital generated from the general insurance business over the year (£170 million, 20%) and the adverse impact of TMTP recalculation and economic variances (£246 million, 28%). We have also implemented various capital initiatives over the year to de-risk the Solvency II balance sheet, including the reinsurance of the OB pensions portfolio and closure of certain capital intensive product lines.
Financial summary Operating profitThe group has delivered an operating profit of £158 million (2016: £12 million loss), with strong results from its general insurance business and an improved life business result.
The general insurance business operating profit of £121 million is made up of underwriting profits of £103 million (2016: £70 million) and investment returns of £18 million (2016: £43 million). The improved underwriting result is even more pleasing given that we have strengthened reserve margins by an additional £31 million during the year.
The improved life business operating profit of £37 million reflects an increase in new business contribution to £37 million (2016: £31 million), with continued positive contributions generated by flexible guarantee bond and protection products and an improvement in volumes and margins in pensions. A £26 million positive impact from model and basis changes has been largely offset by £19 million of adverse experience variances.
Profit before taxProfit Before Tax (PBT) of £122 million is a significant improvement over the prior year loss before tax of £49 million, which included a £139 million adverse impact from the Ogden rate change. Current year PBT is favourably impacted by growth in operating profit, the £35 million benefit of the general insurance transaction on PBT and £37 million favourable short-term investment fluctuations (2016: £14 million). Items adversely impacting PBT include a £48 million increase in reserves following a life reserving reporting basis change, £24 million interest on the subordinated debt (2016: £24 million) and £36 million of central costs (2016: £30 million) which include costs related to the strategic review, Solvency II costs and strategic spend on capital optimisation initiatives.Operating profit growth £m
Capital generation £m
(12)
139 127
29
(25)
67
8 158
2016
O
per
ati
ng
loss
Og
den
Im
pa
ct
2016
P
re-O
gd
en
Op
era
tin
g p
rofit G
I un
der
wri
tin
g*
Life
new
b
usin
ess
Life
oth
er*
Gro
up*
2017
O
per
ati
ng
pro
fitGI
Inve
stm
ents
367
(8)
946 (51)
170
(33)
133
444
(246)698
Op
enin
g su
rplu
s
Life
new
b
usin
ess
Life
in
-fo
rce
Ca
pit
al
init
iati
ves
Gro
up
&
stra
teg
ic
cost
s
GI d
ivid
end
& c
ap
ita
l g
ener
ati
on
Fin
an
cin
g &
mu
tua
l b
onu
s
Op
era
tin
g ca
pit
al
gen
era
tio
n
Sa
le o
f st
ake
in G
I b
usin
ess
TMTP
re
calc
ula
tio
n &
eco
no
mic
va
ria
nce
s
Clo
sin
g su
rplu
s
CCR140%
CCR180%
IFRS Surplus (UDS) generationUnallocated divisible surplus (UDS) rose by £191 million and includes the profit from the Allianz transaction. A mutual bonus of £26 million was allocated to eligible members’ policies during the year.
Notes1 Life business results are reported including heritage as these are now managed as one business. 2 Short-term investment fluctuations and related items include the favourable impact of tax deducted from policy asset shares and the
RNPFN fund totalling £24m (2016: £42m) and £13m relating to market movements.3 Change in accounting estimate to align IFRS reporting economic basis with Solvency II.4 The total positive impact of the general insurance transaction on the transfer to Unallocated Divisible Surplus (UDS) is £159m. Of this
£52m relating to the sale of the commercial business renewal rights, and £17m costs are recognised in PBT; £124m relating to the sale of a 49% equity stake is taken directly to UDS.
5 Profit/(loss) before tax (PBT): Our measure of PBT is defined as profit before tax, mutual bonus allocated, and transfer to Unallocated divisible surplus. This definition allows meaningful comparisons with the PBT disclosed by other companies.
6 Income tax expense includes tax deducted from policy asset shares and the RNPFN fund totalling £24m and tax on trading businesses of £26m.
Tra
nsfe
r to
UD
S
121
37
37
(48)
(24)
35
(36)
122
(26)
(50)
21
124 191
Sa
le o
f st
ake
in
GI b
usin
ess4
Pen
sio
ns
act
ua
ria
l ga
in
an
d ot
her
Inco
me
tax
exp
ense
6
Mu
tua
l b
onu
s
PB
T5
Cen
tra
l co
stsGI
tra
nsa
ctio
n im
pa
ct o
n P
BT4
Fin
an
cin
g co
sts
Life
res
ervi
ng
rep
ort
ing
ba
sis
cha
ng
e3
STI
F2
Life
Op
era
tin
g p
rofit
1
GI
Op
era
tin
g p
rofit
6
Exp
ense
s
Life reserving reporting basis changeDuring the year we have changed our life IFRS reserving reporting basis to better align with Solvency II. This involved applying the swop curve used in Solvency II as the definition of the risk-free rate, rather than the gilt rate curve used previously. This one-off change is recognised in 2017 with no prior year restatement and has adversely affected PBT by £48 million.
Key
Life & Group
GI
Operating profit £m
2016 Post Ogden
2016 Pre Ogden
2017
(139)mOgdenImpact
14127
37158
(12)
121113
£m
21
Strategic Report
20
Andy ParsonsGroup Finance Director
Group Finance Director’s Review

Group Finance Director’s Review
General insurance business transactionA long-term transaction has been entered into with Allianz Holdings PLC that will ultimately result in Allianz owning a majority stake in the general insurance business. On 28 December 2017 LV= sold a 49% equity stake to Allianz. As part of the transaction the general insurance business exchanged for consideration the renewal rights on its commercial lines business for those on Allianz Insurance PLC’s personal lines business. As part of the overall transaction there is a fixed price forward contract for £213 million regarding a further 20.9% equity stake that results in transfer of control to Allianz on or before 31 December 2019.
A gain of £35 million related to the general insurance transaction is recognised within PBT. This relates to the sale of the commercial lines renewal rights from Liverpool Victoria General Insurance Group (LVGIG) to Allianz and the costs associated with the overall transaction. The £124 million gain on sale of the 49% equity stake in LVGIG Ltd is recognised directly in the IFRS surplus (UDS) as a transaction with owners that does not result in a loss of control.
Overall the IFRS surplus (UDS) increased by £159 million as a result of the transaction in 2017 comprising:
●● £124 million gain on sale of 49% equity stake in LVGIG Ltd, recognised directly in IFRS surplus (UDS)
●● £52 million profit relating to the sale of commercial lines renewal rights
●● £17 million transaction and related restructuring costs
The transaction with Allianz will allow LV= to continue to benefit from a growing personal lines general insurance business, while also enabling us to strengthen our capital position, leaving us well placed to continue to expand our life and pensions business and pursue new digital opportunities. The general insurance business will benefit from LV=’s excellent brand and reputation in personal insurance and Allianz’s financial strength and digital expertise, and a shared passion for customer service.
28 December
201731 December
2019
49%
General insurance financial summary
Gross written premiums for 2017 are broadly in line with 2016 at £1,596 million. General insurance operating profit of £121 million is up £8 million compared to the 2016 result of £113 million (prior to the impact of the Ogden rate change), driven by a strong underwriting result of £103 million.
We have implemented motor rate increases in the wake of the reduction in the Ogden discount rate. In addition favourable claims experience has led to releases of prior year claims reserves of £46 million (2016: £54 million), including £17 million resulting from a case-by-case review of claims impacted by the Ogden change. We have also strengthened our reserves against unexpected shocks, such as the change to the Ogden rate in March 2017, increasing our overall margin on claims reserves by £31 million.
The reduced expense ratio of 22.6% (2016 pre-Ogden: 24.4%) is driven by a reduction in expenses and an increase in profit commission on reinsurance. Savings in expenses reflects management’s strong focus on cost control and operational efficiency.
Investment returns at £18 million are £25 million lower than the prior year due to lower returns on assets held in bonds and gilts. During 2017 we changed our investment strategy to reduce our exposure to equity volatility including increased hedging. Overall investment performance was 0.9% (2016: 2.1%).
During the year we have exited the unprofitable broker home market and have sold the renewal rights on our commercial lines business to Allianz at the end of the year.
DefinitionsLoss ratioThe ratio of Net benefits and claims to Net earned premiums.
Expense ratioThe ratio of general insurance Other expenses net of Other income to Net earned premiums.
Combined ratioThe total of the Loss ratio plus the Expense ratio.
Key
Investment return
Underwriting result
Operating profit £m
2016 Post Ogden
2016 Pre Ogden 2017
Gross written premiums £m
2016 2017
1,5961,581
Combined ratio
2016 Pre Ogden 2017
91.8%
69.2%
22.6%
69.7%
94.1%
24.4%
Key
Expense ratio
Loss ratio
Ownership of the general insurance business
51% 30.1%
69.9%
18
103
121
43
113
(139)mOgdenImpact
(26)
70
22 23
Strategic Report
LV= Annual Report 2017

OB pensions reinsurance arrangementIn December 2017, the group reinsured a large portfolio of heritage deferred and immediate with-profits annuity policies (OB pensions), with RGA, a leading global life reinsurer. The agreement covers specified levels of benefits, thereby significantly reducing the level of market and longevity risk associated with the portfolio, and was executed at a price that was lower than the best estimate value of the liabilities. The group retains certain risks associated with the portfolio, primarily those related to expenses, discretionary benefits, changes to the policyholder take-up rate of the cash commutation option and some retained longevity risk.
Key
GI Life Other
Gross expenses £m
Life financial summary
DefinitionsPVNBP: Present value of new business premiumsThe total of new single premium sales received in the year plus the discounted value, at the point of sale, of the regular premiums we expect to receive over the term of the new contract sold in the year. For Equity Release this represents the amount of loans provided.
New business contribution The contribution to underlying operating profit as a result of new business written. This is reported gross of cost of capital and investment in new propositions. It includes the value-add on new business and deduction for expense overruns.
1 New business contribution has been re-aligned with the IFRS valuation excluding cost of capital. Prior periods have been restated accordingly resulting in a reduction in the new business contribution before investment in new propositions for 2016 of £7m.
2 Enhanced annuities were discontinued in 2016. PVNBP sales of enhanced annuities in 2016 were £99 million. After restatement of £2m to align with the IFRS valuation, new business contribution excluding cost of capital from enhanced annuities was £nil million. 2016 results have been restated accordingly.
Life sales on a PVNBP basis in 2017 are £2,020 million (including heritage premiums of £3 million, 2016: £8 million) a 9% increase over 2016 (excluding the impact of enhanced annuities which were exited at the end of 2016).
There has been significant growth in pensions sales to £1,325 million (up 33% on 2016) boosted by ongoing transfers from final salary schemes. In the first half of this year a number of actions were taken to improve the long-term performance of our protection business, such as closing to new business the mortgage and lifestyle protection product and our underwritten whole-of-life offering. Despite these changes a 4% growth in protection present value of new business premiums has been achieved to £296 million.
Life operating profit includes new business contribution of £37 million (up £6 million compared to 2016) driven by strong volumes and margins in pensions. Strategic investment costs of £11 million were incurred in the development of new business.
Favourable model and basis changes of £26 million (2016: £3 million) relate to changes in longevity assumptions and the beneficial impact of the OB pensions reinsurance arrangement together with the adverse impact of higher equity release prepayment rates, changes to charges associated with the legacy review and expenses including a provision for potential stranded costs arising from the Allianz transaction.
The result was also impacted by £19 million adverse experience variances (2016: £14 million) relating to increases in equity release prepayment rates and adverse mortality experience.
Expenses Expenses have benefited from the strategic cost reduction programme launched in 2017, which secured £33 million of cost savings in the year against the planned cost base and helped deliver a year on year reduction of £16 million in operating expenses across both our trading businesses. The Group saw an overall year on year reduction of £8 million, including an £8 million increase in strategic investment spend.
Our general insurance business continued to deliver excellent customer experience, while maintaining a clear focus on cost control to generate a £4 million reduction in expenses. Our life business achieved a £12 million reduction in expenses through the strategic cost review and continued investment in systems and digital initiatives.
Headcount savings of over 400 people have been achieved with minimal redundancies, with additional savings delivered through strong day-to-day cost management discipline and an ongoing review of discretionary spend. Management continues to focus strongly on underlying cost control.
TaxThe tax charge of £50 million (2016: £35 million) includes £24 million (2016: £42 million) related to tax on income on policyholder asset shares, the corresponding credit is reported within Short-term investment fluctuations. The remaining tax charge largely relates to our general insurance business which delivered strong profits in the year, compared with a loss in 2016 following the change in the Ogden rate. Our tax policy is included on our website lv.com.
Balance sheetBalance sheet assets have grown by £1.7 billion in the year to £18.5 billion. This includes the receipt of £0.5 billion from the sale of a 49% equity stake in the general insurance business and an increase of £0.5 billion in the value of unit linked investment contracts. Reinsurance assets have increased by £1.2 billion largely driven by the reinsurance arrangement entered into with RGA over the OB pensions portfolio.
Unit linked and other financial assets include £7.9 billion in shares, other variable yield securities and units in unit trusts, £5.1 billion in debt and other fixed income securities, £0.9 billion in loans secured on residential and commercial mortgages and £1 billion of cash.
Insurance and investment contract liabilities have been increased by new business, changes to economic basis and assumptions and investment returns increasing policyholder assets, offset by claims paid. Other liabilities have increased due to the recognition of a £0.4 billion non-controlling interest balance following the sale of an equity stake in the general insurance business.
Results £m 2017 2016New business contribution1,2 37 31Existing business 11 9Strategic investment (11) (11)Model and basis changes 26 3Experience variances (19) (14)Wealth Wizards/Financial Advice Services (7) (5)Operating profit 37 13
Life Operating profit growth £m
6
2016 Operating profit
13
2337
(5)
New businessModel and
basis changes Experience variances 2017 Operating profit
PVNBP2 £m New business contribution1,2 £m
Key
Protection
Retirement Assets £m Liabilities £m
2016
16,870
2,612
12,098
1,162
2017
18,531
1,461
1,189
3,130
Key
Other liabilities
UDS
Insurance and investments contract liabilities
Unit linked
Key
Other assets
Reinsurance assets
Other financial assets
Unit linked
2017
1,318
2,305
11,778
3,130
18,531
1,090
2016
11,863
2,612
1,305
16,870
2017
14
23
37
2016
13
18
31
2017
34
141
256
431
2016
26
260
153
439
2017
296
1,721
2,017
2016
284
1,554
1,838
998 12,751
24 25
Strategic Report
LV= Annual Report 2017 Group Finance Director’s Review
Group Finance Director’s Review
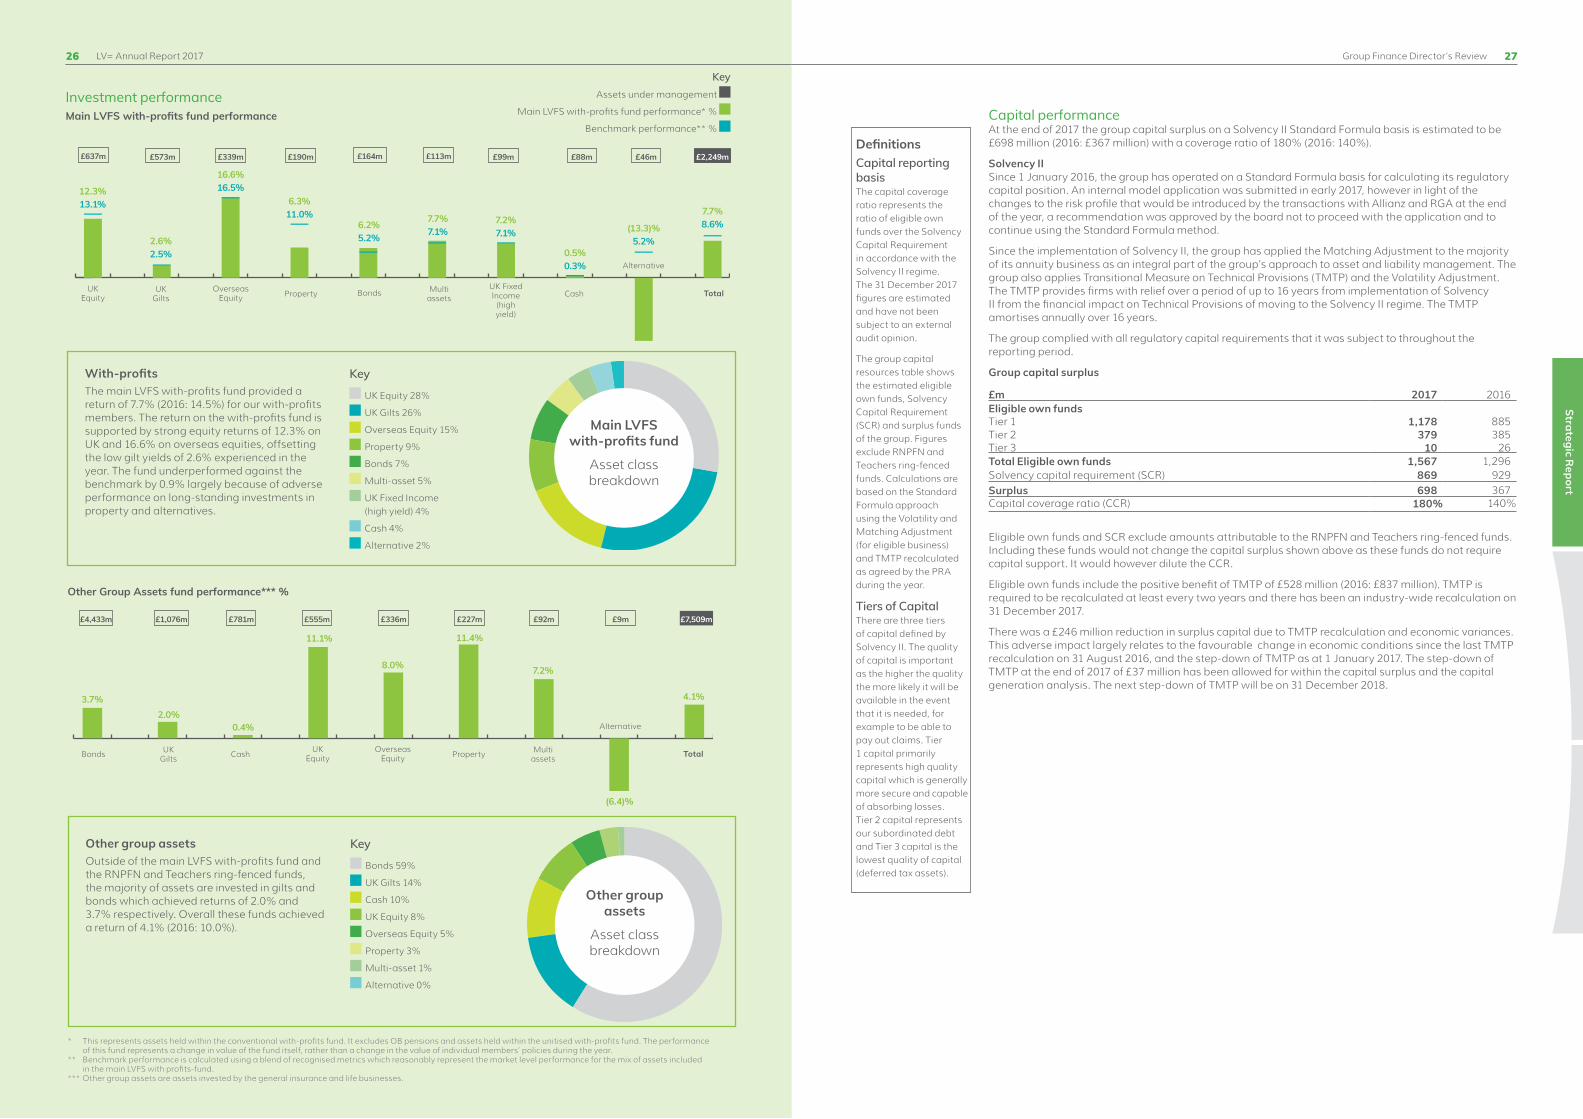
Investment performanceMain LVFS with-profits fund performance
With-profitsThe main LVFS with-profits fund provided a return of 7.7% (2016: 14.5%) for our with-profits members. The return on the with-profits fund is supported by strong equity returns of 12.3% on UK and 16.6% on overseas equities, offsetting the low gilt yields of 2.6% experienced in the year. The fund underperformed against the benchmark by 0.9% largely because of adverse performance on long-standing investments in property and alternatives.
Main LVFS with-profits fund
Asset class breakdown
Key
UK Equity 28%
UK Gilts 26%
Overseas Equity 15%
Property 9%
Bonds 7%
Multi-asset 5%
UK Fixed Income (high yield) 4%
Cash 4%
Alternative 2%
Other Group Assets fund performance*** %
Other group assets Outside of the main LVFS with-profits fund and the RNPFN and Teachers ring-fenced funds, the majority of assets are invested in gilts and bonds which achieved returns of 2.0% and 3.7% respectively. Overall these funds achieved a return of 4.1% (2016: 10.0%).
Other group assets
Asset class breakdown
Key
Bonds 59%
UK Gilts 14%
Cash 10%
UK Equity 8%
Overseas Equity 5%
Property 3%
Multi-asset 1%
Alternative 0%
* This represents assets held within the conventional with-profits fund. It excludes OB pensions and assets held within the unitised with-profits fund. The performance of this fund represents a change in value of the fund itself, rather than a change in the value of individual members’ policies during the year.
** Benchmark performance is calculated using a blend of recognised metrics which reasonably represent the market level performance for the mix of assets included in the main LVFS with profits-fund.
*** Other group assets are assets invested by the general insurance and life businesses.
Capital performanceAt the end of 2017 the group capital surplus on a Solvency II Standard Formula basis is estimated to be £698 million (2016: £367 million) with a coverage ratio of 180% (2016: 140%).
Solvency IISince 1 January 2016, the group has operated on a Standard Formula basis for calculating its regulatory capital position. An internal model application was submitted in early 2017, however in light of the changes to the risk profile that would be introduced by the transactions with Allianz and RGA at the end of the year, a recommendation was approved by the board not to proceed with the application and to continue using the Standard Formula method.
Since the implementation of Solvency II, the group has applied the Matching Adjustment to the majority of its annuity business as an integral part of the group’s approach to asset and liability management. The group also applies Transitional Measure on Technical Provisions (TMTP) and the Volatility Adjustment. The TMTP provides firms with relief over a period of up to 16 years from implementation of Solvency II from the financial impact on Technical Provisions of moving to the Solvency II regime. The TMTP amortises annually over 16 years.
The group complied with all regulatory capital requirements that it was subject to throughout the reporting period.
Group capital surplus
£m 2017 2016Eligible own fundsTier 1 1,178 885Tier 2 379 385Tier 3 10 26Total Eligible own funds 1,567 1,296Solvency capital requirement (SCR) 869 929Surplus 698 367Capital coverage ratio (CCR) 180% 140%
Eligible own funds and SCR exclude amounts attributable to the RNPFN and Teachers ring-fenced funds. Including these funds would not change the capital surplus shown above as these funds do not require capital support. It would however dilute the CCR.
Eligible own funds include the positive benefit of TMTP of £528 million (2016: £837 million). TMTP is required to be recalculated at least every two years and there has been an industry-wide recalculation on 31 December 2017.
There was a £246 million reduction in surplus capital due to TMTP recalculation and economic variances. This adverse impact largely relates to the favourable change in economic conditions since the last TMTP recalculation on 31 August 2016, and the step-down of TMTP as at 1 January 2017. The step-down of TMTP at the end of 2017 of £37 million has been allowed for within the capital surplus and the capital generation analysis. The next step-down of TMTP will be on 31 December 2018.
DefinitionsCapital reporting basisThe capital coverage ratio represents the ratio of eligible own funds over the Solvency Capital Requirement in accordance with the Solvency II regime. The 31 December 2017 figures are estimated and have not been subject to an external audit opinion.
The group capital resources table shows the estimated eligible own funds, Solvency Capital Requirement (SCR) and surplus funds of the group. Figures exclude RNPFN and Teachers ring-fenced funds. Calculations are based on the Standard Formula approach using the Volatility and Matching Adjustment (for eligible business) and TMTP recalculated as agreed by the PRA during the year.
Tiers of CapitalThere are three tiers of capital defined by Solvency II. The quality of capital is important as the higher the quality the more likely it will be available in the event that it is needed, for example to be able to pay out claims. Tier 1 capital primarily represents high quality capital which is generally more secure and capable of absorbing losses. Tier 2 capital represents our subordinated debt and Tier 3 capital is the lowest quality of capital (deferred tax assets).
UKEquity
11.1%
£555m
8.0%
£336m
OverseasEquity
£1,076m
2.0%
UKGilts
£4,433m
3.7%
Bonds
11.4%
£227m
Property
(6.4)%
£9m
Alternative0.4%
£781m
Cash
7.2%
£92m
Multi assets
4.1%
£7,509m
Total
£637m
UKEquity
12.3%13.1%
£339m
OverseasEquity
16.6% 16.5%
£573m
UKGilts
2.6%2.5%
£164m
Bonds
6.2% 5.2%
£190m
Property
6.3% 11.0%
£46m
Alternative
(13.3)%5.2%
£88m
Cash
0.5% 0.3%
£113m
Multi assets
7.7% 7.1%
£99m
UK Fixed Income (high yield)
7.2%7.1%
£2,249m
Total
7.7% 8.6%
KeyAssets under management
Main LVFS with-profits fund performance* %
Benchmark performance** %
26 27
Strategic Report
LV= Annual Report 2017

Group Finance Director’s Review
Solvency Capital Requirement
Key
Market risks*
Life insurance risk
General insurance risk
Operational and counterparty risk
* Market risks include: credit, equity, property, interest rate and other risks.
Sensitivity analysis of Solvency II group capital surplusThe following table shows the sensitivity of the group’s Solvency II capital surplus and capital coverage ratio to economic assumptions. All other assumptions remain unchanged for each sensitivity, except where these are directly affected by the revised economic conditions or where a management action that is allowed for in the SCR calculation is applicable for that sensitivity. The analysis also provides the benefit from a further recalculation of TMTP, following the stress event. The credit and gilt spread sensitivities represent a widening of yields on these asset classes relative to swap rates. The sensitivities below allow for the impact of the group’s hedging strategy.
No Further TMTP Recalculation With Further TMTP Recalculation
Changes in economic assumptions Impact on surplus capital
£m
Impact on CCR
(%)
Impact on surplus capital
£m
Impact on CCR
(%)
Equity values fall by 25% (89) (10) (89) (10)
Credit spreads increase by 100bps 146 18 63 9
Gilt spreads increase by 50bps (128) (15) (62) (7)
Fixed interest yields fall by 100bps (112) (18) 82 3
Fixed interest yields increase by 100bps 91 15 (57) (3)
The group’s capital surplus position is affected by the sensitivities due to the following:
●● A fall in equity values reduces the value of the group’s defined benefit pension schemes, increases with-profits guarantee costs and reduces the benefit of future charges on unit-linked business; all of which are partially hedged to equity market movements. There is no benefit from TMTP recalculation to equity market movements as TMTP is predominantly driven by interest rate related market risks.
●● A widening of credit spreads, relative to swaps, increases the value of the group’s defined benefit pension schemes, reduces the value of liabilities using the Volatility Adjustment, offset by a reduction in corporate bond values held to support the general insurance business lines. Following TMTP recalculation, the benefit reduces due to the loss of Volatility Adjustment and increased risk from future credit defaults associated with annuity business assumed under the previous solvency regime.
●● A widening of gilt spreads, relative to swaps, reduces the value of the group’s defined benefit pension schemes and the assets invested to support the Society’s liabilities. The OB pensions reinsurance transaction has reduced the reliance on TMTP recalculations, hence improving surplus capital stability.
●● Changes to fixed interest rate yields (both swap and gilt rates) lead to changes in the group’s capital surplus position, as the Solvency II yield exposure is hedged on a post-TMTP recalculation basis. Following a TMTP recalculation, the residual exposure largely arises from defined benefit pension schemes.
Capital management actionsDuring 2017 we have taken a number of actions to improve our capital position and to reduce thesensitivity of our capital position to market movements including:
●● sale of a 49% stake in our general insurance business and a fixed-price forward contract over sale of a further 20.9%, with an option to sell the remaining stake at a fixed price for two years;
●● entered into a reinsurance treaty which substantially reduced the volatility and capital held for a block of with-profits deferred annuities within our OB pensions portfolio;
●● reduced the equity exposure within the general insurance companies;
●● closure of certain capital-intensive product lines in our protection portfolio; and
●● increased the scope of hedging to our flexible guarantee and unit-linked product lines.
Liquidity management The group’s operational liquidity inflow of £62 million was a £115 million improvement on the prior year outflow of £53 million. This is highly encouraging, reflecting a significant improvement in the life position following the decision to exit markets with high new business cash and capital strain, such as enhanced annuities and recognising the growing scale of the life trading businesses. The strong general insurance trading performance also resulted in improved surplus cash remitted in the year, despite action to strengthen reserves following the Ogden rate change in March 2017.
The table below summarises the operational liquidity generated for the Society.
LVFS operational liquidity
£m 2017 2016General insurance surplus cash remitted 95 7Other subsidiaries surplus cash remitted 23 18Life 5 (26)Group items * (29) (25)Debt interest paid (23) (23)Tax paid (9) (4)Operational liquidity inflow/(outflow) 62 (53)General insurance business transaction 489 –Economic and other non-operational 116 (131)Net inflow/(outflow) before mutual bonus 667 (184)Mutual bonus (26) (17)Net inflow/(outflow) 641 (201)
Operational liquidity held at 31 December 947 306* Group items comprise centrally managed costs and the return on the free estate.
On 28 December 2017 the group entered into a transaction with Allianz to sell a stake in its general insurance business, the consideration from this transaction, net of associated costs borne by the Society, generated £489 million of liquidity inflow.
In addition to the inflow from the general insurance business transaction, the net inflow includes £62 million of operational liquidity and £116 million of economic and non-operational items, mainly as a result of positive impacts coming through from cash and capital optimisation initiatives. The inflows across the group have resulted in an overall net inflow of £641 million, increasing our stock position to £947 million.
Outlook2017 has been a pivotal year for LV= in which significant steps have been taken to strengthen the financial foundation of the group. The significant management actions taken to de-risk the balance sheet including the creation of the strategic partnership with Allianz and reinsurance of the OB pensions portfolio has provided the group with an above risk appetite capital surplus, whilst the positive earnings from both the general insurance and life businesses provide a positive platform from which the group can move forwards, supporting the future sustainability of the group.
DefinitionOperational liquidity Operational liquidity is generated from movements in free assets in the year (including cash and cash equivalents and surplus assets within funds in excess of matched liabilities). This excludes amounts attributable to the RNPFN and Teachers ring-fenced funds and is not directly reconcilable to the group’s IFRS Statement of Cash Flows.
2017 SCR £869m
466330
203
120
Less: tax relief £82m and management actions of £168m
2016 SCR £929m
462326
210
124
Less: tax relief £46m and management actions of £147m
180%Solvency II
Capital Coverage Ratio
£62mOperational liquidity
inflow
28 29
Strategic Report
LV= Annual Report 2017

At the end of my first full year with LV= I look back with enormous pride at how we have continued to give our customers the great service they deserve. This was achieved against a backdrop of one of the most challenging regulatory years that motor insurers have ever faced, historically low investment returns, and a devastating year-end car park fire. And all this happened at the same time as we were successfully negotiating and completing our new strategic partnership with Allianz!
Throughout, we have striven continually to give excellent service and good value to our customers, and we were delighted to close the year holding the Which? Insurer of the Year award and the 2017 Moneywise Most Trusted Insurer award. These awards are a testament to how our colleagues have, once again, put our customers at the very heart of our business. Their instincts were powerfully demonstrated to me recently by the way that everyone responded to the fire at the Echo Arena Liverpool, working together to address an unprecedented event by straightforwardly answering a simple question: “what is the right thing to do for our customers?”
I am especially grateful for, and humbled by, their dedication in what has, at times, been an uncertain period, and particularly so for our people working for great customer outcomes in our commercial area.
The reduction in the Ogden rate increased our 2016 claims incurred by £139 million and forced us to increase prices to customers. I was therefore very pleased when the Government recently published legislation to address this issue. The new system would not only ensure fair payments for those making claims but would also help reduce the cost of motor insurance for drivers at a time when premiums have been at record highs for hard-pressed motorists. I remain fully committed to passing on 100% of any discount rate savings produced by this legislation.
Our 2017 operating profit of £121 million is up £8 million compared to 2016’s result of £113 million (prior to the impact of the Ogden rate change), and £147 million up compared to the post-Ogden operating loss of £26 million. We reacted rapidly to the Ogden rate change, putting through immediate price increases and maintaining disciplined underwriting and pricing controls in a very uncertain year. We purposefully chose to exit unprofitable general home business through our broker channel in April 2017, and while overall policy numbers were down 2%, when the impact of our withdrawal from broker home is taken into account, policy numbers in our chosen markets actually grew by 1%. Overall gross written premiums were up 1%, and without the impact of broker home actually grew by 2%.
As expected, at £46 million the releases from prior year claims reserves were not as large as those in previous years (2016: £54 million). Of this, £17 million resulted from a case-by-case review of claims impacted by the Ogden change.
The Ogden discount rate change highlighted the risk our business faces from unexpected shocks of this magnitude. Accordingly, we decided to increase our overall margin on claims reserves to give improved protection in this area. Our operating profit would have been £31 million higher at £152 million without the increased prudence in claims reserves.
Falling returns on investment income were compensated for by good expense control, disciplined pricing and underwriting and an increasing use of systems thinking to design our business straightforwardly around our customer needs.
Our claims area successfully delivered a number of initiatives, including the formation of our own building contractor network, dedicated LV= branded bodyshops, market leading anti-fraud activity, and efficiency gains through automation. All these combined produce record motor claims customer satisfaction with a net promoter score of +69, while simultaneously helping to contain claims inflation and deliver expense savings.
General Insurance Review
Steve TreloarChief Executive, General Insurance
DirectOur direct business continued to grow in LV= branded motor and home portfolios due to strong sales and market-leading renewal retention. This growth was driven by our continuous focus on providing great-value products, underpinned by great customer service. The market did see an increase in customers shopping around following repricing for Ogden, and average premium increases were subdued as a result of our disciplined approach in the market. We maintained growth in our heartland with overall policies increasing by 3% to 3.7 million. Overall premiums therefore grew strongly by 5% from £913 million in 2016 to £960 million. The loss ratio, before the impact of the claims margin strengthening, improved to 69.6% from 71.8% in 2016 (prior to Ogden strengthening), and we posted record divisional profits of £106 million.
We have invested heavily in our new policy administration system, Pioneer, and have delivered transformational change in our business and capabilities, achieving our “go live” goals of switch-on for motor insurance in 2017. We have launched our new multicar proposition, and by year end we had also rolled out our car, motorbike, and classic car products to all our new customers and have also begun renewing policies onto our new system. We are already getting great feedback from customers and colleagues, and are looking forward to launching our new home insurance proposition in 2018. We will then move on to decommissioning our legacy policy systems.
Broker2017 saw continued strong progression in the profits of the broker division from a pre-Ogden operating profit of £26 million last year to an improved operating profit of £30 million in 2017. Without claims margin strengthening, profits would have been £18 million higher at £48 million.
Our withdrawal from the home general market has been carried out in an orderly fashion, and we have maintained a strong and disciplined approach to underwriting and pricing in an extremely competitive market. We continue to see strong support from our brokers as a result of our overall service and proposition. Our ongoing commitment to service excellence was recognised with the award of the Institute of Customer Service ServiceMark Accreditation, and LV= achieved an overall UK Customer Satisfaction Survey score significantly higher than the insurance industry average at 82.5.
In the broker personal lines market we have reduced our exposure to purely aggregator business, widening our distribution reach through key partnerships with motor manufacturers, retail brands and digital channels. We continue to grow our range of specialist lines solutions. While commercial gross written premiums grew by 6%, our disciplined approach and withdrawal from unprofitable lines meant that overall broker premiums fell by £32 million from £668 million to £636 million. However, our combined ratio, before the impact of the claims margin strengthening, improved to a record 93.7% compared to 99.3% in 2016 (prior to Ogden strengthening).
Looking aheadOur general insurance business is already reaping the benefits of strong positioning in all our chosen markets from the combination of excellent customer service, exciting digital offerings being rolled out and an exceptionally strong brand franchise. We have navigated our way through a challenging year to deliver record underwriting profits in 2017. 2018 will bring fresh challenges to a motor insurance market with the remaining uncertainties around the passage of the Ogden discount rate and whiplash reform contained within the recently published Civil Liability Bill.
We are progressing rapidly with our new strategic partner, Allianz UK, to finalise robust joint plans to begin welcoming their renewing motor and specialist home customers later this year, while Allianz will similarly welcome our commercial customers. I am extremely confident that both enterprises will continue to offer the excellent customer service throughout this period that each has become famous for. We will maintain our prices to give value to our customers while they are with us, and we are already seeing technology investments delivering productivity improvements. There is more to come in this area. We remain cautious in an uncertain investment market, and will concentrate on delivering underwriting profits rather than relying on volatile and unpredictable returns.
Our franchise increasingly shines through in a market crowded by “me too” players, and I am confident that our strong foundations, clear plan, and the backing of our new strategic partner mean that we will continue to deliver excellent service to our customers, and growth and profits to our joint shareholders.
General Insurance Review
£121mOperating profit
31
Strategic Report
30

We sent David a purifying food processor and a recipe book
to help him while he recovered from a broken jaw. He had been checking the parking fees at a meter when two men mugged
him and stole his car.
Nadia needed to get away after witnessing a traumatic accident so we organised for her and her husband to stay in a nice hotel.
She’d comforted an injured person who had been hit by a drunk driver, while waiting for
the ambulance.
GI Green Heart Support
A movie night hamper together with a restaurant voucher were the right gestures for
taxi driver Mike after he was held at gunpoint in his cab.
After running off with his day’s takings we wanted to help Mike enjoy some family time and take
his mind off the events.
2017 life results2017 saw the integration of retirement, heritage and protection into a single business, enabling alignment of our strategic objective to help customers to live confident lives by providing market leading products with modern value added services. This will help evolve our mutual business from a traditional life and pensions offering to broader services in Health, Wealth and Knowledge.
The life business generated an operating profit of £37 million, £24 million above 2016, with the continued strength of the trading businesses supported by favourable capital management actions and expense savings following the completion of our strategic cost review.
New business volumes have exceeded £2 billion on a present value of new business premiums (PVNBP) basis for the first time, demonstrating 9% growth year on year, driven by strong growth in pensions, equity release and protection.
PVNBP £m
Life Review
John PerksManaging Director of Life
RetirementThe retirement business continued its year on year growth with volumes 11% up on 2016. Pensions new business sales have increased by a third from 2016 levels supported by the increase in defined benefit to defined contribution transfers following pension freedoms. In addition, equity release sales have grown by 17% driven by increased levels of external funding and new product enhancements, including the introduction of LV= Doctor Services, which has been introduced across all new protection and retirement business. The launch of a new version of the flexible guarantee product range in the second half of 2017 resulted in reduced marketing activity earlier in the year and therefore lower volumes compared to 2016.
Income from our Retirement Advice Service grew 25% year on year reflecting growth in our corporate solutions distribution, with success in securing deals with a number of partners who recognise the importance of offering their customers direct access to regulated advice. Our services focus on helping customers plan for an affordable retirement and accessing their pensions, including strong demand from customers for our advice when considering the suitability of transferring some or all of their defined benefits into more flexible retirement income arrangements.
With the support of Wealth Wizards, the company in which we have had a majority stake since August 2015, we have also seen significant efficiency benefits from the development of ground breaking advice automation technology.
2017
2016
1,325
996 239
118 159
217
119
102 284
296
8
3
£2,020m
£1,846m
Key Pensions1
Annuities2
FGB
Equity release
Protection
Heritage
Notes
1 Flexible guarantee fund, our flexible guarantee bond sold within our pensions wrapper, is included within the pensions PVNBP (2017: £260 million, 2016: £344 million).
2 Annuities excludes enhanced annuities which were exited in 2016 (2016: £99 million).
Names have been changed to protect identities.
£37mOperating profit
To say your beautiful gift
was a complete surprise
would be an understatement.
“
“
Blown away with this amazing
thoughtful act by @lv. They’d noticed we’d
lost some sentimental items in the fire…It’s a
lovely act that has lifted our spirits.
“
“33
Strategic Report
32
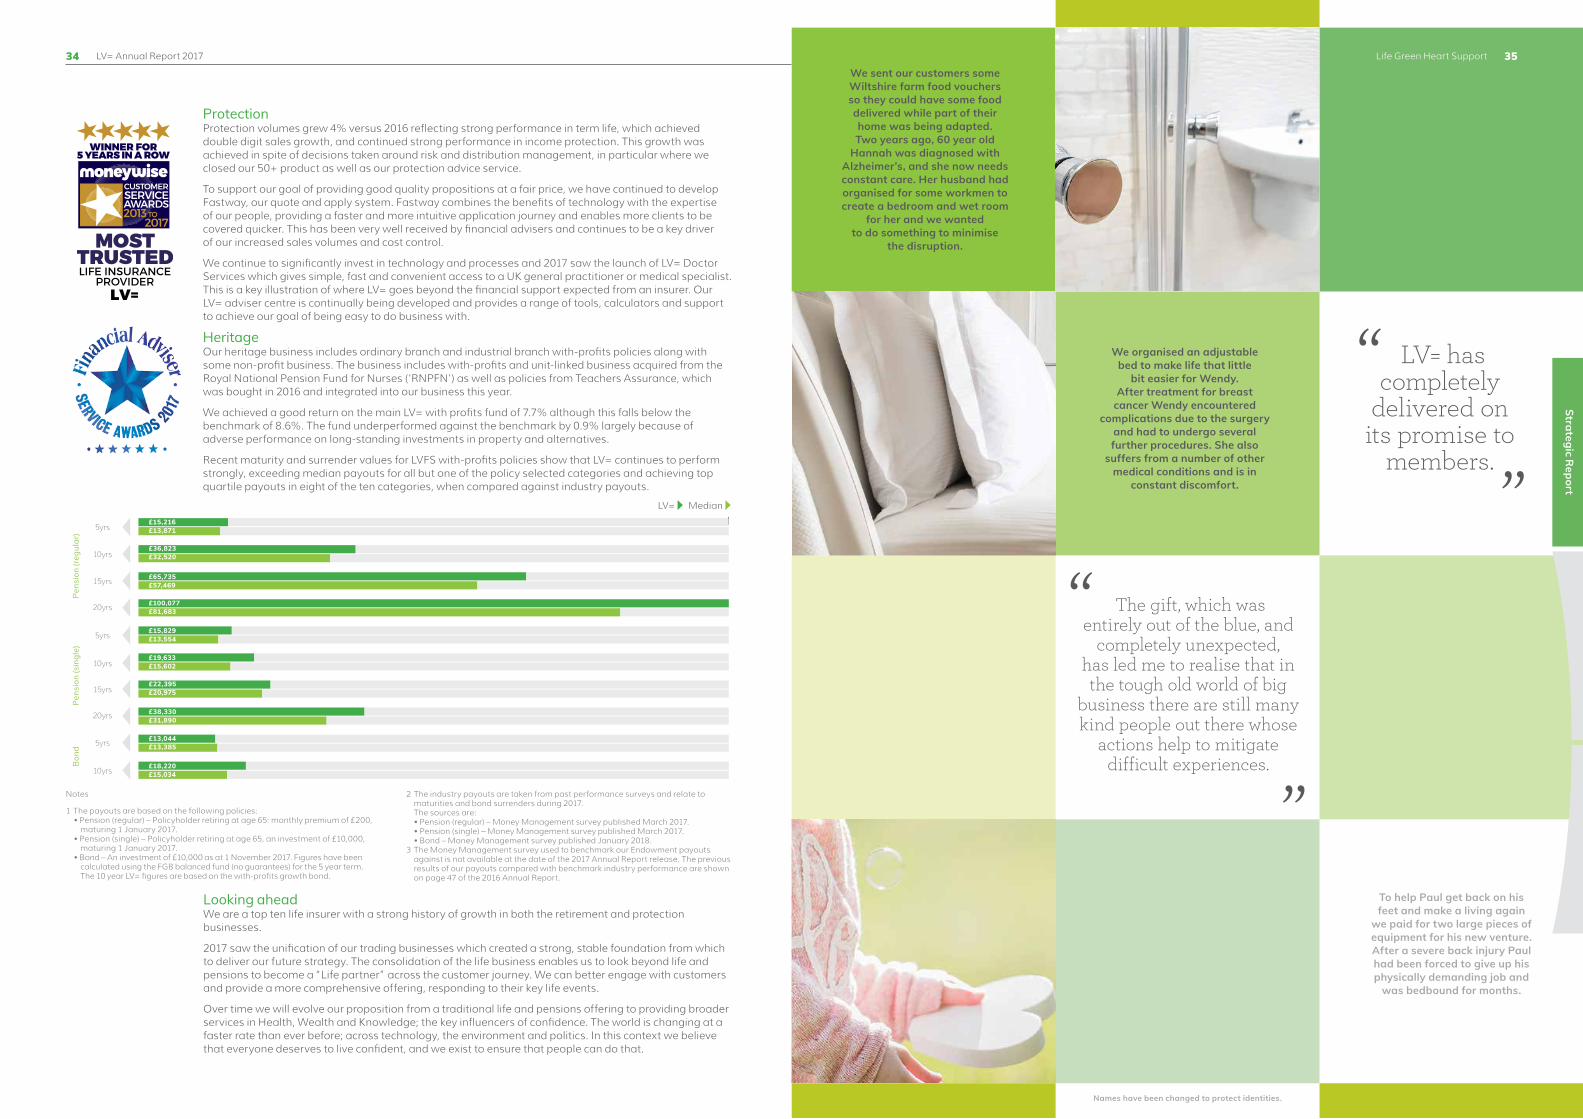
We sent our customers some Wiltshire farm food vouchers so they could have some food delivered while part of their home was being adapted. Two years ago, 60 year old
Hannah was diagnosed with Alzheimer’s, and she now needs constant care. Her husband had organised for some workmen to create a bedroom and wet room
for her and we wanted to do something to minimise
the disruption.
To help Paul get back on his feet and make a living again
we paid for two large pieces of equipment for his new venture. After a severe back injury Paul had been forced to give up his physically demanding job and
was bedbound for months.
We organised an adjustable bed to make life that little
bit easier for Wendy. After treatment for breast
cancer Wendy encountered complications due to the surgery
and had to undergo several further procedures. She also
suffers from a number of other medical conditions and is in
constant discomfort.
Life Green Heart Support
ProtectionProtection volumes grew 4% versus 2016 reflecting strong performance in term life, which achieved double digit sales growth, and continued strong performance in income protection. This growth was achieved in spite of decisions taken around risk and distribution management, in particular where we closed our 50+ product as well as our protection advice service.
To support our goal of providing good quality propositions at a fair price, we have continued to develop Fastway, our quote and apply system. Fastway combines the benefits of technology with the expertise of our people, providing a faster and more intuitive application journey and enables more clients to be covered quicker. This has been very well received by financial advisers and continues to be a key driver of our increased sales volumes and cost control.
We continue to significantly invest in technology and processes and 2017 saw the launch of LV= Doctor Services which gives simple, fast and convenient access to a UK general practitioner or medical specialist. This is a key illustration of where LV= goes beyond the financial support expected from an insurer. Our LV= adviser centre is continually being developed and provides a range of tools, calculators and support to achieve our goal of being easy to do business with.
HeritageOur heritage business includes ordinary branch and industrial branch with-profits policies along with some non-profit business. The business includes with-profits and unit-linked business acquired from the Royal National Pension Fund for Nurses (‘RNPFN’) as well as policies from Teachers Assurance, which was bought in 2016 and integrated into our business this year.
We achieved a good return on the main LV= with profits fund of 7.7% although this falls below the benchmark of 8.6%. The fund underperformed against the benchmark by 0.9% largely because of adverse performance on long-standing investments in property and alternatives.
Recent maturity and surrender values for LVFS with-profits policies show that LV= continues to perform strongly, exceeding median payouts for all but one of the policy selected categories and achieving top quartile payouts in eight of the ten categories, when compared against industry payouts.
Looking aheadWe are a top ten life insurer with a strong history of growth in both the retirement and protection businesses.
2017 saw the unification of our trading businesses which created a strong, stable foundation from which to deliver our future strategy. The consolidation of the life business enables us to look beyond life and pensions to become a “Life partner” across the customer journey. We can better engage with customers and provide a more comprehensive offering, responding to their key life events.
Over time we will evolve our proposition from a traditional life and pensions offering to providing broader services in Health, Wealth and Knowledge; the key influencers of confidence. The world is changing at a faster rate than ever before; across technology, the environment and politics. In this context we believe that everyone deserves to live confident, and we exist to ensure that people can do that.
LV= Median
5yrs
10yrs
15yrs
20yrs
5yrs
10yrs
15yrs
20yrs
5yrs
10yrs
Pens
ion
(reg
ular
)Pe
nsio
n (s
ingl
e)B
ond
£15,216£13,871
£36,823£32,520
£65,735£57,469
£100,077£81,683
£15,829£13,554
£19,633£15,602
£22,395£20,975
£38,330£31,890
£13,044£13,385
£18,220£15,034
The gift, which was entirely out of the blue, and
completely unexpected, has led me to realise that in the tough old world of big
business there are still many kind people out there whose
actions help to mitigate difficult experiences.
“
“ LV= has
completely delivered on
its promise to members.
“
“Notes
1 The payouts are based on the following policies: • Pension (regular) – Policyholder retiring at age 65: monthly premium of £200,
maturing 1 January 2017. • Pension (single) – Policyholder retiring at age 65, an investment of £10,000,
maturing 1 January 2017. • Bond – An investment of £10,000 as at 1 November 2017. Figures have been
calculated using the FGB balanced fund (no guarantees) for the 5 year term. The 10 year LV= figures are based on the with-profits growth bond.
2 The industry payouts are taken from past performance surveys and relate to maturities and bond surrenders during 2017. The sources are:
• Pension (regular) – Money Management survey published March 2017. • Pension (single) – Money Management survey published March 2017. • Bond – Money Management survey published January 2018.3 The Money Management survey used to benchmark our Endowment payouts
against is not available at the date of the 2017 Annual Report release. The previous results of our payouts compared with benchmark industry performance are shown on page 47 of the 2016 Annual Report.
Names have been changed to protect identities.
35
Strategic Report
34 LV= Annual Report 2017
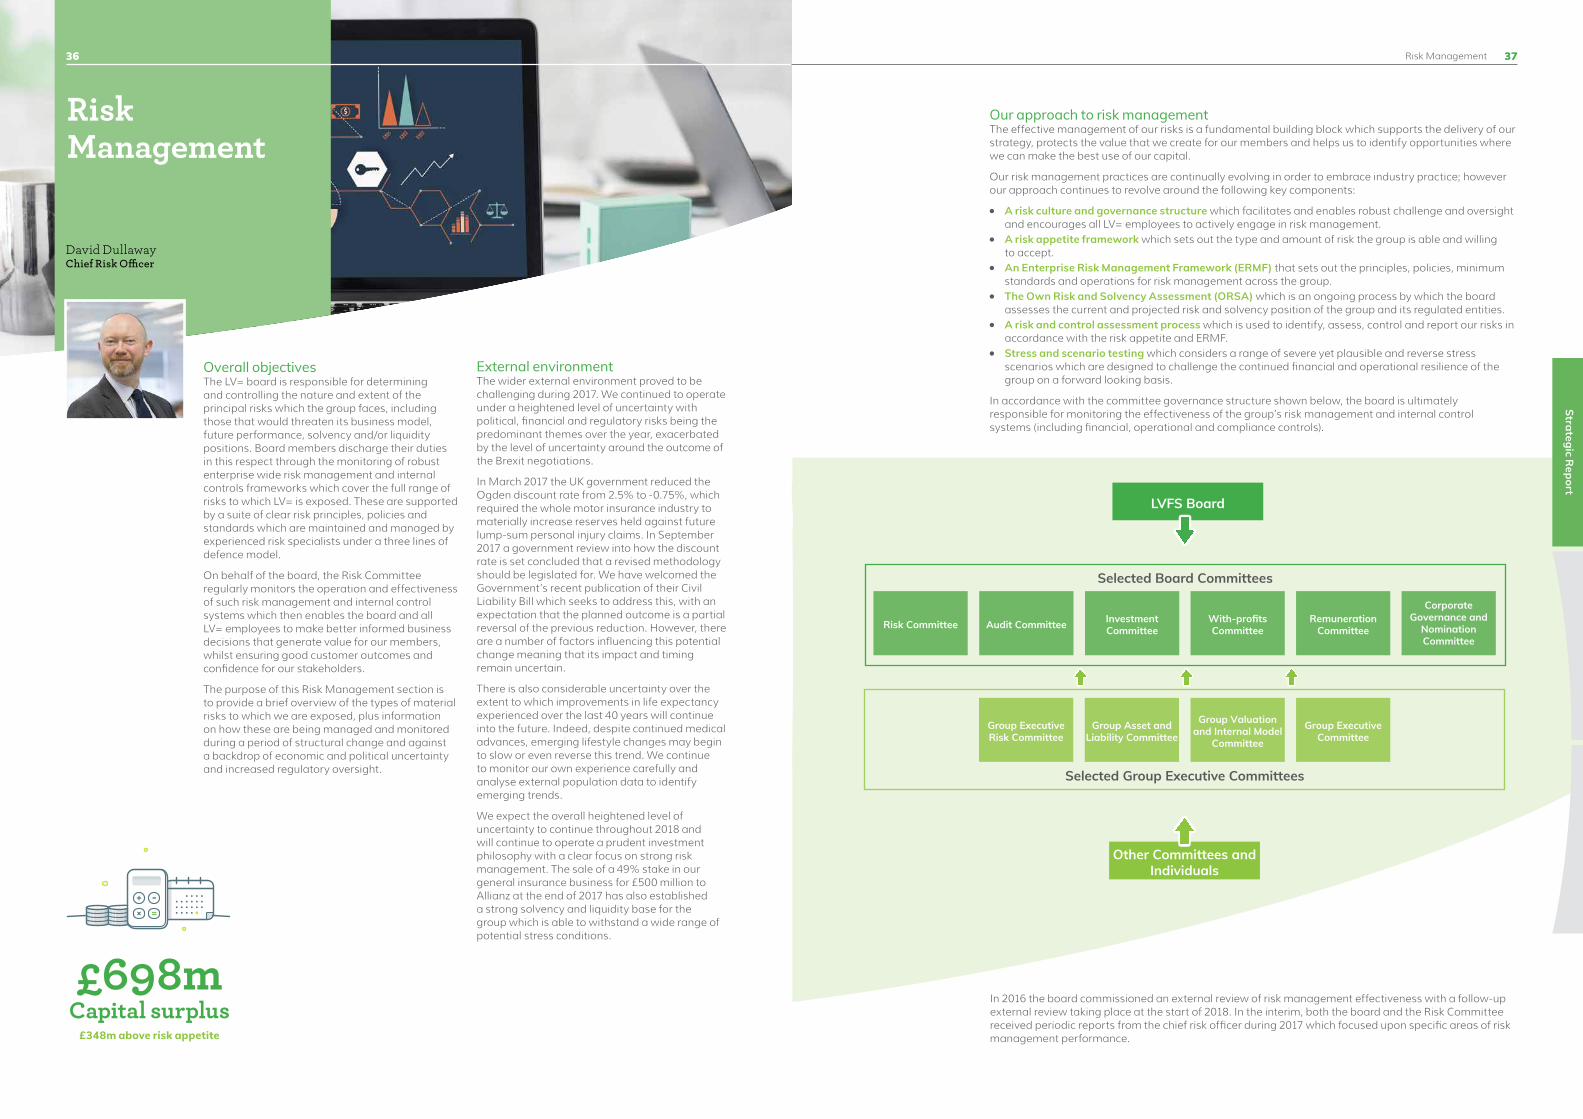
Risk Management
David DullawayChief Risk Officer
Overall objectivesThe LV= board is responsible for determining and controlling the nature and extent of the principal risks which the group faces, including those that would threaten its business model, future performance, solvency and/or liquidity positions. Board members discharge their duties in this respect through the monitoring of robust enterprise wide risk management and internal controls frameworks which cover the full range of risks to which LV= is exposed. These are supported by a suite of clear risk principles, policies and standards which are maintained and managed by experienced risk specialists under a three lines of defence model.
On behalf of the board, the Risk Committee regularly monitors the operation and effectiveness of such risk management and internal control systems which then enables the board and all LV= employees to make better informed business decisions that generate value for our members, whilst ensuring good customer outcomes and confidence for our stakeholders.
The purpose of this Risk Management section is to provide a brief overview of the types of material risks to which we are exposed, plus information on how these are being managed and monitored during a period of structural change and against a backdrop of economic and political uncertainty and increased regulatory oversight.
External environment The wider external environment proved to be challenging during 2017. We continued to operate under a heightened level of uncertainty with political, financial and regulatory risks being the predominant themes over the year, exacerbated by the level of uncertainty around the outcome of the Brexit negotiations.
In March 2017 the UK government reduced the Ogden discount rate from 2.5% to -0.75%, which required the whole motor insurance industry to materially increase reserves held against future lump-sum personal injury claims. In September 2017 a government review into how the discount rate is set concluded that a revised methodology should be legislated for. We have welcomed the Government’s recent publication of their Civil Liability Bill which seeks to address this, with an expectation that the planned outcome is a partial reversal of the previous reduction. However, there are a number of factors influencing this potential change meaning that its impact and timing remain uncertain.
There is also considerable uncertainty over the extent to which improvements in life expectancy experienced over the last 40 years will continue into the future. Indeed, despite continued medical advances, emerging lifestyle changes may begin to slow or even reverse this trend. We continue to monitor our own experience carefully and analyse external population data to identify emerging trends.
We expect the overall heightened level of uncertainty to continue throughout 2018 and will continue to operate a prudent investment philosophy with a clear focus on strong risk management. The sale of a 49% stake in our general insurance business for £500 million to Allianz at the end of 2017 has also established a strong solvency and liquidity base for the group which is able to withstand a wide range of potential stress conditions.
Our approach to risk managementThe effective management of our risks is a fundamental building block which supports the delivery of our strategy, protects the value that we create for our members and helps us to identify opportunities where we can make the best use of our capital.
Our risk management practices are continually evolving in order to embrace industry practice; however our approach continues to revolve around the following key components:
●● A risk culture and governance structure which facilitates and enables robust challenge and oversight and encourages all LV= employees to actively engage in risk management.
●● A risk appetite framework which sets out the type and amount of risk the group is able and willing to accept.
●● An Enterprise Risk Management Framework (ERMF) that sets out the principles, policies, minimum standards and operations for risk management across the group.
●● The Own Risk and Solvency Assessment (ORSA) which is an ongoing process by which the board assesses the current and projected risk and solvency position of the group and its regulated entities.
●● A risk and control assessment process which is used to identify, assess, control and report our risks in accordance with the risk appetite and ERMF.
●● Stress and scenario testing which considers a range of severe yet plausible and reverse stress scenarios which are designed to challenge the continued financial and operational resilience of the group on a forward looking basis.
In accordance with the committee governance structure shown below, the board is ultimately responsible for monitoring the effectiveness of the group’s risk management and internal control systems (including financial, operational and compliance controls).
In 2016 the board commissioned an external review of risk management effectiveness with a follow-up external review taking place at the start of 2018. In the interim, both the board and the Risk Committee received periodic reports from the chief risk officer during 2017 which focused upon specific areas of risk management performance.
Risk Committee Audit Committee Investment Committee
With-profits Committee
Remuneration Committee
Corporate Governance and
Nomination Committee
Selected Board Committees
Selected Group Executive Committees
Group Executive Committee
LVFS Board
Other Committees and Individuals
Group Executive Risk Committee
Group Asset and Liability Committee
Group Valuation and Internal Model
Committee
Risk Management
£698mCapital surplus
£348m above risk appetite
37
Strategic Report
36

Investment Committee Remunera
tion
Com
mitt
ee
With
-pro
fits
Com
mitt
ee
Audit Committee
Cor
pora
te G
ov
ernance and
Nom
inat
ion
Committe
e
Monitor risk governance and framew
ork,
group’s economic capital m
odel and
systems of governance.
Focus on risk exposure.
Embed risk culture.
BoardEstablish values, culture and
ethics. Appointment and removal of directors. All
financial and strategic matters. Mergers, acquisitions and disposals. Monitor board
committees.
Risk Comm
ittee
Our risk culture and governance structure Over a number of years, our risk management approach and engagement with the business has sought to embed a culture of risk ownership and accountability throughout the group, supported by a robust risk framework and governance infrastructure which delivers the necessary risk management capability. The fundamental building blocks which enable our risk management approach are described below:
Risk culture: The way we think and act as individuals and as a business. It encompasses our attitudes, capabilities and behaviours such as “tone from the top”, risk transparency and risk competency, and is achieved through rewarding appropriate risk behaviours. Our culture drives how we identify, understand and openly discuss, and act upon, both current and future risks.
Risk mandate: To support our risk management approach we operate a three lines of defence model of risk management, with clearly defined roles, responsibilities and mandates for individuals and committees, as follows:
●● First line: Day to day risk management is delegated from the board to the chief executive and, through a system of delegated authorities and limits, to business managers.
●● Second line: Risk oversight is provided by the chief risk officer and supported by the group risk management function and through established risk committees such as the Group Executive Risk Committee (GERC) and with reporting to the Risk Committee. The majority of members of the GERC are the executive managers of the first-line functions whereas independent oversight is provided by non-executive directors at the Risk Committee.
●● Third line: Independent verification of the adequacy and effectiveness of the internal risk and control management systems is provided by our internal audit function. This is independent from all other operational functions and operates subject to supervision and challenge by the Audit Committee.
Risk governance: Our risk governance framework operates through group-wide risk policies and business standards which are aligned to a formal committee governance structure incorporating clearly defined roles, responsibilities and delegated authorities. The diagram below outlines the current Risk Committee governance arrangements:
The board is able to discharge its responsibilities with respect to risk governance, mandate and culture through the operation of the Risk Committee. This body makes recommendations to the board in respect of leadership, direction and oversight of the group’s risk appetite, risk tolerance and risk management frameworks. In doing so, it plays a key role in delivering effective risk oversight as well as being responsible for review and challenge of the group’s regulatory and internal control policies and procedures and its compliance monitoring plan.
Our risk appetite frameworkThe value of the business comprises the net value of the assets and liabilities (balance sheet value) plus its brand and reputation (franchise value). Our risk appetite framework has therefore been developed to focus on safeguarding these value drivers and the board regularly reviews its appetite for risk within this context. During 2017 we operated within five board-approved risk appetite dimensions each supported by a qualitative risk appetite statement, as outlined in the table below:
Risk Management
Risk appetite dimension Risk appetite statement
Financial Strength LV= will hold a level of capital surplus that is equivalent to being assessed as an S&P ‘A’ rated firm.
Solvency StrengthLV= has no appetite to breach the regulatory Minimum Capital Requirement (MCR) and is only prepared to breach the Solvency Capital Requirement (SCR) in the event of a severe financial market led stress scenario.
Liquidity LV= will hold sufficient liquid capital resources to ensure it can meet its liquidity requirements in both normal and stressed circumstances.
Reputation and Capability
LV= will seek to avoid risks that materially impair its reputation, while ensuring that its treatment of customers and its operational capabilities are designed to deliver fair customer outcomes.
Stakeholder Commitment
LV= will, in stressed market conditions and over a cumulative three year period, aim to generate sufficient profit after tax to meet its planned mutual bonus and debt interest payments without recourse to retained earnings.
These risk appetite statements are designed to set out the risks we believe we are capable of managing in order to generate a return; the risks we can support but which we share with third parties; and the risks we seek to avoid or minimise.
Each risk appetite statement is supported by risk limits (or tolerances) and triggers which provide us with a suite of early warning indicators for when risks start to deteriorate, allowing timely actions to be initiated.
The management of risk against risk appetite is brought to life and embedded across the organisation though the application of risk principles, policies and standards which are laid out within our ERMF.
Our Enterprise Risk Management Framework (ERMF)The group’s ERMF is designed to enable and support the safe delivery of the group’s strategy and business objectives within risk appetite. It comprises a suite of documented governance, internal control and risk management frameworks with clear lines of accountability around principal risk ownership, attestation and control. The ERMF is made up of the following elements:
1 2nd line of defence: Group risk management on behalf of the Risk Committee.
2 3rd line of defence: Group internal audit on behalf of the Audit Committee.
38 39
Strategic Report
LV= Annual Report 2017
Ownership Oversight
Risk Management Principles
Operations
Minimum Risk Standards
Risk Management Policies
Conduct risk Credit counterparty risk
Life insurance riskGeneral insurance risk
Liquidity riskMarket risk
Operational riskGroup risk
Strategic risk
Board
Chief risk officer
Principal risk owners
2nd
Line
of d
efen
ce1
3rd
Line
of d
efen
ce2
Enterprise Risk Management Framework
Board

Risk Management
Systems
Identify
Re
po
rt
Control
Asses
s
Risk management principlesFundamental values and statements representing the group’s approach to consideration of risk. The principles ultimately support the safe delivery of the strategy and plan (e.g. board statements on risk preferences and aversions).
Risk management policiesClear requirements and rules which have been designed to ensure that the risk management principles are appropriately delivered. They establish a framework within which the board’s requirements for risk management are delivered and executed (e.g. risk appetite limits and risk capital constraints).
Minimum risk standardsThe minimum requirements within which the business must operate in order to demonstrate the development and management of the group’s risk-taking activity in line with the risk principles and policies (e.g. calculation methodologies and reporting requirements).
OperationsThe core functions of the group which ensure that the business is managed and monitored within agreed boundaries. These comprise activities and processes which are owned by the business in order to monitor and manage the group’s underlying risks.
The board and senior management seek and obtain confirmation over the appropriateness and effectiveness of the ERMF design, execution and monitoring through a process of attestation. This process takes place on an ongoing basis with regular oversight and review as part of the operation of the three lines of defence.
The overall system of governance and ERMF is owned and maintained by the chief risk officer on behalf of the board, with accountability for the definition, design, monitoring and maintenance of any associated risk sub-frameworks clearly described within the group risk management organisational design. It also provides both the context and architecture for our risk and control assessment process.
Our Own Risk and Solvency Assessment process (ORSA)The group’s ORSA embeds effective risk management into all areas of the business. It captures a number of activities such as the regular identification and review of LV=’s risks and the current and future assessment of the solvency and liquidity position of the group.
The ORSA is not a one-off process. Individual activities take place throughout the year, with outputs providing a current and forward looking assessment of the risk and capital position of the group, included within regular management information.
Formal ORSA reporting takes place on an annual basis with quarterly updates presented to the Risk Committee to keep the board appraised of the group’s evolving risk profile and risk management initiatives.
The annual ORSA report is produced for the board and represents a key part of our strategic planning cycle informing the board’s assessment of group strategy, sustainability and ongoing viability.
Our risk and control assessment process The risk and control assessment process is made up of four key stages which are set out within the figure below. Each step comprises a number of established sub-processes within LV=, as determined by our ERMF, and generates a suite of risk registers plus associated action plans (where necessary).
Assessment
& Tolerances
Ass
essm
ent
& Challenge
Capital
Business
Capita
l
Risk &
Risk ID &
Risk Appetite
Ris
k &
Solv
ency
Strategy Review
Planning
Management Manag
emen
t
1
2
3
4
5
6
7
Cultureand
Governance
Identify – To identify and categorise risks in accordance with the group’s risk taxonomy;
Assess – To quantify the materiality of each risk against a suite of financial and non-financial measures and in accordance with risk appetite;
Control – To identify and/or design and implement controls to mitigate each material risk; and
Report – To regularly monitor and report upon the effectiveness of controls in mitigating material risk exposures and where necessary escalate control failures and put in place remedial measures.
This process happens throughout the year across all areas of the business, with support provided by group risk management. Outputs are captured on a centralised risk management system and are presented quarterly to the relevant executive risk committees, with overall monitoring and oversight exercised by the Risk Committee.
In accordance with the ERMF, the risk and control assessment process has been designed to bring to life the linkages between the group’s overarching internal control framework and the associated risk categorisation, principal risk ownership and risk appetite frameworks. It is also designed to identify risks before they materialise. This gives us time to identify and capture risks as they emerge, understand them and respond accordingly. We are then able to use this process to inform our stress testing and capital adequacy assessments across the group as part of our ORSA.
Stress and scenario testingAs part of our regular ORSA activities, financial risk modelling is used to assess the amount of each risk type against its risk appetite. This modelling is aligned to our capital metrics to allow the board to understand the capital requirements and key drivers associated with our principal risks.
We also performed stress tests throughout 2017 to assess the capital resilience of the group under a range of severe but plausible scenarios covering areas such as: general macro-economic downturn, stresses to the business model, emerging regulatory impacts, sector-specific and company-specific risks (including operational risks), risk concentrations and emerging competitor and customer challenges.
These stress tests allow the board to review and challenge the strategic plan and risk management strategy on a forward looking basis. This includes an assessment of the impact and effectiveness of mitigating management actions designed to maintain or restore capital, liquidity and solvency to within risk appetite.
The de-risking of the balance sheet has helped to reduce our sensitivity to certain stress scenarios. In the scenarios tested during 2017, sufficient actions were available to management to maintain the viability of the group over the three year period of assessment.
In addition, reverse stress tests which determine particular points of failure not only confirm our ongoing resilience to extreme events, but are also used to inform the setting of our capital risk appetite buffers (over and above the regulatory capital requirement) in order to protect the group against future shocks and stresses. For 2017, reverse stress scenarios included a major disruption to the general insurance business, a material increase in longevity and further significant volatility in financial markets.
40 41
Strategic Report
LV= Annual Report 2017 Risk Management

Top risk Risk management actions
Political and regulatory uncertaintyThe risk of failure to achieve the group business plan due to material and prolonged uncertainty within the political and regulatory landscape.
We continue to remain alert to the risks associated with the UK political and regulatory uncertainty. For example, the outcome of the Brexit negotiations remains unclear and the UK’s political landscape changed during 2017 with the establishment of a minority government. The full impact of this period of political uncertainty is as yet unknown, although there may be increased market volatility over the coming months. We continue to give careful consideration to these risks through our ongoing emerging risk process which is prominent in our risk oversight.
Regulatory challengesFailure to comply with current (known) or future (unknown) regulation / legislation resulting in regulatory censure (e.g. fines or enforcement).
We continue to work hard with the regulators to ensure that the group meets all of its regulatory commitments, especially against a backdrop of the challenging regulatory change agenda (e.g. GDPR, Universal Credit). We remain alert to the changing agenda and continue to monitor the impact of potential changes across all risk categories.
General Data Protection Regulation (GDPR)The risk of a material loss resulting from compliance with new GDPR legislation which will become enshrined in UK law from May 2018 (or the receipt of regulatory fines due to non-compliance).
We proactively seek to manage and mitigate the risks associated with GDPR. During 2017 we appointed a General Data Protection Officer (GDPO) who has actively monitored and assessed the impact of proposed changes in UK GDPR legislation as it has moved through parliament. The GDPO is supported by a dedicated change programme to ensure that we are compliant when the new legislation comes into final effect.
UK health and social provisionThe inherent risk that treatment of private (insurance) provision benefits under Universal Credit may have an adverse impact on the life and health insurance industry, particularly around the individual income protection market where LV= is recognised as a market leader.
We continue to liaise with the relevant Government departments and the industry to quantify the potential impact and implications of Universal Credit on existing and prospective (income) protection policyholders. As we lobby for fairer treatment from Government, we continue to hold awareness and training sessions internally and externally and are reviewing our claims proposition and communications to existing policyholders. Furthermore, as Universal Credit is rolled out across the country, we’re addressing any individual LV= policyholder claimant issues as they arise on a case-by-case basis.
Corporate bond spreadThe risk that there is a change in the market value of LV=’s corporate bond holdings over and above risk free yields.
We continue to accept corporate bond spread risk as part of our business strategy and risk taking activity. With the exception of Brexit, risks from the domestic market remain relatively stable overall across the major markets, spreads between corporate and sovereign bond yields remain compressed, particularly for high-yield corporate bonds.
In managing this risk we stipulate minimum levels of credit quality (both at an individual and portfolio level) and place limits on credit concentrations by issuer, sector and type of instrument.
Conduct risk The risk that conduct risk controls are ineffective for new business and/or our legacy books contain a material number of cases where there is evidence of customer detriment due to mis-selling.
We continue to consider all aspects of conduct risk and the potential impact of customer detriment in everything we do. During 2017, we updated our conduct risk framework and suite of associated management information. Control enhancements and structural changes have also been made to enable senior management and the Risk Committee to provide greater challenge and support around the conduct risk agenda. These activities will continue into 2018.
Information security / cyber securityThe risk that LV= does not have a sufficiently robust strategy and control infrastructure in place to protect itself against, or recover from, an event which results in the loss, misuse or reduction in the confidentiality, integrity or availability of its customer data.
We continue to remain alert to and seek to minimise the threat from cyber risk. Recent high profile ransomware attacks around the world show this threat to be both real and increasing. Cyber security therefore continues to feature within our top risks in order to reflect the heightened risk environment and level of additional vigilance undertaken in order to maintain our security architecture framework.
IT change deliveryThe risk of reduced availability, lack of stability and/or total failure of critical IT systems as a result of a failure to execute IT change effectively.
We continue to be alert to the increasing demands placed upon our IT infrastructure, especially with the approaching IT systems separation under the strategic partnership with Allianz. To address the issue of stretch across the change portfolio a monthly summary of project activity is presented to the group executive committee, who apply a start/stop/continue lens to prioritise project activity.
This has been further supported by a regular review of critical change milestones and a central review of the strategic investment budget allocations.
Delivery riskThe risk that key strategic initiatives, business objectives and/or regulatory obligations are not met due to loss of key staff or the demands of the change portfolio exceed the available capacity.
We continue to experience and initiate a high degree of internal change whilst also managing our business-as-usual commitments. In order to achieve this successfully, we regularly review our capacity and resourcing requirements, responding to any pressure points through a combination of careful capacity planning, reprioritisation and/or resource management. We also have a number of key initiatives in place to ensure that the wellbeing of our staff is monitored and our teams are supported.
Our principal risks and uncertaintiesLV= has defined three (increasingly granular) levels of principal risk categories (levels 1, 2 and 3) which represent a documented and agreed common risk taxonomy that is understood by the board and promotes consistency and comparability of reporting across the group. This risk categorisation framework is reviewed and approved annually by the Audit Committee and is supported by the principal risk ownership framework which provides clarity over risk accountabilities and improves the understanding between those who identify, model and make risk-based decisions. Together these frameworks also encourage easier and clearer aggregation of risks and capital by risk type.
Level 1 principal risks are all owned by the chief executive and represent the highest category of risks which are faced by the group, covering the following areas:
(Level 1) principal risk category Principal risk description
Financial markets risk Adverse movement in asset values, asset income, interest rates or inflation.
Life insurance risk Life insurance experience is different to current best-estimate assumptions.
General insurance risk General insurance experience is different to current best-estimate assumptions.
Credit counterparty risk A counterparty defaults on its obligations or fails to meet them in a timely fashion.
Operational risk Loss resulting from inadequate or failed internal processes, people and systems or from external events.
Liquidity riskThe risk that the group and/or its subsidiaries, though solvent, either do not have sufficient financial resources available to meet their obligations when they fall due, or can secure them only at excessive cost.
Group riskThe risk arising from the membership of the group, including potential conflicts of strategy, competition for financial resources from other businesses and the reputational impact from the activities of other parts of the group.
Strategic risk Risks which can be quantified and understood, and which would have a major impact on the group’s business model.
The group’s principal risk categories are expected to remain relatively stable over time. Within the boundaries of this risk framework, and by using our risk and control assessment methodology, senior management will continually assess the more dynamic day-to-day risks faced by the business, from both a first and second line perspective. Aggregated, the most material of these are known as our top risks and are tracked monthly by senior management and by the board.
A selection of these top risks is provided in the following table. These tend to change month on month and therefore this should not be considered to be an exhaustive list of all the risks that the group faces, but rather those which at the year end we believed had the greatest potential to affect our business model, future performance, solvency or liquidity. Throughout 2017 all of our top risks, along with proposed mitigating actions, were subject to robust review and challenge by senior management, the Risk Committee and by the board.
42 43
Strategic Report
LV= Annual Report 2017 Risk Management

Corporate Responsibility Report
Katie WadeyChief Customer Officer
Our people donated over
2,500 volunteering hours
We believe that everyone deserves to Live Confident and our approach to corporate responsibility is all about putting our customers at the heart of our business, looking after our people, investing in our communities and caring about our impact on our surroundings.
To help us focus on those areas where we believe we can make the most difference, we have structured our approach around four key areas:
Current and future developmentsThe group completed two transactions during 2017 that had a significant (positive) impact on its overall risk profile. These were:
1 The sale of a majority interest in its general insurance business to Allianz over two tranches, with completion of the first tranche (49%) at the end of 2017 and the remaining second tranche scheduled for completion by 31st December 2019; and
2 The reinsurance of longevity and market risk associated with our with-profits deferred annuitieswithin the OB pensions portfolio to Reinsurance Group of America.
The Risk Committee received regular reports from the business and from the chief risk officer on the impact of these transactions and reported on its findings and recommendations to the board.
Following an external review of risk management, performed at the committee’s request in 2016, the committee has also closely monitored the development and implementation of improvements to the risk management target operating model (people, processes and systems). In particular, during 2017 the Risk Committee reviewed and approved: the risk mandate, the risk appetite framework, the implementation of new liquidity risk tolerances, improvements to conduct risk and the performance of a broad range of operational risk scenario workshops.
This programme of continuous review and improvement will continue into 2018 with the introduction of a revised target operating model and organisational design for group risk management. This will enable the delivery of updated risk appetite and framework documentation, a planned upgrade to our risk management system (driving improvements in our risk and control assessment processes) and a focus on embedding an effective and proportionate risk management culture through better engagement and collaboration across all three lines of defence.
People and cultureDiversity
Employee engagementReward and recognition
Gender pay gap
Invest
ing
in
our com
mun
itie
sSafeguarding
our environment
and culture
Our people
Resp
onsib
le
busi
ness
practice1
4
2
3
CommunitiesCommunity investment
Community partnershipCommunity fundraising
Member support
EnvironmentCarbon footprintEnergyBusiness travelWaste
Responsible businessCustomer satisfactionFinancial crime Human rights and modern slaveryOur suppliers Responsible investment
44 45
Strategic Report
LV= Annual Report 2017
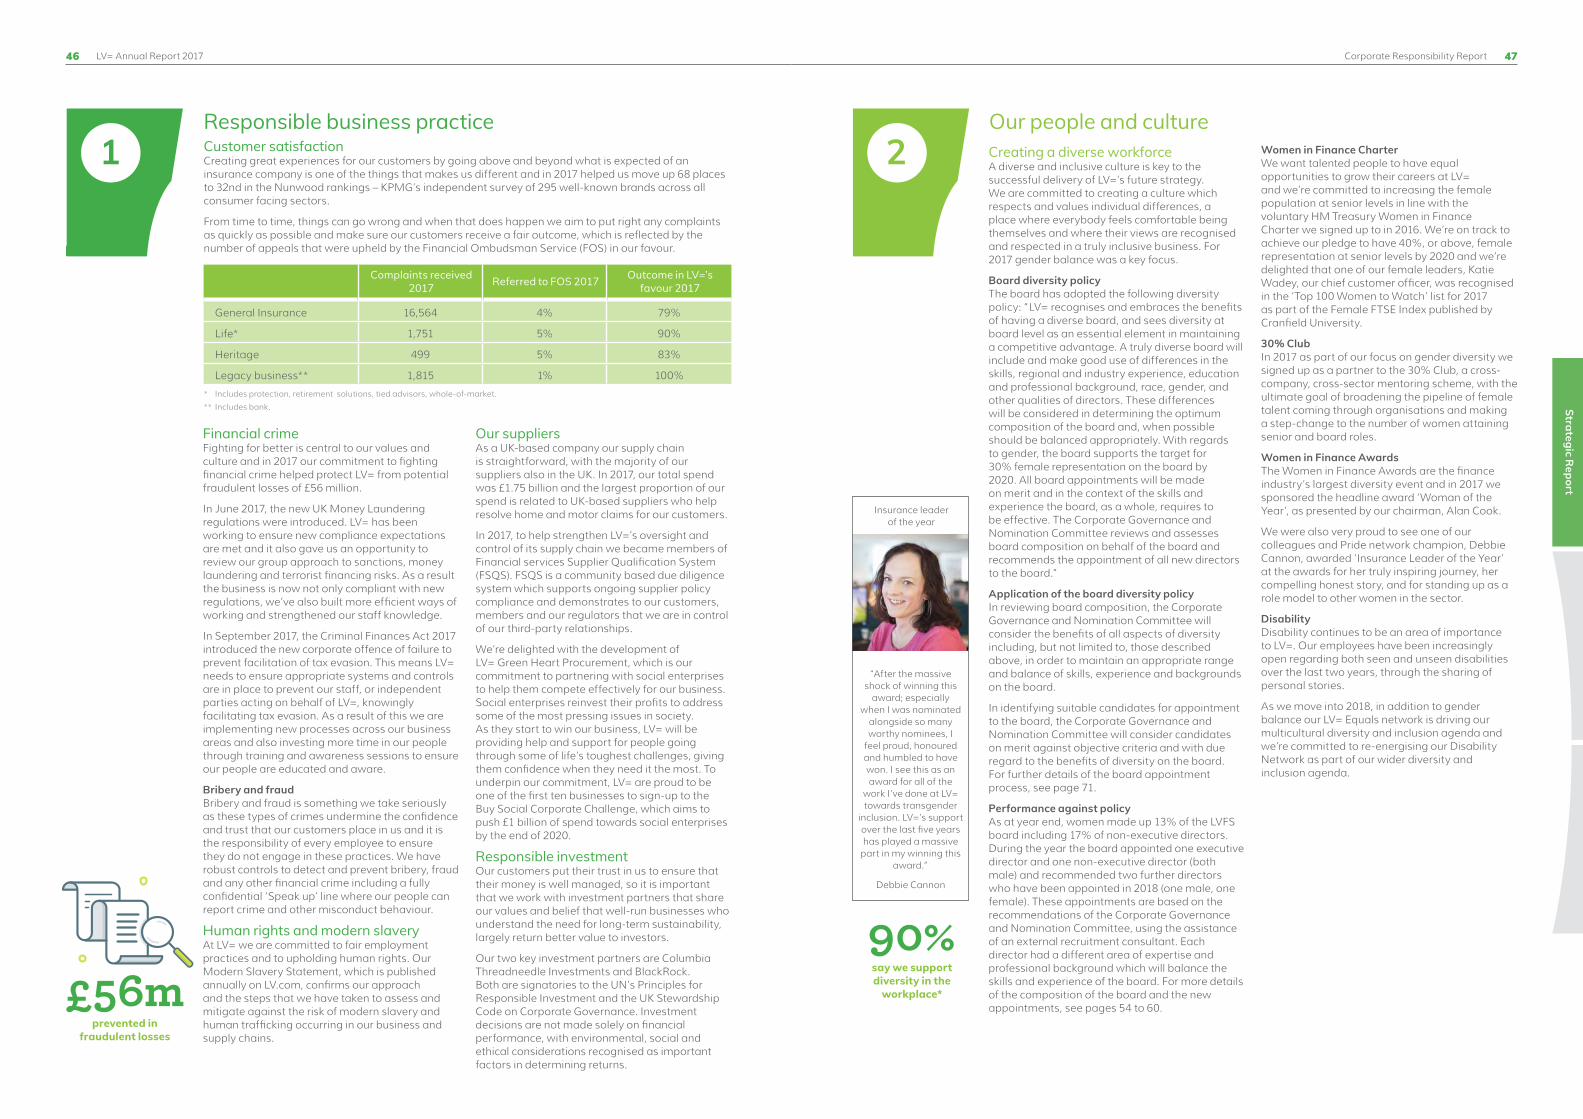
Corporate Responsibility Report
Responsible business practiceCustomer satisfactionCreating great experiences for our customers by going above and beyond what is expected of an insurance company is one of the things that makes us different and in 2017 helped us move up 68 places to 32nd in the Nunwood rankings – KPMG’s independent survey of 295 well-known brands across all consumer facing sectors.
From time to time, things can go wrong and when that does happen we aim to put right any complaints as quickly as possible and make sure our customers receive a fair outcome, which is reflected by the number of appeals that were upheld by the Financial Ombudsman Service (FOS) in our favour.
Complaints received 2017 Referred to FOS 2017 Outcome in LV=’s
favour 2017
General Insurance 16,564 4% 79%
Life* 1,751 5% 90%
Heritage 499 5% 83%
Legacy business** 1,815 1% 100%
* Includes protection, retirement solutions, tied advisors, whole-of-market.
** Includes bank.
Financial crime Fighting for better is central to our values and culture and in 2017 our commitment to fighting financial crime helped protect LV= from potential fraudulent losses of £56 million.
In June 2017, the new UK Money Laundering regulations were introduced. LV= has been working to ensure new compliance expectations are met and it also gave us an opportunity to review our group approach to sanctions, money laundering and terrorist financing risks. As a result the business is now not only compliant with new regulations, we’ve also built more efficient ways of working and strengthened our staff knowledge.
In September 2017, the Criminal Finances Act 2017 introduced the new corporate offence of failure to prevent facilitation of tax evasion. This means LV= needs to ensure appropriate systems and controls are in place to prevent our staff, or independent parties acting on behalf of LV=, knowingly facilitating tax evasion. As a result of this we are implementing new processes across our business areas and also investing more time in our people through training and awareness sessions to ensure our people are educated and aware.
Bribery and fraudBribery and fraud is something we take seriously as these types of crimes undermine the confidence and trust that our customers place in us and it is the responsibility of every employee to ensure they do not engage in these practices. We have robust controls to detect and prevent bribery, fraud and any other financial crime including a fully confidential ‘Speak up’ line where our people can report crime and other misconduct behaviour.
Human rights and modern slavery At LV= we are committed to fair employment practices and to upholding human rights. Our Modern Slavery Statement, which is published annually on LV.com, confirms our approach and the steps that we have taken to assess and mitigate against the risk of modern slavery and human trafficking occurring in our business and supply chains.
Our suppliers As a UK-based company our supply chain is straightforward, with the majority of our suppliers also in the UK. In 2017, our total spend was £1.75 billion and the largest proportion of our spend is related to UK-based suppliers who help resolve home and motor claims for our customers.
In 2017, to help strengthen LV=’s oversight and control of its supply chain we became members of Financial services Supplier Qualification System (FSQS). FSQS is a community based due diligence system which supports ongoing supplier policy compliance and demonstrates to our customers, members and our regulators that we are in control of our third-party relationships.
We’re delighted with the development of LV= Green Heart Procurement, which is our commitment to partnering with social enterprises to help them compete effectively for our business. Social enterprises reinvest their profits to address some of the most pressing issues in society. As they start to win our business, LV= will be providing help and support for people going through some of life’s toughest challenges, giving them confidence when they need it the most. To underpin our commitment, LV= are proud to be one of the first ten businesses to sign-up to the Buy Social Corporate Challenge, which aims to push £1 billion of spend towards social enterprises by the end of 2020.
Responsible investment Our customers put their trust in us to ensure that their money is well managed, so it is important that we work with investment partners that share our values and belief that well-run businesses who understand the need for long-term sustainability, largely return better value to investors.
Our two key investment partners are Columbia Threadneedle Investments and BlackRock. Both are signatories to the UN’s Principles for Responsible Investment and the UK Stewardship Code on Corporate Governance. Investment decisions are not made solely on financial performance, with environmental, social and ethical considerations recognised as important factors in determining returns.
Our people and cultureCreating a diverse workforce A diverse and inclusive culture is key to the successful delivery of LV=’s future strategy. We are committed to creating a culture which respects and values individual differences, a place where everybody feels comfortable being themselves and where their views are recognised and respected in a truly inclusive business. For 2017 gender balance was a key focus.
Board diversity policyThe board has adopted the following diversity policy: “LV= recognises and embraces the benefits of having a diverse board, and sees diversity at board level as an essential element in maintaining a competitive advantage. A truly diverse board will include and make good use of differences in the skills, regional and industry experience, education and professional background, race, gender, and other qualities of directors. These differences will be considered in determining the optimum composition of the board and, when possible should be balanced appropriately. With regards to gender, the board supports the target for 30% female representation on the board by 2020. All board appointments will be made on merit and in the context of the skills and experience the board, as a whole, requires to be effective. The Corporate Governance and Nomination Committee reviews and assesses board composition on behalf of the board and recommends the appointment of all new directors to the board.”
Application of the board diversity policyIn reviewing board composition, the Corporate Governance and Nomination Committee will consider the benefits of all aspects of diversity including, but not limited to, those described above, in order to maintain an appropriate range and balance of skills, experience and backgrounds on the board.
In identifying suitable candidates for appointment to the board, the Corporate Governance and Nomination Committee will consider candidates on merit against objective criteria and with due regard to the benefits of diversity on the board. For further details of the board appointment process, see page 71.
Performance against policyAs at year end, women made up 13% of the LVFS board including 17% of non-executive directors. During the year the board appointed one executive director and one non-executive director (both male) and recommended two further directors who have been appointed in 2018 (one male, one female). These appointments are based on the recommendations of the Corporate Governance and Nomination Committee, using the assistance of an external recruitment consultant. Each director had a different area of expertise and professional background which will balance the skills and experience of the board. For more details of the composition of the board and the new appointments, see pages 54 to 60.
Women in Finance CharterWe want talented people to have equal opportunities to grow their careers at LV= and we’re committed to increasing the female population at senior levels in line with the voluntary HM Treasury Women in Finance Charter we signed up to in 2016. We’re on track to achieve our pledge to have 40%, or above, female representation at senior levels by 2020 and we’re delighted that one of our female leaders, Katie Wadey, our chief customer officer, was recognised in the ‘Top 100 Women to Watch’ list for 2017 as part of the Female FTSE Index published by Cranfield University.
30% Club In 2017 as part of our focus on gender diversity we signed up as a partner to the 30% Club, a cross-company, cross-sector mentoring scheme, with the ultimate goal of broadening the pipeline of female talent coming through organisations and making a step-change to the number of women attaining senior and board roles.
Women in Finance AwardsThe Women in Finance Awards are the finance industry’s largest diversity event and in 2017 we sponsored the headline award ‘Woman of the Year’, as presented by our chairman, Alan Cook.
We were also very proud to see one of our colleagues and Pride network champion, Debbie Cannon, awarded ‘Insurance Leader of the Year’ at the awards for her truly inspiring journey, her compelling honest story, and for standing up as a role model to other women in the sector.
Disability Disability continues to be an area of importance to LV=. Our employees have been increasingly open regarding both seen and unseen disabilities over the last two years, through the sharing of personal stories.
As we move into 2018, in addition to gender balance our LV= Equals network is driving our multicultural diversity and inclusion agenda and we’re committed to re-energising our Disability Network as part of our wider diversity and inclusion agenda.
“After the massive shock of winning this
award; especially when I was nominated
alongside so many worthy nominees, I
feel proud, honoured and humbled to have won. I see this as an award for all of the
work I’ve done at LV= towards transgender
inclusion. LV=’s support over the last five years has played a massive part in my winning this
award.”
Debbie Cannon
£56m prevented in
fraudulent losses
1 2
Insurance leader of the year
90% say we support diversity in the
workplace*
46 47
Strategic Report
LV= Annual Report 2017

Investing in our communities3
Employee engagement We know that having engaged employees has a positive impact on customer experience and therefore business performance, which is why each year we invite our people to give us feedback via our Engage employee survey. The survey is anonymous and the results identify key focus areas we all need to work on for the rest of the year.
2017 has been a year of significant change across the group and we recognise that the uncertainty that our people have experienced during this time is reflected in the sustainable engagement score of 76%, 5% lower than 2016.
Reward and recognition We are committed to making sure our people are rewarded fairly through the regular review of our pay levels to ensure they are competitive both internally and externally with market rates. We pay all our employees at least the Living Wage rates of pay. In 2017, the average full time employee salary was £32,200 (2016: £31,500). In addition to basic pay, all our employees participate in an incentive scheme which is structured around both individual and business performance. In 2017 the average bonus was 11.7% of bonus-able earnings.
All employees automatically become members of the LV= Pension Plan when they start working for us. They also have access to the LV= Pensions Village which allows them to track their contributions and the impact contribution levels will have on their retirement plans.
We understand that the needs of our employees are different, so through our flexible benefits platform we give all employees the opportunity to select the benefits most suited to their individual needs and lifestyles.
Gender pay gapUK employers with over 250 employees must now report on their gender pay gap. This is a measure of the difference between males’ and females’ average earnings across an organisation and something that we welcome because we want talented people to have equal opportunities to grow their careers and we believe that gender balance is vital to our success. We have published our gender pay gap, using data from April 2017, and at 28%, our mean gender pay gap is lower than the indicative average for the financial services industry (34%). We understand why it exists, recognise there is work to be done and are focused on the steps needed to close the gap. To view our full Gender Pay Gap Report visit LV.com.
Proportionately the split between the overall number of males and females working for LV=, as at the end of 2017, stood at 52% female and 48% male. From a job role perspective where a band A is most junior and band E most senior, the infographic below shows the ratio of female employees in each band:
Our focus for 2017 has been to better understand the impact we make in communities. In June we became a member of the London Benchmarking Group so that we could better measure the impacts made through our commitment to the community. Last year we reached just over 42,000 people through our investment, partnership and fundraising in three key areas of health, education and social welfare.
Community investmentWe want to create a lasting positive impact through a programme of activity, not only by way of donations, but by harnessing the power of our own people volunteering their time and fundraising. During 2017 our community contributions were worth over £373,000 to a variety of good causes and community projects.
To help decide how best to lend our support we have Regional Community Committees made up of employee volunteers in each of our offices. They continued to work with the London Benchmarking Group to better understand the impact of the £175,000 donated and support given to 228 charities during the year.
Our people truly live our values of ‘we don’t wait to be asked’ and ‘we make it feel special’ and make a huge difference by getting out in the community sharing their skills, knowledge and time, with LV= matching up to two and a half days per year. This not only benefits the community, and in 2017 over 2,500 hours were spent supporting directly in our local communities, but is great personal development for our people.
Community partnershipsOver the years we have created a number of community partnerships and built strong relationships with charities and community groups on programmes around shared interests.
Our longest standing partnership is LV= KidZone now in its eleventh year. Working with Bournemouth council and the RNLI, the scheme helps keep children safe along Bournemouth’s beaches. In 2017, around 40,000 wristbands were handed out to local and visiting families and they reunited 219 children, an all-time record number of lost children, on average within just six minutes, with their loved ones.
A more recent partnership is with AutoRaise, the vehicle repair industry’s charity tackling the industry-wide skills shortage. As a car insurer, we know that our customers need their vehicles to be repaired to a safe and high standard by highly skilled people and as a platinum partner with AutoRaise, we’re working with the charity to help attract the next generation of apprentices and raise the profile of the benefits that a career in the repair industry can bring. Loneliness continues to be a big society concern and we’ve strengthened our commitment in 2017 (by increasing the number of employees by 50% to sixty volunteers) to take part in Age UK’s telephone befriending service. During the year, our people have made over 950 calls to those in society who may not otherwise get to speak to another human being.
Call in Time spent
500 hours
talking to lonely older people
LV= KidZone reunited
219 lost children with
their families (up from 184 in 2016)
Community investment £373,808
Community partnerships £75,546
Community fundraising £330,075
Member support £127,820
£907,249Community and member support
Gender data 2017
Band A Band B Band C Band D Band E
35%
65%
46%
64%
74%
81%
54%
36%
26%
19%
89% believe our values
are clear*
2,097 1,989 1,644 77 16 5,823
Number of employees
Total
52%48%
KeyBand Typical roles A Sales, service and claims representatives B Team leaders, personal assistants and administration C Technical and managerial D Senior leaders and heads of department E Executives
90% believe strongly in the goals and objectives
of LV=*
87% feel they have the opportunity to ask
questions*
90%
feel they are able to use their own
judgement to do the right thing*
* Employee engagement results
48 49
Strategic Report
LV= Annual Report 2017 Corporate Responsibility Report

Corporate Responsibility Report
4
55% of our people
registered in our Pennies for Charity
scheme
Safeguarding our environmentEnvironmentAs a UK insurer, our environmental impacts are small in comparison to many other businesses. However, we are committed to managing the impacts of our day to day business on the three areas where we have most influence – carbon emissions as a result of our energy consumption, employee travel, and our overall waste management.
Carbon footprintIn 2017 we rolled out a power management tool called Nightwatchman which automatically shuts down our idle desktop workstations after business hours, and then wakes them back up at the start of the next working day. This measure should reduce our carbon footprint by as much as 566 metric tonnes of CO2 a year from next year.
Community fundraising It isn’t just the close to home charities and community projects that bring out the best in our people, for over a decade we’ve been supporting national fundraising events like Children in Need, Comic Relief and Macmillan Coffee Morning. In 2017 our peoples’ fundraising meant these charities received over £33,000. It is not only their fundraising that helped these charities, as we continue to be one of Children in Need’s official call centres for their telethon event in November, with over 100 of our people volunteering and taking over 1,500 calls and £60,000 in donations on the night.
Our payroll giving and £ for £ charity matching schemes continue to support our people as they raise funds for causes close to their own hearts. In 2017 our people raised over £244,000 and benefited from a further £67,500 in corporate matching.
We also now have over half of all of our people donating the odd pence from their net pay each month through Pennies for Charity, raising over £18,600 in 2017, which was distributed to a local charity voted for by each office.
Extra support for membersThe Member Care Line is an additional benefit available to all members offering a 24 hour telephone advice line where members can access legal, medical and counselling support. In 2017 advisers dealt with 1,064 calls from members seeking assistance, at a cost of £42,000.
First established in 2012, the Member Community Fund ran for the first six months of 2017 with £20,000 distributed to The Pod charity, ACT for SMA and The Encephalitis Society.
The Member Support Fund was set up in 2001 to help members in financial hardship. During the last decade this Fund awarded over £450,000 to more than 500 members and their families. During the year, the Member Support Fund has supported 40 members with over £50,000 and became part of Green Heart support at the end of June.
Members who choose to take out car, home, pet, travel, caravan, motorcycle or classic car insurance with us can receive between 5-10% off the price of their premium. This financial benefit amounted to £2,154,540 of direct value to members in 2017.
We reached over
42,000people
through our social programme Regional community committees donated
£175,000
and helped 228 charities
£330,075fundraised by our people
for good causes
Greenhouse gas emissionsCarbon emissions (tonnes CO2 equivalent p/employee)
2016 2017
0.05
0.250.05
0.46
0.04
0.210.07
0.44
Key Purchased Electricity
Purchased Gas
Business Travel (Land)
Business Travel (Air)
* From April 2017 the assumptions on waste and recycling collection weights per volume changed as a result of a change of provider. These different assumptions were applied retrospectively to enable like for like comparison.
Business travelTravel (tonnes CO2 equivalent p/employee)
EnergyEnergy usage (tonnes CO2 equivalent p/employee)
2017
2016
2015
2017
2016
2015
0.25
0.30
0.35
0.51
0.51
0.63
Waste and recycling*Waste (tonnes)
Recycling (as a % of overall waste)
2017
2016
2015
2017
2016
2015
95%
96%
95%
645
635
714
0.810.76
50 51
Strategic Report
LV= Annual Report 2017

Corporate Governance ReportCorporate Governance Statement 54
Directors’ Report 72
Report on Directors’ Remuneration 75
OverviewThe following pages outline our corporate governance framework and our approach to remuneration.
We adhere to the UK Corporate
Governance Code
Alan Cookappointed as Chairman
75%Independent members
on the board
Exceeded maximum profit
targets for Bonus and LTIP
52 53
Governance

Corporate Governance StatementWe comply with the Financial Reporting Council’s UK Corporate Governance Code, (the ‘Code’)
Corporate Governance Report
(As at 31 December 2017)
In accordance with the Society’s rules, all directors offer themselves for re-election every 3 years. The chairman offers himself for re-election annually.
Board member compositionExecutive 2
Independent Chairman 1
Independent Non-executive 5
We therefore satisfy the Code’s recommendation that at least half of the board should consist of independent non-executive directors.
Male 7
Board member balance
up to 3 years 4
Female 1
13% female representation on the board
Board members’ tenure
over 6 years 2
3-6 years 2
Compliance with the Code for the year ended 31 December 2017Due to the Society’s debt listing on the London Stock Exchange, the board has adopted a governance structure based on the principles and provisions of the Code with the following exceptions during the reporting year:
i. a decision taken by the board to allow Mark Austen (chairman until June 2017) to be a member of the Audit Committee. The Audit Committee membership includes three independent non-executive directors as required by the Code and Mark’s membership to the committee was in addition to this. The Code recommends that the chairman may only be a member of the Audit Committee in ‘smaller companies’1. However, Mark was a member of the Audit Committee prior to his appointment as chairman of the board in 2013 and it was deemed that Mark had recent and relevant financial experience and continued to make a valuable contribution to the Audit Committee. Alan Cook was appointed as chairman following Mark’s resignation in June 2017 and the board decided that Alan would not replace Mark as a member of the Audit Committee.
ii. a decision taken by the board that only the chairman will offer himself for annual re-election by members at the Annual General Meeting. The board has determined that the annual election of the chairman provides an adequate means for members to register concern with the performance of the board directors who continue to stand for re-election at least every three years.
In order to comply with the Code, the Society interprets all references to “shareholders” to mean its members and reference to “major shareholders” as those members invited to attend the Member Panel.
Alignment of the board to the group’s culture, values and governance arrangementsThe role of the board is to set the tone from the top on the group’s governance, culture and values and to be collectively responsible for the long-term success of the group. For the board this means not only ensuring that we comply with all relevant laws and regulations and
ensuring that we have high standards of internal control and risk management, but that we run our business with integrity.
The board ensures that we truly live our values every day, delivering on ‘Green Heart Experiences’ for our customers, colleagues and members, harnessing the latest technologies and building a business that is sustainably lean and strong. By doing this the board helps ensure that LV= will enable people to ‘Live Confident’.
Working as a collective boardAt the year-end, the board comprised an independent non-executive chairman, five independent non-executive directors and two executive directors (following the resignation of Steve Treloar on 28 December 2017) who collectively possess an appropriate balance of expertise in the financial services industry, including general insurance and life insurance, investments, risk and governance. This ensures a balance of skills, understanding and perspectives relevant to the group’s business. As members of a unitary board, the non-executive directors meet, without the executive directors present, to constructively challenge and help develop proposals on strategy. The particular skills and experience that each director brings to the board are included on pages 58 to 60. The composition and tenure is summarised to the left.
Changes to board compositionThere have been a number changes at board level during the year under review:
Alan Cook joined the Society’s board on 1 January 2017 as a non-executive director and chairman designate. Following a member vote at the AGM, Alan became chairman of the board in June 2017, replacing Mark Austen who had served four years as chairman and ten years on the board. Alan has extensive financial services experience across insurance, banking and investment and his full biography has been included on page 58.
Andy Parsons joined the Society in June 2017 as a board member and group finance director following the departure of Philip Moore. Andy has over 25 years’ industry experience (see biography on page 58).
After six years, Cath Keers resigned from the board in July 2017. The board welcomed Colin Ledlie as a new non-executive director in August 2017.
Colin has also joined the Audit, Risk and With-profits Committees and his biography, detailing his relevant skills and experience, is included on page 59.
Steve Treloar, who joined the Society in May 2016 as an LVFS board member, resigned from the board in December 2017 following the sale of a 49% stake in the general insurance business to Allianz. He remained on the board of Liverpool Victoria General Insurance Group Limited as chief executive. Further details of the transaction with Allianz have been included on page 22.
In 2018 the board was pleased to welcome two new non-executive directors; Alison Hutchinson and Luke Savage. Alison joined the board on 1 January 2018 and has a strong background in financial services as well as IT, digital marketing and cyber security. Luke joined the board on 1 February 2018 and was most recently group chief financial officer at Standard Life and prior to that finance director at Lloyds of London for ten years.
Board effectivenessThe Code recommends an externally facilitated review of board effectiveness at least every three years. Although a review was undertaken in 2015, as a prerequisite of the chairman’s appointment, it was decided that the board undertake an external review in 2017. The chairman, supported by the company secretary, interviewed a number of consultants and appointed Steve Southall of EY to carry out the review and work alongside the board. Steve has significant experience of conducting board evaluations for companies within the financial services industry and offered a different perspective to the more traditional governance-focused reviews.
The process included a full review of the Audit, Remuneration and Risk Committees focusing fundamentally on the committees’ interaction with the board and also considered the quality, transfer and escalation of information.
In light of the number of changes to the board composition throughout the year, and the strategic challenges faced by the Society, the main objectives of the evaluation were to provide an assessment of the past effectiveness of the board in order to make recommendations and provide guidance for the new chairman in leading the board going forward.
EY met initially with the company secretary to gain a broader understanding of the board’s history and approach to governance before undertaking a detailed review of a broad range of documentation. EY also carried out interviews with all board members as well as the chief risk officer, director of compliance, internal audit director and the company secretary. The interviews focused on the effectiveness of the current board, but also discussed the issues which had historically impacted the board’s effectiveness.
EY observed a board, Audit Committee and Risk Committee meeting to gain a broader understanding of the operation of the board and the interaction and challenge made by the directors.
EY presented the results of the evaluation and recommendations to the board at its meeting in November 2017 and a number of actions were agreed to be addressed throughout 2018.
The directors are satisfied that the board and each of the committees that were evaluated are operating effectively. The review has identified some actions and recommendations that will help maintain and improve its effectiveness. The following ‘key areas’ were highlighted and the actions taken to improve on these areas are outlined in the table below.
1 As per the Code ‘smaller companies’ are defined as those that are below FTSE 350 throughout the year immediately prior to the reporting year. The Society is deemed as ‘FTSE 350 equivalent’ as it does not fall below the threshold for compliance with Solvency II.
Key focus area Action taken
Governance framework Continue to improve the form and focus of board meetings and the structure of board agendas as the board moves into a more “business as usual” environment following a period of transition.
The format of the meeting agendas will be updated to ensure sufficient time is dedicated to each agenda item. An effective governance framework will be implemented to accurately capture delegated authorities and the process for issuing and monitoring actions arising from the meeting, through to closure, will be improved.
Board operationsMaintain and continuously develop the appropriate skills and experiences of the collective board. Continue to make improvements to the flow of management information before submission to the board.
A training programme (both collective and individual) will be prepared to strengthen the skills and knowledge of the board. The expectations of the senior independent director will be discussed and the role strengthened and used more effectively to assist the chairman. Further training will be provided to those preparing board papers and the board and committee schedules will be reviewed to facilitate the flow of management information and to ensure that the discussion and challenge, through appropriate forums, has been held and approvals sought before any paper is submitted to the board.
Culture and behaviour To continue to develop a culture which enables effective challenge by the board, led by the chair.
Meetings of the non-executives will be held outside the formal board meetings to discuss, amongst other matters, the effectiveness of the chairman.
Management information Guidance and additional support to the board will be provided to ensure that they have all the information required (including historic and current) to discharge their duties.
Guidance and refresher training on how to use the on-line board paper portal will be provided to the board to ensure that information can be easily accessed when needed. The use of the on-line ‘reading rooms’ to ensure the most effective use of board papers and reference materials will continue to be used.
Risk and oversight The board will have a greater involvement in monitoring and reviewing the risks affecting the Society and its business and the board.
Improved reporting on the existing and emerging risks will be produced in order to facilitate discussion and challenge from the board. Conduct risk will continue to be a priority for the Risk Committee and the board.
55
Governance
54

Corporate Governance Report
The BoardThe board ensures that we truly live our values every day, delivering ‘Green Heart Experiences’ for our customers, colleagues and members, harnessing the latest technologies and building a business that is sustainably lean and strong. By doing this the board help ensure that LV= will be able to make people ‘Live Confident’.We have a strong, experienced and diverse board with a good balance of skills.
Back row L to R
David BarralDavid Neave James DeanAndy ParsonsFront row L to R
Colin LedlieCaroline BurtonAlan CookRichard Rowney
56 57
Governance

Alan Cook CBE (64) ChairmanDate of appointment: 1 January 2017 (LVFS board), 20 June 2017 (chairman)
Experience: Alan has extensive financial services experience across insurance, banking and investments. Prior to his appointment at LV=, Alan was chairman of the Permanent TSB Group, one of the four leading banks in Ireland, and was senior independent director of Sainsbury’s Bank and on the board of MetLife Europe. Alan also has served as chairman of Irish Life Group in Ireland and the Highways Agency as well as being a non-executive director at the Department of Transport, Financial Ombudsman Service and the Office of Fair Trading. As an executive, he has also been managing director of Post Office Ltd, chief executive officer of National Savings & Investments and chief operating officer for UK and Europe of Prudential Assurance. Alan has also been chairman and is now Patron of ‘Action for ME’, the UK’s leading charity supporting sufferers of ME/CFS.
External appointments: Chairman of the University of Bedfordshire and chairman of Chetwood Financial Ltd.
Committee membership: Chair of the Corporate Governance and Nomination Committee and a member of the Risk, Investment and Remuneration Committees.
Chairman of Liverpool Victoria General Insurance Group Limited and its two regulated subsidiaries with effect from 28 December 2017.
Andy Parsons (53) Group Finance Director Date of appointment: 30 June 2017
Experience: Having held executive positions at several leading financial institutions, Andy’s career in finance has spanned over 25 years. His particular areas of expertise include life and general insurance. Prior to joining LV=, Andy held the roles of finance director, divisional risk officer and more recently longstanding life, pensions and investment director for the insurance business of Lloyds Banking Group from 2012 until 2017. He previously also worked at Friends Life Group, AXA and Zurich Financial Services where he held a number of executive financial roles.
External appointments: Member of Trustee and Finance Group, Oxfam GB.
Committee membership: Member of the Investment Committee and director of various LV= group subsidiaries.
Richard Rowney (47) Chief ExecutiveDate of appointment: 1 March 2010 (LVFS board), 28 July 2016 (chief executive)
Experience: Richard spent 14 years at Barclays Bank holding a number of senior positions across corporate and retail banking including overseeing integration of the Woolwich and Barclays retail banks. Since joining LV= in 2007, Richard has overseen the creation of the operational support areas, including the rebrand to LV= and the in-sourcing of our IT and HR functions. Richard was appointed group chief executive in 2016 and prior to this he had been managing director of life and pensions, appointed in 2010. Richard led the transformation of this business to create one of the UK’s leading protection and retirement specialists, including the acquisition of Wealth Wizards in 2015.
External appointments: Board member of the Association of British Insurers.
Committee membership: Member of the Investment and Corporate Governance and Nomination Committees and a director of various LV= group subsidiaries.
Non-executive director of Liverpool Victoria General Insurance Group Limited and its two regulated subsidiaries.
James Dean (60) Senior IndependentNon-Executive DirectorDate of appointment: 26 July 2012
Experience: James is a chartered accountant and is recognised as an expert in insurance accounting having spent much of his 30 years’ experience in audit and advisory roles. As a senior partner at EY he dealt with clients such as AXA UK PLC, Prudential PLC, Legal & General Group PLC, RSA Insurance Group PLC and Aviva PLC, also serving on boards outside the firm including as chairman of the ICAEW Insurance Committee. He is also a former global IFRS leader for the insurance sector of EY.
External appointments: Chairman of the Stafford Railway Building Society, R.J. Young Properties (Stafford) Ltd and Reigate Grammar School. Non-executive director at Rathbone Brothers plc.
Committee membership: Chairman of the Audit Committee and member of the Risk and Corporate Governance and Nomination Committees. As the senior independent director, James provides a sounding board to the chairman and is available to members if they have concerns which contact through the normal channels of chairman, chief executive and other executive directors has failed to resolve or for which contact is inappropriate.
Caroline Burton (68) Non-Executive DirectorDate of appointment: 9 September 2011
Experience: Caroline has a life insurance background and is a highly experienced figure in the asset management industry having spent 26 years with Guardian Royal Exchange PLC, where she was in charge of investments from 1990 until 1999. She acts as a pensions and business adviser for a number of pension funds and charities and her expertise puts her in good stead to monitor the management of LV=’s assets.
External appointments: Non-executive director of BlackRock Small Companies Investment Trust PLC, member of the appointments committee at Hermes Property Unit trust and advisory work for pension schemes.
Committee membership: Chairman of the Investment Committee and (with effect 20 June 2017) chairman of the Remuneration Committee. Caroline is a member of the Audit and Corporate Governance and Nomination Committees. Caroline was also a non-executive director of LV= general insurance subsidiaries until 28 December 2017.
David Neave (58) Non-Executive DirectorDate of appointment: 1 June 2013
Experience: David has 35 years of experience in the general insurance industry, with a particular specialism in personal lines and technical expertise in a range of functions including underwriting, claims and partnerships. David held various roles at RSA including managing director of corporate partnerships and claims services director for the overall UK business. Subsequently he was managing director of general insurance for the Co-operative Banking Group Ltd, and has been chairman of the Insurance Fraud Bureau and the ABI Financial Crime Committee and a director of the Motor Insurers’ Bureau and the International Co-operative and Mutual Insurance Federation.
External appointments: Non-executive director of Slater & Gordon UK, FirstPort Insurance Services Ltd, the Solicitors Indemnity Fund and a director of Bayleaf Consulting Ltd.
Committee membership: Member of the Risk, Remuneration and Corporate Governance and Nomination Committees.
Non-executive director of Liverpool Victoria General Insurance Group Limited, with effect from 28 December 2017, and its two regulated subsidiaries, since 16 December 2016. Chairman of the Nomination and Remuneration Committee and the Risk Committee for these entities.
David Barral (56) Non-Executive DirectorDate of appointment: 7 March 2016
Experience: David has had a 38 year career in financial services. He joined us from Aviva PLC where he was the chief executive of UK and Ireland life insurance, the largest business unit within the Aviva group. Previous positions include sales director, marketing director and chief operating officer. David brings a mix of strategic, transformation and operational experience with a strong focus on customers, risk and governance. He is a former chairman of the ABI Retirement and Savings Committee.
External appointments: Chairman of Virgin Wines, independent customer champion at Old Mutual Wealth.
Committee membership: Chairman of the Risk Committee and member of the Audit, Investment and Corporate Governance and Nomination Committees.
Non-executive director of Liverpool Victoria General Insurance Group Limited and its two regulated subsidiaries with effect from 28 December 2017. Chairman of the Audit Committee for these entities.
Colin Ledlie (51) Non-Executive DirectorDate of appointment: 1 August 2017
Experience: Colin is an experienced non-executive director, actuary and risk professional with over 30 years’ experience working in the insurance industry. Colin previously held a number of senior executive roles at Standard Life PLC, including chief actuary and chief risk officer.
External appointments: Non-executive director of ReAssure, BUPA and the National Records of Scotland. Chair of the Institute and Faculty of Actuaries’ Finance and Investment Board.
Committee membership: Member of the Audit, Risk and With-profits Committees.
58 59
Governance
LV= Annual Report 2017 Corporate Governance Report
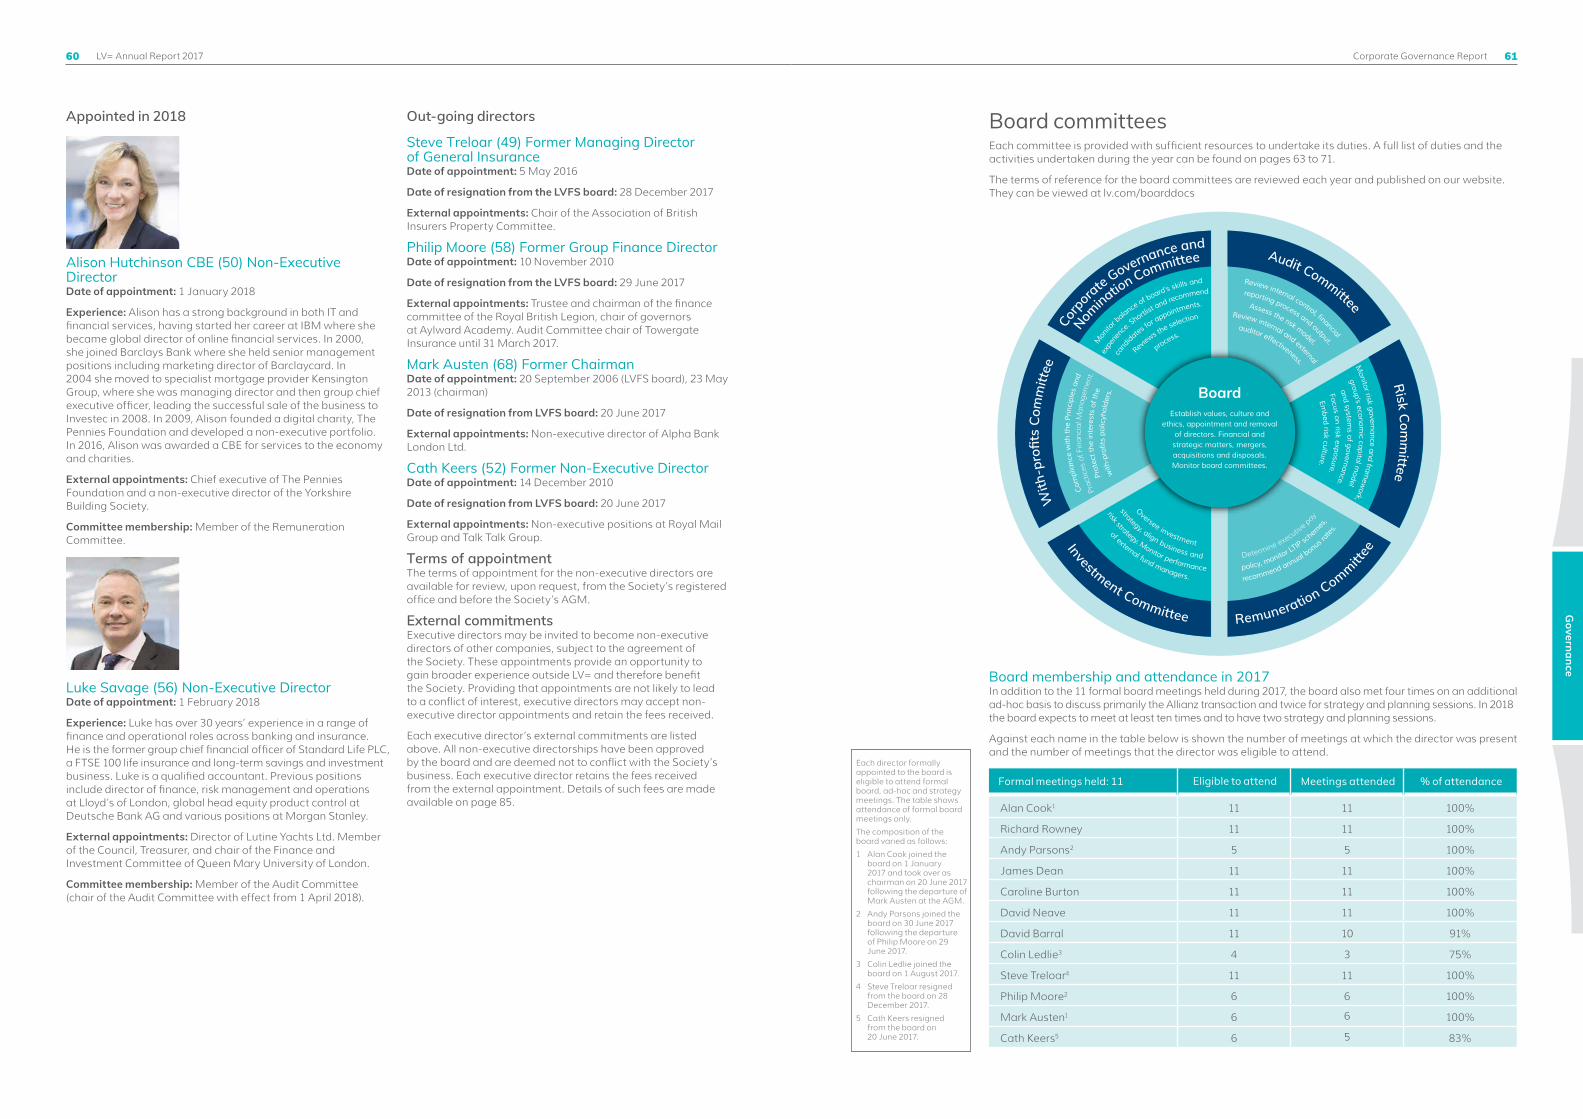
Investment Committee Remuneration Committee
With
-profit
s Co
mm
ittee
Audit Committee
Risk Comm
ittee
Corp
orate Governance and
Nom
ination Committee
Com
plia
nce
with
the
Prin
cipl
es a
nd
Monitor risk governance and fram
ework,
Review internal control, financial
Mon
ito
r balance of board’s skills and
Prac
tices
of F
inan
cial
Man
agem
ent. group’s econom
ic capital model
reporting process and output.
expe
rienc
e. Shortlis
t and recommend
Prot
ect t
he in
tere
sts
of th
e and systems of governance.
Assess the risk model.
cand
idates
for appointments.
with
-pro
fits
polic
yhol
ders
. Focus on risk exposure.
Review internal and external
Review
s the selection
of external fund managers. recommend annual bonus r
ates
.
risk strategy. Monitor performance policy, monitor LTIP sc
hem
es,
strategy, align business and Determine executiv
e p
ay Oversee investment
Embed risk culture.
auditor effectiveness.
process.
BoardEstablish values, culture and
ethics, appointment and removal of directors. Financial and
strategic matters, mergers, acquisitions and disposals. Monitor board committees.
Board committeesEach committee is provided with sufficient resources to undertake its duties. A full list of duties and the activities undertaken during the year can be found on pages 63 to 71.
The terms of reference for the board committees are reviewed each year and published on our website. They can be viewed at lv.com/boarddocs
Appointed in 2018
Alison Hutchinson CBE (50) Non-Executive DirectorDate of appointment: 1 January 2018
Experience: Alison has a strong background in both IT and financial services, having started her career at IBM where she became global director of online financial services. In 2000, she joined Barclays Bank where she held senior management positions including marketing director of Barclaycard. In 2004 she moved to specialist mortgage provider Kensington Group, where she was managing director and then group chief executive officer, leading the successful sale of the business to Investec in 2008. In 2009, Alison founded a digital charity, The Pennies Foundation and developed a non-executive portfolio. In 2016, Alison was awarded a CBE for services to the economy and charities.
External appointments: Chief executive of The Pennies Foundation and a non-executive director of the Yorkshire Building Society.
Committee membership: Member of the Remuneration Committee.
Luke Savage (56) Non-Executive DirectorDate of appointment: 1 February 2018
Experience: Luke has over 30 years’ experience in a range of finance and operational roles across banking and insurance. He is the former group chief financial officer of Standard Life PLC, a FTSE 100 life insurance and long-term savings and investment business. Luke is a qualified accountant. Previous positions include director of finance, risk management and operations at Lloyd’s of London, global head equity product control at Deutsche Bank AG and various positions at Morgan Stanley.
External appointments: Director of Lutine Yachts Ltd. Member of the Council, Treasurer, and chair of the Finance and Investment Committee of Queen Mary University of London.
Committee membership: Member of the Audit Committee (chair of the Audit Committee with effect from 1 April 2018).
Out-going directors
Steve Treloar (49) Former Managing Director of General InsuranceDate of appointment: 5 May 2016
Date of resignation from the LVFS board: 28 December 2017
External appointments: Chair of the Association of British Insurers Property Committee.
Philip Moore (58) Former Group Finance DirectorDate of appointment: 10 November 2010
Date of resignation from the LVFS board: 29 June 2017
External appointments: Trustee and chairman of the finance committee of the Royal British Legion, chair of governors at Aylward Academy. Audit Committee chair of Towergate Insurance until 31 March 2017.
Mark Austen (68) Former ChairmanDate of appointment: 20 September 2006 (LVFS board), 23 May 2013 (chairman)
Date of resignation from LVFS board: 20 June 2017
External appointments: Non-executive director of Alpha Bank London Ltd.
Cath Keers (52) Former Non-Executive DirectorDate of appointment: 14 December 2010
Date of resignation from LVFS board: 20 June 2017
External appointments: Non-executive positions at Royal Mail Group and Talk Talk Group.
Terms of appointmentThe terms of appointment for the non-executive directors are available for review, upon request, from the Society’s registered office and before the Society’s AGM.
External commitmentsExecutive directors may be invited to become non-executive directors of other companies, subject to the agreement of the Society. These appointments provide an opportunity to gain broader experience outside LV= and therefore benefit the Society. Providing that appointments are not likely to lead to a conflict of interest, executive directors may accept non-executive director appointments and retain the fees received.
Each executive director’s external commitments are listed above. All non-executive directorships have been approved by the board and are deemed not to conflict with the Society’s business. Each executive director retains the fees received from the external appointment. Details of such fees are made available on page 85.
Board membership and attendance in 2017In addition to the 11 formal board meetings held during 2017, the board also met four times on an additional ad-hoc basis to discuss primarily the Allianz transaction and twice for strategy and planning sessions. In 2018 the board expects to meet at least ten times and to have two strategy and planning sessions.
Against each name in the table below is shown the number of meetings at which the director was present and the number of meetings that the director was eligible to attend.
Formal meetings held: 11 Eligible to attend Meetings attended % of attendance
Alan Cook1 11 11 100%
Richard Rowney 11 11 100%
Andy Parsons2 5 5 100%
James Dean 11 11 100%
Caroline Burton 11 11 100%
David Neave 11 11 100%
David Barral 11 10 91%
Colin Ledlie3 4 3 75%
Steve Treloar4 11 11 100%
Philip Moore2 6 6 100%
Mark Austen1 6 6 100%
Cath Keers5 6 5 83%
Each director formally appointed to the board is eligible to attend formal board, ad-hoc and strategy meetings. The table shows attendance of formal board meetings only.
The composition of the board varied as follows:
1 Alan Cook joined the board on 1 January 2017 and took over as chairman on 20 June 2017 following the departure of Mark Austen at the AGM.
2 Andy Parsons joined the board on 30 June 2017 following the departure of Philip Moore on 29 June 2017.
3 Colin Ledlie joined the board on 1 August 2017.
4 Steve Treloar resigned from the board on 28 December 2017.
5 Cath Keers resigned from the board on 20 June 2017.
60 61
Governance
LV= Annual Report 2017 Corporate Governance Report
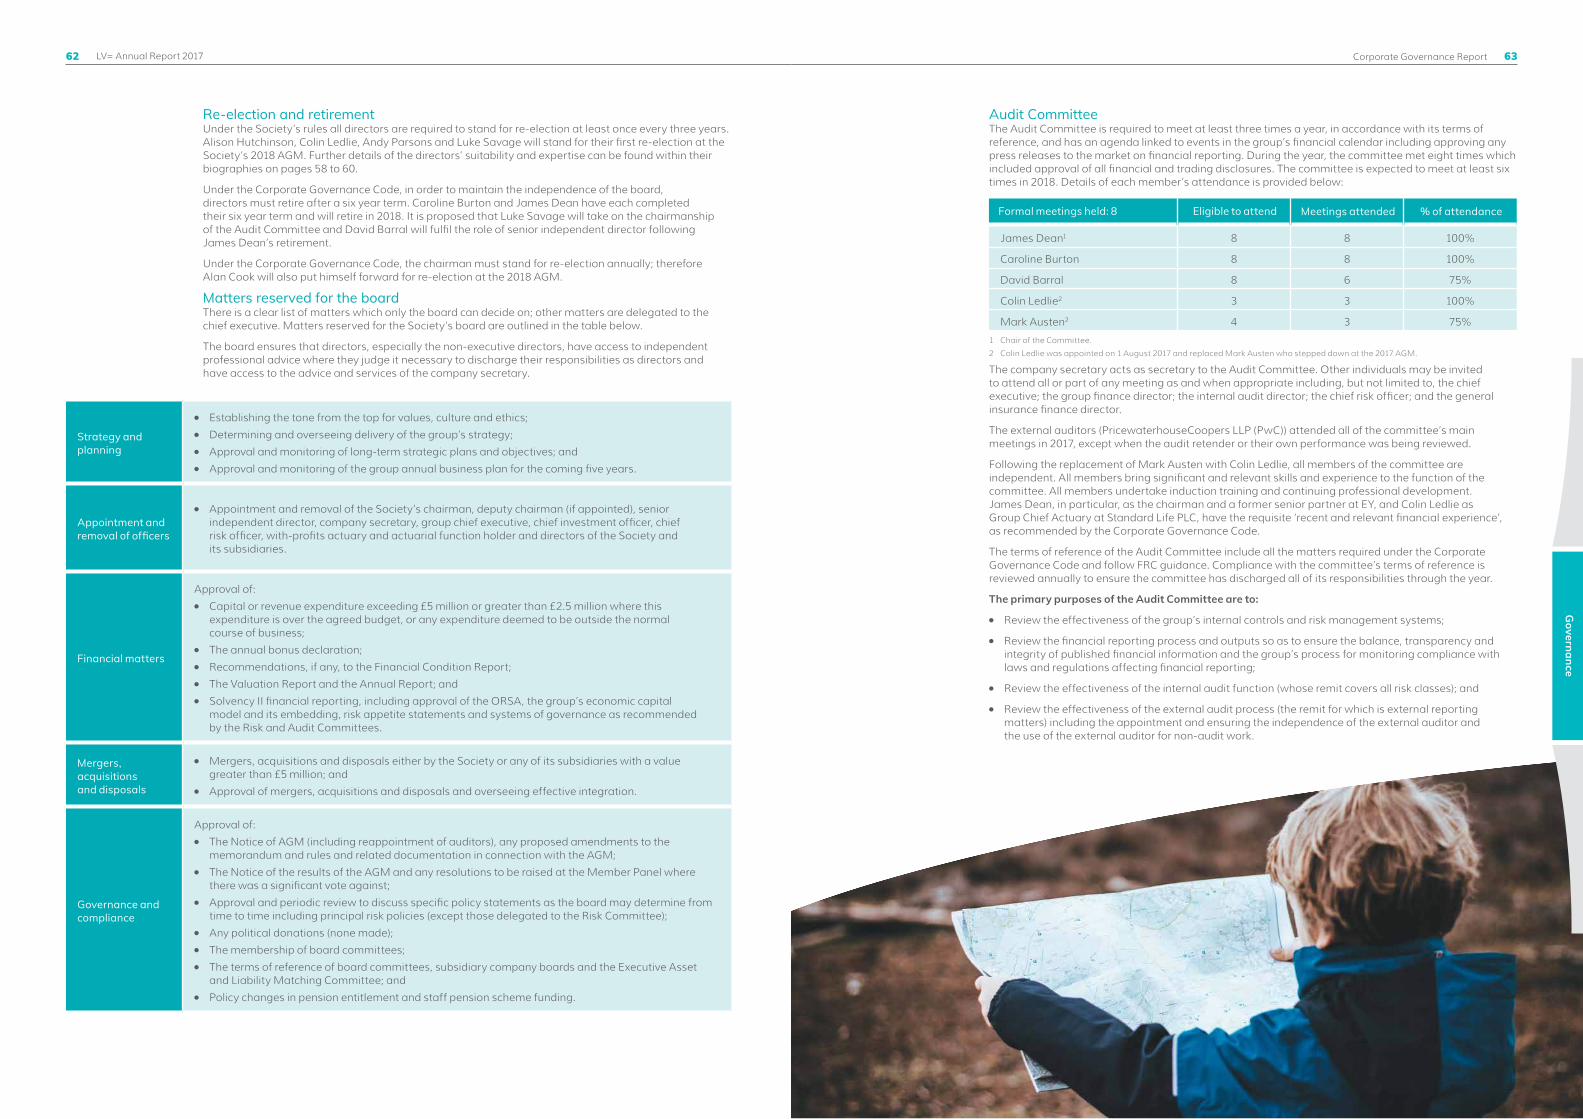
Re-election and retirementUnder the Society’s rules all directors are required to stand for re-election at least once every three years. Alison Hutchinson, Colin Ledlie, Andy Parsons and Luke Savage will stand for their first re-election at the Society’s 2018 AGM. Further details of the directors’ suitability and expertise can be found within their biographies on pages 58 to 60.
Under the Corporate Governance Code, in order to maintain the independence of the board, directors must retire after a six year term. Caroline Burton and James Dean have each completed their six year term and will retire in 2018. It is proposed that Luke Savage will take on the chairmanship of the Audit Committee and David Barral will fulfil the role of senior independent director following James Dean’s retirement.
Under the Corporate Governance Code, the chairman must stand for re-election annually; therefore Alan Cook will also put himself forward for re-election at the 2018 AGM.
Matters reserved for the boardThere is a clear list of matters which only the board can decide on; other matters are delegated to the chief executive. Matters reserved for the Society’s board are outlined in the table below.
The board ensures that directors, especially the non-executive directors, have access to independent professional advice where they judge it necessary to discharge their responsibilities as directors and have access to the advice and services of the company secretary.
Audit CommitteeThe Audit Committee is required to meet at least three times a year, in accordance with its terms of reference, and has an agenda linked to events in the group’s financial calendar including approving any press releases to the market on financial reporting. During the year, the committee met eight times which included approval of all financial and trading disclosures. The committee is expected to meet at least six times in 2018. Details of each member’s attendance is provided below:
Formal meetings held: 8 Eligible to attend Meetings attended % of attendance
James Dean1 8 8 100%
Caroline Burton 8 8 100%
David Barral 8 6 75%
Colin Ledlie2 3 3 100%
Mark Austen2 4 3 75%
1 Chair of the Committee.
2 Colin Ledlie was appointed on 1 August 2017 and replaced Mark Austen who stepped down at the 2017 AGM.
The company secretary acts as secretary to the Audit Committee. Other individuals may be invited to attend all or part of any meeting as and when appropriate including, but not limited to, the chief executive; the group finance director; the internal audit director; the chief risk officer; and the general insurance finance director.
The external auditors (PricewaterhouseCoopers LLP (PwC)) attended all of the committee’s main meetings in 2017, except when the audit retender or their own performance was being reviewed.
Following the replacement of Mark Austen with Colin Ledlie, all members of the committee are independent. All members bring significant and relevant skills and experience to the function of the committee. All members undertake induction training and continuing professional development. James Dean, in particular, as the chairman and a former senior partner at EY, and Colin Ledlie as Group Chief Actuary at Standard Life PLC, have the requisite ‘recent and relevant financial experience’, as recommended by the Corporate Governance Code.
The terms of reference of the Audit Committee include all the matters required under the Corporate Governance Code and follow FRC guidance. Compliance with the committee’s terms of reference is reviewed annually to ensure the committee has discharged all of its responsibilities through the year.
The primary purposes of the Audit Committee are to:
●● Review the effectiveness of the group’s internal controls and risk management systems;
●● Review the financial reporting process and outputs so as to ensure the balance, transparency and integrity of published financial information and the group’s process for monitoring compliance with laws and regulations affecting financial reporting;
●● Review the effectiveness of the internal audit function (whose remit covers all risk classes); and
●● Review the effectiveness of the external audit process (the remit for which is external reporting matters) including the appointment and ensuring the independence of the external auditor and the use of the external auditor for non-audit work.
Strategy and planning
●● Establishing the tone from the top for values, culture and ethics;●● Determining and overseeing delivery of the group’s strategy;●● Approval and monitoring of long-term strategic plans and objectives; and●● Approval and monitoring of the group annual business plan for the coming five years.
Appointment and removal of officers
●● Appointment and removal of the Society’s chairman, deputy chairman (if appointed), senior independent director, company secretary, group chief executive, chief investment officer, chief risk officer, with-profits actuary and actuarial function holder and directors of the Society and its subsidiaries.
Financial matters
Approval of:●● Capital or revenue expenditure exceeding £5 million or greater than £2.5 million where this
expenditure is over the agreed budget, or any expenditure deemed to be outside the normal course of business;
●● The annual bonus declaration;●● Recommendations, if any, to the Financial Condition Report;●● The Valuation Report and the Annual Report; and●● Solvency II financial reporting, including approval of the ORSA, the group’s economic capital
model and its embedding, risk appetite statements and systems of governance as recommended by the Risk and Audit Committees.
Mergers, acquisitions and disposals
●● Mergers, acquisitions and disposals either by the Society or any of its subsidiaries with a value greater than £5 million; and
●● Approval of mergers, acquisitions and disposals and overseeing effective integration.
Governance and compliance
Approval of:●● The Notice of AGM (including reappointment of auditors), any proposed amendments to the
memorandum and rules and related documentation in connection with the AGM;●● The Notice of the results of the AGM and any resolutions to be raised at the Member Panel where
there was a significant vote against;●● Approval and periodic review to discuss specific policy statements as the board may determine from
time to time including principal risk policies (except those delegated to the Risk Committee);●● Any political donations (none made);●● The membership of board committees;●● The terms of reference of board committees, subsidiary company boards and the Executive Asset
and Liability Matching Committee; and ●● Policy changes in pension entitlement and staff pension scheme funding.
62 63
Governance
LV= Annual Report 2017 Corporate Governance Report
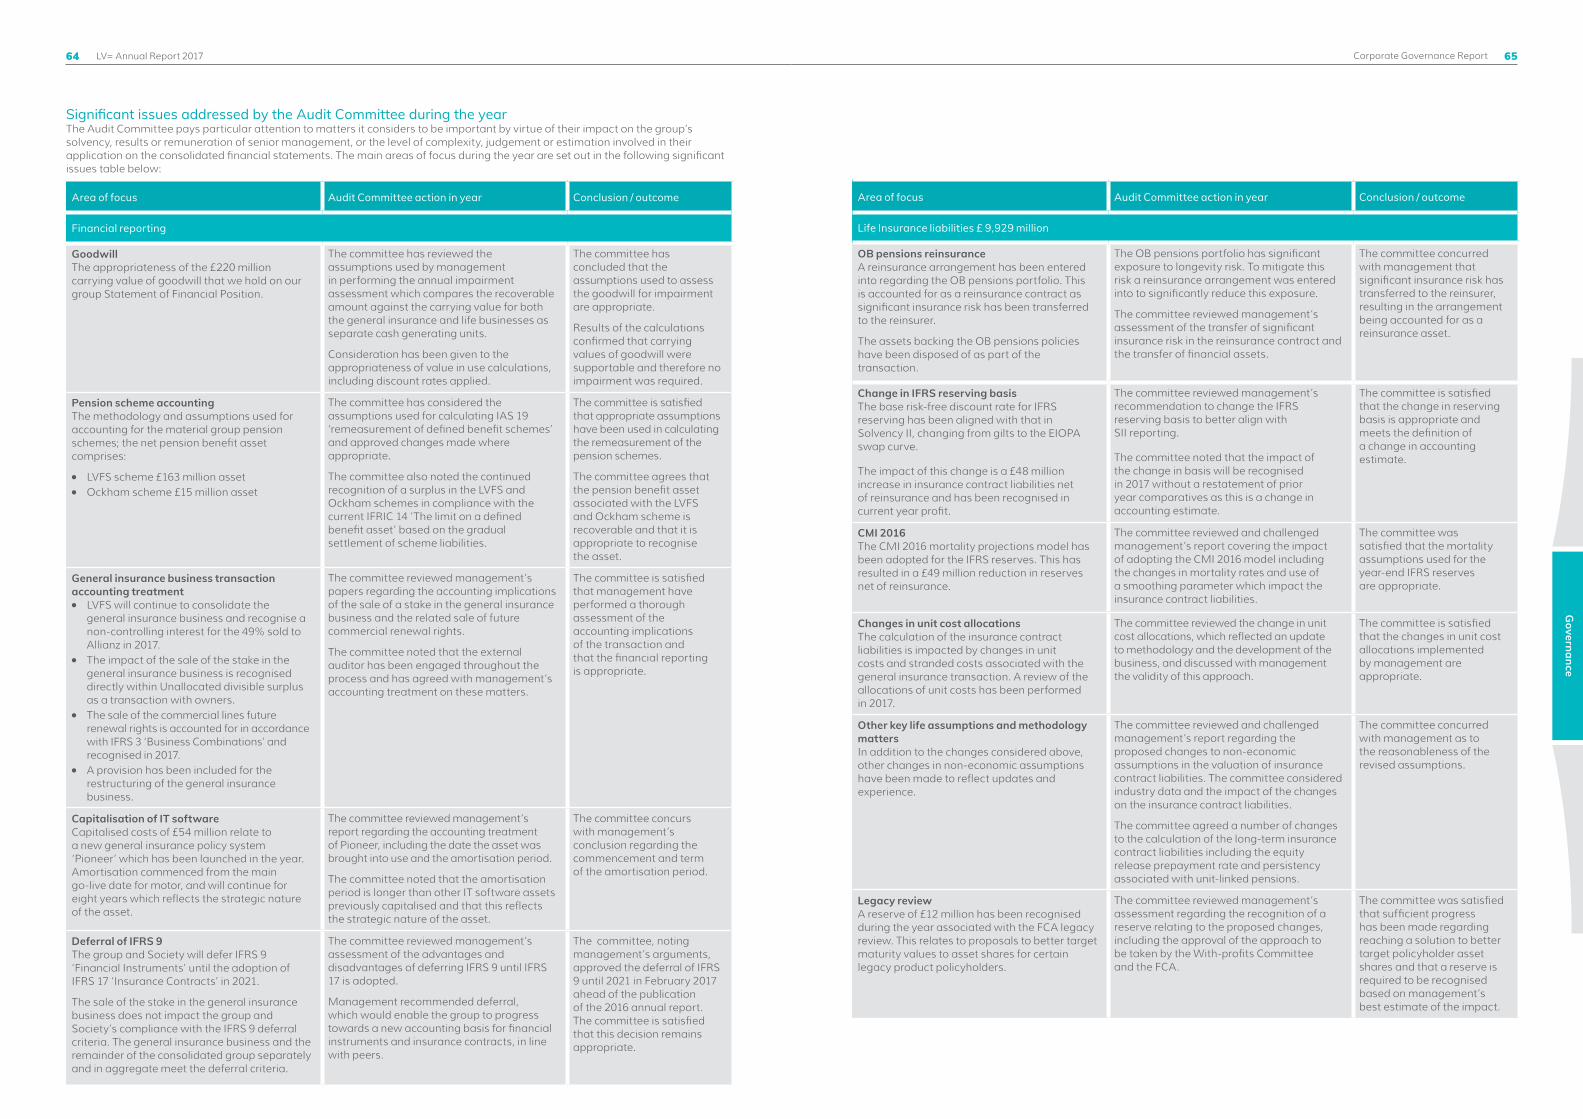
Significant issues addressed by the Audit Committee during the yearThe Audit Committee pays particular attention to matters it considers to be important by virtue of their impact on the group’s solvency, results or remuneration of senior management, or the level of complexity, judgement or estimation involved in their application on the consolidated financial statements. The main areas of focus during the year are set out in the following significant issues table below:
Area of focus Audit Committee action in year Conclusion / outcome
Financial reporting
GoodwillThe appropriateness of the £220 million carrying value of goodwill that we hold on our group Statement of Financial Position.
The committee has reviewed the assumptions used by management in performing the annual impairment assessment which compares the recoverable amount against the carrying value for both the general insurance and life businesses as separate cash generating units.
Consideration has been given to the appropriateness of value in use calculations, including discount rates applied.
The committee has concluded that the assumptions used to assess the goodwill for impairment are appropriate.
Results of the calculations confirmed that carrying values of goodwill were supportable and therefore no impairment was required.
Pension scheme accountingThe methodology and assumptions used for accounting for the material group pension schemes; the net pension benefit asset comprises:
●● LVFS scheme £163 million asset●● Ockham scheme £15 million asset
The committee has considered the assumptions used for calculating IAS 19 ‘remeasurement of defined benefit schemes’ and approved changes made where appropriate.
The committee also noted the continued recognition of a surplus in the LVFS and Ockham schemes in compliance with the current IFRIC 14 ‘The limit on a defined benefit asset’ based on the gradual settlement of scheme liabilities.
The committee is satisfied that appropriate assumptions have been used in calculating the remeasurement of the pension schemes.
The committee agrees that the pension benefit asset associated with the LVFS and Ockham scheme is recoverable and that it is appropriate to recognise the asset.
General insurance business transaction accounting treatment●● LVFS will continue to consolidate the
general insurance business and recognise a non-controlling interest for the 49% sold to Allianz in 2017.
●● The impact of the sale of the stake in the general insurance business is recognised directly within Unallocated divisible surplus as a transaction with owners.
●● The sale of the commercial lines future renewal rights is accounted for in accordance with IFRS 3 ‘Business Combinations’ and recognised in 2017.
●● A provision has been included for the restructuring of the general insurance business.
The committee reviewed management’s papers regarding the accounting implications of the sale of a stake in the general insurance business and the related sale of future commercial renewal rights.
The committee noted that the external auditor has been engaged throughout the process and has agreed with management’s accounting treatment on these matters.
The committee is satisfied that management have performed a thorough assessment of the accounting implications of the transaction and that the financial reporting is appropriate.
Capitalisation of IT softwareCapitalised costs of £54 million relate to a new general insurance policy system ‘Pioneer’ which has been launched in the year. Amortisation commenced from the main go-live date for motor, and will continue for eight years which reflects the strategic nature of the asset.
The committee reviewed management’s report regarding the accounting treatment of Pioneer, including the date the asset was brought into use and the amortisation period.
The committee noted that the amortisation period is longer than other IT software assets previously capitalised and that this reflects the strategic nature of the asset.
The committee concurs with management’s conclusion regarding the commencement and term of the amortisation period.
Deferral of IFRS 9The group and Society will defer IFRS 9 ‘Financial Instruments’ until the adoption of IFRS 17 ‘Insurance Contracts’ in 2021.
The sale of the stake in the general insurance business does not impact the group and Society’s compliance with the IFRS 9 deferral criteria. The general insurance business and the remainder of the consolidated group separately and in aggregate meet the deferral criteria.
The committee reviewed management’s assessment of the advantages and disadvantages of deferring IFRS 9 until IFRS 17 is adopted.
Management recommended deferral, which would enable the group to progress towards a new accounting basis for financial instruments and insurance contracts, in line with peers.
The committee, noting management’s arguments, approved the deferral of IFRS 9 until 2021 in February 2017 ahead of the publication of the 2016 annual report. The committee is satisfied that this decision remains appropriate.
Area of focus Audit Committee action in year Conclusion / outcome
Life Insurance liabilities £ 9,929 million
OB pensions reinsuranceA reinsurance arrangement has been entered into regarding the OB pensions portfolio. This is accounted for as a reinsurance contract as significant insurance risk has been transferred to the reinsurer.
The assets backing the OB pensions policies have been disposed of as part of the transaction.
The OB pensions portfolio has significant exposure to longevity risk. To mitigate this risk a reinsurance arrangement was entered into to significantly reduce this exposure.
The committee reviewed management’s assessment of the transfer of significant insurance risk in the reinsurance contract and the transfer of financial assets.
The committee concurred with management that significant insurance risk has transferred to the reinsurer, resulting in the arrangement being accounted for as a reinsurance asset.
Change in IFRS reserving basisThe base risk-free discount rate for IFRS reserving has been aligned with that in Solvency II, changing from gilts to the EIOPA swap curve.
The impact of this change is a £48 million increase in insurance contract liabilities net of reinsurance and has been recognised in current year profit.
The committee reviewed management’s recommendation to change the IFRS reserving basis to better align with SII reporting.
The committee noted that the impact of the change in basis will be recognised in 2017 without a restatement of prior year comparatives as this is a change in accounting estimate.
The committee is satisfied that the change in reserving basis is appropriate and meets the definition of a change in accounting estimate.
CMI 2016The CMI 2016 mortality projections model has been adopted for the IFRS reserves. This has resulted in a £49 million reduction in reserves net of reinsurance.
The committee reviewed and challenged management’s report covering the impact of adopting the CMI 2016 model including the changes in mortality rates and use of a smoothing parameter which impact the insurance contract liabilities.
The committee was satisfied that the mortality assumptions used for the year-end IFRS reserves are appropriate.
Changes in unit cost allocationsThe calculation of the insurance contract liabilities is impacted by changes in unit costs and stranded costs associated with the general insurance transaction. A review of the allocations of unit costs has been performed in 2017.
The committee reviewed the change in unit cost allocations, which reflected an update to methodology and the development of the business, and discussed with management the validity of this approach.
The committee is satisfied that the changes in unit cost allocations implemented by management are appropriate.
Other key life assumptions and methodology mattersIn addition to the changes considered above, other changes in non-economic assumptions have been made to reflect updates and experience.
The committee reviewed and challenged management’s report regarding the proposed changes to non-economic assumptions in the valuation of insurance contract liabilities. The committee considered industry data and the impact of the changes on the insurance contract liabilities.
The committee agreed a number of changes to the calculation of the long-term insurance contract liabilities including the equity release prepayment rate and persistency associated with unit-linked pensions.
The committee concurred with management as to the reasonableness of the revised assumptions.
Legacy reviewA reserve of £12 million has been recognised during the year associated with the FCA legacy review. This relates to proposals to better target maturity values to asset shares for certain legacy product policyholders.
The committee reviewed management’s assessment regarding the recognition of a reserve relating to the proposed changes, including the approval of the approach to be taken by the With-profits Committee and the FCA.
The committee was satisfied that sufficient progress has been made regarding reaching a solution to better target policyholder asset shares and that a reserve is required to be recognised based on management’s best estimate of the impact.
64 65
Governance
LV= Annual Report 2017 Corporate Governance Report

Area of focus Audit Committee action in year Conclusion / outcome
General Insurance liabilities £1,643 million
General insurance reserve marginThe reserving margin on top of management’s best estimate liabilities for IFRS has been increased from a flat 2.5% to being aligned to the 75th percentile of the reserve risk distribution in the year to reflect the additional uncertainty in the market.
The committee reviewed management’s analysis of the reserving margin which demonstrated that the margin should be increased.
The committee noted that the previous margin was lower than others in the industry.
The committee approved the increase in the general insurance reserving margin to be aligned to the 75th percentile of the reserve risk distribution and this is reflected in the year-end reserves.
Ogden discount rateIn March 2017 the Ogden discount rate used in valuing lump sum personal injury settlements was reduced from 2.5% to minus 0.75%. Subsequently on 20 March 2018 the Government put forward the Civil Liability Bill which seeks to have the discount rate established on the basis of a “low risk diversified portfolio” rather than using index linked gilts as a proxy for a “very low risk investment strategy”. If enacted this would be expected to result in an increase in the rate.
While the draft legislation has been published, it and the new framework, have not yet been enacted; therefore the Ogden discount rate used in the calculation of our reserves remains at minus 0.75%.
The committee reviewed and agreed with the details outlined in the general insurance reserving report, including the rationale for maintaining the current Ogden discount rate within the best estimate.
The committee concurs with management that lump sum personal injury settlements should continue to use the Ogden discount rate of minus 0.75% and this is reflected in our year-end reserves.
Solvency II
Withdrawal of Internal Model applicationThe group withdrew its Internal Model application due to the significant change in the group’s risk profile associated with the transaction with Allianz and other capital initiatives, such as reinsurance of the OB pensions portfolio. The transaction with Allianz involved selling a 49% stake in our general insurance business in 2017 and includes a forward contract for Allianz to purchase a further 20.9% in 2019.
The committee discussed the impact of the significant ongoing changes to the risk profile of the group on the Internal Model application.
The committee agreed with management that the group should withdraw its Internal Model application.
Capital impact of general insurance business transactionThe sale of the stake in the general insurance business has contributed a 51 percentage point increase in the Capital Coverage Ratio (CCR) of the group.
The committee reviewed external reports commissioned to assess the cash and capital impact of the proposed sale of a stake in the general insurance business as part of the review of strategic options available to the group.
The committee has reviewed management’s calculations of the CCR, including the beneficial impact of the sale of the stake in the general insurance business.
The committee approved the Annual Report including the regulatory capital results.
Impact of Transitional Measures on Technical Provisions (TMTP)A recalculation of TMTP has been performed at 31 December 2017 and is included in the calculation of the regulatory capital. This has reduced the group’s CCR by 28 percentage points.
The committee has reviewed and challenged management’s proposed TMTP recalculation methodology.
The committee has reviewed the calculations of the CCR, including the adverse impact of the recalculation of TMTP.
The committee was satisfied with the methodology used by management in recalculating TMTP.
Group Solvency Financial Condition Report (SFCR)The group filed the 2016 SFCR during the year, which is the annual narrative Solvency II Pillar 3 reporting.
The committee reviewed the 2016 group SFCR produced by management for external reporting, noting that it was a single group SFCR including all relevant entities.
The committee recommended the SFCR to the board and Disclosure Committee for public disclosure.
Summary of key activities during 2017 by which the Audit Committee discharged its responsibilities:Financial reporting ●● Analysed and scrutinised the key accounting policies,
judgements, estimates and actuarial assumptions with management, the external auditors and the chief actuary;
●● Reviewed procedures for dealing with any complaints regarding accounting, reporting, internal control or auditing matters;
●● Considered management’s review of the viability and going concern status of the group, ensuring that appropriate capital and liquid assets are in place to allow the group results to be reported on a going concern basis;
●● Monitored the financial results communicated to members, including the Annual Report;
●● Reviewed and recommended all external financial reporting for the Society (including press releases and any interim announcements put onto the regulatory news service of the London Stock Exchange) to the board (or the Disclosure Committee) together with supporting narrative, ensuring estimates, judgements and reporting issues are considered so that there is appropriate balance, transparency and integrity of information contained in the Annual Report; and
●● At the request of the board, the committee considered whether the 2017 Annual Report was fair, balanced and understandable and whether it provided the necessary information for stakeholders to assess LV=’s position, performance, business model and strategy. In reviewing the Annual Report the Audit Committee has concluded that this was the case.
Internal audit●● Periodically reviewing the internal audit plans for 2017 to
ensure they reflected the group’s priorities, plans and risk profiles, approving internal audit’s plans on a quarterly basis;
●● Considering and approving the internal audit plan for 2018, this being derived from a risk-based assessment of the business and a review against the group’s risk profiles;
●● Receiving update reports from the internal audit director as to the effectiveness of the governance, risk management and internal control framework within the group;
●● Receiving a summary of assurance over significant change initiatives including Pioneer, the RDP (Risk Development Programme) and the setup of the general insurance transaction with Allianz;
●● Receiving updates on ongoing issues, significant findings and the adequacy of remediation activity, and having access to all internal audit reports;
●● Considering whether internal audit’s budget, together with changes to the budget agreed during the year, was sufficient to allow internal audit to deliver the plan;
●● Approving updates to the audit charter, (the charter being available on our external website);
●● Confirming that the internal audit director’s independence has been maintained;
Taking into account how resource challenges have been managed, the positive independent feedback from external audit and the regulators, and the views of executive management when assessing that the internal audit function was performing effectively.
Internal controls●● Received the annual attestation and associated exception
report regarding the effectiveness of the risk management system and controls being operated (for more details on this process see page 40); and
●● Reviewed the arrangements through which employees can raise concerns about possible irregularities relating to financial reporting or other matters including reviewing all whistleblowing reports.
Solvency II●● Reviewed and recommended all Solvency II external financial
reporting for the group including the release of the Solvency Financial Condition Report.
●● Review and challenge of the annual regulatory capital calculations, including the methodology associated with a recalculation of TMTP and the interaction with the Financial Resource Requirement (FRR) test.
●● Delegated to the chief executive and group finance director the approval of the quarterly regulatory capital submissions to the PRA.
External auditEffectiveness of the external auditor The committee reviewed an evaluation of the effectiveness of the external auditor, which was prepared by internal audit using input from across the group. Key stakeholders involved in the 2016 year-end audit process were interviewed and/ or completed a questionnaire to evaluate the effectiveness of the external auditor’s processes and key individuals, and also to identify opportunities to enhance the effectiveness and added value from the external auditor. Areas assessed were: expertise, communication, team, and delivery. The committee concluded that the external audit was effective.
Audit tenderIn last year’s Annual Report, the group announced its intention to launch a competitive audit tender process during 2017, in response to changes in UK and EU legislation requiring that the external audit contract be put out to tender at least once every ten years and allowing re-appointment of the incumbent auditor for a further ten years. PwC have been the group’s auditor since 2008.
During the year, the committee had oversight and responsibility for carrying out the tender for external audit services.
The process ●● A selection panel was created, led by the chair of the
Audit Committee and made up of one other member of the Audit Committee and the internal audit director. Three senior finance management representatives were also in attendance;
●● Three audit firms reached the final stage of the tender process, one of which was a “mid-tier” audit firm;
●● There was an opportunity for the tendering firms to meet with key LV= executives relevant to the audit and the chair of the Audit Committee, who were available to answer questions relating to the audit itself and matters arising from the data room. Selection panel members received detailed responses from each firm to a formal request for proposal;
●● Each firm delivered a presentation to the selection panel during which questions were raised by the panel and each presentation was debated and evaluated immediately afterwards and scored against pre-defined selection criteria which included: understanding of our business and risks; experience and fit of the lead partner; senior audit team capability; approach to ensuring audit quality; transition approach; and value provided from the audit.
The outcomeHaving taken into account each of the selection criteria and the quality of the presentations, the selection panel unanimously agreed to propose to the Audit Committee and in turn the committee agreed to propose to the board that PwC be re-appointed as statutory auditor following completion of the 2017 year-end process and that this appointment would be subject to member approval at the AGM in June 2018. The committee would like to thank each firm for their participation in the tender process.
66 67
Governance
LV= Annual Report 2017 Corporate Governance Report
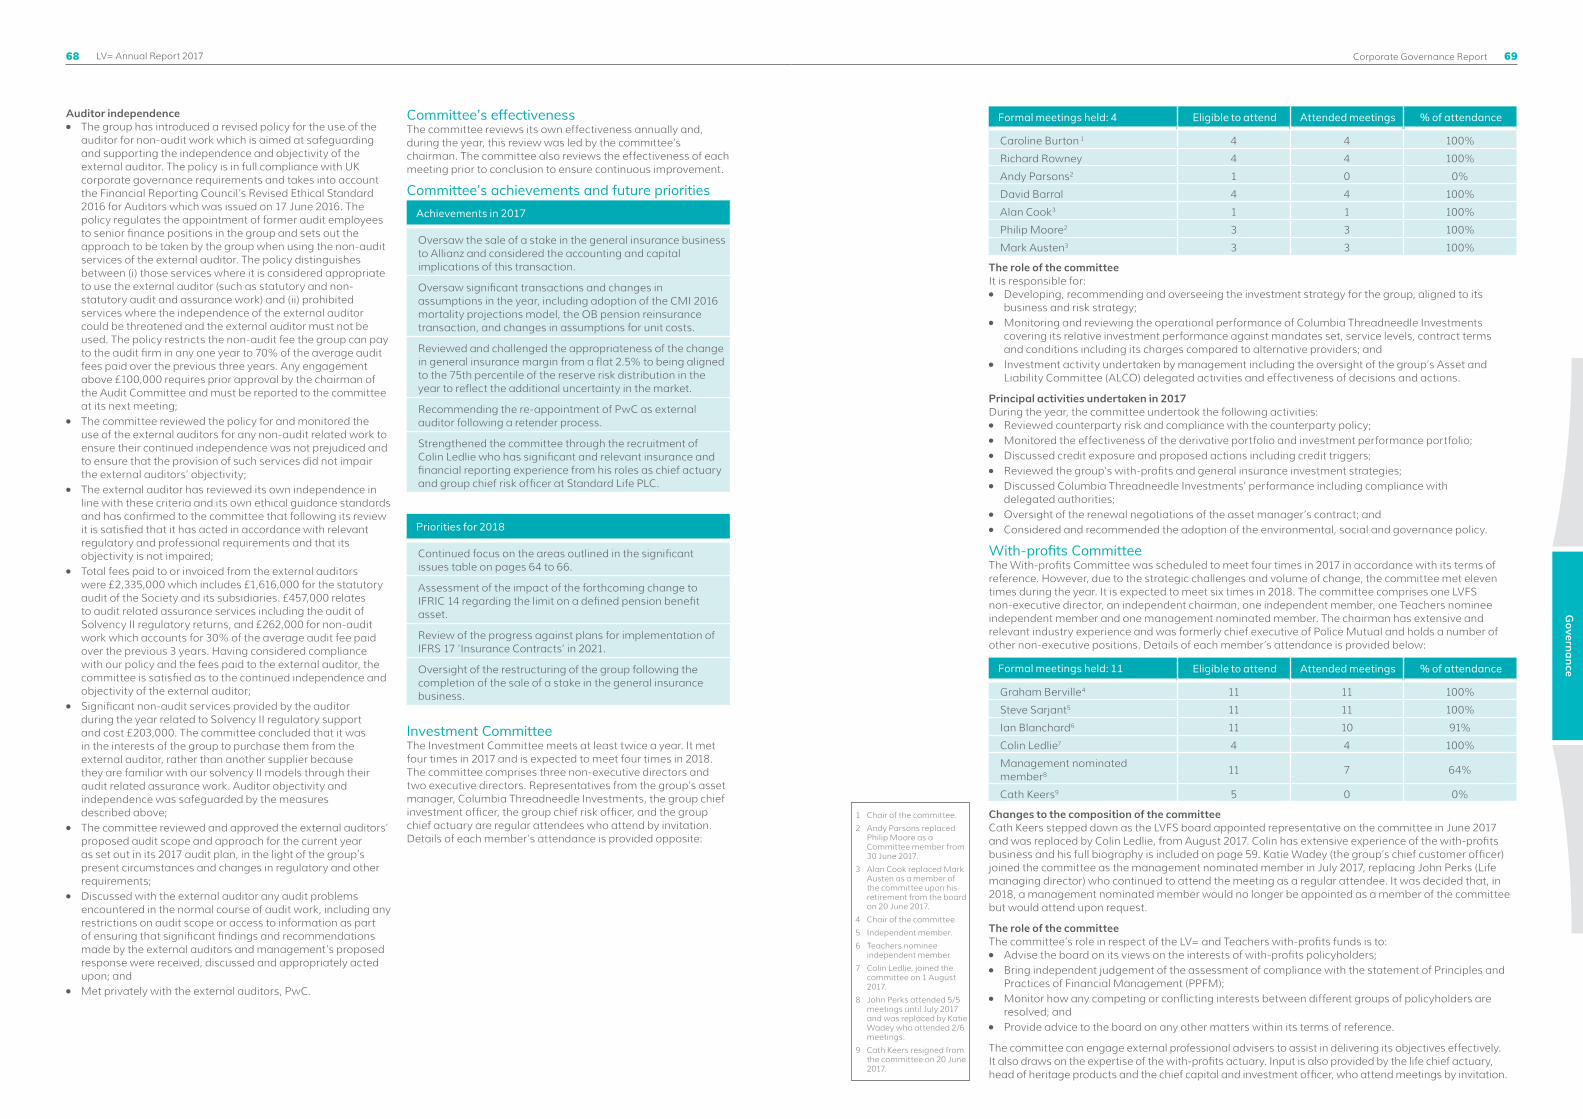
Auditor independence●● The group has introduced a revised policy for the use of the
auditor for non-audit work which is aimed at safeguarding and supporting the independence and objectivity of the external auditor. The policy is in full compliance with UK corporate governance requirements and takes into account the Financial Reporting Council’s Revised Ethical Standard 2016 for Auditors which was issued on 17 June 2016. The policy regulates the appointment of former audit employees to senior finance positions in the group and sets out the approach to be taken by the group when using the non-audit services of the external auditor. The policy distinguishes between (i) those services where it is considered appropriate to use the external auditor (such as statutory and non-statutory audit and assurance work) and (ii) prohibited services where the independence of the external auditor could be threatened and the external auditor must not be used. The policy restricts the non-audit fee the group can pay to the audit firm in any one year to 70% of the average audit fees paid over the previous three years. Any engagement above £100,000 requires prior approval by the chairman of the Audit Committee and must be reported to the committee at its next meeting;
●● The committee reviewed the policy for and monitored the use of the external auditors for any non-audit related work to ensure their continued independence was not prejudiced and to ensure that the provision of such services did not impair the external auditors’ objectivity;
●● The external auditor has reviewed its own independence in line with these criteria and its own ethical guidance standards and has confirmed to the committee that following its review it is satisfied that it has acted in accordance with relevant regulatory and professional requirements and that its objectivity is not impaired;
●● Total fees paid to or invoiced from the external auditors were £2,335,000 which includes £1,616,000 for the statutory audit of the Society and its subsidiaries. £457,000 relates to audit related assurance services including the audit of Solvency II regulatory returns, and £262,000 for non-audit work which accounts for 30% of the average audit fee paid over the previous 3 years. Having considered compliance with our policy and the fees paid to the external auditor, the committee is satisfied as to the continued independence and objectivity of the external auditor;
●● Significant non-audit services provided by the auditor during the year related to Solvency II regulatory support and cost £203,000. The committee concluded that it was in the interests of the group to purchase them from the external auditor, rather than another supplier because they are familiar with our solvency II models through their audit related assurance work. Auditor objectivity and independence was safeguarded by the measures described above;
●● The committee reviewed and approved the external auditors’ proposed audit scope and approach for the current year as set out in its 2017 audit plan, in the light of the group’s present circumstances and changes in regulatory and other requirements;
●● Discussed with the external auditor any audit problems encountered in the normal course of audit work, including any restrictions on audit scope or access to information as part of ensuring that significant findings and recommendations made by the external auditors and management’s proposed response were received, discussed and appropriately acted upon; and
●● Met privately with the external auditors, PwC.
Committee’s effectivenessThe committee reviews its own effectiveness annually and, during the year, this review was led by the committee’s chairman. The committee also reviews the effectiveness of each meeting prior to conclusion to ensure continuous improvement.
Committee’s achievements and future prioritiesAchievements in 2017
Oversaw the sale of a stake in the general insurance business to Allianz and considered the accounting and capital implications of this transaction.
Oversaw significant transactions and changes in assumptions in the year, including adoption of the CMI 2016 mortality projections model, the OB pension reinsurance transaction, and changes in assumptions for unit costs.
Reviewed and challenged the appropriateness of the change in general insurance margin from a flat 2.5% to being aligned to the 75th percentile of the reserve risk distribution in the year to reflect the additional uncertainty in the market.
Recommending the re-appointment of PwC as external auditor following a retender process.
Strengthened the committee through the recruitment of Colin Ledlie who has significant and relevant insurance and financial reporting experience from his roles as chief actuary and group chief risk officer at Standard Life PLC.
Priorities for 2018
Continued focus on the areas outlined in the significant issues table on pages 64 to 66.
Assessment of the impact of the forthcoming change to IFRIC 14 regarding the limit on a defined pension benefit asset.
Review of the progress against plans for implementation of IFRS 17 ‘Insurance Contracts’ in 2021.
Oversight of the restructuring of the group following the completion of the sale of a stake in the general insurance business.
Investment Committee The Investment Committee meets at least twice a year. It met four times in 2017 and is expected to meet four times in 2018. The committee comprises three non-executive directors and two executive directors. Representatives from the group’s asset manager, Columbia Threadneedle Investments, the group chief investment officer, the group chief risk officer, and the group chief actuary are regular attendees who attend by invitation. Details of each member’s attendance is provided opposite:
Formal meetings held: 4 Eligible to attend Attended meetings % of attendance
Caroline Burton 1 4 4 100%
Richard Rowney 4 4 100%
Andy Parsons2 1 0 0%
David Barral 4 4 100%
Alan Cook3 1 1 100%
Philip Moore2 3 3 100%
Mark Austen3 3 3 100%
The role of the committeeIt is responsible for:●● Developing, recommending and overseeing the investment strategy for the group, aligned to its
business and risk strategy;●● Monitoring and reviewing the operational performance of Columbia Threadneedle Investments
covering its relative investment performance against mandates set, service levels, contract terms and conditions including its charges compared to alternative providers; and
●● Investment activity undertaken by management including the oversight of the group’s Asset and Liability Committee (ALCO) delegated activities and effectiveness of decisions and actions.
Principal activities undertaken in 2017During the year, the committee undertook the following activities:●● Reviewed counterparty risk and compliance with the counterparty policy;●● Monitored the effectiveness of the derivative portfolio and investment performance portfolio;●● Discussed credit exposure and proposed actions including credit triggers;●● Reviewed the group’s with-profits and general insurance investment strategies;●● Discussed Columbia Threadneedle Investments’ performance including compliance with
delegated authorities; ●● Oversight of the renewal negotiations of the asset manager’s contract; and●● Considered and recommended the adoption of the environmental, social and governance policy.
With-profits Committee The With-profits Committee was scheduled to meet four times in 2017 in accordance with its terms of reference. However, due to the strategic challenges and volume of change, the committee met eleven times during the year. It is expected to meet six times in 2018. The committee comprises one LVFS non-executive director, an independent chairman, one independent member, one Teachers nominee independent member and one management nominated member. The chairman has extensive and relevant industry experience and was formerly chief executive of Police Mutual and holds a number of other non-executive positions. Details of each member’s attendance is provided below:
Formal meetings held: 11 Eligible to attend Attended meetings % of attendance
Graham Berville4 11 11 100%
Steve Sarjant5 11 11 100%
Ian Blanchard6 11 10 91%
Colin Ledlie7 4 4 100%
Management nominated member8 11 7 64%
Cath Keers9 5 0 0%
Changes to the composition of the committeeCath Keers stepped down as the LVFS board appointed representative on the committee in June 2017 and was replaced by Colin Ledlie, from August 2017. Colin has extensive experience of the with-profits business and his full biography is included on page 59. Katie Wadey (the group’s chief customer officer) joined the committee as the management nominated member in July 2017, replacing John Perks (Life managing director) who continued to attend the meeting as a regular attendee. It was decided that, in 2018, a management nominated member would no longer be appointed as a member of the committee but would attend upon request.
The role of the committeeThe committee’s role in respect of the LV= and Teachers with-profits funds is to:●● Advise the board on its views on the interests of with-profits policyholders;●● Bring independent judgement of the assessment of compliance with the statement of Principles and
Practices of Financial Management (PPFM);●● Monitor how any competing or conflicting interests between different groups of policyholders are
resolved; and●● Provide advice to the board on any other matters within its terms of reference.
The committee can engage external professional advisers to assist in delivering its objectives effectively. It also draws on the expertise of the with-profits actuary. Input is also provided by the life chief actuary, head of heritage products and the chief capital and investment officer, who attend meetings by invitation.
1 Chair of the committee.
2 Andy Parsons replaced Philip Moore as a Committee member from 30 June 2017.
3 Alan Cook replaced Mark Austen as a member of the committee upon his retirement from the board on 20 June 2017.
4 Chair of the committee.
5 Independent member.
6 Teachers nominee independent member.
7 Colin Ledlie, joined the committee on 1 August 2017.
8 John Perks attended 5/5 meetings until July 2017 and was replaced by Katie Wadey who attended 2/6 meetings.
9 Cath Keers resigned from the committee on 20 June 2017.
68 69
Governance
LV= Annual Report 2017 Corporate Governance Report

Principal activities undertaken in 2017During the year, and in addition to its core responsibilities, the committee undertook the following activities:●● Welcomed two new committee members and ensured a thorough induction plan was undertaken;●● Considered the impact on policyholders of the strategic partnership with Allianz and several other
strategic initiatives aimed at creating a sustainable mutual with a clearly defined social purpose, member reward strategy and an appropriate legal structure to enable the business to prosper in the long term and grow member value;
●● Considered the impact of the negotiations on the renewal of the investment management contract with Columbia Threadneedle Investments;
●● Considered the impact on the policyholders of various capital optimisation initiatives such as the reinsurance of the OB Pensions business.
●● Strengthened the committee’s relationship with the regulator;●● Continued to monitor the outcomes from the legacy product review programme and considered any
proposed remediation and improvements; ●● Continued with an ongoing programme of improvements to policyholder communication; ●● Completed a review of the investment strategy for the main with-profits fund and oversaw its
implementation; and ●● Following the committee’s positive effectiveness review, conducted by Advanced Boardroom
Excellence in November 2016, agreed an action plan to implement further improvements to the committee’s effectiveness.
Risk CommitteeThe Risk Committee met nine times in 2017 and is expected to meet seven times in 2018. The committee is made up of five non-executive directors and each member’s attendance is provided below:
Formal meetings held: 9 Eligible to attend Attended meetings % of attendance
David Barral1 9 9 100%
David Neave 9 8 89%
James Dean 9 7 78%
Alan Cook2 4 4 100%
Colin Ledlie3 3 3 100%
Mark Austen2 5 4 80%
Other attendees include, but are not limited to: the chief executive, the group finance director, the chief risk officer, the internal audit director, the head of compliance, and the group chief actuary.
The role and principal activities of the committeeThe principal role of the committee is to consider the risks faced by LV= and advise the board.
More details of the group’s policy on risk management, and the activities of the committee during the year are set out in the Risk Management section on pages 36 to 44.
Remuneration Committee The Remuneration Committee met eight times during 2017 and is expected to meet five times in 2018. The committee is made up of at least three non-executive directors and each member’s attendance is provided below:
Formal meetings held: 8 Eligible to attend Attended meetings % of attendance
Caroline Burton4 8 8 100%
David Neave 8 7 88%
Alan Cook5 4 4 100%
Cath Keers4 4 4 100%
Mark Austen6 4 4 100%
Other attendees include the HR director, head of reward, the chief executive and the chief risk officer, who attend by invitation.
The role and principal activities of the committeeOn behalf of the board, the committee determines:
●● The group’s policy on executive remuneration; and●● The specific packages for each of the executive directors and certain senior managers, including the
group-wide incentive and bonus schemes.
More details of the group’s policy on executive and senior management remuneration, and the activities of the Remuneration Committee during the year are set out in the Report on Directors’ Remuneration on pages 75 to 91.
Corporate Governance and Nomination Committee The Corporate Governance and Nomination Committee met six times in 2017 and is expected to meet at least twice in 2018. During the year, the committee comprised all the pre-existing independent non-executive directors, the chairman and the chief executive. Details of each member’s attendance is provided below:
Formal meetings held: 6 Eligible to attend Attended meetings % of attendance
Alan Cook1 6 6 100%
Richard Rowney 6 6 100%
James Dean 6 4 67%
Caroline Burton 6 3 50%
David Neave 6 6 100%
David Barral 6 4 67%
Mark Austen1 3 3 100%
Cath Keers2 3 2 67%
Changes to the composition of the committeeHistorically, all non-executive directors were members of the committee. Following discussions with the chairman, it was agreed that as it was not a requirement for all non-executive directors to be members of the committee, the membership would be revised. The committee’s terms of reference were reviewed and updated to require up to four non-executive directors to be appointed as members of the committee. It was further agreed that the senior independent director would be a mandatory member of the committee.
The role of the committeeThe committee:●● Evaluates the balance of skills, knowledge and experience on, and required by, the board for board
appointments and certain senior management roles; ●● Prepares a description of the role and capabilities required for any particular appointment; ●● Oversees the board’s governance arrangements and makes appropriate recommendations to the
board; and●● Ensures compliance with the UK Corporate Governance Code, and other applicant legislations, and
ensures best practice is carried out.
Involvement of external consultantsRecruitment consultants, The Zygos Partnership (TZP), were instructed to help compile a short-list of candidates to interview for the non-executive director vacancies throughout the year. At the conclusion of the recruitment process, the committee reviewed the candidates and made recommendations to the board for approval. TZP had no other connection with the Society. EgonZehnder were instructed to assist with the recruitment of the group finance director position. Five candidates were shortlisted including four external and one internal applicant. Further details of the board appointments made throughout the year are included on pages 54 to 55.
Principal activities undertaken in 2017During the year, the committee undertook the following activities:●● Evaluated the balance of skills on the board and identified a greater requirement for actuarial
knowledge amongst the directors which initiated the recruitment search for a non-executive director with appropriate expertise to fulfil the skills gap;
●● Reviewed the Board Diversity Policy and performance against its set objectives. See page 47 for further details of the Board Diversity Policy, its implementation and objectives.
●● Discussed succession planning of the board and the wider LV= group;●● Instructed external search consultants to undertake the recruitment process for the group finance
director position and the vacant non-executive position initiated by the resignation of Cath Keers at the AGM;
●● Considered the shortlist of candidates for the role, including their time commitment and any potential conflicts of interest before making a recommendation to the board;
●● Undertook a thorough review of the directors’ time commitment, both external and internal, to ensure that each director had sufficient time to discharge their responsibilities;
●● Discussed the professional development plans and non-executive director training for the year; and●● Considered the scope and shortlist of consultants for the externally facilitated board evaluation which
encompassed an effectiveness review of the Audit, Remuneration and Risk Committees.
Executive CommitteeThe chief executive chairs this weekly committee meeting to monitor the group’s business performance. It also meets in order to help him meet the responsibilities which the board has delegated to him and as a precursor to its monthly reporting to the board.
1 Chair of the committee.
2 Mark Austen resigned from the committee on 20 June 2017 at which date Alan Cook became a member of the committee.
3 Colin Ledlie was appointed to the board and became a committee member on 1 August 2017.
4 Caroline Burton was appointed chair of the committee from July 2017 following the departure of Cath Keers in June 2017.
5 Alan Cook joined the committee on 1 January 2017.
6 Mark Austen resigned from the committee in June 2017.
1 Alan Cook took over as chairman on 20 June 2017 following the departure of Mark Austen at the AGM.
2 Cath Keers resigned on 20 June 2017.
70 71
Governance
LV= Annual Report 2017 Corporate Governance Report

Business activities and future prospects LV= is an incorporated friendly society that, together with various subsidiaries, carries out insurance and financial services business in the United Kingdom, through LVFS and its subsidiaries. These activities include with-profits insurance, life protection (both term and whole-of-life), pensions, annuities, online retirement advice, equity release, motor, home, pet and travel insurance. The directors consider that all the activities undertaken by the group during the year were within the Society’s rules and relevant regulatory permissions.
The board sets objectives and priorities supported by key performance indicators (KPIs) and targets, which it monitors on an ongoing basis throughout the year. During 2017, the key objectives and priorities were aligned to our strategic agenda as outlined on pages 15 and 16.
Business strategyThe board has chosen to set out the group’s strategic report information required under applicable law and regulations in full, which can be found on pages 8 to 51 of this report.
Board directors and interestsThe current members of the board and details of its various committees are shown on pages 56 to 71.
We continued to maintain liability insurance cover for our directors and officers during the year and as at the date of approval of these financial statements.
Basis of accountingThese financial statements are presented using International Financial Reporting Standards (IFRS), as adopted by the European Union, drawn up on a going concern basis. Further details about the directors’ responsibilities for the financial statements are described on page 74.
Going concern and viability statement In accordance with the provisions of the UK Corporate Governance Code, the directors are required to assess the prospect of the group as a going concern generally over the next 12 months and also its longer-term viability.
Going concernUnder the UK Corporate Governance Code the directors are required to state whether the business is a going concern. In considering this requirement, the directors have taken into account the following:
●● The group plan, which was approved by the board and in particular the forecast regulatory solvency position. Sensitivity analysis is included within this forecast (for further detail on this analysis see page 28);
●● For the group, regulatory solvency is given more attention than liquidity. This is because, by the nature of its business, the group holds very substantial liquid assets on its balance sheet which would enable it to pay claims and expenses as they fall due for at least a 12 month period; and
●● The principal risks and uncertainties that could impact the group’s solvency and liquidity over the next 12 months (for further detail on the principal risks and uncertainties assessed in 2017 see pages 36 to 44).
Having due regard to these matters and after making appropriate enquiries, the directors confirm that they consider it appropriate to prepare the financial statements on a going concern basis.
Viability statementOur members rely on the sustainability of the group over the longer term and this is reflected in our business model and management of risk. An assessment of viability is integral to our strategic planning and decision making process in order that we can continue in operation and meet our obligations to policyholders.
Period of assessmentA three-year time period of assessment has been used in the board’s assessment of viability. Each year a strategic plan is developed and is subject to robust review and challenge by the board. This plan is over a five-year horizon, with greater certainty associated with the first three years, and a further two years to provide the board with an extended plan for strategic decision making. The board recognises that uncertainty increases over time and this is reflected in the period for the assessment of viability.
Strategic planning processThe strategic planning process includes an assessment of the sustainability and resilience of our business model and an in-depth analysis of the group’s forecast risk profile, capital, solvency and liquidity. The validity of the planning process is assessed by reconciling the projections to actual business outcomes over the past planning cycle, and understanding differences that are identified in order to continually improve the process going forward. The plan provides a road map for implementing the group’s strategic objectives and is underpinned by a series of economic and other assumptions which are subject to stress and scenario testing outlined below.
Stress and scenario testingAssessment of the risks to achieving the projected performance is an integral part of the planning process. As part of the ORSA process we perform stress tests to assess the capital resilience of the group to a range of severe but plausible scenarios (see page 28 and 41). These tests allow the board to review and challenge the strategic plan and risk management strategy. In considering these scenarios the impacts of mitigating management actions designed to maintain or restore capital, liquidity and solvency to within risk appetite are considered.
The significant management actions taken to strengthen and de-risk the balance sheet including the strategic partnership with Allianz and reinsurance of the OB pensions portfolio has provided the group with an above risk appetite capital surplus, solidifying the sustainability of the group for the future. The de-risking of the balance sheet has helped to reduce the sensitivity to non-market stresses and associated scenarios. In the scenarios tested, sufficient mitigating actions have been identified to enable the directors to have a reasonable expectation that the group would remain viable over the three year period of assessment.
In addition, the group conducts a reverse stress test which gives the board an understanding of the maximum resilience of the group to extremely severe adverse scenarios. Results of stress tests form part of the process to set the group’s capital risk appetite for a buffer of £350 million to be held above the regulatory capital requirement to protect against shocks and stresses (see page 28).
Formal viability statementThe directors make this viability statement based on a robust assessment of those risks that could threaten the business model, future profitability, solvency, liquidity or capital adequacy of the group. Based on this assessment, the directors have a reasonable expectation that the group will be able to continue in operation and meet its liabilities as they fall due over the three-year period to December 2020.
Fixed assetsChanges in our fixed assets are shown in note 26 to the financial statements.
Margin of solvencyThroughout the year and at 31 December 2017 we held the required capital resources for each business class as prescribed by the PRA.
Independent auditorA resolution for the re-appointment of PricewaterhouseCoopers LLP (PwC) as auditor will be proposed at the 2018 AGM, following a competitive tender which was carried out during the year. Further details are shown on page 67 of the Corporate Governance Report.
Assessment of riskWe look to create value for members by maintaining an appropriate balance between the returns that we seek and the level and type of risk we take on in order to achieve these returns.
In accordance with the UK Corporate Governance Code, the directors have carried out a robust assessment of the principal risks facing the group and Society, including those which would threaten its business model, future performance, solvency or liquidity.
A full overview of our risk management can be found on pages 36 to 44 and further details of the ongoing monitoring and the annual review of the effectiveness of risk management systems can be found in the Audit Committee report on page 67. Note 4 of these accounts also provides further detail about our risk management and control.
Internal controlThe board has overall responsibility for the group’s internal control systems and for monitoring effectiveness of these. Implementation and maintenance of the internal control systems are the responsibility of the executive directors and senior management. The performance of the internal control systems is reviewed by the relevant board committees, principally the Audit Committee which receives reports from the internal audit, compliance and risk functions.
The Audit Committee report on pages 63 to 68 describes the main features of the internal control and risk management systems in relation to the financial reporting process and the process for preparing consolidated accounts, which are a subset of the internal control systems under the supervision of the board’s committees.
The group’s internal control systems are designed to manage, rather than eliminate, the risk of failure to meet business objectives and can only provide reasonable, and not absolute, assurance against material misstatement or loss. In assessing what constitutes reasonable assurance, the board has regard to materiality and to the relationship between the cost of, and benefit from, internal control systems.
The regular review of the effectiveness of the system of risk management and internal control concluded that these systems remain effective and there were no significant failings or weaknesses to report.
Our employeesDetails about our people, our people policies including the employment of disabled persons, and engagement with our staff generally can be found on pages 47 and 48 of this report, headed ‘Corporate Responsibility Report’. Our board diversity policy is included on page 47.
Charitable donationsA full view of our charitable donations and corporate social responsibility activities can be found on pages 49 and 50. No political donations were made in 2017.
Directors’ Report
Rachel SmallCompany Secretary
73
Governance
72 Directors’ Report

Statement of disclosure of information to the auditorAs at the date of this report each director confirms that:
1 So far as he or she is aware, there is no information relevant to the audit of the Society’s and the group’s financial statements for the year ended 31 December 2017 of which the auditor is unaware;
2 He or she has taken all steps that he or she ought to have taken in his/her duty as a director to make him/her aware of any relevant audit information and to establish that the Society’s auditor is aware of that information.
Directors’ statement of responsibility The Friendly Societies Act 1992 (1992 Act) requires a Friendly Society’s Committee of Management to prepare accounts for each accounting period. As we are incorporated under the 1992 Act our board of directors has assumed the responsibilities and duties of the Committee of Management in relation to these accounts.
These accounts must comply with the relevant provisions of the 1992 Act, and present fairly the financial position, financial performance and cash flows of the Society and the group at the end of the accounting period. In carrying out this duty, the directors have chosen to use IFRS as adopted by the European Union.
A fair presentation of our accounts in accordance with IFRS requires our directors to:●● Select suitable accounting policies and ensure
they are applied consistently;
●● Prepare the accounts on a going concern basis, unless it is inappropriate to presume that the Society and the group will continue in business;
●● Make judgements and accounting estimates that are reasonable and prudent;
●● Present information, including accounting policies, in a manner that provides relevant, reliable, comparable and understandable information;
●● Provide additional disclosures when compliance with the specific requirements in IFRS is insufficient to enable users to understand the impact of particular transactions, other events and conditions on the Society’s and the group’s financial position and financial performance; and
●● State that the Society and the group have complied with applicable IFRSs, subject to any material departures disclosed and explained in the accounts.
The directors are also responsible for maintaining:●● Proper accounting records which are intended
to disclose with reasonable accuracy, at any time, the financial position of the Society and the group;
●● Appropriate internal control systems to safeguard our assets and to prevent and detect fraud and other irregularities; and
●● The integrity of the corporate and financial information included on our website LV.com.
Legislation in the UK governing the preparation and dissemination of financial statements may differ from legislation in other jurisdictions.
Each of the directors, whose names and functions are shown on pages 58 to 60, confirm that to the best of their knowledge and belief:
●● The Society and the group financial statements, which have been prepared in accordance with IFRS as adopted by the EU, give a true and fair view of the assets, liabilities, financial position and profit of the Society and the group;
●● The Business Reviews on pages 20 to 35 of the Strategic Report include a fair review of the development and performance of the business during the financial year and the financial position of the group at the end of 2017; and
●● A description of the group’s principal risks and details of the group’s risk governance structure are provided on pages 36 to 44.
Having taken all the matters considered by the board and brought to the attention of the board during the year into account, the directors are satisfied that the Annual Report, taken as a whole, is fair, balanced and understandable, and provides the information necessary for our members and investors to assess the Society’s and the group’s position and performance, business model and strategy.
By order of the Board of Directors
Rachel Small Group Company Secretary28 March 2018
Report on Directors’ Remuneration
Caroline BurtonChairman of the Remuneration Committee
Annual Statement Dear member,
The performance of LV= in 2017 has significantly improved from 2016, with the group delivering an operating profit of £158 million. As well as the strong financial performance, a number of important strategic goals were achieved too, in particular the agreement of the strategic partnership with Allianz.
Under the terms of the agreement, we acquired the renewal rights for the personal home and motor activities of Allianz Insurance PLC, while Allianz acquired our commercial broker insurance renewal rights. A strategic partnership has been created to run the enlarged personal lines general insurance business, which will trade under the LV= brand. As well as creating a personal lines business of significant scale and presence within the market under an award winning brand, the transaction proceeds will help to secure the cash and capital strength of the Society.
As chair of the Remuneration Committee, I appreciate the need to ensure that individuals throughout the organisation who have worked hard to achieve the successes in 2017 are appropriately rewarded. It is also important that we ensure our ongoing remuneration policy supports and incentivises the ongoing success of the Society. The remuneration policy approved at the 2015 AGM has come to the end of its three year lifecycle. Therefore, a new remuneration policy will be put forward at the 2018 AGM. We have considered our approach to remuneration during 2017 and having looked for other alternatives, we do not feel it is appropriate or in the best interests of the Society to make any significant changes to how we structure remuneration. Therefore, the new remuneration policy we set out in this Report on Directors’ Remuneration does not include any significant changes to our structure.
Remuneration policy and the link to long-term business performanceOur remuneration policy seeks to align remuneration with performance. Salaries are targeted at median levels against the external market, for executive directors and for all employees. Variable remuneration, with the amount paid linked to performance, therefore forms an important part of their remuneration package.
All employees are eligible to participate in the group annual bonus, with the total pot to be shared amongst all employees calculated based on group performance. Group performance for the purposes of determining the annual bonus pot is assessed based on the group balanced scorecard with a mix of financial and non-financial performance conditions.
Each individual’s bonus amount is then determined based on their individual performance. For more senior employees, a proportion of any bonus award may be deferred and paid out in a later year, ensuring that our executives remain focused on both the short-term and long-term health of the Society.
Senior employees also participate in the group long-term incentive plan. The final value of an LTIP award is determined based on long-term performance conditions measured over a three year period. The final value can range from zero to two times the initial value, depending on performance. The LTIP therefore incentivises senior employees and rewards them for delivering high performance business results over the long-term.
2017 performance and remuneration outcomesThe 2017 group balanced scorecard, used to measure performance and determine the size of the bonus pot, was structured as follows:
●● 55% on financial measures: normalised group operating profit; and
●● 45% non-financial measures:
• 15%: Strategy and change;
• 10%: Customer and member;
• 10%: Risk and compliance; and
• 10%: People.Normalised group operating profit for 2017 was £158 million, which compared to £108 million in 2016, against a target of £86 million. This strong financial performance was driven by both the general insurance and life businesses, but also further added to by the strategic cost transformation programme we commenced in 2016.
75
Governance
74 LV= Annual Report 2017

We have seen significant expense reductions, reflective of significant management action to reduce our cost base, predominantly achieved through a reduction in our salary bill, and stronger discipline on discretionary spend items.
Performance against the non-financial measures was also strong, resulting in the Remuneration Committee determining that a bonus pot of £23 million for distribution amongst employees (based on individual performance against their objectives) would be appropriate in respect of 2017. The distribution of the bonus pot under the group annual bonus scheme, resulted in the average percentage bonus received by our employees being 11.7% of bonus-able earnings (8.6% for 2016).
Further analysis of the group’s performance against the 2017 group balanced scorecard is shown on page 78.
As well as performance against the measures in the group balanced scorecard being used to determine the size of the bonus pot on a group level, it is also used as part of the assessment of the performance of each executive director.
In addition to performance against the group balanced scorecard, with weighting on particular areas for some individuals, individual performance targets for each of the executive directors are used to determine their individual bonus amounts. The 2017 outcomes for each of the executive directors range from 11% of maximum to 83% of maximum. Further commentary on the personal performance of each individual executive director against their objectives and their 2017 bonus awards is shown on pages 86 and 87. A portion of each bonus received by Richard Rowney and Steve Treloar, will be deferred for payment over the next three years, with the value linked to the value of investments in the with-profits fund, ensuring a continued link to the performance of the Society.
Our 2015-17 LTIP awards were subject to stretching performance conditions related to growth in Average Adjusted Group Profit Before Tax (AAGPBT). In addition, awards held by Mike Rogers and Philip Moore had a further performance condition based on Relative Investment Performance (RIP), which had a 25% weighting. Under the performance conditions, for any LTIP payment to be due, AAGPBT over the three year performance period needed to exceed AAGPBT over the previous three years by 5% and the RIP of our main with-profits fund needed to perform in line with benchmark over the past three years. At this level of growth, LTIP awards would payout at 0.5 times their initial value or 0.56 times their initial value for Mike Rogers and Philip Moore. For the maximum payout to be due (i.e. two times the initial value), AAGPBT over the three year performance period needed to exceed AAGPBT over the previous three years by 13% and the RIP of our main with-profits fund needed to outperform the benchmark by 60 basis points.
The actual figure achieved for AAGPBT was £151 million, an increase of 110% compared to the previous three year period, resulting in the maximum payout of two times the initial value being due for this measure. The RIP was below benchmark over the past three years resulting in nil payout for this measure. Therefore, 2015-17 LTIP awards subject only to the AAGPBT performance condition will payout at maximum (two times their initial value). For 2015-17 LTIP awards also subject to the RIP condition (with a 25% weighting), the payout level is 1.5 times their initial value. The payments to executive directors holding 2015-17 LTIP awards will be made in three equal tranches on an annual basis from May 2018.
Board changes Philip Moore stepped down from the board in June 2017 and Andy Parsons was appointed in his place as group finance director. Andy Parsons’ remuneration package upon appointment is in line with our existing remuneration policy that was approved by members in May 2015. Details of all remuneration arrangements are set out on pages 89 and 90 of the Report on Directors’ Remuneration.
As explained in our 2016 Report on Directors’ Remuneration, Alan Cook was appointed to the board on 1 January 2017 as an independent non-executive director of the Society and chairman designate. Mark Austen stepped down from the board and his position as chairman from June 2017, from which point Alan Cook took on the role of chairman.
Cath Keers also stepped down from the board in June 2017 and I took on the role of chairman of the Remuneration Committee. Colin Ledlie joined the board in August 2017.
Steve Treloar stepped down from the LVFS board on 28 December 2017, on completion of the strategic partnership with Allianz.
Changes to remuneration during 2017In our 2016 Report on Directors’ Remuneration, we explained that Richard Rowney had been appointed to the role of chief executive on a salary of £490,000, being set below market levels, with the intention that this would be increased as Richard grew into the role of chief executive and based on his performance. In July 2017, once he had completed one year in the role, the Remuneration Committee considered Richard’s salary level. Based on his progression into the chief executive role over that time and his strong performance, it was determined that it would be appropriate to award him an increase. Richard’s salary was therefore increased to £525,000 (an increase of 7%) with effect from 1 August 2017.
Remuneration from 2018 onwardsWe review executive directors’ salaries at the same time as all other employees. In 2018, the average employee salary increase will be 2.4% (effective from 1 April 2018). The average salary increase for executive committee members is 1%. As chief executive, Richard Rowney’s salary will not increase at this time (in light of his increase awarded during 2017). His next salary review will be aligned with the following all employee salary review in 2019.
To improve our remuneration policy and practices, a number of refinements have been made for 2018. Whilst the general structures remain appropriate and aligned to market practice, we have made changes to the detail of how the policy is structured and will operate. These changes are summarised below.
Group annual bonus:●● The group balanced scorecard will have an
increased weighting on strategy and change (from 15% to 20%)
●● The financial measure will have a reduced weighting (from 55% to 50%)
●● The financial measure will change from normalised operating profit to measures on:
– Operating capital surplus – Dividend flow from the general insurance business – Economic value of new businessFurther information on the 2018 group balanced scorecard is shown on pages 80 and 91.
LTIP awards, from 2018-20 and beyond:Long-term growth in group profit has previously been the main performance measure used as profit contributes to growing member value and provides the resources for us to invest in the Society’s future. However, we propose to make changes to the performance measures for our 2018-20 LTIP awards.
The AAGPBT performance measure will no longer apply and will be replaced with the following performance measures:
●● 75% weighting: Financial measures, based around growth in own funds and economic value of new business: and
●● 25% weighting: strategic goals, based around (i) developing a sustainable, growing, vibrant business; (ii) excellent franchise health; and (iii) ensuring a strong risk and capital position.
●● An underpin related to risk whereby no vesting will occur if appropriate levels of risk management have not been achieved.
This reflects the need for a capital adjusted performance measure, given the increased importance of capital over recent years. Furthermore, the financial measures will be a good proxy for the value of the business and therefore management’s success in delivering value for members. The introduction of strategic goals will help incentivise and reward the delivery of important goals that contribute to the long-term health of the Society.
The LTIP maximum award value that can be made to the chief executive will increase from 100% of salary to 150% of salary, and from 75% of salary to 125% of salary for other executive directors. This change is intended to increase the long-term remuneration element to more market aligned levels and to provide additional incentivisation to the executive directors to grow the LV= business and increase member value over the longer term, from 2018 and beyond. For 2018-20 LTIP awards, it is intended that awards will be granted at these new, increased maximum levels. However, in future years, the awards may be made at lower levels, which will be determined by the committee at the appropriate time.
The Remuneration Committee is confident that these refinements to the policy will support the achievement of the new strategy by incentivising executive directors and other senior employees to drive the growth of the LV business.
Further information on the new LTIP performance measures is shown on page 81 and 91.
Listening to membersWe have discussed remuneration structures and policy with members a number of times at member panels during 2017. Each discussion was useful in hearing well considered opinions from members and allows us to take these views into account when making remuneration decisions. It has also been useful to continue open dialogue with each other and we intend that this will continue during 2018.
We aim to comply with the highest standards of corporate governance and our Report on Directors’ Remuneration has again been prepared in line with the reporting requirements which apply to listed companies. On that basis, and as it is three years since our directors’ remuneration policy was approved by members (at our 2015 AGM), we are proposing a member vote on our remuneration policy at our 2018 AGM. Therefore, there will be two resolutions relating to our 2017 Report on Directors’ Remuneration that will be subject to a member vote at our 2018 AGM. These will be on:
●● Our revised remuneration policy for 2018 onwards; and
●● The implementation of our remuneration policy in 2017 (the usual annual vote).
I hope that as members you will support the resolutions at this year’s AGM. As always, the committee and I are keen to receive feedback so we can take on board your views in the future.
Yours sincerely
Caroline BurtonChairman of the Remuneration Committee
76 77
Governance
LV= Annual Report 2017 Report on Directors’ Remuneration

LV= financial performance in 2016
£20m140%
14.5%
2017 Remuneration Summary
Financial measures used for the 2017 annual bonus scheme and long-term incentive plan
Total remuneration
(£’000)
Annual bonus (% of
maximum)
Long-term incentives (% of maximum)
Richard Rowney 1,719 80% 100%
Andy Parsons1 497 53% N/A
Steve Treloar 815 83% N/A
Philip Moore2 599 11% 75%
How much our executive directors earned in 2017 from our ongoing remuneration policy
1stUK best loved
76% engagement
1 In addition to this remuneration from our ongoing policy, Andy Parsons received £450,000 on appointment as group finance director in respect of a buy-out for incentive arrangements with his previous employer which lapsed upon his departure to join LV=.
2 Amounts above relate to remuneration received for services as directors. For Philip Moore this excludes any amounts received as payments for contractual commitments on leaving office. See page 90.
Remuneration policyWhen developing our remuneration policy we compare ourselves to other businesses, in particular financial services organisations of a similar size to our own, to ensure our policy is designed to support recruitment and retention of talented people who are able to achieve stretching targets and deliver greater benefits for our members. Our aim is to provide remuneration packages that are targeted at median against the external market, and which have a significant proportion dependent upon the delivery of strong performance. Our remuneration policy is governed by good risk management practice to ensure that management are incentivised appropriately to support the short, medium and long-term interests of our members. The policy for executive directors is described in more detail below.
We are subject to the Solvency II regulations and fully adhere to the remuneration aspects of those. While we currently remain outside the scope of the Financial Conduct Authority’s (FCA) remuneration rules that apply to other financial services sectors, we keep them under regular review and aspire to follow their spirit.
Seeking the views of membersThe committee is keen to hear members’ views on the Society’s remuneration policy and the remuneration decisions which the committee takes on our members’ behalf. During 2017, we held feedback and discussion sessions at our member panel gatherings and we will continue to do so. We value dialogue with members and always consider the variety of views from members carefully, alongside other relevant factors when making remuneration decisions.
At our 2017 AGM, the annual advisory vote on our Report on Directors’ Remuneration received support from 94% of our members who voted. In addition to the annual advisory vote, we will also hold a vote on our directors’ remuneration policy at our 2018 AGM. This was last approved at our 2015 AGM so holding the vote after three years is in accordance with our practice of meeting the full governance requirements on executive directors’ remuneration that apply to listed companies.
Consideration of employment conditions elsewhere in the groupWhen setting levels of remuneration for directors, the committee takes into account the pay arrangements across the Society as a whole to ensure that consistent underlying principles are applied for all employees when making decisions about rewards. The remuneration arrangements for the executive directors are similar to those for the general employee population, aside from quantum and participation rates in incentive schemes.
The committee takes into account employees’ views with regard to remuneration generally when determining the design of the Society’s remuneration policy. It does not however consult employees generally regarding the pay arrangements for senior executives, although this position is kept under review.
LV= financial performance in 2017
LV= non-financial performance in 2017
Remuneration policy for executive directors (to apply from 1 January 2018)
Purpose and link to strategy
Operation Maximum opportunity
Performance measures
Salary
To attract high performing individuals to lead the Society and continue to reward them fairly in the context of alternative opportunities open to them.
Salaries are reviewed annually (but not necessarily increased) taking account of several factors including individual experience, responsibilities, function and sector, along with individual and group performance.
The committee also reviews benchmarking information on pay levels in organisations of comparable size and complexity to LV=.
If salaries are increased they are normally effective from 1 April each year.
There is no prescribed maximum annual increase.
The committee is guided by the general increase for the LV= employee population and wage increases generally, but on occasions may need to take into account factors such as retention risk, development in the role and/or changes in responsibility.
Individual performance is taken into account when salary levels are reviewed.
£158moperating profit
180%capital cover ratio
7.7%LVFSmain with-profits fund performance
Key Achieved target
Progressing towards target
Missed target
Richard Rowney
Andy Parsons
Steve Treloar
Philip Moore
Key Salary, pension and other benefits
Annual bonus
Long-term incentives
2017 Annual bonus
Normalised group operating profit
Payout = 100% of maximum
2015-2017 LTIP
Average Adjusted Group Profit Before Tax (AAGPBT)
Payout = 100% of maximum
Relative Investment Performance (RIP)
Payout = 0% of maximum
79
Governance
78 Report on Directors’ Remuneration

Purpose and link to strategy
Operation Maximum opportunity
Performance measures
Benefits
To operate a competitive benefits structure that provides adequate protection to our employees and aids recruitment and retention.
The Society currently provides:●● car allowance●● medical insurance●● income protection cover●● group product discounts or any other
benefits, which are available to all staff and directors on equal terms.
●● Other benefits may be introduced if considered appropriate by the committee.
Car allowance of up to £10,200.
The values of other benefits are based on the cost to the group and are not subject to a pre-determined maximum.
N/A
Pension
To provide the facility for a competitive and viable retirement income.
Directors can elect to join a defined contribution pension scheme or receive a cash sum in lieu of pension contributions.
Up to 22% of salary may be paid as a cash sum and/ or contribution to a defined contribution pension scheme.
Pension contributions are currently set at:
Chief executive: 22% of salary.
Group finance director: 14% of salary.
N/A
Annual bonus
To drive and reward delivery of near-term business objectives.
A performance plan is agreed with each executive for the performance year using a balanced scorecard approach.
The annual bonus is not pensionable.
Part of the annual bonus may be deferred. Any amount deferred will usually be paid over a period of three years.
Chief executive: maximum payment of 150% of salary (with 75% paid for on target performance).
Other directors: maximum payment of 120% of salary (with 60% paid for on target performance).
The annual bonus pot is measured against annual financial objectives, accounting for at least 50% of the assessment and a balanced scorecard of non-financial objectives accounting for the balance of the assessment.
For 2018, these will include strategy and change, customer and member, risk and compliance and people. Risk is taken into account when assessing performance against all the measures in the balanced scorecard and the committee may reduce or cancel any bonus payment if it considers that risk exceeded acceptable levels.
No annual bonus payments will be made for below threshold performance. The committee has the discretion to adjust the formulaic outcomes both upwards and downwards (including to zero) to ensure alignment of pay with performance.
Purpose and link to strategy
Operation Maximum opportunity
Performance measures
Long-term incentive plan (LTIP)
To drive and reward the achievement of longer-term business objectives, so creating a powerful retention incentive.
The scheme provides further alignment between the interests of executive directors and members.
LTIP payouts will be made in cash.
One-third of any payment will normally be made after three years when the award vests, one-third will be deferred for a further year and one-third will be deferred for two years after vesting.
Performance will be measured over a period of at least three years.
Maximum payout is capped at two times the initial award, the value of which is up to:
Chief executive: 150% of salary;
Other board executive directors: 125% of salary.
The LTIP performance measures will be based on financial and non-financial measures, with financial measures making up at least 50%.
For 2018-2020 LTIP awards, the financial measures will be based around growth in own funds and new business and will have a 75% weighting. The remaining 25% focus on strategic goals, based around (i) developing a sustainable, growing, vibrant business; (ii) excellent franchise health; and (iii) ensuring a strong risk and capital position. An underpin related to risk whereby no vesting will occur if appropriate levels of risk management have not been achieved.
No LTIP payments will be made for below threshold performance. The committee has the discretion to adjust the formulaic outcomes both upwards and downwards (including to zero) to ensure alignment of pay with performance.
Deferred variable pay and malus and ‘clawback’
In line with the requirements of the Solvency II regulations and PRA and FCA guidance, we operate a policy of deferral that covers our annual bonus scheme and the group LTIP; this includes the option for the Remuneration Committee to clawback any deferred payments.
At least 40% of the variable remuneration paid to executive directors is delivered in long-term pay. If this ratio is not met, then a portion of the annual bonus payment for that year will be deferred. For employees whose variable remuneration is £500,000 or more, the requirement will be that 60% be in long-term pay.
Long-term remuneration is normally paid over a three year period. One-third of any bonus or LTIP payment will be made when the award vests, one-third will be deferred for a further year and one-third will be deferred for two years after vesting.
The committee may operate malus and/or clawback in respect of annual bonus deferred awards and/or LTIP in circumstances such as a misstatement of financial results, an error in assessing vesting levels, gross misconduct or a failure of risk management or any other circumstances in which the committee, in its absolute discretion, considers that the Society is required by any Remuneration Code to operate clawback.
N/A N/A
The committee keeps under review all elements of remuneration and retains the discretion to make changes in response to market conditions and, in exceptional circumstances, where it is in the interest of members to do so. The committee also retains the discretion to make reasonable and proportionate changes to the remuneration policy if the committee considers this appropriate in order to respond to changing legal or regulatory requirements or guidelines.
Payments outside the policyThe Committee reserves the right to make any remuneration payments and/or payments for loss of office (including exercising any discretions available to it in connection with such payments) where the terms of the payment were agreed (i) before 1 January 2014 (the date the Society’s first directors’ remuneration policy came into effect); (ii) before the policy set out above came into effect, provided that the terms of the payment were consistent with the directors’ remuneration policy in force at the time they were agreed; or (iii) at a time when the relevant individual was not a director of the Society. For these purposes “payments” includes the committee satisfying awards of variable remuneration.
80 81
Governance
LV= Annual Report 2017 Report on Directors’ Remuneration

Changes to previous policyA number of minor changes have been made to the policy put forward to a member vote at the 2015 AGM to align it with updated best market practice. As set out in the chairman’s letter, the maximum LTIP award levels have also been increased to increase the long-term remuneration element to more market aligned levels and to provide additional incentivisation to the executive directors to grow the LV= business and increase member value over the longer term, from 2018 and beyond.
Selection and disclosure of performance measures The committee selected the performance conditions because these are central to the Society’s overall strategy and are the key metrics used by the executive directors to oversee the operation of the business. The performance targets are determined annually by the committee following consultation with the Audit and Risk Committees and are typically set at a level that is above the level of the group’s forecasts.
The committee is of the opinion that the performance targets for the annual bonus are commercially sensitive in respect of the Society and that it would be detrimental to the interests of the Society to disclose them before the start of the financial year. The targets will be disclosed in the annual Report on Directors’ Remuneration that follows the end of the relevant financial year.
Illustrations of application of remuneration policyThe group’s policy results in a significant portion of remuneration received by executive directors being dependent on group performance. The charts below illustrate how the total pay opportunities for the executive directors vary under three different performance scenarios: minimum, on target and maximum.
Approach to recruitment and promotions The remuneration package for any new executive director would be set in line with the remuneration policy in force at the time of appointment. In exceptional circumstances, to ensure we are able to recruit the most talented people to our business, it may be necessary to make an offer to a new director on terms outside the current policy. In such an event, the committee would notify members of the arrangements in the next Report on Directors’ Remuneration.
When it considers it to be in the best interests of the Society and its members, the committee may offer additional cash payments to new appointees as compensation for the loss of bonus, LTIP or other such arrangements from their former employer. Any cash payments would normally take into account the time horizons and performance requirements attached to the lost remuneration. Members will be informed of any such payments in the next Report on Directors’ Remuneration to be published.
In the case of an internal appointment, any variable pay element awarded in respect of the prior role would normally be allowed to payout according to its terms. For external and internal appointments, the committee may agree that the group will meet certain relocation expenses as appropriate.
Service contracts and payments for loss of officeOur executive directors are subject to a notice period of twelve months. Service contracts normally continue until the director’s agreed retirement date or such other date as the parties agree. The service contracts contain a provision for early termination and notice periods given by the group are limited to twelve months or less. In certain circumstances, such as gross misconduct, a director’s service contract may be terminated without notice and without any further payment or compensation, except for sums accrued up to the date of termination. If the Society terminates the employment of a director in other circumstances, compensation is generally limited to salary due for any unexpired notice period and any amount assessed by the Remuneration Committee as representing the value of other contractual benefits (including pension) which would have been received during the unexpired notice period. However, the committee may determine that a level of compensation above this is appropriate in individual cases. Payments in lieu of notice are not pensionable.
●● Termination payment – salary plus benefits (including pension), may be subject to phasing and mitigation where this is in the interests of the Society. In addition, any statutory entitlements would be paid as necessary. In certain circumstances, a pro rata bonus may be payable, along with the entitlement to LTIP awards at the usual time, the treatment of which is set out below.
●● LTIP – the default treatment under the LTIP is that any unvested awards lapse when employment ends. However, if an individual is a ‘good leaver’ (e.g. death, disability, retirement or any other situation where the Remuneration Committee determines in its discretion that the individual shall be treated as a good leaver) awards may not lapse immediately and the individual may retain their entitlement to a pro rata payment, to reflect their reduced period of employment during the term of the LTIP. Payments received under these circumstances will be subject to the same performance conditions and timescales as other participants. If it considers it appropriate to do so the committee may choose to remove the normal performance conditions and time pro rating, and/or make payments under the scheme at the point employment ends, although it is envisaged that this would only be applied in exceptional circumstances. In determining whether an executive should be treated as a good leaver or not, the committee will take into account the performance of the individual and the reasons for their departure. If employment ends after an LTIP award has vested but during its deferral period, the LTIP award will continue unless the individual resigned (unless the committee determines otherwise) or was dismissed for gross misconduct, in which case it will lapse.
Copies of the directors’ service contracts and letters of appointment are available for inspection at the Society’s registered office.
Summary of the policy for non-executive directorsThe policy is intended to apply for three years beginning on 1 January 2018.
The committee keeps under review all elements of the policy and retains the discretion to make changes in response to market conditions and in exceptional circumstances, where it is in the interest of members to do so.
Fees – In order to attract and retain high calibre non-executive directors to the Society we pay individuals fees for the positions they undertake for the organisation. Fees are generally reviewed on an annual basis and whilst there is no prescribed maximum increase that is applied, consideration is taken of the fees paid for similar roles in other organisations, the responsibility and necessary time commitment to the group’s affairs, the general increase for the broader UK employee population and on occasion the need for specific skills, changes in responsibility, or other relevant factors. No other remuneration is paid apart from these non-pensionable fees and non-executive directors are not eligible to participate in any performance-related arrangements. Fees for the non-executive directors are determined by the executive members of the board. For the chairman, fees are determined by the whole board (excluding the chairman). Non-executive directors may also be reimbursed for their travel and accommodation costs incurred in the pursuance of their duties (including any tax which may be payable in respect of such costs).
Notice – either party may give three months’ notice of termination.
Richard Rowney – Chief Executive
Andy Parsons – Group Finance Director
Key Salary, pension and
other benefits1
Annual bonus2
Long-term incentives3
1 Basic salary is based on salary coming into effect on 1 April 2018. Benefits and pension levels are based on 2017 amounts on the basis that these will not be significantly different from amounts expected to be paid in 2018.
2 The on target level of bonus is 50% of the maximum bonus opportunity.
3 The on target level of the group LTIP is 50% of the maximum payout.
100%
39%
24%
20%
25%
41%
51%
468
1,204
1,940
100%
36%
22%
21%
26%
43%
52%
Min
Target
Max
657
1,838
3,020
Total remuneration £’000
Total remuneration £’000
Min
Target
Max
82 83
Governance
LV= Annual Report 2017 Report on Directors’ Remuneration
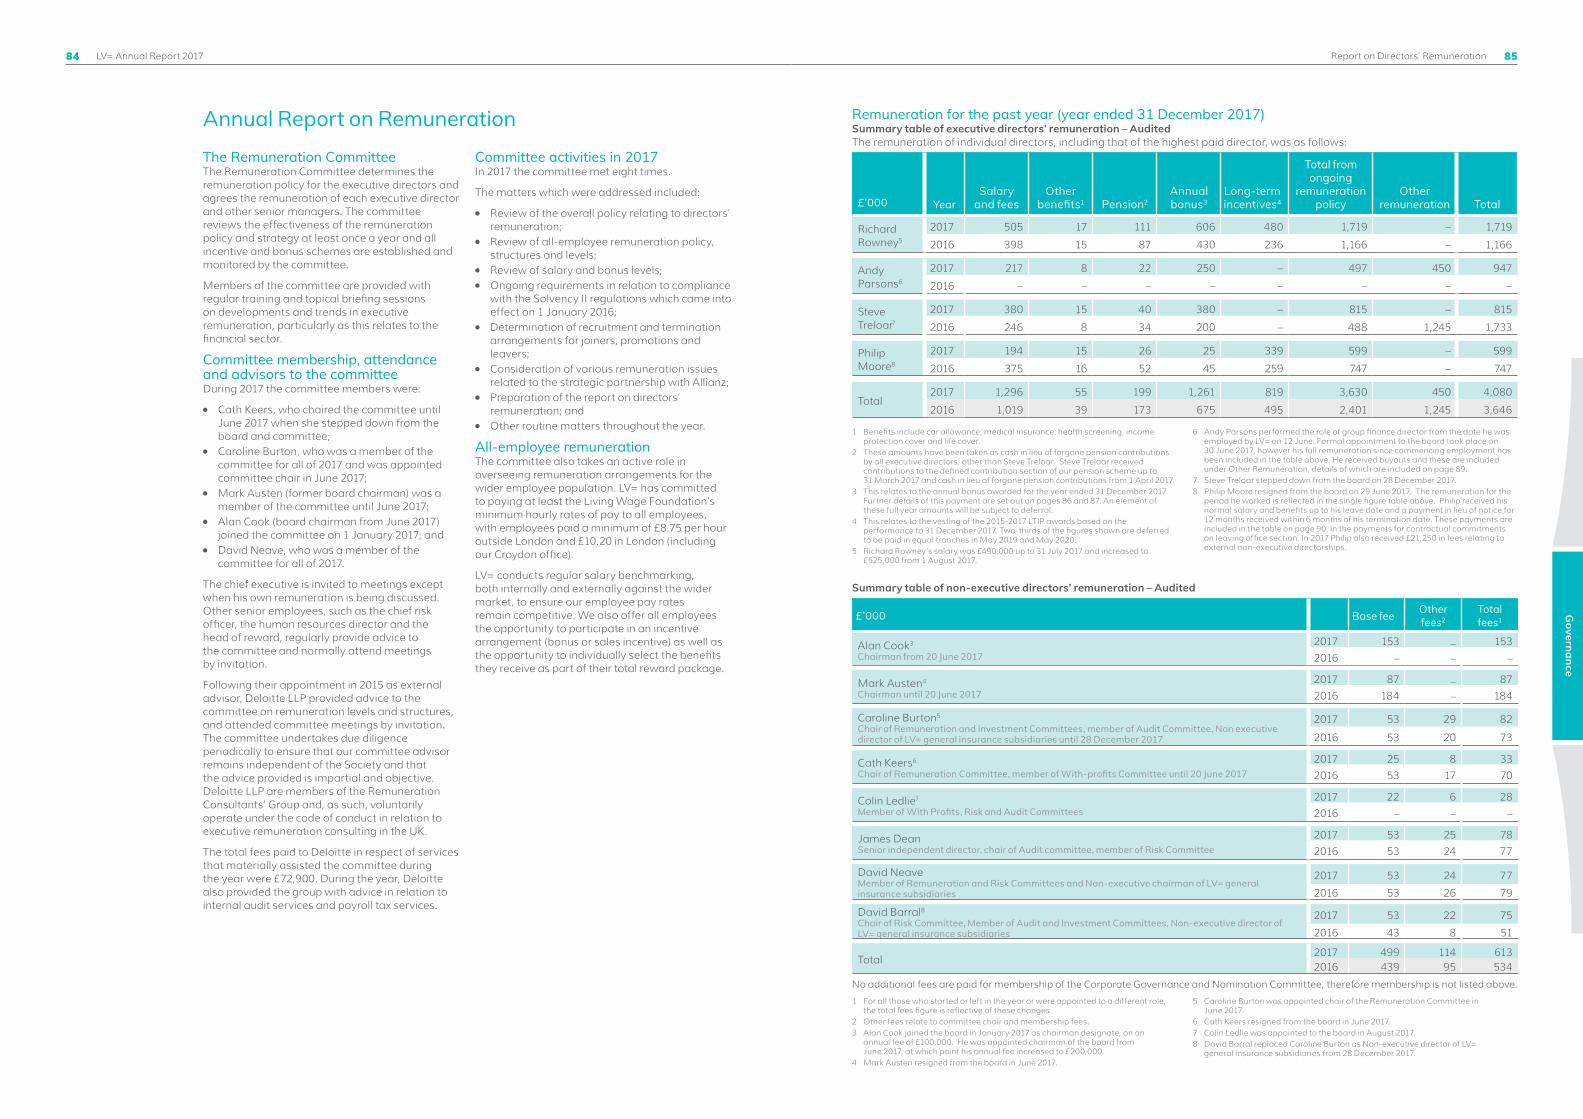
Annual Report on RemunerationThe Remuneration CommitteeThe Remuneration Committee determines the remuneration policy for the executive directors and agrees the remuneration of each executive director and other senior managers. The committee reviews the effectiveness of the remuneration policy and strategy at least once a year and all incentive and bonus schemes are established and monitored by the committee.
Members of the committee are provided with regular training and topical briefing sessions on developments and trends in executive remuneration, particularly as this relates to the financial sector.
Committee membership, attendance and advisors to the committeeDuring 2017 the committee members were:
●● Cath Keers, who chaired the committee until June 2017 when she stepped down from the board and committee;
●● Caroline Burton, who was a member of the committee for all of 2017 and was appointed committee chair in June 2017;
●● Mark Austen (former board chairman) was a member of the committee until June 2017;
●● Alan Cook (board chairman from June 2017) joined the committee on 1 January 2017; and
●● David Neave, who was a member of the committee for all of 2017.
The chief executive is invited to meetings except when his own remuneration is being discussed. Other senior employees, such as the chief risk officer, the human resources director and the head of reward, regularly provide advice to the committee and normally attend meetings by invitation.
Following their appointment in 2015 as external advisor, Deloitte LLP provided advice to the committee on remuneration levels and structures, and attended committee meetings by invitation. The committee undertakes due diligence periodically to ensure that our committee advisor remains independent of the Society and that the advice provided is impartial and objective. Deloitte LLP are members of the Remuneration Consultants’ Group and, as such, voluntarily operate under the code of conduct in relation to executive remuneration consulting in the UK.
The total fees paid to Deloitte in respect of services that materially assisted the committee during the year were £72,900. During the year, Deloitte also provided the group with advice in relation to internal audit services and payroll tax services.
Committee activities in 2017In 2017 the committee met eight times.
The matters which were addressed included:
●● Review of the overall policy relating to directors’ remuneration;
●● Review of all-employee remuneration policy, structures and levels;
●● Review of salary and bonus levels;●● Ongoing requirements in relation to compliance
with the Solvency II regulations which came into effect on 1 January 2016;
●● Determination of recruitment and termination arrangements for joiners, promotions and leavers;
●● Consideration of various remuneration issues related to the strategic partnership with Allianz;
●● Preparation of the report on directors’ remuneration; and
●● Other routine matters throughout the year.
All-employee remunerationThe committee also takes an active role in overseeing remuneration arrangements for the wider employee population. LV= has committed to paying at least the Living Wage Foundation’s minimum hourly rates of pay to all employees, with employees paid a minimum of £8.75 per hour outside London and £10.20 in London (including our Croydon office).
LV= conducts regular salary benchmarking, both internally and externally against the wider market, to ensure our employee pay rates remain competitive. We also offer all employees the opportunity to participate in an incentive arrangement (bonus or sales incentive) as well as the opportunity to individually select the benefits they receive as part of their total reward package.
Remuneration for the past year (year ended 31 December 2017) Summary table of executive directors’ remuneration – Audited The remuneration of individual directors, including that of the highest paid director, was as follows:
£’000 YearSalary
and feesOther
benefits1 Pension2Annual bonus3
Long-term incentives4
Total from ongoing
remuneration policy
Other remuneration Total
Richard Rowney5
2017 505 17 111 606 480 1,719 – 1,719
2016 398 15 87 430 236 1,166 – 1,166
Andy Parsons6
2017 217 8 22 250 – 497 450 947
2016 – – – – – – – –
Steve Treloar7
2017 380 15 40 380 – 815 – 815
2016 246 8 34 200 – 488 1,245 1,733
Philip Moore8
2017 194 15 26 25 339 599 – 599
2016 375 16 52 45 259 747 – 747
Total2017 1,296 55 199 1,261 819 3,630 450 4,080
2016 1,019 39 173 675 495 2,401 1,245 3,646
1 Benefits include car allowance, medical insurance, health screening, income protection cover and life cover.
2 These amounts have been taken as cash in lieu of forgone pension contributions by all executive directors, other than Steve Treloar. Steve Treloar received contributions to the defined contribution section of our pension scheme up to 31 March 2017 and cash in lieu of forgone pension contributions from 1 April 2017.
3 This relates to the annual bonus awarded for the year ended 31 December 2017. Further details of this payment are set out on pages 86 and 87. An element of these full year amounts will be subject to deferral.
4 This relates to the vesting of the 2015-2017 LTIP awards based on the performance to 31 December 2017. Two-thirds of the figures shown are deferred to be paid in equal tranches in May 2019 and May 2020.
5 Richard Rowney’s salary was £490,000 up to 31 July 2017 and increased to £525,000 from 1 August 2017.
6 Andy Parsons performed the role of group finance director from the date he was employed by LV= on 12 June. Formal appointment to the board took place on 30 June 2017, however his full remuneration since commencing employment has been included in the table above. He received buyouts and these are included under Other Remuneration, details of which are included on page 89.
7 Steve Treloar stepped down from the board on 28 December 2017.8 Philip Moore resigned from the board on 29 June 2017. The remuneration for the
period he worked is reflected in the single figure table above. Philip received his normal salary and benefits up to his leave date and a payment in lieu of notice for 12 months received within 6 months of his termination date. These payments are included in the table on page 90, in the payments for contractual commitments on leaving office section. In 2017 Philip also received £21,250 in fees relating to external non-executive directorships.
1 For all those who started or left in the year or were appointed to a different role, the total fees figure is reflective of these changes.
2 Other fees relate to committee chair and membership fees.3 Alan Cook joined the board in January 2017 as chairman designate, on an
annual fee of £100,000. He was appointed chairman of the board from June 2017, at which point his annual fee increased to £200,000.
4 Mark Austen resigned from the board in June 2017.
5 Caroline Burton was appointed chair of the Remuneration Committee in June 2017.
6 Cath Keers resigned from the board in June 2017.7 Colin Ledlie was appointed to the board in August 2017.8 David Barral replaced Caroline Burton as Non-executive director of LV=
general insurance subsidiaries from 28 December 2017.
Summary table of non-executive directors’ remuneration – Audited
£’000 Base fee Other fees2
Total fees1
Alan Cook3
Chairman from 20 June 20172017 153 _ 153
2016 _ _ _
Mark Austen4
Chairman until 20 June 20172017 87 _ 87
2016 184 _ 184
Caroline Burton5
Chair of Remuneration and Investment Committees, member of Audit Committee, Non executive director of LV= general insurance subsidiaries until 28 December 2017
2017 53 29 82
2016 53 20 73
Cath Keers6
Chair of Remuneration Committee, member of With-profits Committee until 20 June 20172017 25 8 33
2016 53 17 70
Colin Ledlie7
Member of With Profits, Risk and Audit Committees2017 22 6 28
2016 _ _ _
James DeanSenior independent director, chair of Audit committee, member of Risk Committee
2017 53 25 78
2016 53 24 77
David NeaveMember of Remuneration and Risk Committees and Non-executive chairman of LV= general insurance subsidiaries
2017 53 24 77
2016 53 26 79
David Barral8Chair of Risk Committee, Member of Audit and Investment Committees, Non-executive director of LV= general insurance subsidiaries
2017 53 22 75
2016 43 8 51
Total2017 499 114 6132016 439 95 534
No additional fees are paid for membership of the Corporate Governance and Nomination Committee, therefore membership is not listed above.
84 85
Governance
LV= Annual Report 2017 Report on Directors’ Remuneration

4070%
100%
130%
70 100 130 160
Payo
ut %
Threshold payout at £69m
Target payout at £86m
Max payout above £104m
Annual bonus for the year ended 31 December 2017 – AuditedThe annual bonus for the year under review was based on performance against annual group financial objectives, risk metrics and a balanced scorecard of personal objectives. Details of actual performance against targets are as follows:
Financial
The Society operates a performance range for the profit target of normalised group operating profit (see chart above) which is considered to be stretching at all levels. Threshold, at £69 million is the level of performance that must be achieved to release 70% of the bonus pot. Target, at £86 million is the level of performance that must be achieved to release 100% of the bonus pot. Maximum, above £104 million is the level of performance that must be achieved to release 130% of the bonus pot. The normalised group operating profit achieved in 2017 was £158 million, resulting in maximum payout.
Individual and strategicThe table below gives a broad indicator of how each executive director performed against their individual and strategic objectives along with a description of those objectives. The total bonus awarded to each director and the percentage deferred is set out in the next table.
Individual and strategic objectives (45% weighting) Indication of performance
Richard Rowney
Objectives as chief executive: ●● Progress against key strategic priorities including strengthening
the Society’s capital position and securing our future as a modern mutual
●● Deliver the financial plan and targets, including good cost control ●● Solvency II implementation●● Operate within the Society’s risk appetite●● Deliver excellent customer satisfaction scores to remain Britain’s
best loved insurer●● Continue to deliver good employee engagement scores and
champion diversity & inclusion
Out perform
Andy Parsons
Objectives as group finance director:●● Strengthen the Society’s capital position and secure our future as a
modern mutual●● Deliver financial operational performance ●● Solvency II implementation●● Operate within the Society’s risk appetite●● Develop the investment strategy●● Deliver the financial plan and targets, including good cost control
Perform
Steve Treloar
Objectives as managing director of general insurance:●● Progress against key strategic priorities including strengthening the
Society’s capital position●● Growth of the general insurance business●● Build a distinct and relevant brand●● Deliver market leading digital solutions●● Operate within the Society’s risk appetite
Out perform
Philip Moore
Objectives as group finance director:●● Deliver financial operational performance●● Solvency II implementation●● Operate within the Society’s risk appetite●● Develop the investment strategy●● Deliver the financial plan and targets, including good cost control
Perform
In addition to the objectives determined at the start of the year, a key additional objective that arose during the year became the successful completion of the strategic partnership with Allianz which was achieved on 28 December 2017. Risk is taken into account when appraising all performance measures and the committee may reduce or cancel any bonus payment if it considers that risk exceeded acceptable levels. In addition, no bonus payments will be made unless the group achieves a pre-determined minimum level of profits.
The Remuneration Committee looks at the performance of the business in the round to understand any internal and external factors that have impacted performance and the broad trajectory of the business and market conditions, for example, before determining the appropriate level of bonus to be released.
Payout (% of
maximum)
Total 2017 bonus
(£’000s)
Total 2017 bonus
(% of salary)
2017 bonus deferred %
2017 bonus deferred1 (£’000s)
Richard Rowney 80% 606 120% 8% 49
Andy Parsons2 53% 250 64% 0% 0
Steve Treloar 83% 380 100% 28% 108
Philip Moore3 11% 25 13% 0% 0
Performance against the specific performance targets is as follows:●● AAGPBT of £151 million resulted in a maximum payout●● Relative investment performance of 20 basis points below benchmark was below threshold and
resulted in no payout
Richard Rowney ●● AAGPBT vesting (100% weighting): 200% (maximum 200%)
Overall vesting: 200% (maximum 200%)
Philip Moore●● AAGPBT vesting (75% weighting): 200% (maximum 200%)●● RIP vesting (25% weighting): 0% (maximum 200%)
Overall vesting: 150% (maximum 200%)
1 Amounts deferred achieve the deferral criteria whereby 40% of variable remuneration (60% if variable remuneration is above £500,000) is deferred. Amounts are calculated using the 2017 bonus and the 2018-2020 LTIP award. Any variable pay amount deferred will be paid in equal parts over the following three years. During the deferral period, the value of deferred amounts will be tied to the value of members’ invested funds, thereby creating a link to ongoing performance.
2 As part of his joining contract, the Remuneration Committee agreed that Andy Parsons would have the opportunity of being entitled to bonus measured against his full annual salary of £390,000 and that this would not be pro-rated for his period of service.
3 Phillip Moore was treated as a good leaver and as such was eligible for a pro-rata bonus until his termination date of 29 June 2017.
Group LTIP payments made in the year (2015 – 2017 scheme) – AuditedThe 2015-17 LTIP scheme is based on a performance period from 1 January 2015 to 31 December 2017. For the 2015-2017 scheme, the payout is based on:
●● AAGPBT: 75% of award for Mike Rogers and Philip Moore (former directors), and 100% for Richard Rowney as he was managing director of life and pensions when this award was made; and
●● Relative Investment Performance: 25% of award for Mike Rogers and Philip Moore (former directors).
Key
Payout scale
Actual performance
AAGPBT £m Relative investment performance (basis points - ‘bps’)
4050% -50%
0%
75%
150%
200%
100%
150%
200%
70 100 130 160 -40 -20 0 20 40 60 80
Key Payout scale Actual performance Key Payout scale Actual performance
Threshold payout at £63m
Max payout above £78m
Payo
ut %
Payo
ut %
Max payout above 60bps
Threshold payout at 0bps
AAGPBT – Average Adjusted Group Profit Before Tax over the three prior years. Relative Investment Performance - Annualised investment performance return relative to benchmark.
Normalised group operating profit £m
86 87
Governance
LV= Annual Report 2017 Report on Directors’ Remuneration

The vested awards are subject to claw-back provisions, which can apply in scenarios where events later come to light that would have meant the payout amount was inappropriate (such as a material re-statement of the Society’s financial results, an error was made in determining the payout amount, the recipient committed an act of gross misconduct or a material failure in risk management).
Group LTIP summary of awards and amounts vested during 2017 – Audited
£’000 Award
Unvested awards at 1 January
2017 1
Awards made
in the year
To be paid in
respect of 2015-2017
schemeOf which deferred
Unvested awards
at 31 December
2017 2
Richard Rowney 2015-2017 240 – 480 320 –
2016-2018 246 – – – 246
2017-2019 – 490 – – 490
Andy Parsons 2017-2019 – 293 – – 293
Steve Treloar 2016-2018 285 – – – 285
2017-2019 – 285 – – 285
Philip Moore3 2015-2017 271 – 339 226 –
2016-2018 277 – – – 277
1 Unvested awards are shown at the base award level. Unvested awards at 1 January 2017 are in respect of awards granted in 2015 and 2016.
2 Unvested awards at 31 December 2017 are in respect of awards granted in 2016 and 2017.
3 Phillip Moore was treated as a good leaver and as such was eligible for a pro-rata LTIP until his termination date of 29 June 2017.
Group LTIP awards made in the year (2017 – 2019 scheme) – Audited
Type of awardInitial award
(£'000)
Growth in Average Adjusted
Group Profit Before Tax
Relative Investment
Performance% of initial
award that would vest
at maximum performance
Vesting determined by
performance over
75% weighting 25% weighting
Richard Rowney Cash 490 50% 75% 200% 3 years to 31 December
2019Andy Parsons Cash 293 50% 75% 200%
100% weighting 0% weighting
Steve Treloar Cash 285 50% N/A 200%
Pensions – Audited Since the closure of the defined benefit (DB) section of our pension scheme to future accrual in 2013, executive directors have had the choice of receiving contributions into the defined contribution (DC) section of our pension scheme or being paid an equivalent cash allowance. Steve Treloar was a member of the DC section of the pension scheme, ceasing to be an active member on 1 April 2017. Following that date he received cash payments in lieu of pension contributions. All other executive directors received cash payments in lieu of pension contributions.
Additional information on 2017 remunerationPercentage change in remuneration levels The table below shows the movement in the salary, benefits and annual bonus for the group chief executive between the current and previous financial year compared to the total amounts for the same elements for all employees.
Salary Taxable benefits Bonus
Chief executive 7% 4% 41%
% change based on a static population excluding the chief executive
2% 4% 42%
Ratio of chief executive salary to average employee FTE salary 16:1, (2016: 17:1).
Relative importance of the spend on pay The table below shows the group’s actual spend on pay (for all employees) relative to the mutual bonus, which represents a significant, discretionary disbursement of profit to members.
Total remuneration
2017 £m 2016 £m % change
Staff costs 255 263 (3)%
Mutual bonus 26 17 53%
Chief executive’s remuneration over nine financial years The total remuneration figures for the chief executive during each of the last nine financial years are shown in the table below. The total remuneration figure includes the annual bonus based on that year’s performance and LTIP awards based on three year performance periods ending in the relevant year. For 2016, total remuneration reflects the amounts received by Richard Rowney and Mike Rogers for the periods each director performed the role of chief executive.
The annual bonus payout and LTIP vesting level as a percentage of the maximum opportunity are also shown for each of these years.
2009 2010 2011 2012 2013 2014 2015 2016 2017
Mike Rogers
Mike Rogers
Mike Rogers
Mike Rogers
Mike Rogers
Mike Rogers
Mike Rogers
Mike Rogers
Richard Rowney
Richard Rowney
Total remuneration (£'000) 997 1,247 2,177 2,622 2,364 1,666 1,970 891 610 1,719
Bonus % of maximum awarded % 77% 86% 95% 100% 74% 80% 86% 13% 79% 80%
LTIP % of maximum vesting % 0% 0% 100% 100% 90% 25% 59% 49% 50% 100%
Payments upon recruitment and promotion of directorsAndy Parsons was appointed as the group finance director to replace Philip Moore in June 2017. Upon appointment Andy’s salary was set at £390,000. Andy’s bonus maximum opportunity and LTIP award level were set in line with our remuneration policy, i.e. a bonus maximum of 120% of salary and LTIP award of 75% of salary (with payout capped at two times the LTIP initial award). Andy also participated in a number of incentive arrangements at his previous employer which the committee agreed to buy-out as part of his offer to join the Society. This buy out was comprised of amounts in respect of annual bonus, deferred bonuses and performance shares which were forfeited as a result of his resignation to join the Society. For the amounts in respect of annual bonus and performance shares, the applicable performance conditions were taken into account when determining their value at the time of the buy-out. The awards are not subject to further performance conditions and will payout at the same time as the original awards would have done. Buy out awards are subject to clawback provisions.
The total buyout value is £450,000, of which £193,000 is in respect of bonus and deferred bonus shares forfeited and £257,000 is in respect of LTIP shares forfeited.
Payments to past directors – AuditedAs set out in our 2016 Report on Directors’ Remuneration, on leaving Mike Rogers retained eligibility to participate in the long-term incentive schemes to which he had already been invited to participate. All awards were pro-rated to his final date in employment, 31 December 2016, with the amount payable based on the applicable performance conditions.
The 2015-17 LTIP award, which Mike retained 2/3 eligibility for, will payout at two times the initial award value, which will result in a 2015-17 LTIP award payout amount of £530,000 for Mike. This will be paid to him annually in one third instalments, beginning from May 2018.
% of initial award that would vest at threshold performance
88 89
Governance
LV= Annual Report 2017 Report on Directors’ Remuneration
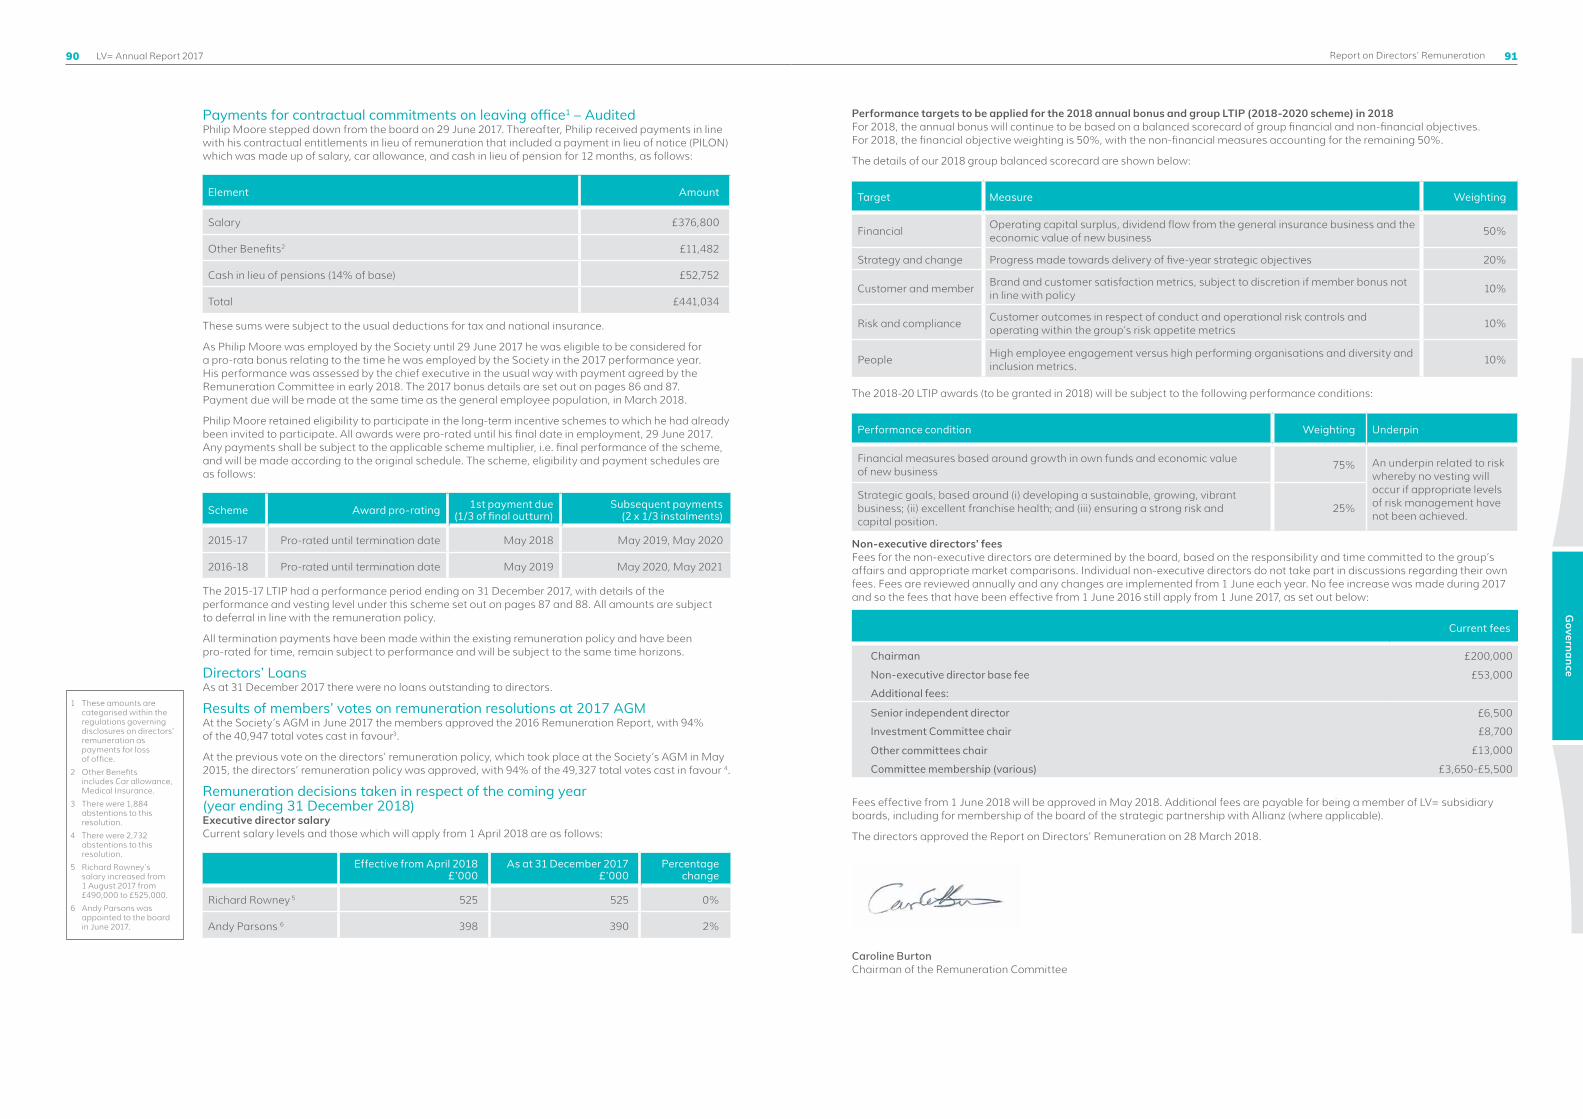
Payments for contractual commitments on leaving office1 – AuditedPhilip Moore stepped down from the board on 29 June 2017. Thereafter, Philip received payments in line with his contractual entitlements in lieu of remuneration that included a payment in lieu of notice (PILON) which was made up of salary, car allowance, and cash in lieu of pension for 12 months, as follows:
Element Amount
Salary £376,800
Other Benefits2 £11,482
Cash in lieu of pensions (14% of base) £52,752
Total £441,034
These sums were subject to the usual deductions for tax and national insurance.
As Philip Moore was employed by the Society until 29 June 2017 he was eligible to be considered for a pro-rata bonus relating to the time he was employed by the Society in the 2017 performance year. His performance was assessed by the chief executive in the usual way with payment agreed by the Remuneration Committee in early 2018. The 2017 bonus details are set out on pages 86 and 87. Payment due will be made at the same time as the general employee population, in March 2018.
Philip Moore retained eligibility to participate in the long-term incentive schemes to which he had already been invited to participate. All awards were pro-rated until his final date in employment, 29 June 2017. Any payments shall be subject to the applicable scheme multiplier, i.e. final performance of the scheme, and will be made according to the original schedule. The scheme, eligibility and payment schedules are as follows:
Scheme Award pro-rating 1st payment due (1/3 of final outturn)
Subsequent payments (2 x 1/3 instalments)
2015-17 Pro-rated until termination date May 2018 May 2019, May 2020
2016-18 Pro-rated until termination date May 2019 May 2020, May 2021
The 2015-17 LTIP had a performance period ending on 31 December 2017, with details of the performance and vesting level under this scheme set out on pages 87 and 88. All amounts are subject to deferral in line with the remuneration policy.
All termination payments have been made within the existing remuneration policy and have been pro-rated for time, remain subject to performance and will be subject to the same time horizons.
Directors’ LoansAs at 31 December 2017 there were no loans outstanding to directors.
Results of members’ votes on remuneration resolutions at 2017 AGM At the Society’s AGM in June 2017 the members approved the 2016 Remuneration Report, with 94% of the 40,947 total votes cast in favour3.
At the previous vote on the directors’ remuneration policy, which took place at the Society’s AGM in May 2015, the directors’ remuneration policy was approved, with 94% of the 49,327 total votes cast in favour 4.
Remuneration decisions taken in respect of the coming year (year ending 31 December 2018)Executive director salaryCurrent salary levels and those which will apply from 1 April 2018 are as follows:
Effective from April 2018 £’000
As at 31 December 2017 £’000
Percentage change
Richard Rowney 5 525 525 0%
Andy Parsons 6 398 390 2%
Performance targets to be applied for the 2018 annual bonus and group LTIP (2018-2020 scheme) in 2018For 2018, the annual bonus will continue to be based on a balanced scorecard of group financial and non-financial objectives. For 2018, the financial objective weighting is 50%, with the non-financial measures accounting for the remaining 50%.
The details of our 2018 group balanced scorecard are shown below:
Target Measure Weighting
FinancialOperating capital surplus, dividend flow from the general insurance business and the economic value of new business
50%
Strategy and change Progress made towards delivery of five-year strategic objectives 20%
Customer and memberBrand and customer satisfaction metrics, subject to discretion if member bonus not in line with policy
10%
Risk and complianceCustomer outcomes in respect of conduct and operational risk controls and operating within the group’s risk appetite metrics
10%
PeopleHigh employee engagement versus high performing organisations and diversity and inclusion metrics.
10%
The 2018-20 LTIP awards (to be granted in 2018) will be subject to the following performance conditions:
Performance condition Weighting Underpin
Financial measures based around growth in own funds and economic value of new business
75% An underpin related to risk whereby no vesting will occur if appropriate levels of risk management have not been achieved.
Strategic goals, based around (i) developing a sustainable, growing, vibrant business; (ii) excellent franchise health; and (iii) ensuring a strong risk and capital position.
25%
Non-executive directors’ feesFees for the non-executive directors are determined by the board, based on the responsibility and time committed to the group’s affairs and appropriate market comparisons. Individual non-executive directors do not take part in discussions regarding their own fees. Fees are reviewed annually and any changes are implemented from 1 June each year. No fee increase was made during 2017 and so the fees that have been effective from 1 June 2016 still apply from 1 June 2017, as set out below:
Current fees
Chairman £200,000
Non-executive director base fee £53,000
Additional fees:
Senior independent director £6,500
Investment Committee chair £8,700
Other committees chair £13,000
Committee membership (various) £3,650-£5,500
Fees effective from 1 June 2018 will be approved in May 2018. Additional fees are payable for being a member of LV= subsidiary boards, including for membership of the board of the strategic partnership with Allianz (where applicable).
The directors approved the Report on Directors’ Remuneration on 28 March 2018.
Caroline BurtonChairman of the Remuneration Committee
1 These amounts are categorised within the regulations governing disclosures on directors’ remuneration as payments for loss of office.
2 Other Benefits includes Car allowance, Medical Insurance.
3 There were 1,884 abstentions to this resolution.
4 There were 2,732 abstentions to this resolution.
5 Richard Rowney’s salary increased from 1 August 2017 from £490,000 to £525,000.
6 Andy Parsons was appointed to the board in June 2017.
90 91
Governance
LV= Annual Report 2017 Report on Directors’ Remuneration
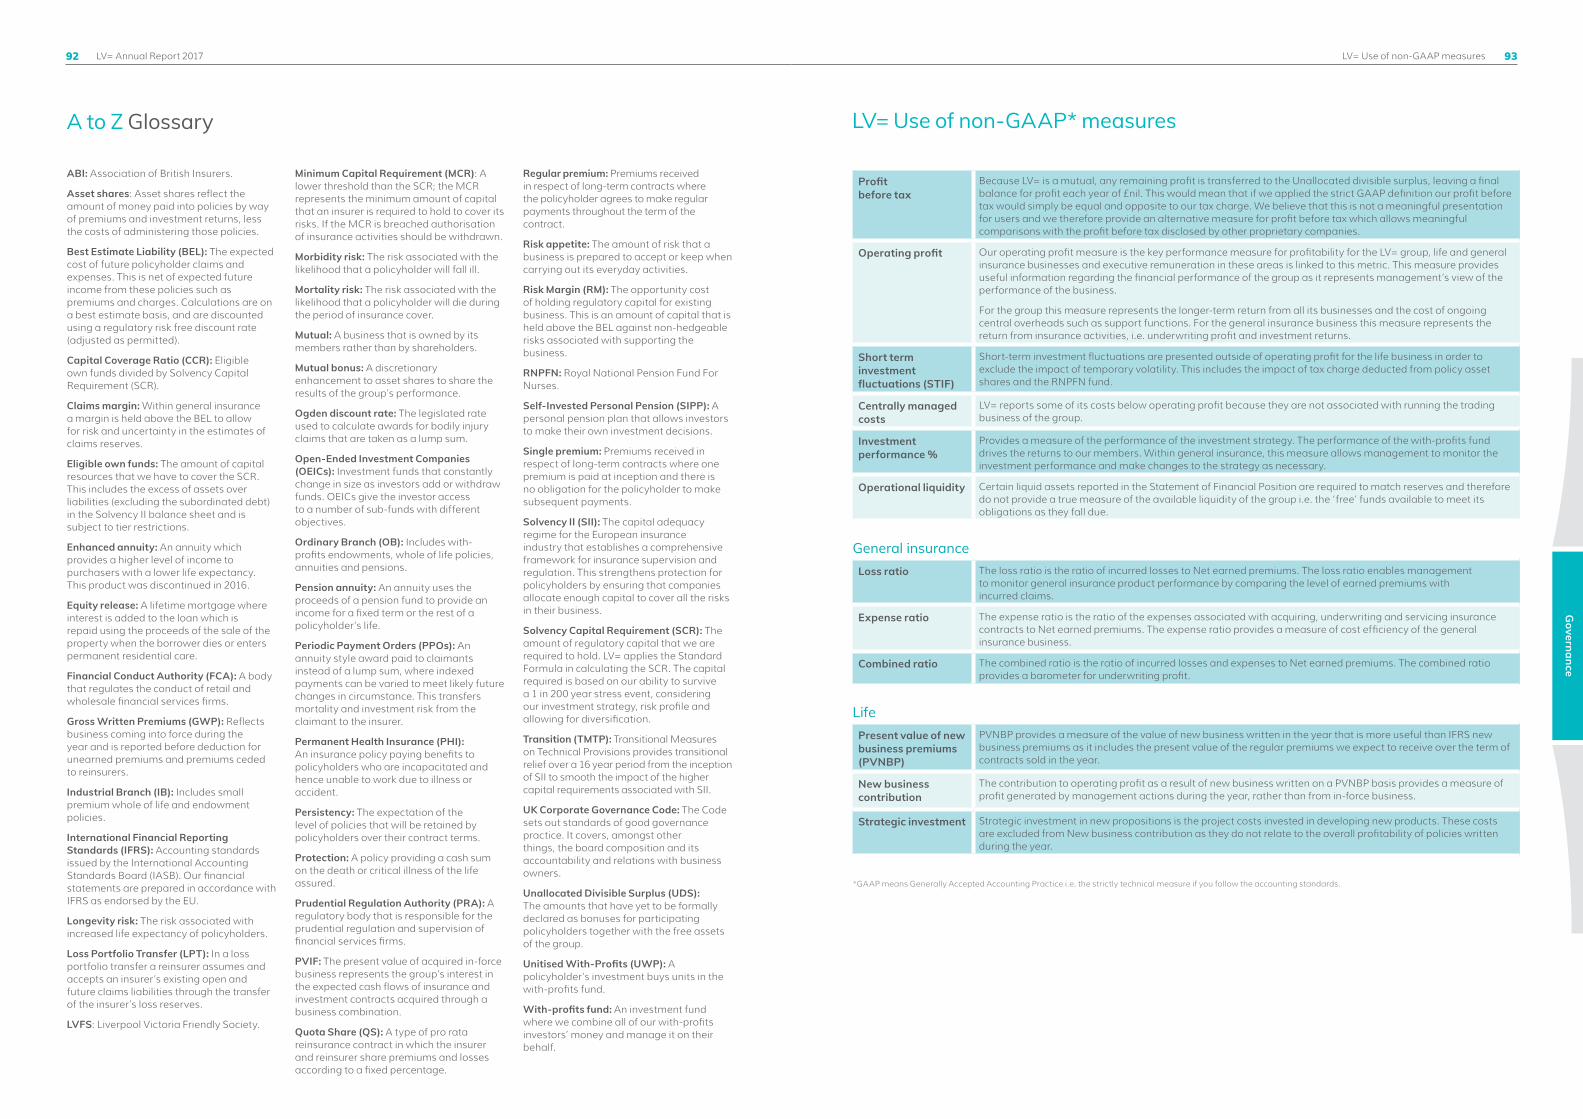
A to Z Glossary
ABI: Association of British Insurers.
Asset shares: Asset shares reflect the amount of money paid into policies by way of premiums and investment returns, less the costs of administering those policies.
Best Estimate Liability (BEL): The expected cost of future policyholder claims and expenses. This is net of expected future income from these policies such as premiums and charges. Calculations are on a best estimate basis, and are discounted using a regulatory risk free discount rate (adjusted as permitted).
Capital Coverage Ratio (CCR): Eligible own funds divided by Solvency Capital Requirement (SCR).
Claims margin: Within general insurance a margin is held above the BEL to allow for risk and uncertainty in the estimates of claims reserves.
Eligible own funds: The amount of capital resources that we have to cover the SCR. This includes the excess of assets over liabilities (excluding the subordinated debt) in the Solvency II balance sheet and is subject to tier restrictions.
Enhanced annuity: An annuity which provides a higher level of income to purchasers with a lower life expectancy. This product was discontinued in 2016.
Equity release: A lifetime mortgage where interest is added to the loan which is repaid using the proceeds of the sale of the property when the borrower dies or enters permanent residential care.
Financial Conduct Authority (FCA): A body that regulates the conduct of retail and wholesale financial services firms.
Gross Written Premiums (GWP): Reflects business coming into force during the year and is reported before deduction for unearned premiums and premiums ceded to reinsurers.
Industrial Branch (IB): Includes small premium whole of life and endowment policies.
International Financial Reporting Standards (IFRS): Accounting standards issued by the International Accounting Standards Board (IASB). Our financial statements are prepared in accordance with IFRS as endorsed by the EU.
Longevity risk: The risk associated with increased life expectancy of policyholders.
Loss Portfolio Transfer (LPT): In a loss portfolio transfer a reinsurer assumes and accepts an insurer’s existing open and future claims liabilities through the transfer of the insurer’s loss reserves.
LVFS: Liverpool Victoria Friendly Society.
Minimum Capital Requirement (MCR): A lower threshold than the SCR; the MCR represents the minimum amount of capital that an insurer is required to hold to cover its risks. If the MCR is breached authorisation of insurance activities should be withdrawn.
Morbidity risk: The risk associated with the likelihood that a policyholder will fall ill.
Mortality risk: The risk associated with the likelihood that a policyholder will die during the period of insurance cover.
Mutual: A business that is owned by its members rather than by shareholders.
Mutual bonus: A discretionary enhancement to asset shares to share the results of the group’s performance.
Ogden discount rate: The legislated rate used to calculate awards for bodily injury claims that are taken as a lump sum.
Open-Ended Investment Companies (OEICs): Investment funds that constantly change in size as investors add or withdraw funds. OEICs give the investor access to a number of sub-funds with different objectives.
Ordinary Branch (OB): Includes with-profits endowments, whole of life policies, annuities and pensions.
Pension annuity: An annuity uses the proceeds of a pension fund to provide an income for a fixed term or the rest of a policyholder’s life.
Periodic Payment Orders (PPOs): An annuity style award paid to claimants instead of a lump sum, where indexed payments can be varied to meet likely future changes in circumstance. This transfers mortality and investment risk from the claimant to the insurer.
Permanent Health Insurance (PHI): An insurance policy paying benefits to policyholders who are incapacitated and hence unable to work due to illness or accident.
Persistency: The expectation of the level of policies that will be retained by policyholders over their contract terms.
Protection: A policy providing a cash sum on the death or critical illness of the life assured.
Prudential Regulation Authority (PRA): A regulatory body that is responsible for the prudential regulation and supervision of financial services firms.
PVIF: The present value of acquired in-force business represents the group’s interest in the expected cash flows of insurance and investment contracts acquired through a business combination.
Quota Share (QS): A type of pro rata reinsurance contract in which the insurer and reinsurer share premiums and losses according to a fixed percentage.
Regular premium: Premiums received in respect of long-term contracts where the policyholder agrees to make regular payments throughout the term of the contract.
Risk appetite: The amount of risk that a business is prepared to accept or keep when carrying out its everyday activities.
Risk Margin (RM): The opportunity cost of holding regulatory capital for existing business. This is an amount of capital that is held above the BEL against non-hedgeable risks associated with supporting the business.
RNPFN: Royal National Pension Fund For Nurses.
Self-Invested Personal Pension (SIPP): A personal pension plan that allows investors to make their own investment decisions.
Single premium: Premiums received in respect of long-term contracts where one premium is paid at inception and there is no obligation for the policyholder to make subsequent payments.
Solvency II (SII): The capital adequacy regime for the European insurance industry that establishes a comprehensive framework for insurance supervision and regulation. This strengthens protection for policyholders by ensuring that companies allocate enough capital to cover all the risks in their business.
Solvency Capital Requirement (SCR): The amount of regulatory capital that we are required to hold. LV= applies the Standard Formula in calculating the SCR. The capital required is based on our ability to survive a 1 in 200 year stress event, considering our investment strategy, risk profile and allowing for diversification.
Transition (TMTP): Transitional Measures on Technical Provisions provides transitional relief over a 16 year period from the inception of SII to smooth the impact of the higher capital requirements associated with SII.
UK Corporate Governance Code: The Code sets out standards of good governance practice. It covers, amongst other things, the board composition and its accountability and relations with business owners.
Unallocated Divisible Surplus (UDS): The amounts that have yet to be formally declared as bonuses for participating policyholders together with the free assets of the group.
Unitised With-Profits (UWP): A policyholder’s investment buys units in the with-profits fund.
With-profits fund: An investment fund where we combine all of our with-profits investors’ money and manage it on their behalf.
Profit before tax
Because LV= is a mutual, any remaining profit is transferred to the Unallocated divisible surplus, leaving a final balance for profit each year of £nil. This would mean that if we applied the strict GAAP definition our profit before tax would simply be equal and opposite to our tax charge. We believe that this is not a meaningful presentation for users and we therefore provide an alternative measure for profit before tax which allows meaningful comparisons with the profit before tax disclosed by other proprietary companies.
Operating profit Our operating profit measure is the key performance measure for profitability for the LV= group, life and general insurance businesses and executive remuneration in these areas is linked to this metric. This measure provides useful information regarding the financial performance of the group as it represents management’s view of the performance of the business.
For the group this measure represents the longer-term return from all its businesses and the cost of ongoing central overheads such as support functions. For the general insurance business this measure represents the return from insurance activities, i.e. underwriting profit and investment returns.
Short term investment fluctuations (STIF)
Short-term investment fluctuations are presented outside of operating profit for the life business in order to exclude the impact of temporary volatility. This includes the impact of tax charge deducted from policy asset shares and the RNPFN fund.
Centrally managed costs
LV= reports some of its costs below operating profit because they are not associated with running the trading business of the group.
Investment performance %
Provides a measure of the performance of the investment strategy. The performance of the with-profits fund drives the returns to our members. Within general insurance, this measure allows management to monitor the investment performance and make changes to the strategy as necessary.
Operational liquidity Certain liquid assets reported in the Statement of Financial Position are required to match reserves and therefore do not provide a true measure of the available liquidity of the group i.e. the ‘free’ funds available to meet its obligations as they fall due.
General insuranceLoss ratio The loss ratio is the ratio of incurred losses to Net earned premiums. The loss ratio enables management
to monitor general insurance product performance by comparing the level of earned premiums with incurred claims.
Expense ratio The expense ratio is the ratio of the expenses associated with acquiring, underwriting and servicing insurance contracts to Net earned premiums. The expense ratio provides a measure of cost efficiency of the general insurance business.
Combined ratio The combined ratio is the ratio of incurred losses and expenses to Net earned premiums. The combined ratio provides a barometer for underwriting profit.
LifePresent value of new business premiums (PVNBP)
PVNBP provides a measure of the value of new business written in the year that is more useful than IFRS new business premiums as it includes the present value of the regular premiums we expect to receive over the term of contracts sold in the year.
New business contribution
The contribution to operating profit as a result of new business written on a PVNBP basis provides a measure of profit generated by management actions during the year, rather than from in-force business.
Strategic investment Strategic investment in new propositions is the project costs invested in developing new products. These costs are excluded from New business contribution as they do not relate to the overall profitability of policies written during the year.
*GAAP means Generally Accepted Accounting Practice i.e. the strictly technical measure if you follow the accounting standards.
LV= Use of non-GAAP* measures
92 93
Governance
LV= Annual Report 2017 LV= Use of non-GAAP measures

Our AccountsIndependent Auditors’ Report to the Members of Liverpool Victoria Friendly Society Limited 96
Statement or Comprehensive Income 104
Statement of Financial Position 105
Statement of Cash Flows 106
Notes to the Financial Statements 107
£122mProfit before tax*
*see definition on p21
£1,189mUnallocated divisible surplus
£26mMutual bonus
94 95
Our A
ccounts

97
Our A
ccounts
LV= Annual Report 2017 Our Accounts96
Report on the audit of the financial statementsOpinionIn our opinion, Liverpool Victoria Friendly Society Limited’s group financial statements and Society financial statements (the “financial statements”):
l give a true and fair view of the state of the group’s and of the Society’s affairs as at 31 December 2017 and of the group’s and the Society’s income and expenditure and cash flows for the year then ended;
l have been properly prepared in accordance with IFRSs as adopted by the European Union; and
l have been prepared in accordance with the requirements of the Friendly Societies Act 1992 and, as regards the group financial statements, Article 4 of the IAS Regulation.
We have audited the financial statements, included within the Annual Report, which comprise: the group and Society Statements of Financial Position as at 31 December 2017; the group and Society Statements of Comprehensive Income, and the group and Society Statements of Cash Flows for the year then ended; and the notes to the financial statements, which include a description of the significant accounting policies.
Our opinion is consistent with our reporting to the Audit Committee.
Basis for opinionWe conducted our audit in accordance with International Standards on Auditing (UK) (“ISAs (UK)”) and applicable law. Our responsibilities under ISAs (UK) are further described in the Auditors’ responsibilities for the audit of the financial statements section of our report. We believe that the audit evidence we have obtained is sufficient and appropriate to provide a basis for our opinion.
IndependenceWe remained independent of the group in accordance with the ethical requirements that are relevant to our audit of the financial statements in the UK, which includes the FRC’s Ethical Standard, as applicable to listed public interest entities, and we have fulfilled our other ethical responsibilities in accordance with these requirements.
To the best of our knowledge and belief, we declare that non-audit services prohibited by the FRC’s Ethical Standard were not provided to the group or the Society.
Other than those disclosed in note 12 to the financial statements, we have provided no non-audit services to the group or the Society in the period from 1 January 2017 to 31 December 2017.
Our audit approachContextLiverpool Victoria Friendly Society Limited (the ‘Society’) is an incorporated friendly society that, together with various subsidiaries, carries out insurance and financial services business in the UK. On 28 December 2017, the group completed a strategic partnership with Allianz. The transaction has resulted in 49% of the group’s General Insurance business being sold to Allianz for £500m, resulting in a gain of £124m. As control has been retained, the General Insurance business has continued to be consolidated with Allianz’s 49% stake being recognised as a non-controlling interest in the group’s financial statements. As part of the transaction, the group entered into an agreement with Allianz to sell its commercial business renewal rights. This has resulted in a gain of £52m being recognised this year.
These significant transactions together with external and internal changes impacting the valuation of the life and general insurance contract liabilities, have been key focus areas for our audit.
Overview
Materiality l Overall group materiality: £36.5 million (2016: £30 million), based on 3.1% of the group’s Unallocated Divisible Surplus (‘UDS’).
l Overall Society materiality: £32.9 million (2016: £30 million), based on 3.1% of the Society’s Unallocated Divisible Surplus (‘UDS’).
Audit scope
l The group consists of 26 active statutory entities, but primarily operates through three main trading entities (Liverpool Victoria Friendly Society Limited, Liverpool Victoria Insurance Company Limited and Highway Insurance Company Limited) at 15 locations across the UK. In our view, all three main trading entities required full scope audits of their complete financial information, due to their size and risk characteristics.
l In addition to the group’s head offices in Bournemouth, we visited five other locations. Our procedures performed at those other locations primarily focused on understanding the systems and controls in place over the recording and processing of new and renewal business and claims.
l Taken together, the procedures we performed over the three main trading entities, balances included in a further 2 reporting units and the group consolidation entries accounted for over 99% of the group’s Unallocated Divisible Surplus (‘UDS’), the group’s net earned premiums, and the group’s profit before tax, mutual bonus and UDS transfer.
Key audit matters
l The valuation of long-term insurance contract liabilities (Group and Society).l The recognition and valuation of the reinsurance assets associated with the long-term insurance contract
liabilities for OB Pensions (Group and Society).l The valuation of general insurance claims liabilities (Group).l The accounting and related disclosures of the sale of 49% of the General Insurance business and sale of the
commercial business renewal rights to Allianz (Group).
The scope of our auditAs part of designing our audit, we determined materiality and assessed the risks of material misstatement in the financial statements. In particular, we looked at where the directors made subjective judgements, for example in respect of significant accounting estimates that involved making assumptions and considering future events that are inherently uncertain.
We gained an understanding of the legal and regulatory framework applicable to the group and the industry in which it operates, and considered the risk of acts by the group which were contrary to applicable laws and regulations, including fraud. We designed audit procedures at group and significant component level to respond to the risk, recognising that the risk of not detecting a material misstatement due to fraud is higher than the risk of not detecting one resulting from error, as fraud may involve deliberate concealment by, for example, forgery or intentional misrepresentations, or through collusion. We focused on laws and regulations that could give rise to a material misstatement in the group and Society financial statements, including but not limited to, the Friendly Societies Act 1992 legislation, the Companies Act 2006, the UK Corporate Governance Code, the Prudential Regulation Authority’s regulations, the UK tax legislation and equivalent local laws and regulations applicable to significant components.
Our tests included, but were not limited to, review of the financial statement disclosures to underlying supporting documentation; review of correspondence with, reports to and making enquiries of the regulator; review of the group’s register of litigation and claims; review of policyholder complaints; review of the With-Profits Committee meeting minutes; enquiries of the Board, management, the risk and compliance function and internal audit; and review of internal audit reports, compliance reports and whistleblowing reports in so far as they related to the financial statements.
There are inherent limitations in the audit procedures described above and the further removed non-compliance with laws and regulations is from the events and transactions reflected in the financial statements, the less likely we would become aware of it.
We did not identify any key audit matters relating to irregularities, including fraud. As in all of our audits we also addressed the risk of management override of internal controls, including testing journals and evaluating whether there was evidence of bias by the directors that represented a risk of material misstatement due to fraud.
Key audit mattersKey audit matters are those matters that, in the auditors’ professional judgement, were of most significance in the audit of the financial statements of the current period and include the most significant assessed risks of material misstatement (whether or not due to fraud) identified by the auditors, including those which had the greatest effect on: the overall audit strategy; the allocation of resources in the audit; and directing the efforts of the engagement team. These matters, and any comments we make on the results of our procedures thereon, were addressed in the context of our audit of the financial statements as a whole, and in forming our opinion thereon, and we do not provide a separate opinion on these matters. This is not a complete list of all risks identified by our audit.
Independent auditors’ report to the Members of Liverpool Victoria Friendly Society LimitedYear ended 31 December 2017

99
Our A
ccounts
LV= Annual Report 2017 Our Accounts98
Key audit matter How our audit addressed the key audit matter
The valuation of long-term insurance contract liabilities (Group and Society: £9.9bn (2016: £9.4bn)) Refer to page 65 (Audit Committee Report) and note 19 to the financial statementsThe group and Society financial statements include liabilities for the estimated cost of settling benefits and claims associated with life products. We focused on this area because of the significance of these amounts in deriving the group and Society’s result, and because of the use of a suite of economic and demographic data and assumptions, which are often highly subjective. In particular, we focused on the most judgemental assumptions having an impact on the liabilities, namely longevity assumptions (i.e. life expectancy of policyholders for annuity products) and management’s use of the CMI 2016 projection model for the first time this year.
Our work to address the valuation of the long-term insurance contract liabilities was supported by our in-house life actuarial specialists and included the following procedures:l We tested the underlying data, including key reconciliations, and this testing
was performed with no material exceptions.l We compared the methodology, models and assumptions used against
recognised actuarial practises and underlying internal experience, and by applying our industry knowledge and experience, and found them to be reasonable.
l We performed an independent annual benchmarking survey, which allowed us to further challenge the assumptions setting process by comparing certain assumptions used relative to the Society’s industry peers.
In respect of longevity assumptions we:l Base longevity: Verified the appropriateness and accuracy of data used by
management to model base longevity for the Society’s annuity portfolios. We reviewed management’s assessments in calculating the assumptions based on that data and considered the extent to which the assumptions used were consistent with other sources of information, such as industry-wide mortality investigations.
l Future improvements: Considered management’s use of the CMI 2016 projection model for the first time this year by assessing management’s analysis to justify their decision. This included considering management’s use of industry data to model longevity improvements for the Society’s annuity contracts against the Society’s own experience and verifying the data used. Our market benchmarking survey indicated the use of the CMI 2016 model is consistent with other benchmark respondents, however a wide range of parameterisations have been used. We therefore challenged management’s expert judgement for the parameterisation by performing sensitivity analysis to consider the impact of different parameterisations.
l Used the above information to critically assess and challenge the judgements made by management and to determine whether there was any evidence of management bias.
Based on the work performed we found that the longevity assumptions used were supported by the evidence we obtained.
The recognition and valuation of the reinsurance assets associated with the long-term insurance contract liabilities for OB Pensions (Group and Society: £0.9bn (2016: N/A))Refer to page 65 (Audit Committee Report) and note 23 to the financial statementsIn December 2017 the group and Society entered into a reinsurance agreement to reinsure a substantial proportion of the OB pension portfolio to reduce its exposure to longevity risk. This has resulted in the assets backing the OB pension liabilities being transferred, an increase of £0.8bn to premiums ceded to reinsurance and the recognition of a reinsurance asset for this product of £0.9bn.
Management have applied expert judgement in determining whether the contract entered into transferred significant insurance risk. Further modelling the future cash flows is complex due to policyholder behaviour which impacts the reinsured benefits to be received.
Our work to address the valuation of the reinsurance asset was supported by our in-house life actuarial specialists and included the following procedures:l We verified management’s judgement that significant insurance risk had
been transferred by reviewing the terms and conditions of the contract and considering various criteria in forming our own conclusion. This included assessing the Society’s remaining exposure to risk and whether or not compensation would be paid to the Society for an uncertain future event adversely impacting its performance and position.
l We assessed the effect we expected the reinsurance agreement to have on management’s modelling of future cash flows and consequently the recognition of the reinsurance asset this year. This included validating the model changes implemented by management, checking the changes made to the model were consistent with the structure and terms of the reinsurance treaty, and assessing whether the resulting financial impacts were as expected on the net of reinsurance reserves.
Based on the work performed we found that management’s conclusion that significant insurance risk had been transferred and the assumptions and modelling used was supported by the evidence we obtained.
Key audit matter How our audit addressed the key audit matter
The valuation of general insurance claims liabilities (Group: £1.6bn (2016: £1.6bn))Refer to page 66 (Audit Committee Report) and note 19 to the financial statementsThe group financial statements include liabilities for the estimated cost of settling general insurance claims. These are included within insurance contract liabilities.
We focused on this area due to the significance of these liabilities to the group’s balance sheet and because of the inherent subjectivity of their valuation.
In particular, we focused on:l The accuracy of claims data used to
estimate the claims liabilities, in particular, the completeness of recorded claims and the consistency in setting case estimates;
l Whether any changes to the underlying risk profile of the policies written (for example, the concentration of younger drivers or changes to postcode mix) are appropriately reflected in the estimation of claims liabilities;
l The methodologies and assumptions used in estimating the costs of claims for general insurance products (mainly motor policies), in particular for those claims such as personal injury, which can take a long time to settle and where the amounts concerned can be large; and
l Whether any trends in the underlying claims experience, whether driven by internal or market level factors, have been appropriately reflected in the estimates of future claim costs.
Our work to address the valuation of the general insurance claims liabilities was supported by our in-house non-life actuarial specialists, and included the following procedures:l We tested the completeness, consistency and accuracy of claims data; andl We performed independent re-projection testing over 55% of claims liabilities
and methodology and assumptions reviews over a further 22%. Furthermore, we performed key indicator checks over 19% of the liabilities and confirmed the validity and appropriateness of claims data to identify any anomalies over the remaining balance.
Specific areas of testingCompleteness of recorded claims and consistency of case estimatesWe tested the reconciliation of source claims data to that used in the actuarial modelling process. In order to assess the completeness of recorded claims, we observed whether there was any evidence of claims being recorded on any medium other than directly onto the claims systems, and tested the operation of the controls over the handling of complaints.
We tested the effectiveness of the quality assurance processes over the work of the claims handlers in order to determine whether claims were being assessed on a consistent basis and examined a sample of claims to obtain evidence that they were based on the most recent claims information.
Consistency of risk exposureWe assessed management’s assertion that there had been no significant changes in the risk profile for material lines of business by inspecting their analyses, discussing profiles of policies written with claims and pricing teams, examining the characteristics behind claims development, and utilising our own independent trend analyses.
Methodologies and assumptionsWe carried out a substantial amount of our work on the claims liabilities at 30 September 2017, rolling forward our work to the year-end.
We performed independent re-projection testing by independently selecting our own methodology and assumptions to estimate the reserves for some of the most significant components of the claims liabilities.
We evaluated the methodology and assumptions used by management to estimate the most judgemental components of the claims liabilities. We took into account any changes to the types of risks underwritten by the business, which could increase the level of uncertainty and judgement in the estimates. Particular focus was given to future potential Ogden rate changes that would impact certain types of personal injury claims where we evaluated management’s rationale for assumptions used against government announcements and market practice and examined sensitivity testing.
For lower risk categories of reserves we considered trends in various indicators such as paid to incurred ratios, incurred to ultimate ratios and other Key Performance Indicators (“KPIs”).
Where we felt it was appropriate, we performed independent calculations to quantify the impact of differences between management’s actuarial analysis or assumptions and those which we would have conducted or selected ourselves based on our understanding of market trends and the particular circumstances of the group.
Trends in the underlying claims experienceWe considered the run-off of prior year liabilities, the sensitivity of the liabilities to alternative methods and assumptions and, where relevant, industry benchmarking.
We also examined trends in ratios driven by internal or market level factors, including those between the initial case estimates and the final costs of settlement.
Based on the work performed, no evidence was identified to suggest issues with respect to the completeness of claims data. Furthermore, we found the methodology and assumptions used in estimating the costs of claims were appropriate and supported by the evidence we obtained.

101
Our A
ccounts
LV= Annual Report 2017 Our Accounts100
Key audit matter How our audit addressed the key audit matter
The accounting and related disclosures of the sale of 49% of the General Insurance business and sale of the commercial business renewal rights to Allianz resulting in a gain of £124m and £52m respectively Refer to page 64 (Audit Committee Report) and note 46 to the financial statementsSale of General Insurance businessOn 28 December 2017 the group disposed of 49% of its holding in its General Insurance business to Allianz for £500m as part of a two-phase transaction. The second phase of the transaction will result in a further 20.9% stake being sold in two years’ time and is based on an agreed valuation of £1.020bn for the entire General Insurance business. Should the Society choose to settle earlier, it has the flexibility to do so by exercising its put option.
At 31 December 2017 control is retained by the Society and therefore the General Insurance business has continued to be consolidated in the group’s financial statements with Allianz’s 49% stake being recognised as a non-controlling interest.
We focused on this disposal as it is a material one-off transaction. The accounting for the sale and presentation of the gain in the group financial statements is complex and involves a number of judgements and the initial accounting treatment this year forms the basis for subsequent periods. Key matters we have considered include the following:l Retention of control of the General Insurance
business by the group;l Completeness of the transaction including
the forward contract and linked put option and whether all aspects had been appropriately reflected and accounted for in the financial statements;
l The measurement of the gain; andl The presentation and disclosures of the
transaction.
We reviewed accounting papers produced for the main sale and purchase transaction and the sale of the commercial business renewal rights, including contracts entered into, to evaluate and assess the impact of the transactions on the group and ensure the analysis performed by management considered all accounting and disclosure impacts. We made our own assessment as to the most appropriate accounting treatment and used this as a basis to challenge the key judgements made by management, including the assessment of any management bias.
Sale of General Insurance businessFor the main sale and purchase transaction we:l Verified management’s conclusion that the General Insurance business
should continue to be consolidated at the year-end against requirements of the International Financial Reporting Standards. We assessed various factors in forming this conclusion including assessing the proportion of and the power to influence variable returns accruing to each of the transacting parties, the level of Allianz’s managerial involvement and the composition of the new General Insurance Board.
l Assessed the completeness of the transaction by reading the contracts to verify all aspects had been identified and appropriately reflected in the financial statements. Specifically we considered the forward contract and linked put option and assessed the appropriateness of management’s assertion that the put option and forward contract had a nil-value giving consideration to the valuation date and proximity to the year-end.
l Recalculated the accuracy of the gain recognised by agreeing the receipt of cash consideration to bank and verifying the accounting treatment of the deferred consideration.
l Reviewed the presentation of the gain and disclosure of the transaction against International Financial Reporting Standards.
Based on the work performed, we found that the evidence supporting management’s accounting for the sale of the General Insurance business was appropriate and that the transaction including the financial impact had been appropriately assessed, presented and disclosed.
Sale of commercial business renewal rightsThe sale of the commercial business renewal rights to Allianz has resulted in a gain of £52m. Due to the fact that the group will continue to renew and administer these policies on behalf of Allianz for a short period post year-end there is judgement in determining whether or not the risks and rewards of ownership and managerial involvement had been substantially transferred to Allianz by the year-end.
Sale of commercial business renewal rightsWe verified management’s conclusion that the risks and rewards of ownership and managerial involvement had been substantively transferred to Allianz. In forming our view we read the contract, held discussions with the Society’s external lawyers and assessed whether Allianz had taken over managerial involvement subsequent to the sale. We also tested the calculation of the gain recognised, agreed the receipt of cash to bank and assessed the presentation and disclosure of the gain, ensuring the judgements management had formed in reaching their conclusion had been clearly described.
Based on the work performed, we found that the evidence supporting management’s accounting for the sale of the commercial business renewal rights was appropriate. We noted no exceptions from our testing of the gain calculation.
How we tailored the audit scopeWe tailored the scope of our audit to ensure that we performed enough work to be able to give an opinion on the financial statements as a whole, taking into account the structure of the group and the Society, the accounting processes and controls, and the industry in which they operate.
The group is structured along three business units, being ‘Life’ (including Protection and Retirement Solutions), ‘Heritage’ and ‘General Insurance’. The group’s financial statements consist of a consolidation of 26 active statutory entities; but the group primarily operates through the three main trading entities; the Society, encompassing the ‘Life’ and ‘Heritage’ business units and two general insurance companies, at 15 locations across the UK.
All three main trading entities are material to the group and were audited by the group engagement team. In establishing the overall approach to the group audit, we determine the type of work that we needed to perform at each entity to be able to conclude whether sufficient appropriate audit evidence had been obtained as a basis for our opinion on the group financial statements as whole.
In addition to the group’s head offices in Bournemouth, we visited five other locations, two of which were visited for the
purposes of the Society audit. Our procedures performed at those other locations primarily focused on understanding the systems and controls in place over the recording and processing of new and renewal business and claims.
In our view, all three main trading entities required a full scope audit of their complete financial information, due to their size and risk characteristics. Taken together, the procedures we performed over the three main trading entities, balances included in a further 2 reporting units and the group consolidation entries accounted for over 99% of the group’s Unallocated Divisible Surplus (‘UDS’), the group’s net earned premiums, and the group’s profit before tax, mutual bonus and UDS transfer.
MaterialityThe scope of our audit was influenced by our application of materiality. We set certain quantitative thresholds for materiality. These, together with qualitative considerations, helped us to determine the scope of our audit and the nature, timing and extent of our audit procedures on the individual financial statement line items and disclosures and in evaluating the effect of misstatements, both individually and in aggregate on the financial statements as a whole.
Based on our professional judgement, we determined materiality for the financial statements as a whole as follows:
Group financial statements Society financial statements
Overall materiality
£36.5 million (2016: £30 million). £32.9 million (2016: £30 million).
How we determined it
3.1% of the group’s Unallocated Divisible Surplus (‘UDS’). 3.1% of the Society’s Unallocated Divisible Surplus (‘UDS’).
Rationale for benchmark applied
In arriving at this judgement, we considered the financial measures, which we believed to be most relevant to the members of the group as a body. Members’ interests in the group are represented primarily by the UDS and, consequently, the UDS was considered to be the primary metric to use to determine materiality. We have also had regard to other measures such as the group’s regulatory capital surplus and other performance metrics such as operating profit and have compared the level of audit work required to be performed over the group Statement of Comprehensive Income using these alternative benchmarks.
Consistent with the group we considered the financial measures, which we believed to be most relevant to the members of the Society as a body. Members’ interests in the Society are represented primarily by the UDS and, consequently, the UDS was considered to be the primary metric to use to determine materiality. We have also had regard to other measures such as the Society’s regulatory capital surplus and other performance metrics such as operating profit and have compared the level of audit work required to be performed over the Statement of Comprehensive Income using these alternative benchmarks.
For each component in the scope of our group audit, we allocated a materiality that is less than our overall group materiality. The range of materiality allocated across components was between £3.8 million and £32.9 million. Certain components were audited to a local statutory audit materiality that was also less than our overall group materiality.
We agreed with the Audit Committee that we would report to them misstatements identified during our audit above £1.8 million (Group audit) (2016: £1.5 million) and £1.6 million (Society audit) (2016: £1.5 million) as well as misstatements below those amounts that, in our view, warranted reporting for qualitative reasons.
Going concernIn accordance with ISAs (UK) we report as follows:
Reporting obligationWe are required to report if we have anything material to add or draw attention to in respect of the directors’ statement in the financial statements about whether the directors considered it appropriate to adopt the going concern basis of accounting in preparing the financial statements and the directors’ identification of any material uncertainties to the group’s and the Society’s ability to continue as a going concern over a period of at least twelve months from the date of approval of the financial statements.
OutcomeWe have nothing material to add or to draw attention to. However, because not all future events or conditions can be predicted, this statement is not a guarantee as to the group’s and Society’s ability to continue as a going concern.

103
Our A
ccounts
LV= Annual Report 2017 Our Accounts102
Reporting on other informationThe other information comprises all of the information in the Annual Report other than the financial statements and our auditors’ report thereon. The directors are responsible for the other information. Our opinion on the financial statements does not cover the other information and, accordingly, we do not express an audit opinion or, except to the extent otherwise explicitly stated in this report, any form of assurance thereon.
In connection with our audit of the financial statements, our responsibility is to read the other information and, in doing so, consider whether the other information is materially inconsistent with the financial statements or our knowledge obtained in the audit, or otherwise appears to be materially misstated. If we identify an apparent material inconsistency or material misstatement, we are required to perform procedures
to conclude whether there is a material misstatement of the financial statements or a material misstatement of the other information. If, based on the work we have performed, we conclude that there is a material misstatement of this other information, we are required to report that fact. We have nothing to report based on these responsibilities.
With respect to the Directors’ Report, we also considered whether it had been prepared in accordance with the Friendly Societies Act 1992 and the regulations made under it.
Based on the responsibilities described above and our work undertaken in the course of the audit, the Friendly Societies Act 1992, (FSA92) and ISAs (UK) require us also to report certain opinions and matters as described below (required by ISAs (UK) unless otherwise stated).
Directors’ ReportIn our opinion, based on the work undertaken in the course of the audit, the information given in the Directors’ Report for the financial year for which the financial statements are prepared is consistent with the financial statements and has been prepared in accordance with the Friendly Societies Act 1992 and the regulations made under it. (FSA92)
In light of the knowledge and understanding of the group and the Society and their environment obtained in the course of the audit, we did not identify any material misstatements in the Directors’ Report. (FSA92)
The directors’ assessment of the prospects of the group and of the principal risks that would threaten the solvency or liquidity of the groupAs a result of the directors’ voluntary reporting on how they have applied the UK Corporate Governance Code (the “Code”), we are required to report to you if we have anything material to add or draw attention to regarding: l The directors’ confirmation on page 73 of the Annual Report that they have carried out a robust assessment of the principal
risks facing the group, including those that would threaten its business model, future performance, solvency or liquidity.l The disclosures in the Annual Report that describe those risks and explain how they are being managed or mitigated.l The directors’ explanation on page 72 of the Annual Report as to how they have assessed the prospects of the group,
over what period they have done so and why they consider that period to be appropriate, and their statement as to whether they have a reasonable expectation that the group will be able to continue in operation and meet its liabilities as they fall due over the period of their assessment, including any related disclosures drawing attention to any necessary qualifications or assumptions.
We have nothing to report in respect of this responsibility.
Other Code ProvisionsAs a result of the directors’ voluntary reporting on how they have applied the Code, we are required to report to you if, in our opinion: l The statement given by the directors, on page 74, that they consider the Annual Report taken as a whole to be fair, balanced
and understandable, and provides the information necessary for the members to assess the group’s and Society’s position and performance, business model and strategy is materially inconsistent with our knowledge of the group and Society obtained in the course of performing our audit.
l The section of the Annual Report on page 64 describing the work of the Audit Committee does not appropriately address matters communicated by us to the Audit Committee.
We have nothing to report in respect of this responsibility.
Responsibilities for the financial statements and the audit Responsibilities of the directors for the financial statementsAs explained more fully in the Directors’ statement of responsibility set out on page 74, the directors are responsible for the preparation of the financial statements in accordance with the applicable framework and for being satisfied that they give a true and fair view. The directors are also responsible for such internal control as they determine is necessary to enable the preparation of financial statements that are free from material misstatement, whether due to fraud or error.
In preparing the financial statements, the directors are responsible for assessing the group’s and the Society’s ability to continue as a going concern, disclosing as applicable, matters related to going concern and using the going concern basis of accounting unless the directors either intend to liquidate the group or the Society or to cease operations, or have no realistic alternative but to do so.
Auditors’ responsibilities for the audit of the financial statementsOur objectives are to obtain reasonable assurance about whether the financial statements as a whole are free from material misstatement, whether due to fraud or error, and to issue an auditors’ report that includes our opinion. Reasonable assurance is a high level of assurance, but is not a guarantee that an audit conducted in accordance with ISAs (UK) will always detect a material misstatement when it exists. Misstatements can arise from fraud or error and are considered material if, individually or in the aggregate, they could reasonably be expected to influence the economic decisions of users taken on the basis of these financial statements.
A further description of our responsibilities for the audit of the financial statements is located on the FRC’s website at: www.frc.org.uk/auditorsresponsibilities. This description forms part of our auditors’ report.
Use of this reportThis report, including the opinions, has been prepared for and only for the Society’s members as a body in accordance with Section 73 of the Friendly Societies Act 1992 and for no other purpose. We do not, in giving these opinions, accept or assume responsibility for any other purpose or to any other person to whom this report is shown or into whose hands it may come save where expressly agreed by our prior consent in writing.
Other required reportingFriendly Societies Act 1992 exception reportingUnder the Friendly Societies Act 1992 we are required to report to you if, in our opinion:
• we have not received all the information and explanations and access to documents we require for our audit; or
• adequate accounting records have not been kept by the group or Society; or
• the financial statements are not in agreement with the accounting records.
We have no exceptions to report arising from this responsibility.
AppointmentFollowing the recommendation of the audit committee, we were appointed by the members on 29 May 2008 to audit the financial statements for the year ended 31 December 2008 and subsequent financial periods. The period of total uninterrupted engagement is 10 years, covering the years ended 31 December 2008 to 31 December 2017.
Other voluntary reportingGoing concernThe directors have requested that we review the statement on page 72 in relation to going concern as if the Society were a premium listed company. We have nothing to report having performed our review.
The directors’ assessment of the prospects of the group and of the principal risks that would threaten the solvency or liquidity of the groupThe directors have requested that we perform a review of the directors’ statements on pages 72 and 73 that they have carried out a robust assessment of the principal risks facing the group and in relation to the longer-term viability of the group, as if the Society were a premium listed company. Our review was substantially less in scope than an audit and only consisted of making inquiries and considering the directors’ process supporting their statements; checking that the statements are in alignment with the relevant provisions of the Code; and considering whether the statements are consistent with the knowledge and understanding of the group and Society and their environment obtained in the course of the audit. We have nothing to report having performed this review.
Directors’ remunerationThe Society voluntarily prepares a Directors’ Remuneration Report in accordance with the provisions that apply to companies subject to the Companies Act 2006. The directors requested that we audit the part of the Directors’ Remuneration Report specified by the Companies Act 2006 to be audited as if the Society were a quoted company.
In our opinion, the part of the Directors’ Remuneration Report to be audited has been properly prepared in accordance with the Companies Act 2006.
Andrew G Hill (Senior Statutory Auditor)
for and on behalf of PricewaterhouseCoopers LLP Chartered Accountants and Statutory Auditors London 28 March 2018

105
Our A
ccounts
LV= Annual Report 2017 Our Accounts104
Group Society 2017 2016 2017 2016
Notes £m £m £m £m
Gross earned premiums 5 2,439 2,760 835 1,228Premiums ceded to reinsurers 5 (1,455) (601) (1,092) (261)Net earned premiums 5 984 2,159 (257) 967Investment income 6 374 401 430 406Net gains on investments 7 360 1,006 379 1,013Gain on sale of commercial business renewal rights 46 52 – – –Gain arising on Teachers acquisition – 3 – 3Other income 8 85 68 22 12Total income 1,855 3,637 574 2,401
Gross benefits and claims 9 (2,027) (2,136) (871) (859)Claims ceded to reinsurers 9 535 540 237 237Net benefits and claims 9 (1,492) (1,596) (634) (622) Gross change in long-term contract liabilities, excluding mutual bonus 21 (590) (1,591) (590) (1,591)Change in long-term contract liabilities ceded to reinsurers 21 1,035 94 1,035 94Change in non-participating value of in-force business 21 (30) 3 (30) 3Net change in contract liabilities, excluding mutual bonus before change in economic basis 21 415 (1,494) 415 (1,494)
Change in economic basis 21 (48) – (48) –Net change in contract liabilities, excluding mutual bonus 21 367 (1,494) 367 (1,494) Gross operating and administrative expenses 11 (656) (643) (222) (215)Expenses recoverable from reinsurers 11 72 72 – –Net operating and administrative expenses 11 (584) (571) (222) (215)Finance costs 10 (24) (24) (23) (23)Investment return allocated to external unit holders – (1) – –Total other expenses (608) (596) (245) (238)Total benefits, claims and expenses, excluding mutual bonus (1,733) (3,686) (512) (2,354)
Profit/(loss) before tax, mutual bonus and UDS transfer 122 (49) 62 47
Mutual bonus (26) (17) (26) (17)Income tax expense 33 (50) (35) (24) (45)Non-controlling interest 2 – – –Transfer (to)/ from the Unallocated divisible surplus 47 (48) 101 (12) 15
Profit for the year – – – – Other comprehensive income/(expense)Items that will not be reclassified to profit or lossRe-measurements of defined benefit pension schemes, net of tax 38 19 (2) 19 (2)Transfer (to)/ from the Unallocated divisible surplus 47 (19) 2 (19) 2Total comprehensive income for the year – – – –
As a Friendly Society, all net earnings are for the benefit of participating policyholders and are carried forward within the Unallocated divisible surplus. Accordingly, there is no profit for the year shown in the Statement of Comprehensive Income.
The Group and the Society have not presented a Statement of Changes in Equity as there are no equity holders in either the Group or Society.
Group Society 2017 2016 2017 2016
Notes £m £m £m £m
AssetsPension benefit asset 38 178 134 178 134Intangible assets 27 315 291 10 11Investments in group undertakings 28 – – 897 802Property and equipment 26 37 43 7 9Investment properties 3 5 3 5Deferred acquisition costs 22 95 102 – –Reinsurance assets 23 2,305 1,090 1,747 601Prepayments and accrued income 30 124 140 71 99Loans and other receivables 16 258 291 65 155Insurance receivables 29 308 293 29 16Corporation tax asset 34 – 6 – –Financial assets at fair value through income 13 13,853 13,491 11,875 11,842Derivative financial instruments 14 81 179 80 179Cash and cash equivalents (excluding bank overdrafts) 974 805 424 469Total assets 18,531 16,870 15,386 14,322 LiabilitiesUnallocated divisible surplus 47 1,189 998 1,050 1,019Participating insurance contract liabilities 19 5,279 4,999 5,279 4,999Participating investment contract liabilities 15 746 690 746 690Non-participating value of in-force business 20 (293) (324) (293) (324)
6,921 6,363 6,782 6,384Non-participating insurance contract liabilities 19 7,078 6,798 4,635 4,426Non-participating investment contract liabilities 15 3,071 2,547 3,071 2,547
10,149 9,345 7,706 6,973Net asset value attributable to external unit holders – 28 – –Non-controlling interest 48 373 (1) – –Deferred tax liability 35 97 70 98 73Provisions 39 20 12 13 11Subordinated liabilities 17 358 357 348 347Derivative financial instruments 14 193 259 187 236Other financial liabilities 18 62 116 62 116Corporation tax liability 36 20 – 9 6Insurance payables 31 50 51 22 21Trade and other payables 32 288 270 159 155Total liabilities 18,531 16,870 15,386 14,322
The financial statements on pages 104 to 197 were approved by the Board of Directors on 28 March 2018 and signed on its behalf by:
Rachel Small Company Secretary
Statement of Comprehensive IncomeYear ended 31 December 2017
Statement of Financial PositionAs at 31 December 2017
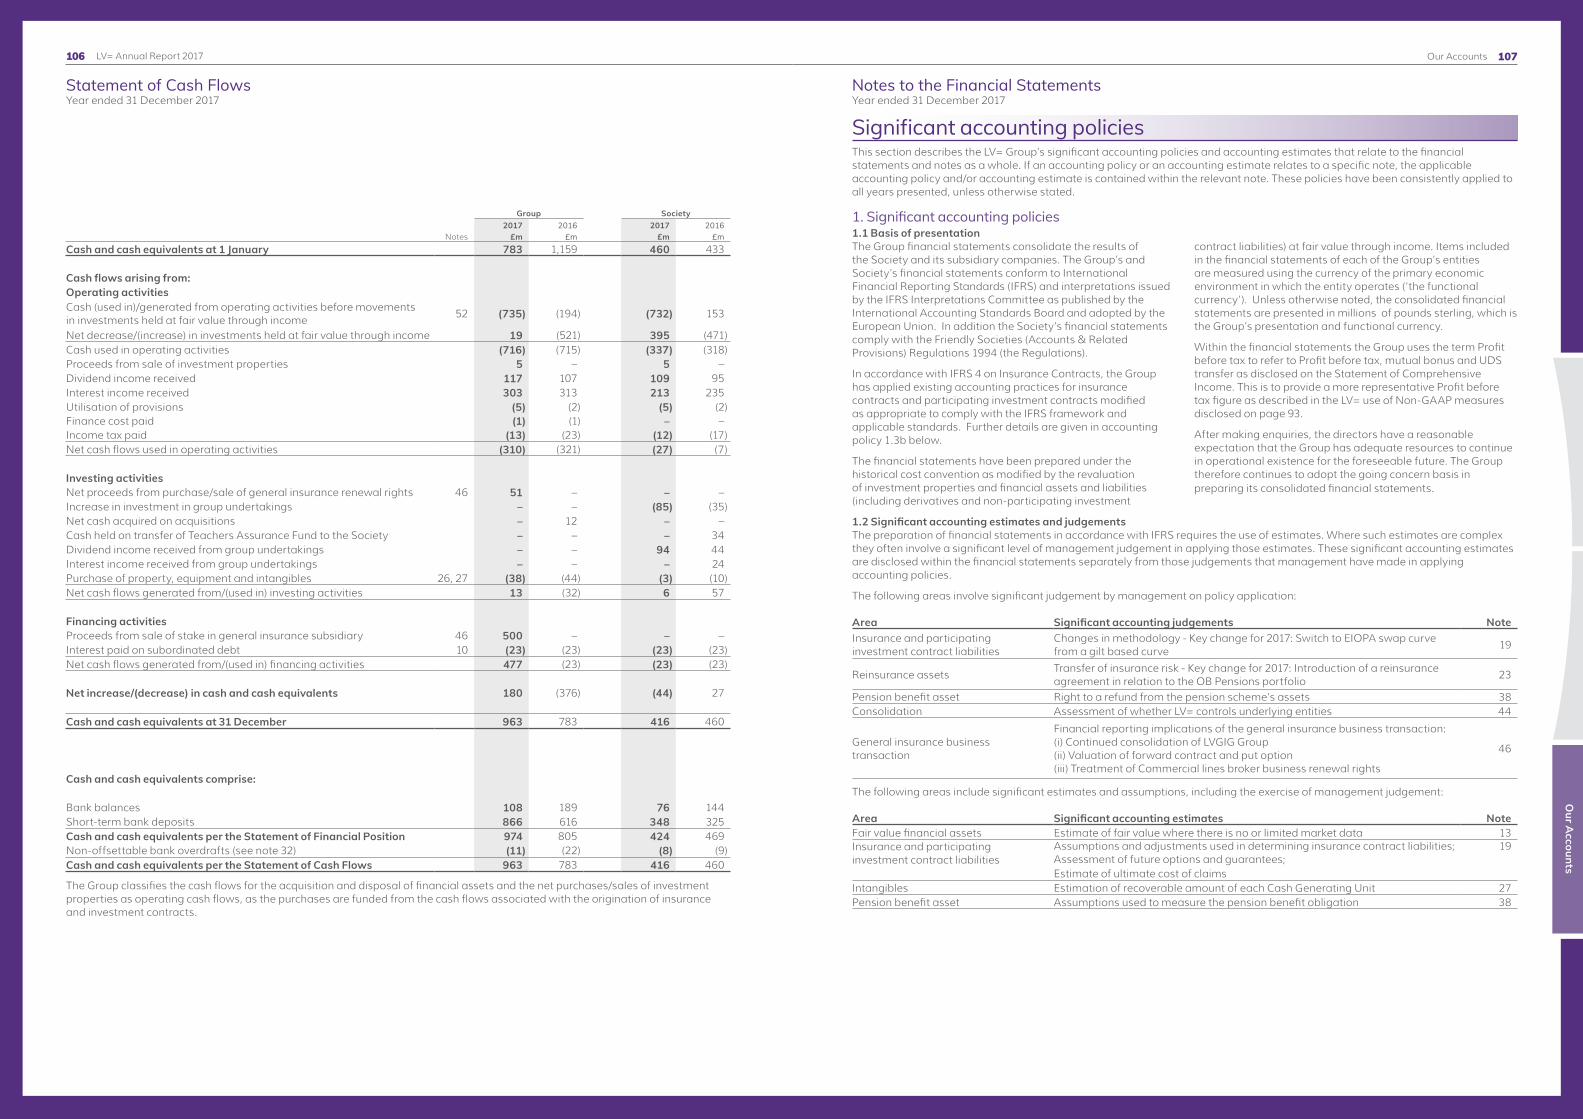
107
Our A
ccounts
LV= Annual Report 2017 Our Accounts106
Group Society 2017 2016 2017 2016
Notes £m £m £m £mCash and cash equivalents at 1 January 783 1,159 460 433 Cash flows arising from:Operating activitiesCash (used in)/generated from operating activities before movements in investments held at fair value through income
52 (735) (194) (732) 153
Net decrease/(increase) in investments held at fair value through income 19 (521) 395 (471)Cash used in operating activities (716) (715) (337) (318)Proceeds from sale of investment properties 5 – 5 –Dividend income received 117 107 109 95Interest income received 303 313 213 235Utilisation of provisions (5) (2) (5) (2)Finance cost paid (1) (1) – –Income tax paid (13) (23) (12) (17)Net cash flows used in operating activities (310) (321) (27) (7) Investing activitiesNet proceeds from purchase/sale of general insurance renewal rights 46 51 – – –Increase in investment in group undertakings – – (85) (35)Net cash acquired on acquisitions – 12 – –Cash held on transfer of Teachers Assurance Fund to the Society – – – 34Dividend income received from group undertakings – – 94 44Interest income received from group undertakings – – – 24Purchase of property, equipment and intangibles 26, 27 (38) (44) (3) (10)Net cash flows generated from/(used in) investing activities 13 (32) 6 57
Financing activitiesProceeds from sale of stake in general insurance subsidiary 46 500 – – –Interest paid on subordinated debt 10 (23) (23) (23) (23)Net cash flows generated from/(used in) financing activities 477 (23) (23) (23)
Net increase/(decrease) in cash and cash equivalents 180 (376) (44) 27
Cash and cash equivalents at 31 December 963 783 416 460 Cash and cash equivalents comprise:
Bank balances 108 189 76 144Short-term bank deposits 866 616 348 325Cash and cash equivalents per the Statement of Financial Position 974 805 424 469Non-offsettable bank overdrafts (see note 32) (11) (22) (8) (9)Cash and cash equivalents per the Statement of Cash Flows 963 783 416 460
The Group classifies the cash flows for the acquisition and disposal of financial assets and the net purchases/sales of investment properties as operating cash flows, as the purchases are funded from the cash flows associated with the origination of insurance and investment contracts.
Significant accounting policiesThis section describes the LV= Group’s significant accounting policies and accounting estimates that relate to the financial statements and notes as a whole. If an accounting policy or an accounting estimate relates to a specific note, the applicable accounting policy and/or accounting estimate is contained within the relevant note. These policies have been consistently applied to all years presented, unless otherwise stated.
1. Significant accounting policies1.1 Basis of presentationThe Group financial statements consolidate the results of the Society and its subsidiary companies. The Group’s and Society’s financial statements conform to International Financial Reporting Standards (IFRS) and interpretations issued by the IFRS Interpretations Committee as published by the International Accounting Standards Board and adopted by the European Union. In addition the Society’s financial statements comply with the Friendly Societies (Accounts & Related Provisions) Regulations 1994 (the Regulations).
In accordance with IFRS 4 on Insurance Contracts, the Group has applied existing accounting practices for insurance contracts and participating investment contracts modified as appropriate to comply with the IFRS framework and applicable standards. Further details are given in accounting policy 1.3b below.
The financial statements have been prepared under the historical cost convention as modified by the revaluation of investment properties and financial assets and liabilities (including derivatives and non-participating investment
contract liabilities) at fair value through income. Items included in the financial statements of each of the Group’s entities are measured using the currency of the primary economic environment in which the entity operates (‘the functional currency’). Unless otherwise noted, the consolidated financial statements are presented in millions of pounds sterling, which is the Group’s presentation and functional currency.
Within the financial statements the Group uses the term Profit before tax to refer to Profit before tax, mutual bonus and UDS transfer as disclosed on the Statement of Comprehensive Income. This is to provide a more representative Profit before tax figure as described in the LV= use of Non-GAAP measures disclosed on page 93.
After making enquiries, the directors have a reasonable expectation that the Group has adequate resources to continue in operational existence for the foreseeable future. The Group therefore continues to adopt the going concern basis in preparing its consolidated financial statements.
1.2 Significant accounting estimates and judgementsThe preparation of financial statements in accordance with IFRS requires the use of estimates. Where such estimates are complex they often involve a significant level of management judgement in applying those estimates. These significant accounting estimates are disclosed within the financial statements separately from those judgements that management have made in applying accounting policies.
The following areas involve significant judgement by management on policy application:
Area Significant accounting judgements NoteInsurance and participating investment contract liabilities
Changes in methodology - Key change for 2017: Switch to EIOPA swap curve from a gilt based curve
19
Reinsurance assetsTransfer of insurance risk - Key change for 2017: Introduction of a reinsurance agreement in relation to the OB Pensions portfolio
23
Pension benefit asset Right to a refund from the pension scheme's assets 38Consolidation Assessment of whether LV= controls underlying entities 44
General insurance business transaction
Financial reporting implications of the general insurance business transaction:(i) Continued consolidation of LVGIG Group(ii) Valuation of forward contract and put option(iii) Treatment of Commercial lines broker business renewal rights
46
The following areas include significant estimates and assumptions, including the exercise of management judgement:
Area Significant accounting estimates NoteFair value financial assets Estimate of fair value where there is no or limited market data 13Insurance and participating investment contract liabilities
Assumptions and adjustments used in determining insurance contract liabilities; 19Assessment of future options and guarantees;Estimate of ultimate cost of claims
Intangibles Estimation of recoverable amount of each Cash Generating Unit 27Pension benefit asset Assumptions used to measure the pension benefit obligation 38
Statement of Cash FlowsYear ended 31 December 2017
Notes to the Financial StatementsYear ended 31 December 2017
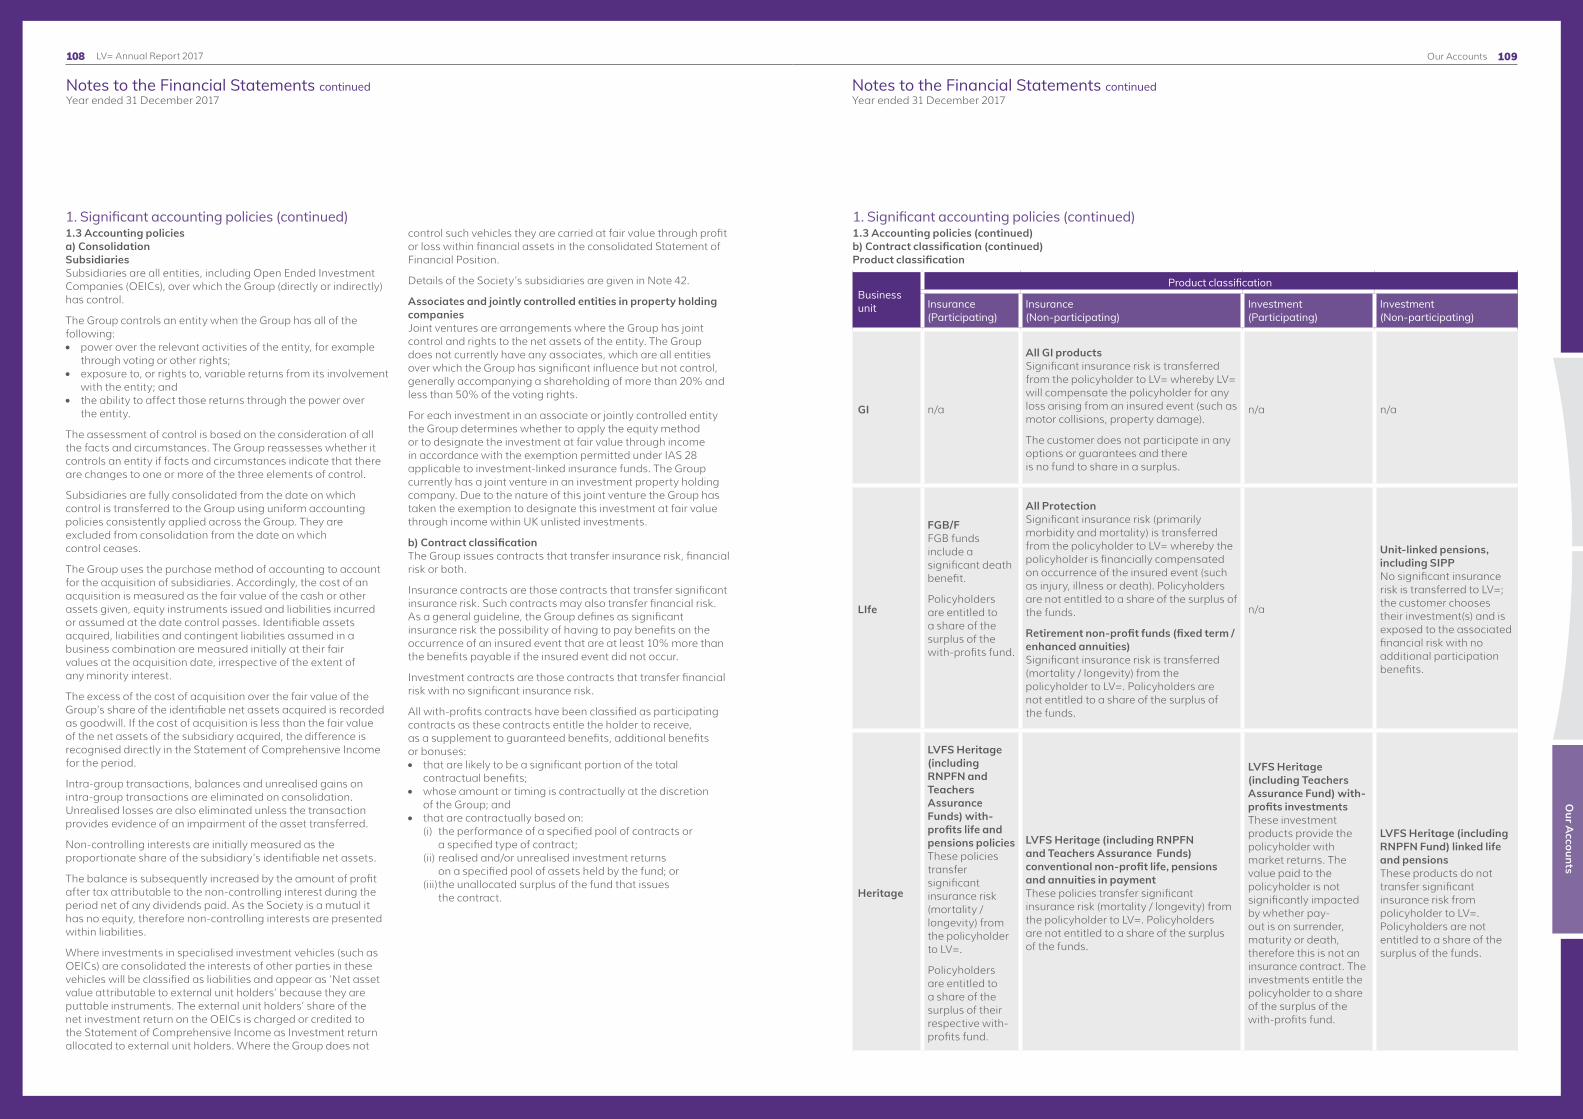
109
Notes to the Financial Statements continuedYear ended 31 December 2017
Notes to the Financial Statements continuedYear ended 31 December 2017
Our A
ccounts
LV= Annual Report 2017 Our Accounts108
1. Significant accounting policies (continued)1.3 Accounting policiesa) ConsolidationSubsidiariesSubsidiaries are all entities, including Open Ended Investment Companies (OEICs), over which the Group (directly or indirectly) has control.
The Group controls an entity when the Group has all of the following:l power over the relevant activities of the entity, for example
through voting or other rights;l exposure to, or rights to, variable returns from its involvement
with the entity; andl the ability to affect those returns through the power over
the entity.
The assessment of control is based on the consideration of all the facts and circumstances. The Group reassesses whether it controls an entity if facts and circumstances indicate that there are changes to one or more of the three elements of control.
Subsidiaries are fully consolidated from the date on which control is transferred to the Group using uniform accounting policies consistently applied across the Group. They are excluded from consolidation from the date on which control ceases.
The Group uses the purchase method of accounting to account for the acquisition of subsidiaries. Accordingly, the cost of an acquisition is measured as the fair value of the cash or other assets given, equity instruments issued and liabilities incurred or assumed at the date control passes. Identifiable assets acquired, liabilities and contingent liabilities assumed in a business combination are measured initially at their fair values at the acquisition date, irrespective of the extent of any minority interest.
The excess of the cost of acquisition over the fair value of the Group’s share of the identifiable net assets acquired is recorded as goodwill. If the cost of acquisition is less than the fair value of the net assets of the subsidiary acquired, the difference is recognised directly in the Statement of Comprehensive Income for the period.
Intra-group transactions, balances and unrealised gains on intra-group transactions are eliminated on consolidation. Unrealised losses are also eliminated unless the transaction provides evidence of an impairment of the asset transferred.
Non-controlling interests are initially measured as the proportionate share of the subsidiary’s identifiable net assets.
The balance is subsequently increased by the amount of profit after tax attributable to the non-controlling interest during the period net of any dividends paid. As the Society is a mutual it has no equity, therefore non-controlling interests are presented within liabilities.
Where investments in specialised investment vehicles (such as OEICs) are consolidated the interests of other parties in these vehicles will be classified as liabilities and appear as ‘Net asset value attributable to external unit holders’ because they are puttable instruments. The external unit holders’ share of the net investment return on the OEICs is charged or credited to the Statement of Comprehensive Income as Investment return allocated to external unit holders. Where the Group does not
control such vehicles they are carried at fair value through profit or loss within financial assets in the consolidated Statement of Financial Position.
Details of the Society’s subsidiaries are given in Note 42.
Associates and jointly controlled entities in property holding companiesJoint ventures are arrangements where the Group has joint control and rights to the net assets of the entity. The Group does not currently have any associates, which are all entities over which the Group has significant influence but not control, generally accompanying a shareholding of more than 20% and less than 50% of the voting rights.
For each investment in an associate or jointly controlled entity the Group determines whether to apply the equity method or to designate the investment at fair value through income in accordance with the exemption permitted under IAS 28 applicable to investment-linked insurance funds. The Group currently has a joint venture in an investment property holding company. Due to the nature of this joint venture the Group has taken the exemption to designate this investment at fair value through income within UK unlisted investments.
b) Contract classification The Group issues contracts that transfer insurance risk, financial risk or both.
Insurance contracts are those contracts that transfer significant insurance risk. Such contracts may also transfer financial risk. As a general guideline, the Group defines as significant insurance risk the possibility of having to pay benefits on the occurrence of an insured event that are at least 10% more than the benefits payable if the insured event did not occur.
Investment contracts are those contracts that transfer financial risk with no significant insurance risk.
All with-profits contracts have been classified as participating contracts as these contracts entitle the holder to receive, as a supplement to guaranteed benefits, additional benefits or bonuses:l that are likely to be a significant portion of the total
contractual benefits;l whose amount or timing is contractually at the discretion
of the Group; andl that are contractually based on:
(i) the performance of a specified pool of contracts or a specified type of contract; (ii) realised and/or unrealised investment returns on a specified pool of assets held by the fund; or (iii) the unallocated surplus of the fund that issues the contract.
1. Significant accounting policies (continued)1.3 Accounting policies (continued)b) Contract classification (continued) Product classification
Business unit
Product classification
Insurance (Participating)
Insurance (Non-participating)
Investment (Participating)
Investment (Non-participating)
GI n/a
All GI productsSignificant insurance risk is transferred from the policyholder to LV= whereby LV= will compensate the policyholder for any loss arising from an insured event (such as motor collisions, property damage).
The customer does not participate in any options or guarantees and there is no fund to share in a surplus.
n/a n/a
LIfe
FGB/FFGB funds include a significant death benefit.
Policyholders are entitled to a share of the surplus of the with-profits fund.
All ProtectionSignificant insurance risk (primarily morbidity and mortality) is transferred from the policyholder to LV= whereby the policyholder is financially compensated on occurrence of the insured event (such as injury, illness or death). Policyholders are not entitled to a share of the surplus of the funds.
Retirement non-profit funds (fixed term / enhanced annuities)Significant insurance risk is transferred (mortality / longevity) from the policyholder to LV=. Policyholders are not entitled to a share of the surplus of the funds.
n/a
Unit-linked pensions, including SIPPNo significant insurance risk is transferred to LV=; the customer chooses their investment(s) and is exposed to the associated financial risk with no additional participation benefits.
Heritage
LVFS Heritage (including RNPFN and Teachers Assurance Funds) with-profits life and pensions policiesThese policies transfer significant insurance risk (mortality / longevity) from the policyholder to LV=.
Policyholders are entitled to a share of the surplus of their respective with-profits fund.
LVFS Heritage (including RNPFN and Teachers Assurance Funds) conventional non-profit life, pensions and annuities in payment These policies transfer significant insurance risk (mortality / longevity) from the policyholder to LV=. Policyholders are not entitled to a share of the surplus of the funds.
LVFS Heritage (including Teachers Assurance Fund) with-profits investments These investment products provide the policyholder with market returns. The value paid to the policyholder is not significantly impacted by whether pay-out is on surrender, maturity or death, therefore this is not an insurance contract. The investments entitle the policyholder to a share of the surplus of the with-profits fund.
LVFS Heritage (including RNPFN Fund) linked life and pensions These products do not transfer significant insurance risk from policyholder to LV=. Policyholders are not entitled to a share of the surplus of the funds.

111
Notes to the Financial Statements continuedYear ended 31 December 2017
Notes to the Financial Statements continuedYear ended 31 December 2017
Our A
ccounts
LV= Annual Report 2017 Our Accounts110
1. Significant accounting policies (continued) 1.3 Accounting policies (continued)c) Foreign currenciesInvestment assets and liabilities denominated in foreign currencies are translated to sterling at rates of exchange ruling at the end of the year. Purchases and sales of investments denominated in foreign currencies are translated at the rates prevailing at the dates of the transactions. Exchange gains and losses are dealt with in that part of the Statement of Comprehensive Income in which the underlying transaction is reported.
d) Financial assets and liabilitiesRecognitionThe Group classifies its financial assets and liabilities upon initial recognition as shown below. The classification is impacted by the nature of the instrument and the purpose for which the investments were acquired:
Category Financial Instrument Basis of classification Subsequent Measurement
Recognition of change in fair value
Designated fair value through profit and loss (FVTPL) on initial recognition
Debt securities, Equity securities
Where the investment return is managed on the basis of the total return on investment.
Fair value using prices at the end of the period.
Income Statement – Net investment gains/ (losses).
Loans secured on residential and commercial property
Fair value on a discounted cash flow basis, taking into account no negative equity guarantees where relevant.
Non-participating investment contract liabilities
Designated as fair value in order to avoid a measurement inconsistency with the associated unit-linked financial assets.
Amount equal to the fair value of the associated unit-linked financial assets.
Fair value through profit and loss Held for trading
Derivative assets/ (liabilities)
Derivatives are classified as held for trading as required by IAS 39.
Carried at fair value. Asset/(liability) classification dependant on whether fair value is positive or negative.
Income Statement –Net investment gains/ (losses).
Loans and receivables
Loans, reinsurance deposits, other deposits and financial assets arising from non-investment activities
Financial assets with fixed or determinable payments not quoted in an active market.
Amortised cost using the effective interest method.
Income Statement –Net investment gains/ (losses) when realised or impaired.
Cash and cash equivalents
Cash and cash equivalents
Consist of cash and highly liquid investments that are readily convertible into a known amount of cash.
Carrying amounts at amortised cost.
n/a
Other financial liabilities
Subordinated debt Financial liabilities with fixed or determinable payments and maturity date.
Amortised cost using the effective interest method.
n/a
The accounting policy for each type of financial asset or liability is included within the relevant note for the category.
DerecognitionA financial asset is derecognised when:l the rights to receive cash flows from the asset have expired;
or l the Group has transferred its rights to receive cash flows from the asset and has: – transferred the risks and rewards of the asset; or
– transferred control of the asset.
A financial liability is derecognised when the obligation under the liability is discharged or cancelled or expires.
1. Significant accounting policies (continued) 1.3 Accounting policies (continued) e) Liability adequacy testingLong-term insurance and participating investment contract liabilitiesAt each reporting date, an assessment is made of whether the recognised long-term contract liabilities are adequate, using current estimates of future cash flows. If that assessment shows that the carrying amount of the liabilities (less related assets) is insufficient in light of the estimated future cash flows, the deficiency is recognised in the Statement of Comprehensive Income by setting up an additional liability.
General insuranceAt each reporting date liability adequacy tests are performed to ensure the adequacy of insurance contract liabilities, net of related deferred acquisition costs. In performing these tests, current best estimates of future contractual cash flows and claims handling and administration expenses, as well as investment income from the assets backing such liabilities, are used. Any deficiency is immediately charged to the Statement of Comprehensive Income and an unexpired risk reserve is established.
f) Impairment of non-financial assetsAssets that have an indefinite useful life, for example goodwill, are not subject to amortisation and are tested annually for impairment. Assets that are subject to amortisation or depreciation are reviewed for impairment whenever events or changes in circumstances indicate that the carrying amount may not be recoverable. An impairment loss is recognised for the amount by which the asset’s carrying amount exceeds its recoverable amount. The recoverable amount is the higher of an asset’s fair value less costs to sell and value in use. For the purposes of assessing impairment, assets are grouped at the lowest levels for which there are separately identifiable cash flows (cash-generating units).
Non-financial assets, other than goodwill, that suffered impairment are reviewed for possible reversal of the impairment at each reporting date.
g) Cash and cash equivalentsCash and cash equivalents comprise cash at bank and in hand, and short-term deposits with an original maturity of three months or less.
For the purpose of the Statement of Cash Flows, Cash and cash equivalents are as defined above but are shown net of outstanding bank overdrafts.
h) CollateralCollateral is received or pledged in the form of cash collateral and non-cash collateral.
Cash collateralCash collateral received, which is not legally segregated from the Group, is recognised as an asset with a corresponding liability for its repayment in the Statement of Financial Position.
Cash collateral pledged, which is legally segregated from the Group, is derecognised from Cash and cash equivalents and a corresponding asset for its return is recognised in the Statement of Financial Position.
Non-cash collateralNon-cash collateral received where the counterparty is not in default, that is neither sold nor repledged, is not recognised in the Statement of Financial Position. Non-cash collateral pledged where the Group is not in default is not derecognised from the Statement of Financial Position and remains within the appropriate asset classification.
i) Mutual bonusThe Mutual bonus declared by the Society is presented on the Statement of Comprehensive Income below Profit before tax and not within the Gross change in long-term contract liabilities. This is to provide a more representative Profit before tax figure as described in the LV= use of Non-GAAP measures disclosed on page 93. The impact on Gross changes in long-term contract liabilities is disclosed separately within Note 21.

113
Notes to the Financial Statements continuedYear ended 31 December 2017
Notes to the Financial Statements continuedYear ended 31 December 2017
Our A
ccounts
LV= Annual Report 2017 Our Accounts112
1. Significant accounting policies (continued) 1.4 Changes and future developments in accounting policies (i) New and amended standards adopted by the Group Although no new standards have come into effect, amendments to IFRSs have been adopted by the EU for accounting periods beginning on or after 1 January 2017. These amendments have been adopted by the Group but do not have a material impact on the 2017 financial statements.
IAS 7 ‘Statement of cash flows’ has been amended as part of the Disclosure Initiative. The amendment requires entities to provide additional information to enable users to evaluate changes in liabilities arising from financing activities. For the Group and Society this relates primarily to the Subordinated debt, and the relevant disclosure is included in Note 17.
IAS 12 ‘Income taxes’ has been amended to clarify the treatment of deferred tax associated with unrealised gains and losses on financial instruments and also addresses the recoverability of deferred tax where this relates to an asset with a fair value below its tax base. Recognition of deferred tax by the Group and Society has been assessed and there is no impact of this clarification.
(ii) New standards and interpretations not yet adoptedA number of new standards and amendments to standards and interpretations are effective for annual periods beginning after 1 January 2018, and have not been applied in preparing these consolidated financial statements. None of these are expected to have a significant effect on the consolidated financial statements of the Group, except for the following:
Amendment to IFRS 4 ‘Insurance contracts’: Applying IFRS 9 ‘Financial Instruments’ with IFRS 4 ‘Insurance Contracts’, effective from 1 January 2018. The amendment provides two approaches that can be applied by eligible insurers to address concerns arising from the different effective dates of IFRS 9 and IFRS 17 ‘Insurance Contracts’; the overlay approach and the temporary exemption from IFRS 9 until adoption of IFRS 17. The Group and the Society are eligible insurers and will take the temporary exemption from IFRS 9 due to the uncertainty regarding accounting for insurance contracts and the impact of this upon the classification of financial assets.
IFRS 9, ‘Financial instruments’, addresses the classification, measurement and recognition of financial assets and financial liabilities and replaces IAS 39. The effective date is 1 January 2018, however as noted above, IFRS 9 will be deferred for the Group and Society until adoption of IFRS 17 which is effective from 1 January 2021.
IFRS 15 ‘Revenue from contracts with customers’ applies to non-insurance revenue and provides a principles-based approach for revenue recognition that is underpinned by the achievement of performance obligations. It replaces IAS 18 ‘Revenue’ and is effective from 1 January 2018. At 31 December 2017 the Group had £48m (Society £24m) of revenue that is relevant for this standard, of which £22m related to asset management fees. Revenue recognition has been assessed for these revenue streams and the impact of the application of IFRS 15 will not be material for the Group and Society because the Group’s existing accounting treatment, revenue being recognised on fulfilment of obligation, is broadly compliant with the new standard.
IFRS 16 ‘Leases’ sets out the principles for the recognition, measurement, presentation and disclosure of leases. It replaces IAS 17 ‘Leases’ and is effective from 1 January 2019. Information disclosed by lessees and lessors will enable users of financial statements to assess the effect that leases have on the financial position, financial performance and cash flows of the entity. The standard has been reviewed and it is expected that leases currently classified as operating leases will require recognition on the Statement of Financial Position at the present value of minimum lease payments. Assets and liabilities will be increased by a material amount; however the net impact on the Statement of Financial Position and Statement of Comprehensive Income is expected to be immaterial.
IFRS 17 ‘Insurance contracts’ was issued in May 2017 and replaces IFRS 4 ‘Insurance contracts’ from 1 January 2021. This provides an accounting model for insurance contracts that is more useful and consistent for insurers. In contrast to the requirements in IFRS 4, which are largely based on grandfathering previous local accounting policies, IFRS 17 provides a comprehensive model for insurance contracts, covering all relevant accounting aspects. The core of IFRS 17 is the general model, supplemented by:
l A specific adaptation for contracts with direct participation features (the variable fee approach)
l A simplified approach (the premium allocation approach) mainly for short-duration contracts
The standard will have a material impact on the Group and Society and the Group expects to invest significant efforts in transitioning its accounting to the new standard.
Segmental informationThis section details the disclosures arising under IFRS 8 Operating segments. These segmental disclosures are based on operating segments that reflect the level within the Group at which key strategic and resource allocation decisions are made and the way in which operating performance is reported internally to the Group board of directors.
During the year the heritage business has been incorporated into the life business in order to align with the future strategic direction of the overall life business. Comparative segmental information has been restated to reflect this change.
2. Segmental information
Accounting for operating profitOperating profit is a non-GAAP measure and calculated as IFRS profit before tax, mutual bonus and UDS transfer adjusted for the following items:l Centrally managed strategic costs; l Short-term investment fluctuations; this represents the unmatched movements in the value of investments;l Impact of change in long-term contract liabilities economic basis; this has been performed to better align IFRS economic basis
with Solvency II;l Finance costs;l Gains arising on strategic transactions, including acquisitions and the general insurance transaction; andl Amortisation and impairment of acquired intangibles.
The activities of each operating segment are described below:
General insurance The principal activity is to underwrite general insurance business through both direct and broker distribution channels. The primary sources of premium income are from the sale of Motor and Home products and Commercial Insurance for Small and Medium Size Enterprises. The General Insurance business also underwrites Road Rescue, Pet Insurance and Travel Insurance.
Life The principal activity is the provision of Protection and Retirement Solutions products and managing our legacy Heritage products. The core products offered in Protection are Life, Critical Illness and Income Protection Insurance. The core products offered in Retirement Solutions are Fixed-Term Annuities, Self-Invested Personal Pensions (SIPPs), Equity Release Mortgages and Flexible Guarantee Bonds. Heritage products include our LVFS with-profits business (both ordinary branch and industrial branch), the Teachers Assurance ring-fenced fund and some non-profit business and unit-linked business, which was acquired from the Royal National Pension Fund for Nurses (‘RNPFN’). Most of the Heritage products are no longer actively marketed, although the Society continues to sell newer with-profits products via the Life business channels.
For the purposes of this segmental disclosure, insurance and investment contract liabilities, operating profits, IFRS profit before tax and net change in contract liabilities shown for the Life business, are calculated after allocating the non-participating value of in-force business to this segment.
Central items and otherThis segment comprises centrally held items such as group functions.
Transactions between reportable segments are on normal commercial terms, and are included within the reported segments.
The profit measure used by the Group board of directors to monitor performance is Operating profit. Operating profit by segment is shown in the table below, together with a reconciliation of the Total operating profit to the IFRS profit before tax.

115
Notes to the Financial Statements continuedYear ended 31 December 2017
Notes to the Financial Statements continuedYear ended 31 December 2017
Our A
ccounts
LV= Annual Report 2017 Our Accounts114
2. Segmental information (continued) The following tables give details of the Group’s profit, revenue and expenses and assets and liabilities with reference to the operating segments defined on the previous page:
a) Segment profit
2017
General insurance Life
Central items and other Total
£m £m £m £mOperating profit 121 37 – 158Centrally managed costs (1) (4) (28) (33)Short-term investment fluctuations and related items – 75 (38) 37Change in long-term contract liabilities economic basis – (48) – (48)Finance costs – – (24) (24)Impact of general insurance transaction on profit 46 – (11) 35Amortisation of acquired intangibles (2) (1) – (3)Profit/(loss) before tax, mutual bonus and UDS transfer 164 59 (101) 122
2016
General insurance Life
Central items and other Total
£m £m £m £m
Operating (loss)/profit (26) 13 1 (12)Centrally managed costs (2) (4) (21) (27)Short-term investment fluctuations and related items – 53 (39) 14Finance costs – – (24) (24)Gain arising on Teachers acquisition – 3 – 3Amortisation of acquired intangibles (2) (1) – (3)(Loss)/profit before tax, mutual bonus and UDS transfer (30) 64 (83) (49)
2. Segmental information (continued) b) Segment revenue and expensesAll revenues disclosed in the tables below are external.
Year ended 31 December 2017
General insurance Life
Central items and other Total
£m £m £m £m
Gross earned premiums 1,604 835 - 2,439Premiums ceded to reinsurers (363) (1,092) - (1,455)Net earned premiums 1,241 (257) - 984 Investment and other income 121 786 (36) 871Total segmental income 1,362 529 (36) 1,855 Gross benefits and claims (1,155) (872) - (2,027)Claims ceded to reinsurers 298 237 - 535Net benefits and claims (857) (635) - (1,492) Net change in contract liabilities - 367 - 367Other expenses (341) (202) (65) (608)Total segmental expenses (1,198) (470) (65) (1,733) Profit/(loss) before tax, mutual bonus and UDS transfer* 164 59 (101) 122
Year ended 31 December 2016
General insurance Life
Central items and other Total
£m £m £m £m
Gross earned premiums 1,530 1,230 – 2,760Premiums ceded to reinsurers (340) (261) – (601)Net earned premiums 1,190 969 – 2,159 Investment and other income 84 1,427 (33) 1,478Total segmental income 1,274 2,396 (33) 3,637 Gross benefits and claims (1,275) (861) – (2,136)Claims ceded to reinsurers 303 237 – 540Net benefits and claims (972) (624) – (1,596) Net change in contract liabilities – (1,488) (6) (1,494)Other expenses (332) (220) (44) (596)Total segmental expenses (1,304) (2,332) (50) (3,686) (Loss)/profit before tax, mutual bonus and UDS transfer* (30) 64 (83) (49)
Gross written premiums for investment contracts which are deposit accounted for and not included above are £656m (2016: £425m).
* As a Friendly Society, all net earnings are for the benefit of participating policyholders and are carried forward within the Unallocated divisible surplus, resulting in the profit for each financial year being zero. Therefore the resulting Profit before tax required to be disclosed under IFRS 8 will always be equal to the tax charge being £50m (2016: £35m) and £24m (2016: £45m) for the Group and Society respectively. In order to present a more meaningful disclosure the Profit before tax, mutual bonus and UDS transfer is disclosed in the tables above.

117
Notes to the Financial Statements continuedYear ended 31 December 2017
Notes to the Financial Statements continuedYear ended 31 December 2017
Our A
ccounts
LV= Annual Report 2017 Our Accounts116
2. Segmental information (continued) c) Segment assets and liabilities
As at 31 December 2017
General insurance Life
Central items and other Total
£m £m £m £mAssetsIntangible assets 244 71 – 315Property and equipment 6 3 28 37Financial assets 1,935 11,779 786 14,500Reinsurance assets 558 1,747 – 2,305Other assets 165 68 167 400Cash and cash equivalents 540 332 102 974Total assets 3,448 14,000 1,083 18,531 LiabilitiesInsurance and investment contract liabilities (2,427) (13,454) – (15,881)Subordinated liabilities (10) – (348) (358)Non-controlling interest – 3 (376) (373)Other liabilities (243) (349) (138) (730)Total liabilities excluding UDS (2,680) (13,800) (862) (17,342) Net Assets 768 200 221 1,189Consolidation adjustments (654) 1 653 –Unallocated divisible surplus (UDS) 114 201 874 1,189
As at 31 December 2016
General Insurance Life
Central items and other Total
£m £m £m £m
AssetsIntangible assets 217 74 – 291Property and equipment 8 4 31 43Financial assets 2,078 11,848 328 14,254Reinsurance assets 489 601 – 1,090Other assets 170 100 117 387Cash and cash equivalents 310 357 138 805Total assets 3,272 12,984 614 16,870 LiabilitiesInsurance and investment contract liabilities (2,353) (12,357) – (14,710)Subordinated liabilities (10) – (347) (357)Other liabilities (219) (390) (196) (805)Total liabilities excluding UDS (2,582) (12,747) (543) (15,872) Net Assets 690 237 71 998Consolidation adjustments (575) (156) 731 –Unallocated divisible surplus (UDS) 115 81 802 998
Within the Central items and other segment, there is a balance of £1,014m (2016: £618m) which relates to Estate net assets. The Life with-profits policyholders have access to the Estate assets, if required to settle guarantees and bonuses.
d) Major customersThe directors consider the Group’s external customers to be individual policyholders. As such, the Group is not reliant on any individual customer.
Capital and risk managementThis section details the capital and risk management approach of the Society and Group. The Group seeks to create value for its members by investing in the development of the business while maintaining an appropriate level of capital available. The risk appetite for each type of principal risk is set based on the amount necessary to meet the PRA’s capital requirements.
3. Capital managementPolicies and objectivesCapital is managed on both economic and regulatory bases to ensure the Group has sufficient funds to meet its business objectives, the promises made to members and policyholders and regulatory requirements.
The Group’s key capital management objectives are:(i) To ensure the Group’s financial strength and to support the
risks it takes on as part of its business;(ii) To give confidence to policyholders and other stakeholders
who have relationships with the Group; (iii) To comply with capital requirements imposed by its UK
regulator, the PRA, in association with the European Insurance and Occupational Pensions Authority (EIOPA) and Solvency II legislation; and
(iv) To ensure the Group’s strategy can be implemented and is sustainable.
These objectives are reviewed at least annually and benchmarks are set by which to judge the adequacy of the Group’s capital. The capital position is monitored against those benchmarks to ensure that sufficient capital is available to the Group.
The Group complied with all regulatory capital requirements that it was subject to throughout the reporting period.
Capital ManagementCapital is monitored and managed at a Group and entity level. The Group manages capital resources under Solvency II at the level of Eligible own funds. Excluding RNPFN and Teachers ring-fenced funds, Eligible own funds were £1,567m for the Group (2016: £1,296m) and £1,418m for the Society (2016: £1,284m). Including RNPFN and Teachers ring-fenced funds, Eligible own funds were £1,677m for the Group (2016: £1,411m) and £1,528m for the Society (2016: £1,400m). The inclusion of the ring-fenced funds does not change the Group capital surplus. The large divergence between Group and Society Eligible own funds over the year is caused by the reporting treatment of the majority holding of the general insurance subsidiaries and corresponds to the Group solvency capital requirement reflecting the entire general insurance subsidiaries and not just the 51% holding.
The Group seeks to deploy capital where it believes the risk is properly rewarded. Asset and liability matching is extensively used and risks are hedged where the Group believes it would otherwise receive insufficient return for the risk taken or to reduce volatility.
The Group Solvency II results are not due to be submitted to the PRA until after the release of the Annual Report. As a result, the Eligible own funds figures disclosed above are based on the best estimate of the results at the Annual Report signing date and may differ to the results published as part of the annual Solvency Financial Condition Report.
Risk appetiteThe Group has embedded its approach to risk management through its risk appetite. The risk appetite for capital management is that sufficient solvency capital is held to ensure that the Group can continue to trade following a severe adverse movement in markets or other risks. As at 31 December 2017, following the completion of capital management actions to de-risk the balance sheet including the sale of a 49% equity stake in the general insurance business and reinsurance of the OB
pensions portfolio, the target capital risk appetite was set to £350m above the Solvency Capital Requirement (equivalent to a Capital Coverage Ratio of 140% at 31 December 2017). See further details on risk management on pages 36 to 44.
Measurement and monitoring of capitalThe capital position of the Group is monitored on a regular basis and reviewed formally on a monthly basis by the Group Asset and Liability Committee (ALCO). These objectives are reviewed and benchmarks are set by which to judge the adequacy of the Group’s capital and ensure that sufficient capital is available.
The Group’s capital requirements are forecast on a regular basis and compared against the available capital and the Group’s minimum internal rate of return. The internal rate of return forecast to be achieved on potential investments is also measured against minimum required benchmarks taking into account the risks associated with the investment.
MethodologyEligible own funds comprise the excess of the value of assets over the liabilities, as valued on a Solvency II basis. Subordinated debt issued by the Group is considered to be part of Eligible own funds, rather than a liability, as it is subordinate to policyholder claims.
Assets are valued at IFRS fair value with adjustments to remove intangibles and deferred acquisition costs, and to value reassurers’ share of technical provisions consistent with the Solvency II regulations.
Liabilities are valued on a best estimate market consistent basis, with the application of a Matching Adjustment, for valuing qualifying annuity liabilities, and a Volatility Adjustment for other qualifying business. Transitional measure on technical provisions (TMTP) is recognised on the balance sheet and has been calculated on a basis approved by the Audit Committee which seeks to capture the differences between the total Financial Resources Requirement under the previous Solvency I regime and the new Solvency II regime.
The liabilities include the Risk Margin which represents an allowance for the cost of capital for a purchasing insurer taking on the portfolio of liabilities and residual risks that are deemed to be not hedgeable under Solvency II, following the 1-in-200 stress event. This is calculated using a cost of capital of 6% as prescribed by EIOPA.
The Solvency Capital Requirement (SCR) is the amount of capital required to cover the 1-in-200 worst projected future outcome in the year following the valuation, allowing for realistic management and policyholder actions and the impact of the stress on the tax position of the Group. This allows for diversification between the different businesses within the Group and between the risks to which they are exposed.
All non-insurance regulated businesses are included using their current regulatory surplus.
Allowance is made within the Solvency II Balance Sheet for the Group’s defined benefit pension scheme using results on an IFRS basis.
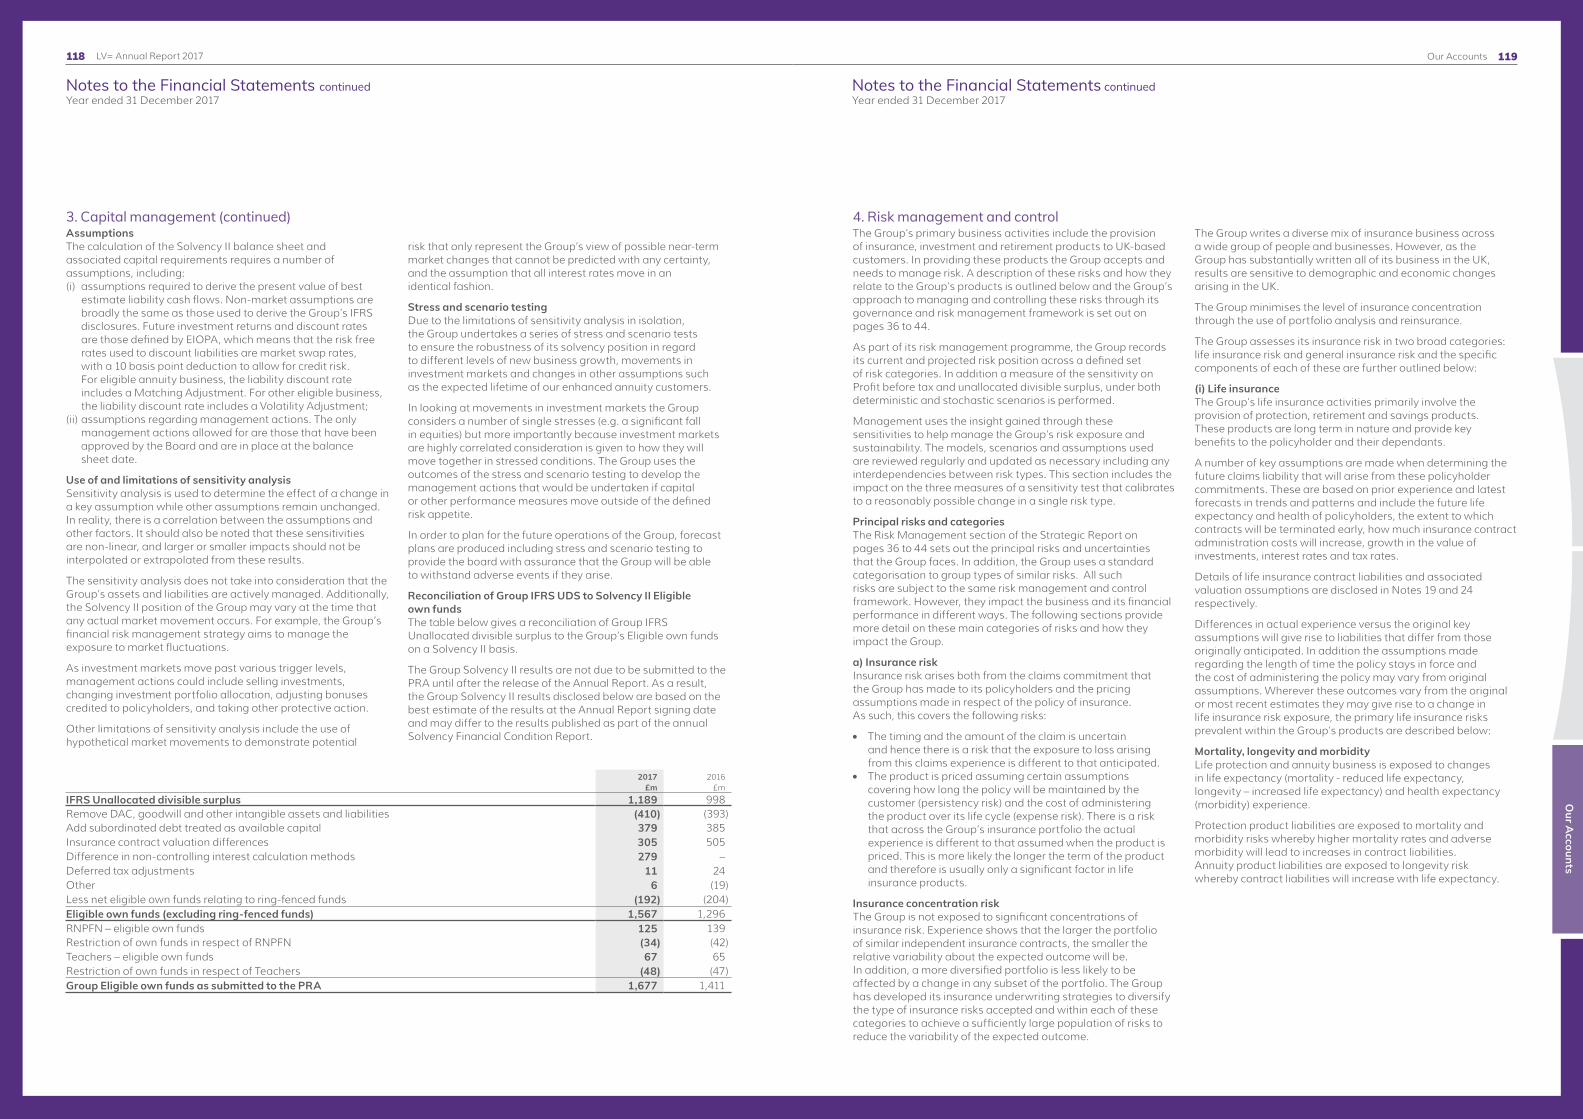
119
Notes to the Financial Statements continuedYear ended 31 December 2017
Notes to the Financial Statements continuedYear ended 31 December 2017
Our A
ccounts
LV= Annual Report 2017 Our Accounts118
3. Capital management (continued)AssumptionsThe calculation of the Solvency II balance sheet and associated capital requirements requires a number of assumptions, including: (i) assumptions required to derive the present value of best
estimate liability cash flows. Non-market assumptions are broadly the same as those used to derive the Group’s IFRS disclosures. Future investment returns and discount rates are those defined by EIOPA, which means that the risk free rates used to discount liabilities are market swap rates, with a 10 basis point deduction to allow for credit risk. For eligible annuity business, the liability discount rate includes a Matching Adjustment. For other eligible business, the liability discount rate includes a Volatility Adjustment;
(ii) assumptions regarding management actions. The only management actions allowed for are those that have been approved by the Board and are in place at the balance sheet date.
Use of and limitations of sensitivity analysisSensitivity analysis is used to determine the effect of a change in a key assumption while other assumptions remain unchanged. In reality, there is a correlation between the assumptions and other factors. It should also be noted that these sensitivities are non-linear, and larger or smaller impacts should not be interpolated or extrapolated from these results.
The sensitivity analysis does not take into consideration that the Group’s assets and liabilities are actively managed. Additionally, the Solvency II position of the Group may vary at the time that any actual market movement occurs. For example, the Group’s financial risk management strategy aims to manage the exposure to market fluctuations.
As investment markets move past various trigger levels, management actions could include selling investments, changing investment portfolio allocation, adjusting bonuses credited to policyholders, and taking other protective action.
Other limitations of sensitivity analysis include the use of hypothetical market movements to demonstrate potential
risk that only represent the Group’s view of possible near-term market changes that cannot be predicted with any certainty, and the assumption that all interest rates move in an identical fashion.
Stress and scenario testingDue to the limitations of sensitivity analysis in isolation, the Group undertakes a series of stress and scenario tests to ensure the robustness of its solvency position in regard to different levels of new business growth, movements in investment markets and changes in other assumptions such as the expected lifetime of our enhanced annuity customers.
In looking at movements in investment markets the Group considers a number of single stresses (e.g. a significant fall in equities) but more importantly because investment markets are highly correlated consideration is given to how they will move together in stressed conditions. The Group uses the outcomes of the stress and scenario testing to develop the management actions that would be undertaken if capital or other performance measures move outside of the defined risk appetite.
In order to plan for the future operations of the Group, forecast plans are produced including stress and scenario testing to provide the board with assurance that the Group will be able to withstand adverse events if they arise.
Reconciliation of Group IFRS UDS to Solvency II Eligible own fundsThe table below gives a reconciliation of Group IFRS Unallocated divisible surplus to the Group’s Eligible own funds on a Solvency II basis.
The Group Solvency II results are not due to be submitted to the PRA until after the release of the Annual Report. As a result, the Group Solvency II results disclosed below are based on the best estimate of the results at the Annual Report signing date and may differ to the results published as part of the annual Solvency Financial Condition Report.
2017 £m
2016 £m
IFRS Unallocated divisible surplus 1,189 998Remove DAC, goodwill and other intangible assets and liabilities (410) (393)Add subordinated debt treated as available capital 379 385Insurance contract valuation differences 305 505Difference in non-controlling interest calculation methods 279 –Deferred tax adjustments 11 24Other 6 (19)Less net eligible own funds relating to ring-fenced funds (192) (204)Eligible own funds (excluding ring-fenced funds) 1,567 1,296RNPFN – eligible own funds 125 139Restriction of own funds in respect of RNPFN (34) (42)Teachers – eligible own funds 67 65Restriction of own funds in respect of Teachers (48) (47)Group Eligible own funds as submitted to the PRA 1,677 1,411
4. Risk management and controlThe Group’s primary business activities include the provision of insurance, investment and retirement products to UK-based customers. In providing these products the Group accepts and needs to manage risk. A description of these risks and how they relate to the Group’s products is outlined below and the Group’s approach to managing and controlling these risks through its governance and risk management framework is set out on pages 36 to 44.
As part of its risk management programme, the Group records its current and projected risk position across a defined set of risk categories. In addition a measure of the sensitivity on Profit before tax and unallocated divisible surplus, under both deterministic and stochastic scenarios is performed.
Management uses the insight gained through these sensitivities to help manage the Group’s risk exposure and sustainability. The models, scenarios and assumptions used are reviewed regularly and updated as necessary including any interdependencies between risk types. This section includes the impact on the three measures of a sensitivity test that calibrates to a reasonably possible change in a single risk type.
Principal risks and categoriesThe Risk Management section of the Strategic Report on pages 36 to 44 sets out the principal risks and uncertainties that the Group faces. In addition, the Group uses a standard categorisation to group types of similar risks. All such risks are subject to the same risk management and control framework. However, they impact the business and its financial performance in different ways. The following sections provide more detail on these main categories of risks and how they impact the Group.
a) Insurance riskInsurance risk arises both from the claims commitment that the Group has made to its policyholders and the pricing assumptions made in respect of the policy of insurance. As such, this covers the following risks:
l The timing and the amount of the claim is uncertain and hence there is a risk that the exposure to loss arising from this claims experience is different to that anticipated.
l The product is priced assuming certain assumptions covering how long the policy will be maintained by the customer (persistency risk) and the cost of administering the product over its life cycle (expense risk). There is a risk that across the Group’s insurance portfolio the actual experience is different to that assumed when the product is priced. This is more likely the longer the term of the product and therefore is usually only a significant factor in life insurance products.
Insurance concentration riskThe Group is not exposed to significant concentrations of insurance risk. Experience shows that the larger the portfolio of similar independent insurance contracts, the smaller the relative variability about the expected outcome will be. In addition, a more diversified portfolio is less likely to be affected by a change in any subset of the portfolio. The Group has developed its insurance underwriting strategies to diversify the type of insurance risks accepted and within each of these categories to achieve a sufficiently large population of risks to reduce the variability of the expected outcome.
The Group writes a diverse mix of insurance business across a wide group of people and businesses. However, as the Group has substantially written all of its business in the UK, results are sensitive to demographic and economic changes arising in the UK.
The Group minimises the level of insurance concentration through the use of portfolio analysis and reinsurance.
The Group assesses its insurance risk in two broad categories: life insurance risk and general insurance risk and the specific components of each of these are further outlined below:
(i) Life insuranceThe Group’s life insurance activities primarily involve the provision of protection, retirement and savings products. These products are long term in nature and provide key benefits to the policyholder and their dependants.
A number of key assumptions are made when determining the future claims liability that will arise from these policyholder commitments. These are based on prior experience and latest forecasts in trends and patterns and include the future life expectancy and health of policyholders, the extent to which contracts will be terminated early, how much insurance contract administration costs will increase, growth in the value of investments, interest rates and tax rates.
Details of life insurance contract liabilities and associated valuation assumptions are disclosed in Notes 19 and 24 respectively.
Differences in actual experience versus the original key assumptions will give rise to liabilities that differ from those originally anticipated. In addition the assumptions made regarding the length of time the policy stays in force and the cost of administering the policy may vary from original assumptions. Wherever these outcomes vary from the original or most recent estimates they may give rise to a change in life insurance risk exposure, the primary life insurance risks prevalent within the Group’s products are described below:
Mortality, longevity and morbidity Life protection and annuity business is exposed to changes in life expectancy (mortality - reduced life expectancy, longevity – increased life expectancy) and health expectancy (morbidity) experience.
Protection product liabilities are exposed to mortality and morbidity risks whereby higher mortality rates and adverse morbidity will lead to increases in contract liabilities. Annuity product liabilities are exposed to longevity risk whereby contract liabilities will increase with life expectancy.
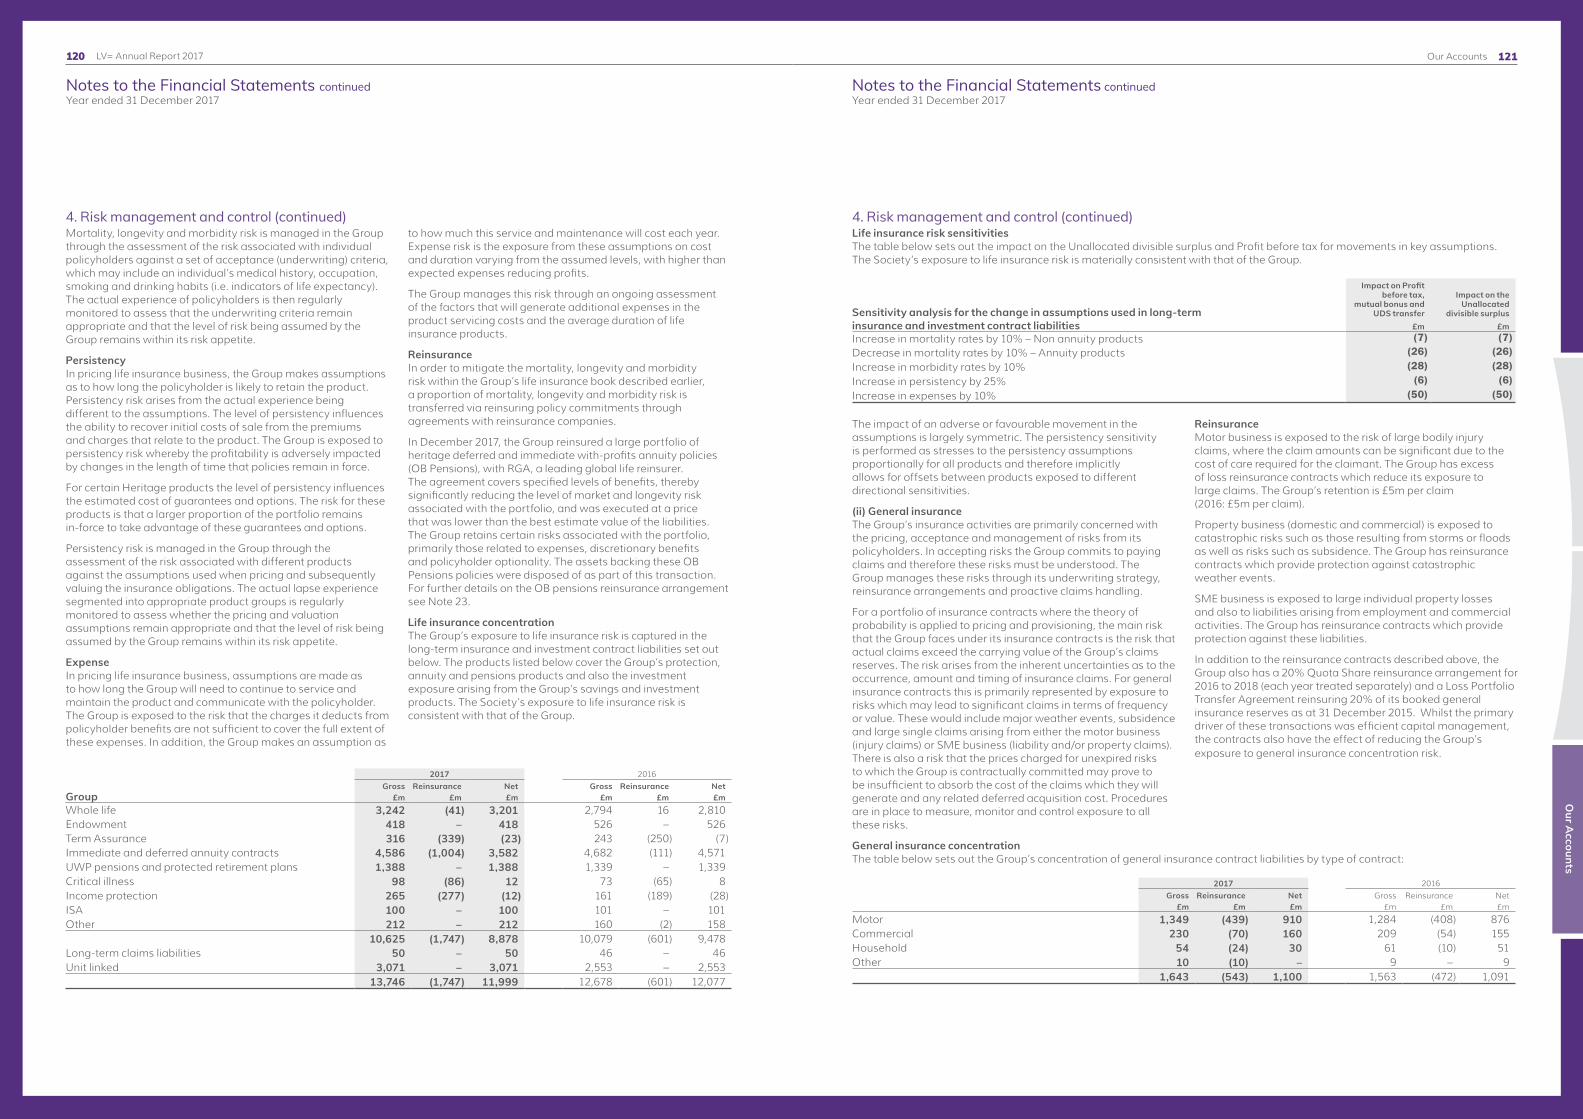
121
Notes to the Financial Statements continuedYear ended 31 December 2017
Notes to the Financial Statements continuedYear ended 31 December 2017
Our A
ccounts
LV= Annual Report 2017 Our Accounts120
4. Risk management and control (continued)Mortality, longevity and morbidity risk is managed in the Group through the assessment of the risk associated with individual policyholders against a set of acceptance (underwriting) criteria, which may include an individual’s medical history, occupation, smoking and drinking habits (i.e. indicators of life expectancy). The actual experience of policyholders is then regularly monitored to assess that the underwriting criteria remain appropriate and that the level of risk being assumed by the Group remains within its risk appetite.
Persistency In pricing life insurance business, the Group makes assumptions as to how long the policyholder is likely to retain the product. Persistency risk arises from the actual experience being different to the assumptions. The level of persistency influences the ability to recover initial costs of sale from the premiums and charges that relate to the product. The Group is exposed to persistency risk whereby the profitability is adversely impacted by changes in the length of time that policies remain in force.
For certain Heritage products the level of persistency influences the estimated cost of guarantees and options. The risk for these products is that a larger proportion of the portfolio remains in-force to take advantage of these guarantees and options.
Persistency risk is managed in the Group through the assessment of the risk associated with different products against the assumptions used when pricing and subsequently valuing the insurance obligations. The actual lapse experience segmented into appropriate product groups is regularly monitored to assess whether the pricing and valuation assumptions remain appropriate and that the level of risk being assumed by the Group remains within its risk appetite.
ExpenseIn pricing life insurance business, assumptions are made as to how long the Group will need to continue to service and maintain the product and communicate with the policyholder. The Group is exposed to the risk that the charges it deducts from policyholder benefits are not sufficient to cover the full extent of these expenses. In addition, the Group makes an assumption as
to how much this service and maintenance will cost each year. Expense risk is the exposure from these assumptions on cost and duration varying from the assumed levels, with higher than expected expenses reducing profits.
The Group manages this risk through an ongoing assessment of the factors that will generate additional expenses in the product servicing costs and the average duration of life insurance products.
ReinsuranceIn order to mitigate the mortality, longevity and morbidity risk within the Group’s life insurance book described earlier, a proportion of mortality, longevity and morbidity risk is transferred via reinsuring policy commitments through agreements with reinsurance companies.
In December 2017, the Group reinsured a large portfolio of heritage deferred and immediate with-profits annuity policies (OB Pensions), with RGA, a leading global life reinsurer. The agreement covers specified levels of benefits, thereby significantly reducing the level of market and longevity risk associated with the portfolio, and was executed at a price that was lower than the best estimate value of the liabilities. The Group retains certain risks associated with the portfolio, primarily those related to expenses, discretionary benefits and policyholder optionality. The assets backing these OB Pensions policies were disposed of as part of this transaction. For further details on the OB pensions reinsurance arrangement see Note 23.
Life insurance concentrationThe Group’s exposure to life insurance risk is captured in the long-term insurance and investment contract liabilities set out below. The products listed below cover the Group’s protection, annuity and pensions products and also the investment exposure arising from the Group’s savings and investment products. The Society’s exposure to life insurance risk is consistent with that of the Group.
2017 2016
GroupGross Reinsurance Net Gross Reinsurance Net
£m £m £m £m £m £mWhole life 3,242 (41) 3,201 2,794 16 2,810Endowment 418 – 418 526 – 526Term Assurance 316 (339) (23) 243 (250) (7)Immediate and deferred annuity contracts 4,586 (1,004) 3,582 4,682 (111) 4,571UWP pensions and protected retirement plans 1,388 – 1,388 1,339 – 1,339Critical illness 98 (86) 12 73 (65) 8Income protection 265 (277) (12) 161 (189) (28)ISA 100 – 100 101 – 101Other 212 – 212 160 (2) 158 10,625 (1,747) 8,878 10,079 (601) 9,478Long-term claims liabilities 50 – 50 46 – 46Unit linked 3,071 – 3,071 2,553 – 2,553
13,746 (1,747) 11,999 12,678 (601) 12,077
4. Risk management and control (continued)Life insurance risk sensitivitiesThe table below sets out the impact on the Unallocated divisible surplus and Profit before tax for movements in key assumptions. The Society’s exposure to life insurance risk is materially consistent with that of the Group.
Sensitivity analysis for the change in assumptions used in long-term insurance and investment contract liabilities
Impact on Profit before tax,
mutual bonus and UDS transfer
£m
Impact on the Unallocated
divisible surplus£m
Increase in mortality rates by 10% – Non annuity products (7) (7)Decrease in mortality rates by 10% – Annuity products (26) (26)
Increase in morbidity rates by 10% (28) (28)
Increase in persistency by 25% (6) (6)
Increase in expenses by 10% (50) (50)
The impact of an adverse or favourable movement in the assumptions is largely symmetric. The persistency sensitivity is performed as stresses to the persistency assumptions proportionally for all products and therefore implicitly allows for offsets between products exposed to different directional sensitivities.
(ii) General insuranceThe Group’s insurance activities are primarily concerned with the pricing, acceptance and management of risks from its policyholders. In accepting risks the Group commits to paying claims and therefore these risks must be understood. The Group manages these risks through its underwriting strategy, reinsurance arrangements and proactive claims handling.
For a portfolio of insurance contracts where the theory of probability is applied to pricing and provisioning, the main risk that the Group faces under its insurance contracts is the risk that actual claims exceed the carrying value of the Group’s claims reserves. The risk arises from the inherent uncertainties as to the occurrence, amount and timing of insurance claims. For general insurance contracts this is primarily represented by exposure to risks which may lead to significant claims in terms of frequency or value. These would include major weather events, subsidence and large single claims arising from either the motor business (injury claims) or SME business (liability and/or property claims). There is also a risk that the prices charged for unexpired risks to which the Group is contractually committed may prove to be insufficient to absorb the cost of the claims which they will generate and any related deferred acquisition cost. Procedures are in place to measure, monitor and control exposure to all these risks.
ReinsuranceMotor business is exposed to the risk of large bodily injury claims, where the claim amounts can be significant due to the cost of care required for the claimant. The Group has excess of loss reinsurance contracts which reduce its exposure to large claims. The Group’s retention is £5m per claim (2016: £5m per claim).
Property business (domestic and commercial) is exposed to catastrophic risks such as those resulting from storms or floods as well as risks such as subsidence. The Group has reinsurance contracts which provide protection against catastrophic weather events.
SME business is exposed to large individual property losses and also to liabilities arising from employment and commercial activities. The Group has reinsurance contracts which provide protection against these liabilities.
In addition to the reinsurance contracts described above, the Group also has a 20% Quota Share reinsurance arrangement for 2016 to 2018 (each year treated separately) and a Loss Portfolio Transfer Agreement reinsuring 20% of its booked general insurance reserves as at 31 December 2015. Whilst the primary driver of these transactions was efficient capital management, the contracts also have the effect of reducing the Group’s exposure to general insurance concentration risk.
General insurance concentrationThe table below sets out the Group’s concentration of general insurance contract liabilities by type of contract:
2017 2016Gross Reinsurance Net Gross Reinsurance Net
£m £m £m £m £m £m
Motor 1,349 (439) 910 1,284 (408) 876Commercial 230 (70) 160 209 (54) 155Household 54 (24) 30 61 (10) 51Other 10 (10) – 9 – 9
1,643 (543) 1,100 1,563 (472) 1,091

123
Notes to the Financial Statements continuedYear ended 31 December 2017
Notes to the Financial Statements continuedYear ended 31 December 2017
Our A
ccounts
LV= Annual Report 2017 Our Accounts122
4. Risk management and control (continued)Claims developmentThe claims provision is the estimated cost of outstanding claims from expired risks. The provision is calculated largely from using the Group’s historic claims development data. How much the past claim development will reflect future claims development will be impacted by the following factors:l Changes in actuarial processes and methodology.l Changes in risk profile.l Changes in underwriting, rating and policy conditions.l Changes in legislation and regulation e.g. PPOs, Ministry
of Justice reforms, changes to the Ogden discount rate, etc.l Changes in other external factors e.g. ‘claims farming’/
accident management firms.
It is therefore important that the impact of these items on claims development is understood. Whilst every effort has been made to ensure the claims provision appropriately allows for such changes, there remains uncertainty in the eventual reserve outcome as a result. This uncertainty can change from year to year depending on the timing and magnitude of these items.
The estimation of the ultimate cost of large bodily injury claims follows a more complex stochastic process given that these claims typically exhibit low frequency and high severity and hence the outcome is highly uncertain. Significant factors that affect the large injury claims estimation process are legislation (e.g. the Ogden discount rate used to value lump sum settlements), judicial decisions and the long delay to settlement. Over the last decade, there has been an increasing prevalence of Periodic Payment Order (‘PPO’) settlements when the Ogden discount rate was set at 2.5% p.a. and at a time when real yields were very low. These settlements have an annuity-type structure, i.e. they are typically paid annually over the claimant’s life with mortality, inflation and investment returns being the key risks. Courts may decide that a claim should be settled on a PPO basis, but in some cases the claimant will request a PPO settlement. Due to all these factors, the future development of bodily injury claims have a high degree of uncertainty compared to non-injury claims.
On 27 February 2017, the Lord Chancellor announced a change in the Ogden discount rate from 2.5% p.a. to minus 0.75% p.a. This change impacted the valuation of the cost of care element of large injury claims, and required insurance companies to hold more money in reserves in order to match the inflation risk in the long term. The change in the Ogden rate resulted in a £139m increase in the Group’s 31 December 2016 reserves.
The change in the Ogden discount rate during 2017 makes a lump sum settlement more attractive to claimants than it was previously, whilst the valuation of a PPO equivalent remains unchanged. Overall PPO claim settlement frequencies are expected to reduce as claimants are increasingly likely to desire a lump sum settlement.
On 7 September 2017 the Government confirmed that it plans to introduce a new framework based on how claimants actually invest, as well as making sure the rate is reviewed fairly and regularly. If passed, the Ministry of Justice indicated that if the rate were calculated using September 2017 economic conditions, the rate would fall in the range 0% p.a. to +1% p.a.
On 20 March 2018 the Government published a draft of its Civil Liability Bill. This contains proposals for changes to the discount rate and the governance around its setting. If enacted in its current form, and assuming no changes to current market conditions, this should result in lower settlements for certain types of liability claims. While the Group welcomes the proposals, there are a number of factors influencing this potential change meaning that its impact and timing remain uncertain. Therefore the Group continues to maintain a discount rate of -0.75% for reserving such claims, reflecting the current legislated rate.
The table below provides a sensitivity analysis of the potential impact of a change in the discount rate used to value PPOs and a change in the Ogden discount rate, with all other assumptions left unchanged.
Increase/(decrease) in Profit before tax, mutual bonus and UDS
transfer
Increase/(decrease) in Unallocated divisible
surplus2017 2016 2017 2016
£m £m £m £m
Periodic Payment Orders (PPO’s)Impact of a 1% increase in the discount rate used to value PPOs 9 8 7 6Impact of a 1% reduction in the discount rate used to value PPOs (13) (11) (11) (9)Lump sum personal injury settlementsImpact of an increase in the Ogden discount rate from -0.75% p.a. to 0% p.a. 44 n/a 36 n/a
1) The sensitivities are shown on a pre-LPT and Quota Share basis.
2) The selection of these sensitivities should not be interpreted as a prediction.
4. Risk management and control (continued) b) Financial markets riskAs a result of the insurance, investment and retirement products offered to policyholders the Group is exposed to financial markets through the investment of premiums and investment lump sums in various investment assets such as equities, gilts, corporate bonds and property.
Financial markets risk is defined as the risk that arises from adverse fluctuations or increased volatility in asset values, asset income or interest rates. This includes credit spread widening. The Group manages these risks through aligning the investment strategy, asset allocation and performance benchmarks with the Group’s risk appetite and utilising asset liability matching and stochastic modelling techniques. These actions aim to match the risks arising from the liabilities under the Group’s insurance and investment contracts with the risks inherent in its assets and the capital available to ensure the Group is able to meet policyholder commitments when they fall due and to achieve a sufficient return for members.
In addition to the actions summarised above the Group may also look to use derivative instruments particularly to assist in hedging policyholder guaranteed options and, where cost effective, to transfer risks it believes are either unrewarded or which it believes can be better managed by a third party. For example, derivatives are used to reduce exposure to fluctuations in interest rates, exchange rates and for efficient portfolio management purposes. The main derivatives used for this function are interest rate contracts (including interest rate swaps and options), forward foreign exchange contracts and equity derivatives (index futures and options) respectively. The Group does not hold derivatives for investment purposes, they are held purely as a risk management technique to manage financial market risk exposures within its investment holdings (see Note 14 on how these are used).
The investment management agreement between the Group and Columbia Threadneedle Investments specifies the limits for holdings in certain asset categories and currencies. Asset allocation and performance benchmarks are set, which ensure that each fund has an appropriate mix of assets and is not over or under exposed to a particular asset category, currency or specific investment. The Funds Management Group monitors the actual asset allocation and performance against benchmarks with oversight provided by Group ALCO and the Investment Committee.
The Group is not exposed to financial markets risk in respect of assets held to cover unit linked liabilities as these risks are borne by the holders of the contracts concerned, except to the extent that income from the fund based management charges levied on these contracts varies directly with the value of the underlying assets. Such assets are, however, prudently managed in order to meet policyholders’ risk and reward expectations. In addition, regulatory requirements prescribe the type and quality of assets that can be held to support these liabilities.
The key types of financial markets risk to which the Group is exposed are set out in more detail in the following paragraphs. Sensitivities to key market risks are shown on page 125.
(i) Asset performance riskAsset performance risk is the risk that the fair value or future cash flows of an asset or liability will fluctuate because of changes in market prices, other than those arising from interest rate or currency risks.
The Group is primarily exposed to asset performance risk arising from its investment in equities, property, gilts and corporate bonds.
Equity price riskThe Group is exposed to equity price risk from daily fluctuations in the market values of the equity portfolio. These assets are used to support contractual liabilities arising from investment and long-term insurance contracts. For investment and long-term linked insurance contracts the price movements are matched with corresponding movements in contractual obligations. For participating insurance contracts the aim is to achieve growth in excess of the obligations. For general insurance contracts, equities are held to achieve an investment return. Decreases in the market price of equities will negatively impact the profits and capital of the Group. The risks from investing in equities are managed by investing in a diverse portfolio of high quality securities ensuring that holdings are diversified across industries and concentrations in any one company or industry are limited by parameters established by the Investment Committee. In addition, the Group may use derivatives to reduce the level of equity price risk.
Property price risk The Group is subject to property price risk due to its exposure to the residential and commercial property market through its equity release and commercial mortgage products, where sustained underperformance in property prices could result in proceeds on sale being exceeded by the mortgage debt at the date of redemption (see Note 13 for disclosures relating to loans secured on residential and commercial property). This risk is managed through limits on the maximum loan to value ratio and seeking to limit concentrations in particular geographic areas. In addition, monitoring of actual experience in house prices versus expected is undertaken.
Corporate bond price risk (Credit spread risk)The credit spread risk represents the risk of adverse fluctuation in the values of assets and liabilities due to changes in the level of corporate bond credit spreads.
A widening in credit spreads, over and above risk-free yields, causes bond values to decrease. There is a partial offset where the value of certain insurance liabilities fall in value but the overall impact on IFRS profits is negative. Conversely a narrowing of credit spreads results in a positive impact on IFRS profits. The Group monitors credit spread risk by regularly reviewing its exposure to corporate bonds by sector (e.g. financial or non-financial), credit rating and duration and through its asset and liability matching tools.

125
Notes to the Financial Statements continuedYear ended 31 December 2017
Notes to the Financial Statements continuedYear ended 31 December 2017
Our A
ccounts
LV= Annual Report 2017 Our Accounts124
4. Risk management and control (continued)(ii) Interest rate risk Interest rate risk is the risk that the Group is exposed to lower returns or loss as a direct or indirect result of fluctuations in the value of specific assets and liabilities arising from changes in underlying interest rates.
Interest rate risk arises primarily from the Group’s investments in long-term debt and fixed income securities and their movement relative to the value placed on the insurance liabilities. A number of products sold by the Group have features that influence the Group’s exposure to interest rate risk. These features include guaranteed surrender values, guaranteed annuity options and minimum surrender and maturity values, which can lead to the present value of claims being higher than the value of the backing assets, when interest rates change.
The Group manages interest rate risk by investing in fixed income securities which closely match the interest rate sensitivity of the liabilities, where such investments are available. The Group also makes use of derivatives in addition to physically held assets to manage the interest rate exposure resulting from the liabilities. The Group manages its exposure on both an IFRS basis and a regulatory capital basis under Solvency II, and currently focuses on regulatory capital. These derivatives are principally interest rate swaps and swaptions.
Exposure to interest rate risk is monitored using several techniques, including scenario testing, stress testing and asset liability duration control.
(iii) Foreign currency risk The Group predominantly operates within the UK and is therefore not significantly exposed to currency exposures within its normal trading activities. However, the Group’s investment strategy and policies allow for a limited level of investment in overseas markets, via both equities and fixed interest securities. The main currency exposures here are to the Euro and US dollar.
The risk to the Group is that the fair value or future cash flows of an overseas investment asset will change as a result of changes in foreign exchange rates. Currency risk is managed by the use of exposure limits and authorisation controls operated within the Group’s risk management framework.
The table below summarises the Group’s exposure, after hedging, to foreign currency exchange risk in sterling.
2017 2016Euro US Dollar Yen Other Total Euro US Dollar Yen Other Total
£m £m £m £m £m £m £m £m £m £m
Derivatives – (1) – – (1) (77) (1) – (27) (105)Equity securities 13 122 – – 135 200 123 48 108 479Cash and cash equivalents 13 5 – – 18 13 8 – – 21
26 126 – – 152 136 130 48 81 395
The Society’s exposure to foreign currency risk in 2017 amounted to £14m Euros and £126m US dollars (2016: £18m Euros and £124m US dollars).
A strengthening of the value of sterling against the foreign currency (increase in exchange rates), in which the investment asset is denominated, will lead to a devaluation of the asset value and any associated income flows. A weakening of the value of sterling against the foreign currency will have the reverse impact.
The sensitivity of investment assets to a 10% increase/decrease in Euro and US Dollar exchange rates, net of derivatives, is £3m (2016: £14m) and £13m (2016: £13m) respectively. In determining the percentage rates to use in this sensitivity the movements in the actual market rates of Euro and US Dollars during 2017 were taken into account. The above table incorporates all material currency risk to Profit before tax. Therefore, a 10% increase/decrease across all currencies could impact Profit before tax by up to £15m (2016: £27m).
Some foreign debt securities are denominated in sterling so bear no direct currency risk and have not been included within the above table.
(iv) Investment concentrationInvestment concentration risk arises through exposure to particular asset types, geographical markets, industry sectors, groups of business undertakings or similar activities. The Group may suffer losses in the investment portfolio as a result of over exposure to particular sectors engaged in similar activities or similar economic features that would cause their ability to meet contractual obligations to be similarly affected by changes in economic, political and other conditions. The Group’s trading activities are UK-based and associated insurance and investment contract liabilities are impacted by the UK marketplace and hence there is a high concentration in corresponding matching UK investment assets.
4. Risk management and control (continued)The Group invests in a portfolio of assets and seeks to maximise portfolio expected return for a given amount of portfolio risk, or equivalently minimise risk for a given level of expected return, by carefully choosing the proportions of various assets. The Investment Committee sets the Group’s investment strategy and recommends to the Board the policy and limits required. Responsibility for implementation is delegated to
the Chief Investment Officer, with day to day investment activities being undertaken by the Group’s investment manager, Columbia Threadneedle Investments.
The Funds Management Group monitors the actual asset allocation and performance against benchmarks with oversight provided by Group ALCO and the Investment Committee.
Eurozone exposureThe table below shows the Group’s exposure by country of incorporation of the counterparty at 31 December 2017. The Society’s exposure to Eurozone risk is materially consistent with that of the Group.
2017 2016
SovereignNon
Sovereign Total SovereignNon
Sovereign Total£m £m £m £m £m £m
Italy – 35 35 – 32 32Spain – 49 49 1 114 115Other Eurozone 327 1,068 1,395 46 1,785 1,831Total 327 1,152 1,479 47 1,931 1,978
The Group’s combined exposure to Greece, Cyprus and Portugal is £1m (2016: £7m). Non-sovereign exposure includes £102m (2016: £109m) of subordinated debt.
Summary of market risk sensitivitiesThe table below sets out the impact on Profit before tax and the Unallocated divisible surplus for movements in sectors of the market that the Group is invested in, net of derivatives, excluding the Group’s defined benefit pension schemes. The 2016 profit before tax sensitivities have been restated such that the tax charge to with-profits asset shares is applied as part of Profit before tax, with no change to Unallocated divisible surplus. Explanation of the movements, and where the sensitivity for the Society is materially different to the Group, are provided below.
In determining the percentage rates to use in the sensitivity analysis reference has been made to those used for internal reporting within the Group. Where sensitivities have not been produced in both directions, the impact of the sensitivity in the other direction is materially consistent with the sensitivity provided.
2017 2016
Sensitivity analysis to movements in key market sectors
Impact on Profit before tax,
mutual bonus and UDS transfer
Impact on the Unallocated
divisible surplus
Impact on Profit before tax,
mutual bonus and UDS transfer
Impact on the Unallocated
divisible surplus£m £m £m £m
Equity values fall by 20% (69) (34) (87) (39)Property values fall by 12.5% (17) (12) (19) (15)Credit spreads increase by 100bps relative to swap yields (89) (83) (152) (143)
Government Bond spreads increase by 50bps relative to swap yields
(16) (7) – –
Fixed interest yields fall by 50bps 38 20 104 90Fixed interest yields increase by 100bps (64) (35) (182) (159)
In 2017, there have been significant changes to the hedging strategy as part of the Group’s capital optimisation activity. As a result, there is now significantly less interest rate and equity exposure in the IFRS results. In addition, the general insurance transaction with Allianz has approximately halved the exposure in market movements originating from the general insurance subsidiaries. The Society’s exposure to fixed interest yields is lower than the Group as the general insurance subsidiaries engage in Solvency II related hedging, which contribute to the Group’s exposure above.
The fall in credit exposure is materially driven by the OB pensions reinsurance transaction, due to the transfer of invested assets to the reinsurer, with the remaining reduction due to the general insurance transaction with Allianz and the reduction in corporate bonds backing the annuity business.
As part of aligning Solvency II and IFRS reporting, the reference risk-free rate used to set the discount rates which are used to value IFRS liabilities has been changed to be based on swap yields with a credit risk adjustment, in place of gilt yields. As the Group uses a mixture of gilt based assets alongside interest rate derivatives, there is a new exposure to IFRS profits of gilt yields rising relative to swap yields. As a result, the government bond spread sensitivity has been added.
Asset values and, where appropriate, asset share changes are reflected in each sensitivity. With-profits future policy related liabilities are recalculated using these revised values and, where appropriate, economic scenarios generated by an asset model calibrated to the revised risk-free rate.

127
Notes to the Financial Statements continuedYear ended 31 December 2017
Notes to the Financial Statements continuedYear ended 31 December 2017
Our A
ccounts
LV= Annual Report 2017 Our Accounts126
4. Risk management and control (continued)Fair value estimation The following fair value estimation tables present the Group’s and Society’s assets and liabilities measured at fair value by level of the fair value measurement hierarchy at 31 December 2017.
Level 1 – quoted pricesThe fair value of financial instruments included in the Level 1 category is based on the value within the bid-ask spread that is most representative of fair value quoted in an active market at the year-end date. An instrument is regarded as quoted in an active market if quoted prices are readily and regularly available from an exchange, dealer, broker, industry group, pricing service or regulatory agency and those prices represent actual and regularly occurring market transactions on an arm’s length basis.
Level 2 – observable inputsLevel 2 financial instruments are not traded in an active market and their fair value is determined using valuation techniques. These valuation techniques maximise the use of data from observable current market transactions (where it is available) using pricing obtained via pricing services, even where the market is not active. It also includes financial assets with prices based on broker quotes.
Specific valuation techniques used to value financial instruments classified as Level 2 include:l Derivatives are valued by discounted cash flow techniques,
using observable yield curves and models such as Black Scholes using implied market forward rates and volatilities.
l Units in listed investment funds are valued using quoted prices from external pricing services.
l Debt securities are valued using quoted prices from external pricing services.
l Loans secured on commercial property are valued using discounted cash flows to reflect changes in underlying gilt yields and debt margins.
l Non-participating investment contract liabilities are valued on a basis consistent with the underlying assets in the investment fund.
Level 3 – significant unobservable inputsIf one or more of the significant inputs is not based on observable market data, the instrument is included in Level 3.
Specific valuation techniques used to value financial instruments and other financial investments held at fair value classified as Level 3 include:l Private equity holdings are valued on a net asset value
basis using unobservable external unit prices factoring in distributions or calls since the latest valuations. The private equity valuations are reviewed on a monthly basis by group treasury to ensure ongoing validity and accuracy.
l The fair value of the loans secured on residential property is determined using discounted cash flow projections. The expected value of redemptions are estimated based on the assumed prepayments over future time periods (months), mortality and long-term care entry rates including any early redemption charges. The expected redemptions are discounted at swap rates plus spread plus allowances for risk factors. The full swap curve is used so each discount rate is matched to the appropriate cash flow. The assumptions used for prepayment, mortality and long-term care are based on the experience of the in-force book supported by industry data. The valuation is performed by a qualified actuary and reviewed by the Actuarial Asset Reporting Manager. The assumptions are set by the Board upon recommendation by the Audit Committee.
There were no changes to the valuation techniques during the year. There were no transfers between Levels 1 and 2 during the year.
The Group’s policy is to recognise transfers into and out of fair value hierarchy levels as at the date of the event or change in circumstances that caused the transfer.
The valuation of all of the Group’s investment holdings is performed by independent and qualified valuers.
Any changes to fair value are recognised within net gains/losses on investments within the Statement of Comprehensive Income with the exception of Investment contract liabilities where the movement is recognised within the Gross change in contract liabilities. Details of these gains/losses are disclosed within Notes 7 and 21 respectively.
4. Risk management and control (continued)
2017 2016
GroupLevel 1 Level 2 Level 3
Total fair value Level 1 Level 2 Level 3
Total fair value
£m £m £m £m £m £m £m £m
Financial assets Derivative financial instruments Interest rate swaps – 69 – 69 – 160 – 160Gilt forwards – 4 – 4 – – – –Swaptions – – 1 1 – 6 1 7Equity/index derivates – 7 – 7 – 12 – 12 – 80 1 81 – 178 1 179
Financial assets held at fair value through income
Shares, other variable yield securities and units in unit trusts – UK listed 1,973 5,656 – 7,629 1,746 4,390 – 6,136– UK unlisted – – 91 91 – – 120 120– Overseas listed 117 – – 117 464 3 – 467– Overseas unlisted – – 42 42 – – 55 55 Debt and other fixed income securities– UK listed 1,179 1,853 – 3,032 1,657 1,927 – 3,584– Overseas listed 77 1,995 – 2,072 98 2,148 – 2,246 Loans secured on residential property – – 667 667 – – 685 685
Loans secured on commercial property – 200 – 200 – 198 – 198Other – 3 – 3 – – – – 3,346 9,707 800 13,853 3,965 8,666 860 13,491 3,346 9,787 801 13,934 3,965 8,844 861 13,670 Financial liabilities Non-participating investment contract liabilities – 3,071 – 3,071 – 2,547 – 2,547
Derivative financial instrumentsCash flow swaps – 186 – 186 – 173 – 173Interest rate swaps – 4 – 4 – 29 – 29Gilt spread lock – – – – – 37 – 37Equity/index derivatives 3 – – 3 1 19 – 20 3 190 – 193 1 258 – 259 3 3,261 – 3,264 1 2,805 – 2,806
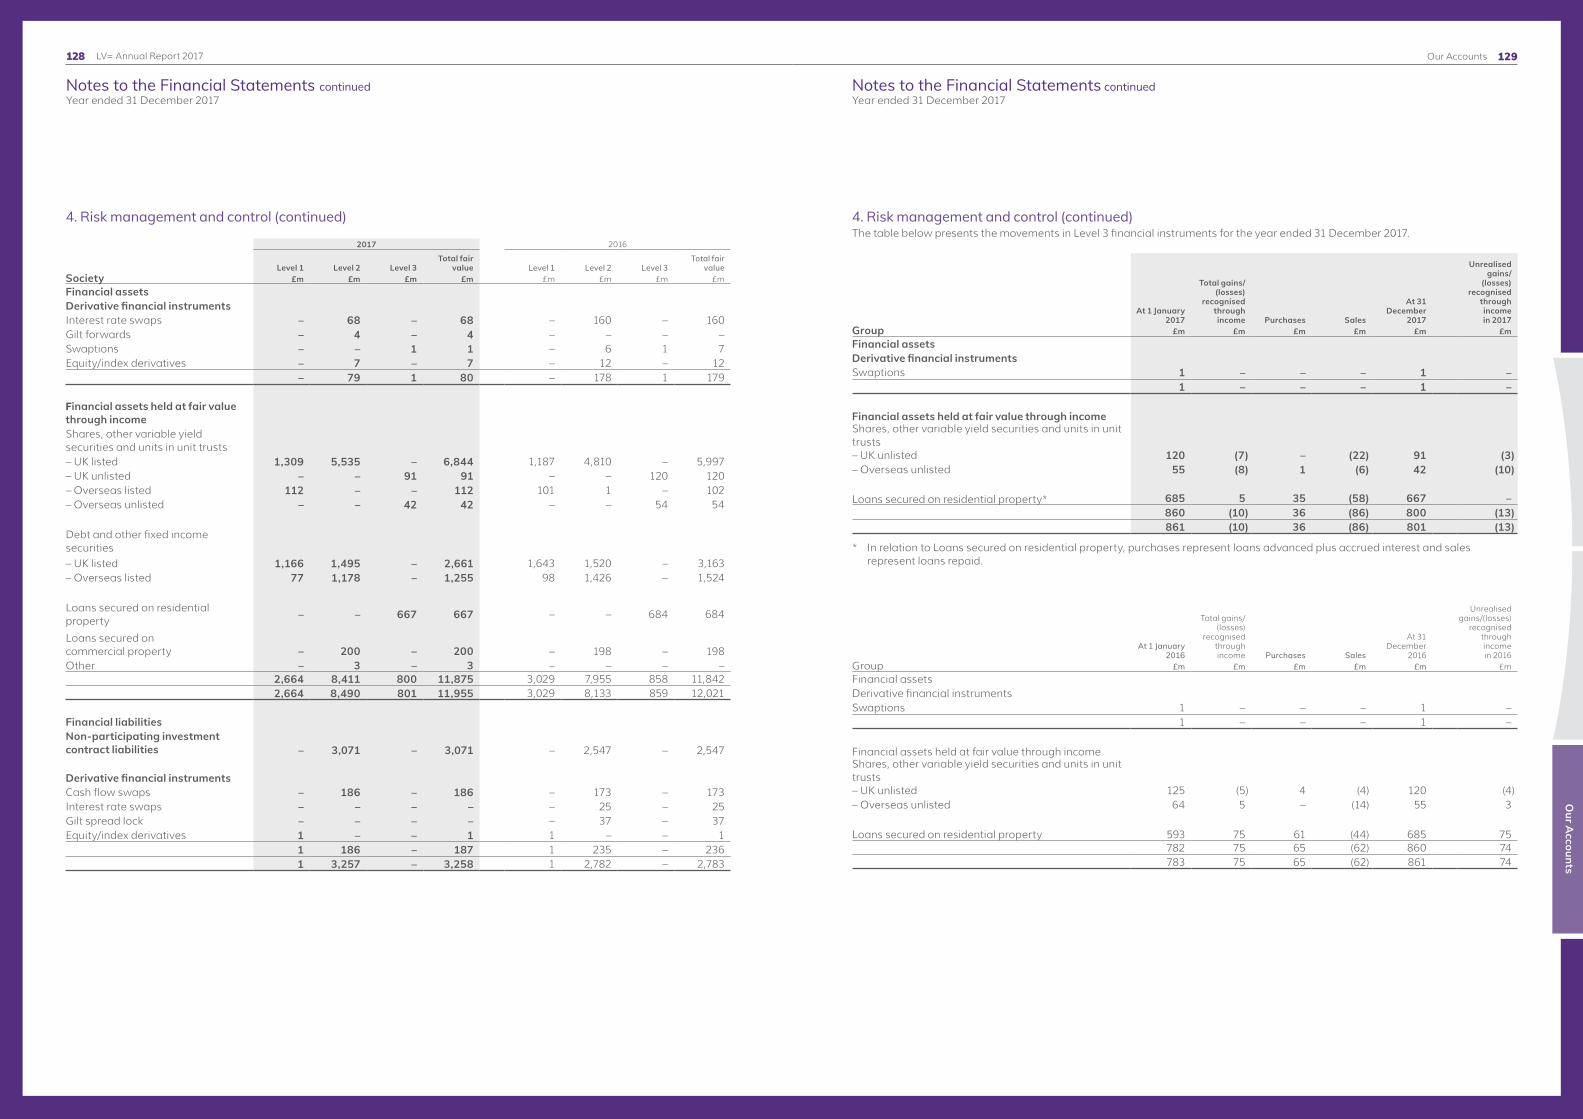
129
Notes to the Financial Statements continuedYear ended 31 December 2017
Notes to the Financial Statements continuedYear ended 31 December 2017
Our A
ccounts
LV= Annual Report 2017 Our Accounts128
4. Risk management and control (continued)
2017 2016
SocietyLevel 1 Level 2 Level 3
Total fair value Level 1 Level 2 Level 3
Total fair value
£m £m £m £m £m £m £m £m
Financial assets Derivative financial instruments Interest rate swaps – 68 – 68 – 160 – 160Gilt forwards – 4 – 4 – – – –Swaptions – – 1 1 – 6 1 7Equity/index derivatives – 7 – 7 – 12 – 12 – 79 1 80 – 178 1 179 Financial assets held at fair value through income Shares, other variable yield securities and units in unit trusts – UK listed 1,309 5,535 – 6,844 1,187 4,810 – 5,997– UK unlisted – – 91 91 – – 120 120– Overseas listed 112 – – 112 101 1 – 102– Overseas unlisted – – 42 42 – – 54 54 Debt and other fixed income securities– UK listed 1,166 1,495 – 2,661 1,643 1,520 – 3,163– Overseas listed 77 1,178 – 1,255 98 1,426 – 1,524 Loans secured on residential property – – 667 667 – – 684 684
Loans secured on commercial property – 200 – 200 – 198 – 198Other – 3 – 3 – – – – 2,664 8,411 800 11,875 3,029 7,955 858 11,842 2,664 8,490 801 11,955 3,029 8,133 859 12,021 Financial liabilities Non-participating investment contract liabilities – 3,071 – 3,071 – 2,547 – 2,547
Derivative financial instrumentsCash flow swaps – 186 – 186 – 173 – 173Interest rate swaps – – – – – 25 – 25Gilt spread lock – – – – – 37 – 37Equity/index derivatives 1 – – 1 1 – – 1 1 186 – 187 1 235 – 236 1 3,257 – 3,258 1 2,782 – 2,783
4. Risk management and control (continued)The table below presents the movements in Level 3 financial instruments for the year ended 31 December 2017.
Group
At 1 January 2017
Total gains/ (losses)
recognised through income Purchases Sales
At 31 December
2017
Unrealised gains/
(losses) recognised
through income in 2017
£m £m £m £m £m £mFinancial assets Derivative financial instrumentsSwaptions 1 – – – 1 – 1 – – – 1 – Financial assets held at fair value through incomeShares, other variable yield securities and units in unit trusts– UK unlisted 120 (7) – (22) 91 (3)– Overseas unlisted 55 (8) 1 (6) 42 (10) Loans secured on residential property* 685 5 35 (58) 667 – 860 (10) 36 (86) 800 (13)
861 (10) 36 (86) 801 (13)
* In relation to Loans secured on residential property, purchases represent loans advanced plus accrued interest and sales represent loans repaid.
Group
At 1 January 2016
Total gains/ (losses)
recognised through income Purchases Sales
At 31 December
2016
Unrealised gains/(losses)
recognised through income in 2016
£m £m £m £m £m £m
Financial assets Derivative financial instrumentsSwaptions 1 – – – 1 – 1 – – – 1 – Financial assets held at fair value through incomeShares, other variable yield securities and units in unit trusts– UK unlisted 125 (5) 4 (4) 120 (4)– Overseas unlisted 64 5 – (14) 55 3 Loans secured on residential property 593 75 61 (44) 685 75 782 75 65 (62) 860 74
783 75 65 (62) 861 74

131
Notes to the Financial Statements continuedYear ended 31 December 2017
Notes to the Financial Statements continuedYear ended 31 December 2017
Our A
ccounts
LV= Annual Report 2017 Our Accounts130
4. Risk management and control (continued)
Society
At 1 January 2017
Total gains/ (losses)
recognised through income Purchases Sales
At 31 December
2017
Unrealised gains/
(losses) recognised
through income in 2017
£m £m £m £m £m £mFinancial assets Derivative financial instrumentsSwaptions 1 – – – 1 – 1 – – – 1 – Financial assets held at fair value through incomeShares, other variable yield securities and units in unit trusts– UK unlisted 120 (7) – (22) 91 (3)– Overseas unlisted 54 (7) 1 (6) 42 (10) Loans secured on residential property* 684 6 35 (58) 667 – 858 (8) 36 (86) 800 (13) 859 (8) 36 (86) 801 (13)
* In relation to Loans secured on residential property, purchases represent loans advanced plus accrued interest and sales represent loans repaid.
Society
At 1 January 2016
Total gains/ (losses)
recognised through income Purchases Sales
At 31 December
2016
Unrealised gains/(losses)
recognised through income in 2016
£m £m £m £m £m £m
Financial assets Derivative financial instrumentsSwaptions 1 – – – 1 – 1 – – – 1 – Financial assets held at fair value through incomeShares, other variable yield securities and units in unit trusts– UK unlisted 124 (4) 4 (4) 120 (4)– Overseas unlisted 63 5 – (14) 54 3 Loans secured on residential property 592 75 61 (44) 684 75 779 76 65 (62) 858 74 780 76 65 (62) 859 74
4. Risk management and control (continued)Information about fair value measurements using significant unobservable inputs (Level 3)Included below are the significant unobservable inputs that impact the valuation of the material level 3 assets and liabilities for the Group, these apply equally to the Society.
Group
Fair value at 31
December 2017
Fair value at 31
December 2016
Valuation technique(s)
Unobservable inputs
Range of unobservable inputs (probability – weighted average)
Relationship of unobservable inputs to fair value
Description £m £m
Financial assetsDerivative financial instruments
Swaptions 1 1 Mark-to-modelInterest rate
volatilityCould be several
percentage points
Higher interest rate volatility results in
higher contract value.
1 1
Financial assets held at fair value through incomeShares, other variable yield securities and units in unit trusts
– UK unlisted 91 120Adjusted net
asset methodPrice per unit
Could vary significantly due to the range of
holdings
The higher the price per unit, the higher the
fair value.
Distributions or calls since
last valuation
Could vary significantly due to the range of
holdings
The fair value varies on distributions/calls and period since last
valuation.
– Overseas unlisted 42 55Adjusted net
asset methodPrice per unit
Could vary significantly due to the range of
holdings
The higher the price per unit, the higher the
fair value.
Distributions or calls since
last valuation
Could vary significantly due to the range of
holdings
The fair value varies on distributions/calls and period since last
valuation.
Loans secured on residential property 667 685
Discounted cash flow
SpreadVaries based on cohorts of loans
The spread (together with the underlying risk free yield curve) forms the discount rate used
to value the cashflows.
Prepayments
Varies by policy year: min 3.5% - max 8%.
Long-term assumption: 4%
Prepayment rate will determine the profile of
expected cashflows.
Mortality and long-term care
assumptions
Annuitant mortality tables are applied
Mortality and long-term care rate will
determine the profile of expected cashflows.
800 860
801 861

133
Notes to the Financial Statements continuedYear ended 31 December 2017
Notes to the Financial Statements continuedYear ended 31 December 2017
Our A
ccounts
LV= Annual Report 2017 Our Accounts132
4. Risk management and control (continued)Sensitivity to changes in unobservable inputs (Level 3)The only financial instrument which is significantly impacted by reasonably possible changes in unobservable inputs is the loans secured on residential property. The loans secured on residential property are sensitive to changes in discount rate spread, which includes the profit and liquidity premium as well as the No Negative Equity Guarantee risk allowance.
The impact of reasonably possible alternative assumptions is shown in the table below:
2017 2016
Reasonably possible alternative assumptions
Reasonably possible alternative assumptions
Unobservable input
Current fair value
Increase in fair value
Decrease in fair value
Current fair value
Increase in fair value
Decrease in fair value
Description £m £m £m £m £m £m
Loans secured on residential propertyDiscount rate
+/- 50bps 667 33 (30) 685 38 (35)
c) Credit counterparty risk Credit counterparty risk (credit risk) is defined as the risk of loss if another party fails to perform its obligations or fails to perform them in a timely fashion. Exposure to credit risk may arise in connection with a single transaction or an aggregation of transactions (not necessarily the same type) with a single counterparty.
The Group encounters credit counterparty risk from different sources, firstly within the business activities associated with its insurance, investment and retirement products and secondly in the financial assets held in the Group’s investment portfolio.
Credit counterparty risk is managed via a Group policy and risk limits covering aspects such as total exposure, and concentration. Group counterparty exposures are monitored by Group ALCO, with ultimate oversight of risk being undertaken by the Risk Committee.
The main credit counterparty risks within the Group are as follows:
Investment counterpartiesThe key other source of credit risk arises from the assets held in the investment portfolio. The risk is that the investment counterparty enters financial difficulties and the fair value of the asset diminishes or the income stream is not paid; alternatively the counterparty becomes insolvent and the value of the asset is written off.
The investment portfolio contains a range of assets, including equities, corporate bonds and other fixed income securities and cash deposits. The credit counterparty risk policy stipulates approved counterparties, permitted investments and geographical territories, as well as detailing specific asset class exposure limits. These are implemented within the investment management agreement with Columbia Threadneedle Investments. The policy and agreements also require that asset holdings are within regulatory limits that restrict excessive concentrations with individual counterparties or with particular asset classes. In order to minimise its exposure to credit risk the Group invests primarily in higher graded assets, rated BBB and above.
In addition, the Group uses derivatives to transfer elements of financial markets risk exposures. Where possible, significant counterparty exposures from over-the-counter derivatives are mitigated by the use of collateral. The fair value of the derivative is matched by collateral received from the counterparty, which increases or reduces in line with the contract’s fair value. The collateral can be sold or re-pledged by the Group and is repayable if the contract terminates or the contract’s fair value decreases. Details of collateral received and pledged is included within the offsetting disclosure on page 134.
Loans secured on residential and commercial propertyThe retirement business provides residential and commercial mortgage lending and is exposed to credit risk arising from mortgage loans provided. This risk is managed by using the property as security against the loan, assessment of the risk and maintaining a low loan to value ratio. AgFe is the Group’s mandated originator and asset manager for commercial mortgages, using their considerable expertise to source and underwrite loan prospects.
Note 13 provides further disclosure and provisions for ‘No Negative Equity Guarantees’ on residential mortgages.
Reinsurance counterparties Reinsurance agreements are entered into to transfer an element of potential insurance risk exposure from contract liabilities. This does not, however, discharge the Group’s liability as primary insurer. If a reinsurer fails to pay a reinsurance claim, the Group remains liable for the payment to the policyholder. To manage this exposure the creditworthiness of reinsurers is considered by reviewing their financial strength prior to finalisation of any contract, which is then regularly reviewed. In addition, collateral is held to manage the counterparty exposure to the reinsurer.
Reinsurance concentration riskReinsurance concentration risk is minimised through contracting with a diverse range of reinsurance counterparties with credit ratings within our risk appetite. Reinsurance concentration risk is managed through reviewing the credit rating of reinsurance counterparties and exposure limits.
4. Risk management and control (continued) Insurance receivablesInsurance sales expose the Group to credit risk from policyholders and intermediaries for outstanding premiums. The creditworthiness of the intermediaries is assessed and credit limits are used to manage any potential concentration risk associated with individual counterparties.
The creditworthiness of policyholders who take out premium finance on general insurance products is assessed at the time of sale and outstanding premiums are monitored and collected via a dedicated budget accounts function.
No further credit risk provision is required in excess of the normal provision for doubtful receivables.
Credit exposures also arise within general insurance, where claims expense recoveries are due from other insurers’ policyholders who are at fault for any repairs expense suffered by the Group’s policyholders. These exposures are managed via a dedicated recoveries team and an industry wide compensation scheme is in place to provide cover for default by an individual insurer.
The tables below show the credit profile of the Group’s assets. The credit risk profile of the Society is materially consistent with that of the Group.
Credit risk exposure 2017
Neither past due nor impaired
AAA AA A BBBBelow
BBB Not rated Total
Past due but not
impaired
Past due and
impaired Total£m £m £m £m £m £m £m £m £m £m
Debt and other fixed income securities 578 1,839 1,421 1,150 115 1 5,104 n/a n/a 5,104
Loans secured on residential and commercial property – – – – – 867 867 n/a n/a 867
Derivative assets – – – – – 81 81 n/a n/a 81Loans and other receivables – – 200 – – 58 258 – – 258Reinsurance assets – 2,227 73 – – 5 2,305 – – 2,305Insurance receivables – 18 17 – – 265 300 7 1 308Cash and cash equivalents – 312 517 145 – – 974 n/a n/a 974
578 4,396 2,228 1,295 115 1,277 9,889 7 1 9,897
Credit risk exposure 2016
Neither past due nor impaired
AAA AA A BBB Below BBB Not rated Total
Past due but not
impaired
Past due and
impaired Total£m £m £m £m £m £m £m £m £m £m
Debt and other fixed income securities
800 2,455 1,330 1,075 170 - 5,830 n/a n/a 5,830
Loans secured on residential and commercial property
– – – – – 883 883 n/a n/a 883
Derivative assets – – – – – 179 179 n/a n/a 179Loans and other receivables – – 203 – – 87 290 1 – 291Reinsurance assets – 1,003 86 – – 1 1,090 – – 1,090Insurance receivables 10 1 17 – – 260 288 5 – 293Cash and cash equivalents – 273 410 117 – 5 805 n/a n/a 805
810 3,732 2,046 1,192 170 1,415 9,365 6 – 9,371
ImpairmentThe Group reviews the carrying value of its financial assets held at amortised cost at each Statement of Financial Position date. If the carrying value of a financial asset is impaired, the carrying value is reduced through a charge to the Statement of Comprehensive Income.
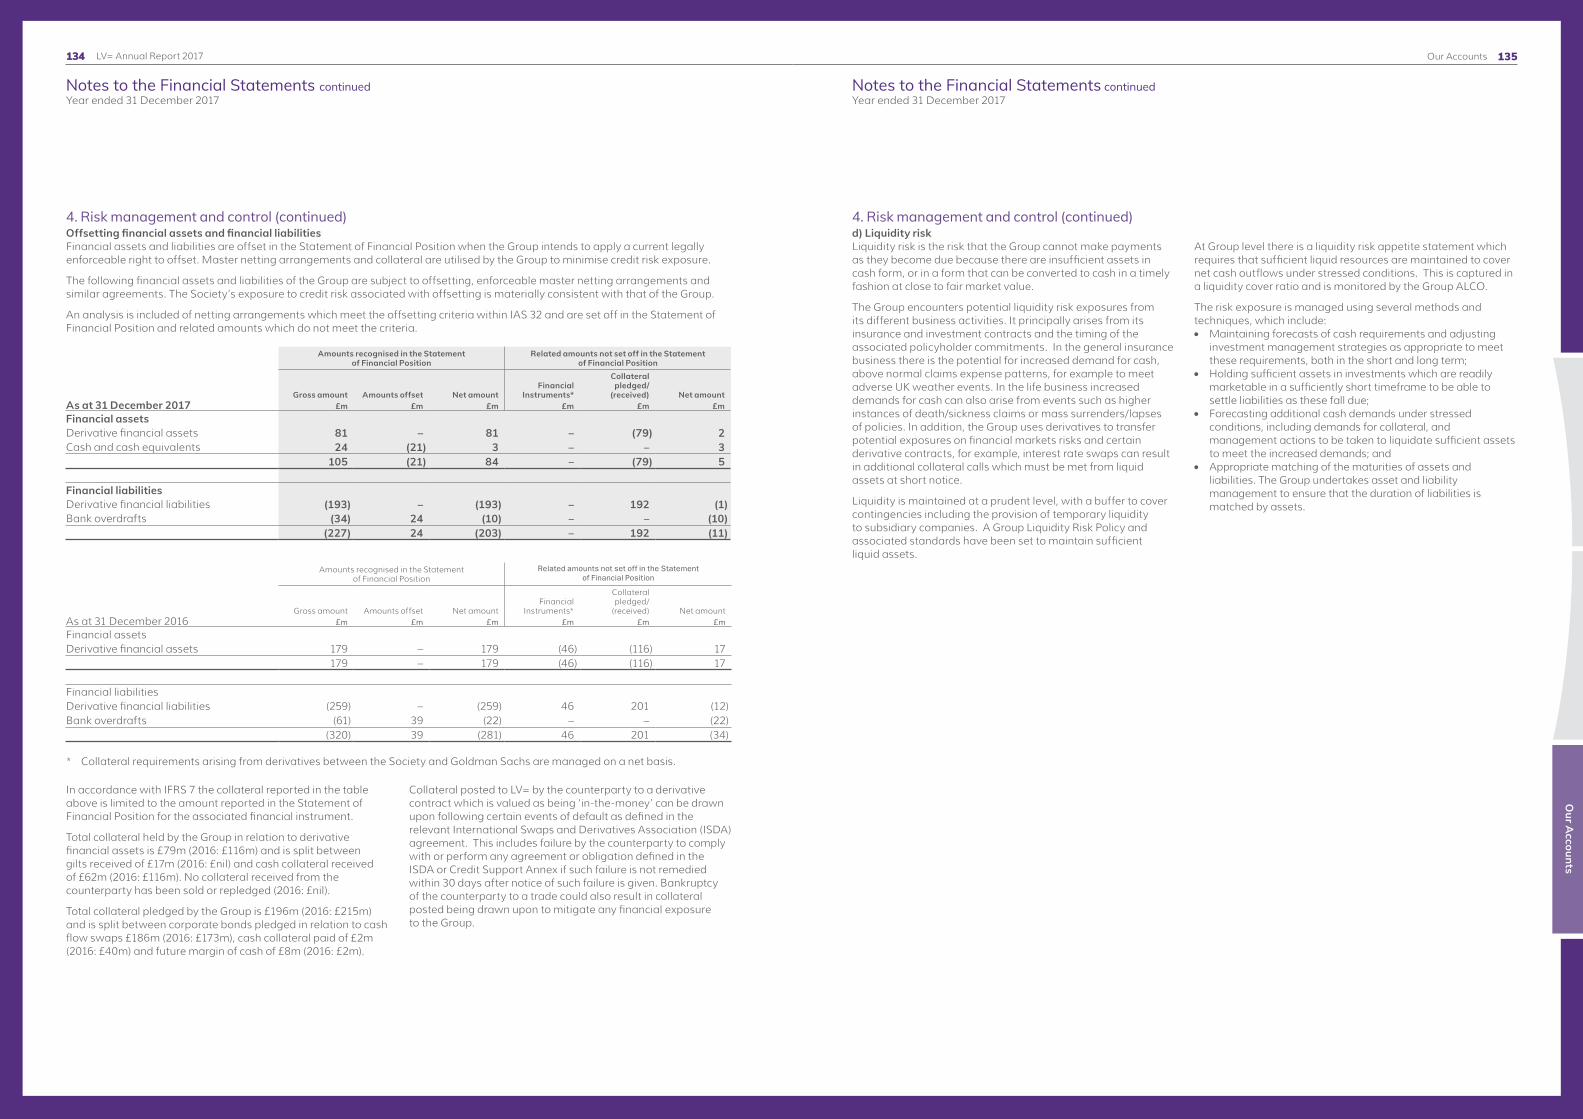
135
Notes to the Financial Statements continuedYear ended 31 December 2017
Notes to the Financial Statements continuedYear ended 31 December 2017
Our A
ccounts
LV= Annual Report 2017 Our Accounts134
4. Risk management and control (continued)Offsetting financial assets and financial liabilitiesFinancial assets and liabilities are offset in the Statement of Financial Position when the Group intends to apply a current legally enforceable right to offset. Master netting arrangements and collateral are utilised by the Group to minimise credit risk exposure.
The following financial assets and liabilities of the Group are subject to offsetting, enforceable master netting arrangements and similar agreements. The Society’s exposure to credit risk associated with offsetting is materially consistent with that of the Group.
An analysis is included of netting arrangements which meet the offsetting criteria within IAS 32 and are set off in the Statement of Financial Position and related amounts which do not meet the criteria.
As at 31 December 2017
Amounts recognised in the Statement of Financial Position
Related amounts not set off in the Statement of Financial Position
Gross amount Amounts offset Net amountFinancial
Instruments*
Collateral pledged/
(received) Net amount£m £m £m £m £m £m
Financial assetsDerivative financial assets 81 – 81 – (79) 2Cash and cash equivalents 24 (21) 3 – – 3
105 (21) 84 – (79) 5
Financial liabilitiesDerivative financial liabilities (193) – (193) – 192 (1)Bank overdrafts (34) 24 (10) – – (10)
(227) 24 (203) – 192 (11)
As at 31 December 2016
Amounts recognised in the Statement of Financial Position
Related amounts not set off in the Statement of Financial Position
Gross amount Amounts offset Net amountFinancial
Instruments*
Collateral pledged/
(received) Net amount£m £m £m £m £m £m
Financial assetsDerivative financial assets 179 – 179 (46) (116) 17
179 – 179 (46) (116) 17
Financial liabilitiesDerivative financial liabilities (259) – (259) 46 201 (12)Bank overdrafts (61) 39 (22) – – (22)
(320) 39 (281) 46 201 (34)
* Collateral requirements arising from derivatives between the Society and Goldman Sachs are managed on a net basis.
In accordance with IFRS 7 the collateral reported in the table above is limited to the amount reported in the Statement of Financial Position for the associated financial instrument.
Total collateral held by the Group in relation to derivative financial assets is £79m (2016: £116m) and is split between gilts received of £17m (2016: £nil) and cash collateral received of £62m (2016: £116m). No collateral received from the counterparty has been sold or repledged (2016: £nil).
Total collateral pledged by the Group is £196m (2016: £215m) and is split between corporate bonds pledged in relation to cash flow swaps £186m (2016: £173m), cash collateral paid of £2m (2016: £40m) and future margin of cash of £8m (2016: £2m).
Collateral posted to LV= by the counterparty to a derivative contract which is valued as being ‘in-the-money’ can be drawn upon following certain events of default as defined in the relevant International Swaps and Derivatives Association (ISDA) agreement. This includes failure by the counterparty to comply with or perform any agreement or obligation defined in the ISDA or Credit Support Annex if such failure is not remedied within 30 days after notice of such failure is given. Bankruptcy of the counterparty to a trade could also result in collateral posted being drawn upon to mitigate any financial exposure to the Group.
4. Risk management and control (continued)d) Liquidity riskLiquidity risk is the risk that the Group cannot make payments as they become due because there are insufficient assets in cash form, or in a form that can be converted to cash in a timely fashion at close to fair market value.
The Group encounters potential liquidity risk exposures from its different business activities. It principally arises from its insurance and investment contracts and the timing of the associated policyholder commitments. In the general insurance business there is the potential for increased demand for cash, above normal claims expense patterns, for example to meet adverse UK weather events. In the life business increased demands for cash can also arise from events such as higher instances of death/sickness claims or mass surrenders/lapses of policies. In addition, the Group uses derivatives to transfer potential exposures on financial markets risks and certain derivative contracts, for example, interest rate swaps can result in additional collateral calls which must be met from liquid assets at short notice.
Liquidity is maintained at a prudent level, with a buffer to cover contingencies including the provision of temporary liquidity to subsidiary companies. A Group Liquidity Risk Policy and associated standards have been set to maintain sufficient liquid assets.
At Group level there is a liquidity risk appetite statement which requires that sufficient liquid resources are maintained to cover net cash outflows under stressed conditions. This is captured in a liquidity cover ratio and is monitored by the Group ALCO.
The risk exposure is managed using several methods and techniques, which include:l Maintaining forecasts of cash requirements and adjusting
investment management strategies as appropriate to meet these requirements, both in the short and long term;
l Holding sufficient assets in investments which are readily marketable in a sufficiently short timeframe to be able to settle liabilities as these fall due;
l Forecasting additional cash demands under stressed conditions, including demands for collateral, and management actions to be taken to liquidate sufficient assets to meet the increased demands; and
l Appropriate matching of the maturities of assets and liabilities. The Group undertakes asset and liability management to ensure that the duration of liabilities is matched by assets.

137
Notes to the Financial Statements continuedYear ended 31 December 2017
Notes to the Financial Statements continuedYear ended 31 December 2017
Our A
ccounts
LV= Annual Report 2017 Our Accounts136
4. Risk management and control (continued)The table below summarises the maturity profile of the assets of the Group and Society on the expected recovery timing.
Maturity profile of assets 2017
Group SocietyWithin 1 year Over 1 year Total Within 1 year Over 1 year Total
£m £m £m £m £m £mPension benefit asset – 178 178 – 178 178Intangible assets – 315 315 – 10 10Investments in group undertakings – – – – 897 897Property and equipment – 37 37 – 7 7Investment properties 3 – 3 3 – 3Deferred acquisition costs 95 – 95 – – –Reinsurance assets 53 2,252 2,305 – 1,747 1,747Prepayments and accrued income 124 – 124 71 – 71Loans and other receivables 258 – 258 65 – 65Insurance receivables 308 – 308 29 – 29Financial assets at fair value through income 7,736 6,117 13,853 6,776 5,099 11,875Derivative financial instruments 4 77 81 4 76 80Cash and cash equivalents 974 – 974 424 – 424
9,555 8,976 18,531 7,372 8,014 15,386
Maturity profile of assets 2016
Group SocietyWithin 1 year Over 1 year Total Within 1 year Over 1 year Total
£m £m £m £m £m £m
Pension benefit asset – 134 134 – 134 134Intangible assets – 291 291 – 11 11Investments in group undertakings – – – – 802 802Property and equipment – 43 43 – 9 9Investment properties – 5 5 – 5 5Deferred acquisition costs 102 – 102 – – –Reinsurance assets 100 990 1,090 (16) 617 601Prepayments and accrued income 140 – 140 99 – 99Loans and other receivables 290 1 291 154 1 155Insurance receivables 293 – 293 16 – 16Corporation tax asset 6 – 6 – – –Financial assets at fair value through income 6,602 6,889 13,491 6,001 5,841 11,842Derivative financial instruments 6 173 179 6 173 179Cash and cash equivalents 805 – 805 469 – 469
8,344 8,526 16,870 6,729 7,593 14,322
4. Risk management and control (continued)The tables below summarise the maturity profile of insurance contracts and financial liabilities of the Group and Society.
As permitted by IFRS 4, the maturity profiles for insurance and participating investment contracts are presented based on the estimated timing of the amounts recognised in the Statement of Financial Position.
The remaining financial liabilities are presented based on the undiscounted contractual obligations and as such will not tie into the balances disclosed within the Statement of Financial Position. Non-participating investment contract liabilities, accounted for in accordance with IAS 39, can be called upon immediately by the policyholder and are therefore presented as ‘on demand’.
Group Maturity profile of financial, insurance and investment contract liabilities 2017
Unit-linked (on demand) Within 1 year 1-3 years 3-5 years Over 5 years Total
£m £m £m £m £m £mParticipating insurance contract liabilities – 462 801 752 3,264 5,279Participating investment contract liabilities – 35 63 64 584 746Non-participating value of in-force business (23) (17) (31) (26) (196) (293)Non-participating insurance contract liabilities – 258 498 485 3,409 4,650General insurance claims liabilities – 547 517 274 305 1,643Non-participating investment contract liabilities 3,071 – – – – 3,071Total insurance and investment contract liabilities 3,048 1,285 1,848 1,549 7,366 15,096Financial liabilities– Derivative financial instruments – 6 (6) 27 166 193– Subordinated liabilities – – – – 360 360– Other financial liabilities – – – – 62 62Insurance payables – 50 – – – 50Trade and other payables – 213 4 2 22 241
3,048 1,554 1,846 1,578 7,976 16,002
Group Maturity profile of financial, insurance and investment contract liabilities 2016
Unit-linked (on demand) Within 1 year 1-3 years 3-5 years Over 5 years Total
£m £m £m £m £m £m
Participating insurance contract liabilities – 481 817 723 2,978 4,999Participating investment contract liabilities – 42 59 75 514 690Non-participating value of in-force business (26) (19) (33) (27) (219) (324)Non-participating insurance contract liabilities 6 237 431 470 3,298 4,442General insurance claims liabilities – 650 550 227 136 1,563Non-participating investment contract liabilities 2,547 – – – – 2,547Total insurance and investment contract liabilities 2,527 1,391 1,824 1,468 6,707 13,917Financial liabilities– Derivative financial instruments – 8 3 17 231 259– Subordinated liabilities – – – – 360 360– Other financial liabilities – – – – 116 116Insurance payables – 51 – – – 51Trade and other payables – 200 2 2 23 227
2,527 1,650 1,829 1,487 7,437 14,930
For investment and long-term linked insurance contracts (unit linked) the Group matches all the assets on which the unit prices are based with assets in the portfolio. The Group is responsible for ensuring there is sufficient liquidity within the asset portfolio to enable liabilities to unit linked policyholders to be met as they fall due.

139
Notes to the Financial Statements continuedYear ended 31 December 2017
Notes to the Financial Statements continuedYear ended 31 December 2017
Our A
ccounts
LV= Annual Report 2017 Our Accounts138
4. Risk management and control (continued)
Society Maturity profile of financial, insurance and investment contract liabilities 2017
Unit-linked (on demand) Within 1 year 1-3 years 3-5 years Over 5 years Total
£m £m £m £m £m £mParticipating insurance contract liabilities – 462 801 752 3,264 5,279Participating investment contract liabilities – 35 63 64 584 746Non-participating value of in-force business (23) (17) (31) (26) (196) (293)Non-participating insurance contract liabilities – 257 496 484 3,398 4,635Non-participating investment contract liabilities 3,071 – – – – 3,071Total insurance and investment contract liabilities 3,048 737 1,329 1,274 7,050 13,438Financial liabilities– Derivative financial instruments – 4 (6) 27 162 187– Subordinated liabilities – – – – 350 350– Other financial liabilities – – – – 62 62Insurance payables – 22 – – – 22Trade and other payables – 149 – – – 149
3,048 912 1,323 1,301 7,624 14,208
Society Maturity profile of financial, insurance and investment contract liabilities 2016
Unit-linked (on demand) Within 1 year 1-3 years 3-5 years Over 5 years Total
£m £m £m £m £m £m
Participating insurance contract liabilities – 481 817 723 2,978 4,999Participating investment contract liabilities – 42 59 75 514 690Non-participating value of in-force business (26) (19) (33) (27) (219) (324)Non-participating insurance contract liabilities 6 235 429 469 3,287 4,426Non-participating investment contract liabilities 2,547 – – – – 2,547Total insurance and investment contract liabilities 2,527 739 1,272 1,240 6,560 12,338Financial liabilities– Derivative financial instruments – (11) 3 17 227 236– Subordinated liabilities – – – – 350 350– Other financial liabilities – – – – 116 116Insurance payables – 21 – – – 21Trade and other payables – 143 – – – 143
2,527 892 1,275 1,257 7,253 13,204
e) Operational riskOperational risk is defined as the potential for loss resulting from inadequate or failed internal processes, people and systems or from external events. It is inherent in every part of the business and covers a wide spectrum of issues. Senior management are responsible for ensuring that the material operational risks as relevant to their area of responsibilities are identified, assessed and managed using the approach as outlined in the Group’s Enterprise Risk Management Framework. A formal attestation process provides assurance about the effectiveness of the overall control environment and reports on any material exceptions.
Operational risk is unrewarded and is therefore inherently unattractive. Consequently, the Group seeks to minimise exposure to operational risk as far as it is cost-effective to do so. The Group will always seek to uphold its brand image as “Britain’s best loved insurer” with customers, employees and other external parties and the Group has no appetite whatsoever for regulatory weaknesses or failings that lead to censure actions.
PerformanceThe notes included within this section focus on the performance and results of the Group and Society. Information on the income generated, benefits and claims paid, expenditure incurred and mutual bonus declared are presented here.
5. Net earned premiums
Accounting for net earned premiumsWritten premiums include new business premiums plus ongoing regular premiums received for in-force policies. Furthermore an estimate is included for premiums due from intermediaries. Net earned premiums are arrived at following deductions for premiums payable to reinsurers and in general insurance, unearned premium is deferred.
Long-term insurance and participating investment contractsRegular premiums on long-term insurance and participating investment contracts are recognised as income when due for payment. For single premium business, recognition occurs on the date from which the policy is effective.
General insurance contractsGeneral insurance premiums written reflect business coming into force during the year. Earned premium is written premium adjusted for unearned premium. Unearned premium is that proportion of a premium written in a year that relates to periods of risk after the Statement of Financial Position date. Unearned premiums are calculated on a time apportionment basis. The proportion attributable to subsequent periods is deferred as a provision for unearned premiums.
Non-participating investment contractsPremiums and claims relating to non-participating investment contracts are not recognised in the Statement of Comprehensive Income but are recorded as contributions to and deductions from the non-participating investment contract liabilities recorded in the Statement of Financial Position.
Group Society
Gross earned premiums 2017 2016 2017 2016
£m £m £m £m
Long-term insurance and participating investment contractsSingle premiumNew businessInvestments and savings 420 561 420 561Pensions and annuities 151 423 151 423
Regular premiumNew businessLife and health protection 37 37 37 37
Existing in-force businessInvestments and savings 33 31 33 31Pensions and annuities 9 10 9 10Life and health protection 185 166 185 166
General insurance contractsMotor 1,081 1,067 – –Commercial 283 268 – –Household 143 161 – –Other 89 83 – –Change in unearned premiums provision 8 (47) – –Gross earned premiums 2,439 2,760 835 1,228
Premiums ceded to reinsurersLong-term insurance premiums (1,092) (261) (1,092) (261)General insurance business (361) (345) – –Change in unearned premiums provision (2) 5 – – (1,455) (601) (1,092) (261)Net earned premiums 984 2,159 (257) 967 Gross written premiums for non-participating investment contracts which are deposit accounted for and not included above (refer to Note 15) 656 425 656 425
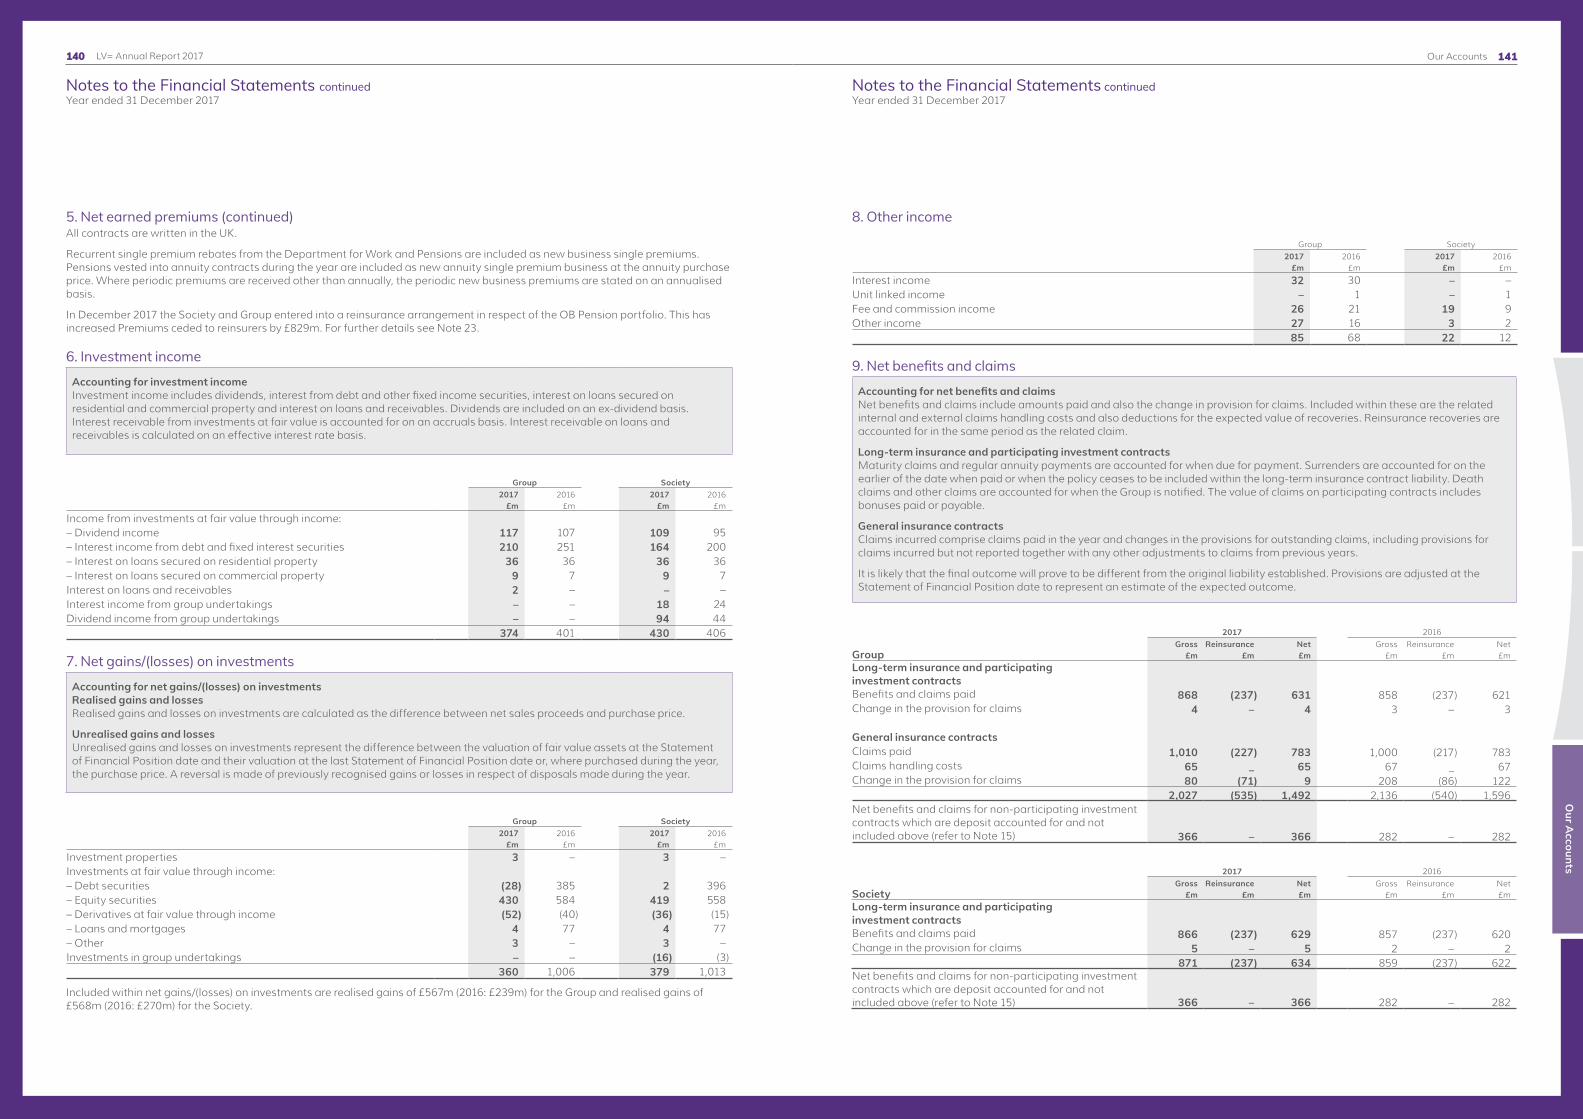
141
Notes to the Financial Statements continuedYear ended 31 December 2017
Notes to the Financial Statements continuedYear ended 31 December 2017
Our A
ccounts
LV= Annual Report 2017 Our Accounts140
5. Net earned premiums (continued)All contracts are written in the UK.
Recurrent single premium rebates from the Department for Work and Pensions are included as new business single premiums. Pensions vested into annuity contracts during the year are included as new annuity single premium business at the annuity purchase price. Where periodic premiums are received other than annually, the periodic new business premiums are stated on an annualised basis.
In December 2017 the Society and Group entered into a reinsurance arrangement in respect of the OB Pension portfolio. This has increased Premiums ceded to reinsurers by £829m. For further details see Note 23.
6. Investment income
Accounting for investment incomeInvestment income includes dividends, interest from debt and other fixed income securities, interest on loans secured on residential and commercial property and interest on loans and receivables. Dividends are included on an ex-dividend basis. Interest receivable from investments at fair value is accounted for on an accruals basis. Interest receivable on loans and receivables is calculated on an effective interest rate basis.
Group Society2017 2016 2017 2016
£m £m £m £m
Income from investments at fair value through income:– Dividend income 117 107 109 95– Interest income from debt and fixed interest securities 210 251 164 200– Interest on loans secured on residential property 36 36 36 36– Interest on loans secured on commercial property 9 7 9 7Interest on loans and receivables 2 – – –Interest income from group undertakings – – 18 24Dividend income from group undertakings – – 94 44
374 401 430 406
7. Net gains/(losses) on investments
Accounting for net gains/(losses) on investmentsRealised gains and losses Realised gains and losses on investments are calculated as the difference between net sales proceeds and purchase price.
Unrealised gains and lossesUnrealised gains and losses on investments represent the difference between the valuation of fair value assets at the Statement of Financial Position date and their valuation at the last Statement of Financial Position date or, where purchased during the year, the purchase price. A reversal is made of previously recognised gains or losses in respect of disposals made during the year.
Group Society2017 2016 2017 2016
£m £m £m £m
Investment properties 3 – 3 –Investments at fair value through income:– Debt securities (28) 385 2 396– Equity securities 430 584 419 558– Derivatives at fair value through income (52) (40) (36) (15)– Loans and mortgages 4 77 4 77– Other 3 – 3 –Investments in group undertakings – – (16) (3)
360 1,006 379 1,013
Included within net gains/(losses) on investments are realised gains of £567m (2016: £239m) for the Group and realised gains of £568m (2016: £270m) for the Society.
8. Other income
Group Society2017 2016 2017 2016
£m £m £m £m
Interest income 32 30 – –Unit linked income – 1 – 1Fee and commission income 26 21 19 9Other income 27 16 3 2
85 68 22 12
9. Net benefits and claims
Accounting for net benefits and claimsNet benefits and claims include amounts paid and also the change in provision for claims. Included within these are the related internal and external claims handling costs and also deductions for the expected value of recoveries. Reinsurance recoveries are accounted for in the same period as the related claim.
Long-term insurance and participating investment contractsMaturity claims and regular annuity payments are accounted for when due for payment. Surrenders are accounted for on the earlier of the date when paid or when the policy ceases to be included within the long-term insurance contract liability. Death claims and other claims are accounted for when the Group is notified. The value of claims on participating contracts includes bonuses paid or payable.
General insurance contractsClaims incurred comprise claims paid in the year and changes in the provisions for outstanding claims, including provisions for claims incurred but not reported together with any other adjustments to claims from previous years.
It is likely that the final outcome will prove to be different from the original liability established. Provisions are adjusted at the Statement of Financial Position date to represent an estimate of the expected outcome.
2017 2016
GroupGross Reinsurance Net Gross Reinsurance Net
£m £m £m £m £m £m
Long-term insurance and participating investment contractsBenefits and claims paid 868 (237) 631 858 (237) 621Change in the provision for claims 4 – 4 3 – 3
General insurance contractsClaims paid 1,010 (227) 783 1,000 (217) 783Claims handling costs 65 _ 65 67 _ 67Change in the provision for claims 80 (71) 9 208 (86) 122
2,027 (535) 1,492 2,136 (540) 1,596Net benefits and claims for non-participating investment contracts which are deposit accounted for and not included above (refer to Note 15) 366 – 366 282 – 282
2017 2016
SocietyGross Reinsurance Net Gross Reinsurance Net
£m £m £m £m £m £m
Long-term insurance and participating investment contractsBenefits and claims paid 866 (237) 629 857 (237) 620Change in the provision for claims 5 – 5 2 – 2
871 (237) 634 859 (237) 622Net benefits and claims for non-participating investment contracts which are deposit accounted for and not included above (refer to Note 15) 366 – 366 282 – 282
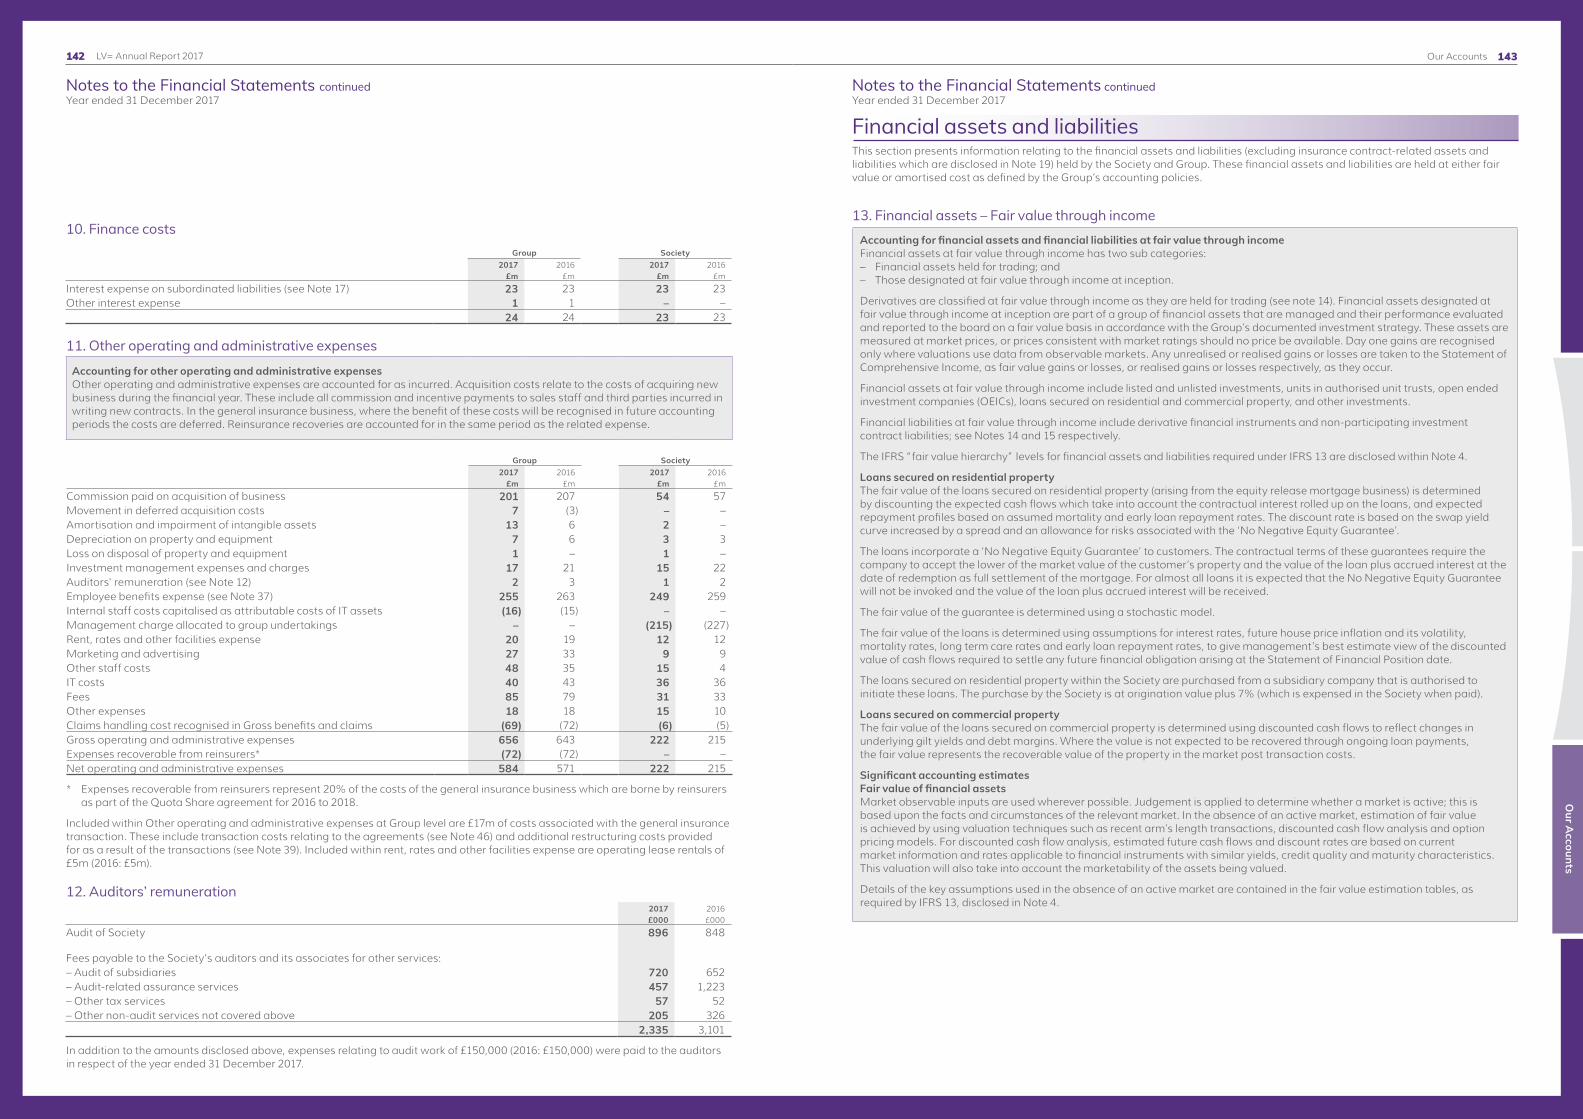
143
Notes to the Financial Statements continuedYear ended 31 December 2017
Notes to the Financial Statements continuedYear ended 31 December 2017
Our A
ccounts
LV= Annual Report 2017 Our Accounts142
10. Finance costsGroup Society
2017 2016 2017 2016 £m £m £m £m
Interest expense on subordinated liabilities (see Note 17) 23 23 23 23Other interest expense 1 1 – –
24 24 23 23
11. Other operating and administrative expenses
Accounting for other operating and administrative expensesOther operating and administrative expenses are accounted for as incurred. Acquisition costs relate to the costs of acquiring new business during the financial year. These include all commission and incentive payments to sales staff and third parties incurred in writing new contracts. In the general insurance business, where the benefit of these costs will be recognised in future accounting periods the costs are deferred. Reinsurance recoveries are accounted for in the same period as the related expense.
Group Society2017 2016 2017 2016
£m £m £m £m
Commission paid on acquisition of business 201 207 54 57Movement in deferred acquisition costs 7 (3) – –Amortisation and impairment of intangible assets 13 6 2 –Depreciation on property and equipment 7 6 3 3Loss on disposal of property and equipment 1 – 1 –Investment management expenses and charges 17 21 15 22Auditors' remuneration (see Note 12) 2 3 1 2Employee benefits expense (see Note 37) 255 263 249 259Internal staff costs capitalised as attributable costs of IT assets (16) (15) – –Management charge allocated to group undertakings – – (215) (227)Rent, rates and other facilities expense 20 19 12 12Marketing and advertising 27 33 9 9Other staff costs 48 35 15 4IT costs 40 43 36 36Fees 85 79 31 33Other expenses 18 18 15 10Claims handling cost recognised in Gross benefits and claims (69) (72) (6) (5)Gross operating and administrative expenses 656 643 222 215Expenses recoverable from reinsurers* (72) (72) – –Net operating and administrative expenses 584 571 222 215
* Expenses recoverable from reinsurers represent 20% of the costs of the general insurance business which are borne by reinsurers as part of the Quota Share agreement for 2016 to 2018.
Included within Other operating and administrative expenses at Group level are £17m of costs associated with the general insurance transaction. These include transaction costs relating to the agreements (see Note 46) and additional restructuring costs provided for as a result of the transactions (see Note 39). Included within rent, rates and other facilities expense are operating lease rentals of £5m (2016: £5m).
12. Auditors’ remuneration2017 2016£000 £000
Audit of Society 896 848
Fees payable to the Society's auditors and its associates for other services:– Audit of subsidiaries 720 652– Audit-related assurance services 457 1,223– Other tax services 57 52– Other non-audit services not covered above 205 326
2,335 3,101
In addition to the amounts disclosed above, expenses relating to audit work of £150,000 (2016: £150,000) were paid to the auditors in respect of the year ended 31 December 2017.
Financial assets and liabilitiesThis section presents information relating to the financial assets and liabilities (excluding insurance contract-related assets and liabilities which are disclosed in Note 19) held by the Society and Group. These financial assets and liabilities are held at either fair value or amortised cost as defined by the Group’s accounting policies.
13. Financial assets – Fair value through incomeAccounting for financial assets and financial liabilities at fair value through incomeFinancial assets at fair value through income has two sub categories:– Financial assets held for trading; and– Those designated at fair value through income at inception.
Derivatives are classified at fair value through income as they are held for trading (see note 14). Financial assets designated at fair value through income at inception are part of a group of financial assets that are managed and their performance evaluated and reported to the board on a fair value basis in accordance with the Group’s documented investment strategy. These assets are measured at market prices, or prices consistent with market ratings should no price be available. Day one gains are recognised only where valuations use data from observable markets. Any unrealised or realised gains or losses are taken to the Statement of Comprehensive Income, as fair value gains or losses, or realised gains or losses respectively, as they occur.
Financial assets at fair value through income include listed and unlisted investments, units in authorised unit trusts, open ended investment companies (OEICs), loans secured on residential and commercial property, and other investments.
Financial liabilities at fair value through income include derivative financial instruments and non-participating investment contract liabilities; see Notes 14 and 15 respectively.
The IFRS “fair value hierarchy” levels for financial assets and liabilities required under IFRS 13 are disclosed within Note 4.
Loans secured on residential propertyThe fair value of the loans secured on residential property (arising from the equity release mortgage business) is determined by discounting the expected cash flows which take into account the contractual interest rolled up on the loans, and expected repayment profiles based on assumed mortality and early loan repayment rates. The discount rate is based on the swap yield curve increased by a spread and an allowance for risks associated with the ‘No Negative Equity Guarantee’.
The loans incorporate a ‘No Negative Equity Guarantee’ to customers. The contractual terms of these guarantees require the company to accept the lower of the market value of the customer’s property and the value of the loan plus accrued interest at the date of redemption as full settlement of the mortgage. For almost all loans it is expected that the No Negative Equity Guarantee will not be invoked and the value of the loan plus accrued interest will be received.
The fair value of the guarantee is determined using a stochastic model.
The fair value of the loans is determined using assumptions for interest rates, future house price inflation and its volatility, mortality rates, long term care rates and early loan repayment rates, to give management’s best estimate view of the discounted value of cash flows required to settle any future financial obligation arising at the Statement of Financial Position date.
The loans secured on residential property within the Society are purchased from a subsidiary company that is authorised to initiate these loans. The purchase by the Society is at origination value plus 7% (which is expensed in the Society when paid).
Loans secured on commercial propertyThe fair value of the loans secured on commercial property is determined using discounted cash flows to reflect changes in underlying gilt yields and debt margins. Where the value is not expected to be recovered through ongoing loan payments, the fair value represents the recoverable value of the property in the market post transaction costs.
Significant accounting estimatesFair value of financial assets Market observable inputs are used wherever possible. Judgement is applied to determine whether a market is active; this is based upon the facts and circumstances of the relevant market. In the absence of an active market, estimation of fair value is achieved by using valuation techniques such as recent arm’s length transactions, discounted cash flow analysis and option pricing models. For discounted cash flow analysis, estimated future cash flows and discount rates are based on current market information and rates applicable to financial instruments with similar yields, credit quality and maturity characteristics. This valuation will also take into account the marketability of the assets being valued.
Details of the key assumptions used in the absence of an active market are contained in the fair value estimation tables, as required by IFRS 13, disclosed in Note 4.

145
Notes to the Financial Statements continuedYear ended 31 December 2017
Notes to the Financial Statements continuedYear ended 31 December 2017
Our A
ccounts
LV= Annual Report 2017 Our Accounts144
13. Financial assets – Fair value through income (continued)Group Society
2017 2016 2017 2016£m £m £m £m
Financial assets – Fair value through incomeShares, other variable yield securities and units in unit trusts– UK listed 7,629 6,136 6,844 5,997– UK unlisted 91 120 91 120– Overseas listed 117 467 112 102– Overseas unlisted 42 55 42 54
Debt and other fixed income securities– UK listed 3,032 3,584 2,661 3,163– Overseas listed 2,072 2,246 1,255 1,524
Loans secured on residential property 667 685 667 684Loans secured on commercial property 200 198 200 198Other 3 – 3 – 13,853 13,491 11,875 11,842
Assets held to cover linked liabilities included above 3,130 2,612 3,130 2,612
For details on exposure to foreign exchange currency risk see page 124.
14. Derivative financial instruments
Accounting for derivative financial instrumentsDerivatives are initially recognised at fair value on the date on which a derivative contract is entered into and are subsequently re-measured at their fair value. There are no designated hedging relationships within the Group that qualify for hedge accounting, all are classified as held for trading. Derivatives are settled on a gross basis.
Changes in the fair value of derivative instruments are recognised immediately in gains or losses on investments in the Statement of Comprehensive Income for the period. Realised gains or losses are taken to the Statement of Comprehensive Income on occurrence.
The Group uses derivatives primarily to reduce its exposure to interest rate risk and to protect against falls in equity values.
2017 2016
Group
Contract/ notional amount
Fair value – asset
Fair value – liability
Contract/ notional amount
Fair value – asset
Fair value – liability
£m £m £m £m £m £m
Interest rate swaps 811 69 (4) 1,507 160 (29)Gilt spread lock – – – 1,120 – (37)Gilt forwards 624 4 – – – –Cash flow swaps 1,070 – (186) 1,117 – (173)Swaptions 87 1 – 1,402 7 –Forward exchange contracts 2 – – 1 – –Equity/index derivatives 211 7 (3) 515 12 (20)
2,805 81 (193) 5,662 179 (259)
2017 2016
Society
Contract/ notional amount
Fair value – asset
Fair value – liability
Contract/ notional amount
Fair value – asset
Fair value – liability
£m £m £m £m £m £m
Interest rate swaps 444 68 – 1,369 160 (25)Gilt spread lock – – – 1,120 – (37)Gilt forwards 624 4 – – – –Cash flow swaps 1,070 – (186) 1,117 – (173)Swaptions 87 1 – 1,402 7 –Forward exchange contracts – – – 1 – –Equity/index derivatives 132 7 (1) 118 12 (1)
2,357 80 (187) 5,127 179 (236)
15. Investment contract liabilities
Accounting for investment contract liabilitiesNon-participating contractsInvestment contract liabilities are recognised when contracts are entered into and premiums are charged. These liabilities are initially recognised at transaction price excluding any transaction costs directly attributable to the issue of the contract. Designation at inception is at fair value in order to avoid a measurement inconsistency with the associated financial assets.
Deposits and withdrawals are recorded directly as an adjustment to the contract liability in the Statement of Financial Position, a method known as deposit accounting. Fees charged and investment income received are recognised in the Statement of Comprehensive Income when earned.
Fair value adjustments are measured at each reporting date and are recorded in the Statement of Comprehensive Income. Fair value is calculated as the number of units allocated to the policyholder in each unit linked fund multiplied by the unit price of those funds at the Statement of Financial Position date. The unit prices are determined with reference to the fund assets and liabilities, which are valued on a basis consistent with that used to measure the equivalent assets and liabilities in the Statement of Financial Position, adjusted for the effect of future tax arising from any unrealised gains or losses. For a contract that can be cancelled by the policyholder, the fair value cannot be less than the surrender value.
Participating contractsInsurance and participating investment contract liabilities are valued using accounting policies consistent with those adopted prior to the transition to IFRS as permitted under IFRS 4 ‘Insurance contracts’. The accounting treatment of these contracts is described within Note 19.
a) Analysis of investment contract liabilities Group Society
Notes2017 2016 2017 2016
£m £m £m £m
Non-participating investment contract liabilities 15b 3,071 2,547 3,071 2,547Participating investment contract liabilities 15c 746 690 746 690
3,817 3,237 3,817 3,237
b) Movement in non-participating investment contract liabilities Group Society2017 2016 2017 2016
£m £m £m £m
Balance at 1 January 2,547 1,862 2,547 1,862Acquired through business combinations – 239 – 239Deposits received from policyholders 656 425 656 425Payments made to policyholders (366) (282) (366) (282)Change in contract liabilities included in the Statement of Comprehensive Income 234 303 234 303Balance at 31 December 3,071 2,547 3,071 2,547
The change in contract liabilities as shown in the Statement of Comprehensive Income comprises principally the allocation of the net investment return to policyholders of investment contracts less allowances for taxes.

147
Notes to the Financial Statements continuedYear ended 31 December 2017
Notes to the Financial Statements continuedYear ended 31 December 2017
Our A
ccounts
LV= Annual Report 2017 Our Accounts146
15. Investment contract liabilities (continued)
c) Movement in participating investment contract liabilities Group Society2017 2016 2017 2016
£m £m £m £m
Balance at 1 January 690 554 690 554Acquired through business combinations – 120 – 120Premiums received 9 6 9 6Liabilities paid for deaths, maturities, surrenders, benefits and claims (37) (27) (37) (27)New business – 1 – 1Benefits and claims variation 1 4 1 4Fees deducted (4) (3) (4) (3)Accretion of investment income or change in unit prices 54 76 54 76Adjustment due to changes in assumptions:– Investment return 1 8 1 8– Expense (3) (3) (3) (3)Model changes – 1 – 1Other 23 (50) 23 (50)Mutual bonus 7 3 7 3Change to economic basis 5 – 5 –Balance at 31 December 746 690 746 690
16. Loans and other receivables
Accounting for loans and other receivablesLoans and other receivables are initially measured at fair value and then subsequently measured at amortised cost using the effective interest rate method. Loans include reverse repurchase agreements and represent the consideration paid to the borrower. Other receivables comprise amounts due to the Society from group undertakings and other receivables including outstanding investment sales and are recognised when due.
The Group assesses at each Statement of Financial Position date whether there is any indication that a loan or receivable, or a group of loans or receivables, is impaired. For loans, the amount of any impairment loss is measured as the difference between the carrying amount and the present value of future cash flows. For receivables, where there is objective evidence that the carrying value is impaired then the impairment loss will be recognised in the Statement of Comprehensive Income.
Group Society2017 2016 2017 2016
£m £m £m £m
Reverse repurchase agreements 200 200 – –Deposits with credit institutions – 3 – –Cash collateral pledged 10 42 3 18Amounts due from group undertakings – – 25 103Investments receivable 26 18 20 16Other receivables 22 28 17 18 258 291 65 155
Details of impairments on financial assets held at amortised cost are included within the credit counterparty risk section (c) of Note 4. The carrying amounts disclosed above reasonably approximate fair value at the Statement of Financial Position date.
17. Subordinated liabilities
Accounting for subordinated liabilitiesSubordinated liabilities are initially measured at the fair value of the proceeds less attributable transaction costs. Subsequent to initial recognition they are measured at amortised cost. The transaction costs are amortised over the period to the expected redemption date on an effective interest rate basis. The amortisation charge is included in the Statement of Comprehensive Income within finance costs. An equivalent amount is added to the carrying value of the liability such that at the redemption date the value of the liability equals the redemption value.
Group Society2017 2016 2017 2016
£m £m £m £m
Subordinated notes (GBP 350m) 348 347 348 347Subordinated notes (EUR 12m) 10 10 – –
358 357 348 347
All the subordinated liabilities are expected to be settled more than 12 months after the balance sheet date.
In 2013 the Society issued £350m of Fixed Rate Reset Subordinated Notes at par. The directly related costs of £4m incurred to issue the Notes have been capitalised as part of the carrying value and are being amortised using the effective interest rate basis over the period to the first call date in 2023. The effective interest rate on the £350m liability is 6.654% resulting in a £23m finance charge for the year (see Note 10).
The Notes have a maturity date of 22 May 2043 but the issuer has the option to redeem the Notes at the first call date of 22 May 2023 and at five yearly intervals thereafter up to the maturity date.
Interest is payable on the Notes at a fixed rate of 6.5% (£23m) per annum for the period until the first call date on 22 May 2023, payable annually in arrears on 22 May each year. If the Notes are not redeemed on 22 May 2023, the interest rate is reset on that date and at five yearly intervals thereafter at a rate equal to the five year gilt rate quoted on the day before the reset date plus an initial margin of 463 basis points and a step up margin of 100 basis points.
There is an option of cumulative deferral of interest at the issuer’s discretion and mandatory interest deferral in the event that a regulatory deficiency interest deferral event has occurred or is continuing (breach of the applicable regulatory solvency capital requirement of the issuer or group) or would occur if payment of interest on the subordinated notes were to be made. Following any deferral of a principal or interest payment, the Society would be prevented from declaring any distribution to members which falls within the Mutual Bonus arrangements. The Society has the option to elect to defer payment of interest in whole or in part and this will not constitute a default or give the right to the noteholders or the trustee to accelerate repayment of the Notes or to take any enforcement action.
The €12m subordinated notes are issued by a subsidiary undertaking and are repayable in 2034. Interest on these Notes is payable at the 3 month euro deposit rate plus a margin of 365 basis points.
Subordinated liabilities are held in the Statement of Financial Position at amortised cost. The fair value at 31 December 2017 was £405m (2016: £351m). The valuation of the subordinated notes was determined by reference to the bid price obtained from the markets as at 31 December 2017. Management consider this to be representative of fair value.
18. Other financial liabilitiesGroup Society
2017 2016 2017 2016£m £m £m £m
Cash collateral received 62 116 62 116 62 116 62 116
The carrying amounts disclosed above reasonably approximate fair value at the Statement of Financial Position date.

149
Notes to the Financial Statements continuedYear ended 31 December 2017
Notes to the Financial Statements continuedYear ended 31 December 2017
Our A
ccounts
LV= Annual Report 2017 Our Accounts148
19.1 Accounting for insurance contract liabilitiesInsurance contract liabilities are recognised for insurance contracts in existence at the end of the reporting period. Such liabilities are only derecognised when the obligation specified in the contract is discharged, cancelled or expires.
IFRS 4 Insurance Contracts permits the continued application, for income statement presentation and liability measurement purposes, of accounting policies that were being used at the date of transition to IFRS, except where a change is deemed to make the financial statements more relevant to the economic decision-making needs of users and no less reliable, or more reliable, and no less relevant to those needs. As such, the Group accounting for insurance contracts and participating investment contracts is in accordance with the Statement of Recommended Practice issued by the Association of British Insurers in December 2005, amended in December 2006 and withdrawn in December 2015. The Group continues to apply this Statement of Recommended Practice.
a) Long-term insurance contract liabilities and participating investment contract liabilities (i) Participating businessParticipating business includes both participating insurance and participating investment contract liabilities. The liabilities are calculated in accordance with the PRA’s previous ‘realistic’ liability regime, which was the regime in place at the date of transition to IFRS. In particular, provision is made for all bonus payments (declared and future, reversionary and terminal) estimated, where necessary, in a manner consistent with the relevant fund’s Principles and Practices of Financial Management (PPFM). The liabilities include an allowance for the time and intrinsic value of options and guarantees granted to policyholders and for future management actions.
The realistic participating liabilities are based on the aggregate value of policy asset shares reflecting past premiums, investment return, expenses and charges applied to each policy. Allowance is also made for policy-related liabilities such as guarantees, options and future bonuses calculated using a stochastic model simulating investment returns, asset mix, expense charges and bonuses.
In determining the realistic value of liabilities for participating contracts, the value of future profits on non-participating business written in the with-profits part of the fund is accounted for as part of the calculation. The present value of future profits on the non-participating business (‘Non-participating value of the in-force business’) is separately determined and its value is deducted from the sum of the liabilities for participating contracts and the Unallocated divisible surplus.
The non-participating value of the in-force business is separately disclosed within Note 20. Such an amount is not recognised for business written outside participating contract funds.
(ii) Non-participating businessThe liability is calculated to comply with the reporting requirements under the PRA’s handbook using a gross premium valuation method or a method at least as prudent as the gross premium method. This was the regime in place on
adoption of IFRS. The Society and relevant subsidiaries have adopted the modified statutory solvency basis in the valuation of provisions for non-participating business.
Liabilities for non-participating business are either included within the long-term insurance contract liabilities or the investment contract liabilities, depending upon the product classification.
b) General insurance claims and insurance contract liabilitiesClaims incurred comprise claims and related internal and external claims handling costs paid in the year and changes in the provisions for outstanding claims, including provisions for claims incurred but not reported and related claims handling costs, together with any other adjustments to claims from previous years. Where applicable, deductions are made for recoveries from other parties.
Provision is made for the estimated cost of claims incurred but not settled, including the cost of claims incurred but not reported. The estimated cost of claims includes expenses to be incurred in settling claims and a deduction for the expected value of recoveries. However, given the inevitable uncertainty in establishing claims provisions, it is likely that the final outcome will prove to be different from the original liability established. Provisions are adjusted at the Statement of Financial Position date to represent a best estimate of the expected outcome.
Provisions are calculated allowing for reinsurance recoveries and a separate asset is recorded for the reinsurers’ share of the provision.
Standard actuarial claims projection techniques are used to estimate outstanding claims. Such methods extrapolate the development of paid and incurred claims, recoveries from third parties, average cost per claim and ultimate claim numbers for each accident year, based upon the observed development of earlier years and expected loss ratios. The main assumption underlying these techniques is that past claims development experience can be used to project ultimate claims costs. In the case of PPOs, the annuity type structure of the claim payments mean that these have to be projected over a longer-term period and reserved for on a discounted basis accordingly. Allowance for one off occurrences or changes in legislation, policy conditions or portfolio mix, is also made in arriving at the estimated ultimate cost of claims, in order that it represents the most likely outcome, taking account of all the uncertainties involved. To the extent that the ultimate cost is different from the estimate, where experience is better or worse than that assumed, the surplus or deficit will be credited or charged to the Statement of Comprehensive Income in future years.
For general insurance contracts, provision is made, if required, for any anticipated claims and claims handling costs that are anticipated to exceed the unearned premiums, net of deferred acquisition costs. An estimate is made for future investment income arising from the unearned premiums, and used to reduce the unexpired risk provision. Unexpired risk surpluses and deficits are offset where business classes are managed together and a provision is made if an aggregate deficit arises.
Insurance contract related assets and liabilitiesThis section presents information relating to insurance contract related assets and liabilities held by the Society and Group. The assumptions used in the valuation of the insurance contract liabilities are disclosed within Note 24 with sensitivities to these assumptions disclosed separately within Note 4.
19. Insurance contract liabilities
19.2 Significant accounting estimates and judgementsThe valuation of insurance contract liabilities requires management judgement in applying the appropriate accounting treatment and the use of estimates. Where the use of estimates involves management judgement, these are explained separately to judgements involving the application of accounting policies.
a) Long-term insurance contract liabilities and participating investment contract liabilities (i) Significant accounting estimates
Estimate Judgement applied to estimate
Assumptions and adjustments applied in the valuation of insurance liabilities The valuation of participating contract liabilities is based on assumptions reflecting the best estimate at the time. The valuation of non-participating insurance contracts is based on prudent assumptions; a separate calculation is also performed to assess the non-participating value of in-force business which is based on best estimate assumptions. All contracts are subject to liability adequacy tests, which reflects management’s best current estimate of future cash flows.
The assumptions used for mortality, morbidity and longevity are based on standard industry or reinsurers’ tables. The assumptions used for investment returns and discount rates are based on current market yields. The assumptions used for expenses and persistency reflect product characteristics and are primarily based on relevant internal experience.
The assumptions for mortality improvements are based on the latest version of the Institute and Faculty of Actuaries Continuous Mortality Investigation (CMI) Mortality Projections Model, referred to as CMI_2016.
Due to the long-term nature of the liabilities, the estimates are subject to significant uncertainty.
The assumptions used for mortality, morbidity and longevity are adjusted where appropriate to reflect the Group’s own experience. In particular, for impaired annuities the mortality assumptions are adjusted so as to allow for convergence to standard mortality at advanced ages. These adjustments vary according to lifestyle or medical condition, gender, age and duration in-force.
The assumptions used for discount rates are adjusted for the Group’s own risk exposure. Non-participating value of in-force business valuation makes allowance for a margin of risk and adverse deviation.
Assessment of future options and guarantees The value of options and guarantees on with-profits business is valued within the market-consistent discounted cash flow valuation, the most material of which are minimum benefit guarantees on LVFS WP business and guaranteed annuity options on RNPFN.
Due to the asymmetric nature of these liabilities, stochastic valuation techniques are required. A market consistent economic scenario generator is used with a wide range of future economic conditions to capture the asymmetry, and a discounted cash flow model is used to derive a value of the liability at the valuation date. These techniques are widely used in the life insurance industry to value liabilities with embedded options and guarantees.
The valuation models make appropriate allowance for both management and policyholder actions, where appropriate, including appropriate demographic assumptions on option or guarantee dates.
(ii) Significant accounting judgementsChanges to methodology for long-term insurance contract liabilities and participating investment contract liabilitiesDuring 2017, the Group has reviewed the accounting policy for long-term insurance contract liabilities and participating investment contract liabilities in light of the Solvency II regulatory reporting regime that came into effect from 1 January 2016. Following this review, the Group concluded that it would continue to apply the SORP as described above. However, where possible, the Group would align IFRS reporting with Solvency II with changes considered to make the information more relevant and reliable.
This has been achieved by making changes to the methodology and estimates used to calculate the value of the insurance and participating investment contract liabilities to more closely align the economic basis to that used for Solvency II as set out below.
In accordance with IAS 8 ‘Accounting Policies, Changes in Accounting Estimates and Errors’ these changes have been treated as a ‘change in accounting estimate’, which is required to be recognised in the current year with no restatement of prior year comparatives.
19. Insurance contract liabilities (continued)

151
Notes to the Financial Statements continuedYear ended 31 December 2017
Notes to the Financial Statements continuedYear ended 31 December 2017
Our A
ccounts
LV= Annual Report 2017 Our Accounts150
19.2 Significant accounting estimates and judgements (continued) The total impact of the change is a charge of £48m, which has been shown in the 2017 Consolidated Statement of Comprehensive Income as a separate line item. The charge is the result of using the EIOPA swap reference risk-free rate curve, rather than a gilt based curve, to discount cash flows. This change is reported separately in the movement tables in Notes 15, 19 and 20 as ‘Change in economic basis’.
Other changes in methodologyThe calculation of the insurance contract liabilities is impacted by changes in unit costs. A full review of the expense allocation methodology has been carried out in 2017 and revised expense allocation assumptions have been adopted.
Details of all the long-term insurance and investment contract liabilities valuation assumptions and the non-participating value of in-force business valuation assumptions are disclosed separately within Notes 24 and 25 respectively.
b) General insurance claims and insurance contract liabilities(i) Significant accounting estimates
Estimate Judgement applied to estimate
Estimate of ultimate cost of claims The estimation of the ultimate liability arising from claims made under insurance contracts is the most critical accounting estimate for the general insurance business. For general insurance contracts estimates are made for the expected ultimate cost of claims as at the Statement of Financial Position date and the cost of claims incurred but not yet reported to the Group. It can take a significant period of time before the ultimate cost of claims can be established with certainty, and the final outcome may be better or worse than that provided.
There are several sources of uncertainty that need to be considered in the estimate of the liability that the Group will ultimately pay for such claims. In particular, motor insurance policies are exposed to claims for bodily injury and household insurance policies are exposed to claims for subsidence.
Estimation of the ultimate cost of large bodily injury claims is a complex process and cannot be done using conventional actuarial techniques given they typically exhibit low frequency and high severity. Significant factors that affect the bodily injuries estimation process are legislation (e.g. the Ogden discount rate used to value lump sum settlements), judicial decisions and the long delay to settlement. Due to this uncertainty it is not possible to determine the future development of bodily injury claims with the same degree of reliability as with other types of claims.
Over the last decade, there has been an increasing prevalence of Periodic Payment Order (‘PPO’) settlements when the Ogden discount rate was set at 2.5% and at a time when real yields were very low. These settlements have an annuity-type structure, i.e. they are typically paid annually over the claimant’s life with mortality, inflation and investment returns being the key risks. Courts may decide that a claim should be settled on a PPO basis, but in the majority of cases the claimant will request a PPO settlement. A further complexity of PPO claims is that due to the annuity-type structure of the claim payments these have to be projected over a longer-term period and reserved for on a discounted basis accordingly. Therefore, the estimation of ultimate claims cost now involves projecting mortality rates, discount rates and benefit indexation rates, which is unlike all other general insurance liabilities.
On 27 February 2017, the Lord Chancellor announced a change in the Ogden discount rate from 2.5% p.a. to minus 0.75% p.a. This change impacted the valuation of the cost of care element of large injury claims, and required insurance companies to hold more money in reserves in order to match the inflation risk in the long term. The impact of the Ogden rate change was recognised in the Group’s 31 December 2016 reserves.
While management believes that the insurance contract liabilities carried at year end are adequate, the application of statistical techniques requires significant judgement.
The estimation of these claims is based on historical experience projected forward. Where possible, the Group adopts multiple techniques to provide a best estimate of the required level of provisions. This assists in developing greater understanding of the trends inherent in the data being projected. The Group’s estimates of losses and loss expenses are reached after a review of several commonly accepted actuarial projection methodologies, as well as more bespoke methods and a number of different bases to determine these provisions. These include methods based upon the following:• the development of previously paid
claims, where payments to date are extrapolated for each prior year;
• estimates based upon a projection of claims numbers and average cost;
• incurred claims development, where incurred claims to date for each year are extrapolated based upon observed development of earlier years; and
• expected loss ratios.
19. Insurance contract liabilities (continued)
b) General insurance claims and insurance contract liabilities (continued)(i) Significant accounting estimates (continued)
Estimate Judgement applied to estimate
The change in the Ogden discount rate during 2017 makes a lump sum settlement more attractive to claimants than it was previously, whilst the valuation of a PPO equivalent remains unchanged. Overall PPO claim settlement frequencies are expected to reduce as claimants are increasingly likely to desire a lump sum settlement.
On 7 September 2017 the Government confirmed that it plans to introduce a new framework based on how claimants actually invest, as well as making sure the rate is reviewed fairly and regularly. If passed, the Ministry of Justice indicated that if the rate were calculated using September 2017 economic conditions, the rate would fall in the range 0% p.a. to +1% p.a.
On 20 March 2018 the Government published a draft of its Civil Liability Bill. This contains proposals for changes to the discount rate and the governance around its setting. If enacted in its current form, and assuming no changes to current market conditions, this should result in lower settlements for certain types of liability claims. While the Group welcomes the proposals, there are a number of factors influencing this potential change meaning that its impact and timing remain uncertain. Therefore the Group continues to maintain a discount rate of -0.75% for reserving such claims, reflecting the current legislated rate.
Large claims impacting each relevant business class are generally assessed separately, being measured either at the face value of the loss adjusters’ estimates or projected separately in order to allow for the future development of large claims.
Over 2017 the Group has increased the Claims Margin position from the previous 2.5% of the Actuarial Best Estimate to 5.6%, in line with the 75th percentile of the Reserve Risk distribution.
Provisions are initially calculated gross of any reinsurance recoveries. A separate estimate is made of the amounts that will be recoverable from reinsurers based upon the gross provisions and having due regard to collectability.
19. Insurance contract liabilities (continued)

153
Notes to the Financial Statements continuedYear ended 31 December 2017
Notes to the Financial Statements continuedYear ended 31 December 2017
Our A
ccounts
LV= Annual Report 2017 Our Accounts152
19. Insurance contract liabilities (continued) a) Analysis of insurance contract liabilities and reinsurance assets
2017 2016
Group NoteGross Reinsurance Net Gross Reinsurance Net
£m £m £m £m £m £m
Participating insurance contract liabilitiesLong-term insurance contract liabilities 19 b 5,279 – 5,279 4,999 – 4,999
Non-participating insurance contract liabilitiesReinsurance relating to participating contracts 19 b – (933) (933) – – –Long-term insurance contract liabilities 19 c 4,371 (644) 3,727 4,204 (474) 3,730Long-term linked insurance contract liabilities 19 d 229 (170) 59 192 (127) 65Long-term claims liabilities 19 e 50 – 50 46 – 46 4,650 (1,747) 2,903 4,442 (601) 3,841 General insurance unearned premiums 19 f 785 (15) 770 793 (17) 776General insurance claims liabilities 19 g 1,643 (543) 1,100 1,563 (472) 1,091 2,428 (558) 1,870 2,356 (489) 1,867 7,078 (2,305) 4,773 6,798 (1,090) 5,708
2017 2016
Society NoteGross Reinsurance Net Gross Reinsurance Net
£m £m £m £m £m £m
Participating insurance contract liabilitiesLong-term insurance contract liabilities 19 b 5,279 – 5,279 4,999 – 4,999
Non-participating insurance contract liabilitiesReinsurance relating to participating contracts 19 b – (933) (933) – – –Long-term insurance contract liabilities 19 c 4,356 (644) 3,712 4,189 (474) 3,715Long-term linked insurance contract liabilities 19 d 229 (170) 59 192 (127) 65Long-term claims liabilities 19 e 50 – 50 45 – 45 4,635 (1,747) 2,888 4,426 (601) 3,825
From 4 December 2017 the Group entered into a reinsurance arrangement in respect of the OB Pension portfolio. The OB Pensions portfolio is a participating insurance contract liability, whereas the associated reinsurance is classified as non-participating as disclosed in the tables above.
19. Insurance contract liabilities (continued) b) Movement in long-term insurance contract liabilities - participating
2017 2016
Group and SocietyGross Reinsurance Net Gross Reinsurance Net
£m £m £m £m £m £m
Balance at 1 January 4,999 – 4,999 3,972 – 3,972Acquired through business combinations – – – 222 – 222Premiums received 31 – 31 33 – 33Liabilities paid for deaths, maturities, surrenders, benefits and claims (444) – (444) (368) – (368)New business 403 – 403 554 – 554Benefits and claims variation 57 – 57 32 – 32Fees deducted (23) – (23) (22) – (22)Accretion of investment income or change in unit prices 224 – 224 317 – 317Adjustment due to changes in assumptions:– Mortality/morbidity/longevity (44) – (44) (2) – (2)– Investment return 38 – 38 217 – 217– Expense (15) – (15) (11) – (11)– Lapse and surrender rates 1 – 1 (6) – (6)– Other basis changes – – – 44 – 44Model changes 12 – 12 – – –Other (59) – (59) 26 – 26TA Fund special bonus (9) – (9) (23) – (23)Mutual bonus 19 – 19 14 – 14Change in economic basis 89 – 89 – – –Balance at 31 December 5,279 – 5,279 4,999 – 4,999
Included within ‘Other’ above is a gain of £24m relating to reinsurance of the OB Pensions portfolio.
b) Movement in non-participating reinsurance assets relating to long-term participating insurance contract liabilities
2017 2016
Group and SocietyGross Reinsurance Net Gross Reinsurance Net
£m £m £m £m £m £m
Balance at 1 January – – – – – –Inception of OB pensions reinsurance contract – (847) (847) – – –Adjustment due to changes in assumptions:– Investment return – (9) (9) – – –Other – (1) (1) – – –Change in economic basis – (76) (76) – – –Balance at 31 December – (933) (933) – – –

155
Notes to the Financial Statements continuedYear ended 31 December 2017
Notes to the Financial Statements continuedYear ended 31 December 2017
Our A
ccounts
LV= Annual Report 2017 Our Accounts154
19. Insurance contract liabilities (continued)c) Movement in long-term insurance contract liabilities – non-participating
2017 2016
GroupGross Reinsurance Net Gross Reinsurance Net
£m £m £m £m £m £m
Balance at 1 January 4,204 (474) 3,730 3,621 (412) 3,209Acquired through business combinations – – – 166 (15) 151Premiums received 156 (61) 95 150 (57) 93Liabilities paid for deaths, maturities, surrenders, benefits and claims (393) 76 (317) (356) 45 (311)New business 156 (113) 43 356 (87) 269Benefits and claims variation 30 (16) 14 13 (3) 10Fees deducted (16) – (16) (16) – (16)Accretion of investment income or change in unit prices 43 – 43 49 – 49Adjustment due to changes in assumptions:– Mortality/morbidity/longevity (6) (9) (15) (114) 136 22– Investment return 80 (6) 74 383 (67) 316– Expense 24 – 24 (24) – (24)– Lapse and surrender rates 13 (9) 4 9 (6) 3– Other basis changes 14 – 14 2 (1) 1Model changes (2) (4) (6) (58) (7) (65)Other 18 (1) 17 23 – 23Change in economic basis 50 (27) 23 – – –Balance at 31 December 4,371 (644) 3,727 4,204 (474) 3,730
2017 2016
SocietyGross Reinsurance Net Gross Reinsurance Net
£m £m £m £m £m £m
Balance at 1 January 4,189 (474) 3,715 3,606 (412) 3,194Acquired through business combinations – – – 166 (15) 151Premiums received 155 (61) 94 150 (57) 93Liabilities paid for deaths, maturities, surrenders, benefits and claims (391) 76 (315) (355) 45 (310)New business 156 (113) 43 356 (87) 269Benefits and claims variation 30 (16) 14 13 (3) 10Fees deducted (16) – (16) (16) – (16)Accretion of investment income or change in unit prices 43 – 43 49 – 49Adjustment due to changes in assumptions:– Mortality/morbidity/longevity (6) (9) (15) (114) 136 22– Investment return 80 (6) 74 382 (67) 315– Expense 24 – 24 (24) – (24)– Lapse and surrender rates 13 (9) 4 9 (6) 3– Other basis changes 14 – 14 2 (1) 1Model changes (2) (4) (6) (58) (7) (65)Other 17 (1) 16 23 – 23Change in economic basis 50 (27) 23 – – –Balance at 31 December 4,356 (644) 3,712 4,189 (474) 3,715
19. Insurance contract liabilities (continued)d) Movement in long-term linked insurance contract liabilities
2017 2016
Group and SocietyGross Reinsurance Net Gross Reinsurance Net
£m £m £m £m £m £m
Balance at 1 January 192 (127) 65 138 (80) 58Premiums received 45 (18) 27 36 (14) 22Liabilities paid for deaths, maturities, surrenders, benefits and claims (41) 25 (16) (31) 12 (19)New business 15 (33) (18) 13 (20) (7)Benefits and claims variation 6 (5) 1 2 (2) –Fees deducted (2) – (2) (2) – (2)Accretion of investment income or change in unit prices 1 – 1 2 – 2Adjustment due to changes in assumptions:– Mortality/morbidity/longevity (14) – (14) – (4) (4)– Investment return 4 (1) 3 34 (14) 20– Expense 5 – 5 (6) – (6)– Lapse and surrender rates 4 (3) 1 2 (2) –Model changes (3) – (3) 3 (3) –Other 3 – 3 1 – 1Change in economic basis 14 (8) 6 – – –Balance at 31 December 229 (170) 59 192 (127) 65
e) Movement in long-term claims liabilities2017 2016
GroupGross Reinsurance Net Gross Reinsurance Net
£m £m £m £m £m £m
Balance at 1 January 46 – 46 40 – 40Claims notified 872 (237) 635 861 (237) 624Claims paid during the year (868) 237 (631) (858) 237 (621)Acquired through business combinations – – – 3 – 3Balance at 31 December 50 – 50 46 – 46
2017 2016
SocietyGross Reinsurance Net Gross Reinsurance Net
£m £m £m £m £m £m
Balance at 1 January 45 – 45 40 – 40Claims notified 871 (237) 634 859 (237) 622Claims paid during the year (866) 237 (629) (857) 237 (620)Acquired through business combinations – – – 3 – 3Balance at 31 December 50 – 50 45 – 45
f) Movement in general insurance unearned premiums2017 2016
GroupGross Reinsurance Net Gross Reinsurance Net
£m £m £m £m £m £m
Balance at 1 January 793 (17) 776 744 (12) 732Premiums written in the year 1,596 (361) 1,235 1,579 (345) 1,234Premiums earned during the year (1,604) 363 (1,241) (1,532) 340 (1,192)Acquired through business combinations – – – 2 – 2Balance at 31 December 785 (15) 770 793 (17) 776
g) Movement in general insurance claims liabilities2017 2016
GroupGross Reinsurance Net Gross Reinsurance Net
£m £m £m £m £m £m
Balance at 1 January 1,563 (472) 1,091 1,353 (386) 967Acquired through business combinations – – – 2 – 2Movement in claims incurred in prior accident years (34) (12) (46) 31 (134) (103)Claims incurred in the current accident year 1,124 (286) 838 1,172 (169) 1,003Claims paid during the year (1,010) 227 (783) (1,000) 217 (783)Unexpired risk provision – – – 5 – 5Balance at 31 December 1,643 (543) 1,100 1,563 (472) 1,091

157
Notes to the Financial Statements continuedYear ended 31 December 2017
Notes to the Financial Statements continuedYear ended 31 December 2017
Our A
ccounts
LV= Annual Report 2017 Our Accounts156
19. Insurance contract liabilities (continued)h) Analysis of general insurance claims developmentThe tables below reflect the cumulative incurred claims including both claims notified and incurred but not reported (‘IBNR’) for each successive accident year at each Statement of Financial Position date, together with the cumulative payments to date. The Group aims to maintain appropriate reserves in order to protect against adverse future claims experience and developments.
Analysis of claims development – gross of reinsurance
2008 2009 2010 2011 2012 2013 2014 2015 2016 2017 Total
£m £m £m £m £m £m £m £m £m £m £mInitial estimate of gross provision 540 607 773 909 1,089 1,077 1,051 1,049 1,148 1,124One year later 540 589 825 915 1,042 1,015 1,000 1,100 1,089Two years later 500 589 841 902 1,018 999 982 1,070Three years later 490 588 835 895 992 986 968Four years later 491 603 825 892 981 998Five years later 487 599 829 876 999Six years later 481 598 830 892Seven years later 480 577 843Eight years later 455 578Nine years later 456Current estimate of cumulative claims 456 578 843 892 999 998 968 1,070 1,089 1,124 9,017Cumulative payments to date (453) (574) (801) (862) (951) (878) (831) (808) (752) (542) (7,452)
Liability recognised in the Statement of Financial Position for 2008 to 2017 accident years 3 4 42 30 48 120 137 262 337 582 1,565Liability recognised in the Statement of Financial Position in respect of prior accident years 60Claims handling provision 18Gross general insurance claims liabilities as at 31 December 2017 1,643
Analysis of claims development – net of reinsurance
2008 2009 2010 2011 2012 2013 2014 2015 2016 2017 Total
£m £m £m £m £m £m £m £m £m £m £mInitial estimate of net provision 507 584 764 899 1,063 1,057 1,039 916 1,002 838One year later 483 578 805 899 1,024 995 934 1,008 836Two years later 464 565 821 893 1,003 943 923 939Three years later 457 562 808 888 964 937 918Four years later 458 577 798 874 955 947Five years later 454 570 797 863 964Six years later 452 566 791 869Seven years later 450 560 798Eight years later 451 559Nine years later 451Current estimate of cumulative claims 451 559 798 869 964 947 918 939 836 838 8,119Cumulative payments to date (451) (558) (792) (851) (938) (864) (814) (753) (591) (434) (7,046)
Liability recognised in the Statement of Financial Position for 2008 to 2017 accident years – 1 6 18 26 83 104 186 245 404 1,073Liability recognised in the Statement of Financial Position in respect of prior accident years 9Claims handling provision 18Net general insurance claims liabilities as at 31 December 2017 1,100
20. Non-participating value of in-force business
Accounting for the non-participating value of in-force business In determining the realistic value of liabilities for participating contracts as disclosed in Note 19, the value of future profits on non-participating business written in the with-profits part of the fund is accounted for as part of the calculation. The present value of future profits of the non-participating business (‘non-participating value of in-force business’) is separately determined and its value is deducted from the sum of the liabilities for participating contracts and the Unallocated divisible surplus. Such an amount is not recognised for business written outside participating contract funds.
The principal assumptions are disclosed separately within Note 25.
Analysis of non-participating value of in-force businessGroup Society
2017 2016 2017 2016£m £m £m £m
Balance at 1 January 324 321 324 321Premiums received (1) (1) (1) (1)Liabilities paid for deaths, maturities, surrenders, benefits and claims (14) (12) (14) (12)New business 41 39 41 39Benefits and claim variation (1) – (1) –Fees deducted (6) (3) (6) (3)Accretion of investment income or change in unit prices 8 1 8 1Adjustment due to changes in assumptions:– Mortality/morbidity/longevity (17) 8 (17) 8– Investment return (4) 18 (4) 18– Expense (10) (2) (10) (2)– Lapse and surrender rates (9) – (9) –– Other basis changes (3) – (3) –Model changes (5) (43) (5) (43)Other (9) (2) (9) (2)Change in economic basis (1) – (1) –Balance at 31 December 293 324 293 324
21. Net change in long-term contract liabilities and non-participating value of in-force businessGroup Society
2017 2016 2017 2016£m £m £m £m
Gross increase in long-term contract liabilitiesIncrease in long-term insurance contract liabilities – participating (191) (813) (191) (813)Increase in investment contract liabilities – participating (51) (21) (51) (21)Increase in long-term insurance contract liabilities – non-participating (117) (417) (117) (417)Increase in investment contract liabilities – non-participating (234) (303) (234) (303)Increase in long-term linked insurance contract liabilities (23) (54) (23) (54) (616) (1,608) (616) (1,608)Mutual bonus (disclosed separately on the Statement of Comprehensive Income) 26 17 26 17
(590) (1,591) (590) (1,591)Increase in long-term contract liabilities ceded to reinsurersIncrease in long-term insurance contract liabilities relating to non-participating contracts 143 47 143 47
Increase in long-term insurance contract liabilities relating to participating contracts 857 – 857 –
Increase in long-term linked insurance contract liabilities 35 47 35 471,035 94 1,035 94
(Decrease)/increase in non-participating value of in-force business (30) 3 (30) 3
Net change in contract liabilities before change in economic basis 415 (1,494) 415 (1,494)Change in economic basis (48) – (48) –Net change in contract liabilities 367 (1,494) 367 (1,494)
In December 2017 the Group entered into a reinsurance arrangement in respect of the OB Pension portfolio, this has had an initial impact of £847m on Long-term contract liabilities ceded to reinsurers. For further details see Note 23.
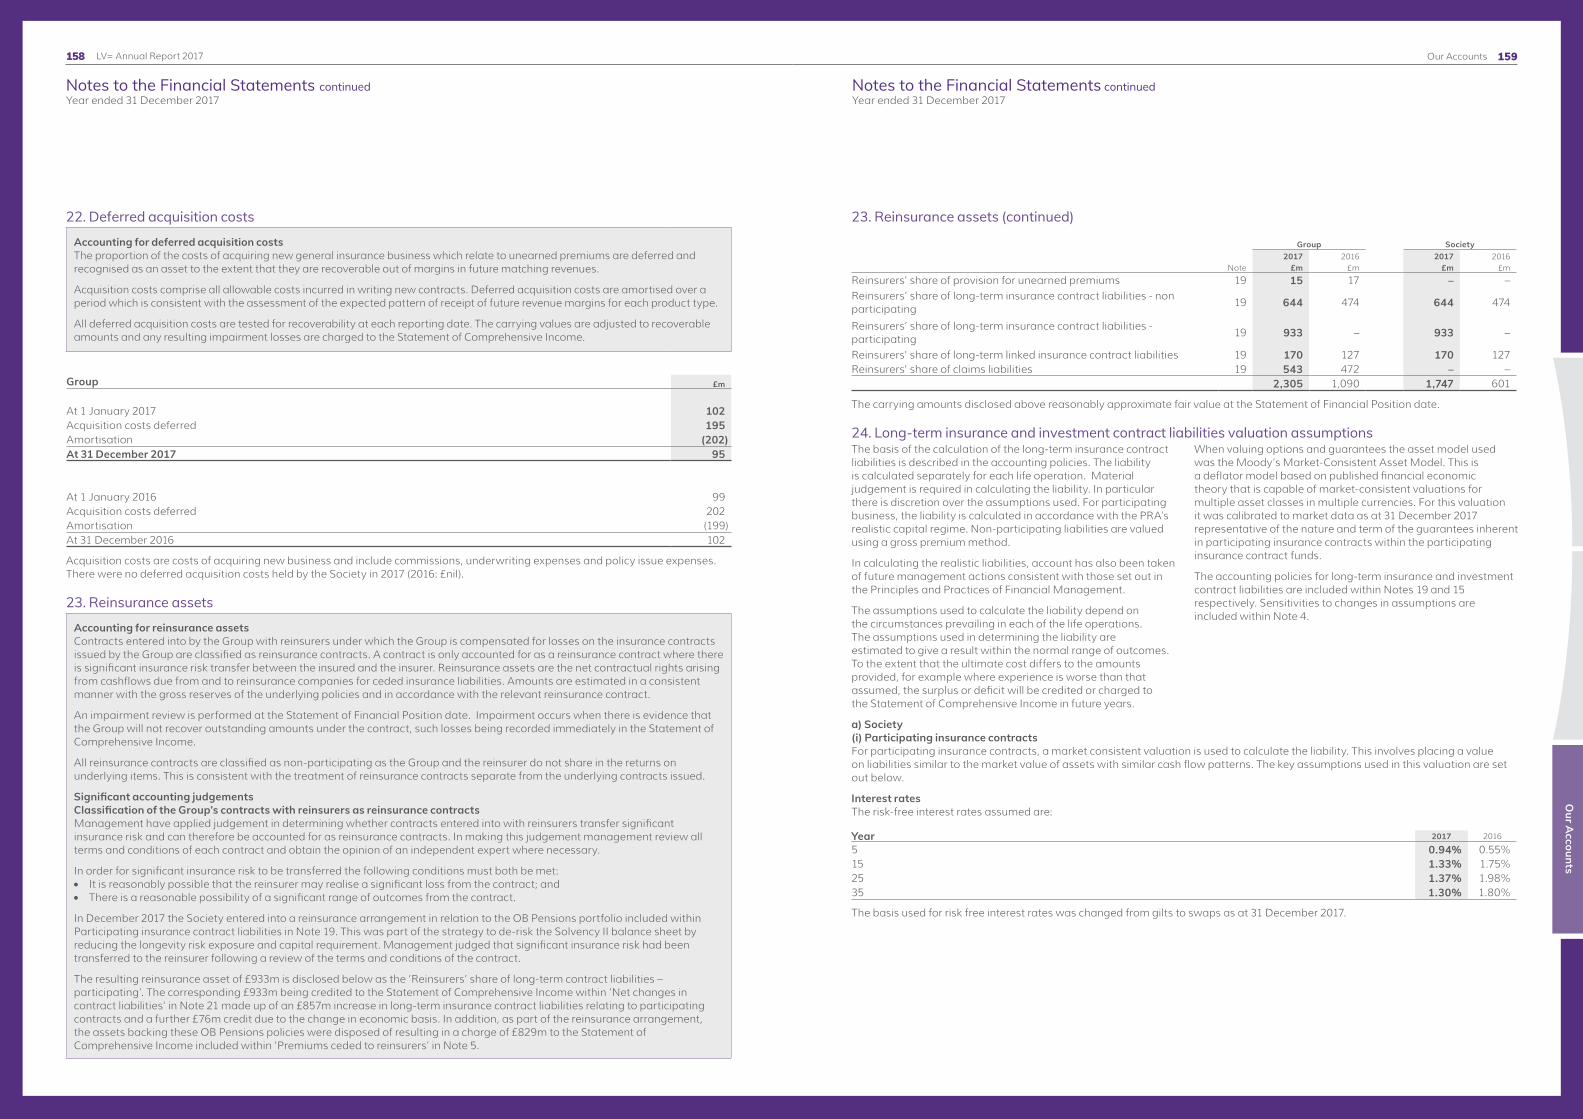
159
Notes to the Financial Statements continuedYear ended 31 December 2017
Notes to the Financial Statements continuedYear ended 31 December 2017
Our A
ccounts
LV= Annual Report 2017 Our Accounts158
22. Deferred acquisition costs
Accounting for deferred acquisition costsThe proportion of the costs of acquiring new general insurance business which relate to unearned premiums are deferred and recognised as an asset to the extent that they are recoverable out of margins in future matching revenues.
Acquisition costs comprise all allowable costs incurred in writing new contracts. Deferred acquisition costs are amortised over a period which is consistent with the assessment of the expected pattern of receipt of future revenue margins for each product type.
All deferred acquisition costs are tested for recoverability at each reporting date. The carrying values are adjusted to recoverable amounts and any resulting impairment losses are charged to the Statement of Comprehensive Income.
Group £m At 1 January 2017 102Acquisition costs deferred 195Amortisation (202)At 31 December 2017 95 At 1 January 2016 99Acquisition costs deferred 202Amortisation (199)At 31 December 2016 102
Acquisition costs are costs of acquiring new business and include commissions, underwriting expenses and policy issue expenses.There were no deferred acquisition costs held by the Society in 2017 (2016: £nil).
23. Reinsurance assets
Accounting for reinsurance assetsContracts entered into by the Group with reinsurers under which the Group is compensated for losses on the insurance contracts issued by the Group are classified as reinsurance contracts. A contract is only accounted for as a reinsurance contract where there is significant insurance risk transfer between the insured and the insurer. Reinsurance assets are the net contractual rights arising from cashflows due from and to reinsurance companies for ceded insurance liabilities. Amounts are estimated in a consistent manner with the gross reserves of the underlying policies and in accordance with the relevant reinsurance contract.
An impairment review is performed at the Statement of Financial Position date. Impairment occurs when there is evidence that the Group will not recover outstanding amounts under the contract, such losses being recorded immediately in the Statement of Comprehensive Income.
All reinsurance contracts are classified as non-participating as the Group and the reinsurer do not share in the returns on underlying items. This is consistent with the treatment of reinsurance contracts separate from the underlying contracts issued.
Significant accounting judgementsClassification of the Group’s contracts with reinsurers as reinsurance contractsManagement have applied judgement in determining whether contracts entered into with reinsurers transfer significant insurance risk and can therefore be accounted for as reinsurance contracts. In making this judgement management review all terms and conditions of each contract and obtain the opinion of an independent expert where necessary.
In order for significant insurance risk to be transferred the following conditions must both be met:l It is reasonably possible that the reinsurer may realise a significant loss from the contract; andl There is a reasonable possibility of a significant range of outcomes from the contract.
In December 2017 the Society entered into a reinsurance arrangement in relation to the OB Pensions portfolio included within Participating insurance contract liabilities in Note 19. This was part of the strategy to de-risk the Solvency II balance sheet by reducing the longevity risk exposure and capital requirement. Management judged that significant insurance risk had been transferred to the reinsurer following a review of the terms and conditions of the contract.
The resulting reinsurance asset of £933m is disclosed below as the ‘Reinsurers’ share of long-term contract liabilities – participating’. The corresponding £933m being credited to the Statement of Comprehensive Income within ‘Net changes in contract liabilities‘ in Note 21 made up of an £857m increase in long-term insurance contract liabilities relating to participating contracts and a further £76m credit due to the change in economic basis. In addition, as part of the reinsurance arrangement, the assets backing these OB Pensions policies were disposed of resulting in a charge of £829m to the Statement of Comprehensive Income included within ‘Premiums ceded to reinsurers’ in Note 5.
23. Reinsurance assets (continued)
Group Society2017 2016 2017 2016
Note £m £m £m £m
Reinsurers' share of provision for unearned premiums 19 15 17 – –Reinsurers’ share of long-term insurance contract liabilities - non participating
19 644 474 644 474
Reinsurers’ share of long-term insurance contract liabilities - participating
19 933 – 933 –
Reinsurers' share of long-term linked insurance contract liabilities 19 170 127 170 127Reinsurers' share of claims liabilities 19 543 472 – – 2,305 1,090 1,747 601
The carrying amounts disclosed above reasonably approximate fair value at the Statement of Financial Position date.
24. Long-term insurance and investment contract liabilities valuation assumptionsThe basis of the calculation of the long-term insurance contract liabilities is described in the accounting policies. The liability is calculated separately for each life operation. Material judgement is required in calculating the liability. In particular there is discretion over the assumptions used. For participating business, the liability is calculated in accordance with the PRA’s realistic capital regime. Non-participating liabilities are valued using a gross premium method.
In calculating the realistic liabilities, account has also been taken of future management actions consistent with those set out in the Principles and Practices of Financial Management.
The assumptions used to calculate the liability depend on the circumstances prevailing in each of the life operations. The assumptions used in determining the liability are estimated to give a result within the normal range of outcomes. To the extent that the ultimate cost differs to the amounts provided, for example where experience is worse than that assumed, the surplus or deficit will be credited or charged to the Statement of Comprehensive Income in future years.
When valuing options and guarantees the asset model used was the Moody’s Market-Consistent Asset Model. This is a deflator model based on published financial economic theory that is capable of market-consistent valuations for multiple asset classes in multiple currencies. For this valuation it was calibrated to market data as at 31 December 2017 representative of the nature and term of the guarantees inherent in participating insurance contracts within the participating insurance contract funds.
The accounting policies for long-term insurance and investment contract liabilities are included within Notes 19 and 15 respectively. Sensitivities to changes in assumptions are included within Note 4.
a) Society(i) Participating insurance contractsFor participating insurance contracts, a market consistent valuation is used to calculate the liability. This involves placing a value on liabilities similar to the market value of assets with similar cash flow patterns. The key assumptions used in this valuation are set out below.
Interest ratesThe risk-free interest rates assumed are:
Year 2017 2016
5 0.94% 0.55%15 1.33% 1.75%25 1.37% 1.98%35 1.30% 1.80%
The basis used for risk free interest rates was changed from gilts to swaps as at 31 December 2017.
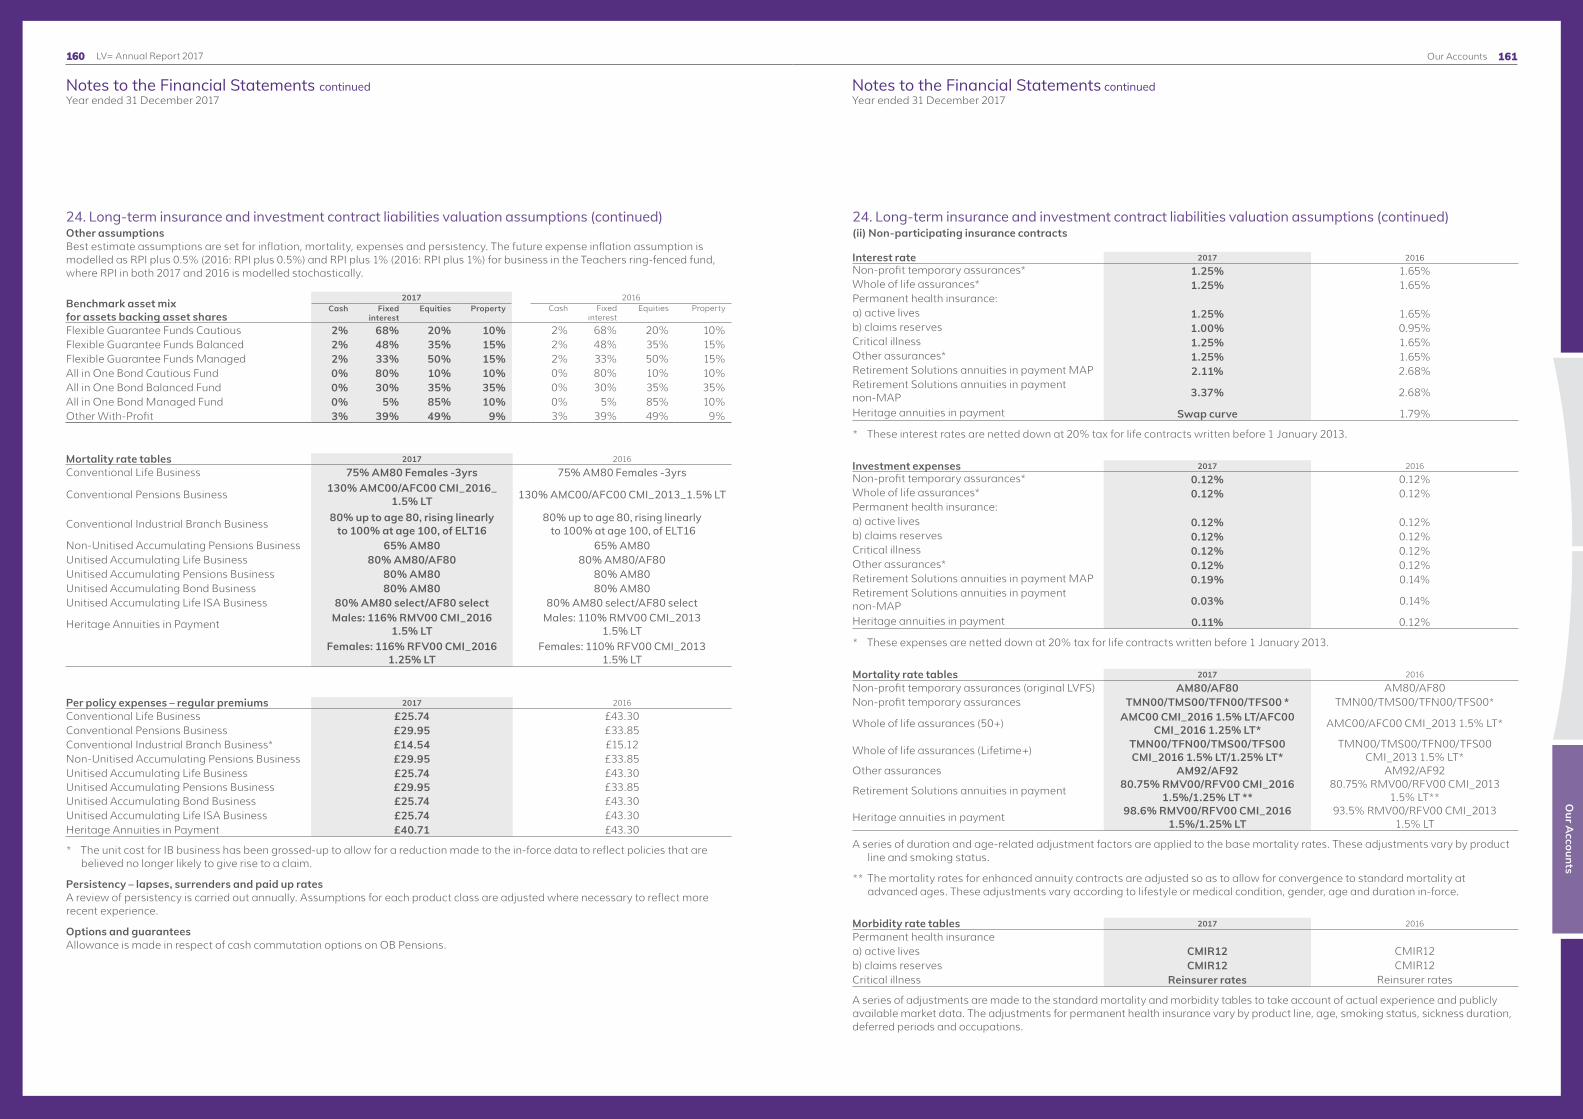
161
Notes to the Financial Statements continuedYear ended 31 December 2017
Notes to the Financial Statements continuedYear ended 31 December 2017
Our A
ccounts
LV= Annual Report 2017 Our Accounts160
24. Long-term insurance and investment contract liabilities valuation assumptions (continued)Other assumptionsBest estimate assumptions are set for inflation, mortality, expenses and persistency. The future expense inflation assumption is modelled as RPI plus 0.5% (2016: RPI plus 0.5%) and RPI plus 1% (2016: RPI plus 1%) for business in the Teachers ring-fenced fund, where RPI in both 2017 and 2016 is modelled stochastically.
Benchmark asset mix for assets backing asset shares
2017 2016Cash Fixed
interestEquities Property Cash Fixed
interestEquities Property
Flexible Guarantee Funds Cautious 2% 68% 20% 10% 2% 68% 20% 10%Flexible Guarantee Funds Balanced 2% 48% 35% 15% 2% 48% 35% 15%Flexible Guarantee Funds Managed 2% 33% 50% 15% 2% 33% 50% 15%All in One Bond Cautious Fund 0% 80% 10% 10% 0% 80% 10% 10%All in One Bond Balanced Fund 0% 30% 35% 35% 0% 30% 35% 35%All in One Bond Managed Fund 0% 5% 85% 10% 0% 5% 85% 10%Other With-Profit 3% 39% 49% 9% 3% 39% 49% 9%
Mortality rate tables 2017 2016
Conventional Life Business 75% AM80 Females -3yrs 75% AM80 Females -3yrs
Conventional Pensions Business 130% AMC00/AFC00 CMI_2016_ 1.5% LT 130% AMC00/AFC00 CMI_2013_1.5% LT
Conventional Industrial Branch Business 80% up to age 80, rising linearly to 100% at age 100, of ELT16
80% up to age 80, rising linearly to 100% at age 100, of ELT16
Non-Unitised Accumulating Pensions Business 65% AM80 65% AM80 Unitised Accumulating Life Business 80% AM80/AF80 80% AM80/AF80Unitised Accumulating Pensions Business 80% AM80 80% AM80Unitised Accumulating Bond Business 80% AM80 80% AM80 Unitised Accumulating Life ISA Business 80% AM80 select/AF80 select 80% AM80 select/AF80 select
Heritage Annuities in Payment Males: 116% RMV00 CMI_2016 1.5% LT
Males: 110% RMV00 CMI_2013 1.5% LT
Females: 116% RFV00 CMI_2016 1.25% LT
Females: 110% RFV00 CMI_2013 1.5% LT
Per policy expenses – regular premiums 2017 2016
Conventional Life Business £25.74 £43.30Conventional Pensions Business £29.95 £33.85Conventional Industrial Branch Business* £14.54 £15.12Non-Unitised Accumulating Pensions Business £29.95 £33.85Unitised Accumulating Life Business £25.74 £43.30Unitised Accumulating Pensions Business £29.95 £33.85Unitised Accumulating Bond Business £25.74 £43.30Unitised Accumulating Life ISA Business £25.74 £43.30Heritage Annuities in Payment £40.71 £43.30
* The unit cost for IB business has been grossed-up to allow for a reduction made to the in-force data to reflect policies that are believed no longer likely to give rise to a claim.
Persistency – lapses, surrenders and paid up ratesA review of persistency is carried out annually. Assumptions for each product class are adjusted where necessary to reflect more recent experience.
Options and guaranteesAllowance is made in respect of cash commutation options on OB Pensions.
24. Long-term insurance and investment contract liabilities valuation assumptions (continued)(ii) Non-participating insurance contracts
Interest rate 2017 2016Non-profit temporary assurances* 1.25% 1.65%Whole of life assurances* 1.25% 1.65%Permanent health insurance:a) active lives 1.25% 1.65%b) claims reserves 1.00% 0.95%Critical illness 1.25% 1.65%Other assurances* 1.25% 1.65%Retirement Solutions annuities in payment MAP 2.11% 2.68%Retirement Solutions annuities in payment non-MAP 3.37% 2.68%
Heritage annuities in payment Swap curve 1.79%
* These interest rates are netted down at 20% tax for life contracts written before 1 January 2013.
Investment expenses 2017 2016
Non-profit temporary assurances* 0.12% 0.12%Whole of life assurances* 0.12% 0.12%Permanent health insurance:a) active lives 0.12% 0.12%b) claims reserves 0.12% 0.12%Critical illness 0.12% 0.12%Other assurances* 0.12% 0.12%Retirement Solutions annuities in payment MAP 0.19% 0.14%Retirement Solutions annuities in payment non-MAP 0.03% 0.14%
Heritage annuities in payment 0.11% 0.12%
* These expenses are netted down at 20% tax for life contracts written before 1 January 2013.
Mortality rate tables 2017 2016
Non-profit temporary assurances (original LVFS) AM80/AF80 AM80/AF80Non-profit temporary assurances TMN00/TMS00/TFN00/TFS00 * TMN00/TMS00/TFN00/TFS00*
Whole of life assurances (50+) AMC00 CMI_2016 1.5% LT/AFC00 CMI_2016 1.25% LT* AMC00/AFC00 CMI_2013 1.5% LT*
Whole of life assurances (Lifetime+) TMN00/TFN00/TMS00/TFS00 CMI_2016 1.5% LT/1.25% LT*
TMN00/TMS00/TFN00/TFS00 CMI_2013 1.5% LT*
Other assurances AM92/AF92 AM92/AF92
Retirement Solutions annuities in payment 80.75% RMV00/RFV00 CMI_2016 1.5%/1.25% LT **
80.75% RMV00/RFV00 CMI_2013 1.5% LT**
Heritage annuities in payment 98.6% RMV00/RFV00 CMI_2016 1.5%/1.25% LT
93.5% RMV00/RFV00 CMI_2013 1.5% LT
A series of duration and age-related adjustment factors are applied to the base mortality rates. These adjustments vary by product line and smoking status.
** The mortality rates for enhanced annuity contracts are adjusted so as to allow for convergence to standard mortality at advanced ages. These adjustments vary according to lifestyle or medical condition, gender, age and duration in-force.
Morbidity rate tables 2017 2016
Permanent health insurancea) active lives CMIR12 CMIR12b) claims reserves CMIR12 CMIR12Critical illness Reinsurer rates Reinsurer rates
A series of adjustments are made to the standard mortality and morbidity tables to take account of actual experience and publicly available market data. The adjustments for permanent health insurance vary by product line, age, smoking status, sickness duration, deferred periods and occupations.
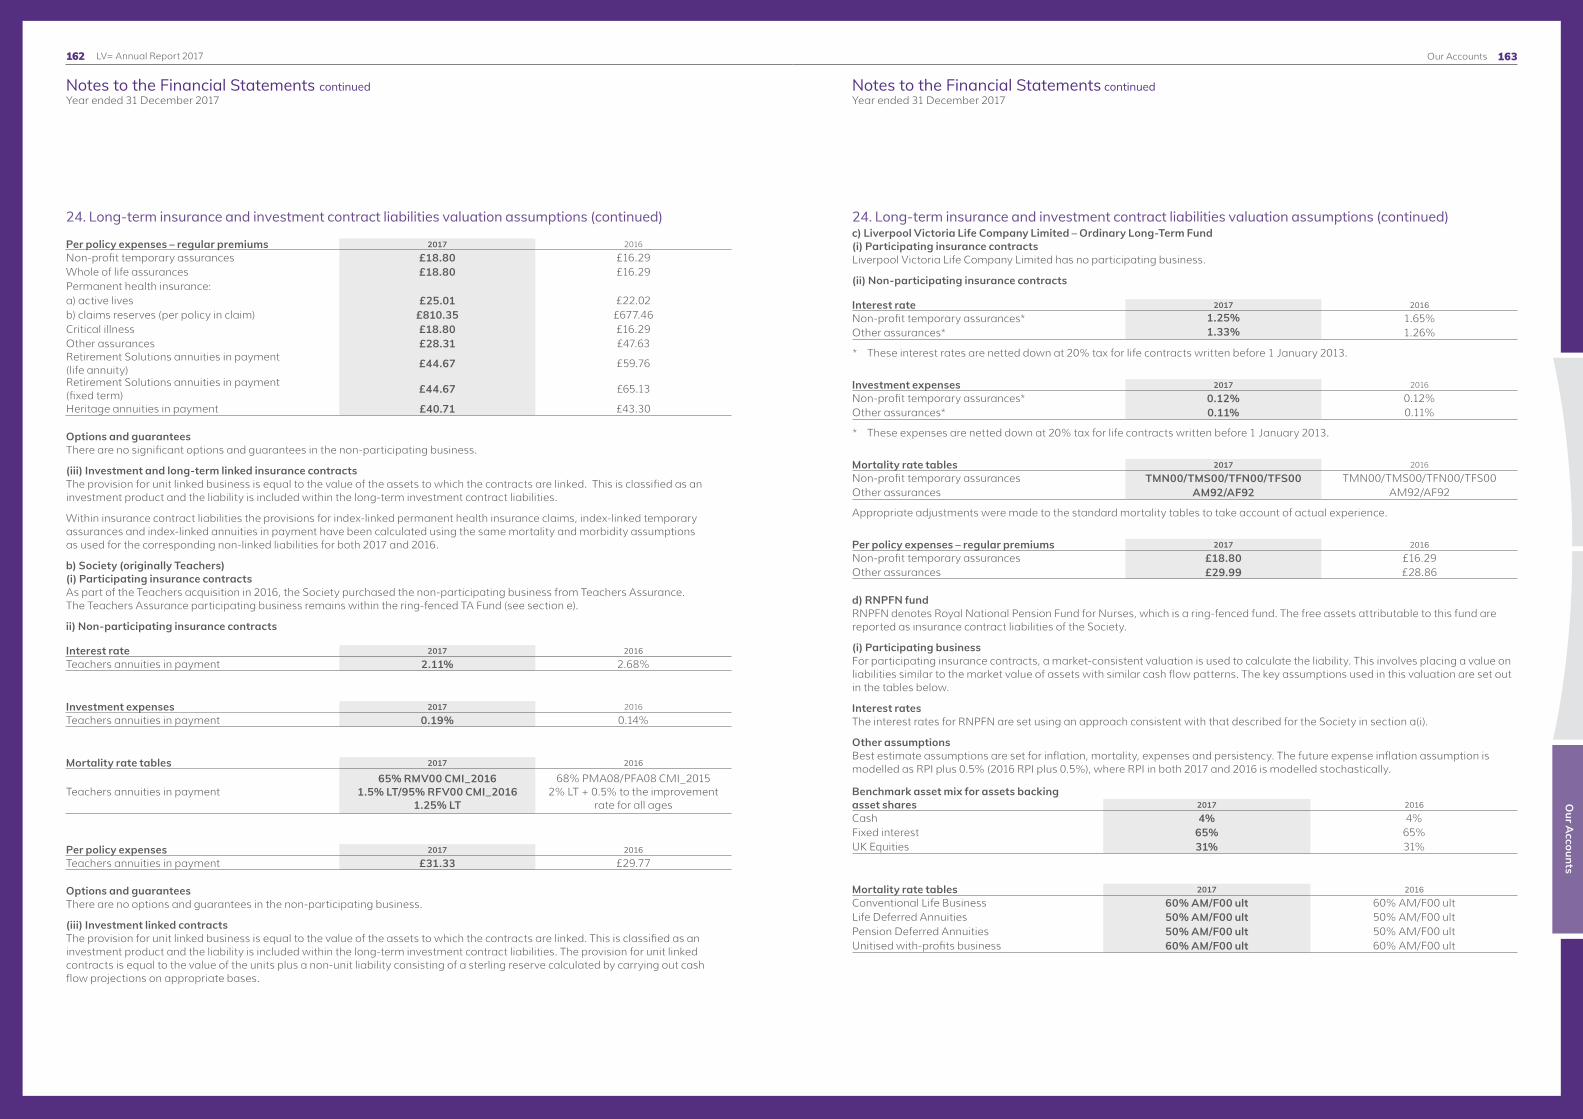
163
Notes to the Financial Statements continuedYear ended 31 December 2017
Notes to the Financial Statements continuedYear ended 31 December 2017
Our A
ccounts
LV= Annual Report 2017 Our Accounts162
24. Long-term insurance and investment contract liabilities valuation assumptions (continued)
Per policy expenses – regular premiums 2017 2016
Non-profit temporary assurances £18.80 £16.29Whole of life assurances £18.80 £16.29Permanent health insurance:a) active lives £25.01 £22.02b) claims reserves (per policy in claim) £810.35 £677.46Critical illness £18.80 £16.29Other assurances £28.31 £47.63Retirement Solutions annuities in payment (life annuity) £44.67 £59.76
Retirement Solutions annuities in payment (fixed term) £44.67 £65.13
Heritage annuities in payment £40.71 £43.30
Options and guaranteesThere are no significant options and guarantees in the non-participating business.
(iii) Investment and long-term linked insurance contracts The provision for unit linked business is equal to the value of the assets to which the contracts are linked. This is classified as an investment product and the liability is included within the long-term investment contract liabilities.
Within insurance contract liabilities the provisions for index-linked permanent health insurance claims, index-linked temporary assurances and index-linked annuities in payment have been calculated using the same mortality and morbidity assumptions as used for the corresponding non-linked liabilities for both 2017 and 2016.
b) Society (originally Teachers)(i) Participating insurance contracts As part of the Teachers acquisition in 2016, the Society purchased the non-participating business from Teachers Assurance. The Teachers Assurance participating business remains within the ring-fenced TA Fund (see section e).
ii) Non-participating insurance contracts
Interest rate 2017 2016
Teachers annuities in payment 2.11% 2.68%
Investment expenses 2017 2016
Teachers annuities in payment 0.19% 0.14%
Mortality rate tables 2017 2016
Teachers annuities in payment65% RMV00 CMI_2016
1.5% LT/95% RFV00 CMI_2016 1.25% LT
68% PMA08/PFA08 CMI_2015 2% LT + 0.5% to the improvement
rate for all ages
Per policy expenses 2017 2016
Teachers annuities in payment £31.33 £29.77
Options and guaranteesThere are no options and guarantees in the non-participating business.
(iii) Investment linked contractsThe provision for unit linked business is equal to the value of the assets to which the contracts are linked. This is classified as an investment product and the liability is included within the long-term investment contract liabilities. The provision for unit linked contracts is equal to the value of the units plus a non-unit liability consisting of a sterling reserve calculated by carrying out cash flow projections on appropriate bases.
24. Long-term insurance and investment contract liabilities valuation assumptions (continued)c) Liverpool Victoria Life Company Limited – Ordinary Long-Term Fund(i) Participating insurance contractsLiverpool Victoria Life Company Limited has no participating business.
(ii) Non-participating insurance contracts
Interest rate 2017 2016
Non-profit temporary assurances* 1.25% 1.65%Other assurances* 1.33% 1.26%
* These interest rates are netted down at 20% tax for life contracts written before 1 January 2013.
Investment expenses 2017 2016
Non-profit temporary assurances* 0.12% 0.12%Other assurances* 0.11% 0.11%
* These expenses are netted down at 20% tax for life contracts written before 1 January 2013.
Mortality rate tables 2017 2016
Non-profit temporary assurances TMN00/TMS00/TFN00/TFS00 TMN00/TMS00/TFN00/TFS00Other assurances AM92/AF92 AM92/AF92
Appropriate adjustments were made to the standard mortality tables to take account of actual experience.
Per policy expenses – regular premiums 2017 2016
Non-profit temporary assurances £18.80 £16.29Other assurances £29.99 £28.86
d) RNPFN fundRNPFN denotes Royal National Pension Fund for Nurses, which is a ring-fenced fund. The free assets attributable to this fund are reported as insurance contract liabilities of the Society.
(i) Participating businessFor participating insurance contracts, a market-consistent valuation is used to calculate the liability. This involves placing a value on liabilities similar to the market value of assets with similar cash flow patterns. The key assumptions used in this valuation are set out in the tables below.
Interest ratesThe interest rates for RNPFN are set using an approach consistent with that described for the Society in section a(i).
Other assumptionsBest estimate assumptions are set for inflation, mortality, expenses and persistency. The future expense inflation assumption is modelled as RPI plus 0.5% (2016 RPI plus 0.5%), where RPI in both 2017 and 2016 is modelled stochastically.
Benchmark asset mix for assets backing asset shares 2017 2016
Cash 4% 4%Fixed interest 65% 65%UK Equities 31% 31%
Mortality rate tables 2017 2016
Conventional Life Business 60% AM/F00 ult 60% AM/F00 ult Life Deferred Annuities 50% AM/F00 ult 50% AM/F00 ultPension Deferred Annuities 50% AM/F00 ult 50% AM/F00 ultUnitised with-profits business 60% AM/F00 ult 60% AM/F00 ult

165
Notes to the Financial Statements continuedYear ended 31 December 2017
Notes to the Financial Statements continuedYear ended 31 December 2017
Our A
ccounts
LV= Annual Report 2017 Our Accounts164
24. Long-term insurance and investment contract liabilities valuation assumptions (continued)
Per policy expenses – regular premiums 2017 2016
Conventional Life Business £25.74 £43.30Pensions Deferred Annuities £29.95 £33.85Life Deferred Annuities £25.74 £43.30Unitised with-profits ISA £25.74 £43.30Unitised with-profits Bond £25.74 £43.30
Persistency – lapses, surrenders and paid up ratesA review of persistency is carried out annually. Assumptions are adjusted where appropriate to reflect more recent experience.
Options and guaranteesThe provisions held in respect of guaranteed annuity options are determined on a market consistent basis. The total amount provided in respect of the future costs of the guaranteed annuity options was £89m (2016: £90m).
(ii) Non-participating business
Interest rate 2017 2016
Non-profits assurances* 1.54% 1.54%Non-profits general deferred annuities* 1.54% 1.54%Annuities in Payment (Life)* 1.54% 1.54%Annuities in Payment (Pension) 1.54% 1.54%Pension Deferred Annuities 1.54% 1.54%
* These interest rates are netted down at 20% tax for life contracts written before 1 January 2013.
Investment expenses 2017 2016
Non-profits assurances* 0.17% 0.13%Non-profits general deferred annuities* 0.17% 0.13%Annuities in Payment (Life)* 0.17% 0.13%Annuities in Payment (Pension) 0.17% 0.13%Pension Deferred Annuities 0.17% 0.13%
* These expenses are netted down at 20% tax for life contracts written before 1 January 2013.
Mortality rate tables 2017 2016
Non-profits assurances 72.0% AM/F00 ult 72.0% AM/F00 ultNon-profits general deferred annuities 42.5% AM/F00 ult 42.5% AM/F00 ult
Annuities in Payment (Male)61.2% IML00 with CMI_2009
improvement model with a long-term improvement rate of 1.75%
61.2% IML00 with CMI_2009 improvement model with a long-term
improvement rate of 1.75%
Annuities in Payment (Female)72.3% IFL00 with CMI_2009
improvement model with a long-term improvement rate of 1.5%
72.3% IFL00 with CMI_2009 improvement model with a long-term
improvement rate of 1.5%Pension Deferred Annuities 42.5% AM/F00 ult 42.5% AM/F00 ult
Appropriate adjustments were made to the standard mortality tables to take account of actual experience and publicly available market data.
24. Long-term insurance and investment contract liabilities valuation assumptions (continued)(iii) Linked fundThere are two main classes of contract included within the linked fund, one is classified as an insurance contract and the liability is included within the long-term unit linked insurance contract liabilities, the other is classified as an investment product and the liability is included within the investment contract liabilities. The provision for unit linked insurance contracts is equal to the value of the units. A non-unit liability consisting mainly of a sterling reserve calculated by carrying out cash flow projections on appropriate bases is included within the liability for insurance contracts only.
Interest rate 2017 2016
Unit linked assurances* 1.54% 1.54%
* This interest rate is netted down at 20% tax for life contracts written before 1 January 2013.
Investment expenses 2017 2016
Unit linked assurances* 0.17% 0.13%
* This expense is netted down at 20% tax for life contracts written before 1 January 2013.
Mortality rate tables 2017 2016
Unit linked assurances 72% AM/F00 ult 72% AM/F00 ult
e) TA fundThe TA fund denotes the Teachers Assurance Fund, which is a ring-fenced fund. The free assets attributable to this fund are reported as insurance and investment contract liabilities of the Society.
(i) Participating contractsFor participating contracts, a market consistent valuation is used to calculate the liability. This involves placing a value on liabilities similar to the market value of assets with similar cash flow patterns. The key assumptions used in this valuation are set out below.
Interest ratesThe risk-free interest rates assumed are:
Year 2017 2016
5 0.94% 0.55%15 1.33% 1.75%25 1.37% 1.98%35 1.30% 1.80%
The basis used for risk free interest rates was changed from gilts to swaps as at 31 December 2017.
Other assumptionsBest estimate assumptions are set for inflation, mortality, expenses and persistency. The future expense inflation assumption is modelled as RPI, where RPI in both 2017 and 2016 is modelled stochastically.
Benchmark asset mix for assets backing asset shares at the valuation date: 2017 2016
Cash 5% 5%Fixed interest 35% 35%Equities 53% 53%Property 7% 7%
Mortality rate tables 2017 2016
Conventional Life Business 50% AM92 / 65% AF92 55% AM92 / 80% AF92Unitised Accumulating Life Business 50% AM92 / 65% AF92 60% AM92 / 45% AF92Unitised Accumulating Bond Business 50% AM92 / 65% AF92 50% AM92 / 80% AF92Unitised Accumulating Life ISA Business 50% AM92 / 65% AF92 50% AM92 / 80% AF92

167
Notes to the Financial Statements continuedYear ended 31 December 2017
Notes to the Financial Statements continuedYear ended 31 December 2017
Our A
ccounts
LV= Annual Report 2017 Our Accounts166
24. Long-term insurance and investment contract liabilities valuation assumptions (continued)
Per policy expenses 2017 2016
Conventional Life Business £38.84 £37.19Unitised Accumulating Life Business* £38.84 £37.19Unitised Accumulating Bond Business £38.84 £37.19Unitised Accumulating Life ISA Business £38.84 £37.19
* A lower percentage of these amounts is used for Series 3 policies.
Persistency – lapses, surrenders and paid up ratesA review of persistency is carried out annually. Assumptions for each product class are adjusted where necessary to reflect more recent experience.
Options and guaranteesThere are no guaranteed annuity or financial options within the contracts participating in the TA Fund.
25. Non-participating value of in-force business valuation assumptionsa) SocietyNon-participating contracts
Interest ratesThe earned rate and discount rate are set by reference to the risk free yield curve applicable at the valuation date with appropriate adjustments for an illiquidity premium and margins for risk and uncertainty, with the exception of Retirement Solutions annuities in payment where the earned rate is based on the IRR of the risk adjusted backing assets cashflows.
Mortality rate tables 2017 2016
Non-profit temporary assurances (original LVFS) AM80/AF80 AM80/AF80
Non-profit temporary assurances TMN00/TMS00/TFN00/TFS00 CMI_2016 1.5%/1.25% LT *
TMN00/TMS00/TFN00/TFS00 CMI_2013 1.5% LT *
Whole of Life Assurances (50+) AMC00 CMI_2016 1.5% LT/AFC00 CMI_2016 1.25% LT* AMC00/AFC00 CMI_2013 1.5% LT*
Whole of Life Assurances (Lifetime+) TMN00/TMS00/TFN00/TFS00 CMI_2016 1.5% LT/1.25% LT*
TMN00/TMS00/TFN00/TFS00 CMI_2013 1.5% LT*
Other assurances AM92/AF92 AM92/AF92
Retirement Solutions annuities in payment 95% RMV00/RFV00 CMI_2016 1.5%/1.25% LT **
95% RMV00/RFV00 CMI_2013 1.5% LT**
Heritage annuities in payment 116% RMV00/RFV00 CMI_2016 1.5%/1.25% LT 110% RMV00/RFV00 CMI_2013 1.5% LT
Unit linked pensions (original LVFS) 80% AM92C20/AF92C20 80% AM92C20/AF92C20
* A series of duration and age-related adjustment factors are applied to the base mortality rates. These adjustments vary by product line and smoking status.
** The mortality rates for enhanced annuity contracts are adjusted so as to allow for convergence to standard mortality at advanced ages. These adjustments vary according to lifestyle or medical condition, gender, age and duration in-force.
Morbidity rate tables 2017 2016
Permanent health insurance:a) active lives CMIR12 CMIR12b) claims reserves CMIR12 CMIR12Critical illness Reinsurer rates Reinsurer rates
A series of adjustments are made to the standard mortality and morbidity tables to take account of actual experience and publicly available market data. The adjustments for permanent health insurance vary by product line, age, smoking status, sickness duration, deferred periods and occupations.
Persistency and unit costsPersistency and unit costs assumptions are based on our best estimate of future experience. A review of persistency is carried out annually. Assumptions for each product class are adjusted where appropriate to reflect more recent experience.
Fixed assets and investmentsThis section gives detail on the tangible, intangible and investment assets of the Society and Group that are used to generate profit for the business.
26. Property and equipment
Accounting for property and equipmentOperational property and equipment are held at cost less accumulated depreciation. Cost includes the original purchase price of the asset and the costs attributable to bringing the asset to its working condition for its intended use. Both property and equipment are depreciated to their estimated residual values on a straight line basis over their estimated useful lives. The periods used are as follows:
Freehold buildings and finance lease property 10 to 50 years Leasehold property enhancements 10 years or lease term if shorter Fixtures and fittings 3 to 10 years IT equipment 3 to 8 years Land is not depreciated.
Assets are written down to their recoverable amount where this is less than the carrying value.
The assets’ residual values and useful lives are reviewed, and adjusted if appropriate, at each Statement of Financial Position date.
Group
Freehold and leasehold property
Leasehold property
enhancements
Fixtures, fittings and IT
equipment Total £m £m £m £m
Cost: At 1 January 2017 43 15 28 86Additions – 1 1 2Disposals – (2) (2) (4)At 31 December 2017 43 14 27 84 Accumulated depreciation:At 1 January 2017 17 11 15 43Provided in the year 2 1 4 7Disposals – (2) (1) (3)At 31 December 2017 19 10 18 47
Net book value at 31 December 2017 24 4 9 37 Cost:At 1 January 2016 39 15 22 76Acquired through business combinations 4 – – 4Additions – – 6 6At 31 December 2016 43 15 28 86 Accumulated depreciation:At 1 January 2016 16 9 12 37Provided in the year 1 2 3 6At 31 December 2016 17 11 15 43 Net book value at 31 December 2016 26 4 13 43
Included within the Freehold and leasehold property category above are assets held under finance leases with a net book value of £18m (2016: £20m).
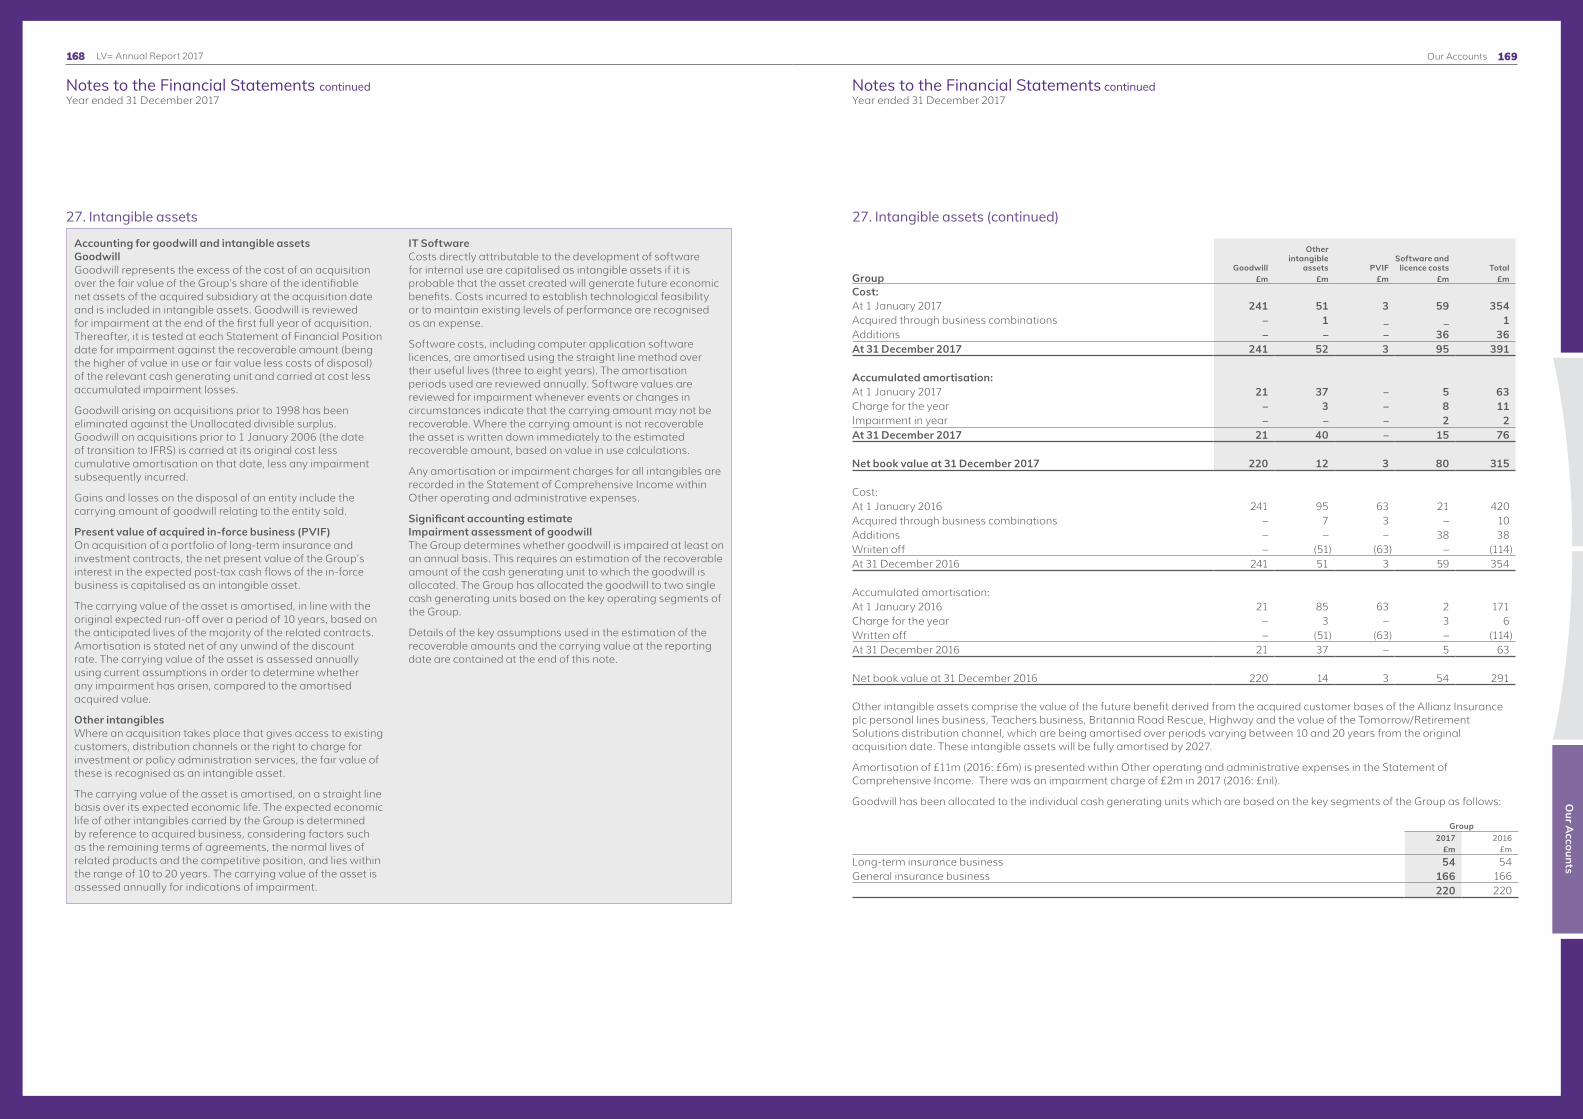
169
Notes to the Financial Statements continuedYear ended 31 December 2017
Notes to the Financial Statements continuedYear ended 31 December 2017
Our A
ccounts
LV= Annual Report 2017 Our Accounts168
Accounting for goodwill and intangible assetsGoodwillGoodwill represents the excess of the cost of an acquisition over the fair value of the Group’s share of the identifiable net assets of the acquired subsidiary at the acquisition date and is included in intangible assets. Goodwill is reviewed for impairment at the end of the first full year of acquisition. Thereafter, it is tested at each Statement of Financial Position date for impairment against the recoverable amount (being the higher of value in use or fair value less costs of disposal) of the relevant cash generating unit and carried at cost less accumulated impairment losses.
Goodwill arising on acquisitions prior to 1998 has been eliminated against the Unallocated divisible surplus. Goodwill on acquisitions prior to 1 January 2006 (the date of transition to IFRS) is carried at its original cost less cumulative amortisation on that date, less any impairment subsequently incurred.
Gains and losses on the disposal of an entity include the carrying amount of goodwill relating to the entity sold.
Present value of acquired in-force business (PVIF)On acquisition of a portfolio of long-term insurance and investment contracts, the net present value of the Group’s interest in the expected post-tax cash flows of the in-force business is capitalised as an intangible asset.
The carrying value of the asset is amortised, in line with the original expected run-off over a period of 10 years, based on the anticipated lives of the majority of the related contracts. Amortisation is stated net of any unwind of the discount rate. The carrying value of the asset is assessed annually using current assumptions in order to determine whether any impairment has arisen, compared to the amortised acquired value.
Other intangiblesWhere an acquisition takes place that gives access to existing customers, distribution channels or the right to charge for investment or policy administration services, the fair value of these is recognised as an intangible asset.
The carrying value of the asset is amortised, on a straight line basis over its expected economic life. The expected economic life of other intangibles carried by the Group is determined by reference to acquired business, considering factors such as the remaining terms of agreements, the normal lives of related products and the competitive position, and lies within the range of 10 to 20 years. The carrying value of the asset is assessed annually for indications of impairment.
IT SoftwareCosts directly attributable to the development of software for internal use are capitalised as intangible assets if it is probable that the asset created will generate future economic benefits. Costs incurred to establish technological feasibility or to maintain existing levels of performance are recognised as an expense.
Software costs, including computer application software licences, are amortised using the straight line method over their useful lives (three to eight years). The amortisation periods used are reviewed annually. Software values are reviewed for impairment whenever events or changes in circumstances indicate that the carrying amount may not be recoverable. Where the carrying amount is not recoverable the asset is written down immediately to the estimated recoverable amount, based on value in use calculations.
Any amortisation or impairment charges for all intangibles are recorded in the Statement of Comprehensive Income within Other operating and administrative expenses.
Significant accounting estimateImpairment assessment of goodwillThe Group determines whether goodwill is impaired at least on an annual basis. This requires an estimation of the recoverable amount of the cash generating unit to which the goodwill is allocated. The Group has allocated the goodwill to two single cash generating units based on the key operating segments of the Group.
Details of the key assumptions used in the estimation of the recoverable amounts and the carrying value at the reporting date are contained at the end of this note.
27. Intangible assets 27. Intangible assets (continued)
GroupGoodwill
Other intangible
assets PVIFSoftware and
licence costs Total£m £m £m £m £m
Cost: At 1 January 2017 241 51 3 59 354Acquired through business combinations – 1 _ _ 1Additions – – – 36 36At 31 December 2017 241 52 3 95 391 Accumulated amortisation:At 1 January 2017 21 37 – 5 63Charge for the year – 3 – 8 11Impairment in year – – – 2 2At 31 December 2017 21 40 – 15 76 Net book value at 31 December 2017 220 12 3 80 315 Cost: At 1 January 2016 241 95 63 21 420Acquired through business combinations – 7 3 – 10Additions – – – 38 38Wriiten off – (51) (63) – (114)At 31 December 2016 241 51 3 59 354 Accumulated amortisation:At 1 January 2016 21 85 63 2 171Charge for the year – 3 – 3 6Written off – (51) (63) – (114)At 31 December 2016 21 37 – 5 63 Net book value at 31 December 2016 220 14 3 54 291
Other intangible assets comprise the value of the future benefit derived from the acquired customer bases of the Allianz Insurance plc personal lines business, Teachers business, Britannia Road Rescue, Highway and the value of the Tomorrow/Retirement Solutions distribution channel, which are being amortised over periods varying between 10 and 20 years from the original acquisition date. These intangible assets will be fully amortised by 2027.
Amortisation of £11m (2016: £6m) is presented within Other operating and administrative expenses in the Statement of Comprehensive Income. There was an impairment charge of £2m in 2017 (2016: £nil).
Goodwill has been allocated to the individual cash generating units which are based on the key segments of the Group as follows:
Group2017 2016
£m £mLong-term insurance business 54 54General insurance business 166 166 220 220

171
Notes to the Financial Statements continuedYear ended 31 December 2017
Notes to the Financial Statements continuedYear ended 31 December 2017
Our A
ccounts
LV= Annual Report 2017 Our Accounts170
27. Intangible assets (continued)Impairment testing of goodwillGoodwill is reviewed annually for impairment, or more frequently when there are indicators that impairment may have occurred, by comparing the carrying value to its recoverable amount. The recoverable amount of the cash generating unit is based on value in use calculations. The calculations are based upon discounting expected pre-tax cash flows at a risk-adjusted interest rate appropriate to the cash generating unit, the determination of both of which requires the exercise of judgement. The estimation of pre-tax cash flows is sensitive to the periods for which forecasts are available and to assumptions regarding the long-term sustainable cash flows. While forecasts are compared with actual performance and external economic data, expected cash flows reflect management’s view of future performance.
Key assumptions used in the annual impairment testing of intangible assetsThe key assumptions used for impairment testing are set out below for both the long-term insurance business and the general insurance business. The long-term insurance business incorporates both the Heritage and Life businesses.
The recoverable amount of the long-term insurance business and of the general insurance business have each been determined using discounted cash flow predictions based on financial plans approved by management covering a five year period, with a terminal growth rate applied thereafter. Both the growth rates and the discount rates used are consistent with the ranges observed in the market place.
For the general insurance business the cash flows used in the financial plans are most sensitive to changes in the loss ratio, therefore sensitivities have been performed based on this measure. Key loss ratio assumptions are based on a combination of historic and current market place trends, and management judgement.
2017 2016
Long-term insurance
General insurance
Long-term insurance
General insurance
AssumptionsTerminal growth rate 1.5% 1.5% 2% 2%Pre-tax discount rate 9% 9% 9% 9%Recoverable amount in excess of carrying value £169m £1,309m £462m £1,238mSensitivitiesImpact on recoverable amount of a 2% increase in pre-tax discount rate £69m £466m £129m £494mPre-tax discount rate required to eliminate headroom 17% 20% 37% 18%Impact on recoverable amount of an annual reduction in forecast cashflows– 10% cashflow reduction £38m £212m £64m £213m– 1% loss ratio increase n/a £177m n/a £192mReduction required in annual forecast cashflows to eliminate headroom– cashflow reduction 44% 64% 73% 58%– sustained increase in loss ratio n/a 7.4% n/a 6.5%
28. Investments in group undertakings
Accounting for investments in group undertakingsShares in subsidiariesThe subsidiaries are held in the Society’s Statement of Financial Position at cost less any provision for impairment. An assessment of the realisable value is made at the year end and, if the Directors assess that there has been a permanent fall in that value below the carrying value, a provision is made to bring the carrying value down to the assessed realisable value.
Loan stock in subsidiariesLoan stock in subsidiaries is initially measured at fair value. Subsequent to initial recognition it is measured at amortised cost.
Society2017 2016
£m £mShares in subsidiaries Cost less provisions at 1 January 496 470Acquired through business combinations – 26Additions 81 3Conversion of loan stock to equity 326 –Reduction in carrying value including impairment (16) (3)
887 496
Loan stock in subsidiaries
Cost at 1 January 306 300Additions 4 6Redemption (300) –
10 306Shares and loan stock in subsidiaries at 31 December 897 802
During the year £326m of loans and related interest owed to the Society by its subsidiary LV Capital PLC were converted to equity and a further £81m of capital was invested in subsidiaries of the Society.
The £26m acquisition in 2016 relates to the transfer in of the Teachers Provident Society Limited and its subsidiary companies on 1 June 2016.
The Society has examined the carrying value of its subsidiaries and concluded that a provision for impairment of £16m (2016: £3m) was required in regard to these investments.
Further details of the Group’s loan stock are given in Note 49 and the Group’s investments in Notes 42 and 43.
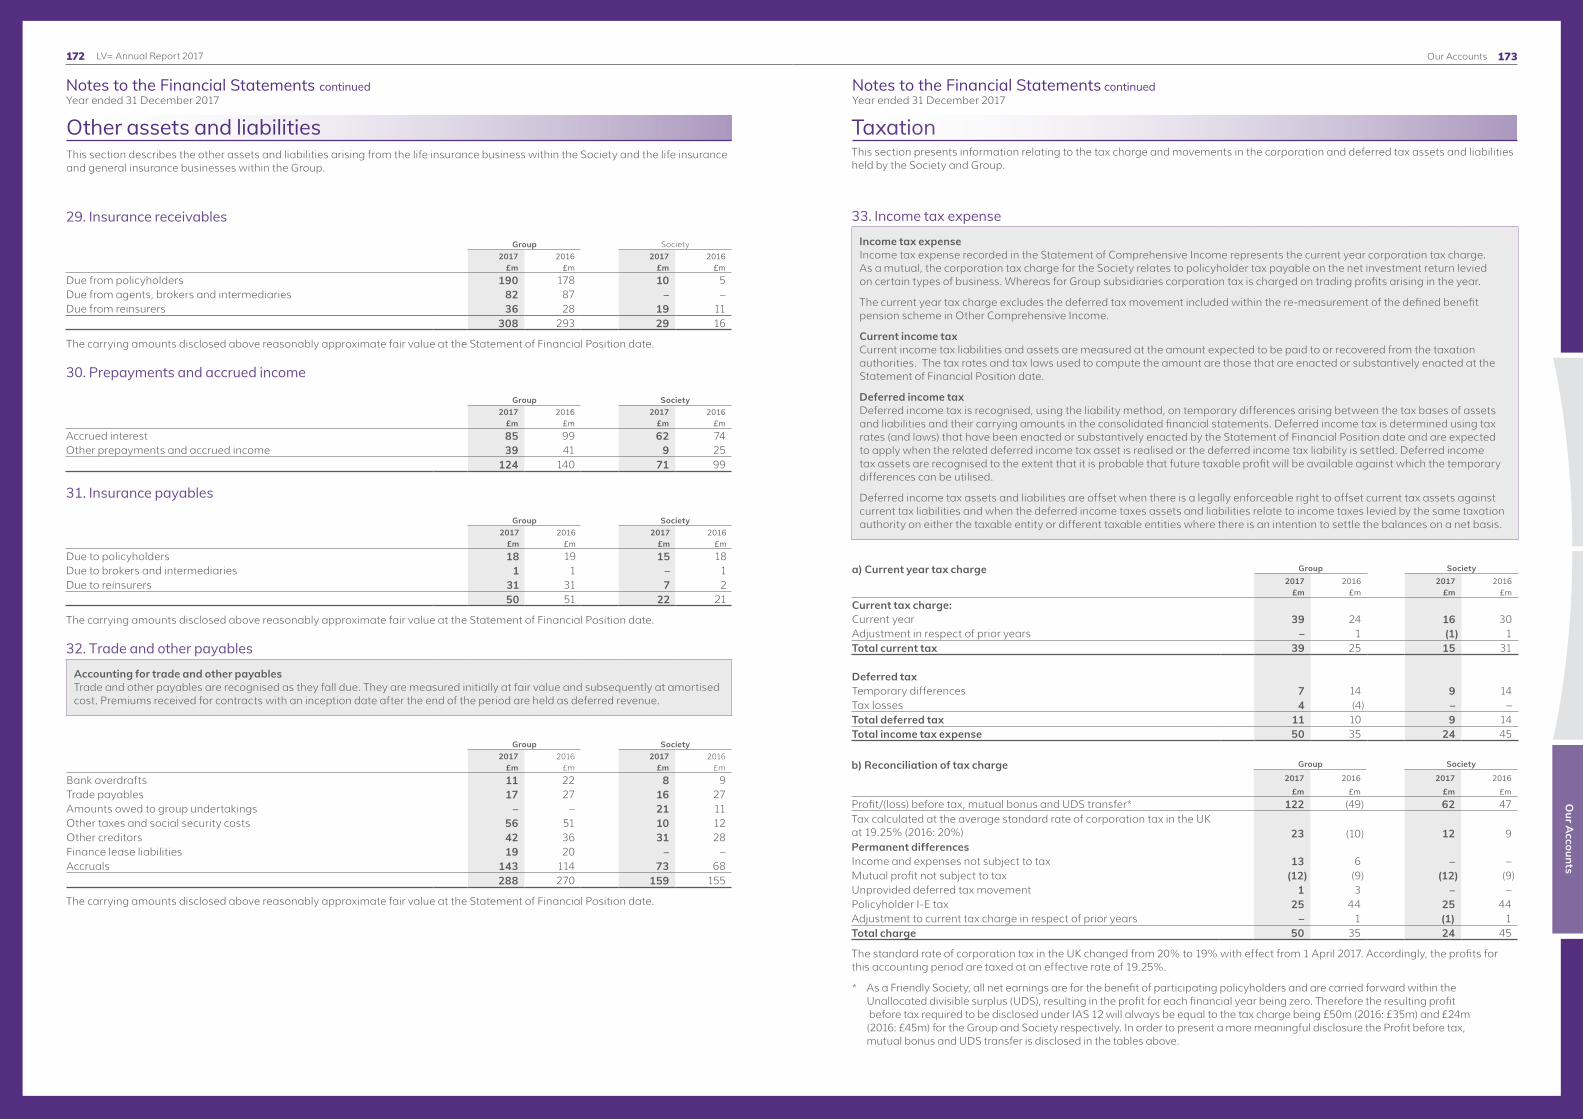
173
Notes to the Financial Statements continuedYear ended 31 December 2017
Notes to the Financial Statements continuedYear ended 31 December 2017
Our A
ccounts
LV= Annual Report 2017 Our Accounts172
Other assets and liabilitiesThis section describes the other assets and liabilities arising from the life insurance business within the Society and the life insurance and general insurance businesses within the Group.
29. Insurance receivables
Group Society2017 2016 2017 2016
£m £m £m £mDue from policyholders 190 178 10 5Due from agents, brokers and intermediaries 82 87 – –Due from reinsurers 36 28 19 11 308 293 29 16
The carrying amounts disclosed above reasonably approximate fair value at the Statement of Financial Position date.
30. Prepayments and accrued income
Group Society2017 2016 2017 2016
£m £m £m £mAccrued interest 85 99 62 74Other prepayments and accrued income 39 41 9 25 124 140 71 99
31. Insurance payables
Group Society2017 2016 2017 2016
£m £m £m £mDue to policyholders 18 19 15 18Due to brokers and intermediaries 1 1 – 1Due to reinsurers 31 31 7 2 50 51 22 21
The carrying amounts disclosed above reasonably approximate fair value at the Statement of Financial Position date.
32. Trade and other payables
Accounting for trade and other payablesTrade and other payables are recognised as they fall due. They are measured initially at fair value and subsequently at amortised cost. Premiums received for contracts with an inception date after the end of the period are held as deferred revenue.
Group Society2017 2016 2017 2016
£m £m £m £m
Bank overdrafts 11 22 8 9Trade payables 17 27 16 27Amounts owed to group undertakings – – 21 11Other taxes and social security costs 56 51 10 12Other creditors 42 36 31 28Finance lease liabilities 19 20 – –Accruals 143 114 73 68 288 270 159 155
The carrying amounts disclosed above reasonably approximate fair value at the Statement of Financial Position date.
TaxationThis section presents information relating to the tax charge and movements in the corporation and deferred tax assets and liabilities held by the Society and Group.
33. Income tax expense
Income tax expense Income tax expense recorded in the Statement of Comprehensive Income represents the current year corporation tax charge. As a mutual, the corporation tax charge for the Society relates to policyholder tax payable on the net investment return levied on certain types of business. Whereas for Group subsidiaries corporation tax is charged on trading profits arising in the year.
The current year tax charge excludes the deferred tax movement included within the re-measurement of the defined benefit pension scheme in Other Comprehensive Income.
Current income taxCurrent income tax liabilities and assets are measured at the amount expected to be paid to or recovered from the taxation authorities. The tax rates and tax laws used to compute the amount are those that are enacted or substantively enacted at the Statement of Financial Position date.
Deferred income taxDeferred income tax is recognised, using the liability method, on temporary differences arising between the tax bases of assets and liabilities and their carrying amounts in the consolidated financial statements. Deferred income tax is determined using tax rates (and laws) that have been enacted or substantively enacted by the Statement of Financial Position date and are expected to apply when the related deferred income tax asset is realised or the deferred income tax liability is settled. Deferred income tax assets are recognised to the extent that it is probable that future taxable profit will be available against which the temporary differences can be utilised.
Deferred income tax assets and liabilities are offset when there is a legally enforceable right to offset current tax assets against current tax liabilities and when the deferred income taxes assets and liabilities relate to income taxes levied by the same taxation authority on either the taxable entity or different taxable entities where there is an intention to settle the balances on a net basis.
a) Current year tax charge Group Society2017 2016 2017 2016
£m £m £m £mCurrent tax charge:Current year 39 24 16 30Adjustment in respect of prior years – 1 (1) 1Total current tax 39 25 15 31
Deferred taxTemporary differences 7 14 9 14Tax losses 4 (4) – –Total deferred tax 11 10 9 14Total income tax expense 50 35 24 45
b) Reconciliation of tax charge Group Society
2017 2016 2017 2016£m £m £m £m
Profit/(loss) before tax, mutual bonus and UDS transfer* 122 (49) 62 47Tax calculated at the average standard rate of corporation tax in the UK at 19.25% (2016: 20%) 23 (10) 12 9Permanent differencesIncome and expenses not subject to tax 13 6 – –Mutual profit not subject to tax (12) (9) (12) (9)Unprovided deferred tax movement 1 3 – –Policyholder I-E tax 25 44 25 44Adjustment to current tax charge in respect of prior years – 1 (1) 1Total charge 50 35 24 45
The standard rate of corporation tax in the UK changed from 20% to 19% with effect from 1 April 2017. Accordingly, the profits for this accounting period are taxed at an effective rate of 19.25%.
* As a Friendly Society, all net earnings are for the benefit of participating policyholders and are carried forward within the Unallocated divisible surplus (UDS), resulting in the profit for each financial year being zero. Therefore the resulting profit before tax required to be disclosed under IAS 12 will always be equal to the tax charge being £50m (2016: £35m) and £24m (2016: £45m) for the Group and Society respectively. In order to present a more meaningful disclosure the Profit before tax, mutual bonus and UDS transfer is disclosed in the tables above.

175
Notes to the Financial Statements continuedYear ended 31 December 2017
Notes to the Financial Statements continuedYear ended 31 December 2017
Our A
ccounts
LV= Annual Report 2017 Our Accounts174
34. Corporation tax asset
Group Society2017 2016 2017 2016
£m £m £m £mCorporation tax receivable – 6 – –
– 6 – –
35. Deferred tax liability
Group Society£m £m
Balance at 1 January 2017 (70) (73)Amounts recorded in the Statement of Comprehensive Income (11) (9)Amounts recorded in pension scheme re-measurements within Other Comprehensive Income (16) (16)Balance at 31 December 2017 (97) (98)
Group Society
(i) Analysis of deferred taxation temporary differences2017 2016 2017 2016
£m £m £m £mExcess of depreciation 2 1 – –Temporary differences on expenses 3 8 4 9Temporary differences arising on consolidation – (1) – –Temporary differences on unrealised gains (40) (35) (40) (35)Temporary difference on re-measurement of defined benefit pension scheme (62) (47) (62) (47)Tax losses – 4 – –Deferred tax liability (97) (70) (98) (73) (ii) Deferred taxation asset not recognisedTax losses unrecognised 8 12 – – 8 12 – –
The value of deferred tax liabilities expected to be settled after more than 12 months is £87m in the Group (2016: £67m) and £88m in the Society (2016: £69m).
The calculation of deferred tax balances at the year end takes into account the reduction in the UK main corporation tax rate to 17%, substantively enacted on 6 September 2016 and effective from 1 April 2020.
The valuation and recoverability of deferred tax assets relating to capital allowances in excess of depreciation, temporary differences on expenses and taxable losses carried forward is dependent on the availability of future taxable profits within the Society and Group. Management forecasts currently support the future recoverability of deferred tax assets recognised in the balance sheet as at 31 December 2017.
36. Corporation tax liability
Group Society2017 2016 2017 2016
£m £m £m £mCorporation tax 20 – 9 6
20 – 9 6
Employee benefitsThis section details the costs and commitments associated with employing our staff.
37. Employee benefits expense
Accounting for staff costs under IAS 19The Society and Group apply IAS 19 Employee benefits in accounting for staff costs.
Short-term employee benefits Salaries, accrued bonuses and social security costs are recognised over the period in which the employees provide the services to which the payments relate.
Group Society2017 2016 2017 2016
£m £m £m £mWages and salaries 218 225 213 221Social security costs 21 21 21 21Pension costs 16 17 15 17
255 263 249 259
Of the £249m (2016: £259m) employee benefit expense in the Society, £133m (2016: £137m) is recharged to other Group companies, leaving £116m (2016: £122m) of staff costs directly relating to the Society.
Wages and salaries include charges for ongoing in flight long-term incentive plans (LTIPs) for Life, General Insurance and Group employees of £6.0m in 2017 (2016: £5.7m). The Group LTIP plan terms are described in the Report on Directors’ Remuneration on page 81.
For the 2015-17 scheme the Group has exceeded the targets for growth in adjusted average pre-tax profits resulting in the maximum payout for this measure. The Relative Investment Performance was below benchmark resulting in £nil payout for this measure.£7.3m will be paid to eligible employees in May 2018.
On 29 December 2017, 3,717 employees (excluding contractors and temporary staff) from the Society transferred to Liverpool Victoria General Insurance Group Limited under a TUPE arrangement.
The number of employees during the year, including executive directors, calculated on a monthly average basis, was as follows:
Group Society
2017 2016 2017 2016Number Number Number Number
Member and customer contact 3,784 4,124 3,730 4,050Administration 2,080 2,137 2,045 2,120
5,864 6,261 5,775 6,170

177
Notes to the Financial Statements continuedYear ended 31 December 2017
Notes to the Financial Statements continuedYear ended 31 December 2017
Our A
ccounts
LV= Annual Report 2017 Our Accounts176
Defined benefit pension schemesThe Group operates three pension schemes with defined benefit sections, the LV= Employee Pension Scheme (“LV Scheme”), the Ockham Pension Scheme (acquired as part of an earlier acquisition) and the Teachers Assurance Group Pension Scheme (acquired as part of the Teachers Assurance acquisition on 1 June 2016). The Society is the principal employer for the LV Scheme and the Ockham Pension Scheme. Teachers Management Services Limited, a subsidiary of the Society, is the principal employer for the Teachers Assurance Group Pension Scheme. The LV Scheme and the Ockham Pension Scheme are both hybrid schemes with a defined benefit section and a defined contribution section.
Defined contribution pension schemesAll employees are eligible to join the defined contribution section of the LV Scheme. Employees contribute a minimum of 3% of salary. The employee contribution is double matched by the Society up to a maximum employer contribution of 14%. The assets of this scheme are held separately from those of the Group in an independently administered fund. The Group’s contribution under this scheme during the year amounted to £18m (2016: £19m).
From 29 December 2017, employees who moved to LVGIG under a TUPE arrangement ceased to be members of the LV Scheme and joined the new My LVGIG Savings Plan, a Group Personal Pension plan.
Accounting for pension benefits under IAS 19For defined benefit schemes, the net surplus or deficit is calculated annually with the assets measured at the fair value at the Statement of Financial Position date and the liabilities discounted at the rate of return available on high quality corporate bonds. The net surplus, to the extent recoverable, or deficit is recognised as a pension benefit asset or liability in the Statement of Financial Position. No separate liability for funding requirements is recognised as the Society has an unconditional right to any of the assets of the pension schemes which would remain following the schemes’ termination.
The pension cost for the schemes is analysed between current service cost, past service cost, net interest on the net defined benefit liability and any gain or loss on settlement. Current service cost is the actuarially calculated present value of the benefits earned by the active employees in each period. Past service costs, relating to employee service in prior periods arising in the current period as a result of the introduction of, or improvement to, retirement benefits, are recognised in Other operating and administrative expenses on a straight-line basis over the period in which the increases in benefits vest or are earned.
All movements other than re-measurements in respect of the pension benefit obligation are recognised in Other operating and administrative expenses in the Statement of Comprehensive Income. Actuarial gains and losses arising from experience adjustments and changes in actuarial assumptions are recognised as re-measurements in Other Comprehensive Income in the period in which they arise.
For defined contribution plans, the Group pays contributions to an independently administered pension fund. The Group has no further payment obligations once the contributions have been paid. The contributions are recognised as an employee benefit expense when they are due.
Significant accounting estimates and judgements(i) Significant accounting estimateValuation of the defined benefit obligationThe valuations of the pension benefit obligations for the Group’s three defined benefit schemes require actuarial assumptions about discount rates, inflation, future salary increases, longevity and future pension increases. Due to the long-term nature of these obligations, the estimates are subject to significant uncertainty.
Details of the principal assumptions used for each of the material defined benefit schemes are disclosed within the valuations of the individual schemes disclosed in sections (ii) and (iii).
(ii) Significant accounting judgementsRecognition of defined benefit assetManagement have applied judgement in evaluating whether the net pension asset can be recognised for each of the pension schemes in accordance with the existing IFRIC 14.
Recognising the asset under the current criteria of IFRIC 14, ‘The limit on a defined benefit asset, minimum funding requirement and their interaction’ is allowable for both the LV and Ockham Pension Schemes because the terms of the pension scheme trust deeds state that the Society has an unconditional right to any assets of the schemes which ultimately remain following the schemes’ termination, assuming the gradual settlement of the scheme liabilities over time until all members have left the schemes. However this is not the case for the trust deed of the Teachers Assurance Group Pension Scheme, so the asset for this scheme is not recognised.
The IASB are expected to publish an amendment to IFRIC 14 during 2018. This amendment, once effective in future accounting periods, may impact the recognition of the pension fund surplus. Management will consider the implications of the amendment once it has been published.
38. Pension benefit asset 38. Pension benefit asset (continued)(i) Summary of defined benefit schemes
Pension benefit asset
2017 2016LV Scheme Ockham Teachers Total LV Scheme Ockham Teachers Total
£m £m £m £m £m £m £m £m
Asset 163 15 – 178 114 20 – 134163 15 – 178 114 20 – 134
Re-measurements
2017 2016LV Scheme Ockham Teachers Total LV Scheme Ockham Teachers Total
£m £m £m £m £m £m £m £m
Re-measurements 40 (5) – 35 15 (1) – 14 Income tax expense (17) 1 – (16) (9) (7) – (16)Amount charged to Comprehensive Income 23 (4) – 19 6 (8) – (2)Cumulative re-measurements recognised in the Statement of Comprehensive Income 193 (10) – 183 153 (5) – 148
Teachers Assurance Group Pension SchemeThe Teachers Assurance Group Pension Scheme is a final salary pension scheme, which provides benefits to members in the form of a guaranteed level of pension payable for life. The level of benefits depends upon the member’s length of service and their final salary. The fair value of the plan assets was £34m (2016: £33m) and the present value of the obligations was £30m (2016: £33m) as at 31 December 2017. The surplus of £4m (2016: £nil ) has not been recognised because under IFRIC 14, the wording of the scheme trust deed does not allow the Society the right to the scheme’s assets following the scheme’s termination. The scheme is closed to new entrants and was closed to future accrual for existing members on 31 December 2015. Funding contributions of £20,000 were paid during the year (2016: £20,000) from the Teachers Assurance fund, a closed fund within the Society. The triennial valuation as at 30 September 2017 is in progress and has not yet concluded. Due to the immaterial nature of the Teachers scheme no detailed disclosures have been made.
Further details of the LV and Ockham schemes are disclosed separately within sections (ii) and (iii) of this note respectively.
(ii) LV Schemea) Information about the schemeThe final salary section of the LV scheme provides benefits to members in the form of a guaranteed level of pension payable for life. The level of benefits depends upon the member’s length of service and their final salary.
The scheme assets are held in a separate trustee-administered fund to meet long-term pension liabilities to past and present employees.
The liabilities of the scheme are measured by discounting the best estimate of future cash flows to be paid out by the scheme using the projected unit method, which is an accrued benefits valuation method.
The scheme has a Corporate Trustee required to act in the best interests of the scheme’s beneficiaries. The Trustee may be removed at the discretion of the Society, in its capacity as principal employer, provided that the board of any new trustee company comprises three directors representing the members, including one director who must be a pensioner and up to a further five directors selected by the Society.
The final salary section is closed to new entrants and was closed to future accrual for existing members on 30 June 2013, at which time they were eligible to join the defined contribution section of the scheme.

179
Notes to the Financial Statements continuedYear ended 31 December 2017
Notes to the Financial Statements continuedYear ended 31 December 2017
Our A
ccounts
LV= Annual Report 2017 Our Accounts178
38. Pension benefit asset (continued)
b) Net Statement of Financial Position2017 2016
£m £m
Present value of defined benefit obligation (1,331) (1,308)Fair value of plan assets 1,494 1,422Pension benefit asset at the end of the year 163 114
c) The movement in the net defined benefit asset over the year is as follows:
Present value of obligation
Fair value of plan assets Total
£m £m £m
At 1 January 2017 (1,308) 1,422 114 Pension costs:Current service cost (1) – (1)Interest (expense)/income (37) 40 3 (38) 40 2 Re-measurements:– Return on plan assets, excluding amounts included in interest (expense)/income – 94 94 – Gain from changes in demographic assumptions 4 – 4 – Loss from changes in financial assumptions (58) – (58) (54) 94 40 Other movements:– Contributions by employer – 7 7 – Benefits paid 69 (69) – 69 (62) 7 At 31 December 2017 (1,331) 1,494 163
At 1 January 2016 (1,080) 1,167 87 Pension costs:Current service cost (2) – (2)Interest (expense)/income (41) 45 4 (43) 45 2 Re-measurements:– Return on plan assets, excluding amounts included in interest (expense)/income – 253 253 – Gain from changes in demographic assumptions 2 – 2 – Loss from changes in financial assumptions (264) – (264)– Experience gains 24 – 24 (238) 253 15 Other movements:– Contributions by employer – 10 10 – Benefits paid 53 (53) – 53 (43) 10 At 31 December 2016 (1,308) 1,422 114
38. Pension benefit asset (continued)(ii) LV Scheme (continued)
d) Principal assumptions used 2017 2016
Discount rate 2.50% 2.85%RPI inflation 3.20% 3.30%CPI inflation 2.20% 2.30%Pension increases for in-payment benefits– RPI price inflation capped at 5% pa, floor of 3% pa 3.45% 3.45%– RPI price inflation capped at 5% pa 3.40% 3.35%– RPI price inflation capped at 2.5% pa 2.50% 2.45%– CPI price inflation capped at 3.0% pa 2.35% 2.30%Rate of (non-guaranteed minimum pension) increases in deferment 2.20% 2.30%
Cash commutationActive at the time of scheme closure 20% 10%Deferred at the time of scheme closure 20% 20%
Scheme member valuation date 31 March 2015 31 March 2015
The discount rate and inflation rate assumptions for 2017 and 2016 have been set with reference to yield curves. The single rates disclosed above represent the weighted average equivalent rate based on the yield curve used.
For 2017, mortality for members is assumed to follow LV specific Club Vita individual base tables, based on pooled experience during the period 2011 to 2013 (2016: LV specific Club Vita tables 2011 – 2013).
The table below shows the life expectancy assumptions used in the accounting assessments based on the average future life expectancy of a scheme member who is a pensioner aged 65 (non-pensioner is assumed to be 45 now).
Future life expectancy assumptions (in years) as at 31 December 2017 2016
Pensioner (currently aged 65)– Male 22.7 22.9– Female 24.3 24.7Non-pensioner (at age 65, currently aged 45)– Male 23.9 24.2– Female 25.8 26.2
In all cases, as at 31 December 2017 CMI Core 2016 projections with a long-term trend of 1.50% have been applied (31 December 2016, CMI Core 2014 projections with a long-term trend of 1.25% have been applied).
e) Sensitivity analysis: Impact on defined benefit obligation of making changes to key assumptions
Change in assumption Impact on defined benefit obligation
Discount rate Decrease by 0.5% Increase by £138m (10%)RPI rate Decrease by 0.5% Decrease by £78m (6%)Life expectancy Increase by 1 year Increase by £44m (3%)
The sensitivity analysis has been calculated by valuing the defined benefit obligation using the amended assumptions shown in the table above and keeping the remaining assumptions the same as disclosed in the principal assumptions table for the scheme, except in the case of the inflation sensitivity where other assumptions that depend on assumed inflation have also been amended correspondingly.

181
Notes to the Financial Statements continuedYear ended 31 December 2017
Notes to the Financial Statements continuedYear ended 31 December 2017
Our A
ccounts
LV= Annual Report 2017 Our Accounts180
38. Pension benefit asset (continued)(ii) LV Scheme (continued) f) Plan asset informationThe following table shows a breakdown of the plan assets:
2017 2016Quoted Unquoted Total
% Quoted Unquoted Total
%£m £m £m £m £m £m
Equities and unit trusts 99 7 106 7 92 9 101 7Debt securities 1,687 – 1,687 113 1,594 – 1,594 112Cash and cash equivalents 113 4 117 8 90 – 90 6Real estate/property – 5 5 – – 5 5 –Derivatives 21 (469) (448) (30) 9 (399) (390) (27)Other – 27 27 2 – 22 22 2
1,920 (426) 1,494 100 1,785 (363) 1,422 100
The use of derivatives is predominantly gilt repos and swaps to hedge the interest and inflation exposure. In addition a proportion of the derivative exposure relates to a synthetic equity strategy used to gain exposure to the global equity markets.
In determining and reviewing the Scheme’s investment strategy, the Trustee adopts a Pensions Risk Management Framework (PRMF). This framework translates the principal goal of paying member benefits into measurable funding objectives and risk constraints, agreed by the Trustee. The PRMF is reviewed and monitored by the Trustee on at least a quarterly basis. The Trustee’s primary funding objective is to reach full funding on the Technical Provisions basis, with a long-term target of moving towards being fully funded on a Gilts +0.25% liability valuation basis by 2033 if possible. In setting the investment strategy, the Trustee aims to:
l Target an expected return on assets close to that required to meet the funding objectives within the PRMF;l Manage the investment risk including that arising due to mismatch between assets and liabilities and limit the total risk on the
Scheme below the risk budget set in the PRMF;l Maintain suitable liquidity of assets such that the Scheme is not forced to buy and sell investments at particular times to pay
member benefits or meet potential collateral calls.
Following the triennial scheme valuation which took place as at 31 March 2015, the Society as principal employer agreed, on behalf of participating employees, to make a one-off payment of £7,500,000 followed by monthly deficit reduction contributions of £416,667 from October 2016 until 31 March 2025 to meet the statutory funding objective*. In addition to these funding contributions, the Society continues to make payments of £169,525 per month towards the regular expenses of administering the defined benefit section of the Scheme plus payments equal to the pension protection fund (PPF) levies. The next formal valuation of the Scheme is due no later than 31 March 2018.
* The statutory funding objective is that the Scheme must have ‘sufficient and appropriate’ assets to meet the expected costs of providing members past service benefits.
g) Pension scheme risksThrough its defined benefit pension schemes the Group is exposed to a number of risks, the most significant of which are detailed below:
Asset volatility: The plan liabilities are calculated using a discount rate set with reference to corporate bond yields; if plan assets underperform this yield, this will create a deficit. The plan assets are predominantly held in debt securities which match the liabilities with a small holding of equities that are expected to outperform corporate bonds in the long-term.
Changes in bond yields: A decrease in corporate bond yields will increase plan liabilities, although this will be offset by an increase in the value of the scheme’s bond holdings.
Inflation risk: The majority of the scheme’s benefit obligations are linked to inflation, therefore an increase in inflation will lead to an increase in liabilities. In most cases, caps on the level of inflationary increases and derivatives are in place to protect the scheme against significant rises in inflation.
Life expectancy: The scheme’s obligations are to provide benefits for the life of the member, so any increases in life expectancy will result in an increase in the scheme’s liabilities. In 2012 the trustees of the LV Scheme entered into a longevity swap which mitigated the majority of this risk for the LV scheme.
h) Expected maturity analysis of undiscounted pension benefits:
Less than a year
Between 1-2 years
Between 2-5 years Over 5 years Total
£m £m £m £m £mAt 31 December 2017 56 41 130 2,051 2,278
The weighted average duration of the gross defined benefit obligation is 20 years. The expected contributions to the scheme for the year ending 31 December 2018 are £7m.
38. Pension benefit asset (continued)(iii) Ockham Schemea) Information about the schemeThe final salary section of the Ockham scheme provides benefits to members in the form of a guaranteed level of pension payable for life. The level of benefits depends upon the members’ length of service and their final salary. The scheme is closed to new entrants. The scheme assets are held in separate trustee-administered funds to meet long-term pension liabilities to past employees. The liabilities of the scheme are measured by discounting the best estimate of future cash flows to be paid out by the scheme using the projected unit method, which is an accrued benefits valuation method.
The scheme has a Board of Trustees who are required to act in the best interests of the scheme’s beneficiaries. Two of the trustees are nominated by the members under the rules notified to the members of the scheme, to serve for a period of three years. In accordance with the trust deed, the Society, as principal employer, has the power to appoint and remove the other trustees of the scheme. The member-nominated trustees may be removed before the end of their three year term only by the agreement of all the remaining trustees.
b) Net Statement of Financial Position2017 2016
£m £mPresent value of defined benefit obligation (149) (143)Fair value of plan assets 164 163Pension benefit asset at the end of the year 15 20
c) The movement in the net defined benefit asset/(obligation) over the year is as follows:
Present value of obligation
Fair value of plan assets Total
£m £m £m At 1 January 2017 (143) 163 20 Pension costs:Interest (expense)/income (4) 4 –
(4) 4 – Re-measurements:– Return on plan assets, excluding amounts included in interest (expense)/income – 3 3 – Loss from changes in financial assumptions (8) – (8)
(8) 3 (5)Other movements:– Benefits paid 6 (6) –
6 (6) – At 31 December 2017 (149) 164 15 At 1 January 2016 (122) 119 (3)Pension costs:Interest (expense)/income (5) 5 – (5) 5 – Re-measurements:– Return on plan assets, excluding amounts included in interest (expense)/income – 20 20 – Loss from changes in financial assumptions (27) – (27)– Experience gains 6 – 6
(21) 20 (1)Other movements:– Contributions by employer – 24 24– Benefits paid 5 (5) – 5 19 24At 31 December 2016 (143) 163 20

183
Notes to the Financial Statements continuedYear ended 31 December 2017
Notes to the Financial Statements continuedYear ended 31 December 2017
Our A
ccounts
LV= Annual Report 2017 Our Accounts182
38. Pension benefit asset (continued)(iii) Ockham Scheme (continued)
d) Principal assumptions used 2017 2016
Discount rate 2.50% 2.80%RPI inflation 3.20% 3.30%CPI inflation 2.20% 2.30%Pension increases for in-payment benefits– RPI price inflation capped at 5% pa 3.35% 3.30%– linked to RPI inflation 3.35% 3.30%– fixed rate in line with scheme rules in line with scheme rulesRate of (non-guaranteed minimum pension) increases in deferment 2.20% 2.30%Cash commutation – Deferreds 20% 20%Scheme member valuation date 31 March 2015 31 March 2015
The discount rate and inflation rate assumptions for 2017 and 2016 have been set with reference to yield curves. The single rates disclosed above represent the weighted average equivalent rate based on the yield curve used.
Mortality rate assumptions are based on the same mortality tables as disclosed within the LV Scheme, but using Ockham specific individual base tables.
Future life expectancy assumptions (in years) as at 31 December 2017 2016
Pensioner (currently aged 65) 23.5 23.7– Male 24.5 24.9– FemaleNon-pensioner (at age 65, currently aged 45)– Male 24.6 24.9– Female 26.2 26.7
e) Sensitivity analysis: Impact on defined benefit obligation of making changes to key assumptions
Change in assumption Impact on defined benefit obligation
Discount rate Decrease by 0.5% Increase by £13m (9%)RPI rate Decrease by 0.5% Decrease by £7m (5%)Life expectancy Increase by 1 year Increase by £6m (4%)
The sensitivity analysis has been calculated by valuing the defined benefit obligation using the amended assumptions shown in the table above and keeping the remaining assumptions the same as disclosed in the principal assumptions table for the scheme, except in the case of the inflation sensitivity where other assumptions that depend on assumed inflation have also been amended correspondingly.
38. Pension benefit asset (continued)f) Plan asset informationPlan assets are comprised as follows:
2017 2016Quoted Unquoted Total
% Quoted Unquoted Total
%£m £m £m £m £m £m
Equities and unit trusts 71 – 71 43 68 – 68 42 Debt securities 91 – 91 56 90 – 90 55 Derivative swaps – 2 2 1 – 2 2 1 Cash and cash equivalents – – – – 3 – 3 2
162 2 164 100 161 2 163 100
In determining and reviewing the Scheme’s investment strategy, the Trustee adopts an objectives based approach. This translates the principal goal of paying member benefits into measurable funding objectives and risk constraints, agreed by the Trustee. These objectives are reviewed and monitored by the Trustee on a regular basis.
The Trustee’s primary funding objective is to reach full funding on the Technical Provisions basis, with a long-term target of moving towards being fully funded on a Gilts +0.50% liability valuation basis by 2034 if possible. In setting the investment strategy, the Trustee aims to:
l Target an expected return on assets close to that required to meet the funding objective;l Manage the investment risk including that arising due to mismatch between assets and liabilities and limit the total risk on the
Scheme below the risk budget;l Maintain suitable liquidity of assets such that the Scheme is not forced to buy and sell investments at particular times to pay
member benefits or meet potential collateral calls.
The Society continues to pay the expenses for administering the Scheme. The next formal valuation of the Scheme is due no later than 31 March 2018.
g) Pension scheme risksDetails of the pension scheme risks that the Group is exposed to are disclosed within the LV Scheme.
h) Expected maturity analysis of undiscounted pension benefits:
Less than a year
Between 1-2 years
Between 2-5 years Over 5 years Total
£m £m £m £m £mAt 31 December 2017 7 5 17 203 232
The weighted average duration of the defined benefit obligation is 18 years.
No contributions are expected to be made to the Ockham pension scheme for the year ending 31 December 2018.
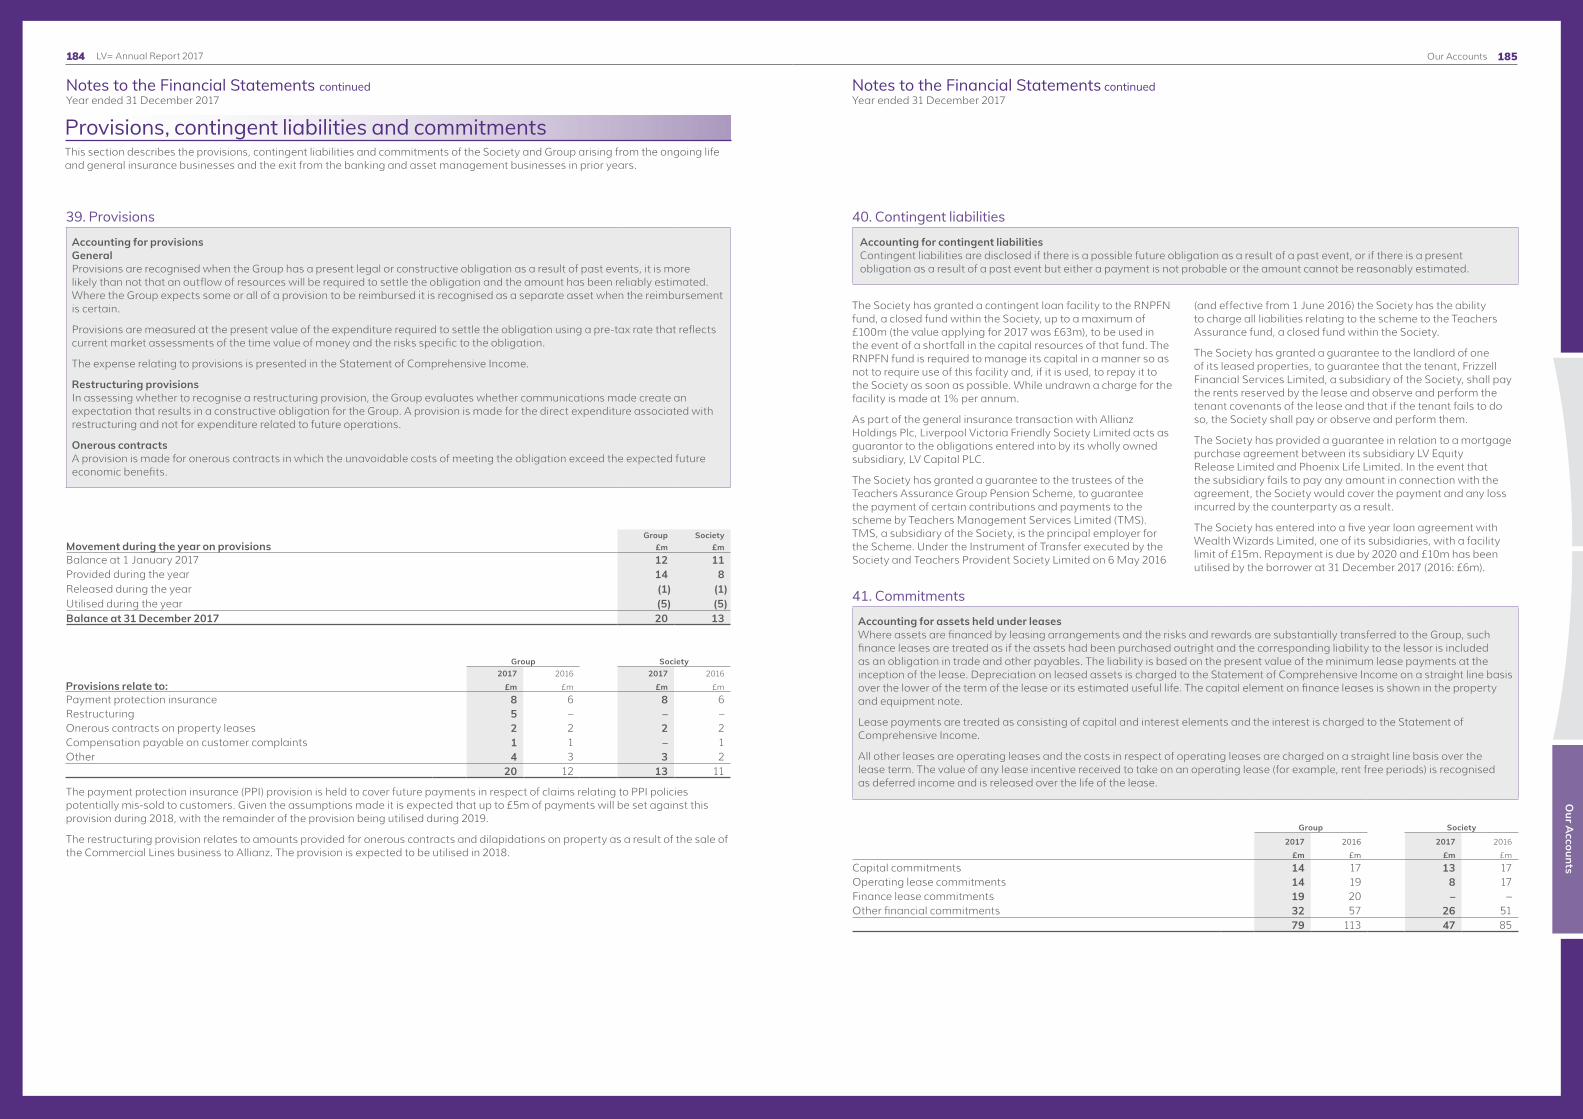
185
Notes to the Financial Statements continuedYear ended 31 December 2017
Notes to the Financial Statements continuedYear ended 31 December 2017
Our A
ccounts
LV= Annual Report 2017 Our Accounts184
Provisions, contingent liabilities and commitmentsThis section describes the provisions, contingent liabilities and commitments of the Society and Group arising from the ongoing life and general insurance businesses and the exit from the banking and asset management businesses in prior years.
39. Provisions
Accounting for provisionsGeneralProvisions are recognised when the Group has a present legal or constructive obligation as a result of past events, it is more likely than not that an outflow of resources will be required to settle the obligation and the amount has been reliably estimated. Where the Group expects some or all of a provision to be reimbursed it is recognised as a separate asset when the reimbursement is certain.
Provisions are measured at the present value of the expenditure required to settle the obligation using a pre-tax rate that reflects current market assessments of the time value of money and the risks specific to the obligation.
The expense relating to provisions is presented in the Statement of Comprehensive Income.
Restructuring provisionsIn assessing whether to recognise a restructuring provision, the Group evaluates whether communications made create an expectation that results in a constructive obligation for the Group. A provision is made for the direct expenditure associated with restructuring and not for expenditure related to future operations.
Onerous contractsA provision is made for onerous contracts in which the unavoidable costs of meeting the obligation exceed the expected future economic benefits.
Movement during the year on provisionsGroup Society
£m £mBalance at 1 January 2017 12 11Provided during the year 14 8Released during the year (1) (1)Utilised during the year (5) (5)Balance at 31 December 2017 20 13
Group Society
Provisions relate to:2017 2016 2017 2016
£m £m £m £m
Payment protection insurance 8 6 8 6Restructuring 5 – – –Onerous contracts on property leases 2 2 2 2Compensation payable on customer complaints 1 1 – 1Other 4 3 3 2
20 12 13 11
The payment protection insurance (PPI) provision is held to cover future payments in respect of claims relating to PPI policies potentially mis-sold to customers. Given the assumptions made it is expected that up to £5m of payments will be set against this provision during 2018, with the remainder of the provision being utilised during 2019.
The restructuring provision relates to amounts provided for onerous contracts and dilapidations on property as a result of the sale of the Commercial Lines business to Allianz. The provision is expected to be utilised in 2018.
40. Contingent liabilities
Accounting for contingent liabilitiesContingent liabilities are disclosed if there is a possible future obligation as a result of a past event, or if there is a present obligation as a result of a past event but either a payment is not probable or the amount cannot be reasonably estimated.
The Society has granted a contingent loan facility to the RNPFN fund, a closed fund within the Society, up to a maximum of £100m (the value applying for 2017 was £63m), to be used in the event of a shortfall in the capital resources of that fund. The RNPFN fund is required to manage its capital in a manner so as not to require use of this facility and, if it is used, to repay it to the Society as soon as possible. While undrawn a charge for the facility is made at 1% per annum.
As part of the general insurance transaction with Allianz Holdings Plc, Liverpool Victoria Friendly Society Limited acts as guarantor to the obligations entered into by its wholly owned subsidiary, LV Capital PLC.
The Society has granted a guarantee to the trustees of the Teachers Assurance Group Pension Scheme, to guarantee the payment of certain contributions and payments to the scheme by Teachers Management Services Limited (TMS). TMS, a subsidiary of the Society, is the principal employer for the Scheme. Under the Instrument of Transfer executed by the Society and Teachers Provident Society Limited on 6 May 2016
(and effective from 1 June 2016) the Society has the ability to charge all liabilities relating to the scheme to the Teachers Assurance fund, a closed fund within the Society.
The Society has granted a guarantee to the landlord of one of its leased properties, to guarantee that the tenant, Frizzell Financial Services Limited, a subsidiary of the Society, shall pay the rents reserved by the lease and observe and perform the tenant covenants of the lease and that if the tenant fails to do so, the Society shall pay or observe and perform them.
The Society has provided a guarantee in relation to a mortgage purchase agreement between its subsidiary LV Equity Release Limited and Phoenix Life Limited. In the event that the subsidiary fails to pay any amount in connection with the agreement, the Society would cover the payment and any loss incurred by the counterparty as a result.
The Society has entered into a five year loan agreement with Wealth Wizards Limited, one of its subsidiaries, with a facility limit of £15m. Repayment is due by 2020 and £10m has been utilised by the borrower at 31 December 2017 (2016: £6m).
41. Commitments
Accounting for assets held under leasesWhere assets are financed by leasing arrangements and the risks and rewards are substantially transferred to the Group, such finance leases are treated as if the assets had been purchased outright and the corresponding liability to the lessor is included as an obligation in trade and other payables. The liability is based on the present value of the minimum lease payments at the inception of the lease. Depreciation on leased assets is charged to the Statement of Comprehensive Income on a straight line basis over the lower of the term of the lease or its estimated useful life. The capital element on finance leases is shown in the property and equipment note.
Lease payments are treated as consisting of capital and interest elements and the interest is charged to the Statement of Comprehensive Income.
All other leases are operating leases and the costs in respect of operating leases are charged on a straight line basis over the lease term. The value of any lease incentive received to take on an operating lease (for example, rent free periods) is recognised as deferred income and is released over the life of the lease.
Group Society
2017 2016 2017 2016
£m £m £m £m
Capital commitments 14 17 13 17Operating lease commitments 14 19 8 17Finance lease commitments 19 20 – –Other financial commitments 32 57 26 51
79 113 47 85

187
Notes to the Financial Statements continuedYear ended 31 December 2017
Notes to the Financial Statements continuedYear ended 31 December 2017
Our A
ccounts
LV= Annual Report 2017 Our Accounts186
41. Commitments (continued) Capital commitmentsCapital commitments relate to authorised and contracted commitments payable but not provided for regarding financial investment and property and equipment.
Operating lease commitmentsThe Group leases various properties under non-cancellable operating lease agreements. The leases have varying terms, escalation clauses and renewal rights.
Finance lease commitmentsFinance lease commitments relate to a property with a remaining lease term of 23 years. The lease is on a fixed repayment basis and no arrangements have been entered into for contingent payments. The Group’s obligations under finance leases are secured by the lessors’ charges over the leased assets.
Group
2017 2016Gross
liabilityFinance charge
Present value
Gross liability
Finance charge
Present value
£m £m £m £m £m £m
Minimum lease paymentsWithin one year 1 – 1 1 – 1Between one and five years 5 (3) 2 5 (3) 2Over five years 22 (6) 16 23 (6) 17
28 (9) 19 29 (9) 20
Other financial commitmentsThe Group has entered into several long-term contracts following service outsourcing which will end no later than 2021. These contracted commitments have not been provided for in the financial statements.
Scope of consolidationThis section presents information on the Group’s investments in subsidiaries, joint ventures, associates and structured entities. Detail is also given of the Unallocated divisible surplus of the Society and Group.
42. Subsidiary undertakingsAll subsidiary undertakings are included in the consolidation. The proportion of the voting rights in the subsidiary undertakings held directly by the parent company do not differ from the proportion of ordinary shares held. The Group and all principal undertakings are incorporated and domiciled in England and Wales. All holdings are in relation to ordinary shares. The registered office is County Gates, Bournemouth BH1 2NF.
Name
Percentage held by non-
controlling interestsPrincipal activity
Percentage held by Group
Subsidiaries directly owned by the SocietyFrizzell Financial Services Limited (Note 1) Property management 100% 0%LV Life Services Limited (Note 1) Management services 100% 0%LV Commercial Mortgages Limited (Note 1) Commercial mortgages 100% 0%NM Pensions Trustees Limited (Note 1) Self-invested personal pension (SIPP) administrator 100% 0%Liverpool Victoria Financial Advice Services Limited (Note 1) Financial advice services 100% 0%Liverpool Victoria Life Company Limited Life insurance 100% 0%LV Protection Limited Insurance 100% 0%LV Capital PLC (Note 1) Holding company 100% 0%LV Equity Release Limited (Note 1) Origination of equity release lifetime mortgages 100% 0%Teachers Property Limited (Note 1) Property services 100% 0%Teachers Financial Services Limited (Note 1) Insurance and financial intermediary 100% 0%Teachers Assurance Company Limited General insurance 100% 0%Teachers Management Services Limited (Note 1) Management services 100% 0%Sovereign Unit Trust Managers Limited Portfolio manager 100% 0%Liverpool Victoria Banking Services Limited (Note 2) Dormant 100% 0%Ayresbrook Limited (Note 2) Dormant 100% 0%Liverpool Victoria Asset Management Limited (Note 2) Dormant 100% 0%Highway Corporate Capital Limited (Note 2) Dormant 100% 0%Ockham Corporate Limited (Note 2) Dormant 100% 0%NLC Name No. 1 Limited (Note 2) Dormant 100% 0%NLC Name No. 2 Limited (Note 2) Dormant 100% 0%NLC Name No. 3 Limited (Note 2) Dormant 100% 0%NLC Name No. 4 Limited (Note 2) Dormant 100% 0%NLC Name No. 5 Limited (Note 2) Dormant 100% 0%NLC Name No. 7 Limited (Note 2) Dormant 100% 0%The LV= Pension Trustee Limited (Note 2) Dormant trustee company Note 3The LV= General Trustee Limited (Note 2) Dormant trustee company Note 3The Ockham Pension Trustee Limited (Note 2) Dormant trustee company Note 3Liverpool Victoria Trustees Limited (Note 2) Dormant trustee company Note 3
Wealth Wizards Limited Group of Companies 70% 30%Wealth Wizards Limited IT softwareWealth Wizards Benefits Limited * (Note 1) Financial intermediaryWealth Wizards Advisers Limited * (Note 1) Financial intermediaryOpal IFA Limited * (Note 2) Dormant
Liverpool Victoria General Insurance Group of Companies 51% 49%Liverpool Victoria General Insurance Group Limited * General insurance holding companyLiverpool Victoria Insurance Company Limited * General insuranceHighway Insurance Company Limited * General insuranceLV Repair Services Limited * (Note 1) Repair servicesLV Assistance Services Limited * (Note 1) Road Rescue - Pay on useLV Insurance Management Limited * Management servicesHighway Insurance Group Limited * General insurance holding companyHighway Group Services Limited * (Note 2) Dormant
* Owned by a subsidiary undertaking of the Society
Note 1 – The financial statements of these subsidiary undertakings have not been audited for the year ended 31 December 2017. These subsidiary undertakings are exempt from the requirements of the Companies Act 2006 relating to the audit of individual financial statements by virtue of Section 479A of the Companies Act 2006. Note 2 – The financial statements of these dormant companies have not been audited for the year ended 31 December 2017. These companies were entitled to exemption from audit under section 480 of the Companies Act 2006 relating to dormant companies. Note 3 – These companies are limited by Guarantee and have no issued share capital.

189
Notes to the Financial Statements continuedYear ended 31 December 2017
Notes to the Financial Statements continuedYear ended 31 December 2017
Our A
ccounts
LV= Annual Report 2017 Our Accounts188
42. Subsidiary undertakings (continued)All the principal subsidiaries have the same year end as the Society and all have been included in the consolidation.
Non-controlling interestFurther details on the non-controlling interests in Liverpool Victoria General Insurance Group Limited and Wealth Wizards Limited are disclosed in Note 48.
Significant restrictionsFollowing the completion of the sale of a 49% stake in Liverpool Victoria General Insurance Group Limited to Allianz Holdings plc there are restrictions associated with this subsidiary and the subsidiaries it directly owns. The general insurance assets and liabilities identified in the Segmental analysis in note 2c) are ring-fenced and distributions from these subsidiaries can only be made in accordance with the dividend policy contractually agreed with Allianz as part of the sale. Allianz has a protective veto right over any dividends paid outside of policy.
Whilst the Society retains control over the LVGIG group, the shareholders agreement includes protective veto rights for the minority investor that restricts the Society’s ability to make changes to the capital structure, initiate insolvency proceedings, make a further sale of the business or enter into a merger or acquisition.
43. Associates and joint venturesThe associates and joint ventures of the Society at 31 December 2017 are shown below. They are incorporated and domiciled in England and Wales.
Name Class of shares Year end Principal activity Percentage heldJoint ventures Great Victoria Partnership * 31/03/2017 Investment property 50.0%
* The percentage held represents the share of the partnership capital and partner loans held by the Society as at 31 December 2017.
The Group holds 50% of the voting rights of its joint arrangement. The Group has joint control over this arrangement as, under the contractual agreement, unanimous consent is required from all parties to the agreement for all relevant activities.
The Group’s joint arrangement is structured as a partnership and provides the Group and the other parties to the agreement with rights to the net assets of the partnership. Therefore, this arrangement is classified as a joint venture.
Commitments and contingent liabilities in respect of joint venturesThere are no commitments or contingent liabilities relating to the Group’s interest in the joint venture.
Summarised financial information for joint venturesIn accordance with the provisions of IFRS 12 which states that an entity may present the summarised financial information on the basis of the joint venture’s or associate’s financial statements if:
l the entity measures its interest in the joint venture or associate at fair value in accordance with IAS 28; andl the joint venture or associate does not prepare IFRS financial statements and preparation on that basis would be impracticable
or cause undue cost.
The summarised financial information set out below is presented on the basis of the Great Victoria Partnership’s financial statements for the year ended 31 March 2017.
Within the Group accounts this holding is accounted for as an investment at fair value in accordance with the exemptions permitted under IAS28 applicable to investment-linked insurance funds.
Summarised Statement of Financial Position
31 March 2017
31 March 2016
£m £mAssetsNon-current– Investment properties 229 294Current– Other assets 15 15
244 309 LiabilitiesNon-current– Financial liabilities (79) (79)Current– Other liabilities (5) (5)
(84) (84)Net assets 160 225
Partners' capital 6 49Retained earnings 154 176Total partners’ funds 160 225

191
Notes to the Financial Statements continuedYear ended 31 December 2017
Notes to the Financial Statements continuedYear ended 31 December 2017
Our A
ccounts
LV= Annual Report 2017 Our Accounts190
43. Associates and joint ventures (continued)
Summarised Statement of Comprehensive Income
31 March 2017
31 March 2016
£m £m
Net rental income 12 11Revaluation (deficit)/surplus on investment properties (13) 23Loss on sale of investment properties (9) –Operating (loss)/profit (10) 34Finance costs (3) (3)(Loss)/profit for the year (13) 31
44. Consolidated structured entities: Open ended investment companies
A structured entity is an entity that has been designed such that voting or similar rights are not the dominant factor in deciding who controls the entity, such as when voting rights relate to administrative tasks only, and the relevant activities are directed by means of contractual arrangements.
The Open Ended Investment Companies (OEICs) have been identified as structured entities. The shares held by the Group in the OEICs do have voting rights attached, however the Group does not have presence on the board of the OEICs. The Authorised Corporate Director (ACD) is Threadneedle Investment Services Limited. The Group’s interest in the OEICs is bound by the OEIC prospectus and contractual arrangements.
Significant accounting judgementConsolidation of Open Ended Investment CompaniesOEICs are structured entities as the relevant activities are directed by contractual arrangements rather than by voting rights. Management have applied judgement in determining whether the Group has control over an OEIC.
Where the Group is the dominant investor in an OEIC, the portfolio of funds that the OEIC invests in is directly influenced by the types of funds that the Group chooses to invest in. The Group is exposed to variable returns arising from the investments held in an OEIC and as a result of its dominant investor position has the ability to affect the variable returns from the OEIC. All OEICs are incorporated and domiciled in England and Wales and are included within the Group consolidation.
Year end 2017 reporting During the year the Group divested its stake in the Threadneedle Investment Funds II ICVC which was reinvested in larger OEIC funds where the Group is no longer the dominant investor. These new OEIC investments have not been consolidated within the Group and have been disclosed as part of the unconsolidated structured entities within Note 45.
Non-controlling interestThe total Group non-controlling interest for the year is £nil (2016: £28m), of which £nil (2016: £28m) is for Threadneedle Investment Funds II ICVC. The summarised Statement of Financial Position on the following page gives additional disclosures on the non-controlling interests.
Significant restrictionsThere are no significant restrictions in place regarding any of the OEICs above.
Summarised financial information on OEIC subsidiaries with material non-controlling interestsSet out below is the summarised financial information for each OEIC subsidiary that has a non-controlling interest that is material to the Group which includes Threadneedle Investment Funds II ICVC (2016 only).
Summarised financial information is presented in order to enable users to understand the interest that non-controlling interests have in the Group’s activities and cash flows. The relevant financial information presented for the OEICs is a Statement of Financial Position and the line item within the Statement of Comprehensive Income that is impacted by the performance of the OEICs in the year. An analysis of the Cash and cash equivalents balance is presented; cash flow movements in the year primarily arise from investing activities.
44. Consolidated structured entities: Open ended investment companies (continued)
Summarised Statement of Financial Position2017 2016
£m £m
AssetsFinancial assets at Fair value through income – 861Loans and other receivables – 3Cash and cash equivalents – 10Total assets – 874 Liabilities Trade and other payables – (2)Total liabilities – (2)Net assets – 872
Cash and cash equivalents comprise2017 2016
£m £m
Bank balances – 10Cash and cash equivalents – 10
Summarised Statement of Comprehensive Income2017 2016
£m £m
Net gains on investments – 64
Movements on net assets in 2016 comprised Net gains on investments of £64m, plus reserve movements related to funds repaid/received for the cancellation/issue of units.
45. Investments in unconsolidated structured entitiesThe Group has interests in structured entities which are not consolidated as the definition of control has not been met based on the proportion of the investment of the structured entity held by the Group. As at 31 December 2017 the Group’s interest in unconsolidated structured entities, which are classified as investments held at fair value through profit or loss, are shown below:
Investment2017
£m2016
£m
Open Ended Investment Companies 5,430 4,139Unit trusts 343 293Liquidity funds 1,017 438
6,790 4,870
Included within the above are £2,995m (2016: £2,468m) of investments held to cover linked liabilities, other than these, the Group’s exposure to financial loss from the interest in the unconsolidated structured entities is limited to the investment amount shown above. The Group is not required to provide financial support to the entities, nor does it sponsor the entities.
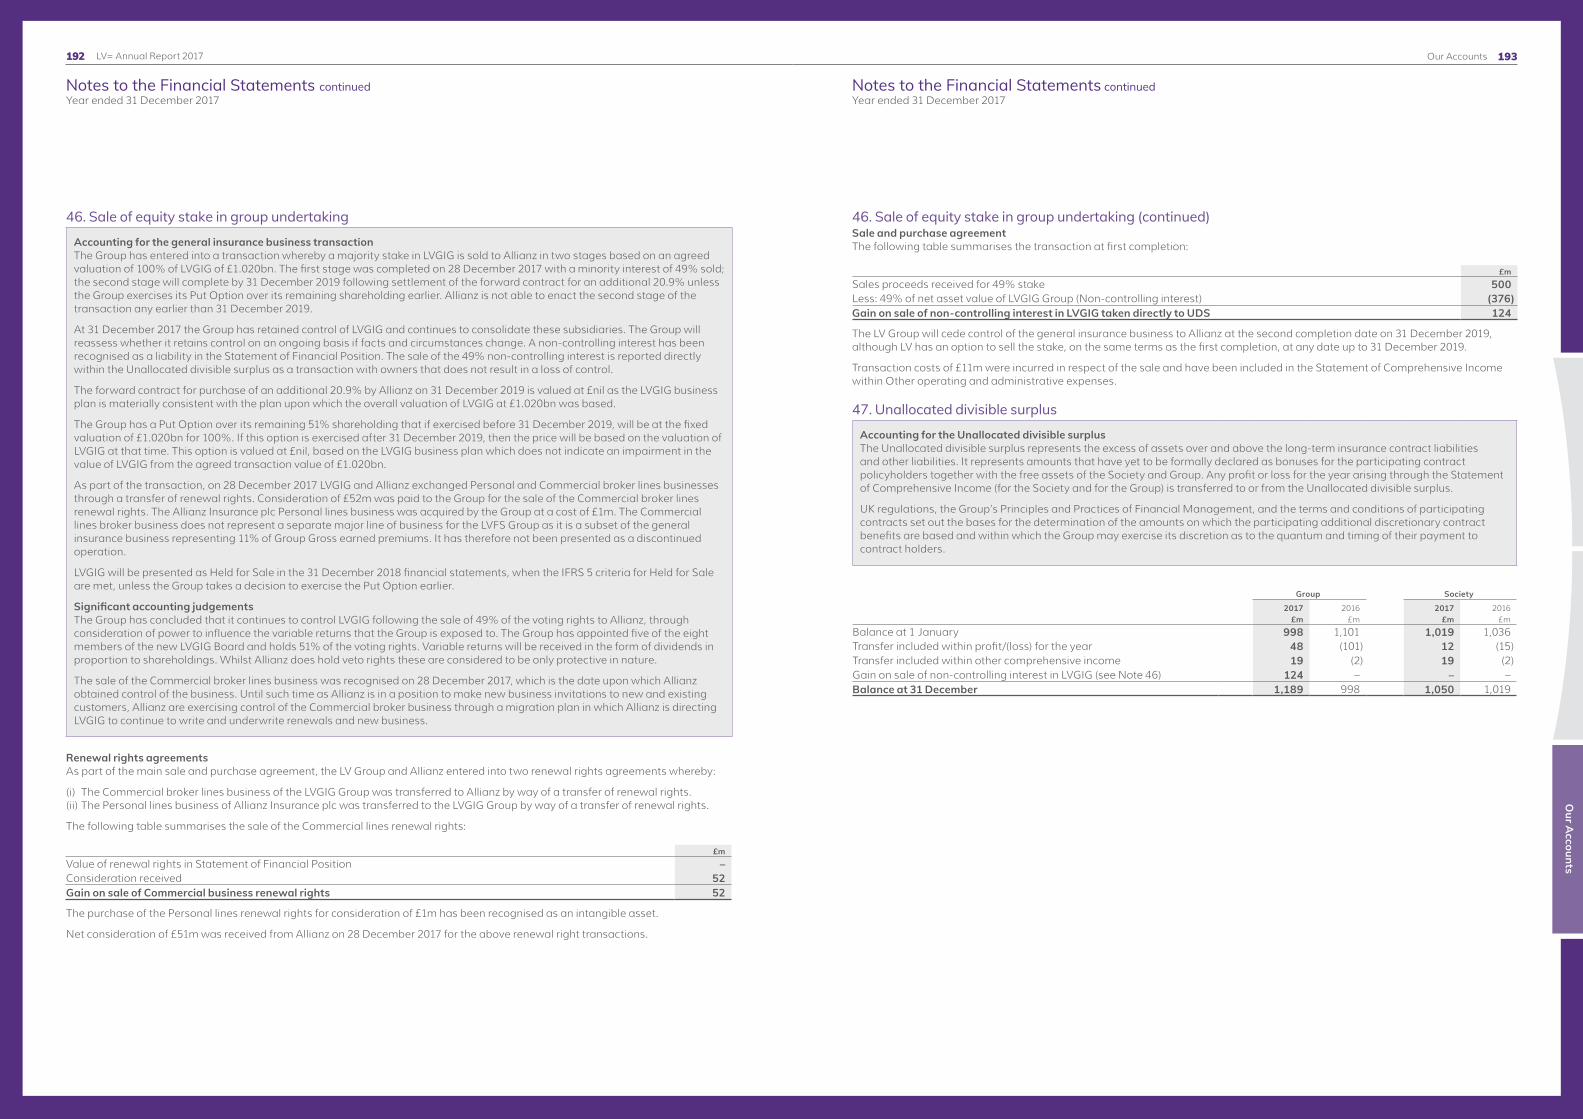
193
Notes to the Financial Statements continuedYear ended 31 December 2017
Notes to the Financial Statements continuedYear ended 31 December 2017
Our A
ccounts
LV= Annual Report 2017 Our Accounts192
46. Sale of equity stake in group undertaking
Accounting for the general insurance business transactionThe Group has entered into a transaction whereby a majority stake in LVGIG is sold to Allianz in two stages based on an agreed valuation of 100% of LVGIG of £1.020bn. The first stage was completed on 28 December 2017 with a minority interest of 49% sold; the second stage will complete by 31 December 2019 following settlement of the forward contract for an additional 20.9% unless the Group exercises its Put Option over its remaining shareholding earlier. Allianz is not able to enact the second stage of the transaction any earlier than 31 December 2019.
At 31 December 2017 the Group has retained control of LVGIG and continues to consolidate these subsidiaries. The Group will reassess whether it retains control on an ongoing basis if facts and circumstances change. A non-controlling interest has been recognised as a liability in the Statement of Financial Position. The sale of the 49% non-controlling interest is reported directly within the Unallocated divisible surplus as a transaction with owners that does not result in a loss of control.
The forward contract for purchase of an additional 20.9% by Allianz on 31 December 2019 is valued at £nil as the LVGIG business plan is materially consistent with the plan upon which the overall valuation of LVGIG at £1.020bn was based.
The Group has a Put Option over its remaining 51% shareholding that if exercised before 31 December 2019, will be at the fixed valuation of £1.020bn for 100%. If this option is exercised after 31 December 2019, then the price will be based on the valuation of LVGIG at that time. This option is valued at £nil, based on the LVGIG business plan which does not indicate an impairment in the value of LVGIG from the agreed transaction value of £1.020bn.
As part of the transaction, on 28 December 2017 LVGIG and Allianz exchanged Personal and Commercial broker lines businesses through a transfer of renewal rights. Consideration of £52m was paid to the Group for the sale of the Commercial broker lines renewal rights. The Allianz Insurance plc Personal lines business was acquired by the Group at a cost of £1m. The Commercial lines broker business does not represent a separate major line of business for the LVFS Group as it is a subset of the general insurance business representing 11% of Group Gross earned premiums. It has therefore not been presented as a discontinued operation.
LVGIG will be presented as Held for Sale in the 31 December 2018 financial statements, when the IFRS 5 criteria for Held for Sale are met, unless the Group takes a decision to exercise the Put Option earlier.
Significant accounting judgementsThe Group has concluded that it continues to control LVGIG following the sale of 49% of the voting rights to Allianz, through consideration of power to influence the variable returns that the Group is exposed to. The Group has appointed five of the eight members of the new LVGIG Board and holds 51% of the voting rights. Variable returns will be received in the form of dividends in proportion to shareholdings. Whilst Allianz does hold veto rights these are considered to be only protective in nature.
The sale of the Commercial broker lines business was recognised on 28 December 2017, which is the date upon which Allianz obtained control of the business. Until such time as Allianz is in a position to make new business invitations to new and existing customers, Allianz are exercising control of the Commercial broker business through a migration plan in which Allianz is directing LVGIG to continue to write and underwrite renewals and new business.
Renewal rights agreementsAs part of the main sale and purchase agreement, the LV Group and Allianz entered into two renewal rights agreements whereby:
(i) The Commercial broker lines business of the LVGIG Group was transferred to Allianz by way of a transfer of renewal rights.(ii) The Personal lines business of Allianz Insurance plc was transferred to the LVGIG Group by way of a transfer of renewal rights.
The following table summarises the sale of the Commercial lines renewal rights:
£mValue of renewal rights in Statement of Financial Position –Consideration received 52Gain on sale of Commercial business renewal rights 52
The purchase of the Personal lines renewal rights for consideration of £1m has been recognised as an intangible asset.
Net consideration of £51m was received from Allianz on 28 December 2017 for the above renewal right transactions.
46. Sale of equity stake in group undertaking (continued) Sale and purchase agreementThe following table summarises the transaction at first completion:
£mSales proceeds received for 49% stake 500Less: 49% of net asset value of LVGIG Group (Non-controlling interest) (376)Gain on sale of non-controlling interest in LVGIG taken directly to UDS 124
The LV Group will cede control of the general insurance business to Allianz at the second completion date on 31 December 2019, although LV has an option to sell the stake, on the same terms as the first completion, at any date up to 31 December 2019.
Transaction costs of £11m were incurred in respect of the sale and have been included in the Statement of Comprehensive Income within Other operating and administrative expenses.
47. Unallocated divisible surplus
Accounting for the Unallocated divisible surplusThe Unallocated divisible surplus represents the excess of assets over and above the long-term insurance contract liabilities and other liabilities. It represents amounts that have yet to be formally declared as bonuses for the participating contract policyholders together with the free assets of the Society and Group. Any profit or loss for the year arising through the Statement of Comprehensive Income (for the Society and for the Group) is transferred to or from the Unallocated divisible surplus.
UK regulations, the Group’s Principles and Practices of Financial Management, and the terms and conditions of participating contracts set out the bases for the determination of the amounts on which the participating additional discretionary contract benefits are based and within which the Group may exercise its discretion as to the quantum and timing of their payment to contract holders.
Group Society
2017 2016 2017 2016£m £m £m £m
Balance at 1 January 998 1,101 1,019 1,036Transfer included within profit/(loss) for the year 48 (101) 12 (15)Transfer included within other comprehensive income 19 (2) 19 (2)Gain on sale of non-controlling interest in LVGIG (see Note 46) 124 – – –Balance at 31 December 1,189 998 1,050 1,019

195
Notes to the Financial Statements continuedYear ended 31 December 2017
Notes to the Financial Statements continuedYear ended 31 December 2017
Our A
ccounts
LV= Annual Report 2017 Our Accounts194
48. Non-controlling interestThe table below details the non-controlling interests held in subsidiaries of the Group as at 31 December:
2017 2016£m £m
Liverpool Victoria General Insurance Group Limited 376 –Wealth Wizards Limited (3) (1)
373 (1)
Summarised financial information on subsidiaries with material non-controlling interestsSummarised financial information is presented in order to enable users to understand the interest that non-controlling interests have in the Group’s activities and cash flows.
Set out below is the summarised financial information for each subsidiary that has a non-controlling interest that is material to the Group. For 2017 this includes the Liverpool Victoria General Insurance Group of companies (LVGIG Group). The Wealth Wizards Group of companies are not material to the Group.
2017£m
AssetsIntangible assets 264Property and equipment 6Financial assets at fair value through income 1,437Deferred acquisition costs 95Reinsurance assets 558Insurance receivables 279Other assets 269Cash and cash equivalents 540Total assets 3,448
LiabilitiesInsurance contract liabilities 2,427Subordinated liabilities 11Other liabilities 242Total liabilities 2,680
Equity 768
Total equity and liabilities 3,448
The relevant financial information presented for the LVGIG Group is a summary Consolidated Statement of Financial Position for 31 December 2017 only. Details of the Statement of Comprehensive Income and Cash Flow Statement for 2017 have not been presented as the Non-controlling interest only took effect at the end of December 2017 – see Note 46. No dividends were paid to the Non-controlling interests during the year.
Other disclosuresThis section details other disclosure matters, comprising: related party transactions, directors’ emoluments, with-profits actuary details and other relevant Society information.
49. Related party transactionsa) Key management compensationKey management personnel of the Group comprise all executive and non-executive directors and senior management. The summary of the compensation of key management personnel for the year is as follows:
Group2017 2016£000 £000
Short-term employment benefits 5,815 6,016Other long-term benefits 2,606 2,999Post-employment benefits 44 103Termination benefits 1,202 1,348Total compensation of key management personnel 9,667 10,466
The aggregate premiums payable for the year by the Group Executive and Non-Executive Directors in respect of the Group’s products was £20,502 (2016: £40,978).
b) Transactions between the Society and other Group companies
2017 2016£m £m
Management charge by the Society (see note 11) 215 227Beneficial interest of subsidiary in loans sold to the Society 219 307Investment expenses charge to the Society (3) (5)Interest income from group undertakings 18 24Dividend income from group undertakings 94 44
The Society performs administration and investment management activities for the entire Group. Subsidiary companies are charged fees for these services.
Balances outstanding between the Society and other Group companies:
2017 2016£m £m
Payable by the Society (21) (11)Receivable by the Society 25 103Loans owed to the Society 10 306
c) Loans to related partiesLoans owed to the Society represents a five year loan agreement with Wealth Wizards Limited with a facility limit of £15m (see Note 40 for further details), at 31 December 2017 £10m of this loan had been drawn down (2016: £6m).
On 30 September 2017 the Society purchased £326,053,921 ordinary £1 shares in LV Capital PLC, in exchange for the cancellation of the £300m loan notes and the repayment of outstanding interest.
d) Other related party disclosureThe Society has granted a contingent loan facility to the RNPFN fund, a closed fund within the Group and a guarantee to the Trustees of the Teachers Assurance Group Pension Scheme. Further details of these are disclosed in Note 40.
50. With-Profits ActuaryThe following information has been provided in accordance with section 77 of the Friendly Societies Act 1992.
a) The With-Profits Actuary of the Society throughout 2017 was Mr A Walton, who is employed by Liverpool Victoria Friendly Society Limited.
b) The total emoluments of Mr Walton during the year were £297,159 (2016: £227,249) including pension contributions, car allowance, LTIPs and other benefits. Mr Walton is a participant in the Society’s long-term incentive plan and held one insurance policy issued by a subsidiary of the Society.
c) Mr Walton did not receive, nor will receive, any other pecuniary benefit.
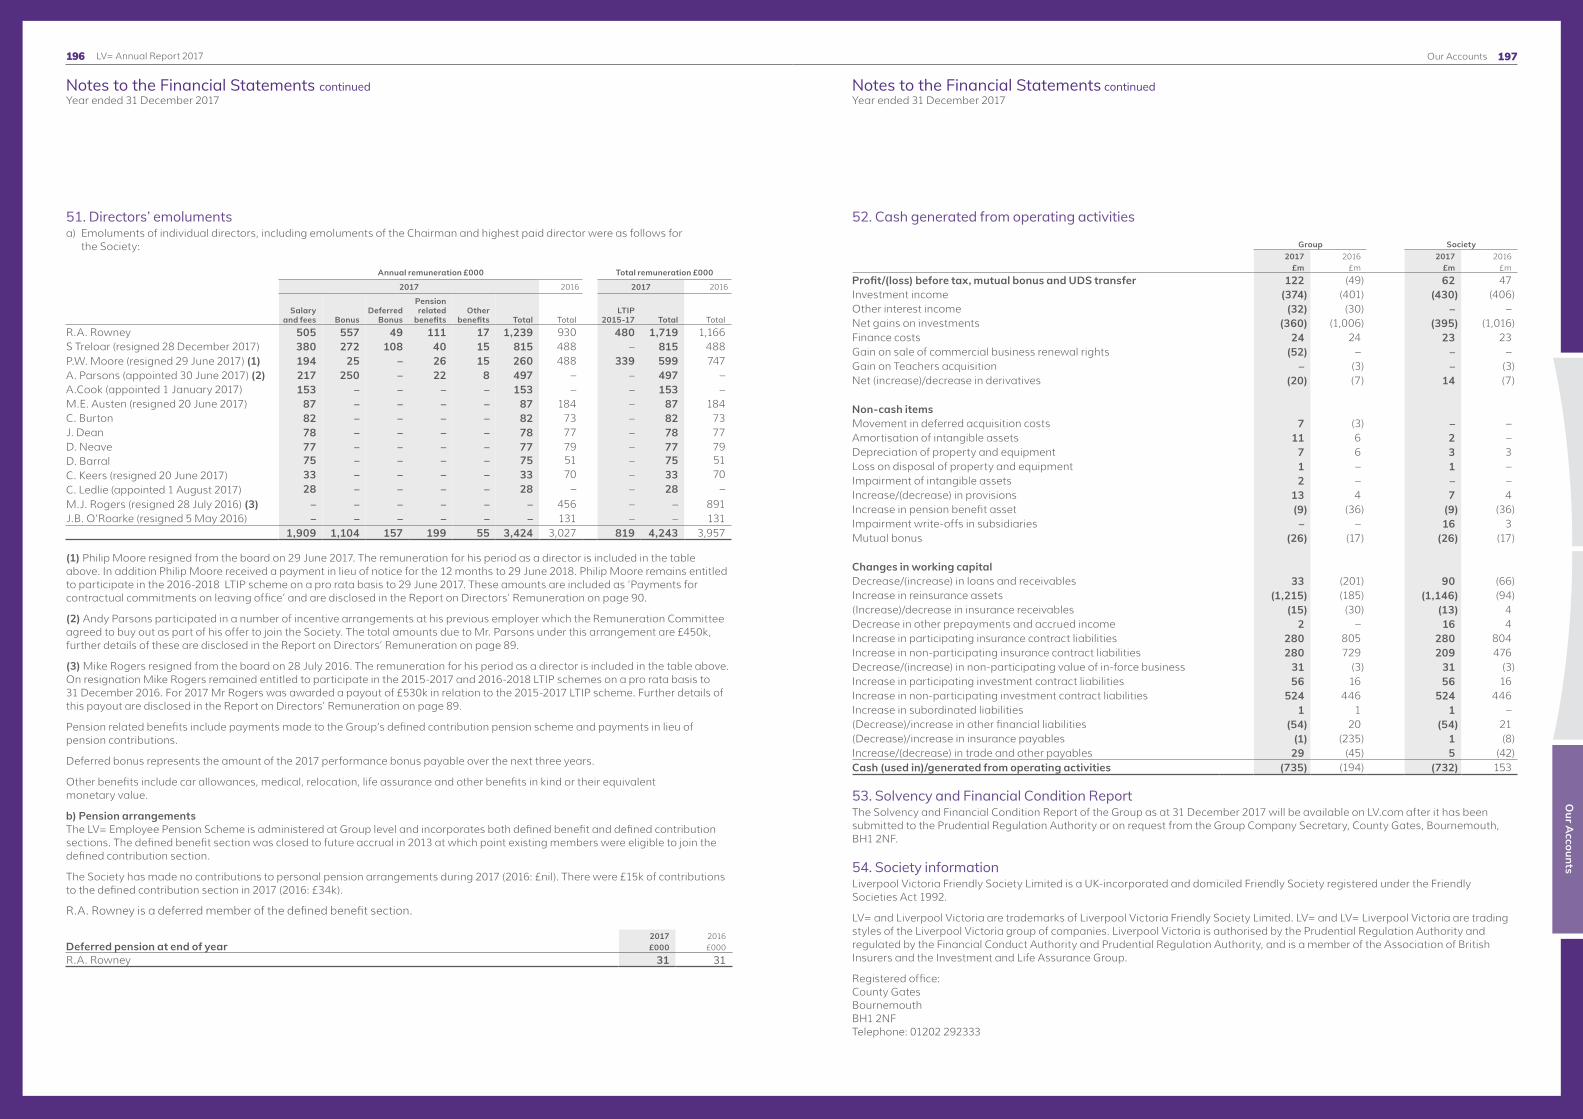
197
Notes to the Financial Statements continuedYear ended 31 December 2017
Notes to the Financial Statements continuedYear ended 31 December 2017
Our A
ccounts
LV= Annual Report 2017 Our Accounts196
51. Directors’ emolumentsa) Emoluments of individual directors, including emoluments of the Chairman and highest paid director were as follows for
the Society:
Annual remuneration £000 Total remuneration £000
2017 2016 2017 2016
Salary and fees Bonus
Deferred Bonus
Pension related
benefitsOther
benefits Total TotalLTIP
2015-17 Total TotalR.A. Rowney 505 557 49 111 17 1,239 930 480 1,719 1,166S Treloar (resigned 28 December 2017) 380 272 108 40 15 815 488 – 815 488P.W. Moore (resigned 29 June 2017) (1) 194 25 – 26 15 260 488 339 599 747A. Parsons (appointed 30 June 2017) (2) 217 250 – 22 8 497 – – 497 –A.Cook (appointed 1 January 2017) 153 – – – – 153 – – 153 –M.E. Austen (resigned 20 June 2017) 87 – – – – 87 184 – 87 184C. Burton 82 – – – – 82 73 – 82 73J. Dean 78 – – – – 78 77 – 78 77D. Neave 77 – – – – 77 79 – 77 79D. Barral 75 – – – – 75 51 – 75 51C. Keers (resigned 20 June 2017) 33 – – – – 33 70 – 33 70C. Ledlie (appointed 1 August 2017) 28 – – – – 28 – – 28 –M.J. Rogers (resigned 28 July 2016) (3) – – – – – – 456 – – 891J.B. O'Roarke (resigned 5 May 2016) – – – – – – 131 – – 131
1,909 1,104 157 199 55 3,424 3,027 819 4,243 3,957
(1) Philip Moore resigned from the board on 29 June 2017. The remuneration for his period as a director is included in the table above. In addition Philip Moore received a payment in lieu of notice for the 12 months to 29 June 2018. Philip Moore remains entitled to participate in the 2016-2018 LTIP scheme on a pro rata basis to 29 June 2017. These amounts are included as ‘Payments for contractual commitments on leaving office’ and are disclosed in the Report on Directors’ Remuneration on page 90.
(2) Andy Parsons participated in a number of incentive arrangements at his previous employer which the Remuneration Committee agreed to buy out as part of his offer to join the Society. The total amounts due to Mr. Parsons under this arrangement are £450k, further details of these are disclosed in the Report on Directors’ Remuneration on page 89.
(3) Mike Rogers resigned from the board on 28 July 2016. The remuneration for his period as a director is included in the table above. On resignation Mike Rogers remained entitled to participate in the 2015-2017 and 2016-2018 LTIP schemes on a pro rata basis to 31 December 2016. For 2017 Mr Rogers was awarded a payout of £530k in relation to the 2015-2017 LTIP scheme. Further details of this payout are disclosed in the Report on Directors’ Remuneration on page 89.
Pension related benefits include payments made to the Group’s defined contribution pension scheme and payments in lieu of pension contributions.
Deferred bonus represents the amount of the 2017 performance bonus payable over the next three years.
Other benefits include car allowances, medical, relocation, life assurance and other benefits in kind or their equivalent monetary value.
b) Pension arrangementsThe LV= Employee Pension Scheme is administered at Group level and incorporates both defined benefit and defined contribution sections. The defined benefit section was closed to future accrual in 2013 at which point existing members were eligible to join the defined contribution section.
The Society has made no contributions to personal pension arrangements during 2017 (2016: £nil). There were £15k of contributions to the defined contribution section in 2017 (2016: £34k).
R.A. Rowney is a deferred member of the defined benefit section.
Deferred pension at end of year 2017 2016 £000 £000
R.A. Rowney 31 31
52. Cash generated from operating activities
Group Society2017 2016 2017 2016
£m £m £m £m
Profit/(loss) before tax, mutual bonus and UDS transfer 122 (49) 62 47Investment income (374) (401) (430) (406)Other interest income (32) (30) – –Net gains on investments (360) (1,006) (395) (1,016)Finance costs 24 24 23 23Gain on sale of commercial business renewal rights (52) – – –Gain on Teachers acquisition – (3) – (3)Net (increase)/decrease in derivatives (20) (7) 14 (7) Non-cash itemsMovement in deferred acquisition costs 7 (3) – –Amortisation of intangible assets 11 6 2 –Depreciation of property and equipment 7 6 3 3Loss on disposal of property and equipment 1 – 1 –Impairment of intangible assets 2 – – –Increase/(decrease) in provisions 13 4 7 4Increase in pension benefit asset (9) (36) (9) (36)Impairment write-offs in subsidiaries – – 16 3Mutual bonus (26) (17) (26) (17) Changes in working capitalDecrease/(increase) in loans and receivables 33 (201) 90 (66)Increase in reinsurance assets (1,215) (185) (1,146) (94)(Increase)/decrease in insurance receivables (15) (30) (13) 4Decrease in other prepayments and accrued income 2 – 16 4Increase in participating insurance contract liabilities 280 805 280 804Increase in non-participating insurance contract liabilities 280 729 209 476Decrease/(increase) in non-participating value of in-force business 31 (3) 31 (3)Increase in participating investment contract liabilities 56 16 56 16Increase in non-participating investment contract liabilities 524 446 524 446Increase in subordinated liabilities 1 1 1 –(Decrease)/increase in other financial liabilities (54) 20 (54) 21(Decrease)/increase in insurance payables (1) (235) 1 (8)Increase/(decrease) in trade and other payables 29 (45) 5 (42)Cash (used in)/generated from operating activities (735) (194) (732) 153
53. Solvency and Financial Condition ReportThe Solvency and Financial Condition Report of the Group as at 31 December 2017 will be available on LV.com after it has been submitted to the Prudential Regulation Authority or on request from the Group Company Secretary, County Gates, Bournemouth, BH1 2NF.
54. Society informationLiverpool Victoria Friendly Society Limited is a UK-incorporated and domiciled Friendly Society registered under the Friendly Societies Act 1992.
LV= and Liverpool Victoria are trademarks of Liverpool Victoria Friendly Society Limited. LV= and LV= Liverpool Victoria are trading styles of the Liverpool Victoria group of companies. Liverpool Victoria is authorised by the Prudential Regulation Authority and regulated by the Financial Conduct Authority and Prudential Regulation Authority, and is a member of the Association of British Insurers and the Investment and Life Assurance Group.
Registered office: County Gates Bournemouth BH1 2NF Telephone: 01202 292333

LV= Annual Report 2017198

![[cover] [101 artwork] [title] Think Bigger: The Call of a ... · Great leaders posses unique character qualities. They are confident, yet humble. Not afraid to speak up, but great](https://img.dokumen.tips/doc/110x75/603a76e9fa8c7472fe14db34/cover-101-artwork-title-think-bigger-the-call-of-a-great-leaders-posses.jpg)