Embed Size (px)
Citation preview

LUNAR SOIL SIMULATION
and
TRAFFICABILITY PARAMETERS
by
W. David Carrier, III
Lunar Geotechnical Institute
P. O. Box 5056
Lakeland, FL 33807-5056
863-646-1842
January 2006

1
1.0 RECOMMENDED LUNAR SOIL TRAFFICABILITY PARAMETERS
Table 9.14 in the Lunar Sourcebook (Carrier et al. 1991, p. 529) lists the current
recommended lunar soil trafficability parameters:
bc = 0.017 N/cm2
b� = 35°
K = 1.78 cm
n = 1
ck = 0.14 N/cm2
�k = 0.82 N/cm3
b b bc and � define the maximum shear strength of the soil available to drive the wheel. c
bis the coefficient of soil/wheel cohesion and its units are N/cm ; and � is the soil/wheel friction2
angle.
K defines the fraction of the maximum soil shear strength that is actually mobilized due
to wheel slippage: K is the coefficient of soil slip and its unit is cm.
c �n, k , and k define the pressure-sinkage characteristics of the soil under a wheel load. n
cis the exponent of soil deformation and is dimensionless; k is the cohesive modulus of soil
�deformation and its units are N/cm ; k is the frictional modulus of soil deformation and itsn+1
units are N/cm .n+2
[How these parameters are measured and how they are utilized to predict wheel sinkage,
gross pull per wheel, soil compaction resistance, and slope-climbing are beyond the scope of this
report. Suffice it to say that the design approach was developed by Bekker (1956, 1969) and it is
b bhighly empirical: The subscript “b” in c and � refers to soil properties measured with a special
shear device called the bevameter, which stands for BEkker VAlue METER.]
2.0 ORIGIN OF RECOMMENDED PARAMETERS
The NASA Request for Proposals for the Lunar Roving Vehicle (LRV), used on Apollos
15, 16, and 17, was issued just after the Apollo 11 mission. Consequently, the lunar soil
properties in the design specifications were primarily based on Surveyor measurements and

2
observations. A range of values were specified (Costes et al. 1972):
bc = 0 to 0.035 N/cm2
b� = 35° ± 4°
K = 1.78 ± 0.76 cm
n = 1
ck = 0 to 0.28 N/cm2
�k = 0.82 N/cm3
The prime contractor for the LRV, The Boeing Company, subsequently defined five sets
of parameters:
Soil Type
1 1 Parameters A A B C C
bc (N/cm ) 0 0 0.017 0.035 0.0352
b � (deg) 31 31 35 39 39
K (cm) 1.02 2.54 1.78 2.54 1.02
n 1 1 1 1 1
ck (N/cm ) 0 0 0.14 0.28 0.282
�k (N/cm ) 0.82 0.82 0.82 0.82 0.823
�n and k are the same for all five soil types. Soil Type A corresponds to the minimum
1design values in the specified ranges. Soil Type A is the same as Soil Type A, except that K has
the maximum specified value of 1.78 + 0.76 = 2.54 cm.
Soil Type C corresponds to the maximum design values in the specified ranges. Soil Type
1 C is the same as Soil Type C, except that K has the minimum specified value of 1.78 � 0.76 =
1.02 cm.

3
Soil Type B corresponds to the median design values in the specified ranges. [And note
that the values for Soil Type B are the same as the recommended lunar soil trafficability
parameters listed in Section 1.0 above and in Table 9.14 of the Lunar Sourcebook.]
3.0 SIMULANT TESTING
1In fact, there were no actual soils with the same parameters as Soil Types A, A , B, C, and
1C . And so, an extensive program of wheel/soil testing was undertaken at the Land Locomotion
Laboratory at the Waterways Experiment Station of the US Army Corps of Engineers (see
Figures 1 and 2). These tests were run on a crushed basalt lunar simulant and on Yuma Sand,
each compacted to different densities, in an attempt to “bracket” the performance of the LRV
wheel. In addition, archival soil values that had been measured in other trafficability studies
were compared analytically. Altogether, Costes et al. reported the results of 38 numerical
analyses.
After the Apollo 15 mission, the performance of the LRV was evaluated in detail and
compared to the simulation results. Costes et al. and Mitchell et al. (1973, 1974) concluded that
Soil Type B was the best match.
However, it was also observed that all 38 soil types yielded reasonable design estimates,
in spite of the wide range of properties. This was because the low ground pressure of the LRV
made its performance essentially independent of the soil type. This was an astonishing
conclusion, given the effort that had gone into the testing, including the development of a lunar
soil simulant. This is what led me to write in the Lunar Sourcebook: “From the experience of the
Apollo and Lunokhod missions, we now know that almost any vehicle with round wheels will
perform satisfactorily on the lunar surface, provided the ground contact pressure is no greater
than about 7 - 10 kPa.” (p. 522)
4.0 COMPARISON OF PARAMETERS FROM LRV STUDY
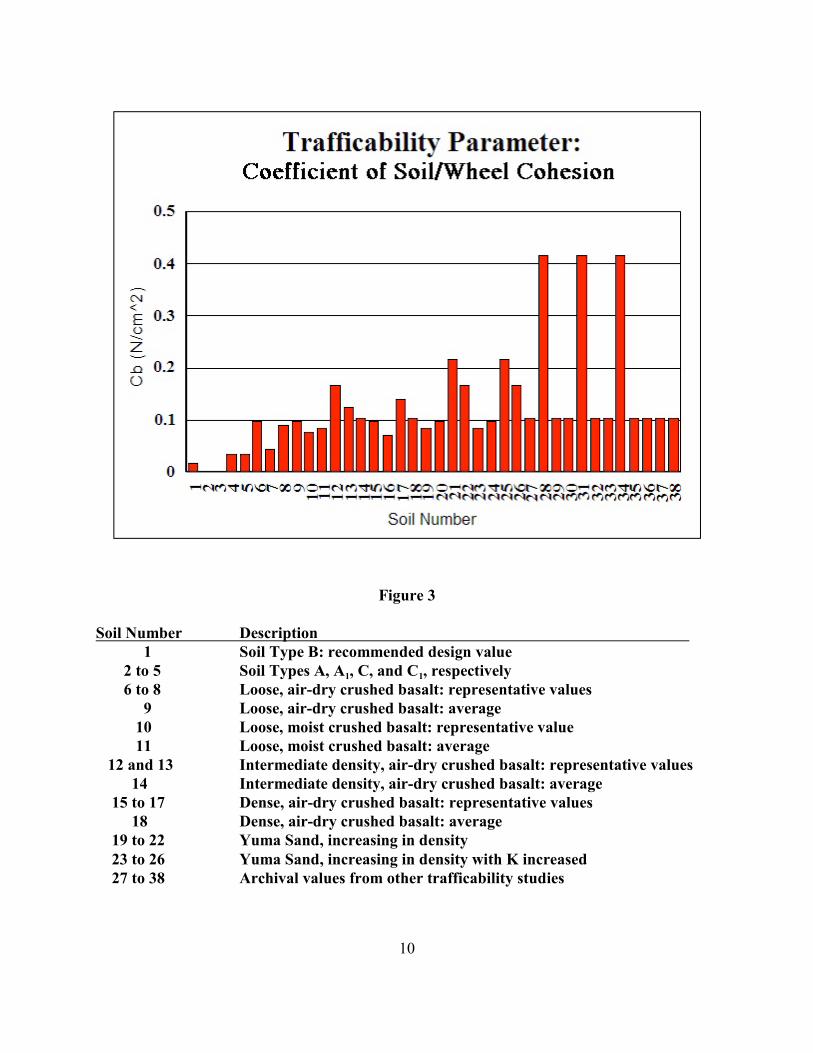
b4.1 Coefficient of Soil/Wheel Cohesion: c
bA bar chart of the c values from the LRV study is shown in Figure 3. Soil Number 1
indicates the value for Soil Type B (or the recommended design value): 0.017 N/cm .2
1 1Soil Numbers 2 to 5 indicate Soil Types A, A , C, and C , respectively.
Soil Numbers 6 to 8 indicate representative values for loose, air-dry crushed basalt; and
Number 9 is the average value for all tests on this simulant.
Soil Number 10 indicates a representative value for loose, moist crushed basalt; and

4
Number 11 is the average value for all tests on this simulant.
Soil Numbers 12 and 13 indicate representative values for intermediate density, air-dry
crushed basalt; and Number 14 is the average value for all tests on this simulant.
Soil Numbers 15 to 17 indicate representative values for dense, air-dry crushed basalt;
and Number 18 is the average value for all tests on this simulant.
Soil Numbers 19 to 22 indicate values for Yuma Sand, increasing in density. Numbers
23 to 26 indicate the same Yuma Sand, but in which K was arbitrarily increased from 2.54 cm to
4.32 cm as part of a sensitivity analysis.
bFinally, Soil Numbers 27 to 38 are archival values of c from other trafficability studies.
[Note that the Soil Numbers do not correspond to the Soil Types listed in Costes et al.
The latter have been re-arranged herein for greater clarity.]
bThe value of c used in the LRV analyses ranged from a minimum of 0 to a maximum of
0.417 N/cm .2
b4.2 Soil/Wheel Friction Angle: �
bA bar chart of the � values is shown in Figure 4. Soil Number 1 is the recommended
bdesign value: 35°. The other Soil Numbers are in the same order as for c .
bThe value of � used in the LRV analyses ranged from a minimum of 13.8° to a
maximum of 50.0°.
4.3 Coefficient of Soil Slip: K
A bar chart of the K values is shown in Figure 5. Soil Number 1 is the recommended
bdesign value: 1.78 cm. The other Soil Numbers are in the same order as for c .
The value of K used in the LRV analyses ranged from a minimum of 1.02 cm to a
maximum of 4.32 cm.
4.4 Exponent of Soil Deformation: n
A bar chart of the n values is shown in Figure 6. Soil Number 1 is the recommended
bdesign value: 1. The other Soil Numbers are in the same order as for c .

5
The value of n used in the LRV analyses ranged from a minimum of 0.52 to a maximum
of 4.24.
c4.5 Cohesive Modulus of Soil Deformation: k
cThe units for k are unusual, in that they are dependent on the value of n: N/cm . Thus,n+1
cbefore the k values for the 38 soil types can be compared, they must be “rationalized” in terms
of the width of the soil/wheel contact, b. The rationalized cohesive modulus of soil modulus,
ck �is given by:
c ck � = b kn�1
cThe unit of b is cm; and the units of k � are N/cm .2
cThus, a bar chart of the k � values is shown in Figure 7, based on the approximate average
width of the LRV soil/wheel contact in the tests: b = 18 cm (the overall width of the LRV wheel
cis 23 cm). Soil Number 1 is the recommended design value: 0.14 N/cm (corresponding to k =2
0.14 N/cm ).2
cThe value of k � used in the LRV analyses ranged from a minimum of �2.81 N/cm2
c c(corresponding to k = �0.70 N/cm ) to a maximum of 1.74 N/cm (corresponding to k = 1.032.48 2
N/cm ). [The values for Soil Numbers 27 to 38 are all 0.]2.18
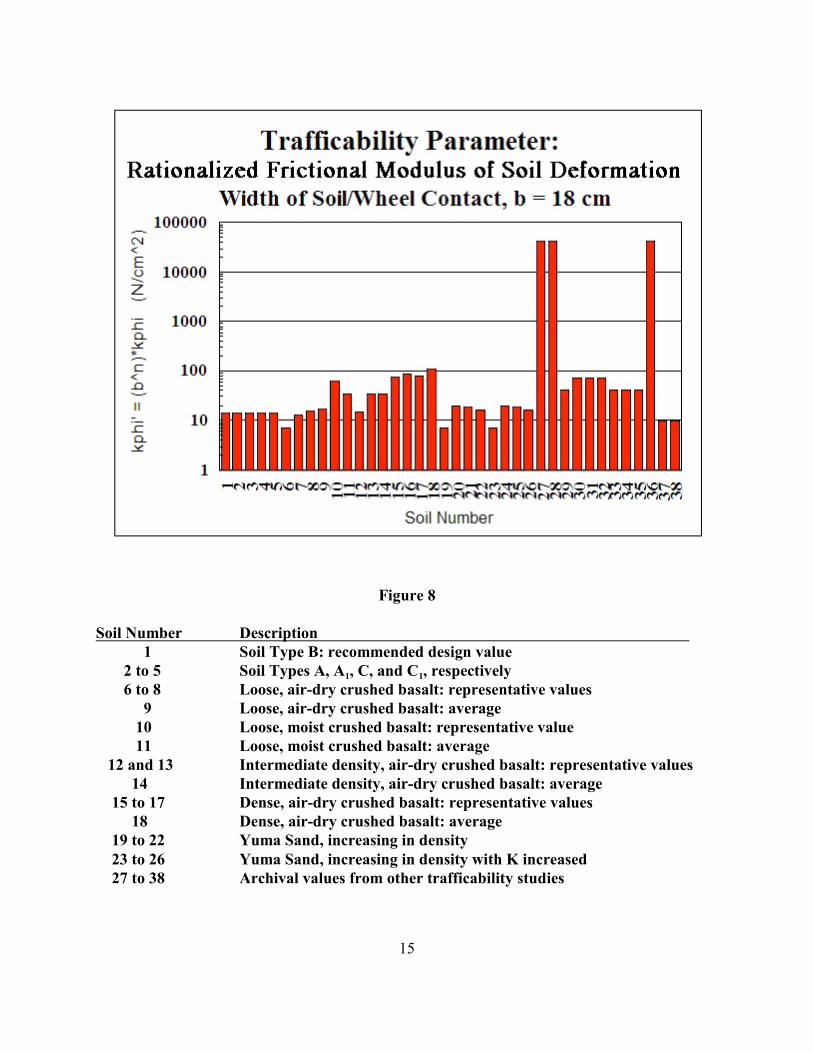
�4.6 Frictional Modulus of Soil Deformation: k
� �The units for k are also dependent on the value of n: N/cm . Again, the k values mustn+2
be rationalized:
� �k � = b kn
�The units of k � are N/cm .2
�A bar chart of the k � values is shown in Figure 8, also based on the width of the LRV
soil/wheel contact. Soil Number 1 is the recommended design value: 14.8 N/cm (corresponding2
�to k = 0.82 N/cm ).3
�The value of k � used in the LRV analyses ranged from a minimum of 7.1 N/cm2
� �(corresponding to k = 0.87 N/cm ) to a maximum of 42,000 N/cm (corresponding to k =2.73 2
0.20 N/cm ).6.24
6
4.7 Penetration Resistance Gradient: G
The US Army Corps of Engineers has developed an alternate trafficability method to the
Bekker method, which it uses to predict and assess the performance of vehicles such as heavy
trucks and tanks. This method utilizes a standardized cone penetrometer to measure penetration
resistance of the soil vs. depth. The slope of this curve is called the penetration resistance
gradient, or G. The units are stress ÷ depth = MN/m (= N/cm ).3 3
Although the Corps method was not used to design the LRV, values for G were reported
by Costes et al. for eight of the test soils, and these are presented in Figure 9. The value of G
ranged from a minimum of 0.20 MN/m to a maximum of 3.17 MN/m , or a factor of about 16. 3 3
This is another measure of the wide range of soil properties used to design the LRV wheel.

7
REFERENCES
Bekker, M. G. (1956) Theory of Land Locomotion, The University of Michigan Press, Ann
Arbor.
Bekker, M. G. (1969) Introduction to Terrain-Vehicle Systems, The University of Michigan
Press, Ann Arbor.
Carrier, W. D., Olhoeft, G. R., and Mendell, W. (1991) “Physical Properties of the Lunar
Surface”, Lunar Sourcebook, G. Heiken, D. Vaniman, and B. M. French, eds., Cambridge
University Press, Cambridge, pp. 475-594.
Costes, N. C., Farmer, J. E., and George, E. B. (1972) Mobility Performance of the Lunar Roving
Vehicle: Terrestrial Studies–Apollo 15 Results, NASA TR-R-401.
Mitchell, J. K., Carrier, W. D., Costes, N. C., Houston, W. N., Scott, R. F., and Hovland, H. J.
(1973) “Soil Mechanics”, Apollo 17 Preliminary Science Report, NASA SP-330, pp.8-1
to 8-22.
Mitchell, J. K., Houston, W. N., Carrier, W. D., and Costes, N. C. (1974) Apollo Soil Mechanics
Experiment S-200, Final report NASA Contract NAS 9-11266, Space Sciences
Laboratory Series 15, Issue 7, University of California, Berkeley.
8
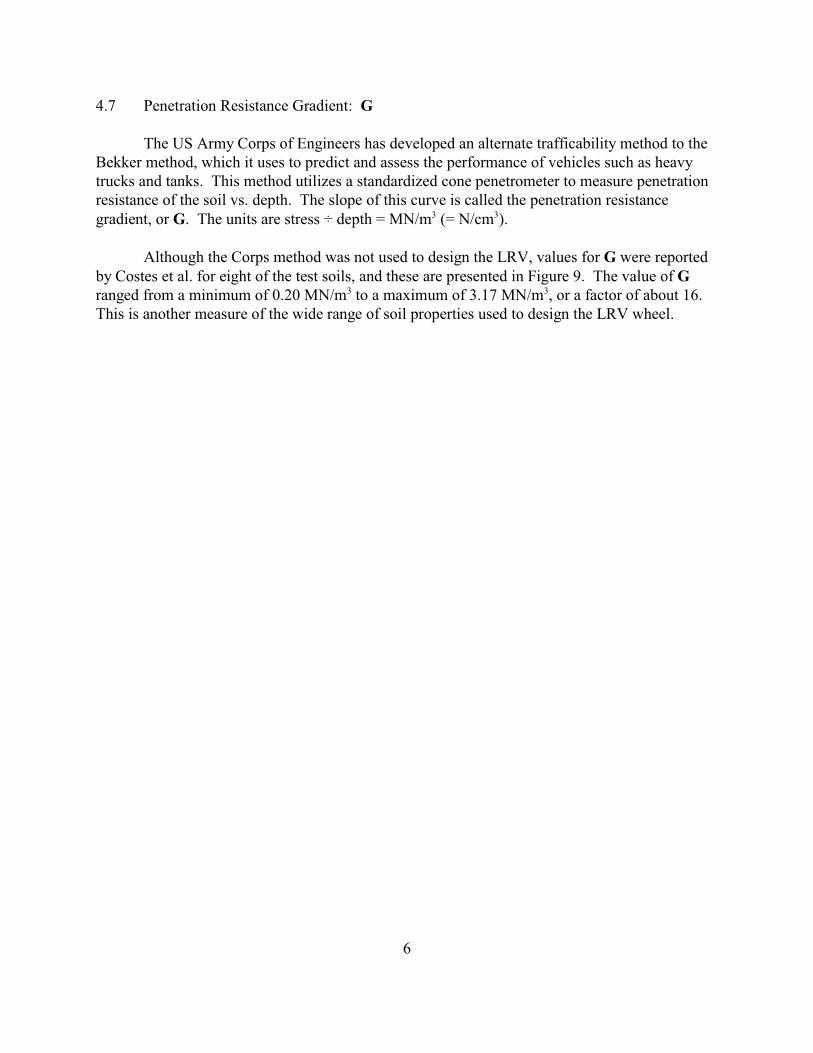
Figure 1
Wheel/soil testing apparatus at the Land Locomotion Laboratory at the Waterways
Experiment Station, US Army Corps of Engineers (from Costes et al. 1972)
9
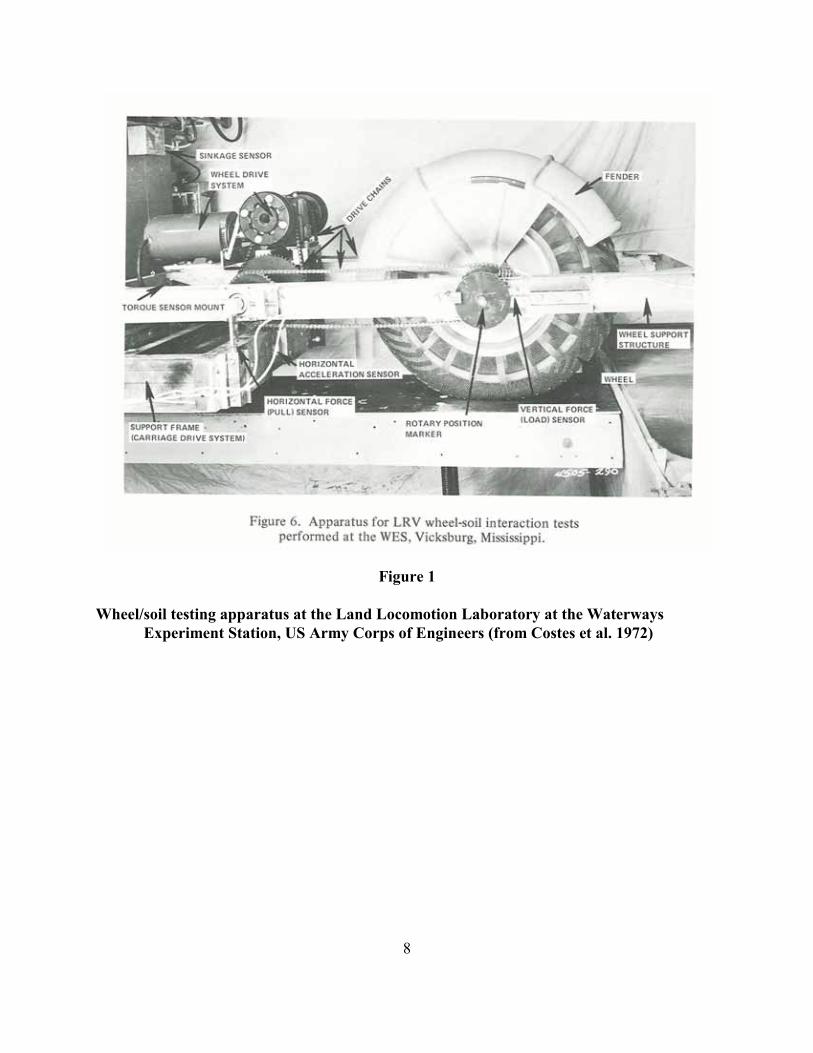
Figure 2
Testing one of the designs of the wheel for the Lunar Roving Vehicle; the direction of
motion is to the right. Note the soil pouring back out of the open weave of the
wheel. (from Costes et al. 1972)
10
Figure 3
Soil Number Description
1 Soil Type B: recommended design value
1 1 2 to 5 Soil Types A, A , C, and C , respectively
6 to 8 Loose, air-dry crushed basalt: representative values
9 Loose, air-dry crushed basalt: average
10 Loose, moist crushed basalt: representative value
11 Loose, moist crushed basalt: average
12 and 13 Intermediate density, air-dry crushed basalt: representative values
14 Intermediate density, air-dry crushed basalt: average
15 to 17 Dense, air-dry crushed basalt: representative values
18 Dense, air-dry crushed basalt: average
19 to 22 Yuma Sand, increasing in density
23 to 26 Yuma Sand, increasing in density with K increased
27 to 38 Archival values from other trafficability studies

11
Figure 4
Soil Number Description
1 Soil Type B: recommended design value
1 1 2 to 5 Soil Types A, A , C, and C , respectively
6 to 8 Loose, air-dry crushed basalt: representative values
9 Loose, air-dry crushed basalt: average
10 Loose, moist crushed basalt: representative value
11 Loose, moist crushed basalt: average
12 and 13 Intermediate density, air-dry crushed basalt: representative values
14 Intermediate density, air-dry crushed basalt: average
15 to 17 Dense, air-dry crushed basalt: representative values
18 Dense, air-dry crushed basalt: average
19 to 22 Yuma Sand, increasing in density
23 to 26 Yuma Sand, increasing in density with K increased
27 to 38 Archival values from other trafficability studies

12
Figure 5
Soil Number Description
1 Soil Type B: recommended design value
1 1 2 to 5 Soil Types A, A , C, and C , respectively
6 to 8 Loose, air-dry crushed basalt: representative values
9 Loose, air-dry crushed basalt: average
10 Loose, moist crushed basalt: representative value
11 Loose, moist crushed basalt: average
12 and 13 Intermediate density, air-dry crushed basalt: representative values
14 Intermediate density, air-dry crushed basalt: average
15 to 17 Dense, air-dry crushed basalt: representative values
18 Dense, air-dry crushed basalt: average
19 to 22 Yuma Sand, increasing in density
23 to 26 Yuma Sand, increasing in density with K increased
27 to 38 Archival values from other trafficability studies

13
Figure 6
Soil Number Description
1 Soil Type B: recommended design value
1 1 2 to 5 Soil Types A, A , C, and C , respectively
6 to 8 Loose, air-dry crushed basalt: representative values
9 Loose, air-dry crushed basalt: average
10 Loose, moist crushed basalt: representative value
11 Loose, moist crushed basalt: average
12 and 13 Intermediate density, air-dry crushed basalt: representative values
14 Intermediate density, air-dry crushed basalt: average
15 to 17 Dense, air-dry crushed basalt: representative values
18 Dense, air-dry crushed basalt: average
19 to 22 Yuma Sand, increasing in density
23 to 26 Yuma Sand, increasing in density with K increased
27 to 38 Archival values from other trafficability studies

14
Figure 7
Soil Number Description
1 Soil Type B: recommended design value
1 1 2 to 5 Soil Types A, A , C, and C , respectively
6 to 8 Loose, air-dry crushed basalt: representative values
9 Loose, air-dry crushed basalt: average
10 Loose, moist crushed basalt: representative value
11 Loose, moist crushed basalt: average
12 and 13 Intermediate density, air-dry crushed basalt: representative values
14 Intermediate density, air-dry crushed basalt: average
15 to 17 Dense, air-dry crushed basalt: representative values
18 Dense, air-dry crushed basalt: average
19 to 22 Yuma Sand, increasing in density
23 to 26 Yuma Sand, increasing in density with K increased
27 to 38 Archival values from other trafficability studies
15
Figure 8
Soil Number Description
1 Soil Type B: recommended design value
1 1 2 to 5 Soil Types A, A , C, and C , respectively
6 to 8 Loose, air-dry crushed basalt: representative values
9 Loose, air-dry crushed basalt: average
10 Loose, moist crushed basalt: representative value
11 Loose, moist crushed basalt: average
12 and 13 Intermediate density, air-dry crushed basalt: representative values
14 Intermediate density, air-dry crushed basalt: average
15 to 17 Dense, air-dry crushed basalt: representative values
18 Dense, air-dry crushed basalt: average
19 to 22 Yuma Sand, increasing in density
23 to 26 Yuma Sand, increasing in density with K increased
27 to 38 Archival values from other trafficability studies

16
Figure 9
Soil Number Description
9 Loose, air-dry crushed basalt: average
11 Loose, moist crushed basalt: average
14 Intermediate density, air-dry crushed basalt: average
18 Dense, air-dry crushed basalt: average
19 to 22 Yuma Sand, increasing in density