Embed Size (px)
Citation preview

A project of The Poverty Group of the Bureau for Development Policy, New York and the International Poverty Centre in Brasilia (IPC), United Nations Development Programme
AnEmployment-Targeted
Economic Program for South Africa
Robert Pollin
Gerald Epstein
James Heintz
Léonce Ndikumana
An
Em
plo
ym
en
t-Targe
ted
Eco
no
mic P
rogram
for S
ou
th A
fricaR
ob
ert P
ollin
Ge
rald
Ep
stein
Jam
es H
ein
tz
Lé
on
ce N
dik
um
an
a
The people of South Africa, and the African National Congress-led government, have made extraordinary social and economic advances since ending apartheid and beginning the transition to democracy in 1994. But the country still faces severe problems of mass unemployment, underemployment and poverty. This study presents a detailed economic program designed to produce major reductions in unemployment and poverty, and a general spreading of economic well-being; and to achieve these ends in a manner that is sustainable over a longer-term framework.
“This United Nations-commissioned study presents the work of a group of leading economists who were asked to think about the nature of the economic policy agenda that South Africa should be pursuing after a decade that was punctuated by improved levels of growth, a growing black middle class, but increased levels of poverty and structural unemployment. It compliments the ASGISA program and provides a platform for the ANC-led developmental state to tackle unemployment and poverty in a sustainable manner. This is an exciting and stimulating work, and one that will leave its mark upon the work of social scientists and policy makers.”
■ LUMKILE MONDIChief Economist and Executive Vice President, Industrial Development Corporation of South Africa; and Member, Presidential Economic Advisory Panel of South Africa
“Investment in South Africa is low, real interest rates are high, the employ-ment-intensity of growth has been relatively slow. The ‘employment-targeted program’ advocated in this book seeks to reverse these tendencies by lowering average interest rates and channeling subsidized credit to labor-intensive, pro-poor activities, particularly small-scale agriculture and small and medium-sized enterprises. This is a bold program and by challenging conventional
“infl ation-targeted” economic policy, the book makes a major contribution to the debate on economic policy in South Africa.”
■ KEITH B. GRIFFINDistinguished Professor of Economics Emeritus, University of California-Riverside
Robert Pollin and Gerald Epstein are Professors of Economics and Co-Directors of the Political
Economy Research Institute (PERI), University of Massachusetts-Amherst. James Heintz is Associate
Professor and Associate Director of PERI, University of Massachusetts-Amherst. Léonce Ndikumana
is Associate Professor, Department of Economics, University of Massachusetts-Amherst and Senior
Economic Affairs Offi cer in the Economic and Social Policy Division at the United Nations Economic
Commission for Africa.
36886_UNDP_CovX.indd 136886_UNDP_CovX.indd 1 6/19/06 2:52:59 PM6/19/06 2:52:59 PM

An Employment-TargetedEconomic Program for South Africa
A project of The Poverty Group of the Bureau for Development Policy,New York and the International Poverty Centre in Brasilia (IPC),United Nations Development Programme


An Employment-Targeted EconomicProgram for South Africa___________________________________________________
Robert PollinGerald EpsteinJames HeintzLéonce Ndikumana
Department of Economics and Political Economy Research Institute (PERI),University of Massachusetts-Amherst
COUNTRY STUDY SUPPORTED BY THE INTERNATIONAL POVERTY CENTREThis is an independent report produced by a team of international and nationalconsultants supported by the International Poverty Centre in Brasilia (IPC). Initialsupport for this report was provided by the Poverty Group of the United NationsDevelopment Programme in New York. This report is part of a wider global researchprogramme encompassing several other countries. The views in this report are theauthors’ and not necessarily IPC’s. However, the IPC regards this report as animportant contribution to the debate on economic policies and employment programmesin South Africa as well as in other countries in Africa.

Copyright © 2006
POLITICAL ECONOMY RESEARCH INSTITUTE (PERI)Gordon Hall / 418 N. Pleasant St., Suite AAmherst, MA, USA, 01002
http://www.umass.edu/peri

Contents___________________________________________________
List of Tables .............................................................................................. viiList of Figures ............................................................................................. ixAcknowledgments ......................................................................................... xiBrief Highlights of Major Proposals ........................................................... xiiiSummary of Major Findings and Proposals ................................................. xix
1. Introduction ........................................................................................ 1
2. The Nature of Mass Unemployment in South Africa Today ......... 5Who Are the Unemployed? ..................................................................... 5Impact of Slow Growth and Declining Labor Intensity ......................... 11Why Is There Employment Stagnation in the Formal Economy? .......... 16
3. Supply-Side Perspectives on Employment Expansion .................. 21Wage Cutting and Labor Market Flexibility ......................................... 22Global Competitiveness Approach ........................................................ 24Examining the Evidence on Unit Labor Costs and Unemployment ...... 25Policy Approaches to Reducing Unit Labor Costs ................................. 32
4. A Policy Framework on Growth,Labor Intensity and Poverty Reduction .......................................... 39Economic Growth ................................................................................ 39
Private Investment ............................................................................. 39Private Consumption .......................................................................... 49Net Exports ....................................................................................... 51Government Spending ......................................................................... 56
Increasing Labor Intensity .................................................................... 56Expanded Public Works Program ......................................................... 57Targeting Activities with High Employment Impacts ............................. 61Poverty Reduction .............................................................................. 76

5. Policy Interventions for Employment-Targeted Program ............ 79Fiscal Policies ....................................................................................... 79
Increasing the Fiscal Deficit ................................................................ 80Tax Financing of New Spending Initiatives .......................................... 82
Monetary Policy and Interest Rates ...................................................... 88Inflation Targeting ............................................................................. 88Interest Rates, Growth, and Inflation .................................................. 92
Public Credit Allocation and Development Banking ............................. 96The Current State of Credit Allocation Policies in South Africa ............. 98Credit Allocation Proposals ................................................................103
Controls on Exchange Rates and Capital Flows ...................................118Background on Exchange Controls in South Africa ..............................119Impacts of Capital Management Techniques ........................................122
Inflation Control and Economic Growth .............................................128What is the Relationship between Inflation and Growth? ......................128Does Inflation Targeting Change the Growth/Inflation Relationship? ......131Policy Implications and Proposals .......................................................132
Productive Sector Policies ...................................................................135Getting Prices Wrong .........................................................................135Targeting Sectors with Low Employment Multipliers ............................137
Appendix 1: Sources of Employment Dataand Employment Elasticity Estimate ...................................143
Appendix 2: Macroeconomic policy factors and private investmentin South Africa ....................................................................147
Appendix 3: Estimation of Consumption Function .................................159Appendix 4: Input-Output Model and Employment Multipliers .............163Appendix 5: Securities Transaction Taxes Around the World ...................167Appendix 6: South Africa Monetary Policy Alternatives:
VAR-Based Simulation Models ...........................................171
References ...............................................................................................185Index .......................................................................................................193About the Authors ...................................................................................201
An Employment-Targeted Economic Program for South Africavi

List of Tables
Table 2.1 Official Unemployment by Gender andPopulation Group, March 2005 .................................................... 6
Table 2.2 Unemployment, Discouraged Workersand Rural Population by Province ................................................ 6
Table 2.3 The Officially Unemployed by Duration ofJob Seeking, March 2005 ............................................................. 7
Table 2.4 South Africa Employment Growth 2005 – 2014 under AlternativeEconomic Growth and Labor Intensity Assumptions ................. 12
Table 3.1 Relative Unit Labor Costs and Trade Performanceof Selected South African Sectors, 1970-79 and 1995-98 ............ 31
Table 3.2 Scenarios for Reducing Formal Unemploymentby Half Through Wage-Cutting ................................................. 33
Table 4.1 Foreign Direct Investment Into South Africa, 1996 – 2000:GEAR Projections vs. Actual Investment Flows ......................... 48
Table 4.2 Employment Generation in South Africa onan Industry-by-Industry Basis ................................................... 63
Table 4.3 Balance of Payments Considerationsfor Selected South African Industries ......................................... 67
Table 4.4 High Employment Growth Industries asShare of South Africa’s Output and Employment ....................... 70
Table 4.5 Employment Effects of Combining AcceleratedEconomic Growth with Increased Labor Intensity ..................... 72
Table 4.6 Total Employment and Unemployment Rate in 2014 Under Alterna-tive Scenarios for Economic Growth and Labor Intensity ..............75
Table 5.1 Overall Government Budget Balance,Including Grants, 1970 – 2001 ................................................... 82
vii

Table 5.2 Consolidated Government Revenue as a Share of GDP ............. 83
Table 5.3 Primary Tax Revenue Sources forSouth African National Treasury ............................................... 85
Table 5.4 Estimating Impact of Interest Rate Declineon GDP Growth, Inflation, and Exchange Rate Changes .......... 95
Table 5.5 South African Government Loan Guarantee Program:Contingent Liabilities and Accruals ......................................... 101
Table 5.6 Losses to Lenders from Loan Defaults WithNon-Guaranteed and Guaranteed Loan Portfolios ................... 109
Table 5.7 Creation of Escrow Account for Social Priority Lending .......... 111
Table 5.8 Numerical Example on Collateral and Escrow Fund ................ 115
Table 5.9 Applying a Simple Asset Reserve Requirement Formulato South African Financial Institutions .................................... 117
Table 5.10 Capital Controls in South Africa in 2002 and 2004 ................... 121
An Employment-Targeted Economic Program for South Africaviii

List of Figures
Figure 2.1 Real Growth Rate of South Africa GDP, 1984 – 2004 ................. 9(also Figure S.1, page xxi)
Figure 2.2 Ratio of Formal Employment to GDP in South Africa,1967 – 2001 (also figure S.2, page xxiii) .................................... 11
Figure 2.3 Total Real Income Changes for Different Income Groupsin South Africa, 1995-2000 ...................................................... 14
Figure 4.1 Investment as a Share of GDP in South African Economy,1970 – 2004 ............................................................................. 41
Figure 4.2 Stock Trading, Bond Trading and Capital Investmentin South Africa, 1970 – 2004 .................................................... 45
Figure 4.3 Exports as a Percentage of GDP in South Africa, 1960 – 2005 .... 53
Figure 4.4 Share of South African Exports by Country/Region, 2005 ...... 54
Figure 5.1 South Africa Fiscal Deficit/GDP Ratio ................................... 81
Figure 5.2 Annual Inflation Rate in South Africa, 1994 – 2004 .................. 89
Figure 5.3 Nominal and Real Interest Rates in South Africa ..................... 90
Figure 5.4 Long-term Government Bond Rate Differential BetweenSouth Africa and the United States, 1994.1 – 2005.4 ................ 91
Figure 5.5 Average Repo and Prime Overdraft Rates, 1999 – 2005 ............ 94
Figure 5.6 Financial Integration Index for South Africa, 1966 – 95 .......... 123
Figure 5.7 Capital Controls, Interest Rates, andInterest Rate Differentials, 1973 – 95 ...................................... 125
Figure 5.8 Capital Controls and Exchange Rate Changesin South Africa, 1973 – 95 ...................................................... 126
ix


Acknowledgments
Between August 23 – September 1, 2004, we conducted more than 30 inter-views in Johannesburg, Pretoria, and Cape Town with people offering us a widerange of knowledge and insight about the workings of the South African economy.We could not have even thought to pursue this project had these people notgiven so generously of their time. It isn’t possible for us to mention all of thepeople we met with, but a partial list of those we wish to thank includes StephenHanival and Dirk van Seventer of TIPS; Rashad Cassim and Simon Roberts ofthe University of Witwatersrand; Miriam Altman of HSRC; Wiseman Nkuhluof NEPAD; Lumkile Mondi, Gerhard Kuhn, Chifipa Mhango, and Christo vanZyl of IDC; Herbert Mkhize, along with representatives of business, govern-ment, labor and community constituencies at NEDLAC; Bhenki Langa, GuyMhone, Tim Hinks, and Afeikhena Jerome at NIEP; Brian Kahn of the SARB;Rudolph Gouws of the Rand Merchant Bank; Kenneth Andoh, Astrid Coyne-Jensen, and Momammed Mwamadzingo of ILO; Neil Coleman, Oupa Bodibe,and Ravi Naidoo of NALEDI; Murray Liebbrandt, Nicoli Nattras, MelvinAyogu, Cecil Mlatsheni, Lawrence Edwards, and Samson Muradsikwa of theUniversity of Cape Town; Stan du Plessis and Servaas Van Der Berg of theUniversity of Stellenbosch; Sean Phillips of the Department of Public Works;Alan Hirsch of the Office of the Presidency; Elias Masilela, Kuben Naidoo, andKevin Fletcher of the National Treasury; Kgalema Mothanthee of the ANC;Nanda Ndalane, Rob Davies, and Jeremy Cronin of the Parliament of SouthAfrica; and Mandisi Mpahlwa of the DTI.
Robert Pollin presented an earlier draft of this study in January 2005 at aconference in Brasilia on “Strengthening the Employment Nexus betweenGrowth and Poverty Reduction,” sponsored by the UNDP International Pov-erty Centre there. He benefited greatly from the discussion of this work at thatconference and from the more general conference discussions.
Our full team returned to South Africa March 11 – 16, 2005 to present apreliminary draft of this study before a series of seminars at the University ofCape Town, and in public meetings in Cape Town, Pretoria, and Johannesburg.We are grateful to all seminar participants for their interest and spirited com-ments. We especially benefited from the formal comments by David Kaplan,Lumkile Mondi, Stephen Gelb, Wiseman Nkhulu, Rob Davies (from SouthAfrica), Rob Davies (from Zimbabwe), and Ben Smit. We also received highly
xi

constructive and characteristically challenging written comments on earlierdrafts from Keith Griffin, Aziz Khan, Laurence Harris, Terry McKinley andCharles Meth. Between our preliminary March 2005 draft and this currentversion, we also were fortunate to have been able to present parts of our findingsbefore seminars at the International Labour Offices in Geneva, at the 2006 Al-lied Social Science Association meetings, and at seminars at York University aswell as our home institution, University of Massachusetts-Amherst. We ben-efited substantially from all of these interchanges.
We owe a special debt of gratitude to the South African economists whohave served as our consultants on this project. They are Anna McCord of theUniversity of Cape Town; Stephen Gelb of the EDGE Institute and Universityof Witwatersrand; and Julian May, Vishnu Padayachee, and Imraan Valodia ofthe University of KwaZulu-Natal.
We are greatly appreciative of the support of our sponsors in the UNDPsystem—at both the Poverty Group of the Bureau for Development Policy,NewYork, and the International Poverty Centre in Brasilia (IPC). We especiallysingle out the efforts of Terry McKinley and Selim Jahan. We also are gratefulfor the support from UNDP officers in South Africa, including JohnOhiorhenuan, John Wayem, Philip Browne, and Lusanda Monale.
Our research assistants, Ozgur Orhangazi, Fiona Tregenna and AndongZhu, all made significant contributions to this project, for which we are veryappreciative. Kim Weinstein has done her customary excellent work in layingout this study. Against formidable odds, Judy Fogg continues to keep this projectand everything else at PERI in order.
An Employment-Targeted Economic Program for South Africaxii

An Employment-TargetedEconomic Program for South Africa:Brief Highlights of Major Proposals
The focus of our study is the severe problem of mass unemployment in SouthAfrica today, and the corresponding problem of mass poverty. Depending onwhether one considers the “official” or “expanded” definition (the expandeddefinition including discouraged workers), unemployment in South Africa stoodat between 26.5 – 40.5 percent as of March 2005. The ANC-led governmenthas committed itself to cutting the unemployment rate in half by 2014, i.e. bring-ing the official unemployment rate down to roughly 13 percent as of 2014. Ourproposed program is designed to produce major reductions in unemploymentand poverty and a general spreading of economic well-being; and to achievethese ends in a manner that is sustainable over a longer-term framework. Ourprogram is certainly consistent in intention with the preliminary presentationsof the government’s forthcoming Accelerated and Shared Growth Initiative forSouth Africa (ASGISA). It also shares several specific features in common withthe preliminary version of the ASGISA.1
UNEMPLOYMENT AND POVERTYIN SOUTH AFRICA TODAY
South Africa’s problem of mass unemployment can be usefully conceptualizedin simple accounting terms, as the result of two factors:
1. Insufficiency in the rate of output growth, i.e. the economy’s production ofgoods and services. Between 1994 – 2004, the average GDP growth ratewas 3.1 percent. This is superior to the last decade of apartheid. But giventhe growth rate of the population of slightly under 2 percent per year, it isstill inadequate for generating a significant expansion of employment op-portunities.
2. Declining labor intensity of production in the formal economy. Between 1994 –2001, the number of workers utilized per unit of output—i.e. a basic mea-
xiii

sure of labor intensity—fell by an average of nearly four percent per year,an acceleration of a longer-term trend decline between 1967 – 2001 ofroughly one percent per year.
Employment projection to 2014. If South Africa proceeds along this approximategrowth pattern for the next decade, we estimate—using a series of reasonableassumptions about labor force growth and the ratio of informal/formal employ-ment—that official unemployment will have risen to roughly 33 percent as of2014.
Economic Growth and Poverty. We observe that—at least between the years 1995– 2000, for which we have adequate data—economic growth was associated withdeclining incomes across households at all income levels, but with the sharpestincome declines occurring among the least well off.
Supply-Side Interventions to Expand Employment. The fact that South Africa isexperiencing both high unemployment and rising capital intensity of produc-tion suggests to some analysts that businesses are convinced that the costs ofhiring more workers exceed the benefits. From this perspective, the solution tomass unemployment is to lower unit labor costs, in particular through reducingwages. But we argue that the evidence linking mass unemployment to highlabor costs is generally not convincing. At the same time, we do support mea-sures to maintain wage increases in line with productivity growth and to im-prove the efficiency of the country’s industrial relations system.
MAIN FEATURES OF PROPOSED EMPLOYMENT-TARGETED PROGRAM
To establish the framework for introducing our overall employment program,we divide the South African economy into two broad categories—activities thatwill receive large-scale credit subsidies and those that will be unsubsidized.
Subsidized activities. These would include small-scale agriculture, small andmedium-sized enterprises, and larger-scale businesses that either operate at highlevels of labor intensity or can generate substantial employment multipliers.We would expect firms that receive the credit subsidies to account for roughly20 – 25 percent of all investment activity in South Africa’s economy. We pro-pose that government policy aim to enable these activities to expand at roughly8 percent per year through 2014.
An Employment-Targeted Economic Program for South Africaxiv

Unsubsidized activities. For the remaining 75 – 80 percent of South Africa’seconomy, we propose that economic growth accelerate to roughly 4.5 percentper year through 2014.
Alternative Employment Projection for 2014 Combining an 8 percent growthstimulus for the subsidized activities and a 4.5 percent growth rate for the restof the economy generates an overall average annual growth rate of 5.3 percent.At this growth rate, as well as making reasonable assumptions about labor mar-ket trends, we estimate that unemployment could decline to about 15.4 percentas of 2014.
Alternative Employment Projection and Poverty Reduction. Given that unem-ployment will remain very high even with an aggressive employment-targetedprogram, other measures besides employment growth are needed to improveliving conditions for the poor over the next decade. We therefore support mea-sures to increase spending on social services and income supports for the poor.We outline the revenue sources that would be needed to pay for program expan-sions on the order of R10 – 20 billion per year.
TOOLS FOR IMPLEMENTING THEEMPLOYMENT-TARGETED PROGRAM
Achieving Sustained 4.5 Percent Growthfor Unsubsidized Share of Economy
1. Fiscal Stimulus. The government is presently projecting a structural fiscaldeficit through 2008–09 in the range of 2 percent of GDP. However, as of2004, it had increased its deficit projections to about 3 percent of GDP. Wethink this higher deficit/GDP ratio is an appropriate and sustainable level ofstructural fiscal stimulus consistent with the government’s employment goals.
2. Monetary stimulus. We propose that the Reserve Bank lower lending ratesto stimulate growth, especially by encouraging higher levels of investmentand consumption spending. For example, lowering the prime lending ratefrom, say, 11 to 7 percent, and holding rates at that lower level for five years,will increase average growth from 3 to 3.6 percent over the five-year period.At the same time, the impact on inflation and the exchange rate will berelatively mild, i.e. raising inflation from, say, 5 to 6 percent as a five-yearaverage, and lowering the value of the rand from, say, R6.3 per dollar toR7.1 per dollar by the end of the five-year period. We believe that these combined relatively modest fiscal and monetarystimuli will be able to bring the average growth rate in the range of 4.5
Brief Highlights of Major Proposals xv

percent, as long as effective controls are maintained at keeping inflationwithin a moderate range and maintaining a relatively stable exchange rate.
Achieving 8 Percent Growth Stimulus for Subsidized Activities
The key mechanism through which we propose to generate the eight percentgrowth stimulus for the subsidized activities is the provision of credit at conces-sionary rates to these industries. We propose a formula for determining appro-priate subsidized credit rates based on 1) the proportion of a loan being guaran-teed; and 2) the differential between market rates and default-safe governmentbond rates.
We propose three main policy tools to channel credit to the targeted indus-tries at concessionary rates.
1. Major expansion in lending activity and developmental focus of the country’seight currently operating development banks.
2. Asset reserve requirements. These requirements would establish that finan-cial institutions hold, for example, 20 percent of their assets in loans tosubsidized activities. We propose measures to operate this system flexibly,for example, allowing banks that hold more than 20 percent of their loanswith subsidized firms to sell permits to institutions whose loans to subsi-dized firms are below the 20 percent minimum threshold.
3. Major expansion of the government’s system of loan guarantees. We proposethat the government underwrite roughly R40 billion in loans to subsidizedactivities. We calculate the budgetary costs of this program as being roughlyR4.5 billion/year, assuming a 75 percent underwriting and a 15 percentfailure rate on guaranteed loans. The idea of subsidizing firms that either operate at high levels of laborintensity or that generate large employment multipliers builds on the ap-proach of the current Expanded Public Works Program (EPWP), whichis specifically targeted at promoting labor-intensive production techniquesin some public infrastructure projects. But the EPWP in its current formwill provide only very modest gains in employment expansion. TheASGISA is focused on a major expansion in public investment, includingin labor-intensive areas. But as yet we have not seen proposals as to howthis new public investment spending will be financed. The method offinancing will be crucial for determining the net employment effects ofthe program.
An Employment-Targeted Economic Program for South Africaxvi

CONTROLLING INFLATIONAND THE EXCHANGE RATE
Inflation Control and Economic Growth. We review the current literature on therelationship between economic growth and inflation. Researchers differ widelyin their conclusions. But there is virtually no evidence demonstrating that de-veloping countries experience slower GDP growth through inflation within asingle-digit range. This is especially true if inflation is generated through in-creasing overall demand, as opposed to supply shocks, exchange rate shocks, ormonopolistic pricing practices. If inflation in South Africa were to reach double-digit rates, we propose two policy measures other than raising interest rates ascontrol measures: a) policies to weaken monopolistic price mark-ups; and 2)incomes policies—that is, wage and price restraint that is negotiated on aneconomy-wide basis between the organized sectors of labor and business.
Capital Controls and Exchange Controls. Capital controls, exchange controls andother capital management techniques have been utilized as mechanisms for re-ducing the sensitivity of domestic financial markets, including exchange rates,to macroeconomic policy. South Africa has a long history of utilizing thesepolicies. We argue that these controls can be successful in supporting efforts bythe Reserve Bank to lower nominal interest rates within the relatively small rangeof about 4 percentage points that we are proposing. In addition, severe bouts ofexchange rate volatility will be less likely when capital management policies aredeployed to prevent such episodes.
GOVERNMENT SPENDING PROGRAMSAND TAX POLICY
Increased Spending. The programs we are advocating would entail annual in-creased government expenditures of roughly R20 – 30 billion (in 2004 prices):
1. Public investment/infrastructure: R5 – 7.5 billion2. Income transfers and social support: R10 – 20 billion3. Credit subsidies to businesses to promote accelerated employment growth:
R 5 – 7.5 billion
Increased Revenues. These programs should be paid for in two roughly equalparts. About R14 billion would come through increasing the structural fiscaldeficit from approximately 2 to 3 percent of GDP. The remainder R16 billionwould be paid for through raising taxes, such that the tax revenue/GDP ratio
Brief Highlights of Major Proposals xvii

would rise from roughly 25 to 26 percent. The increased revenues should comefrom these sources:
1. R6 billion from the three major revenue sources: personal income tax, cor-porate profit tax, and VAT.
2. R10 billion from three additional sources:A) R6 billion from extending the Uncertified Securities Tax to bond trad-
ing. At present, the tax only covers stock trading.B) R2.5 billion from enacting the Mineral and Petroleum Royalty Bill
drafted by the National Treasury in 2003.C) R1.5 billion from raising economic growth to 5.3 percent from 3 per-
cent and from lowering poverty rates, which in turn reduces demandfor social service spending.
Additional Policies for Productive Sectors
In addition to the targeting of industries based on their employment multipli-ers, we also propose two other areas of sectoral policy:
1. Administered pricing. More effective measures to control price setting inmonopolistic and oligopolistic markets, including the administered pricingof parastatals and import parity pricing in the domestic steel industry.
2. Promoting some capital-intensive industries with low employment multipliers.We discuss the motor vehicle industry and sectors of capital goods produc-tion, because of their potential to enhance productivity and capacity to pro-duce import-competing capital goods.
NOTE
1. We have seen the acronym for the Accelerated and Shared Growth Initiative for South Africapresented in two ways: as all capital letters, ASGISA, the more conventional way of presentingacronyms; and as AsgiSA. For consistency with other acronyms in the study (such as GEAR),we are using the conventional style throughout.
An Employment-Targeted Economic Program for South Africaxviii

An Employment-Targeted EconomicProgram for South Africa:Summary of Major Findings and Proposals
This volume outlines a pro-poor, employment-focused economic policy frame-work for South Africa. Its specific focus is the severe problem of mass unem-ployment in South Africa today. Unemployment in South Africa was between26.5 and 40.5 percent as of March 2005, depending on whether one uses the“official” or “expanded” definition of unemployment (with the expanded defi-nition including so-called “discouraged workers”). Our concentration on theproblem of mass unemployment is fully consistent with the stated goals of thecurrent African National Congress (ANC) government. At the Growth andDevelopment Summit in 2003, President Thabo Mbeki singled out “more jobs,better jobs, and decent work for all” as one of the country’s four key economicchallenges. Currently, the preliminary presentations of the Government’s neweconomic policy framework, the “Accelerated and Shared Growth Initiative forSouth Africa” (ASGISA), affirms its commitment to cutting the unemploy-ment rate in half by 2014.
Following an introductory first chapter, the main body of this work consistsof two short chapters that lay out basic concerns, then two substantially longerchapters presenting the framework for policy analysis and specific policy pro-posals.
Chapter 2 presents evidence on the scope of the unemployment problem inSouth Africa today, considering the unemployed by gender, race, region, lengthof joblessness and age. It then examines how the country’s problem of massunemployment can be usefully conceptualized in simple accounting terms—namely, as the result of 1) insufficiency in the rate of output growth, i.e., theeconomy’s production of goods and services; and 2) a declining number of jobsbeing created per unit of output.
Chapter 3 examines supply-side perspectives on employment expansion.The fact that the South African economy is experiencing both high unemploy-ment and rising capital intensity of production suggests to some analysts bothan explanation for high unemployment and a solution to the problem. For theseanalysts, the explanation for the problem is straightforward: businesses will not
xix

hire more workers because they are convinced that the costs of doing so willexceed the benefits. Businesses therefore choose either to 1) maintain their op-erations at a lower level than they would if the benefits of hiring more workersexceeded the costs; or 2) increase the use of machines in their operations as asubstitute for employing workers as their preferred means of expanding theiroperations. Seen from this perspective, the solution to the problem of unem-ployment is also straightforward: lower the costs that businesses face in hiringmore workers.
In general, there are four possible ways in which the costs to businesses ofhiring workers could fall: 1) workers receive lower overall compensation, in-cluding wages and benefits; 2) the industrial relations system and labor marketregulations—including laws and regulations regarding workers rights to orga-nize, conflict resolution, and hiring and firing—operate with more flexibilityfor business; 3) workers perform their workplace operations at a higher level ofproductivity or; 4) the government absorbs some portion of the costs of hiringworkers. In most discussions that consider the sources of unemployment fromthis business cost-oriented perspective, the focus generally is on the first way toreduce business costs, i.e., to lower wages and benefits for workers relative toboth other input costs and the prices at which businesses can sell their finalproducts.
This study argues that the evidence linking mass unemployment to highlabor costs is not persuasive. We also argue that wage cutting as a policy ap-proach is certain to elicit strong resistance, which in turn will worsen thecountry’s investment climate. At the same time, we do support measures tomaintain wage increases in line with productivity growth and to improve theefficiency of the industrial relations system. This study also introduces a pro-posal for a hybrid program of credit and employment subsidies as a meansthrough which the government will effectively absorb a share of businesses’labor costs.
Chapter 4 considers the demand-side forces in South Africa’s economy thatwill need to be mobilized to achieve faster economic growth and greater laborintensity. In terms of growth, the report discusses all four components of theconventional national income identity that, taken together, define economicgrowth—i.e., private investment, private consumption, net exports, and gov-ernment spending. The report places particular stress in this section on thegrowth-enhancing effects of expanding public infrastructure investments. In-deed, public investment could expand both output and private sector produc-tivity, and could correspondingly increase private investment and export com-petitiveness. It is significant that the ASGISA program also emphasizes theneed for expanded public investment.
In considering ways to increase the labor intensity of growth, the reportexamines two basic approaches. The first is the Expanded Public Works Pro-
An Employment-Targeted Economic Program for South Africaxx

gram (EPWP) now being implemented by the national government. The sec-ond approach is to encourage accelerated growth in business activities withinSouth Africa that are capable of generating large increases in employment. Thereport examines the relative labor intensity of various industries in South Africaas well as the “employment multipliers” of industries, i.e., their capacity to gen-erate relatively large numbers of new jobs through their upstream links withother business firms in the country.
Chapter 5, which concludes the study, considers specific policy tools thatcan be deployed to promote faster growth, rising labor intensity and povertyreduction. It considers policy interventions in the following areas: fiscal policy,monetary policy, credit subsidies, and development banking; capital market andexchange rate controls; inflation control; and sectoral policies in the areas of a)monopolistic pricing and b) promoting growth of selected productivity-enhanc-ing and import-substituting capital-intensive industries on grounds other thanemployment benefits.
Our major findings and recommendations are as follows:
1. Between 1994 and 2004—i.e., since the end of apartheid—the South Afri-can economy grew at an average annual rate slightly above three percent.As we see in Figure S.1, this is a major improvement over the country’sdismal 0.9 percent average growth rate over the last decade of apartheid. At
-4
-2
0
2
4
6
1984 1986 1988 1990 1992 1994 1996 1998 2000 2002 2004
Ann
ual g
row
th r
ate
Figure S.1 Real Growth Rate of South Africa GDP, 1984-2004
Source: South Africa National Accounts.South African Reserve Bank Quarterly Bulletin, December 2005.
Average growth beforedemocratic transition = 0.9%
Average growth afterdemocratic transition = 3.1%
APARTHEID ENDS 1994
Summary of Major Findings and Proposals xxi

the same time, a 3 percent growth rate is only about one percent faster thanSouth Africa’s average rate of population growth. As such, a 3 percentgrowth rate by itself is not nearly adequate to deliver major improvementsin average living standards. In addition, average labor intensity of production—as measured by theratio of employment per R1 million in output—has been falling sharply inSouth Africa. The average decline between 1994 and 2001 was nearly fourpercent per year, a substantial acceleration over the longer trend decline ofabout one percent per year from 1967 to 2001. We can see this long-termpattern in Figure S.2. If the South African economy proceeded along ap-proximately this growth path for the next decade, it would not be possiblefor the government to achieve its stated goal of reducing unemployment byhalf by 2014. Making reasonable assumptions about labor force growthand the proportionate rise of informal versus formal employment, the re-port projects that continuing for the next decade at a three percent growthrate and a one percent annual decline in labor intensity would produce anofficial unemployment rate by 2014 in the range of 33 percent.
2. For the government to achieve a 50 percent reduction in unemployment by2014 will require an aggressive employment-targeted program that increasesboth the rate of economic growth and the labor intensity of growth. How-ever, even under an aggressive program such as this report describes, theunemployment rate as of 2014 is still likely to be in the range of 15 percent.This means that other measures besides employment growth are needed toimprove living conditions for the poor. We therefore support significantincreases in government social expenditures and income transfers, even whilerecognizing the large fiscal commitments that the Government is alreadymaking in these areas. We show how increased spending in these areas canbe achieved through only modest increases in the conventional sources oftax revenue.
3. The logic of the employment-targeted program that we propose is as fol-lows. It divides the South African economy into two broad categories—subsidized and unsubsidized activities. The subsidized activities will be eli-gible to receive credit on highly concessionary terms, based on both a largeexpansion of the government’s current development banking activities anda large-scale program of loan guarantees administered by the private bank-ing system. Overall, these subsidized activities should account for roughly20–25 percent of all new investment spending in the South African economy.Small-scale agriculture, small and medium sized businesses, and coopera-tive businesses would all be eligible for this subsidy program. In addition,any other businesses could qualify for this subsidy if they could demon-strate their capacity either to raise the labor intensity of output or to gener-ate large employment multipliers. Some of the activities that are likely to
An Employment-Targeted Economic Program for South Africaxxii

qualify for such subsidies are within the industries identified by the pre-liminary presentations of the ASGISA program as “priority” areas. Theseinclude agro-processing (such as biofuels) and tourism. We estimate thatsectors receiving large credit subsidies should be capable of growing at anaverage annual rate of about eight percent through 2014.
The idea of providing subsidies for activities that are either labor in-tensive or capable of generating large employment multipliers builds on theapproach of the current EPWP program. But the EPWP in its currentform is too modest in scale. According to one estimate, the public infra-structure component of the program that is scheduled to receive 75 per-cent of the program’s total budget will generate roughly 80,000 net newjobs per year. As of March 2005, creating a net increase of 80,000 new jobswould have led to a reduction in the unemployment rate from 26.5 to 26.0percent.
4. For the 75–80 percent of business activities in South Africa that would notreceive credit subsidies, the report proposes that growth of output shouldbe accelerated to an average annual rate of roughly 4.5 percent through2014. This is a rate that could be achieved through a fairly small relaxationof the government’s fiscal and monetary stances—that is, a relaxation thatwill not create significant problems either in terms of inflation or the ex-change rate. If we combine the eight percent growth rate for subsidized
4
5
6
7
8
9
1968 1972 1976 1980 1984 1988 1992 1996 2000
Jobs
/R1
mill
ion
in o
utpu
tFigure S.2 Ratio of Formal Employment to GDP in South Africa, 1967-2001(number of formal jobs per R1 million in output)
Source: Reserve Bank of South Africa.
Before democratic transition Afterdemocratictransition
Summary of Major Findings and Proposals xxiii

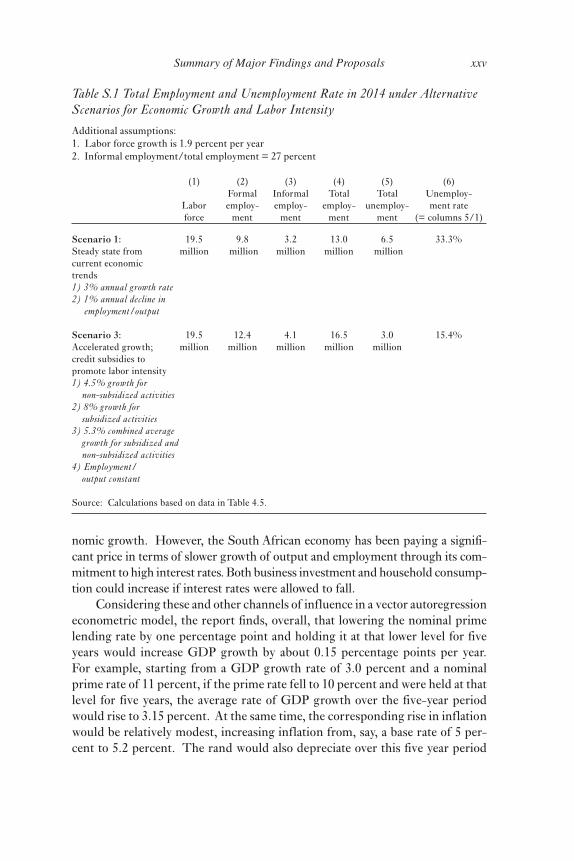
activities with a 4.5 percent growth rate for the remaining 75–80 percent ofthe economy, the result would be an overall average growth rate of 5.3 per-cent between 2005 and 2014. We note that this average growth path over2005–2014 is nearly identical to that being projected in the preliminarypresentations of the ASGISA initiative. Assuming this growth projectioncan be sustained over the next decade, and also making reasonable assump-tions about labor market growth and the ratio of formal to informal economyjobs, this report estimates that South Africa’s official unemployment ratecould fall to roughly 15.4 percent by 2014. Table S.1 below provides thebasic assumptions, data and calculations through which we generated ouralternative estimates of the unemployment rate as of 2014.
The report utilizes a series of conventional policy tools to achieve theseobjectives. These measures will promote growth, employment expansion andpoverty reduction while maintaining stability of inflation and the exchange rate.
Fiscal Stimulus. Because of the high levels of government debt incurred dur-ing the apartheid era, the ANC government understandably chose to establish atight fiscal stance in the initial years of post-apartheid democracy. The deficit asa share of GDP fell to a low of 1.1 percent in 2002. According to its 2005 Me-dium Term Budget Policy Statement (MTBPS), the National Treasury has pro-jected a fiscal deficit in the range of two percent of GDP through 2008-09.However, in its 2004 MTBPS, the Treasury had projected a more relaxed fiscalstance, in the range of three percent of GDP through 2006/07, and somewhathigher figures still for the full Public Sector Borrowing Requirement. This ear-lier proposal for a more expansionary, but still prudent, fiscal stance would con-tribute positively to economic growth, since it would mean an additional injec-tion into the economy of roughly R14 billion per year (in 2004 prices) relative tothe baseline of a deficit at two percent of GDP. At the same time, even with athree percent deficit/GDP ratio, South Africa would still remain within therange of performance of other lower-middle income countries. The averagefiscal deficit for these countries over 1990–2001 was 2.6 percent of GDP.
Monetary Stimulus. The South African Reserve Bank and ANC-led govern-ment have been committed to tight monetary policies since assuming office in thehistoric transition of 1994. This commitment was strengthened through the adop-tion, in two stages between 1998 and 2000, of an inflation-targeting regime, withthe CPIX inflation target being set at 3–6 percent per year.1 The preliminarypresentations of the ASGISA program confirm continued support for a 3–6 per-cent inflation target. The primary policy instrument that the government utilizesto control inflation is adjusting interest rates and, more precisely, raising interestrates to dampen the inflationary pressures that might result from more rapid eco-
An Employment-Targeted Economic Program for South Africaxxiv
nomic growth. However, the South African economy has been paying a signifi-cant price in terms of slower growth of output and employment through its com-mitment to high interest rates. Both business investment and household consump-tion could increase if interest rates were allowed to fall.
Considering these and other channels of influence in a vector autoregressioneconometric model, the report finds, overall, that lowering the nominal primelending rate by one percentage point and holding it at that lower level for fiveyears would increase GDP growth by about 0.15 percentage points per year.For example, starting from a GDP growth rate of 3.0 percent and a nominalprime rate of 11 percent, if the prime rate fell to 10 percent and were held at thatlevel for five years, the average rate of GDP growth over the five-year periodwould rise to 3.15 percent. At the same time, the corresponding rise in inflationwould be relatively modest, increasing inflation from, say, a base rate of 5 per-cent to 5.2 percent. The rand would also depreciate over this five year period
Table S.1 Total Employment and Unemployment Rate in 2014 under AlternativeScenarios for Economic Growth and Labor Intensity
Additional assumptions:1. Labor force growth is 1.9 percent per year2. Informal employment/total employment = 27 percent
(1) (2) (3) (4) (5) (6)Formal Informal Total Total Unemploy-
Labor employ- employ- employ- unemploy- ment rateforce ment ment ment ment (= columns 5/1)
Scenario 1: 19.5 9.8 3.2 13.0 6.5 33.3%Steady state from million million million million millioncurrent economictrends1) 3% annual growth rate2) 1% annual decline in employment/output
Scenario 3: 19.5 12.4 4.1 16.5 3.0 15.4%Accelerated growth; million million million million millioncredit subsidies topromote labor intensity1) 4.5% growth for non-subsidized activities2) 8% growth for subsidized activities3) 5.3% combined average growth for subsidized and non-subsidized activities4) Employment/ output constant
Source: Calculations based on data in Table 4.5.
Summary of Major Findings and Proposals xxv

but, again, only by a modest amount, namely, falling on average by about 0.6percent per year relative to the dollar.
Based on these rough estimates, the report proposes that the Reserve Bankmaintain lending rates at four percentage points below their current levels,which would then raise the average GDP growth rate from the base of threepercent to somewhere around 3.6 percent over a five year policy timeframe.The resulting effects on inflation and the exchange rate would remain rela-tively modest.
However, the four percentage point decline in lending rates would not, byitself, induce an adequate increase in economic growth for the 75–80 percent ofthe economy that is not receiving credit subsidies. But in our judgment, allow-ing the fiscal deficit to rise to roughly three percent of GDP should provide theremaining stimulus to move the unsubsidized segments of the South Africaneconomy to the target 4.5 percent growth path.
Public Credit Allocation and Development Banking. The key mechanismthrough which the report proposes to generate an eight percent growth stimu-lus for 20–25 percent of the economy is to provide credit on a subsidized basis.We develop a formula for establishing an appropriate subsidized interest rate,based on 1) the proportion of a loan that the government is guaranteeing and 2)the difference between market interest rates and government bond rates thathave no default risk.
The report proposes three main policy tools to channel credit to the tar-geted industries at concessionary rates.
1. A major expansion in the lending activity and developmental focus of the country’scurrently operating development banks. The Industrial Development Corpo-ration is South Africa’s largest development bank. Its 2005 Annual Reportreported that through its lending activity over 2004-05, it anticipated creat-ing 16,700 jobs. This is far too modest a contribution for such an importantinstitution, given that the official statistic of 4.3 million unemployed peoplein 2005 is 257 times larger than this 16,700 figure. The capitalization ofthese banks therefore needs to increase and they should be allowed to as-sume a higher level of risk on behalf of an employment-targeted growthagenda.
2. The establishment of so-called “asset reserve requirements” for private banksand other financial institutions. Asset reserve requirements require that fi-nancial institutions hold a designated proportion of their assets in loans topriority areas or else hold the same proportion of their total assets in asterile cash reserve account. For example, applying our subsidy policy wouldstipulate that banks should hold 25 percent of their loan portfolio in desig-nated subsidized activities. If the subsidized activities did not account for
An Employment-Targeted Economic Program for South Africaxxvi
at least 25 percent of the banks’ total loan portfolio, the banks would thenneed to cover this gap by holding cash. Features of this proposal are compa-rable to the system of “prescribed assets” that operated in South Africafrom 1956 to 1989. However, this report proposes measures to operate thissystem more flexibly—for example, through allowing banks that hold morethan 25 percent of their loans in subsidized activities to sell permits to in-stitutions whose targeted industries account for below the 25 percent mini-mum of subsidized loans.
3. A major expansion of the government’s system of loan guarantees. For thegovernment’s current loan guarantee program, the accruals on its contin-gent liabilities—i.e., the amounts that the government actually pays whenloans default—has been a trivial cost, amounting, on average, to 1/100 ofone percent or less over the recent past. We examine a program of thefollowing magnitude: the government underwrites about R40 billion peryear in loans, i.e., a figure approximately equal to 25 percent of fixed capitalformation as of 2004. We then assume a default rate on these loans of 15percent and loan guarantees that cover 75 percent of the principal on de-faulted debts. Under this scenario, it follows that the accruals to the Gov-ernment would amount to R4.5 billion/year (i.e., R40 billion x .15 x .75).This is a crucial result. It shows that the government has the capacity tounderwrite a major loan guarantee program, equivalent to roughly 25 per-cent of productive investment in the economy, with a financial commit-ment of no more than 1-2 percent of its fiscal budget.
Controls on Exchange Rates and Capital Flows. Exchange rate variabil-ity can create significant problems for monetary policy. Excessive deprecia-tions could raise inflation rates, while excessive appreciations could generatelost output, profits and employment in some industries. Variability itself canalso be harmful by generating more uncertainty and thereby possibly discour-aging private investors.
All of these issues will become central if South Africa commits itself to amore expansionary set of fiscal, monetary and credit allocation policies—i.e., aset of measures that could effectively support an employment-targeted program.Policymakers will of course have to take seriously the possibility that financialmarket investors might react negatively to such a program, and might sell offtheir holdings of rand. Such a reaction could occur entirely as a result of a shiftin investors’ perceptions, regardless of whether the fundamental indicators ofeconomic stability—such as fiscal deficits and the inflation rate—may changeby only the relatively modest amounts this report is projecting.
Capital controls, exchange controls and other capital management tech-niques have been utilized as mechanisms for reducing the sensitivity of domes-tic financial markets, including sensitivity of exchange rates, to macroeconomic
Summary of Major Findings and Proposals xxvii

policy. For South Africa, such measures could potentially serve, at least, topartially insulate the economy against any negative reactions by financial mar-kets to an employment-targeted economic program. The key question for SouthAfrica then is: to what extent and under what conditions can capital manage-ment interventions enhance the autonomy of macroeconomic policy, includingby helping to manage exchange rates?
In our view, such measures are capable, at least, of supporting efforts by theReserve Bank to lower nominal interest rates within the range of about fourpercentage points that we are proposing. In addition, severe bouts of exchangerate volatility will be less likely when capital management policies are deployedto prevent such episodes. The fact that South Africa has a long history of oper-ating exchange and capital controls enhances the prospect that such measurescould be used effectively to support a more expansionary set of fiscal, monetary,and credit allocation policies. At the same time, in part because such measuresare again becoming increasingly common as a form of macroeconomic manage-ment, they would not suggest that South Africa is moving away from its gener-ally open interactions with global markets.
Inflation Control and Economic Growth. The government clearly appearscommitted to the idea that maintaining a low inflation environment is a neces-sary foundation for attacking poverty and unemployment in a sustainable way.We certainly do not advocate a high inflation rate or a relaxation of the inflation-targeting regime as ends in themselves. However, the primary tool that thegovernment utilizes to control inflation is to maintain high interest rates. Bycontrast, we have advanced measures to lower interest rates—both across theboard, and also through providing concessionary borrowing rates for industrieswith high employment multipliers. This report anticipates that a likely effect ofsuch measures will be for inflationary pressures to develop beyond the recentlevels common under the inflation-targeting regime.
The question that the report therefore examines is: how severe would bethe costs to the South African economy of allowing the inflation rate to riseabove its current target range of 3–6 percent? Recent research on this generalissue had been pioneered by the late Michael Bruno, who had served both asGovernor of the Bank of Israel and Chief Economist of the World Bank. In his1995 World Bank study, Bruno analyzed the relationship between inflation andeconomic growth for 127 countries between 1960 and 1992. He found that aver-age growth rates fell only slightly as inflation rates moved up to 20–25 percent.Of particular importance for policymaking in South Africa, Bruno found thatduring 1960–72, economic growth on average increased as inflation rose fromnegative or low rates to the 15–20 percent range. This is because, as Brunoexplained, “in the 1950s and 1960s, low-to-moderate inflation went hand in handwith very rapid growth because of investment demand pressures in an expand-
An Employment-Targeted Economic Program for South Africaxxviii

ing economy,” (1995, p. 35). That is, demand-pull inflation, resulting from aprocess of economic expansion, was positively associated with growth as long asthe inflation rate remained moderate.
Many researchers have subsequently examined the issue, a minority chal-lenging Bruno’s findings. This study developed its own model of the growth-inflation relationship, whose results broadly affirm Bruno. And while a consen-sus has not been established on the issue, a few basic conclusions from the rangeof studies, including the one for this report, do seem warranted. One is that,regardless of whether researchers observe a negative growth-inflation relation-ship emerging in the double-digit range for developing countries, there is onlynegligible evidence showing a negative relationship between growth and single-digit inflation. In addition, no researcher has challenged Bruno’s point that therelationship between inflation and growth will be different depending on whatis causing the economy’s inflationary pressures. Thus, if South Africa pursuesan aggressive employment-targeted program, one would expect that the infla-tionary pressures that might then emerge would not be harmful to growth, aslong as policies maintain inflation at a moderate level.
But what happens if inflation accumulates momentum, such that a rise to,say, a 10 percent inflation rate leads to still greater inflationary pressures?Should South Africa then revert to raising interest rates, i.e., its standard policytool at present for controlling inflation? In fact, two other policy tools areavailable for use. The first tool would be to pursue measures that weaken themonopolistic pricing power that now characterize some sectors of the economy.The second tool would be to pursue so-called ‘incomes policies.’ Incomespolicies have been developed in various ways across countries, but the basicidea is straightforward: wage and price increases are negotiated over aneconomy-wide basis between the organized sectors of labor and business. In-comes policies can also be beneficial more generally in improving the effi-ciency of the country’s industrial relations system and the implementation ofits labor-law regulations.
The most basic critique of incomes policies is that in order for the ap-proach to have any chance of success, it is necessary that workers achieve ahigh level of organization and that there be some reasonable degree of com-mon ground for negotiations between workers and business. Otherwise, therewould be no realistic prospect for economy-wide bargaining that could yieldresults that would be honored widely. In the case of South Africa, a highdegree of organization does exist both among sectors of the working class andamong business. However, the relationship between unions and business ishighly contentious. This could possibly diminish to the extent that both sidesrecognize the obvious benefits of a program of accelerated economic growthand employment expansion.
Summary of Major Findings and Proposals xxix

Government Spending Programs and Tax Policy. Beyond providing a fis-cal stimulus, the government obviously would play a crucial role in an employ-ment-targeted program through its spending priorities and tax programs. Theprograms that this report is advocating would entail annual expenditures of R20-30 billion (in 2004 prices), broken down as follows:
1. Public investment in infrastructure: R5–7.5 billion2. Income transfers and social support: R10–20 billion3. Credit subsidies to businesses to promote accelerated employment growth:
R5–7.5 billion
This report supports the idea of raising the structural fiscal deficit fromtwo percent to three percent of GDP. If the Treasury did operate with thishigher deficit, that alone would cover about R14 billion/year, i.e., roughly halfof the total spending increase implied by our high end figure of R30 billion.Raising the additional R16 billion would have to come primarily from morerevenue. This would raise South Africa’s tax revenue/GDP ratio from the 2004rate of 24.7 percent to roughly 25.8 of GDP.
An increase to a roughly 26 percent ratio would still place South Africa wellbelow the ratios for lower-income OECD countries, such as Greece (45.1 per-cent) and Poland (41.8). It would also put South Africa roughly in line with agroup of rapidly growing Asian economies, including Singapore (29.0 percent),Republic of Korea (28.4 percent) and Malaysia (22.2 percent). None of theseother countries necessarily provides a particularly appropriate comparison toSouth Africa. But the key point is that neither the nearly 25 percent ratio atwhich South Africa currently operates nor an increase to 26 percent would es-tablish South Africa as a significant outlier either among the OECD or Asiancomparison groups.
Of the R16 billion/year that would need to be raised through additionalrevenue, the report argues that about R6 billion could be raised through in-creasing rates modestly on the government’s three major revenue sources, thepersonal income tax, the corporate profit tax and the VAT. However, the otherR10 billion could be raised through three other sources. The first would be toextend the current Uncertified Securities Tax, which now applies only to stocktrading, to the bond market as well. This is done in several comparison coun-tries such as Brazil, Chile, Malaysia, and Morocco. We conservatively esti-mate that such a tax could raise roughly R6 billion per year. A second sourcewould be enacting the Mineral and Petroleum Royalty bill that was drafted bythe Treasury in 2003. We estimate that this royalty would generate anotherR2.5 billion.
Finally, assuming that the economy’s growth would rise from a three per-cent trend to a 5.3 percent trend through an employment-targeted program, we
An Employment-Targeted Economic Program for South Africaxxx

conclude that tax revenues of about R6.5 billion would result because of higherincomes. Such a rise in incomes will also bring reductions in the government’sexpenditures on income support payments, given that employment will increaseand poverty will decline. But in our calculations we allow for only a modest netfiscal contribution since the Treasury has already factored in a significant growthdividend in its fiscal projections through 2008-09.
Policies for Productive Sectors. In addition to subsidizing activities forthe expressed purpose of accelerating employment growth, this report con-siders two other concerns within the realm of sectoral policy. The first dealswith the costs incurred through monopolistic pricing power and the adminis-trative determination of prices. The administrated prices of the parastatals —the publicly-owned utilities and economic services industries — are a case inpoint. Enterprises such as Eskom (electricity), Transnet (transportation), andTelkom (telecommunications) provide essential inputs and services to sectorsthroughout the South African economy. However, prices are poorly regulatedand are not effectively coordinated with national policy objectives. Prices areoften the outcome of a process of negotiation rather than an integrated regu-latory framework. For example, large industrial users of electricity are able tonegotiate more favorable rates than smaller commercial enterprises. This ef-fectively subsidizes the costs of production for larger firms, at the expense ofsmaller-scale users.
Such pricing practices therefore act to counter efforts to promote smallenterprises and cooperatives. Similar problems with administered prices ex-ist for other critical segments of the economy. For example, the practice of“import parity pricing” enables steel producers to set prices at the interna-tional price plus tariff and transportation costs rather than at the price thatwould reflect domestic production conditions. Such practices raise barriersto the success of an employment-targeted program. At the same time, com-mon blanket solutions, such as privatization, are not likely to resolve theseproblems. Many of these industries are “natural monopolies” that requireregulation regardless of who owns the assets. Thus, establishing a coherent setof such regulations will be critical to the long-term viability of an employ-ment-targeted program.
The second concern that the report addresses is that of promoting someindustries even when their employment multipliers are weak. Such measuresrelate to both the motor vehicles industry and the capital goods industry. Whileneither industry should be targeted for accelerated expansion on the basis ofits employment multipliers, there are other grounds on which they should bepromoted. In particular, it would clearly be crucial over the next decade forthe South African economy to continue enhancing productivity and the ca-pacity to produce import-competing capital goods. This is so even if
Summary of Major Findings and Proposals xxxi

policymakers remain focused on employment creation as their primary objec-tive. Indeed, implementing an effective employment-targeted program shouldindeed enhance the capacity of policymakers to advance a broader economicpolicy agenda, since they can pursue other objectives—such as building a com-petitive capital goods industry—without neglecting the imperatives of job cre-ation and poverty reduction.
NOTE
1. The CPIX consumer price index excludes interest rates on mortgage bonds, which are in-cluded in the CPI measure. The CPI measure is the so-called “headline” inflation rate.
An Employment-Targeted Economic Program for South Africaxxxii

1. Introduction
Following the overarching programmatic commitments of the United NationsDevelopment Program in the field of economic policy, our project is an effort tooutline a pro-poor economic policy framework for South Africa today.1 We aim todevelop a program that will be coherent and workable within the current politicaland economic framework, while also being effective as a tool for expanding jobopportunities, reducing poverty, and spreading well-being as broadly as possible.
The specific focus of our study is the severe problem of mass unemploy-ment in South Africa today. Depending on whether one considers thegovernment’s “official” or the “expanded” definition of unemployment, theunemployment rate stood between 26.5 and 40.5 percent as of March 2005.The difference between the official and expanded definitions of unemploymentis that the expanded definition includes “discouraged” workers—i.e. people whoself-identify as wanting work and are available for work but who had not takenactive steps to find work in the four weeks prior to having been surveyed by thegovernment. From March 2004 to March 2005, the official unemployment ratedid fall, from 27.9 to 26.5 percent. This decline in official unemployment iscertainly a meaningful development. But these gains are, of course, modest, andthe problem of mass unemployment remains.
Our concentration on the problem of mass unemployment is fully consis-tent with the stated goals of the current African National Congress (ANC)-ledgovernment. Thus, at the Growth and Development Summit in 2003, Presi-dent Thabo Mbeki singled out “more jobs, better jobs, and decent work for all,”as one of the country’s four key economic challenges (the other three beingexpanding investment, advancing equity, and building local-level capacity;Growth and Development Summit summary pamphlet, Department of Labor, p.3). More specifically, according to presidential economic advisor Alan Hirsch,the government has committed itself, as its first economic priority, to reducingunemployment by half as of 2014 (Hirsch 2004).
Employment is the most important source of potential income for the ma-jority of South Africans. This fact establishes a fundamental link between un-employment and poverty: that joblessness is the single greatest cause of masspoverty and, correspondingly, reducing unemployment would be the single mosteffective means of reducing poverty. This does not mean that a program of jobcreation alone will be sufficient as a tool for fighting poverty in South Africa. As
1

An Employment-Targeted Economic Program for South Africa2
we will discuss below, substantial increases in social welfare spending are alsoneeded at present to eliminate the most extreme forms of destitution, and toprovide the impoverished with the minimum means—in terms of nutrition lev-els, among other things—to effectively participate in the labor force. However,increased social welfare spending, on its own, is also not capable of carrying theburden of effectively fighting poverty. Indeed, social welfare spending becomesincreasingly effective when employment opportunities expand for the poor, since,with expanding employment opportunities, the burden of fighting poverty willlighten for any kind of cash transfer program.
And thus, toward the aim of advancing a “pro-poor” economic policy ap-proach in South Africa, we return to the imperative of developing an effectiveprogram of employment creation as one of the two most important policy inter-ventions that the government should pursue. The other fundamental policyconcern is to attack the country’s HIV/AIDS pandemic. But our study doesnot focus on the many pressing issues related to HIV/AIDS.
The program we advance can be termed “employment targeted.” Our no-tion of an “employment targeted” economic program stands in clear contrastwith the ascendant approach, in South Africa and elsewhere, of formulatingeconomic policy, macroeconomic policy in particular, within a framework of“inflation targeting.” We fully recognize the need to prevent excessive infla-tionary pressures from gaining momentum in South Africa and elsewhere. Atthe same time, we observe that establishing the primacy of inflation control as apolicy goal is inhibiting the growth of decent job opportunities and the possibil-ity of seriously reducing poverty. Thus, our “employment targeted” approachseeks to strike a workable balance between inflation control and the imperativeof creating more jobs and reducing poverty. As we try to show, major gains inemployment opportunities and poverty reduction are attainable in South Africawithout threatening the onset of a destructive inflationary spiral. And as wealso show, if the South African economy continues to operate with its existingpolicy package along its current trajectory, the likelihood is high that the officialunemployment rate will be substantially above 30 percent by 2014.
As we write, the government of South Africa is developing its own plan for anambitious new economic program, the “Accelerated and Shared Growth Initia-tive for South Africa,” (ASGISA). We are familiar with the still preliminary plansfor this program through early public presentations and discussions with officialsat the National Treasury.2 To our knowledge, the ASGISA, at least in its prelimi-nary form, remains committed to halving the unemployment rate as of 2014. Italso projects a sustained increase in South Africa’s average GDP growth rate, to4.5 percent between 2005 – 09 and to 6.0 percent between 2010 – 2014. Theseoverall goals are certainly consistent with the program we develop here. More-over, as we will discuss, there are major common elements between our programand specific features of the ASGISA, in its preliminary form.

3Introduction
Following this introductory Chapter 1, the study consists of two short chap-ters that lay out basic concerns, then two substantially longer chapters present-ing our framework for policy analysis and our specific policy proposals. InChapter 2, we present evidence on the scope of the unemployment problem inSouth Africa today, considering the unemployed by gender, race, region, lengthof joblessness and age. We also examine how the country’s problem of massunemployment can be usefully conceptualized in simple accounting terms—asthe result of 1) insufficiency in the rate of output growth—i.e. the economy’sproduction of goods and services, and 2) a declining number of jobs being cre-ated per unit of output. We show the importance of both increasing the rate ofoutput growth and raising the ratio of jobs created per unit of output—what istermed the labor intensity ratio—as the basis for any significant reduction inSouth Africa’s unemployment rate. We finally also present evidence showingthat the South African economy’s growth path—at least between the years 1995– 2000 for which we have adequate data—has been associated with a broad de-cline in incomes, with the most severe income declines having been experiencedby the less well-off.
In Chapter 3, we examine supply-side perspectives on employment expan-sion. The fact that the South African economy is experiencing both high unem-ployment and rising capital intensity of production suggests to some both anexplanation for high unemployment and a solution to the problem. The expla-nation for the problem is straightforward: businesses won’t hire more workersbecause they are convinced that the costs of doing so will exceed the benefits.Businesses therefore choose either to 1) maintain their operations at a lowerlevel than they would if the benefits of hiring more workers exceeded the costs;or 2) increase the use of machines as a substitute for employing more workers astheir preferred means of expanding their operations. Seen from this perspec-tive, the solution to the problem of unemployment is also straightforward: tolower the costs businesses face in hiring more workers. However, we argue inthis chapter that the evidence linking mass unemployment to high labor costs isnot convincing. We also argue that wage cutting as a policy approach is certainto elicit strong resistance, which in turn will worsen the country’s investmentclimate. At the same time, we do support measures to maintain wage increasesin line with productivity growth and to improve the efficiency of the industrialrelations system. We also introduce here our proposal for a hybrid program ofcredit and employment subsidies as a means through which the government willeffectively absorb a share of businesses’ labor costs.
In Chapter 4, we consider the forces in South Africa’s economy that willneed to be mobilized to achieve three ends: 1) faster economic growth; 2) greaterlabor intensity of growth; and 3) poverty reduction. In examining the factorsthat could contribute to faster economic growth, we discuss all four compo-nents of the conventional national income identity which, taken together, define

An Employment-Targeted Economic Program for South Africa4
economic growth—i.e. private investment, private consumption, net exports,and government spending. In considering ways to increase the labor intensityof growth, we examine two basic approaches: the Expanded Public Works Pro-gram (EPWP) now being implemented by the national government; and pro-moting accelerated growth for those sectors of the South African economy thatwould generate relatively large numbers of new jobs, both within their own sec-tors and throughout the country more broadly. In terms of poverty reduction,we briefly consider measures to expand social expenditures and income trans-fers. The importance of such direct poverty-reduction measures is underscoredby the fact that, even under a highly favorable employment growth scenario overthe next decade, such as that projected by the ASGISA, there would still besomewhere between 13 – 20 percent of the workforce who are unemployed as of2014.
In the concluding Chapter 5, we then consider specific policy tools that canbe deployed to promote faster growth, rising labor intensity and poverty reduc-tion. We consider policy interventions in six areas: 1) fiscal policy; 2) monetarypolicy; 3) credit allocation and development banking; 4) capital market and ex-change rate controls; 5) inflation control; and 6) interventions tied to specificsectors of the economy.
NOTES
1. For an outstanding survey of recent research sponsored by the UNDP on pro-poor economicpolicies around the world, see Khan (2004).
2. The preliminary documents which we have examined are the November 2005 Power Point pre-sentation by Joel Netshitenzhe, “A Growing Economy that Benefits All” and an undated papertitled “Accelerated and Shared Growth Initiative for South Africa (ASGISA).” Beyond thesetwo documents, our project consultants Anna McCord and Stephen Gelb have held severaldiscussions on the program with various officials of the National Treasury. This study has alsobenefited from the April 2006 TIPS Working Paper by Davies and van Seventer, “An Economy-Wide Impact Assessment of the Economic Infrastructure Investment Component of the Accel-erated & Shared Growth Initiative (ASGISA).” We will refer to these documents further be-low.
2. The Nature of Mass Unemploymentin South Africa Today
WHO ARE THE UNEMPLOYED?
As noted at the outset, there are two basic ways in which unemployment is de-fined in South Africa today, through which we derive the divergent figures of26.5 percent versus 40.5 percent for the March 2005 unemployment rate. Theofficial definition of unemployment, which is based on the international stan-dard developed by the International Labour Organization ((ILO), refers to peoplewithin the economically active population who a) did not work during the priorseven days; b) want to work and are available to start work within a week; and c)have actively looked for work during the past four weeks. The expanded defini-tion includes those people who have not searched for work during the past fourweeks. Focusing for the moment on the more narrow official definition, what isbehind the 26.5 percent unemployment rate are these underlying facts: amongthe country’s 46.8 million people, 16.2 million, or 34.6 percent, are counted as“economically active.” Of these, 11.9 million have jobs and 4.3 million are un-employed.1
As we see in Table 2.1, the severity of unemployment differs by gender andpopulation group.2 Women consistently experience substantially higher rates ofjoblessness than do men. Among different population groups, Whites have thelowest unemployment rates (an average of 5.1 percent) and Africans have thehighest unemployment rates (an average of 31.6 percent). The unemploymentrates for the Coloured and Indian/Asian populations are significantly higherthan those of Whites (averaging 19.8 and 19.0 percent respectively).
The burden of unemployment also differs geographically, with the highestconcentration of unemployed workers being in rural areas. Table 2.2 presentsunemployment as of March 2005 by province using the official definition. Italso includes figures on discouraged workers as a percentage of the working-agepopulation as of March 2005. It finally also shows the percentage of the popu-lation in each province that is rural. As we see in the table, the official unem-ployment rate for the provinces ranged from 17.6 in the Western Cape to 32.4percent in Limpopo, a difference of 14.8 percentage points. Western Cape is thesecond most heavily urbanized province in the country while Limpopo is the
5

An Employment-Targeted Economic Program for South Africa6
most rural. The differences between the regions are still sharper in consideringdiscouraged workers. Thus, in the Western Cape, only 6.3 percent of the work-ing-age population are discouraged, whereas in Limpopo, discouraged workersaccount for 21.9 percent of the working-age population. Overall, the figures inTable 2.2 suggest that discouraged workers are even more heavily concentratedin rural areas than are the official unemployed.
The long-term unemployed constitute a sizeable share of the jobless popu-lation in South Africa, as we see in Table 2.3. Of all the officially unemployed
Table 2.1 Official Unemployment by Gender and Population Group, March 2005
Male Female TOTAL
African 26.7% 37.6% 31.6%Coloured 18.6% 21.2% 19.8%Indian/Asian 15.4% 22.6% 19.0%White 4.4% 5.9% 5.1%TOTAL 22.4% 31.4% 26.5%
Source: Labour Force Survey March 2005 (Pretoria: Statistics South Africa, July 2005).
Table 2.2 Unemployment, Discouraged Workers, and Rural Populationby Province
LFS, March 2005 2001 Census
Official Discouraged Percentunemployment workers rural population
Limpopo 32.4% 21.9% 86.7%KwaZulu-Natal 31.7% 13.1% 54.0%North West 28.8% 15.6% 58.2%Free State 30.6% 8.3% 24.2%Gauteng 22.7% 11.4% 2.8%Mpumalanga 27.4% 13.8% 58.7%Eastern Cape 27.1% 13.9% 61.2%Northern Cape 29.4% 11.5% 17.3%Western Cape 17.6% 6.3% 9.6%TOTAL 26.5% 13.0% 42.5%
Note: Discouraged workers are presented as a working-age population.Source: Labour Force Survey March 2005 (Pretoria: Statistics South Africa, July 2005) andInvestigation into Appropriate Definitions of Urban and Rural Areas in South Africa, StatisticsSouth Africa, Report 03-02-20, 2003, Table 3.1-1, p. 8.

7The Nature of Mass Unemployment in South Africa Today
individuals who have worked in the past, nearly 60 percent have been seekingwork for more than one year. Of those who have never worked before, approxi-mately 68 percent have been looking for work for more than one year. Past em-ployment experience greatly increases the probability of being employed. Only41 percent of the unemployed have worked before, compared to 59 percent whohave never worked. Of all the unemployed who have never worked in the past,76 percent are aged 15 to 30 years old.
The fact that many of the unemployed who have never worked are youngand that many of these young people remain unemployed for long periods oftime is representative of South Africa’s serious problem of youth unemploy-ment. Many young South Africans are caught in an unemployment trap. Theyneed labor market experience to get a job, but they need a job to gain labormarket experience. According to the March 2005 Labour Force Survey, indi-viduals aged 15 to 34 years account for 74.9 percent of all unemployed people inSouth Africa (official definition), but only 59.6 percent of the working age popu-lation 15 to 65 years old.
Differences exist among data series as to whether there has been an increas-ing or decreasing trend in unemployment over the past decade, and it is there-fore difficult to determine whether the employment problem is getting worse orbetter. Either way, what is clear from these figures is that the problem of massunemployment is a structural one, not simply a cyclical phenomenon. More-over, the employment figures alone do not adequately capture conditions forpeople in the labor market. For example, all workers engaged in so-called “in-formal” activities are counted as among the employed. Informal employment isgenerally defined as the set of remunerative activities that exist outside of theformal system of state regulation. This group includes street traders, domesticlaborers, industrial outworkers, small-scale manufacturers, and people self-em-ployed in agriculture. As of March 2005, those in informal, non-agricultural
Table 2.3 The Officially Unemployed by Duration of Job Seeking, March 2005
Worked before Never worked*
(41% of the unemployed) (59% of the unemployed)
Less than a month 9.2% 6.0%1 month to 3 months 12.2% 9.3%3 months to 6 months 9.7% 7.5%6 months to 1 year 10.4% 8.9%1 year to 3 years 22.9% 26.2%More than 3 years 35.7% 42.1%
* Of all unemployed persons who have never worked before, 76% of them are aged 15 to 30 years.Source: Labour Force Survey March 2005 (Pretoria: Statistics South Africa, July 2005).

An Employment-Targeted Economic Program for South Africa8
employment accounted for a full 24.5 percent of all employment.3 As anotherindicator of quality of employment opportunities, one study which finds em-ployment levels to have risen 1995 – 2003 still also concludes that average realmonthly earnings fell by more than 20 percent over this period (Casale, Mullerand Posel 2004).
By definition, the problem of mass unemployment has both supply- anddemand-side causes. But in terms of effectively addressing the problem in theshort-term as well as the long-term, the focus of our study will be on the de-mand side of the labor market, i.e. on measures that will substantially increasethe demand for the South African workers who are in the labor pool today.
This is not to neglect the crucial issues on the supply-side of the market.Two supply-side issues are central. The first is the low level of formal educa-tion, vocational training and job experience among the workforce. The secondis the contention that labor costs in South Africa are too high, especially relativeto countries that are its trade competitors.
In terms of the issue of education and training, we support the government’sinitiatives aimed at aggressively expanding and improving the country’s educa-tional opportunities and encourage more such measures (though we do not ex-amine this issue in this study). At the same time, there is also a clear link throughwhich expanding job opportunities—the demand for labor—will also enhancethe benefits of an improved system of education and training. Thus, workers inSouth Africa were long deprived of opportunities to acquire a decent education,skills, or to gain entrepreneurial initiative. The most effective way of creatingsuch opportunities now is in the context of an expanding economy, which offersopportunities for on-the-job training and other forms of learning-by-doing, in-cluding learning how to establish one’s own small or medium-sized enterprise.Such efforts will clearly be enhanced over time to the extent that opportunitiesgrow for a decent formal education.
The issue of labor costs in South Africa being too high has been widelydebated. The two interrelated questions considered are the extent to which: 1)excessively high wages are themselves responsible for mass unemployment; and2) the industrial relations system and labor market regulations are inefficient,discouraging business from expanding employment. We review the literatureon these questions at some length in Chapter 3 of our study. As we show, theavailable evidence suggests that these factors are not likely to have been majorcauses of South Africa’s current employment problems. Yet, there is a separatequestion as to whether reductions in labor costs for business and improvements inthe industrial relations system might support an agenda for employment expan-sion and economic growth into the future. We do endorse measures both to re-duce the costs of hiring workers and to improve the labor negotiating environment.Specifically, we describe a large-scale hybrid program of employment and creditsubsidies to reduce the costs of hiring more workers. We also discuss the intro-

9The Nature of Mass Unemployment in South Africa Today
duction of so-called “incomes policies” as a means of improving the environmentfor labor negotiations. We describe these measures both in Chapter 3, briefly, andthen at greater length in Chapter 5. At the same time, we develop both of theseproposals within the context of a broader program aimed at expanding the de-mand for labor and the rate of economic growth. Given the evidence we review inChapter 3, we are persuaded that supply-side measures on their own are not likelyto generate large employment growth and welfare gains.
Thus, we now turn our attention to examining the issue of employmentfrom the perspective of labor demand. Within this perspective, the problem ofmass unemployment can be seen clearly in terms of a simple identity. That is,the insufficiency of demand for labor results from a combination of two factors:1) insufficiency in the rate of output growth, and 2) a ratio of labor demand perunit of output—i.e. the degree of labor intensity under current productionmethods—that is too low. In fact, we can observe from the data both the prob-lem of insufficient levels of output growth and a decreasing level of labor inten-sity.
Slow economic growth. In Figure 2.1, we see the pattern of GDP growthbetween 1984 – 2004, i.e. including both the decade prior to the 1994 end ofapartheid and the subsequent 11 years of democratic transition. As we see,GDP growth has improved significantly in the democratic era relative to the lastdecade of apartheid. Thus, the average growth rate was 1.1 percent between1983 – 93, and 3.1 percent between 1994 – 2004. The gains in growth since
-4
-2
0
2
4
6
1984 1986 1988 1990 1992 1994 1996 1998 2000 2002 2004
Ann
ual g
row
th r
ate
Figure 2.1 Real Growth Rate of South Africa GDP, 1984-2004
Source: South Africa National Accounts.12/05 South African Reserve Bank Quarterly Bulletin
Average growth beforedemocratic transition = 0.9%
Average growth afterdemocratic transition = 3.1%
APARTHEID ENDS 1994

An Employment-Targeted Economic Program for South Africa10
1994 should of course be recognized, especially the strong economic perfor-mance in 2004 itself, when GDP grew at 4.5 percent. We do not yet have suffi-cient evidence that the 2004 growth experience represents a new, higher growthtrend. The Treasury itself in its 2005 Medium Term Budget Policy Statementanticipates growth “moderating to just above 4 percent for 2006,” (p. 2). Con-sidering the full 11 years of democracy, output has been expanding at only aboutone percent faster than the population growth rate, and even this rate of percapita income growth is somewhat overstating the positive growth picture, be-cause population growth has been slowed by a rising death rate, due to the HIV/AIDS crisis.4 Output growth at this pace cannot be expected to be a majorengine of employment growth.
Declining labor intensity. In Figure 2.2, we present figures on employ-ment relative to GDP—specifically the number of jobs in the formal South Af-rican economy relative to R1 million in output from 1967 – 2001.5 This is onebroad indicator of the extent of the labor intensity of output in South Africanproduction. As we can see, this employment/output ratio has been trendingdownward steadily since the 1960s. However, the rate of decline has continued,and indeed accelerated sharply, after 1994. As the figure shows, as of 1967, anestimated 8.2 formal economy workers were employed in South Africa for everyR1 million in output. By 2001, the figure had fallen to 4.9 workers/R1 millionin output—that is, 40 percent more people were employed in the formal economyin 1967 than 2001 for a given level of output. Even since 1994, this employ-ment/output measure has fallen by 28 percent. In just seven years, in otherwords, formal economy businesses in South Africa were hiring nearly 30 per-cent fewer people for a given amount of goods and services they produced.
All major sectors of the South African economy outside of agriculture—i.e.government, mining, manufacturing, construction, trade, and finance—have ex-perienced declining labor intensity from the 1970s onward. But the sharpest de-clines have been in mining and manufacturing over the 1990s. For mining, declininglabor intensity is a result of the diminishing ore grades available for extraction,and, thereby, the need to deploy increased mechanization to profitably reach theseores. In the case of manufacturing, the decline in labor intensity corresponds witha broader pattern throughout middle- and low-income countries, in which manu-facturing production has become increasingly mechanized in the context of main-taining pace with global competition. Considering this broader global pattern,Ghosh (2003), for example, finds that while manufacturing output has risen in thesouth, employment growth has stagnated because of 1) a rise in import competi-tion; and 2) low employment elasticities of new production.
Based on these trends, it is clear that, at its core, any successful employ-ment program for South Africa will have to do two things: raise the average rateof output growth; and increase the labor/capital ratio of the overall level ofoutput.

11The Nature of Mass Unemployment in South Africa Today
IMPACT OF SLOW GROWTH ANDDECLINING LABOR INTENSITY
We can see how crucial this is through the simple hypothetical exercise pre-sented in Table 2.4. In the table, we consider alternative assumptions as to therate of economic growth and the change in labor intensity over the decade 2005– 2014. The starting point for the exercise is the actual levels of economic growth,employment, and labor intensity in 2004, as presented in Panel A of Table 2.4.
We begin by making two assumptions about economic growth. The first isthat the economy’s growth rate over 2005 - 2014 is 3 percent, i.e. essentiallyequal to the growth rate that was achieved over 1994 – 2004. We then consideran acceleration in the average growth rate to 5 percent, somewhat less than theaverage rate the government has set for its goal under the ASGISA, which, aswe have seen, averages to about 5.3 percent over 2005 – 2014 (i.e. 4.5 percentbetween 2005 – 2009 and 6 percent between 2010 and 2014). We then considerthree alternatives for labor intensity: that the employment/output ratio—themeasure of labor intensity that we are using here—remains the same; that theemployment/output ratio is 10 percent lower as of 2014; and that the employ-ment/output ratio is 10 percent higher in 2014.
The next two panels of the table show the results of these alternative sce-narios in terms of employment in 2014. As we see in Panel B, under the as-
4
5
6
7
8
9
1968 1972 1976 1980 1984 1988 1992 1996 2000
Jobs
/R1
mill
ion
in o
utpu
tFigure 2.2 Ratio of Formal Employment to GDP in South Africa, 1967-2001(number of formal jobs per R1 million in output)
Source: Reserve Bank of South Africa.
Before democratic transition Afterdemocratictransition

An Employment-Targeted Economic Program for South Africa12
sumption that growth remains at its current pace, and that labor intensity remainsconstant, there will be 16.2 million people employed, both formally and infor-mally, in South Africa in 2014, 4.2 million more than the 12 million employed in2004. However, if economic policies are successful in raising the average growthrate to 5 percent, a total of 19.6 million people will be employed in 2014, a gain of7.6 million over the actual 2004 level, as well as an improvement of 3.4 millionover what would result in 2014 from a 3 percent average growth rate.
The improvements in overall employment are lower, of course, if we as-sume that the employment/output is 10 percent lower in 2014. A fall in the
C) DIFFERENCES IN EMPLOYMENT GROWTH SCENARIOS
3% growth with constant output/employment vs.5% growth with constant output/employment 3.4 million jobs
3% growth with 10% fall in employment/output vs. (declining labor intensity)3% growth with 10% rise in employment/output (rising labor intensity) 3.2 million jobs
3% growth with 10% fall in employment/output vs. (slower growth and rising labor intensity)5% growth with 10% rise in employment/output (faster growth with rising labor intensity) 7 million jobs
Table 2.4 South Africa Employment Growth 2005 – 2014 UnderAlternative Economic Growth and Labor Intensity Assumptions
A) ACTUAL LEVELS OF ECONOMIC ACTIVITY IN 2004
Total output (GDP) R1.4 trillionTotal employment 12 millionEmployment/output ratio 8.6 jobs per R1 million in output
B) TOTAL EMPLOYMENT IN 2014 UNDER ALTERNATIVE ASSUMPTIONS
3% Growth 5% Growth
Employment/output remains constant 16.2 million 19.6 millionEmployment/output10% lower in 2014 (declining labor intensity) 14.6 million 17.6 millionEmployment/output 10% higher in 2014 (rising labor intensity) 17.8 million 21.6 million

13The Nature of Mass Unemployment in South Africa Today
employment/output ratio of at least this magnitude is consistent with the expe-rience over the past decade, and will almost certainly occur unless policymakersactively intervene to promote labor intensive activities. The importance of pur-suing such policies in addition to growth-promotion policies can be seen in thesecond row of Panel C. As we see there, if we assume a constant average growthrate of 3 percent over the decade, but allow labor intensity to be either 10 per-cent lower or higher as of 2014, the more labor intensive employment growthpath will alone generate an additional 3.2 million jobs.
Finally, in the last row of Panel C, we observe the effects of both accelerat-ing growth from an average of 3 percent to 5 percent, and allowing labor inten-sity to be 10 percent higher rather than 10 percent lower as of 2014. In combiningboth the growth and labor intensity effects, the overall difference in job creationamounts to an increase in employment of 7 million jobs—i.e. an amount that ismore than half of the total number of employed people in South Africa as of2004.
Based on this simple exercise, it is clear why the focus of an employment-targeted policy for South Africa needs to be on both raising the trend rate ofeconomic growth and increasing the relative labor intensity of growth.6
It is also crucial to emphasize that the country’s current economic path ofrelatively slow growth and declining labor intensity has increased inequality and,in particular, has been harmful to the well-being of the poor. It is not surprisingthat this is so, given that, as we have seen, the unemployed are concentratedmost heavily among Africans, traditionally the most disadvantaged populationgroup in South Africa; and among those living in relatively poor regions of thecountry.
In Figure 2.3, we present summary data from a 2005 study by Liebbrandt,Levinsohn and McCrary, “Incomes in South Africa Since the Fall of Apart-heid.” The data are for changes in total individual income between 1995 and2000 for different income percentiles within the South African population. Theincome figures include both labor and pension income. The authors also presentdata broken down by gender in their paper and emphasize the importance of thedistinct patterns of income change for men and women. However, for our pur-poses here, the overall pattern, combining both men and women, is sufficient.
The first thing that is striking about these results is that Liebbrandt et al.find that all income groups in South Africa, from lowest to highest, experienceda decline in total income between 1995 – 2000. This pattern of overall incomedecline is not consistent with the national income account figures, which showan overall modest increase in national income over this period. As the authorsnote, such discrepancies between household survey data and national incomeaccounting figures are not unusual with data for other countries as well. But thisdiscrepancy aside, what is also clear from the data is that the most severe de-clines in real income were experienced by those in the lower-income percentiles.

An Employment-Targeted Economic Program for South Africa14
For example, the poorest 1 percent experienced a 69 percent decline in income,those in the 5th income percentile experienced a 40 percent real income decline,and those in the 10th percentile experienced a 37 percent decline. Meanwhile,for the 90th percentile, the decline was a much lower 18 percent, and those in the95th percentile saw their incomes decline by a still lower 11 percent.
These results from Liebbrandt et al. are consistent with the results ob-tained by Hoogeveen and Ozler of the World Bank in their 2004 study, “NotSeparate, Not Equal: Poverty and Inequality in Post-Apartheid South Africa.”Hoogeveen and Ozler examine the same data sets and time period—i.e. a com-parison of 1995 and 2000—as Liebbrandt et al., but consider the data in termsof household expenditures rather than individual incomes. They find that an-nual per capita growth of household expenditures between 1995 and 2000 was0.5 percent, as they put it, “very much in line with the GDP growth and thegrowth of final consumption expenditure by households,” (p. 6). In other words,their calculations on changes in household expenditures between 1995 and 2000,unlike the Liebbrandt et al. results, are not inconsistent with the national in-come data.
Hoogoveen and Ozler examine the poverty and inequality trends through anumber of measures. Among these, they develop a new poverty line based onwhat they term the “cost of basic needs.” They offer a range of values for this ofbetween 322 and 593 Rands per month in 2000 prices (this is equal to a range of
-60
-40
-20
0
Perc
enta
ge in
com
e de
clin
e
Income percentile groups from 1st to 99th percentiles
Figure 2.3 Total Real Income Changes for Different Income Groupsin South Africa, 1995-2000
Source: Liebbrandt, Levinsohn and McCrary (2005).
All income groups experience real decline in total incomes
1st%
5th%
10th%
25th%
50th%
75th%
90th%
95th% 99th
%

15The Nature of Mass Unemployment in South Africa Today
about R400-734 in 2004 prices, a set of figures to which we return later in thestudy). They report poverty using their own lower-bound figure as well as themore standard $1 and $2 per day poverty lines. Their lower-bound figure isclose to the $2 per day poverty threshold.
Weighing evidence from these various measures, they find that growth wasnot pro-poor, but rather that poverty and inequality increased sharply between1995 and 2000. As they conclude:
The depth and severity of poverty increased as a result of declining expenditures forthose at the bottom of the expenditure distribution, and inequality among Africansrose sharply. By 2000, there were approximately 1.8 million more South Africansliving with less than $1/day and 2.3 million more with less than $2/day (p. 28).
In a recent paper, van der Berg, Burger, Burger, Louw and Yu (2006) havechallenged the evidence showing that poverty increased substantially in the ini-tial post-Apartheid period up to 2000. According to their own estimates, pov-erty did still worsen between 1993 – 2000 according to all the various measuresthey report. But the severity of the decline was more mild than suggested eitherby Liebbrandt et al. or Hoogoveen and Ozler.
van der Berg et al.’s study is notable especially in terms of what it finds forthe years since 2000—that poverty in South Africa actually declined signifi-cantly over these more recent years. For example, using a poverty line of R3000in annual per capita income, they find that the poverty headcount ratio fell from41.3 percent in 2000 to 33.2 percent in 2004. They similarly found that thenumber of people living in poverty fell from 18.5 to 15.4 million.
If these results are accurate, they clearly suggest that the problems thatproduced rising poverty in South Africa from the end of apartheid through 2000had been successfully addressed from 2001–04. van der Berg and his co-au-thors argue that the primary source of declining poverty was the increase ofmore than 70 percent in real terms in social grants to the poor, most notably thechild support grant for impoverished households containing children less than15 years of age, and the deracialization of the means-tested social old age pen-sion. But the authors also conclude by emphasizing that, for the future, addi-tional reductions in poverty will have to come primarily through improving jobopportunities rather than continuing to rely so heavily on social grants. Theywrite, “More rapid job creation is required to make further progress in combat-ing poverty, since the social grant system—while having made a large contribu-tion to the recently observed decline in poverty—is currently nearing the limitsof its poverty alleviation capacity,” (p. 29).
However, their more optimistic assessment of the conditions of the poor inSouth Africa does itself raise significant questions. The first, and most basic, iswith the accuracy of their methodology and findings. Meth (2006) has advanced

An Employment-Targeted Economic Program for South Africa16
a substantial critique of both their methodology and findings. Applying an al-ternative estimation technique, Meth finds that headcount poverty at a R3000annual per capita poverty line was rather at least 18 million and possibly ashigh as 19 million in 2004—i.e. roughly 3 million more people than estimatedby van der Berg and colleagues. Meth’s findings for 2004 are clearly more inline with the estimates for 1995 – 2000 of Liebbrandt et al. and Hoogoveenand Ozler.
This is not the place to attempt to adjudicate a methodological debate be-tween competing experts in this area.7 Suffice it to say that, even if we allow thatvan der Berg and colleague are right, it is still clear, as they themselves empha-size, that any further substantial reduction in poverty will have to come prima-rily through economic growth and job creation rather than expanding socialgrants alone. In other words, even if one takes the van der Berg findings as thebaseline for considering a forward-looking policy agenda, we are still faced withthe imperative of advancing a program that can dramatically increase employ-ment opportunities for South Africans over the next decade.
Overall, one must of course honor the enormous gains that the governmentof South Africa has made since 1994 in terms of health care, access for the poorto public services and infrastructure, and most especially in dismantling apart-heid. But one also cannot escape the conclusion that over the first decade ofnon-racial democracy, the South African economy has followed a path that hasled to slow economic growth and a sharp decline in the labor intensity of outputeven while unemployment hovers around 30 percent.
WHY IS THERE EMPLOYMENT STAGNATIONIN THE FORMAL ECONOMY?
Apartheid was a system that, among other things, systematically excluded theAfrican majority from opportunities for a decent working life. Just on the issueof employment creation alone, the problems inherited by the ANC-led govern-ment on taking office in 1994 were therefore immense.
With this fundamental reality as background, it is also the case that the ANC-led government had moved toward embracing tight fiscal and monetary policiessince first taking office in the historic transition of 1994. This approach was for-malized with the introduction of the GEAR (Growth, Equity, and Redistribution)program in 1996, which outlined an explicit program of macro stringency as thefoundation for a stable long-term growth path. In his recent book Season of Hope:Economic Reform Under Mandela and Mbeki (2005), Presidential economic policyadvisor Alan Hirsch offered some candid views as to how the GEAR program wasdeveloped in response to pressures from the International Monetary Fund (IMF)and international financial investors. Hirsch writes:

17The Nature of Mass Unemployment in South Africa Today
Another motivation for fiscal and monetary conservatism was the ANC’s fear of giv-ing up South Africa’s limited economic sovereignty to the International MonetaryFund and/or the World Bank as the result of a financial crisis…. The irony was thatin order to stave off the power of international finance, the ANC committed itself topolicies approved by these same financiers. In order not to get too indebted to thosewho could turn their debt against them, they had to be conservative and pander tosome of their prejudices (2005, p. 69).
The ANC also faced additional pressures at the time it implemented theGEAR. As Professor Stephen Gelb (2004) discusses, the government inheritedan extremely difficult fiscal position on taking office. Due to politically-relatedspending commitments of the outgoing apartheid government, the fiscal deficitrose from an average of 4.2 percent of GDP between 1988 – 91 to 9.3 percent in1992 and 10.1 percent in 1993. Government debt had risen from 29.0 percentof GDP in 1990/91 to 47.0 percent in 1994/95. This level of deficit spendingwas considered unsustainable given the high public debt servicing costs thatthreatened to crowd out social spending, and the government committed itselfto a policy of fiscal tightness.
It was equally committed to a program of monetary tightness to maintain alow-inflation environment and to protect the value of the rand. The new gov-ernment did inherit relative price stability following the severe recession of 1989-93. It wanted to maintain inflation at this low level, and formalized thiscommitment even beyond the GEAR program in mid-1998 by establishing “in-flation-targeting” as the single aim of central bank policy. The first target, setin February 2000, was to bring inflation within a range of 3 – 6 percent by April2002. Adjusting interest rates was established as the primary mechanism forcontrolling the inflation rate.
The commitment to macroeconomic stringency is also part of a broaderpackage of measures consistent with aspects of the neoliberal policy approachadvanced by the IMF, even while the ANC-led government itself has not pro-fessed a broad-based commitment to a neoliberal approach. These other mea-sures include liberalizing trade and capital flows and minimizing regulation ofbusinesses.
Within its internal logic, this policy approach does not by any means dis-miss the importance of stimulating output and employment. Rather, it sees thefoundation for building a sustainable growth path as relying on the ability toestablish credibility among domestic and especially foreign investors, and thusto rely on private investment as the principal engine of growth. Moreover, tradeliberalization is a means of enabling the economy to expand its exports, withexport growth then serving as a crucial additional source of output and employ-ment growth.
The justifications for this stringent approach to macroeconomic manage-ment cannot be dismissed lightly. There were reasonable grounds for the ANC

An Employment-Targeted Economic Program for South Africa18
to have accepted this policy approach when it did. Nevertheless, these policieshave now been in operation for a decade, during which time there has beenample opportunity to demonstrate their effectiveness. And while this approachhas indeed succeeded in lowering both the fiscal deficit and the inflation rateand in improving South Africa’s external balance in terms of the current ac-count and foreign exchange reserves, it has not succeeded in significantly reduc-ing unemployment or poverty.
Moreover, there are logical reasons why this economic policy approach wouldnot be successful in reducing unemployment or poverty. This is the case evenwhile many of the policy initiatives of the ANC-led government did clearly ad-dress the needs of the poor. These policies include expansion of child mainte-nance grants and other social grants, large-scale investments in low-cost housing,land restitution, and investments in social infrastructure such as water taps.
Perhaps especially in recognition of these significant initiatives, it is alsoimportant to briefly consider the difficulties presented by the economic policyframework pursued under the GEAR strategy. The key points are as follows8:
1. The government’s commitment to macroeconomic tightness—throughminimizing fiscal deficits and maintaining high real interest rates—inhib-ited economic growth, and thereby employment growth. Weak economicgrowth and high interest rates in turn discourage private investment. Theproblem is compounded when high unemployment creates social unrest,which only destabilizes the outlook for potential private investors.
2. Even as a means of promoting private investment, public sector investmentand employment can serve crucial functions in terms of a) stabilizing ag-gregate demand and employment; and b) promoting productivity growth.Thus fiscal tightness further weakens the opportunities for private invest-ment because of reducing expenditures in public investment.
3. The unregulated flows of portfolio capital have been highly volatile, re-flecting the more general volatility of unregulated financial markets, in ad-vanced economies as well as developing economies. This has increased theoverall speculative element in the country’s financial markets, such that as-set trading in financial markets has grown exponentially since the early 1990s,especially relative to the growth of real investment. Consequently, eventhough South African policymakers frequently refer to the country’s “firstworld” financial system, the positive benefits of this financial system to thecountry’s development goals have been insufficient.
4. Export promotion has had some success, especially in the automobile sec-tor. But despite its huge labor surplus, South Africa is most competitive asan exporter in more capital intensive industries such as automobiles rela-tive to other countries in sub-Saharan Africa, or very low labor cost coun-tries, especially China. Thus, the promotion of exports has only strengthened

19The Nature of Mass Unemployment in South Africa Today
the economy’s trend toward increased capital intensity. Moreover, in termsof import competition, eliminating tariff barriers can generate rapid lossesand bankruptcy for domestic firms that are unprepared, at least in the short-run, to compete with foreign multinational firms.
5. Foreign investors have many developing countries in which to choose tolocate, with China currently being the most favored site by far. As such,even with South Africa having succeeded in creating a low inflation, low-regulation environment, this did not ensure that it would succeed in at-tracting foreign investors. The evidence to date suggests that multinationalfirms have little interest in locating in sub-Saharan Africa.
The problem is compounded by the fact that foreign investors are inter-ested in a stable social environment; a well-functioning physical and educa-tional infrastructure; and a growing domestic market. But the commitment tomacroeconomic stringency undermines social cohesion by worsening prob-lems of poverty and underemployment; weakens the public infrastructurethrough cutting government spending and revenue collection; and slows theexpansion of domestic markets through deliberately constraining aggregatedemand.
At present, the government is committed to the ASGISA framework, aim-ing at raising the average growth rate to 4.5 percent between 2005 – 09, andagain to 6.0 percent between 2010 – 2014. Moreover, from preliminary docu-ments and correspondences on the ASGISA, it is clear that the governmentintends to take aggressive positive steps in the areas of expanding public infra-structure and the provision of social services, as well as promoting the growth ofpriority sectors, such as tourism, agriculture and agro-processing (biofuels).All of these measures will support a process of accelerated and shared economicgrowth. At the same time, it also appears from the preliminary documents onthe ASGISA that the government remains committed to maintaining tight fiscaland monetary postures and to reducing taxes. It is therefore not clear where thefinancial resources will come from to promote this highly desirable growth ini-tiative. It is in this context that we now turn to considering some of the specificquestions involved in promoting growth, increasing labor intensity, and reduc-ing poverty. We turn first to examining supply-side measures to reduce unitlabor costs, then move on to discussing demand-side issues.
NOTES
1. In Appendix 1, we provide details on the construction of employment statistics in South Africaand the ways in which we use these data. The population estimates are taken from “Mid-YearPopulation Estimates, South Africa, 2005” from Statistics South Africa. This document notesthat the population estimates as of mid-year 2005 are lower than had been previously published.Statistician-General Pali J. Lehohla explains that “this is primarily a result of additional infor-

An Employment-Targeted Economic Program for South Africa20
mation about mortality now available to Statistics South Africa,” including an explicit account-ing for HIV/AIDS. This document reports HIV-prevalence at approximately 10 percent of thepopulation.
2. “Population group” refers to the historic apartheid-era racial classifications. There has been amovement away from using these categories in South Africa. However, since they remain so-cially meaningful for analyzing such issues as the distribution of employment opportunities,poverty, and inequality, they will be used in this report to illustrate on-going inequities.
3. Informal employment includes those employed in the non-agricultural informal sector andthose employed as domestic workers.
4. For example, population growth between 2004 – 05 was approximately 0.9 percent, signifi-cantly lower than the longer-term annual population growth rate of nearly 2 percent.
5. This data series ends in 2001 because of a change in the sampling frame in the Employment andEarnings enterprise survey of Statistics South Africa after 2001. The more recent sample ismore comprehensive in the range of enterprises surveyed. Nevertheless, a gap still exists be-tween the Employment and Earnings survey estimates (enterprise-based) and the Labour ForceSurvey estimates (household-based). The household surveys report higher levels and greaterincreases in employment than the enterprise surveys. Throughout this report, we use the enter-prise survey estimates for estimating time-series trends or relative comparisons between de-tailed industrial sectors. However, we use the Labour Force Survey estimates as a more accurateassessment of current levels of employment—both formal and informal—in South Africa.
6. We also note, finally, that one observes an even more serious problem of declining labor inten-sity through estimating an employment elasticity of output growth—i.e. the percentage growthin jobs associated with one percent increase in output—over this 1967 – 2001 period. Theseestimates are not highly reliable, given the inconsistencies in the time series data and the factthat there are no time-series data at all for agricultural employment. Within these severe con-straints, it may still be worth noting that our best estimate of the non-agricultural employmentelasticity in this period is 0.28, meaning that a one percent increase in non-agricultural outputincreases non-agricultural employment by slightly less than 0.3 percent. We note that thisemployment elasticity figure is far below the 0.8 figure that is presented in a preliminary No-vember 2005 policy document describing the employment goals of the ASGISA program. Afuller description of our employment elasticity estimate is presented in Appendix 1.
7. The different findings in the estimates result from how the various researchers handle prob-lems of under-reporting of income and expenditures in household surveys and censuses. Theapproach taken by van der Berg et al. was to harmonize income data between the national in-come accounts and the survey data provided by their preferred source, the All Media and Prod-uct Surveys (AMPS) group. To do so, they raised the racial mean incomes derived from theAMPS surveys to the means estimated from the national accounts. Meth offers an extendedcritique of this approach and advances an alternative methodology.
8. Pollin (2006) presents a survey of these problems within the broader context of globalization.

3. Supply-Side Perspectiveson Employment Expansion
The fact that the South African economy is experiencing both high unemploy-ment and rising capital intensity of production suggests to some both an expla-nation for high unemployment and a solution to the problem. The explanationfor the problem is straightforward: businesses won’t hire more workers becausethey are convinced that the costs of doing so will exceed the benefits. Busi-nesses therefore choose either to 1) maintain their operations at a lower levelthan they would if the benefits of hiring more workers exceeded the costs; or 2)increase the use of machines in their operations as a substitute for employingworkers as their preferred means of expanding their operations. Seen from thisperspective, the solution to the problem of unemployment is also straightfor-ward: to lower the costs businesses face in hiring more workers.
There are four possible ways in which the costs to businesses of hiring work-ers could fall:
1. Workers receive lower overall compensation, including wages and ben-efits;
2. The industrial relations system and labor market regulations—includinglaws and regulations regarding workers’ right to organize, conflict resolu-tion, and hiring and firing—operates with more flexibility for business;
3. Workers perform their workplace operations at a higher level of productiv-ity; or
4. The government absorbs some portion of the costs of hiring workers.
In most discussions that consider the sources of unemployment from thisbusiness cost-oriented perspective, the focus generally is on the first way toreduce business costs, i.e. to lower wages and benefits for workers relative toboth other input costs in production and to the prices at which businesses cansell their final products. Indeed, the idea that excessive wage demands are thebasic source of unemployment is embedded in the classical analysis of labormarkets and unemployment. That basic idea has been extended in recent yearsto encompass the idea of inflexible labor markets: that legal and institutionalconstraints in wage bargaining prevent wages from being set at a market-clear-
21

An Employment-Targeted Economic Program for South Africa22
ing level and also inhibit firm managers from organizing the workplace in themost efficient way.
These two considerations on lowering labor costs are highly influential indebates on mass unemployment in South Africa. We will focus on these twoconsiderations in this chapter of our study. But we also provide some briefdiscussion in this chapter on raising productivity and government employmentsubsidies—i.e. using government subsides as a way of reducing labor costs forbusiness. We then also take up these latter two concerns in more depth later inthe study. Specifically, in Chapter 5, our discussion of incomes policies consid-ers the issue of industrial relations and productivity, while our proposals oncredit allocation look at such measures as a means of government subsidizinglabor costs.
WAGE CUTTING AND LABOR MARKET FLEXIBILITY
The classical explanation for unemployment. Under the pure classical model,as well as its contemporary “new classical” variant, there is fundamentally nevera problem of involuntary unemployment. If unemployment exists beyond thefrictional adjustments that always take place in labor markets, it is because workersare unwilling to accept jobs at wages that employers are willing to pay. More-over, because business owners operate to maximize their profits, they will al-ways be willing to pay workers a wage equal to the contribution the workers canmake to the firm’s profitability. Thus, according to the classical model, if work-ers are searching for employment but aren’t being hired, this can only be sobecause workers are seeking to be paid an amount beyond what would be prof-itable for business owners, given the other production costs businesses face andthe prices at which they can expect to sell their final products. This then meansthat if workers were willing to lower their wage demands to a point that is ac-ceptable to businesses, then businesses would be willing to hire them.
Various observers have presented evidence consistent with some variant ofthis classical model to explain mass unemployment in South Africa. For ex-ample, Jeffrey Lewis’ major study for the World Bank (2001) presents two kindsof evidence on this score, concerning, first, wage rates themselves; and second,the inflexibilities in the South African labor market that prevent the labor mar-ket from clearing at something close to full employment.
High wages. The main points that Lewis raises here are straightforward.
1. Unemployment is concentrated among the semi-skilled and unskilled.There is almost no unemployment among skilled and highly skilled work-ers in South Africa.

23Supply-Side Perspectives on Employment Expansion
2. Real remuneration from 1970 – 1999 was basically stagnant for highlyskilled and skilled workers, but increased by 250 percent for unskilledand semi-skilled workers.
Based on this evidence, Lewis writes,
While there are numerous factors that contribute to the differential patterns of un-employment by skill group, the pattern of wage growth appears particularly signifi-cant…. The neoclassical conclusion that unskilled and semi-skilled labor has to alarge extent been priced out of the market seems unavoidable, (2001, p. 14).
Labor Market Inflexibility. Since 1995, several legislative and regulatorymeasures have been enacted to redress the injustices to non-White workerswrought by apartheid. Lewis says these measures have contributed to makingthe South African labor market inflexible. These include the Labor RelationsAct (LRA), focusing, among other things, on workers’ right to organize; theBasic Conditions of Employment Act (BCEA) of 1997, focusing on workplaceconditions; the Employment Equity Act, seeking to correct racial imbalancesthrough, among other things, affirmative action; and the Skills DevelopmentLevy of 1998, seeking to develop more worker training.
Lewis acknowledges that it is difficult to quantify the impact of these initia-tives on the South African employment situation. However, he is clear thatthese measures have at least contributed, as he says, “to the impression of in-flexibility.” As Lewis writes,
South African business leaders cite labor regulations and union activities as discour-aging employment creation. The World Economic Forum’s Global CompetitivenessReport ranks South Africa at the bottom of its fifty-nine nation comparison on whetherlabor regulations on wages, hours or dismissals favor flexibility. The Competitive-ness Report asks groups of domestic business leaders to rank their agreement ordisagreement with statements such as, “Hiring and firing practices are flexibly de-termined by employers.” On this question South African executives strongly dis-agreed. Relative to the rankings of business counterparts in other economies, SouthAfrica came in dead last on most matters concerning flexibility, labor relations andthe work ethic of the labor force. (2001, pp. 14-15).
Given such evidence both on rising wages and apparent labor market ri-gidities, South Africa’s unemployment problem does seem consistent with theclassical theoretical framework of analyzing unemployment, at least at a firstglance. However, it isn’t necessary to rely on a classical approach to connect uppatterns of rapid wage growth and labor market rigidities with high unemploy-ment. In fact, consistent with this same set of data, one could explain highunemployment in South Africa through focusing primarily on the challenges ofglobal competitiveness.1

An Employment-Targeted Economic Program for South Africa24
GLOBAL COMPETITIVENESS APPROACH
In a standard model of international trade, a major factor determining exportsuccess will be a country’s unit labor costs relative to those of its competitors. Acountry with relatively high unit labor costs will not be able to compete in globalexport markets.
Of course, the fact that a country is not highly successful as an exporterdoes not mean it will necessarily face employment problems. Countries couldmaintain a high level of employment derived predominantly from domesticsources of labor demand. However, in the case of South Africa, as Edwards andGolub (2004) put it,
The restrained fiscal policies meant that the government placed its bets on exportsand the private sector as the engine of growth. The liberalization of internationaltrade and domestic markets is intended to spur output and employment throughexport-led growth and higher foreign direct investment. Given the emphasis onexports and foreign investment, international competitiveness became an importantcomponent of the strategy (p. 1323).
The Edwards and Golub study focuses on the empirical facts concerningSouth Africa’s unit labor costs. They measure unit labor costs in South Africarelative to a set of developed countries; and, separately, relative to a set of devel-oping countries. Their measure of relative unit labor costs is:
ci = (ai/a*i) (wi/w*ie),
where a is the unit labor requirement in South African production for sector i(the inverse of productivity); w is the wage rate in sector i; and e is the exchangerate, a* is the foreign unit labor requirement, and w* is the foreign wage. Ac-cording to the equation above, we can decompose relative unit labor costs intorelative productivity (ai/a*i) effects, and relative wage effects measured in a com-mon currency (wi/w*ie).
They report rankings for 24 industrial categories. They also report an av-erage ranking over the 24 industrial groupings. According to their results, SouthAfrica has made substantial improvements in their relative unit labor cost posi-tion since the 1970s, both with respect to developed and developing countries.Edwards and Golub do not discuss the sources of this improved performance.But as one obvious general factor, it is of course the case that the South Africaneconomy became much more open and engaged in global trade with the end ofapartheid in 1994. More specifically, considering the developed countries, SouthAfrica has improved from being 31 percent above average for 1970–79 to being21 percent below average during 1995–98.
25Supply-Side Perspectives on Employment Expansion
However, Edwards and Golub argue that the more significant relative rank-ing is with respect to other developing countries, since it is against other devel-oping countries that South Africa will mainly compete for export markets andattracting foreign direct investment. Average unit labor costs were 65 percentabove the full sample average in 1970–77. For 1995–98, they were 20 percentabove average, an improvement of 45 percentage points. Nevertheless, accord-ing to Edwards and Golub, the most important fact is not that South Africa haddramatically improved its unit labor costs position relative to other developingcountries, but rather, despite this improvement, that it remains 20 percent abovethe average unit labor costs of other developing countries. According to Edwardsand Golub, this fact may be contributing to South Africa’s high unemploymentrate, even while it is not likely to be the only explanation for the South Africansituation.
EXAMINING THE EVIDENCE ON UNIT LABOR COSTSAND UNEMPLOYMENT
As we see then, we can reach the conclusion from a range of perspectives thathigh labor costs are a major determinant of mass unemployment in South Af-rica. As a theoretical matter, there is no doubt that, at some threshold point,high labor costs will significantly discourage businesses from hiring workers.This in turn will lead to reductions in employment levels, as businesses eithersubstitute machines for workers in their business operations or scale back theiroperations. But at what wage level does the South African economy reach thisthreshold? This is an empirical question, not a matter that can be solved simplyby theory. It is therefore crucial to examine the evidence that analysts havebrought to bear on this question. As we will see, serious ambiguities are presentin the major studies that find significant links between labor costs and massunemployment in South Africa. We consider, in turn, the evidence in terms ofwages, labor market rigidities, and trade competitiveness.
Data on Wage Elasticity of Demand
A standard study on the relationship between wages and employment in SouthAfrica is that by Fallon and Lucas (1998), written under the auspices of theWorld Bank. The most basic finding that Fallon and Lucas present is that of awage elasticity of demand for black formal sector employees of -0.71. Thismeans that a 10 percent increase in the real product wage of African formalsector workers will produce a 7.1 percent reduction in employment for theseworkers. Fallon and Lucas also report wage elasticities for 16 separate sectors ofthe South African economy, with values ranging widely, between -0.06 in to-

An Employment-Targeted Economic Program for South Africa26
bacco to -2.9 for non-metallic minerals. The -0.71 figure is the weighted meanderived from the individual estimates for the 16 separate sectors.
But there are many questions to consider with this elasticity estimate. Tobegin with, the -0.71 figure represents a dramatic increase over an estimate of-0.28 that Fallon had himself generated only six years earlier. Fallon and Lucasreport that their much larger revised elasticity estimate is closer in line withestimates of wage elasticities of other countries. And while this is true, the largeshift in their own estimate underscores the difficulties in providing generaliza-tions on this matter, given the remarkable historical and institutional changesthat South Africa has undergone in the past 30 years—as well as the inadequacyof data on employment under the apartheid regime.
Fallon and Lucas also report “impact elasticities” in this latest 1998 study.This is the wage elasticity over a one-year period. They find that the impactelasticities are very weak, at -0.156. With an impact elasticity of -0.156, as theyacknowledge, it would take 2.8 years for even half of the adjustment to a wagechange to work its way through the economy. That is, in a best case scenariounder the Fallon and Lucas estimates, a wage-cutting strategy would take a longtime. Its effectiveness would also be highly uncertain. This is because manyother things would be going on in the economy over the roughly six year periodas the effect worked its way through the economy.
Data on Real Wage Increases
According to figures reported in Lewis, the problem that could be contributingto unemployment is that wages for unskilled and semi-skilled workers rose by250 percent from 1970 – 1999. These are the same categories of workers thatexperience high rates of unemployment. This is in contrast to wages for highly-skilled and skilled workers that, according to Lewis, were essentially flat overthe same 30-year period. There is almost no unemployment among the moreskilled categories of workers.
There are several questions to raise with these figures. The first is a straight-forward statistical issue. In fact, there are no time series data on wage rates byskill level in South Africa. Rather, Lewis took these figures from work by hisWorld Bank colleague Claude van der Merwe, who extrapolated them from avariety of sources. In his memo on this topic van der Merwe states that “careshould be exercised in interpreting remuneration by skill. As the data has beencalculated using at most 5 observations over 30 years, only broad long-term trendscan be recognized at the industry level.” 2
Just as a check on the extrapolation methodology used here, let us considerbriefly the data from Statistics South Africa on Africans and whites in manufac-turing—allowing Africans to roughly proxy for “unskilled” and “semi-skilled”workers while whites proxy for “skilled” and “highly-skilled.”3 According to

27Supply-Side Perspectives on Employment Expansion
Statistics South Africa, the African real wage in manufacturing rose by 85 per-cent from 1973 – 1997, while wages for white manufacturing workers rose by 17percent over this same period. The broad trend from these figures is thereforecomparable to that reported by Lewis, allowing that our proxy figures—Afri-cans and whites as opposed to various skill levels—are reasonably accurate.Nevertheless, the magnitude of the divergence between the two groupings ofworkers is much less pronounced; and, correspondingly, the rise in wages forAfricans is substantially slower than suggested by Lewis’s extrapolation.
But let us assume Lewis’s figures are roughly accurate. Further questionsstill arise. The first question is about the pattern of real wages for the highlyskilled and skilled workers. Why were these wages flat for a full 30-year period,during which time average labor productivity rose by approximately 50 per-cent? If Lewis’s figures are even broadly accurate, this absence of wage gains forskilled and semi-skilled workers would appear to be at least as serious a concernas the wage increases for semi- and unskilled workers.
As for the wages for the semi- and unskilled: the wage increases that theyreceived over this period were of course from an extremely low level—from alevel that could be fairly termed a poverty-level wage in the early 1970s tosomething, by the end of the 1990s, that is approximately twice a poverty linewage, but no more than that. And of course, the reason wages were so low inthe early period is straightforward: apartheid helped create a well-disciplinedworkforce at very low wages. The real wage gains during this period weretherefore an indicator of the effectiveness of the organized struggle againstapartheid. Moreover, using the Statistics South Africa figures for manufac-turing, the African wage equaled only 18 percent of the average wage for whitesin 1973. The gap does diminish. But by 1997, the average African worker inmanufacturing still only earns 29 percent of the wage of white workers in thesame industry. This, again, is after wages rose rapidly for Africans but onlyvery modestly for whites.
Based on these data, even if we were to allow that there has been a trade-offbetween employment and wages, it does not appear that the solution in this casewould be to push African wages back down. The wage increases that did occursince the early 1970s—whether they are in the range extrapolated by Lewis of250 percent, or the lower 85-percent range, as suggested by the official figuresfrom the manufacturing sector—still leave African workers only modestly abovea reasonable poverty line.
Data on Labor Market Rigidities
Significant issues arise in the data on labor market rigidities as well. First, onthe issue of responsiveness of wages to inflation, Fallon and Lucas report that“rigidities in the determination of African real wages are also illustrated by their

An Employment-Targeted Economic Program for South Africa28
vulnerability to unanticipated levels of inflation,” (p. 13). They explain theseinflation-induced rigidities as follows:
The results suggest that an unforeseen one percentage point increase in the infla-tion rate temporarily reduced the real African wage by about -0.27 to -0.42 per-cent, thus suggesting that nominal wage changes do not immediately adjust toinflation.
However, assuming their figures are accurate, the point they are demon-strating with these results is not the rigidity of real wages in South Africa, butprecisely the opposite. If nominal wages of black workers do not rise in stepwith inflation, this means that real wages are indeed highly flexible in a down-ward direction due to inflation.
This is not to suggest that it is advantageous that real wages for blacks aredownwardly flexible due to inflation. Indeed, Fallon and Lucas themselves statethat the fact of insufficient wage indexation for blacks is a problem, not a desir-able situation. It is simply to recognize the fact that, according to Fallon andLucas’s own evidence, real wages for blacks in South Africa are highly flexible inan inflationary environment.
Fallon and Lucas are also ambiguous as to how unionization contributes tolabor market rigidities. They recognize several factors that would suggest thatthe effect of unions on employment is likely to be weak. These include the factsthat:
1. Unions only cover roughly 30 percent of the total formal sector work forcein South Africa (which means that they cover only 22 percent of all work-ers, including those in the informal economy);
2. Unions are committed to preventing retrenchment for their members. Sothey may be supportive of wage restraint when the only alternative is re-trenchment; and
3. Union representation tends to be strongest where wage elasticities of em-ployment demand are weakest, such as in mining.
At the same time, Fallon and Lucas also state that South African businesspeople claim that the impact of unions serves as a general impediment to theirbusiness expansion plans. To the extent this is true, it would then mean that theunion effect on employment is more negative than can be readily capturedthrough statistical measures.
Given these various considerations, the overall result from Fallon and Lucas,as they concede, is that they can’t state with confidence what the effects of unionsare on unemployment. As they conclude, “It is hard to judge by how muchunion activity depresses formal African employment,” (p. 18).

29Supply-Side Perspectives on Employment Expansion
Lewis also acknowledges ambiguities in assessing the impact of rigiditieson employment. He reports the results of a survey of large firms (50 or moreemployees) in Johannesburg conduced by the World Bank and GreaterJohannesburg Metropolitan Council (GJMC) that included questions on howlabor market rigidities affect employment (p. 32). The considerations the sur-vey raised with respect to unions’ impact on employment were 1) one-third ofthe largest firms in the group (greater than 200 employees) must deal with threeor more unions; 2) 45 percent of the full sample of large firms are bound bycollective bargaining arrangements; 3) 30 percent of the large firms experiencedat least one strike during 1998; and 4) the average time required to retrenchentry level workers was 2.7 months.
The findings of the survey respondents were that “around 70 percent offirms pointed out that individual regulations had no effect on employment deci-sions.” The questionnaire also recognized that the firms may not be able topinpoint the effects of these individual factors on employment. So they alsoasked whether there were cumulative negative employment repercussions fromall of these four effects. In response to this, 60 percent responded that therewere no cumulative effects — “that all labor legislation combined had no cumu-lative impact on their employment decisions,” (p. 32).
Of course, these results do still suggest that for roughly 30 percent of largefirms in Johannesburg, the individual factors do reduce employment and thatfor 40 percent, the overall effect is negative. However, there is nothing in thereported survey results that suggests by how much this minority of large firmsis reducing their level of employment. It obviously matters a great deal whetherthese negative employment effects for the minority of firms are large or small.Beyond this, again, a very large majority of firms report no effects on employ-ment by these factors. This result, moreover, is of a survey of employers them-selves—i.e. the very group that would be most likely to report negative effectsof unions.
Moreover, as Fallon and Lucas point out, the unionized sector of the SouthAfrican labor market is roughly 30 percent of the total workforce. Assume wecan generalize from these survey results of large firms in Johannesburg to theentire South African economy. Given this assumption, it would then mean that40 percent of all firms with unionized employees react negatively in their em-ployment decisions to the presence of unions. That in turn means that firmsreacting negatively to unions employ roughly 12 percent of the formal workforceand nine percent of the total workforce, including informal workers.
Thus, at most, the World Bank survey results of businesses themselves sug-gest that rigidities imposed by unionization are affecting the businesses thatemploy roughly 10 percent of South Africa’s labor force. This is not nearlyextensive enough as to serve as a major explanation for mass unemployment inSouth Africa today.

An Employment-Targeted Economic Program for South Africa30
Data on Trade Competitiveness
There is no doubt that relative unit labor costs are a significant factor in estab-lishing trade competitiveness for South Africa or any other country. But thethe evidence that Edwards and Golub present on this issue is also highly prob-lematic.
As we have discussed, with respect to the developing countries, the crucialfact for Edwards and Golub is not that South Africa’s unit labor costs have fallensubstantially. It is rather that, despite this fall, South Africa still maintains rela-tive unit labor costs that are 20 percent higher than the average for developingcountries. However, Edwards and Golub do not show why this single thresh-old—being above a weighted average for 10 countries on a scale that averages 24different product types—should be more important for establishing trade com-petitiveness than the general movement of South Africa’s relative position—that is, the fact that South Africa did substantially improve its standing in unitlabor costs relative to both the developed and developing world.
The problem with their relative unit labor cost threshold as a basis for an-ticipating export success becomes evident when we consider their own data atan industry-level disaggregated basis. Of course, when we move down into thedetails of how trade competitiveness actually occurs in global markets, SouthAfrica, as an economic entity, does not compete with other countries as entities.Competition actually takes place at the level of specific products and firms. Fortesting the robustness of this Edwards and Golub indicator of trade competi-tiveness, it is therefore useful to see how well it holds up at a more detailed level.In particular, it is illuminating to consider the trajectory of competitiveness infour industries in which, according to Edwards and Golub’s own figures, SouthAfrican manufacturers did both improve dramatically in terms of relative unitlabor costs, and more importantly, succeeded in moving from being well aboveaverage by the Edwards and Golub measure of relative unit labor costs from1970 – 79 to being well below average in 1995 – 98.
These four sectors—leather products, footwear, industrial chemicals, andprofessional/scientific equipment—are shown in Table 3.1, along with 1) theirrelative rankings in the two periods 1970 – 79 and 1995 – 98 as reported byEdwards and Golub; and 2) the trade performance of these sectors in these twoperiods.
As we see in the table, with three of the four sectors, the growth rate ofexports actually falls in 1995 – 98 relative to 1970 – 79, despite the dramaticimprovements in relative unit labor costs in these sectors. Thus, with leatherproducts, Edwards and Golub report that relative unit labor costs through 1970– 79 were 60 percent above average for the sample of 10 developing countries,but improved to 23 percent below average over 1995 – 98. However, exportgrowth in leather products averaged 17.5 percent for 1970 – 79 but then fell to

31Supply-Side Perspectives on Employment Expansion
7.9 percent in 1995 – 98. The pattern is similar but more dramatic for foot-wear, while a more moderate version of the same pattern holds with industrialchemicals. The one exception to this pattern is professional and scientificequipment. Here, consistent with the Edwards and Golub postulate, relativeunit labor costs fell from 86 percent above average in the first period to 27percent below average in the second period. Along with this, sectoral growthrose from an average -6.7 percent in the first period to positive 11.3 percent inthe second period.4
The overall point from these data is clear: the measure on which Edwardsand Golub have relied for establishing export success in South Africa is veryblunt. The fact that they are operating with a blunt measure of export competi-tiveness is reinforced by their own econometric exercise. According to theireconometric results, the ability of this measure to contribute to an explanationof South Africa’s trade competitiveness has diminished dramatically over time.As they write:
During 1970-79 and 1980-89 Relative Unit Labor Costs, relative wages, and relativeproductivity were significant in explaining the structure of exports. During the 1990s,however, these variables are incorrectly signed and fail to explain the structure oftrade, as shown by the low F-statistic….The weaker results during the 1990s suggestthat other factors not related to labor costs are becoming more important in influ-encing the sectoral composition of South African exports. The 1990s were a periodcharacterized by significant structural breaks such as the ending of sanctions, theelection of a new government, a new macroeconomic policy, new labor legislation,and the initiation of tariff liberalization. The impact of these structural breaks mayaffect exports in a way that is not necessarily related to RULC. For example, thereintegration of South Africa into the world economy since 1994 led to rapid in-
Table 3.1 Relative Unit Labor Costs and Trade Performance of SelectedSouth African Sectors, 1970 – 79 and 1995 – 98
Edwards and Golub measure Sectoral exportof South Africa unit labor costs growth (real average
relative to developing country sample annual figures)
1970-79 1995-98 1970-79 1995-98
Leather products 60% above 23% below 17.5% 7.9%Footwear 93% above 53% below 4.3% -21.1%Industrial chemicals 54% above 12% below 9.1% 6.7%Professional and scientific equipment 86% above 27% below -6.7% 11.3%
Sources: Relative unit labor cost figures from Edwards and Golub (2004); Sectoral exportgrowth figures from Statistics.

An Employment-Targeted Economic Program for South Africa32
creases in exports to various regions. Some of this export growth is due to increasedmarket access and not changes in labor cost competitiveness. Structural changes inthe economy have also affected RULC across sectors….These changes in the sectoralstructure of exports and RULC may obscure the long-run relationship between thetwo (pp. 1332-1333).
In short, the Edwards and Golub approach offers limited guidance for un-derstanding how much lowering wages—or even unit labor costs more gener-ally, through either a wage or productivity channel—would contribute topromoting employment.
POLICY APPROACHES TO REDUCINGUNIT LABOR COSTS
Overall, then, we have considered in this chapter the evidence presented byLewis, Fallon and Lucas, and Edwards and Golub on 1) wage elasticities ofdemand, 2) real wage increases, 3) labor market rigidities, and 4) relative unitlabor costs and trade competitiveness. It is fair to conclude that, based on thisevidence, the argument that excessive wages and labor market rigidities are oneof the primary causes, if not the primary cause, of mass unemployment in SouthAfrica is based on a weak empirical foundation. As noted above, these authorsthemselves acknowledge this point to some extent. Nevertheless, even if theevidence presented on behalf of these arguments is itself weak, it is still possiblethat reducing unit labor costs could be a central feature of policies to attackmass unemployment. As such, we next address some considerations with re-spect to the four ways of reducing unit labor costs, i.e. wage cutting, raisingproductivity, increasing institutional flexibility, and using government subsi-dies to absorb some of businesses’ labor costs.
Wage Cutting
The government’s stated goal is to cut unemployment in half in 10 years. InTable 3.2, we present some figures which provide a rough sense of what wouldbe needed to achieve a reduction in unemployment through wage cutting alone,assuming a wage elasticity of demand of -0.7. As the table shows, there were 4.1million unemployed officially as of September 2004 and 11.6 million officiallyemployed in either formal or informal activity. Of those employed, 8.7 millioneither had formal jobs or worked in agriculture. Thus, based on this situation,to reduce unemployment by half would mean to create 2.1 million new formaljobs, i.e. an increase of 18 percent in the total number of jobs and 24 percent informal plus agricultural forms of employment.

33Supply-Side Perspectives on Employment Expansion
Assuming a wage elasticity of labor demand of -0.7, that would mean thata wage cut of 38.4 percent would be necessary to generate an additional 2.1million jobs. According to recent research by Casale, Muller, and Posel (2004),the average wage in formal economy employment, expressed in 2004 prices, isabout R3800 per month. Considering a wage-cutting scenario with formal jobsonly, to cut the average formal worker’s wages by 38.4 percent would mean thatthe new wage would be about R2340 per month.
What would this sort of wage cut imply with respect to living standards foraverage working families in South Africa? To address this, we can draw on thebenchmark “cost of basic needs” poverty line developed by the World Bankeconomists Hoogeveen and Ozler, to which we have referred in Chapter 2. Aswe noted in Chapter 2, the Hoogeveen and Ozler cost of basic needs povertyline was between R400 - 734 per month in 2004 prices. For the purpose of ourexercise, we work with the midpoint of their range as an individual poverty line,i.e. R567 per month. We then multiply this figure by four to establish a roughpoverty line for a family of four (the details of the reasoning for this calculationare in the footnote) 5. That brings us to a four-person poverty line of approxi-mately R2268/month. As we see from Table 2.2, this fall in the average wagewould mean that the average wage would fall from being 70 percent above thepoverty line for a family of four to being approximately equal to a poverty-linefamily income.
There would be both positive and negative ramifications of such a measure.On the positive side, of course, to begin with, 2 million more people would havejobs. Each of these workers would be able to support a family of four at a levelroughly equal to a midpoint poverty line. This is clearly an improvement inso-far as many, if not most, unemployed workers and their families currently livecloser to a destitution level. Even a modest income from this job would improvetheir living standard and increase their degree of attachment to the formaleconomy.
Table 3.2 Scenarios for Reducing Formal Unemployment by Halfthrough Wage Cutting(Assume wage elasticity of demand for labor at -0.70)
Total employment 11.6 millionFormal employment and agriculture 8.7 millionUnemployment 4.1 millionAverage real wage R3800Wage reduction needed to reduce unemployment in half 38.4%Wage level after wage cut R2340Estimated midpoint poverty line for family of four (based on Hoogeveen and Ozler individual poverty threshold) R2268

An Employment-Targeted Economic Program for South Africa34
On the negative side, nearly nine million workers—if we include thoseemployed both in the formal economy and in agriculture—and their familieswould experience a sharp decline in their real incomes. To take the case of thefamily whose working member is earning the average wage of R3800, the expe-rience would mean a nearly 40 percent decline in income. If this were also afamily of four, they would now be living at roughly the mid-point Hoogeveenand Ozler poverty line. The policy would clearly be pushing millions of work-ing families into, or at least close to, a state of poverty.
This would no doubt produce both demoralization and resistance amongSouth African workers. Resistance would take the form of strikes and otheractivities that would disrupt normal business activities. This in turn wouldworsen the environment for investors, both foreign and domestic.
To the extent that the average worker has outstanding debts, this measurewould of course make it more difficult for them to make payments on theirdebts, since their debt servicing costs/income ratio would become increasinglyburdensome. For example, if we assume that the average worker paid out 10percent of her income in interest and principal repayments, at the new wageaverage wage rate, this same debt level of R365 would now constitute 16 percentof income. This would in turn raise bankruptcy rates and make it more difficultfor financial institutions serving the middle class to grow.
Overall then, this approach will most likely engender negative countereffectsthat are at least as powerful as the benefit of 2 million more people obtainingjobs at wages roughly equal to the Hoogeveen/Ozler poverty line. Weighing allof these factors, significant wage cutting might seem to be a viable option forreducing poverty and unemployment only if there were no other policy optionsavailable.
Productivity
Raising productivity could of course lower unit labor costs. However, by defini-tion, it could not, on its own, increase employment, since a higher level of pro-ductivity would mean that the same amount of goods and services could beproduced with fewer workers. Indeed, as we have seen, a rise in capital intensityhas been a major factor pushing down the demand for labor. By contrast, thesolution to unemployment, at least in part, will entail generating growth in in-dustries and production technologies that have a higher level of labor intensity.
But there is an important corollary issue on the relationship between un-employment, wage cutting and productivity. This is that workers will tend tooperate more efficiently—at a higher level of productivity—when their wagesare increased. This is the so-called “efficiency wage” effect: that workers’ mo-rale and commitment to their job will rise when they are paid more. Lower jobturnover and worker absenteeism will be among the explicit outgrowths of the

35Supply-Side Perspectives on Employment Expansion
rise in worker morale associated with a higher wage standard. In light of thecurrent discussion, it is also important to recognize that this same efficiencywage effect will operate in reverse. That is, a strategy of wage cutting will en-gender reduced efficiency—more turnover, more absenteeism, lower morale onthe job. Thus, through this negative efficiency wage channel as well, a wage-cutting strategy would seem to be a viable strategy for reducing unemploymentonly if no other options were available.
The only way raising productivity can be supportive of increased labor de-mand is if the rise in productivity also induces an increase in aggregate demandfor products. This could occur through two channels:
1. The rise in productivity does increase export competitiveness to the extentthat it expands South Africa’s export market significantly.
2. Government infrastructure investments increase productivity, and also in-crease the opportunities for private investors. This creates a virtuous cycleof increased spending on public investment, leading to increases in privateinvestment and overall productivity. Job growth would then rise with theincrease in overall demand. However, note that even here, if productivitygrows faster than overall demand, there will not be a net increase in jobgrowth, but rather a further decline in employment for a given level ofoutput.
Wage Restraint and Institutional Flexibility
We concluded from our review above of the evidence on labor market rigidi-ties—from Fallon and Lucas as well as Lewis—that such rigidities are not likelyto be a significant cause of mass unemployment in South Africa. Still, SouthAfrica’s employment situation can benefit significantly through operating wage-bargaining and labor regulations as efficiently as possible. What do we mean bythis? For example, it is no doubt true that it is more difficult for a business tonegotiate with three separate unions rather than one. It is also better that therebe fewer, rather than more, work stoppages. Wage increases should also beroughly commensurate with productivity growth to maintain inflationary pres-sures within a moderate range. Increased flexibility along these lines couldcertainly be implemented in South Africa without being hostile to working peopleand unions.
Indeed, the union movement and unionized workers are likely to benefitdisproportionately through recognizing the benefits of flexibility along the lineswe describe here. In particular, when unions and business can conduct wage-setting negotiations in a relatively cooperative way as a means of avoiding a build-up of inflationary pressures, this in turn opens space for macroeconomic policyto be more expansionary. We take up this issue at greater length below in our

An Employment-Targeted Economic Program for South Africa36
discussion on incomes policies as an inflation-control measure. For now, wewish to emphasize one additional point on the issue of wage-cutting as a strat-egy and building a flexible industrial relations system—that in fact, a strategyof wage-cutting will undermine any effort to create more flexible and coopera-tive institutional arrangements. Indeed, pursuing a wage cutting agenda willprecisely strengthen resistance, and serve as a barrier to the development ofinstitutions through which wages can be negotiated and regulations made tooperate more flexibly.
Government Subsidizes Employment Creation
In principle, there are significant advantages to this method of lowering unitlabor costs. The key advantage is that workers are not being asked to experiencepay cuts in order to encourage businesses to hire more of them. In general, weshare Jeffrey Lewis’s favorable evaluation of employment subsidies when hewrites, “employment subsidies can be used as a strategy for increasing employ-ment without producing negative consequences for productivity and competi-tiveness.”6 Lewis makes clear that employment subsidies are a distinctivelysupply-side approach to expanding job growth through promoting more labor-intensive production methods. At the same time, Lewis holds that “employ-ment subsidies and demand-side job creation policies are not mutually exclusive.”
However, there are serious issues to address in attempting to implement aneffective employment subsidy program. The two broad forms that these mea-sures can take are either as a general or a marginal employment subsidy. Ageneral employment subsidy would apply to all workers, both new and alreadyemployed. A marginal subsidy would apply only when new workers are hiredfrom a previously established base of employees. A general subsidy programwould obviously be much larger in scope, and correspondingly much more ex-pensive, than a marginal subsidy program. It would also reward businesses sim-ply on the basis of their existing employment levels. But a marginal subsidyprogram, which does not face these problems, would also be much more diffi-cult to administer. Such programs require that there be some measurement ofwhat employment would have been without the subsidy program. As such, theycreate incentives for firms to under-report employment. They therefore alsowould place large administrative demands on the government.
Given these and related concerns, we present in a later section of this studya kind of hybrid employment subsidy program. More specifically, the measurewe propose is actually a credit subsidy program. But firms would be eligible toreceive subsidized credit on the basis of their ability to increase their hiring ofworkers within their own operations and to generate large employment multi-pliers through their demand for inputs from other firms (i.e. their upstreamemployment linkages). Relative to more standard general and marginal em-

37Supply-Side Perspectives on Employment Expansion
ployment subsidy measures, our proposal has these advantages: 1) it has fea-tures of both a general and a marginal employment subsidy program; 2) it iscapable of operating on a large-scale basis without requiring large direct gov-ernment expenditures; and 3) it can serve both to stimulate aggregate businessinvestment—for small, medium, and large-scale enterprises—on the demandside, while also promoting more labor intensive methods on the supply side.
NOTES
1. There is also a more heterodox theoretical approach to explaining economic growth in develop-ing countries advanced by Dani Rodrik and colleagues (see, for example, Rodrik 2004). Thisapproach begins without theoretical presumptions about how the labor market should clear andwhy involuntary unemployment cannot exist in a fundamental sense. Instead, this approach isflexible in considering the factors that might be promoting or inhibiting economic growth indeveloping countries. The explanation for mass unemployment would then be found within theframework of identifying the barriers to a robust growth path. In situations where growth hasbeen slow, this approach rather looks to an economy’s structure of relative prices as providingcrucial evidence as to the major barriers to achieving an accelerated growth path. Consideringthis approach within the South African context, one could argue that the fact that businessesare already substituting capital for labor while unemployment remains extremely high wouldsuggest that the high price of employing labor relative to capital—and high wages in particu-lar—is the fundamental barrier to a major employment expansion.
2. We are grateful to Dr. Lewis for sharing his private correspondence with van der Merwe on thistopic.
3. Using these racial groupings to proxy for skill categories of course does not in any way implythat we believe that whites are intrinsically endowed with higher skill levels. For the purposesof this exercise, we are using these proxies simply in recognition that, under apartheid, whitesin South Africa were given far more opportunities to develop their employment-related skills.
4. Furniture is the one other sector in the Edwards and Golub data set that shifts over the twoperiods from being above to below average in relative unit labor costs. But we are unable toobtain accurate data on trade growth at this level of sector specificity for these two periods.However, we do note that for the related Wood and Wood Products sector, we again see a de-cline, rather than increase, in export performance between the two periods, from a 28.6 percentaverage annual growth rate over 1970 - 79 to an 8.0 rate between 1995 – 98.
5. The reasoning for multiplying the midpoint Hoogeveen and Ozler line by four is as follows.The ratio of total population of South Africa relative to the total that are employed is approxi-mately 3.8. This suggests that each employed person in the economy is, on average, supporting3.8 people. As such, the wage to maintain a family at approximately the poverty line would bethe individual poverty line income level multiplied by 3.8, rounded up to 4. It is true thathouseholds operate with economies of scale, such that the poverty line for a family isn’t neces-sarily equal to that for an individual multiplied by the family size. But the Hoogeveen/Ozlerthreshold is within a broad band. As such, even allowing for economies of scale within a family,it is still reasonable that an appropriate four-person family poverty threshold would corre-spond to their individual threshold multiplied by the number of family members.
6. Lewis (2001), p. 35. Lewis’s overall discussion of this issue is on pp. 34-39 of his study.


4. A Policy Framework on Growth,Labor Intensity and Poverty Reduction
For South Africa to achieve its highly desirable goals in terms of employmentgrowth and poverty reduction, it will need to pursue policies along three di-mensions:
1. Increasing the rate of economic growth, i.e. the total amount of overall out-put produced in the economy each year.
2. Increasing the average labor intensity of output; and3. Increasing the degree of inclusion of the poor in society, and particularly in
the job market.
In this chapter, we identify the major types of policy interventions thatwill be needed to promote progress along all three dimensions—i.e to increaseeconomic growth, labor intensity of output, and the social inclusion of thepoor.
ECONOMIC GROWTH
By definition, the overall GDP of an economy can be broken down into fourcomponent parts: private investment, private consumption, net exports, andgovernment spending. Thus, in considering ways of raising the average growthrate of the South African economy, we need to consider the prospects for accel-erating growth in some combination of these four areas. We consider these inturn.
Private Investment
Private investment is correctly recognized as a foundation for successful long-term growth in South Africa. It is easy to understand why this should be so,since any economy that aspires to long-term improvements in productivity andaverage living standards must devise effective means of raising the quantity andquality of its capital stock.
39

An Employment-Targeted Economic Program for South Africa40
The level of private investment activity in South Africa has been disap-pointing since the transition to democracy in 1994. We can see this in Figure4.1. We see from the figure that investment/GDP had risen to a high point of29.7 percent in 1976, but that it has been falling steadily ever since. Since 1994,the decline in the investment share has halted, but there has been no steadymovement upward beyond this. As of 2004 investment accounted for only about16.1 percent of GDP.
The government has been clear in targeting an increase in investment asamong its highest priorities. President Mbeki listed “addressing the investmentchallenge” as one of the “four key challenges” in his address at the 2003 Growthand Development Summit. In the preliminary ASGISA documents and state-ments, it is clear that raising the rate of investment growth is a foundation of theprogram. The ASGISA aims to promote a 10 percent average annual increasein investment, which would in turn raise the investment/GDP ratio to 25 per-cent by 2014.
Sources of private investment growthAlan Hirsch, the Chief Director of Economic Policy in the Office of the Presi-dency, considers in a 2004 paper the factors that are contributing to the slowrate of investment growth. It is worth citing his assessment in some detail:
There are some objective reasons for the slow rate of investment. Both domestic andforeign investors are influenced by the relatively slow domestic growth rate, highinterest rates (which encourage short-term flows), and the volatile exchange rate.More subjective judgments include the extent of inequality and the potential forsocial conflict, where decisions might be made by investors based on their assess-ment, or the assessment of their advisors, of the perceived will and capacity of gov-ernment.
Other factors influencing investment include the high degree of concentration andcentralization of ownership in some market segments in South Africa, and share-holder pressure for short-term and certain returns.
Some factors influencing investment are as much the product of mindset and per-ceptions as objective facts. One is a concern about the crime rate and its impact ondoing business in South Africa, though the per capita incidence of crime is decreas-ing, and is no higher than in many of South Africa’s competitors, which are often lessopen about their crime statistics. Another is a contrary view or misunderstanding ofSouth Africa’s role or potential role in Zimbabwe. Some potential investors believethat the labour market regime inhibits investments, while others are concerned aboutthe expected or imagined effects of affirmative action on the employment prospectsfor whites.
For a few there is an underlying pessimistic view that interprets every possibleevent as a sign of South Africa’s inevitable failure. This in turn often derives from alack of understanding and trust between the potential investors of capital and thepolitical rulers. For unavoidable historical reasons, the cultural gap between politicaland economic leaders is unusually large in South Africa at this time.

41A Policy Framework on Growth, Labor Intensity and Poverty Reduction
Hirsh’s assessment in fact corresponds closely with standard academic analy-ses of the determinants of investment, both in general terms and specificallywith respect to South Africa. According to such standard models, there will befive basic factors—both “objective” and “subjective”—influencing investment.
1. The overall growth rate of the economy (the so-called “accelerator” effect).2. The costs of capital, including here both interest rates and tax rates.3. The expectations of profitability, based on past profit performances.4. The confidence about the long-term stability of the economic environment
and the broader social environment.5. The prospects for relatively higher returns from making short-term port-
folio investments—such as in stocks, bonds, foreign exchange, or derivativeassets—as opposed to investing in the creation of new capital stock.
To our knowledge, there have been four recent statistical models exploringthe determinants of investment in South Africa. These models are summarizedin Appendix 2. In addition, Prof. Léonce Ndikumana of our team has con-ducted new tests on the determinants of investment in South Africa over the 30-year period 1972 – 2001. Ndikumana’s model is conducted with detailed databased on nine industries and 27 manufacturing sub-sectors within the SouthAfrican economy.
In Ndikumana’s most recent model, as well as the four previous ones, all ofthe above-cited factors do play a role in influencing investment. But for the
12
16
20
24
28
32
1970 1975 1980 1985 1990 1995 2000
Inve
stm
ent/
GD
P in
per
cent
ages
Figure 4.1 Investment as a Share of GDP in South African Economy, 1970-2004
Source: Reserve Bank of South Africa.
Before democratic transition After democratictransition

An Employment-Targeted Economic Program for South Africa42
purposes of our study, the primary question is not simply to know that thesefactors do influence investment, but rather 1) How much do they influence in-vestment? and 2) What policy measures are available to the government to en-courage the factors that could raise the rate of investment?
In considering the results from Ndikumana’s model along with the fourprevious studies, we can reach the following conclusions about policies to pro-mote investment.
1. GDP Growth and Investment. All studies find that increasing the rate ofGDP growth will lead to an increase in investment. Ndikumana’s model suggeststhat increasing GDP growth from, say, 3 percent on average to 4.5 percent onaverage will increase the investment/GDP ratio by about one percent.
For policy purposes, government intervention can rapidly contribute to fasterGDP growth by injecting more government spending into the economy—thatis, by increasing the amount of money the government spends without increas-ing its tax revenues. This of course entails increasing the government fiscaldeficit. Increasing the deficit can also have other consequences, as we will dis-cuss below. But the point is that this is the most direct path through which thegovernment can increase spending in the economy, which in turn will lead tomore investment.
Beyond this, to raise the rate of GDP growth as a means of stimulatinginvestment presents a problem of time sequencing: more consumption spend-ing, more net exports, and more investment itself will all contribute to GDPgrowth, and faster GDP growth in turn stimulates investment. But that stillraises the question of how to raise consumption, net exports and investmentspending prior to the injection of faster GDP growth. We return to this pointbelow.
2. Cost of capital—interest rates and taxes. At one level, the five formalstudies all reached an unsurprising conclusion: that if one lowers taxes on busi-ness or interest rates, this will have a positive effect on investment. However,these studies do vary considerably as to how strong they expect the effects willbe of these measures to reduce the costs of capital. Most of the studies find thatthe effects are likely to be modest, perhaps not even detectible in a statisticalsense. Ndikumana has separated out the effects of lowering the interest ratesand corporate tax rates. He finds that reducing the real interest rate (i.e. thenominal rate minus the inflation rate) from, say, 10 percent to 8 percent will leadto an increase in the investment/GDP ratio of 1.3 percent. Ndikumana findsthat lowering the tax rate on business will not have any noticeable effect oninvestment.
However, even if we recognize that the effect of lowering the interest rate islikely to be modest, there is one important advantage to exploiting this effect for

43A Policy Framework on Growth, Labor Intensity and Poverty Reduction
policy purposes. That is, we do have policy tools that can lower interest ratesthrough a straightforward time-sequencing—i.e. we have the means to lowerthe interest rate and thereby encourage investment without having to wait forother changes in the economy to occur first. These policy tools are: a) mon-etary policy to lower the general level of market interest rates; and b) creditallocation policies to lower rates below market rates for firms that have beenselected to received subsidies. We explore ways of effectively implementingthese policies in Chapter 3.
3. Profitability. It should not be a surprise that most studies find thathigher profitability will encourage investment. However, it is unclear what fac-tors within the control of policymakers will be most effective at promoting prof-itability. For example, in Ndikumana’s model, increased governmentexpenditures on infrastructure will have a strong positive effect on investment.This is because improving, for example, the country’s roads, ports, irrigationsystems, and telecommunications systems will enable businesses to operate moreefficiently. According to Ndikumana’s study, increasing the share of public in-vestment relative to GDP from 5 percent to 7 percent (the average for Sub-Saharan Africa) will lead to approximately 6.7 percent more private investment.
Put in other terms, public investment in South Africa (and elsewhere)“crowds in” private investment to a statistically and substantively robust extent.Thus, the more resources the government can commit to expanding public in-vestment, the greater the likelihood that the economy can reach the statedASGISA goal of a 25 percent investment/GDP ratio by 2014.
It is also true that there are other paths of raising profitability, for examplelowering wages. Hirsh’s comments suggest that relatively high wages—the “la-bor market regime”—do dampen investment. However, as we have discussedabove, lowering unit labor costs through wage cutting is not a viable policy ap-proach. Among other important considerations that we have discussed above,pushing down wages will create social discontent, which will also engender aless stable investment climate. Of course, wages cannot rise in excess of pro-ductivity growth without cutting into profits and/or encouraging acceleratinginflation. This is precisely why, in Chapter 5, we discuss the establishment ofso-called “incomes policies” as a means of establishing an institutional environ-ment for sustainable wage growth.
4. Instability. As Hirsch’s observations convey, we can distinguish twotypes of instability that will influence private investment. The first is economicinstability, including exchange-rate volatility, rapid price changes in stock andbond markets, and rapid movements in the country’s overall inflation rate. Thesecond is social instability. This refers to factors such as the crime rate, labormarket disruptions such as strikes, and the degree of credibility enjoyed by the

An Employment-Targeted Economic Program for South Africa44
major political institutions. Both the economic and social indicators of instabil-ity have been found to exert a significant influence on investment. It is clearlybeneficial that exchange-rate fluctuations and other financial market disrup-tions be maintained at a relatively low level. The inflation rate should similarlybe maintained at a relatively stable level. A political climate such as that whichprevailed in the last decade of apartheid—with political repression, a high levelof strike activity, and major uncertainty as to the stability of the political sys-tem—will certainly discourage private investment.
The issue here again is the policy implication of addressing these influ-ences on investment. Monetary policy, exchange controls, and capital controlscan work to stabilize the exchange rate and inflation rate, as we will discussfurther below. Other measures can contribute here as well, including exchangeand capital controls to stabilize the exchange rate and incomes policies to con-trol inflation. In terms of social stability, the key considerations here are thevery things which are the basic focus of this study—i.e. the creation of decentjobs and the reduction in poverty. And here again, a program of lowering unitlabor costs through wage cutting would only work to reduce social stability.
5) Portfolio investments as an alternative to investing in capital stock.Trading in stocks, bonds, foreign exchange, or financial derivatives offer inves-tors the possibility of more rapid returns in the short term than would be pos-sible through investing in capital stock, especially in situations when the economyis operating at a high level of uncertainty. In Ndikumana’s model, the effects ofportfolio investment on capital investment operate through the level of publicdebt outstanding in the economy. He finds that an increase in the level of publicdebt relative to GDP does dampen expenditures on plants and machinery, andthat this effect is separate from the positive effects of an increase in public in-vestment expenditures on efficiency. What appears to be happening here is thatan increase in the supply of new government bonds provides an option for pri-vate investors which then reduces their willingness to spend on structures andmachinery.
This effect of investors substituting portfolio investments like governmentbond purchases for real investments in machinery and buildings is consistentwith the data that show an explosive rise in portfolio trading in South Africa.We can see this from Figure 4.2, which shows the trends in the secondary trad-ing on South Africa’s stock and bond markets. The general story from thesefigures is clear. On the lower scale of both panels, we see the trend of grosscapital expenditures declining sharply as a share of GDP from the 1980s on-ward. But along with this well-known pattern, we also see a rise in secondarymarket trading in stocks and bonds as a share of GDP. Beginning in the mid1990s, this increase in secondary market stock and bond trading relative to GDPexplodes. This is most pronounced with respect to the bond market, with bond

45A Policy Framework on Growth, Labor Intensity and Poverty Reduction
10
15
20
25
30 0
20
40
60
80
1970 1975 1980 1985 1990 1995 2000
Inve
stm
ent/
GD
P sc
ale
Stock trading/GD
P scale
10
15
20
25
30 0
400
800
1200
1600
1970 1975 1980 1985 1990 1995 2000
Inve
stm
ent/
GD
P in
per
cent
ages
Bond trading/G
DP in percentages
Figure 4.2 Stock Trading, Bond Trading and Capital Investment in South Africa,1970 – 2004
Source: Reserve Bank of South Africa.
Secondary stock markettrading/GDP
Gross capital investment/GDP
Secondary bond markettrading/GDP
Gross capital investment/GDP
A) STOCK MARKET TRADING AND CAPITAL INVESTMENT
B) BOND MARKET TRADING AND CAPITAL INVESTMENT

An Employment-Targeted Economic Program for South Africa46
trading rising from an average of 0.9 percent of GDP over the 1970s to an aver-age of 483 percent in the 1990s—i.e. the value of bonds traded in the SouthAfrican exchange was nearly 5 times in excess of the economy’s GDP. Thefigure for 2004 was 685 percent—i.e. nearly 7 times GDP.
The rate of increase in stock market trading is well below that of the bondmarket. Still, considered on its own terms, stock trading rises five-fold from the1970s to the 1990s relative to GDP, and, considering the figure for 2000, therewas an 11-fold increase relative to the average for the 1970s.
The key point in all of this is that, despite the explosive growth in thesesecondary markets, this growth does not correlate with positive developmentsin terms of either productive investment growth, GDP growth or the invest-ment/GDP ratio. Of course, these figures do not, on their own, suggest any-thing about possible directions of causation between the explosion of trading onsecondary financial markets and the decline of productive investment growth.But one can at least observe that 1) the level of portfolio trading is growingexponentially in South Africa’s financial markets; while 2) real productive in-vestment is, at best, stagnating. The policy implication of this pattern is thatgovernment should create incentives for investors to channel funds into pro-ductive investments as opposed to portfolio trading. We will discuss details asto how to accomplish this in our consideration of credit allocation policies.
Raising saving rates to promote investment. A widely held view is thathigh saving rates are the main factor that will encourage higher investment,both for the South African economy today and more generally. Indeed, debatesabout the validity of this perspective have occupied economists for literally hun-dreds of years. This study certainly is not the place to review that debate, muchless attempt to resolve it.1 However, for our discussion here, there is a straight-forward way of at least getting to the heart of the issue without having to plungeinto long-standing controversies in economics. The point is that, even if weallow that high saving is a precondition for high investment, it is still the casethat the channel through which saving influences investment is through interestrates. That is, high saving is said to produce high investment because high sav-ing will lead to lower interest rates, and the lower interest rates, in turn, willencourage investment.
Once we recognize this interest rate channel through which high saving issupposed to produce high investment, it is then clear that the models by Ndikumanaand the others that we have reviewed for South Africa do effectively measure thepotential influence of the saving rate on investment. This is because these modelsdo investigate the influence of interest rates on investment. It is true that themodels do not take one step backward from examining the investment/interestrate nexus, to try to measure the extent to which the saving rate, relative to otherpotential factors, may influence movements in interest rates. But in fact, neither

47A Policy Framework on Growth, Labor Intensity and Poverty Reduction
the theory nor the evidence is strong that low saving rates themselves producehigh interest rates or vice versa. For example, there was a sharp increase in SouthAfrica between 1980 – 2000 in the level of lending and borrowing in the domesticeconomy relative to a given rate of saving. Domestic lending equaled 38.3 percentof gross saving in 1980, but rose to 122.3 percent in 2000. It is this ratio of lendingrelative to saving, rather than the saving rate itself, that exerts direct influence onlong-term interest rates.2 But this, in any case, is a secondary issue for our pur-poses. The main issue is how interest rates affect investment, whatever may be thevarious factors that in turn affect interest rates.
Foreign direct investment for South AfricaThe models that we have reviewed of the factors determining investment pat-terns in South Africa are meant to apply to both foreign and domestic invest-ment. The underlying point is that the same factors that will encourage domesticfirms to spend money on new structures and machinery—the overall level ofdemand; interest rates; profitability; uncertainty; and the alternative of buyingstocks, bonds, and derivative financial assets as opposed to new structures andmachinery—are likely to also be the major factors influencing the investmentdecisions of foreign businesses.
At the same time, South Africa, like many middle- and low-income coun-tries in the current global economic policy environment, has had high expecta-tions about prospects for attracting foreign direct investment (FDI), especiallyin response to the end of apartheid. Indeed, the GEAR program had predicteda sharp increase in FDI, and this increase in FDI, in turn, was anticipated tohave been a major engine of growth for the economy. But this has not occurred.We can see this from the figures in Table 4.1, which, for the years 1996 – 2000,shows the GEAR program projections for FDI flows into South Africa and whatthe actual flows were in these years. As we can see from the table, the actualinflows of FDI were below the GEAR projections in each of the years otherthan 1997. However, even in 1997, the sharp increase in FDI was due to severalmergers and acquisitions, as opposed to “greenfield” investments in new equip-ment and machinery.
The pattern shown in Table 4.1 is consistent with the broader pattern ofevidence presented in Stephen Gelb and Anthony Black’s survey of FDI in Af-rica, including South Africa. With respect to South Africa specifically, Gelband Black conclude:
The majority of new foreign investors entering South Africa during the 1990’s estab-lished small or medium size affiliates with limited impact on employment creation orcapital inflows. Nearly half the entries involved acquisitions of existing operations,rather than greenfields or joint ventures setting up new enterprises. Many investorsmitigated risk by limiting the irreversibility of their investment, by outsourcing pro-duction and focusing on services (2004, pp. 210-11).

An Employment-Targeted Economic Program for South Africa48
Considering South Africa’s recent experience with FDI in comparativeterms, the evidence shows that South Africa receives fewer inward flows of FDIand more inward flows of portfolio investment—stocks, bonds, and derivativeasset purchases—than comparable countries such as Egypt, Mexico, Thailand,and Uruguay (IMF 2003, 2004). South Africa also appears to be a larger sourceof FDI outflows than other countries at its level of development. This is cer-tainly the case relative to other countries in Africa, where South Africa is thelargest source country for FDI inflows (UNCTAD 2004).
There is no full consensus as to why FDI inflows into South Africa havebeen significantly lower than some observers had expected. The relevant econo-metric findings are broadly consistent with the evidence we have reviewed as tothe factors influencing investment in general, i.e. both domestic and foreigninvestment. This evidence suggests that that faster economic growth, improve-ments in the public infrastructure, a more skilled work force, and a more stablerand would all encourage more FDI. However, the fact that South Africa hasnot been attracting FDI to the same extent as comparable countries suggeststhat, at least in the short-term, it may need to rely at this stage primarily ondomestic investment to first raise the country’s investment rate. The expecta-tion would then be that foreign investors would respond favorably to a higherlevel of domestic investment and economic growth.
Overall policy conclusions for promoting investmentFive overall conclusions flow from the foregoing discussion that will be centralfor our focused discussions in the next section on policy approaches:
1. An increase in the overall rate of GDP growth will lead to more investment.This effect is likely to operate first on domestic investment, and only with atime lag on foreign investment. Government deficit spending can promoteGDP growth to some extent, especially if the spending associated with therise in government borrowing is targeted to increase public investment.
Table 4.1 Foreign Direct Investment into South Africa, 1996 – 2000:GEAR Projections vs. Actual Investment Flows(figures are in millions of dollars)
1996 1997 1998 1999 2000
GEAR 155 365 504 716 804Actual1 8 3006 -249 691 77
1 Relative to 1994-1995 average of FDI inflows of $810.5 million.Sources: GEAR, p. 7. UNCTAD (2004), Table Annex: B.1.

49A Policy Framework on Growth, Labor Intensity and Poverty Reduction
However, excessive reliance on government borrowing can be counterpro-ductive, as we will discuss further in the discussion on fiscal policies.
2. Lowering interest rates will certainly stimulate productive investment. Thisinterest rate effect may be modest, but there is still an important advantageof lowering interest rates as a policy intervention. It is that at least thedirection of effect is certain and there is no difficulty in terms of establish-ing the time sequence between the policy intervention—i.e. monetary orcredit allocation policies to lower interest rates—and the intended effect—i.e. making cheaper credit available to private investors.
3. Stabilizing exchange rates, the financial markets, and fluctuations in infla-tion can contribute to promoting both domestic and foreign private invest-ment. The policy mechanisms to achieve these outcomes would involvemonetary policy and incomes policies for the exchange rate and inflationrate, capital controls for the exchange rate and financial markets, and finan-cial market regulations to promote stability.
4. Increased social stability should also promote both domestic and foreigninvestment. But improving social stability will itself come through a broaderprogram of increasing employment opportunities and the social inclusionof the poor. Efforts to reduce unit labor costs through wage cutting will, bycontrast, provoke social unrest and thereby discourage investment.
5. The opportunities to move funds into speculative portfolio trading do dis-courage investment in buildings and machinery. Policies to raise the costsof portfolio trading relative to productive investments—including measuresthat we discuss below to raise the costs of portfolio trading while concur-rently providing subsidized credit to employment-expanding productiveinvestments—should therefore contribute to promoting productive invest-ment
Private Consumption
In 2003, household consumption spending constituted 64 percent of total do-mestic spending in the South African economy. Should it be a goal of policy toincrease consumption spending as a means of promoting economic growth, asopposed to limiting consumption spending and thereby raising private saving?
As discussed earlier, this set of questions around saving, investment, andconsumption is at the heart of long-standing controversies as to whether anincrease in saving is the prior basis for an increase in investment. In our discus-sion above, we were able to avoid working through this entire debate by posinga more focused question: what are the direct factors influencing investment?Within the consideration of direct factors, it is clear that increasing overall de-mand in the economy—which includes consumption demand, as well as invest-ment, net exports and government spending—will promote investment and

An Employment-Targeted Economic Program for South Africa50
economic growth. We can therefore assume that raising the overall level of con-sumption of domestically-produced goods in the economy will promote fastereconomic growth, assuming all other factors are otherwise equal. How then toraise the overall level of consumption?
Consumption and income. Consumption spending will generally varyclosely with changes in income. Within our own model for South Africa devel-oped by Prof. James Heintz, we find that, within a longer-term framework (i.e.3–6 years)3, a 1 percent increase in household income will produce somethingclose to a 1 percent increase in consumption.4 This result is broadly consistentwith the findings of previous models for South Africa and models for othercountries. Prof. Heintz explains his consumption model in Appendix 3.
Domestic versus imported goods. In 2000, South Africans spent an esti-mated 92 percent of their total consumption spending on domestically producedgoods and 8 percent on imports.5 Obviously, only the spending on domesticgoods promotes economic growth in South Africa. Thus, policy measures toincrease the proportion of spending on domestic goods will also promote eco-nomic growth in South Africa.
Consumption and interest rates. A fall in interest rates will induce an in-crease in consumption. According to Heintz’s model, the effect of this will beweak in the short run, but will become more significant within a 3 – 6 year timeframe. Thus, if the interest rate on lending falls from say, 10 percent to 9 percent,this should lead to an increase in consumption of about 2 percent. That wouldmean that, at the 2004 household consumption level of R870 billion, lowering theaverage lending rate from 10 to 9 percent would bring R17.4 billion more spend-ing into the South African economy. This result is also broadly consistent withfindings of previous studies on South African consumption behavior.6
There are two distinct channels through which this interest rate effectwill work in South Africa. One effect is that the lower interest rates will en-courage consumers to borrow more, and thereby increase their purchases ofhomes, cars, and consumer durables. The other effect will be to lower thepayments households have to make on their existing debts, since payments onmost debts vary with changes in interest rates. Through this channel, even ifconsumers do not borrow more money due to the fall in interest rates, theywill still have more income to spend, since it will require less money to pay offtheir existing debts.
Consumption and inflation. Another feature of Heintz’s model is thatincreases in inflation will lead to a decline in consumption spending in the shortrun, i.e. within the first six months after an inflationary increase. However,

51A Policy Framework on Growth, Labor Intensity and Poverty Reduction
these effects of a moderate rise in inflation will dissipate after roughly six months.Overall, therefore, the impact of moderate increases of inflation on consump-tion will be negligible as long as real disposable income remains unchanged.Inflation that results in a reduction in real household incomes would have anegative impact on consumption.
The three key policy considerations for promoting growth through con-sumption will therefore be: 1) raising incomes; 2) increasing the proportion ofspending on domestically produced goods; and 3) lowering interest rates.
Among these three, we again need to consider the issue of time-sequencingof policies.
Income channel. Raising incomes will be an effect of economic growth. Inparticular, higher incomes will result from increasing the number of jobs andraising incomes for the poor. But we cannot expect to obtain much of a boost inconsumption through this channel until there is a prior expansion in jobs andeconomic growth.
Domestic spending channel. Increasing the share of domestic goods in theoverall consumption basket will result through a longer-term strategy of build-ing up import-competitive industries in South Africa while maintaining a stableand competitive exchange rate. It will also occur as the income distributionbecomes more equalized, since lower-income households will have a higher pro-portion of domestically produced goods in their consumption basket than moreaffluent households. Low-income households will spend most of their incomeson food, housing, and services such as transportation.
Interest rate channel. Here again, the policy of lowering interest rates willhave the advantage of providing a clear short-term time-sequencing betweenthe policy intervention and its intended effects. A fall in the interest rate willinduce more spending, which in turn promotes economic growth and invest-ment in a clear sequence of steps: i.e. 1) lower interest rates lead to 2) moreconsumption spending; which produces 3) an increase in overall spending; lead-ing to 4) more investment.
Net Exports
An export-led growth strategy is of course a major feature of the neoliberalapproach to promoting economic growth in developing countries. There is noquestion that developing countries in general, and South Africa in particular,can benefit through increasing their net exports. Among other things, for SouthAfrica to maintain a healthy level of net exports relaxes the constraints on thecountry’s balance of payments that might otherwise result from a rising rate of

An Employment-Targeted Economic Program for South Africa52
imports as economic growth accelerates. However, the relevant question forSouth Africa is to determine realistically whether net exports can serve as theprimary engine of economic growth and job creation at present or in the fore-seeable future. Our view, as we discuss below, is that this is not likely, even whilewe also recognize clear benefits through promoting exports as one componentof a broader growth strategy. As such we favor a balanced approach, in whichexports are seen as one component, though not the primary engine, of an overallgrowth strategy. This approach seems fully consistent with the ASGISA frame-work, at least in its current preliminary form.
The benefits of a strong export sector are clear. First, successful exportingfirms are a major source of decent jobs in high-productivity industries. Thesesectors can also generate important up- and downstream linkages to labor inten-sive industries, such as agriculture, that will primarily serve the domestic mar-ket. We therefore aim to propose a set of balanced export-promoting and sectoralpolicies as one feature of an overall program to accelerate economic growth,expand employment and reduce poverty. We do not expect that such policieswill generate a surge in net exports or employment, since, among other things,the current South African economy is also still strongly dependent on importsin several key areas. Indeed, according to Ndikumana’s investment model, in-vestment growth responded positively to appreciations of the rand. This sug-gests that, at least for investors, they rely more heavily on obtaining importedinputs and capital goods at lower rand prices than they do on selling the prod-ucts they produce on export markets.
Even while export promotion will not be the primary source of growth inthe economy, it will still be important to sustain a successful export sector of theeconomy in order to allow the economy to grow at an accelerated rate withoutcreating an excessive demand for imports relative to export capacity. It is withthis policy concern also in mind that we review factors influencing both exportsand imports in South Africa.
Trade, export growth, and employmentIn the 1990s, South Africa continued a process of trade liberalization that beganin the 1980s with an aim to integrate the country more fully into the globaleconomy. Through this period, trade protections were reduced on average(Cassim et al. 2003, Department of Trade and Industry 2002, Edwards 2001a).Although the 1990s can be generally characterized as a period of liberalization,it is important to recognize that significant levels of protection remain in place(Cassim et al. 2003, Fedderke and Vaze 2001). Furthermore, the extent of liber-alization varies from sector to sector and the level of enforcement remains un-even (van Seventer 2001, Cassim et al. 2003, Fedderke and Vaze 2001).
Trade liberalization in the post-apartheid era has been seen as an importantcomponent of a more general process of “transformation towards a competitive

53A Policy Framework on Growth, Labor Intensity and Poverty Reduction
15
20
25
30
35
40
1960 1965 1970 1975 1980 1985 1990 1995 2000 2005
Perc
enta
ges
outward-oriented economy” (National Treasury 1996) articulated in thegovernment’s early macroeconomic growth strategy. Greater integration was togive South Africa access to new markets, expose industries to competitive pres-sures to erode apartheid-era inefficiencies, reduce the cost of imported indus-trial inputs, allow the country to take advantage of scale economies, and encouragethe economy to move up the value chain in export-oriented industries. In thisregard, trade liberalization was an important part of an overall strategy aimed atindustrial diversification and restructuring.
As we see in Figure 4.3, exports as a percent of GDP have increased since1994. This provides evidence of a growing outward-orientation of the SouthAfrican economy. Exports as a share of GDP only reached similar magnitudesin the late 1970s and early 1980s during a speculative rise in the price of gold.However, the recent growth in exports cannot be explained simply as an out-come of increased openness. The fall in the value of the rand during much ofthis period contributed significantly to the expansion of exports.7
The majority of South Africa’s exports are currently purchased by advancedindustrial economies — approximately 66 percent in 2003. Figure 4.4 shows theshare of exports by destination country or region. The United Kingdom, the UnitedStates, Japan, Germany, and other European Union countries are the main mar-kets for South African exports. Improving access to these markets through bilat-eral and multilateral negotiations remains a priority for the country’s trade policy.However, market access will also depend on the country’s competitiveness relativeto these importing economies and other developing country exporters.
Figure 4.3 Exports as a Percentage of GDP in South Africa, 1960–2005
Source: Reserve Bank of South Africa.

An Employment-Targeted Economic Program for South Africa54
The impact of trade liberalization on employment and earnings remains anarea of controversy. On the one hand, critics of South Africa’s current rate ofliberalization argue that global integration has been a significant cause of thecountry’s poor performance in job creation. On the other hand, proponents ofliberalization counter that trade policy has had a net positive impact on employ-ment, while other factors, such as technological change or excessive labor costs,are responsible for low rates of employment growth.
The expansion of exports has contributed to economic growth and has hadan undeniably positive impact on employment, if considered in isolation (Edwards2001a). However, an assessment of the impact of liberalization cannot be lim-ited to an examination of export trends. There is general consensus that importpenetration increased rapidly during the post-apartheid years (Edwards andGolub 2004, Cassim et al. 2003, Edwards 2001a and b, Bell and Cattaneo 1997).The net impact on employment depends on how the positive effects of exportgrowth balance with the negative effects of greater import penetration.
Assessing the effect of liberalization on employment is made more complexby the differential impact of export growth and import penetration on the vari-ous sectors of the economy. In general, exports have expanded in relatively morecapital-intensive sectors of the South African economy while import penetra-tion has been concentrated in the most labour-intensive sectors (Edwards 2001,Bell and Cattaneo 1997). This dynamic is paradoxical: South Africa, with highrates of unemployment and a large labor surplus, is increasingly exporting capi-tal, but importing labor. It raises serious concerns that trade liberalization will
0
5
10
15
20
25
Perc
ent o
f Sou
th A
fric
an E
xpor
tsFigure 4.4 Share of South African Exports by Country/Region, 2005
Source: IMF Direction of Trade Statistics 2006.
OtherEurope
Africa
U.S.U.K. Japan
OtherAsia
Germany Allothers
China
OtherWesternHemi-sphere

55A Policy Framework on Growth, Labor Intensity and Poverty Reduction
be job-destroying on average (Bell and Cattaneo 1997). This pattern is clearlyconsistent with the broader evidence we have reviewed on rising capital inten-sity over the aggregate South African economy.
Sectoral analysis of the manufacturing sector suggests that industrial com-position in South Africa has not shifted dramatically during the post-apartheidperiod (Chabane et al. 2003, Edwards 2001a). Much of the increase in capital-intensity of the South African economy happened within sectors and was not aresult of capital-intensive sectors increasing their share of total production inresponse to trade liberalization. Taking all these factors into account, researchsuggests that the net impact of trade on employment in recent years has beenpositive, but small (Edwards 2001a). However, the estimated impact of patternsof trade on employment cannot be ascribed to trade liberalization alone. Asmentioned above, more competitive exchange rates during much of the post-apartheid era would have bolstered export performance and limited the harmcaused by import penetration. If the exchange rate remained at its 1994 levelthroughout this period, the net impact of trade liberalization on employmentcould very likely have been negative.
The growing capital-intensity of exports reduces the direct employment-creating potential of expanding trade. However, growth in exports can have in-direct effects on employment by raising national incomes, increasing demandfor the products of upstream industries, and generating multiplier effects else-where in the economy. This is most likely to happen when the growth in exportsis associated with movements up the global value chain so that South Africacaptures an increasing share of global value added. However, export-driven in-creases in value added are not a foregone conclusion. For example, in manycountries, increased product assembly and production of components for highvalue-added global industries (e.g. electronics and motor vehicles) has not raisedthe value added of manufactured exports (UNCTAD 2002). This occurs whenintense competition in these segments of the global production networks andreliance on imported inputs limit the value added that these sectors capture.
In summary, trends in international trade have not had a sizeable positiveimpact on economic growth or employment in South Africa. The growth andemployment gains associated with export growth have largely been offset by thenegative impact of import penetration. The increasing capital-intensity of ex-ports also raises doubts as to whether an export-led growth strategy will be ableto meaningfully address the country’s unemployment challenge. This is not toclaim that export growth has not had positive impacts on employment in recentyears, but rather to question whether the current magnitudes of the employ-ment effects are sufficient to significantly contribute to reducing unemploy-ment.
These observations lead to an overall policy approach: to continue to pro-mote exports because it creates decent jobs and good opportunities for sectors

An Employment-Targeted Economic Program for South Africa56
of the economy to grow. In addition, exports will need to continue to grow toprevent a trade imbalance from emerging, assuming that imports will increasealong with an accelerated rate of economic growth. At the same time, based onthe evidence to date, one should not expect there to be a big boost to economicgrowth coming directly from net exports.
Government Spending
As mentioned above, increases in government spending financed by a fiscal deficitwill provide a direct injection of spending into the domestic economy. Thisdeficit-financed increase in government spending, in turn, will increase invest-ment through the overall spending channel—i.e. investment increases in re-sponse to increases in overall spending in the economy.
At the same time, increasing the fiscal deficit raises other issues beyondsimply the straightforward fact that it is a reliable means of injecting spendinginto the economy in the short run. As mentioned above, the deficit also setsoff countervailing forces, such as the fact that the greater availability of gov-ernment bonds for sale allows investors to purchase these bonds rather thanspend their money on new productive investments in buildings and machin-ery.
Given this array of countervailing factors, it will be necessary to addressthe overall effects of deficit spending within a broader framework of thegovernment’s fiscal policy stance. This is an issue to which we return in Chap-ter 5 of this study.
INCREASING LABOR INTENSITY
We have seen earlier the evidence on South Africa’s rapidly declining rate oflabor intensity relative to the economy’s total production of goods and services.We saw, for example, that just between 1994 and 2001, nearly two fewer workerswere used in formal employment to produce R1 million in output. We also haveseen from our simple hypothetical exercise projecting alternative economicgrowth and labor intensity projections into 2014, that, independent of changesin the economy’s growth rate, around 2 million jobs will be lost if this pattern ofdeclining labor intensity continues through the next decade.
The government has advanced a major initiative to promote labor intensiveproduction methods. This is the so-called Expanded Public Works Program(EPWP), which is precisely a measure to promote labor intensive techniques inmany of the governments’ public works projects. However, the EPWP, at itscurrent level of implementation, is not capable of generating a significant im-provement in overall employment. Moreover, the information we have to date
57A Policy Framework on Growth, Labor Intensity and Poverty Reduction
suggests that the government has no plans in place to significantly increase theEPWP program beyond the measures currently being pursued.
In this section, we begin by reviewing the basic problems with the EPWP atits current level of implementation. We then shift our focus to examine a sec-ond, related approach to reversing the trend toward declining labor intensity.This is to promote accelerated growth among South African firms that are ca-pable of generating high “employment multpliers” — that is, firms that willproduce a large number of jobs throughout the South African economy for agiven amount of spending, utilizing their current production techniques. Iden-tifying such firms will, in turn, serve as a basis for our later discussions in whichwe propose a program of credit subsidizes to promote the growth of labor in-tensive business expansion.
Expanded Public Works Program
The most prominently discussed explicit initiative in the area of job creation is theExpanded Public Works Program (EPWP). To date, this has been developed as a5-year, R20 billion government program. As mentioned above, we are not awareof plans within the ASGISA initiative to expand the size of this program.
The program, to date, includes the following components:
1. R15 billion for infrastructure investments - increasing the labor-intensity ofgovernment-funded infrastructure projects, including building of roads,bridges, and irrigation systems;
2. R4 billion for environmental investments - creating work opportunities in publicenvironmental improvement programs; and
3. R600 million for social services - creating work opportunities in public socialprograms, e.g. home-based care workers and early childhood developmentworkers.
The aim of this program is to create 1 million “cumulative work opportuni-ties” over five years. Included in the 1 million work opportunities are both part-and full-time jobs. According to the legislation which governs the EPWP, alljobs created under the program are to be limited to no more than two years induration. This is true even while employment at least in the areas of environ-mental improvement and social services are not project-specific and, in prin-ciple, could be of longer duration. In practice, almost all the jobs created throughthe program are full-time. But all of them are temporary, with an average dura-tion of four months. Moreover, only 200,000 people are employed in this pro-gram at any one time.
In what sense does such a program constitute an “expanded” public worksprogram? In his September 2004 article (2004a) in ASIST, Sean Phillips, the

An Employment-Targeted Economic Program for South Africa58
director of the program within the Department of Public Works, focuses onthree considerations (see also Phillips 2004b):
1. Public works programs are being expanded beyond the traditional focus oninfrastructure into social, environmental, and economic work activities;
2. The EPWP does not involve the development of a new program—it in-volves the consolidation and expansion of existing best practices across gov-ernment; and
3. The intention is to stimulate an increase in budgets for components of theprogram that prove to be successful.
In principle, the government’s initiative to pursue an expanded public worksprogram as a means of increasing employment is a major positive development.However, as it is being implemented, the program is not capable of significantlyreducing unemployment or poverty. This is true despite reports in the pressthat may have created inflated expectations. For example, an article in the CapeTimes under the heading “Massive Public Works Jobs Plan to Deal Blow to Pov-erty and Lift Economy to New Level” includes the following passage:
The government is to unveil a ‘massive’ public works jobs plan to deal a blow topoverty and take the country to a new level of economic development. Speakingyesterday at the release of the Towards a Ten Year Review, government spokesmanJoel Netshitenzhe said the plan would lead to the employment of hundreds of thou-sands of people at a time. “It will be quite massive. It might not require new re-sources but it will involve better utilisation of projects that exist already” (17/10/03).8
There are three basic problems with the EPWP as it has been implementedto date. The first is that it is simply too small to be expected to make a seriousdent in the country’s unemployment problem. Referring to the R3 billion/yearfor public infrastructure expenditures, McCord and van Seventer (2004) havegenerated a provisional estimate that this level of spending will produce a netincrease in employment of about 80,000 jobs/year. The term “net” here refersto the fact that the program does not entail new government expenditures oninfrastructure, but rather that more labor-intensive methods of production willbe utilized with the projects that have already been budgeted. The net creationof jobs through this program therefore refers to the number of jobs createdthrough utilizing labor-intensive production technologies as opposed to ma-chine-intensive methods. McCord and van Seventer describe, for example, thepilot Gundo Lashu road-building project in Limpopo that utilized labor inten-sive methods. According to their preliminary estimate, the total employmentfrom this project was four times greater than what would have occurred throughutilizing machine-based techniques.

59A Policy Framework on Growth, Labor Intensity and Poverty Reduction
This increase in employment that results from utilizing the labor-intensivemethods is certainly to be welcomed. However, given an official labor market of15.8 million, with an official unemployment rate of 26.2 percent (4.1 millionpeople), the generation of 80,000 net jobs from the EPWP would reduce theunemployment rate by one-half of a percentage point—i.e. unemployment wouldfall from 26.2 to 25.7 percent. This is less than the statistical margin of error inthe estimation of the unemployment rate.
The second problem with the program is its stipulation that all employ-ment opportunities created under the program are to be of limited duration—being employed, for example, on a single road-building project with the jobending once the road has been successfully completed. It is true that jobs in-volving the construction of infrastructure lend themselves naturally to a lim-ited, project-specific time commitment. However, jobs in the areas ofenvironmental maintenance and social services do not reach such natural comple-tion points. There is nothing inherent in these types of jobs that would makethem limited in duration.
The fact that the jobs are stipulated to be of limited duration is especiallyproblematic because such jobs do not generally provide longer-term benefits toworkers. Thus, in surveying workers who had been employed in public worksprojects in Limpopo and KwaZulu Natal, Anna McCord of the University ofCape Town (2004a) found that the stability of employment and income were themost important things workers were seeking through the employment opportuni-ties generated by public works projects. These considerations were more impor-tant than the amount of money being earned during the time of employment.Moreover, McCord found that those who worked at temporary jobs in public worksdid not improve their prospects for permanent jobs. Indeed, in her survey offormer workers on the Gundo Lashu program in Limpopo, McCord found thatthe unemployment rate among former public works project employees was 80percent, compared with a mean rate of 60 percent among the rural Limpopo popu-lation. This finding contradicts the anticipation of proponents that one importantbenefit of even such temporary jobs is that they would provide valuable labormarket experience to people who have been chronically underemployed. Eventhe brief job experience provided by the EPWP is supposed to increase the attach-ment of the chronically underemployed to the formal labor market. This appearsnot to be the case. And because these short-term public works jobs do not appearto provide longer-term labor market benefits to the workers employed by them, itis not surprising that, according to McCord, they also are not likely to providelonger-term benefits in terms of poverty reduction.
The third problem is with the basic idea of relying on increases in the laborintensity of existing infrastructure projects as a major source of job creation.Again, increasing labor intensity without significantly sacrificing efficiency is adesirable goal in its own right. However, it is not likely to yield significant ben-

An Employment-Targeted Economic Program for South Africa60
efits in employment growth even if we allowed that all infrastructure projectscurrently budgeted in South Africa—i.e. the roughly R30 billion/year in spend-ing, rather than the R4 billion currently falling under the rubric of the EPWP—followed the principle of increasing labor intensity. We can see this through thefollowing simple exercise.
1. As we saw in Table 2.4, the employment/output ratio for the entire economy,including both formal and informal types of jobs, in 2004 was 8.6 jobs/R1million in output. Taking the inverse of this figure—an output/employ-ment ratio—we obtain that every employed worker produces, on average,roughly R116,000 in output per year (i.e. R1 million/8.6 workers).
2. If we assume that this infrastructure is produced at roughly the averageoutput/employment ratio for the economy overall, this means that the R30billion expenditure on infrastructure projects would employ a little lessthan 260,000 people (i.e. R30 billion/116,000).
3. Assume that more labor-intensive production methods were utilized on allR30 billion in new infrastructure spending, such that the demand for labordoubled per unit of infrastructure provision. This is an implausibly largeshift in relative labor intensity, but is nevertheless useful for illustration. Sucha shift in labor intensity of infrastructure production would mean that theinfrastructure expenditures would directly produce an additional 260,000 jobsrelative to what would otherwise result through spending at the existing out-put/employment ratio. Note that there would be no large-scale multipliereffects from this shift to more labor intensive methods, since the programdoes not call for an increased level of overall spending by the government.
A net increase in employment of 260,000 jobs would certainly be welcomein South Africa. However, to put this gain in perspective, it would mean reduc-ing the official level of unemployment from 4.1 to a bit less than 3.9 millionpeople, which translates into a decline in the official unemployment rate from26.2 to 24.6 percent. Note that this same basic conclusion would hold even ifwe assumed—still more implausibly—that the labor intensity on the R30 bil-lion in infrastructure projects were to triple relative to current prevailing tech-niques. This would produce roughly 500,000 new jobs, which again wouldrepresent major progress. But it would still mean that 3.6 million as opposed to4.1 million people would be jobless—an unemployment rate of 23.0 rather than26.2 percent.
The overall conclusion from this exercise is that even if we greatly expandthe concept of the EPWP to cover fully R30 billion/year in infrastructureprojects, this still wouldn’t make a serious dent in reducing unemployment, andthereby, in reducing poverty as well. This is because the concept of the EPWPis based on shifting existing levels of government expenditure commitments

61A Policy Framework on Growth, Labor Intensity and Poverty Reduction
toward more labor intensive methods rather than promoting labor-intensive ac-tivities within an overall program of increased expenditures.
Put in other terms, there will not be a significant improvement in the jobssituation unless there are significant increases in spending from somewhere inthe economy. Something like a large-scale EPWP can be a significant feature ofa broader initiative to increase spending, growth, and employment. From thepreliminary materials, it appears that the ASGISA program is aiming to com-mit significant new funds for infrastructure, but the spending components ofthe ASGISA remain unclear at the time of writing.9 But for the EPWP to bemost effective in meeting the aims of job creation and poverty reduction, theemphasis of the additional expenditures should be on: 1) creating permanentjobs as opposed to temporary work opportunities; and 2) giving significantlyhigher priority to spending on road maintenance as well as construction, envi-ronmental protection, and social services, where labor intensity will be mosthigh, and where opportunities are greater for longer-term job security.
Targeting Activities with High Employment Impacts
It is clear that there will not be any significant increase of employment throughincreasing the labor intensity of public infrastructure projects alone, much lessthe subset of infrastructure projects targeted by the EPWP. The more effectiveapproach would be to design policies with the greatest potential to generate jobsthroughout the entire economy. How should this be accomplished?
It is important to recognize, first of all, that activities that will produce thebiggest overall boost in jobs are not necessarily the activities that utilize themost labor-intensive production methods. This is because some activities maybe relatively capital intensive in their production techniques, but they may pur-chase products from other sectors in the South African economy that are highlylabor intensive.
The clearest example of this kind of linked relationship between capital- andlabor-intensive industries within the South African economy is that between agri-culture and agro-processing, which includes grain mills, meat, the production ofdairy products, and the generation of biofuels. Agriculture is highly labor inten-sive in South Africa, while agro-processing is highly capital intensive. However,agro-processing firms in South Africa purchase their raw materials from farmers,South African farmers in particular for the most part. As such, domestic jobs inagriculture will expand as an outgrowth of expansion in agro-processing. Thisrelationship between the domestic agricultural and agro-processing industries—where agro-processing purchases products from agriculture—is termed an “up-stream linkage” in the professional literature. Correspondingly, a “downstreamlinkage” refers to a relationship in which, for example, agro-processing firms sellproducts to other South African firms, such as breweries.

An Employment-Targeted Economic Program for South Africa62
In this section, we present evidence that distinguishes industries accordingto their total job-creating potential, including both direct job generation andtheir employment multipliers. The point of this exercise is to demonstrate somepossibilities for job creation through encouraging strong job-creating activitiesto grow at a rate in excess of the economy’s average growth path.
At the same time, as we have described earlier and will examine in detail inChapter 5, our general policy approach is not to select any particular sectors orindustries per se for subsidies to promote their accelerated growth. Our gen-eral policy approach, as described elsewhere in the study, is rather to allow pro-ducers in all industries to demonstrate their capacity to achieve high employmentgains. We do make exceptions to this general approach, in particular, with small-scale agriculture. We do also support the promotion of small-scale businessactivities generally, both individually-owned SMMEs and cooperatives, thoughwithout specifying sectors among these small-scale and cooperative enterprises.But the point of our discussion here is to illustrate the types of activities that arecapable of generating employment, then considering what the impact would beon the economy’s overall employment path if such activities were encouraged togrow at an accelerated rate.
As such, our approach is less sharply targeted than the government’sASGISA initiative, which does identify specific sectors as priorities, includingbusiness process out-sourcing and tourism as “immediate priorities,” and biofuelsalong with agriculture and agrarian reform as “top priority” sectors. At thesame time, our more open-ended approach to subsidizing employment creationis not incompatible with the government’s identification of priority sectors forgrowth. As we will see from our exercises in this section, many of the prioritysectors selected by the government are ones whose firms are likely to be able togenerate large positive employment gains.
Labor intensity and employment multipliersTo illustrate the crucial distinction between labor intensity and employmentmultipliers among industries within the South African economy, in Table 4.2 werank 10 major industries of the South African economy according to these twocriteria. Again, we are measuring labor intensity as the ratio of total employ-ment in the industry per R1 million of the industry’s output.
It is important to note that the employment multiplier for each industry isthe total number of formal jobs generated in South Africa when the industryproduces R1 million worth of goods or services. Using the available methodol-ogy and statistics on industrial employment linkages, we are not able to estimatelinkages between formal industrial sectors of the economy and informal em-ployment. However, it will be useful later to consider some assumptions aboutthe formal/informal economy employment linkages. Doing so will enable us toprovide a broader picture of the effects of our employment-targeted program.

63A Policy Framework on Growth, Labor Intensity and Poverty Reduction
Table 4.2 Employment Generation in South Africa on anIndustry-by-Industry Basis
A) LABOR INTENSITY BY INDUSTRY:
Employment levels in industry per R1 million in outputAgriculture 18.6Apparel and textiles 9.0Social and community services 5.6Mining 4.0Wood, paper and furniture 4.0Capital goods 3.9Motor vehicles 2.8Accommodation and travel 2.2Agro-processing 2.3Chemicals 1.5
B) EMPLOYMENT MULTIPLIERS BY INDUSTRY:
Total employment created in South Africa per R1 million in industry salesAgriculture 27.9Apparel and textiles 18.2Agro-processing 18.0Wood, paper, and furniture 15.3Social and community services 14.9Mining 13.0Accommodation and travel 11.7Capital goods 11.3Chemicals 9.5Motor vehicles 8.6
C) EMPLOYMENT LINKAGES BY INDUSTRY:
Employment multiplier – industry labor intensityAgro-processing 15.7Wood, paper, and furniture 11.3Mining 11.0Accommodation and travel 9.5Social and community services 9.3Agriculture 9.2Apparel and textiles 9.2Chemicals 8.0Capital goods 7.4Motor vehicles 5.8
Source: See Appendix 3.

An Employment-Targeted Economic Program for South Africa64
As we see in Panel A of Table 4.2, agriculture is, by a significant amount,the most labor intensive industry operating in South Africa, with 18.6 work-ers employed in the industry for every R1 million of output produced. Thenext most labor-intensive industry is apparel and textiles, which employs 9.0workers per R1 million in output. By contrast, agro-processing is next to thelast when ranked according to labor intensity, employing only 2.3 workers per R1million of output.
However, we see in Panel B that the rankings change significantly by measur-ing the full employment multipliers of the various sectors. Agriculture does re-main first in the rankings, generating a total of 27.9 jobs in South Africa for everyadditional R1 million of final demand for the industry’s products.10 Apparel alsoremains second on the list, with 18.2 domestic jobs created for every R1 million infinal demand. However, we now see that agro-processing has risen to third on thelist, creating 18.0 million domestic jobs per R1 million in final demand, i.e. virtu-ally an identical amount of total employment creation as the apparel industry.The wood/paper/furniture industry also rises substantially when ranked in termsof total employment multipliers. It generates 15.3 domestic jobs for every R1million in final demand, even though production within the industry itself utilizesonly 4.0 workers per R1 million of output. At the other end, it is useful to note thetwo industries with the weakest employment multipliers—chemicals at 9.5 jobs,and motor vehicles at 8.6 jobs per R1 million of final demand.
Given these two sets of results, it is also useful to observe the industries withthe largest upstream and downstream domestic employment linkages—that is,the largest difference between the employment multipliers of the industry and thelevel of job creation within the industry itself for every R1 million of final de-mand. We show these linkage rankings in Panel C of Table 4.2. As we see there,agro-processing has the largest employment linkages by a significant amount, gen-erating 15.7 domestic jobs through these linkages. Wood, paper and furniture isranked second in terms of employment linkages, generating 11.3 indirect jobs inSouth Africa per R1 million in final demand. The motor vehicle industry is leasteffective among those industries listed here, producing only 5.8 up- and down-stream jobs in South Africa per R1 million in final demand.
Additional criteria in choosing activities for subsidiesIn evaluating the types of activities to select for government promotion, otherfactors of course need to be considered beyond strictly their employment effects.We would suggest that three additional factors should be of central concern. Theseare 1) balance between expanding jobs and enhancing productivity; 2) balance ofpayments constraints; and 3) poverty reduction. We consider these in turn.
1. Balance between expanding jobs and promoting productivity. SouthAfrica faces a rather difficult challenge in that, while facing the need to greatly

65A Policy Framework on Growth, Labor Intensity and Poverty Reduction
expand employment opportunities within the country, it also justifiably seeks topromote productivity growth and the utilization of modern technologies. Thesetwo purposes can be in competition, given that, at a given level of output, theincreasing utilization of machines in production will entail relatively less de-mand for workers. To balance these potentially competing purposes, it will bedesirable to promote the growth of some capital-intensive industries. The opti-mal way to achieve this balance will be to target some industries for growth thatare themselves capital intensive but that maintain strong upstream linkages withdomestic labor-intensive industries. According to the evidence in Table 4.2, themost appropriate industry by this criterion is clearly agro-processing, includingthe ASGISA “top priority” sector of biofuels. Wood/paper/furniture is also anappropriate industry by this criterion.
Firms within the mining industry may seem to be an appropriate choice forsubsidized growth. The mining industry has been a major employer in SouthAfrica and maintains a high employment multiplier at present. But the rate ofextraction from the mines has been heavy for decades. As a result, the quality ofthe remaining mineral deposits has been depleted and the costs of extractionhave risen correspondingly. It therefore seems unlikely that firms within themining industry would be likely candidates to target for subsidized growth.Finally, according to this criterion, firms within the motor vehicle industry wouldalso likely be inappropriate targets for subsidized growth. As we see from theindustry-wide data, motor vehicle producers, likely to be relatively capital-in-tensive firms, are also likely to operate with weak employment multipliers.
2. Balance of payments constraints. As we have discussed earlier, we donot expect South Africa to gain a significant boost in employment growth byincreasing its volume of international trade. At the same time, the economycannot sustain a growth path geared toward employment generation—or in-deed, toward any other goal—if it is unable to at least maintain growth in ex-ports comparable to its demand for imports.
There are two interrelated but distinct ways to consider the need to main-tain balance in the economy’s degree of integration with the global economy.The first way is straightforward: evaluating industries with respect to theircapacity both to succeed as exporters and to compete with foreign firms seekingto supply imports to the South African market. The second consideration is theextent of linkages that exist between industries in South Africa, and among sec-tors within any given industry. Here we refer to an industry’s downstream aswell as its upstream linkages. Industries with strong up- and downstream link-ages will promote growth in the domestic economy and thereby diminish de-mand for imports as growth proceeds. Industries with strong domestic economylinkages should therefore be promoted, while those with weak linkages shouldeither be discouraged or restructured to strengthen these linkages.

An Employment-Targeted Economic Program for South Africa66
We obtain a sense of the characteristics of the 10 industries we are consid-ering by these two criteria in Table 4.3. Here we show the 10 industries in thissection according to four criteria: 1) upstream linkages; 2) downstream link-ages; 3) penetration into export markets; and 4) penetration into South Africanmarkets from imports. The table reports index numbers for each of these fourcategories. For each category, we show index numbers that can range from 0 to10. The table also explains how we derived each of the index numbers. The 10industries are listed in order of their employment multipliers, so that agricul-ture is listed first, apparel and textiles is listed second, and so on. Among theseindustries, agriculture scores relatively well in terms of both up- and down-stream linkages. Its global orientation is modest both in terms of exports andimports. This means that South Africa’s agricultural sector is in a position togrow without having to focus on maintaining its share of the domestic marketsagainst import competition.
In contrast with agriculture, apparel and textiles ranks substantially lowerin terms of both up- and downstream linkages. Moreover, the index numberreflecting the extent of import penetration within apparel and textiles is roughlydouble the index number for export penetration. These figures reflect the factthat textiles and apparels produced elsewhere in Southern Africa—such asMauritius and Madagascar—as well as from China have been successful in pen-etrating the South African market. Within the existing policy framework, it isnot likely that the extent of this competition will diminish in the foreseeablefuture. As such, our reading of the evidence suggests that, within the existingpolicy framework, apparel and textiles would not generally include a large num-ber of firms that would be capable of generating large employment multipliers.At the same time, we recognize that the ASGISA program has targeted appareland textiles as one of its “medium-term priority sectors.” If the ASGISA pro-gram did entail efforts to achieve competitiveness and promote local sourcing,clothing and textiles firms could certainly become effective recipients of sup-port in terms of their capacity to promote employment.
Working down the list, agro-processing, wood/paper/furniture, and so-cial/community services all perform well in terms of their global orientation, inthat their export indexes are high relative to their import indexes. Thus, pro-moting accelerated growth among firms in these industries will not place a sig-nificant strain on the country’s balance of payments. Of these industries, all butsocial/community services generate reasonably strong up- and downstream link-ages. The weak linkages for social and community services is not particular tothe structure of the South African economy, but is rather characteristic of thenature of this industry. That is, with services such as community-level healthcare, social support, and retail services like personal care, the service being pur-chased is primarily the direct labor effort of the worker at the business location,i.e. the social worker, nurse, or barber.

67A Policy Framework on Growth, Labor Intensity and Poverty Reduction
Finally, the industries that rank relatively low according to their employ-ment multipliers—i.e. capital goods, chemicals, and motor vehicles—all dopoorly in terms of their global orientation, with relatively higher indexes forimport penetration than export orientation. Thus, given their current struc-tures, the growth in all these industries will tend to exert more pressure onSouth Africa’s balance of payments. This does not mean that firms in theseindustries should not be promoted for accelerated growth under any circum-stances. However, it does mean that if policymakers choose to promote firmsin these industries, they should recognize the problems that exist in terms ofboth their job-creating potential and their balance of payments constraints.We will examine further the merits of pursuing restructuring within theseindustries later in this study. However, our present purpose is to identifyindustries that are most likely to be capable of promoting labor intensity overthe next decade without exerting pressure on the balance of payments. Thecapital goods, chemicals, and motor vehicle industries do not rank high ac-cording to these present criteria.
Table 4.3 Balance of Payments Considerations for Selected South African Industries(Figures are index numbers. Definition of index numbers is presented below the table.)
Domestic Global economyeconomy linkages orientation
Penetration Penetrationinto into South
Upstream Downstream export African marketslinkages linkages markets by imports
Agriculture 6.5 7.2 1.2 0.6Apparel and textiles 4.5 3.8 1.0 1.9Agro-processing 7.9 3.0 0.8 0.8Wood, paper, and furniture 6.8 6.6 2.1 1.0Social and community services 3.6 2.0 0.2 0.2Mining 6.0 3.1 7.9 2.0Accommodation and travel 6.4 4.8 2.0 1.8Capital goods 5.1 5.3 1.5 4.4Chemicals 6.8 6.2 1.6 2.0Motor vehicles 3.7 3.7 1.6 3.0
Upstream Linkages: Domestic inputs as a percentage of production costsDownstream Linkages: Domestic industrial demand as a percent of total industrial and finaldemandExport Orientation: Exports as a percentage of total final demandImport Penetration: Imports as a percentage of total supplySource: See Appendix 3.

An Employment-Targeted Economic Program for South Africa68
3. Poverty reduction. As we will discuss in more detail below, it will not bepossible to rely on employment generation alone as a means of improving thewelfare of the poor in South Africa. Other measures in the area of social trans-fer programs will also be necessary here. At the same time, if one is targetingspecific industries for accelerated growth, one important criterion for choosingindustries is whether the activities that take place within any given industry—either in terms of employment possibilities or the goods and services the indus-try produces—will benefit the poor.
By this criterion, one clear priority sector is small-scale agriculture. This isfirst of all because small-scale agriculture remains the activity on which largenumbers of low-income families rely as an important, if frequently supplemen-tal, source of food. And while the proportion of low-income households en-gaged in agriculture as a primary source of income is small at present, this is inpart due to the financial barriers to obtaining and maintaining a small hold-ing—barriers that could be substantially relaxed through a large-scale creditsubsidy program. 11 Another consideration is that when the domestic produc-tion of food expands, this should exert downward pressure on food prices. Whenfood prices decline, the poor receive a relatively greater welfare gain than thoseat higher income levels, since food constitutes a relatively greater share of thetotal consumption basket of the poor. Of course, food prices won’t decline tothe extent that the agricultural sector is dominated by large-scale oligopolisticfirms, who both have pricing power and are responding to global commodityprice fluctuations. This then provides an additional reason for targeting agri-cultural smallholders for accelerated growth, as opposed to large-scale firmswith oligopolistic pricing power. The other industry that should be a clear pri-ority by this criterion is social and community services. This is first of all be-cause, to a significant extent, the services provided by this industry will directlybenefit the poor. Community health clinics promoting AIDS prevention andtreatment are an obvious case in point. In addition, small-scale businesses cangrow relatively easily in areas such as personal services, thus offering opportu-nities for the poor to establish their own small-scale businesses.
An illustrative exercise in promoting employment growthConsidering the evidence we have reviewed on labor intensity and employmentmultipliers for the formal economy, as well as the additional considerations fortargeting industries—i.e. combining capital and labor intensity; balance of pay-ments; and social inclusion of the poor—it will be useful to consider the benefitsof promoting for accelerated growth firms that operate in industries that scorewell by these criteria. Thus, for the purpose of this exercise, we consider thatfirms in five industries are targeted for accelerated growth. These industries areagriculture, agro-processing, wood/furniture/paper, social/community services,and accommodation/travel. We are focusing on industry-level targeting for the

69A Policy Framework on Growth, Labor Intensity and Poverty Reduction
purpose of this exercise because the available data on labor intensity and employ-ment multipliers are at the industry level. But again, as we will discuss more inChapter 5, our proposal is to offer credit subsidies to firms in all industries thatcan demonstrate their ability to generate large employment multiplers.
Of these five industries, all but wood/furniture/paper have been identifiedin some way by the ASGISA as a priority. Tourism is included as an “immediatepriority sector,” and biofuels—a form of agro-processing—and agriculture it-self are the two “top priority sectors.” Social and community services as suchare not included as among the private sector priorities. However, in the area of“second economy initiatives,” areas such as early childhood development, amongthe EPWP priorities, and SMMEs are identified as priorities.
The ASGISA does also include other sectors as priorities, including busi-ness processing outsourcing as an “immediate priority,” and chemicals, creativeindustries, clothing and textiles and downstream minerals beneficiation as “me-dium term” priorities. We are not suggesting that firms in these industries shouldnot receive priority support. But we are concerned that, if firms in these areasare to be supported, there is clarity as to their capacity to generate strong posi-tive employment effects.
By the same token, with the industries that we have prioritized in our illus-trative exercise, we don’t assume that all firms in these industries will be effec-tive in generating domestic employment. That is why, outside of small-scaleagriculture, SMMEs, and cooperatives, we argue that firms would need to ap-ply on an individual basis for subsidized credit, the principle means of subsi-dized support we are proposing in this study.
In Table 4.4, we review data showing the relative size of our five selectedindustries in the overall South African economy. As Table 4.4 shows, these fiveindustries in combination account for a major share of the overall South Africaneconomy, 22.1 percent in terms of total output, and 34.8 percent in terms ofoverall employment. Hence these industries are large enough as a share of theoverall economy that their growth at an accelerated rate would have a majorimpact on the overall economy. At the same time, these industries in aggregateare not so large that policy interventions to target them would have to be casttoo widely to be effective. As we will discuss below, we do think that SouthAfrican policymakers can establish effective interventions to promote acceler-ated growth in business activities—in these industries or other industries aswell—that would constitute roughly 25-30 percent of GDP. This is roughly thesize of these industries considered in aggregate. This is another reason why it isuseful to consider these five industries in our illustrative exercise.
It is, finally, useful here to also note the disparity between the share of out-put and share of employment when adding the relative size of these five indus-tries. The disparity is due almost entirely to agriculture. As we see in Table 4.4,agriculture employs 17.1 percent of all formal workers in South Africa but pro-

An Employment-Targeted Economic Program for South Africa70
duces only 3.3 percent of all output. These figures clearly suggest the substan-tial gains that could accrue to South Africa through enhancing agricultural pro-ductivity—via measures such as the public works programs targeted at ruralinfrastructure. It is precisely through raising agricultural productivity, in com-bination with expanding job opportunities in agriculture, that this gap coulddiminish between levels of agricultural output and employment.
Employment effects of increased growth with rising labor intensityIn Tables 4.5A – C (see pages 72 and 73), we now consider the combined effectson formal employment of accelerating growth with raising labor intensity viasubsidizing firms in these industries for accelerated growth. We illustrate thesegrowth and labor intensity effects in a manner similar to our more simplifiedhypothetical exercise in Chapter 2.
Thus, in Table 4.5.A, we again show actual economic conditions that prevailin South Africa today in terms of economic growth, employment, and the em-ployment/output ratio. In Table 4.5.B, we then examine the effects on employ-ment over the decade 2005 – 14 under three alternative sets of assumptions.
The first set of assumptions is that the South African economy proceeds overthe next decade at roughly the same pattern of activity as it had over the decade1995 – 2004. That is, we assume that the economy grows at an average annual rateof 3 percent per year, and that the employment/output ratio within each industryof the economy declines at an average rate of 1 percent per year. Under thisscenario, as we see, total employment in South Africa in 2014 will be 9.8 millionpeople, and total job creation over the decade will have been roughly 900,000 jobs.
The second set of assumptions is that the average growth rate of the economyaccelerates to 4.5 percent, as a result of macroeconomic policy interventionsthat succeed in promoting growth. However, under this second scenario, there
Table 4.4 High Employment Growth Industries as Share of South Africa’s Outputand Employment
Industry output as Employment asshare of total output industry share of total
(percentages) employment(percentages)
Agriculture 3.3 17.1Agro-processing 4.2 2.7Wood/paper/furniture 2.6 2.9Accommodation/transportation 7.1 4.4Social/community services 4.9 7.7TOTALS 22.1 34.8
Source: See Appendix 3.

71A Policy Framework on Growth, Labor Intensity and Poverty Reduction
are still no policy interventions to reverse the trend of declining labor intensity.We therefore again assume that the employment/output ratio by industry con-tinues to fall at an average annual rate of one percent. Under this scenario, wesee that total employment in South Africa will be 10.8 million. The expansionof employment over the 2005 – 14 decade will be 1.9 million jobs.
In the third set of assumptions, we allow both for aggregate expansionarypolicies as well as measures aimed specifically at promoting labor intensity.Specifically, in this illustrative exercise, we assume that the non-subsidized seg-ments of the economy—accounting for, as we saw above, roughly 80 percent ofthe economy’s total output—will receive a stimulus equivalent to that needed tosupport average economy-wide growth at 4.5 percent per year. However, wenow also assume that the subsidized activities, accounting for roughly 20 per-cent of total output, will receive a proportionately larger growth stimulus of 8percent.12 Moreover, because of the efforts to raise labor intensity through rap-idly expanding the subsidized activities, we now also assume that the employ-ment/output ratio by industry remains constant over the decade. Under thisset of assumptions, we see in Table 4.5.B that overall employment in 2014 willbe 12.4 million people. The expansion in employment over the 2005 – 14 de-cade will now total 3.5 million jobs.
In Table 4.5.C, we compare the effects on employment of these three sce-narios relative to one another. Thus, the table first shows the difference betweenthe 3 percent growth vs. 4.5 percent growth scenarios, with declining labor inten-sity under both cases. As we see, raising the average annual growth rate to 4.5percent will yield an additional 1 million jobs by the end of the decade.
Next, we compare the 4.5 percent growth scenario with the scenario inwhich we promote both the 4.5 percent growth rate for non-subsidized activi-ties and an 8 percent growth stimulus for subsidized activities, yielding an over-all growth rate of 5.3 percent plus no decline in the employment/output ratio.As we see, the difference between these two scenarios as of 2014 will be 1.6million net jobs.
Finally, we compare the effects of allowing the South African economy toproceed along its current path of 3 percent growth with declining labor intensitywith the growth path that combines accelerated overall growth and an 8 percentgrowth stimulus for subsidized activities. Here, of course, we observe the mostextreme difference in the two outcomes: the program to raise both overall growthand increased labor intensity will produce 2.6 million more jobs than allowing theSouth African economy to proceed along its current growth path.
Overall effects on level of employment and unemployment rateHow do these alternative scenarios for employment growth translate into changesin the economy’s overall level of employment, including informal employment?How much is the unemployment rate likely to change? To attempt a rough

An Employment-Targeted Economic Program for South Africa72
Table 4.5 Employment Effects of Combining Accelerated Economic Growth withIncreased Labor Intensity
A) ACTUAL LEVELS OF ECONOMIC ACTIVITY IN 2004
Average GDP growth rate 1994 – 2004 3.1%Total employment 2004 11.6 millionEmployment/output ratio 2003 8.6 (jobs/R1 million in output)
Source: See Appendix 3.
B) EMPLOYMENT IN 2014 UNDER ALTERNATIVE ASSUMPTIONS
EmploymentEmployment creation,
in 2014 2005 – 2014
Scenario 1:Steady state from current economic trends 9.8 million 0.9 million1) 3% annual growth rate2) 1% annual decline in employment/output
Scenario 2:Accelerated growth with no credit subsidies 10.8 million 1.9 millionto promote labor intensive growth1) 4.5% average annual growth rate2) 1% annual decline in employment/output
Scenario 3:Accelerated growth with credit subsidies 12.4 million 3.5 millionto promote labor intensive growth1) 4.5% growth for non-subsidized activities2) 8% growth for subsidized activities3) 5.3% combined average growth for subsidized and non-subsidized activities4) Employment/output constant
Source: See Appendix 3.

73A Policy Framework on Growth, Labor Intensity and Poverty Reduction
Table 4.5 (cont.) Employment Effects of Combining Accelerated Economic Growthwith Increased Labor Intensity
C) DIFFERENCES IN EMPLOYMENT CREATION SCENARIOS
3% growth with declining employment/output; 1.0 million jobsno labor intensity targeting vs.4.5% growth with declining employment/output;no labor intensity targeting
4.5% growth with declining employment/output; 1.6 million jobsno labor intensity targeting vs.5.3% growth with constant employment/outputand labor intensity promotion
3% growth with declining employment/output; 2.6 million jobsno labor intensity targeting vs.5.3% growth with constant employment/outputand labor intensity promotion
answer to these questions, we have to make some assumptions about two con-siderations over the next decade: 1) the growth rate of the labor force; and 2)the growth rate of informal employment as a proportion of the total labor force,what we will term the “informalizaton rate.”
We think it is most sensible to work with the simplest possible reasonableassumptions about both of these factors. Given the range of influences thatmight affect both of them, we are unlikely to achieve more in the way of accu-racy by constructing relatively complicated prospective scenarios.
Thus, the first assumption we work with is that South Africa’s labor forcegrowth rate will be equal to the 1.9 percent annual projected rate of popula-tion growth over the next decade. This assumption simply assumes that thesame proportion of the country’s total population will be entering the workforce over the next decade as does so currently. The second assumption is thatthe proportion of informal employment in the South African economy—theinformalization rate—will remain constant, which is at 27 percent of total em-ployment. In previous research on the relationship between economic growthand informalization in developing countries, Heintz and Pollin (2005) foundthat average growth rates in the range of five percent or more can produce adecline in the proportion of informal employment as a share of total employ-ment. However, more moderate growth rates did not prevent informalizationfrom spreading, though again, on average, the rate of informalization did fallin countries where economic growth was faster. Given that we are projectingan economic growth rate for South Africa roughly in the range of 3 – 5 per-

An Employment-Targeted Economic Program for South Africa74
cent, it is likely that the rate of informalization will rise above 27 percent inthe next decade. If growth gets to the upper limit of this range, of around 5percent, perhaps the rate will remain at around 27 percent. In any case, byassuming a constant informalization rate of 27 percent, we are making conser-vative assumptions about the overall growth in employment that will accom-pany the alternative scenarios we have developed for both economic growthand labor intensity.
In Table 4.6, we present projections for overall employment and unemploy-ment in 2014 under two of the scenarios we have considered in Table 4.5 above.The first is Scenario 1, which is the steady-state scenario of 3 percent averagegrowth and a 1 percent average decline in labor intensity. We then return toScenario 3, in which we assume a growth rate of 4.5 percent for non-subsi-dized activities and an 8 percent growth stimulus for the subsidized activi-ties—in this illustrative exercise, the firms that operate in agriculture,agro-processing, wood/paper/furniture, accommodation/transportation, andsocial/community services. We also assume that the overall labor intensityremains constant. Working with these two additional assumptions about thegrowth in the labor force and the ratio of informal/total employment, we arenow able to see the effects of the two scenarios in terms of overall employmentand unemployment.
In particular, under Scenario 1, we see that a total of 13.0 million peoplewill be employed in South Africa in 2014 and 6.5 million will be unemployed.The unemployment rate will be 33.3 percent. Under Scenario 3, a total of 16.5million people will be employed and 3.0 million will be unemployed. The un-employment rate will be 15.4 percent.
These findings bring us to three major, and interrelated, conclusions aboutpossibilities for significantly improving the employment situation for South Af-ricans over the next decade.
1. It is a matter of great importance whether the economy continues along apath of growth and labor intensity similar to that which occurred between1994 – 2004, or whether it succeeds in both accelerating growth gener-ally, and especially promoting rapid growth in the activities within theeconomy that are either labor intensive or generate high employmentmultipliers.
2. If the economy continues along the path it experienced between 1994 –2004, there is no chance that the government will succeed in meeting itsgoal of reducing unemployment by half. Quite the contrary, assumingthe ratio of informal employment to total employment is unchanged, tocontinue along the path of the previous decade will only produce a sig-nificant increase in the unemployment rate, to something on the order of33 percent.

75A Policy Framework on Growth, Labor Intensity and Poverty Reduction
3. Even if economic growth does accelerate to something like 4.5 percent innon-subsidized areas and 8 percent in subsidized activities, it will still bethe case that by 2014 the unemployment rate will be around 15 percent—i.e. even under our favorable Scenario 3, the unemployment rate will notquite fall to half of its current rate of roughly 26 percent as of 2014.
The overall point then is this: only through an aggressive, though stillrealistic, program of employment targeting will there be any possibility for theSouth African economy to come close to meeting the government’s goal of halv-ing the country’s unemployment rate by 2014. At the same time, in the absenceof an aggressive program targeted at employment expansion, the likelihood isvery high that opportunities for jobs will worsen, not improve, over the nextdecade.
Table 4.6 Total Employment and Unemployment Rate in 2014 under AlternativeScenarios for Economic Growth and Labor Intensity
Additional assumptions:1. Labor force growth is 1.9 percent per year2. Informal employment/total employment = 27 percent
(1) (2) (3) (4) (5) (6)Formal Informal Total Total Unemploy-
Labor employ- employ- employ- unemploy- ment rateforce ment ment ment ment (= columns 5/1)
Scenario 1: 19.5 9.8 3.2 13.0 6.5 33.3%Steady state from million million million million millioncurrent economictrends1) 3% annual growth rate2) 1% annual decline in employment/output
Scenario 3: 19.5 12.4 4.1 16.5 3.0 15.4%Accelerated growth million million million million millioncredit subsidies topromote labor intensity1) 4.5% growth for non-subsidized activities2) 8% growth for subsidized activities3) 5.3% combined average growth for subsidized and non-subsidized activities4) Employment/ output constant
Source: Calculations based on data in Table 4.5.

An Employment-Targeted Economic Program for South Africa76
Poverty Reduction
Our projections for employment and the unemployment rate over the next de-cade make clear that, even under an aggressive program of employment target-ing over the next decade, it will still be the case that unemployment is likely tobe as high as around 15 - 16 percent in 2014. This means that a very highproportion of South Africans will not themselves benefit from an employment-targeted program over the next decade, even assuming the program is highlysuccessful in meeting its targets for economic growth and labor intensity. Thisfinding only underscores the need for additional policy measures to reduce pov-erty in South Africa.
We have reviewed a range of proposals by South African policy analysts forexpanding poverty reduction programs. To the best of our knowledge, theseinclude:
1. The Basic Income Grant (BIG).2. Expansion of the Expanded Public Works Program, especially in the area
of social service delivery. Included here would be, for example, measures toaddress the HIV/AIDS crisis, such as neighborhood or individual home-care paramedical support.
3. Expansion of existing pension and income transfer programs covering chil-dren, the elderly, and the disabled.
4. Expansion of government spending on basic health delivery and primaryeducation.
We will not attempt here to explore the specifics or relative merits of theseand related proposals. However, in our discussion below on fiscal policy, we willconsider the issue of the government’s capacity to finance a significant expan-sion in direct spending on poverty reduction, regardless of the specific break-down as to how such funds might be allocated. For our purposes, the overridingissue is the clear need to finance an expansion of such activities, given the factthat, even under the most favorable scenario of employment growth, there willstill be more than 15 percent unemployment as of 2014.
NOTES
1. See Pollin (1997) for some detailed perspectives from within the academic literature. Pollin(2004) presents a brief overview of this literature.
2. Data on the lending/saving ratio for South Africa are from the South Africa Reserve Bank andthe International Monetary Fund, International Financial Statistics.
3. After 3 years, approximately 75 percent of the impact of a change in household disposableincome would be realized; after 5 years, around 90 percent of the impact would be evident.

77A Policy Framework on Growth, Labor Intensity and Poverty Reduction
4. The short-run marginal propensity to consume is estimated to be 0.91. In the long-run, weexpect incomes and consumption to increase proportionately. This expectation of an incomeelasticity of one is consistent with the estimates for South Africa.
5. Calculated from the 2000 Supply and Use Tables, Statistics South Africa. Estimates do notinclude the value of imported inputs for domestically produced goods.
6. These studies include Fielding (1996), Aron and Muellbauer (2000), and Selvanathan andSelvanathan (2003).
7. The drop off in exports seen in 2003 is partially the result of an appreciation in the value of therand at that time.
8. This quotation is taken from McCord (2004b), a paper which also includes several other ex-amples of press reports regarding the EPWP.
9. Thus, Davies and van Seventer write in April 2006, “It is difficult to pin down with any greataccuracy what the Accelerated & Shared Growth Initiative for South Africa means in terms offiscal expenditures,” (2006, p. 3).
10. By “final demand” we refer to the sale of a good or service to its final user, as opposed to an“intermediate” sale to a business firm that will utilize the good or service to produce someother product.
11. According to the September 2004 Labor Force Survey, approximately 16 percent of poor house-holds have a member of the family engaged in agricultural activities. Of those households thatdo have members engaged in agriculture, 80 percent do so to provide an extra source of food.Thus, agriculture is not a primary source of either employment, food or income for the poor.We are grateful to Professor Charles Meth for pointing out these illuminating figures.
12. When we use the term “growth stimulus” for an industry, we are referring to a particular mag-nitude of an initial stimulus that will have multiplier effects on employment and output through-out the entire economy. Therefore, the overall impact on economic growth will be many timeslarger than the initial stimulus. We use the impact on the overall growth rate to refer to therelative size of the initial stimulus. For example, a “4.5 percent growth stimulus” refers to thesize of the stimulus given to a particular industry. If all industries in the economy were given a4.5 growth stimulus, the economy as a whole would grow at 4.5 percent, taking into account alllinkages, leakages, and multiplier effects. In cases where industries are targeted, the relativemagnitudes of the stimulus will differ between targeted and non-targeted industries. For agiven industry, an 8 percent growth stimulus would be 75 percent larger than a 4.5 percentgrowth stimulus, because a growth rate of 8 percent is 75 percent larger than a growth rate of4.5 percent.


5. Policy Interventions forEmployment-Targeted Program
FISCAL POLICIES
There are three basic ways that shifts in the government’s fiscal stance mightmake a significant contribution to employment generation and poverty reduc-tion. They are:
1. Shifts in the composition of government spending. Raising the pro-portion of government spending on employing workers, and correspond-ingly lowering the proportion of spending on machines and buildings, isthe idea behind the Expanded Public Works Program. This is a straight-forward method of increasing the amount of employment generated by agiven level of spending. In Chapter 4, we have shown how, at current levelsof spending, this initiative will make a positive, but only modest, contribu-tion toward employment expansion.
2. Increases in the tax-financed level of government spending. Herewe refer to increasing the government’s level of spending through tax in-creases, and utilizing the additional government funds for measures thatpromote employment growth or poverty reduction. The fiscal deficit doesnot change in this approach. However, aggregate demand could still in-crease if the tax increases are progressive. Under this scenario, the redistri-bution of income downward could contribute to an expansion of aggregatedemand, since the marginal propensity to consume is higher among lower-income people. The constraint on tax increases is the effect that the highertax burden would have on investors and consumers, with a significant ef-fect leading to a slowdown in private investment and consumption.
3. Increasing the fiscal deficit. This would immediately increase aggre-gate demand, which in turn could promote employment, regardless of howthe additional government funds were spent. But of course, if the fundswere also spent on measures that explicitly targeted employment genera-tion or poverty reduction, this would provide for an even larger increase inemployment relative to a given increment of fiscal deficit. The constrainton deficit spending as an expansionary tool is “crowding out” of three dis-
79

An Employment-Targeted Economic Program for South Africa80
tinct types. The first type of crowding out refers to the rise in interestpayments as a share of the total government budget. The second type ofcrowding out refers to the rise in interest rates generated by the increase ingovernment borrowing, with this rise in rates in turn discouraging privatesector borrowing and spending. The third type of crowding out is the situ-ation we have considered earlier, where investors channel their funds to thepurchase of government bonds—where they earn a safe return—as opposedto utilizing their financial resources for productive investments, i.e. pur-chasing machines and building structures.
We now consider increased fiscal deficits and tax increases in terms of howthey might contribute toward increasing employment and reducing poverty.
Increasing the Fiscal Deficit
As we have discussed earlier, the government committed to a program of bud-get deficit reductions soon after taking office. We can observe the effects ofthis commitment in Figure 5.1, which shows the actual and predicted fiscaldeficits for the South African central government between 1997/98 and 2008/09. As the figure shows, the deficit fell sharply from 3.8 percent of GDP in1997/98 to 1.5 percent in 2004/05. At the current level of GDP, a reductionfrom a deficit of 3.8 to 1.5 percent of GDP represents a withdrawal of govern-ment spending on the order of R18 billion, or nearly five percent of thegovernment’s budget.
As we also see from the figure, the Treasury is estimating, as of its October2005 Medium-Term Budget Policy Statement, a fall in the deficit for 2005-06to 1.0 percent of GDP, before rising to around 2 percent through 2008-09. Inshort, through the medium-term, the Treasury is now expecting to maintain atight fiscal stance.
However, it is notable that these estimates differ significantly from thosemade by the Treasury the previous year, in its 2004 Medium-Term Budget PolicyStatement. In the previous year’s document, the Treasury projected a moderateloosening of its fiscal stance, with deficits in the range of 3 percent of GDPthrough 2006-07. This roughly one percentage point of GDP difference in thetwo deficit projections is quite significant in terms of the government’s capacityto spend, representing about R14 billion in available funds. This is an amountwhich, by itself, is more than three times the size of the annual expendituresprojected to date on the Expanded Public Works Program, of R4 billion/year(for five years).
It is therefore worth examining the case for the moderately more relaxedfiscal stance the Treasury was projecting in 2004 versus its more stringent esti-mates as of 2005. To begin with, a fiscal deficit either at 2 or 3 percent of GDP

81Policy Interventions for Employment-Targeted Program
is well within the range of other countries in the current period. We can see thisfrom Table 5.1 below.
As we see in the table, all groupings of countries have experienced a declinein their deficit/GDP ratios in the 1990s, through 2001. For the lower middleincome countries, which include South Africa, the deficit/GDP ratio rose fromthe 1970s to the 1980s from 4.2 to 5.2 percent, before falling in the 1990s to 2.5percent. With other country groupings, we see the same general pattern, thoughthe size of the fluctuations differs in the different groupings. This overall pat-tern is clearly consistent with the worldwide macro policy agenda supportive offiscal stringency. Nevertheless, against this background of increased fiscal tight-ness both in South Africa and elsewhere, the Treasury’s projections as of 2004 torelax this stance a bit was a move in the other direction, if certainly a modestone. The more relaxed stance would provide the government significantly moreflexibility to pursue key policy aims, such as the EPWP, without moving thedeficit into a range that, by historical standards and global comparative stan-dards today, could be construed as dangerous.
At the same time, we would not favor significant increases in the deficitbeyond the 3 percent of GDP range that the Treasury had projected in 2004,even as a source of funds to support employment expansion or poverty reduc-tion. This is especially the case since the deficit figures we are discussing arelong-term structural deficits. The overall deficit—including the cyclical as well
Figure 5.1 South Africa Fiscal Deficit/GDP Ratio
Source: October 2005 Medium Term Budget Policy Statement SA Treasury.
0
1
2
3
4
Def
icit
as p
ct o
f GD
P
1997-98
1998-99
1999-2000
2000-01
2001-02
2002-03
2003-04
2004-05
2005-06
2006-07
2007-08
2008-09
MAIN BUDGET FRAMEWORK
Actuals
Esti-mate
Medium-termestimates

An Employment-Targeted Economic Program for South Africa82
as the structural deficit—will necessarily increase beyond these projections dur-ing a recession. As such, any significant new government spending initiativesbeyond what is already budgeted will need to be financed through some combi-nation of either a) more rapid GDP growth; or b) higher tax rates.
Tax Financing of New Spending Initiatives
We believe that the government should pursue three major spending initiativesto promote employment growth and poverty reduction. These are:
1. Public investment/infrastructure2. Income transfers and social support3. Credit/employment subsidies to businesses to promote accelerated employ-
ment growth.
We have discussed each of these program areas already, and will considerthe credit/employment subsidy program in depth below. The first two areas ofexpenditure have also been identified as priorities within the ASGISA program,according to the preliminary information we have reviewed. For our discussionhere, we are primarily concerned to provide a rough sense of the additionalgovernment spending that might be channeled into these areas to increase theireffectiveness by a substantial amount. Based on our review of the ASGISAmaterial on increased public investment, on proposals, such as the Basic IncomeGrant, to increase spending on poverty reduction, and finally, on our discussion
Table 5.1 Overall Government Budget Balance, Including Grants, 1970–2001(budget balance as percentage of GDP)
Country groups 1970-1979 1980-1989 1990-2001
Low income countries -4.9 -6.0 -3.6Lower middle income countries including South Africa -4.2 -5.2 -2.6Upper middle income countries -3.2 -3.3 -2.1Middle income countries -3.8 -4.4 -2.5OECD countries -2.8 -4.2 -2.8Non-OECD high income countries -0.5 -0.3 -0.5Former Socialist countries -1.4 -2.8
Note: Overall budget balance is current and capital revenue and official grants received, less totalexpenditure and lending minus repayments. Data are shown for central government only. Formersocialist countries are excluded from all other groups.Source: World Bank, WDI-CD, 2003.

83Policy Interventions for Employment-Targeted Program
below on credit subsidies, we would suggest that government spending shouldincrease by an annual amount of about R20 – 30 billion at 2004 prices beyondwhat is currently being budgeted. The breakdown in increased expenditureswould be roughly along these lines:
1. Public investment/infrastructure: R5 – 7.5 billion2. Income transfers and social support: R10 – 20 billion3. Credit subsidies to businesses to promote accelerated employment growth:
R5 – 7.5 billion
For the purposes of our current discussion of aggregate fiscal expenditures,let us assume a high-end spending increase in the range of R30 billion per yearthat would be financed both through an increase in the deficit from 2 to 3 per-cent of GDP, and through increased tax revenues. Because the deficit increasewould mean an additional R14 billion in funds available for spending, that wouldmean that the additional R16 billion would have to come through either taxincreases or from the revenue dividends of a higher economic growth rate.
Let us assume now that the government would need to raise fully R16 bil-lion in new tax revenues. At current prices and GDP level, this would entailraising the revenue/GDP ratio by a bit more than one percentage point, fromits 2004 rate of 24.7 percent to roughly 25.8 percent. As we see in Table 5.2,
Table 5.2 Consolidated Government Revenue as a Share of GDP
Per capita GDP Revenue/GDPCountry ($US, 2002 PPP) (in percentages, 2000-2003 averages)
Greece $18,700 45.1Poland $10,560 41.8Singapore $24,000 29.0Korea $16,950 28.4Uzbekistan $1,670 28.0South Africa $10,100 24.1Malaysia $9,100 22.2Indonesia $3,200 18.9Thailand $7,010 15.8Philippines $4,200 14.7
Sources: OECD countries’ revenue data are from OECD website (source OECD.org), EconomicOutlook No 75: Annual and quarterly data, as the entry of “Total Receipts Government, %GDP.” Asian countries’ revenue data are from the Asian Development Bank (http://www.adb.org/Documents/Books/Key_Indicators/2004/default.asp), Key Indicators 2004:Poverty in Asia: Measurement, Estimates, and ProspectsPer capita GDP at PPP from WorldDevelopment Indicators 2004, World Bank.

An Employment-Targeted Economic Program for South Africa84
which shows average revenue/GDP ratios for 2000 – 2003 for a range of coun-tries, this kind of increase in the revenue/GDP ratio would continue to placeSouth Africa well below the revenue/GDP ratio for the lower-income OECDcountries, including Greece (45.1 percent) and Poland (41.8). It would put SouthAfrica roughly in line with a group of rapidly growing Asian economies, includ-ing Singapore (29.0 percent), Korea (28.4 percent), and Malaysia (22.2 percent).South Africa also would be significantly higher than some other Asian coun-tries, including Indonesia (18.9 percent), China (17.4 percent), Thailand (15.8percent), and the Philippines (14.7 percent).
It is not clear whether any of these countries provides a particularly appro-priate comparison for South Africa. The key point is that neither the roughly 25percent ratio at which South Africa currently operates, nor an increase to 26percent, would establish South Africa as a significant outlier either among theOECD or the Asian comparison groups.
In terms of how to raise funds, it is useful to first recognize the primarysources of revenue at present. As we see in Table 5.3, as of 2004/05, nearly 80percent of all government revenue derives from three sources: personal incometax (31.3 percent), corporate income tax (19.9 percent), and the value added tax(27.7 percent). We believe that it will be necessary to increase revenue fromthese three primary revenue sources to partially cover the additional R16 bil-lion that would pay for the priority areas we have identified, i.e. public invest-ment, social transfers, and credit/employment subsidies. At the same time, rateincreases on these taxes should not have to generate more than roughly one-third the total amount of revenues needed to finance these three programs. Theremaining roughly R10 billion can be generated effectively through three newrevenue sources: 1) extending the Uncertified Securities Tax that currently ap-plies only to the secondary trading of stocks to cover bond trading as well; 2)enacting the Mineral and Petroleum Royalty Bill, recently introduced by theNational Treasury; and 3) the increasing incomes and decline in poverty thatwould result through the employment-targeted growth program itself. We con-sider these in turn.
Extending the uncertified securities tax to bond tradingAt present, this tax is applied to secondary market trading of stocks at a rate of0.25 percent of the value of trades.1 We propose that the tax be extended toapply also to secondary market bond trading. A wide range of countries doapply similar such taxes on bonds as well as stocks, or have done so in the recentpast. We can see this from the table we present in Appendix 5, Table A5.1 (seepage 167), which collects information on 39 countries that either were operatinga tax on stocks as of 2002 or had done so in the recent past. As Table A5.1 shows,of these 39 countries, 26 also were operating a tax on corporate bonds as of 2002or had done so in the recent past. Twelve countries had extended the tax to
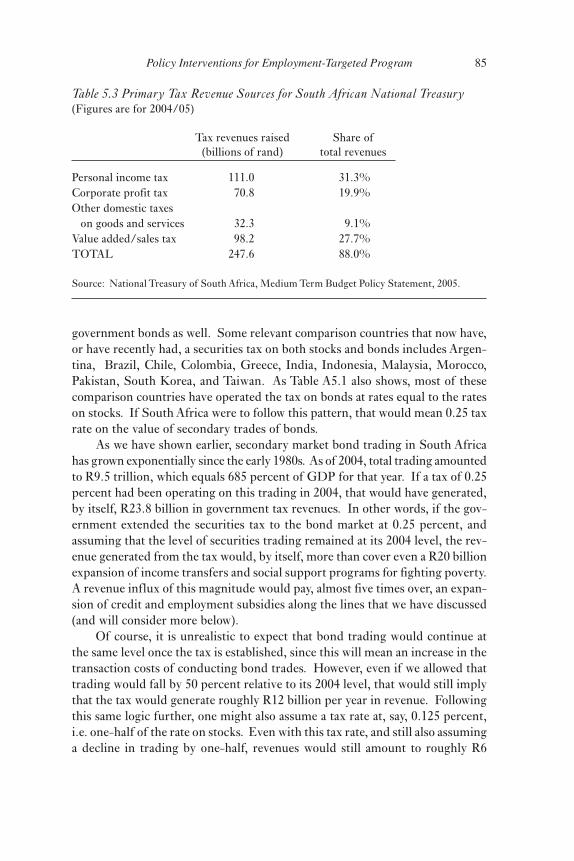
85Policy Interventions for Employment-Targeted Program
government bonds as well. Some relevant comparison countries that now have,or have recently had, a securities tax on both stocks and bonds includes Argen-tina, Brazil, Chile, Colombia, Greece, India, Indonesia, Malaysia, Morocco,Pakistan, South Korea, and Taiwan. As Table A5.1 also shows, most of thesecomparison countries have operated the tax on bonds at rates equal to the rateson stocks. If South Africa were to follow this pattern, that would mean 0.25 taxrate on the value of secondary trades of bonds.
As we have shown earlier, secondary market bond trading in South Africahas grown exponentially since the early 1980s. As of 2004, total trading amountedto R9.5 trillion, which equals 685 percent of GDP for that year. If a tax of 0.25percent had been operating on this trading in 2004, that would have generated,by itself, R23.8 billion in government tax revenues. In other words, if the gov-ernment extended the securities tax to the bond market at 0.25 percent, andassuming that the level of securities trading remained at its 2004 level, the rev-enue generated from the tax would, by itself, more than cover even a R20 billionexpansion of income transfers and social support programs for fighting poverty.A revenue influx of this magnitude would pay, almost five times over, an expan-sion of credit and employment subsidies along the lines that we have discussed(and will consider more below).
Of course, it is unrealistic to expect that bond trading would continue atthe same level once the tax is established, since this will mean an increase in thetransaction costs of conducting bond trades. However, even if we allowed thattrading would fall by 50 percent relative to its 2004 level, that would still implythat the tax would generate roughly R12 billion per year in revenue. Followingthis same logic further, one might also assume a tax rate at, say, 0.125 percent,i.e. one-half of the rate on stocks. Even with this tax rate, and still also assuminga decline in trading by one-half, revenues would still amount to roughly R6
Table 5.3 Primary Tax Revenue Sources for South African National Treasury(Figures are for 2004/05)
Tax revenues raised Share of(billions of rand) total revenues
Personal income tax 111.0 31.3%Corporate profit tax 70.8 19.9%Other domestic taxes on goods and services 32.3 9.1%Value added/sales tax 98.2 27.7%TOTAL 247.6 88.0%
Source: National Treasury of South Africa, Medium Term Budget Policy Statement, 2005.

An Employment-Targeted Economic Program for South Africa86
billion, still again, an amount greater than what we have proposed for expansionof credit/employment subsidies.
In addition to this revenue potential, there are three additional reasonsfor extending the securities tax to cover bond trading. The first is that the taxis already in operation with respect to stock trading. Extending the same tax-collecting mechanisms to another market would not entail major administra-tive adjustments. Nor would we expect the degree of resistance to the tax bySouth African bond traders to be significantly different than what opponentsof the stock trading tax have already expressed. In addition, this is a highlyprogressive tax, falling almost entirely on people who trade actively on bondmarkets. That is, it will fall almost entirely on wealthy individuals, and amongthose people, almost entirely among the subset of the wealthy who choose totrade their assets actively.2 People who purchase financial assets and hold themwill face infrequent tax obligations. Finally, as we have already reviewed, thereis no evidence that the extremely high levels of secondary market bond trad-ing that have prevailed in South Africa since the early 1980s have provided anybenefit in terms of promoting productive investments. Rather, as we haveseen, the exponential growth in bond trading in South Africa has coincidedwith a sharp decline in the ratio of real investment—in buildings and machin-ery—relative to GDP.3
Enacting the Mineral and Petroleum Royalty BillIn 2003, the Treasury drafted a bill which would entail royalty payments madeby holders of the rights for the extraction and sale of South Africa’s valuablenon-renewable mineral resources. The draft bill proposes quarterly royalty pay-ments on the gross sales value of the minerals extracted. The proposed royaltyrates would differ across the different types of minerals, precious metals, andenergy products. The logic behind the royalty payments is straightforward. Aportion of the revenues generated by the extraction of non-renewable resourcesrepresent ‘scarcity rents’—payments made on the basis of the rarity of the com-modity in question and not directly related to the costs of extracting, process-ing, and distributing mineral resources. Because the benefits from these scarcityrents do not result from anyone’s efforts as laborers, managers, or firm owners,it is reasonable to provide that these benefits be shared broadly, to finance, forexample, a portion of larger social service expenditures, the Expanded PublicWorks Program, or a program of credit and employment subsidies. In addition,since the revenues generated derive from the exploitation of natural resourcesthat are not mobile, if the administration of the royalty system is handled withcare, there is virtually no risk that mining operations would relocate out of SouthAfrica to avoid paying the royalty.
Under the Treasury proposal, the royalty rates will be 1 percent of sales formost minerals, rising to 2 – 3 percent in some cases, to 4 percent for platinum,
87Policy Interventions for Employment-Targeted Program
and a high of 8 percent for diamonds. Under this rate structure, we estimatethat for 2003, the Treasury would have raised approximately R2.5 billion. Thus,at the proposed rate structure, the royalty potential is not nearly as large as withextending the securities tax to bonds. Nevertheless, R2.5 billion, by itself,would finance more than half of the Extended Public Works Program annualbudget at its current level of operations.4
Income growth and declines in povertyAssuming the trend rate of economic growth remained at the roughly 3 per-cent average that prevailed from 1994 – 2004, and that the existing levels oftaxation remained unchanged, an additional R8.4 billion in government rev-enues would result simply due to economic growth. It follows that if the SouthAfrican economy’s long term growth rate were to rise to something like the5.3 percent we have projected for our employment-targeted program—i.e.4.5 percent growth for non-subsidized activities and 8 percent for subsidizedactivities—this would also generate a further rise in the government’s taxrevenues. For example, for 2004, the difference in government revenue thatwould result from a 5.3 percent growth rate over 2003 versus a 3 percent growthrate would be R6.4 billion. In addition, precisely because the growth pro-gram we have outlined is targeted at generating rapid employment growth,this should also mean that the number of people who would be requiring so-cial assistance programs should diminish.
However, the Treasury has already projected a significant growth dividendinto their budgetary planning. For example, the 2005 MTBPS allows for aroughly 10 percent average annual increase in nominal revenues from 2006-07to 2008-09. Thus, while it is important to recognize the benefits that wouldflow for the government from higher economic growth and faster poverty re-duction, for the purposes of financing new programs beyond what the govern-ment has already budgeted, we have to assume that the additional funds wouldneed to come from either increased taxes or government borrowing.
Thus, considered as a whole, if we conservatively allow that a securities taxon bonds generates R6 billion in revenue—i.e. roughly a quarter of what wouldhave been generated if the tax were operating at the 2004 level of governmentbond trading—and that that the mineral royalty generates R2.5 billion, thisamounts to a total of roughly R8.5 billion in increased revenue, separate fromany revenue increase or cost reductions due to a growth dividend.
Overall then, it is reasonable to expect that about 60 percent of the revenueneeds we have outlined could be covered through measures other than raisingpersonal income taxes, profit taxes, and the VAT. The remaining roughly R6billion in revenue needed from these traditional sources will therefore representa modest increase of about 2.4 percent over what is already being generatedthrough these sources.

An Employment-Targeted Economic Program for South Africa88
MONETARY POLICY AND INTEREST RATES
Inflation Targeting
The government’s commitment to inflation targeting exerts a major influenceon the overall operations of the economy and, in particular, the realistic possi-bilities for significantly increasing employment prospects in South Africa. TheSouth Africa Reserve Bank (SARB) established an explicit policy of inflationtargeting as the primary focus of monetary policy in February 2000. This wasafter it had adopted a less explicit commitment to inflation targeting in March1998. When taking this first step in March 1998 toward an inflation targetingregime, the Reserve Bank expressed its aim as being able to reduce inflation tolevels comparable to those in the country’s major trading partners, meaningespecially the U.S., Britain, and other OECD countries. Since adopting an ex-plicit inflation targeting policy in 2000, the targeted range for inflation has beenbetween 3 and 6 percent.5 According to T.T. Mboweni (2002), the Governor ofthe Reserve Bank, inflation targeting is a fundamental policy principle for SouthAfrica because it “helps to anchor the public’s inflation expectations, therebyimproving planning for the economy, as well as providing an anchor for expecta-tions of future inflation to influence price and wage setting.”6 Some observerssuggest that since 2003, the Reserve Bank has adopted a somewhat more flexibleapproach to inflation targeting (Aron and Muellbauer, 2005). Nevertheless, todate, the target remains at between 3 – 6 percent, and maintaining this targetintact is included in the preliminary presentations of the new ASGISA pro-gram.
Inflation targeting has been broadly successful at meeting its most directgoal, i.e. to lower the country’s inflation rate. We can see this in Figure 5.2below. As we see, inflation did fall from 1997 – 1999, from 8.3 to 5.1 percent. Itdid then rise, though only modestly in 2000 and 2001. There was a sharp in-crease in 2002, to 8.7 percent. This inflation spike resulted from a run on therand, causing the exchange rate to fall from 6.9 rand to the dollar in 2000 to 10.5rand/dollar in 2002, a change of over 50 percent. The fall in the rand thenpushed up consumer prices, in particular food prices.7 However, once this epi-sode subsided, the inflation rate for 2003 was back within the target, at 5.7 per-cent. The figure for 2004 was 4.3 percent. As of November 2005, inflation wasdown to 3.7 percent. In short, with the exception of the spike in 2002, inflationhas remained within the target range from 1998 – 2004, and into 2005.
The primary means through which the Reserve Bank controls inflation isthrough adjustments in interest rates. Raising interest rates lowers the rate ofborrowing and expenditure and thereby dampens the economy’s level of aggre-gate demand. The Reserve Bank exercises direct control over the rate on gov-ernment bond repurchase agreements—the so-called “repo rate”—and this rate

89Policy Interventions for Employment-Targeted Program
operates directly on the short-end of financial markets and indirectly on longer-term rates.
Figure 5.3 tracks the movements of nominal and real interest rates in SouthAfrica since 1994, distinguishing in the figure both the first and second phasesduring which inflation-targeting policies have been operating. This provides uswith an initial picture of the effect of inflation-targeting policies on interestrates. The two interest rates we are tracking are the long-term governmentbond rate and the composite private lending rate reported in the IMF’s Interna-tional Financial Statistics publication. In the first panel of Figure 5.3, we ob-serve the movements of the nominal long-term rates, and in the lower panel, weobserve ex post real rates, i.e. the nominal rates minus the contemporaneousCPIX inflation rate.
First, we see that the inflation-targeting policies were initially implementedat a time of extraordinarily high interest rates. In the third quarter of 1998, thenominal government bond rate was 17.1 percent and the lending rate was 25percent. The nominal rates fell sharply subsequent to that, during the period inwhich inflation targeting was in operation. The only exception was during 2002,when inflation surged.
In terms of real rates, we also see that both the government bond and lend-ing rates were falling sharply during most of the period under both inflationtargeting phases. This means that the downward movement of nominal rates
4
5
6
7
8
9
1994 1995 1996 1997 1998 1999 2000 2001 2002 2003 2004
Ann
ual i
nfla
tion
rate
(in
perc
enta
ges)
Figure 5.2 Annual Inflation Rate in South Africa, 1994-2004(CPIX Rate)
Source: Reserve Bank of South Africa.

An Employment-Targeted Economic Program for South Africa90
was more rapid than the decline in inflation. This should be recognized as apositive outcome associated with—though not necessarily caused by—inflation-targeting policies. It suggests that inflationary expectations were dampenedafter inflation-targeting policies were put in place.
However, the surge in inflation in 2002 seems to have brought a significantchange in the behavior of interest rates. When inflation rose back up in 2002 to
8
12
16
20
24
28
1994 1995 1996 1997 1998 1999 2000 2001 2002 2003
Nom
inal
Inte
rest
rate
s (p
erce
ntag
es)
-5
0
5
10
15
20
1994 1995 1996 1997 1998 1999 2000 2001 2002 2003
Rea
l int
eres
t rat
es (p
erce
ntag
es)
Figure 5.3 Nominal and Real Interest Rates in South Africa
Source: Reserve Bank of South Africa.
NOMINAL GOVERNMENT BOND AND PRIVATE LENDING RATE
Lending rate
Governmentbond rate
Inflation TargetingPhase 2
InflationTargetingPhase 1
REAL GOVERNMENT AND PRIVATE LENDING RATES
Inflation TargetingPhase 2
InflationTargetingPhase 1
Lending rate
Governmentbond rate

91Policy Interventions for Employment-Targeted Program
8.7 percent, real interest rates also fell sharply, with the government bond ratereaching a negative level and the real lending rate falling to 5.0 percent in thefourth quarter of 2004 (2004.4). Then, when inflation declined in 2003 and2004, both real interest rates then rose back up sharply, with the real lendingrate reaching 11.1 percent in the first quarter of 2004, and averaging 8.0 percentfor the full year.
The overall picture is that inflation-targeting policies did succeed for a timein lowering real interest rates. However, this decline was from an extraordinar-ily high level that prevailed in 1998, so that even while declining, the real ratesremained, for the most part, in the range of 8 percent through 2001. Subse-quent to 2002, maintaining the inflation target has been associated with increas-ing rates. If this pattern holds, it means that keeping the inflation rate withinthe 3 – 6 percent target range will be associated with the maintenance of highreal lending rates, i.e. somewhere in the range of 8 – 10 percent.
This high level of interest rates since 2002 can also be observed when con-sidered in comparison with the rates prevailing in the United States. In Figure5.4, we show the differential in the real long term bond rate between SouthAfrica and that of the United States. Apart from a large increase in 2000 andthen a large drop in 2003, the differential has fluctuated but not declined since1994. This lack of decline in international interest differentials, despite the imple-
-2
0
2
4
6
8
1994 1995 1996 1997 1998 1999 2000 2001 2002 2003 2004 2005
Inte
rest
rat
e di
ffer
entia
l--S
A R
ate
- U
S R
ate
Figure 5.4 Long-Term Government Bond Rate Differential between South Africaand the United States, 1994.1-2005.4
Source: U.S. Federal Reserve; Reserve Bank of South Africa.Note: U. S. rate is for 10-year constant maturity bond; South Africa rate is 10-year maturity orhigher. Inflation rates for both countries are 12-month percentage change in CPI.
Inflation TargetingPhase 2
InflationTargetingPhase 1

An Employment-Targeted Economic Program for South Africa92
mentation of inflation targeting, has been seen as a puzzle by supporters of theinflation targeting regime (see, for example, Aron and Muellbauer, 2005). To usit suggests that the targeting regime has been able to lower nominal interestrates to some extent because of the interest rate declines in international finan-cial markets more generally. However, beyond this, there has been little progresstoward establishing a lower real interest rate environment.
From this reading of the evidence, we can conclude that the problem withinflation targeting is not that it has caused high interest rates by itself. A highinterest rate regime preceded the implementation of inflation targeting. Thepoint about inflation targeting is that it does not appear capable of bringingreal rates down to a significant degree. This is not surprising, since this is notthe purpose of inflation targeting. Rather, precisely because high interest ratesare the instrument of inflation control, inflation targeting has meant that ahigh interest rate regime has continued throughout the 1990s and through2004.
Interest Rates, Growth, and Inflation
What are the costs and benefits of maintaining the country’s high interest rateregime? We have gathered some perspective on this question through our ear-lier consideration of the relationships between investment and interest rates aswell as that between consumption and interest rates. The next step in the analy-sis is to combine the investment and consumption effects, and thereby observethe effects of lowering interest rates on overall South African GDP growth. Inconjunction with measuring the effects on GDP growth, we would then alsowant to examine the effects of lowering interest rates on inflation itself.
To pursue these questions, Prof. Epstein developed a simple econometricmodel of the South African macroeconomy, using the Vector Autoregression(VAR) framework. This model enables us to estimate the following:
1. How changes in interest rates affect GDP growth, after accounting for theeffects of inflation and exchange rate fluctuations on GDP growth;
2. How changes in interest rates affect inflation, after accounting for the ef-fects of GDP growth and exchange rate fluctuations on inflation;
3. How changes in interest rates affect the exchange rate, after accounting forthe effects of GDP growth and inflation on the exchange rate.
Specifically, we use this basic model to perform policy “experiments” toestimate the impacts on economic growth, exchange rates and inflation of a moreexpansionary monetary policy by the South African Reserve Bank. We also haveused a similar model to estimate the impacts of increases in credit growth oneconomic growth and inflation. Appendix 6 presents a much fuller technical

93Policy Interventions for Employment-Targeted Program
discussion of the model, methods and results. Here we present a basic summaryof our findings.
At the outset, it is important to note that these estimates are based on highlysimplified models of the economy that can only take into account a relativelylimited number of possibly important variables. As such, they should be ap-proached with caution. Still, it is likely that the suggested impacts generated byour model are broadly indicative of how the South African economy responds tochanges in macroeconomic policies.
1. Interest rates and economic growth. The model estimates that if thecentral bank lowers the prime lending rate by 1 percentage point, and main-tains the 1 percentage point lower rate for a five-year period, this will in-crease real GDP growth by 0.15 percent per year. For example, startingfrom a GDP growth rate of 3.0 percent and a nominal prime rate of 11percent (corresponding roughly to the actual average figures for 1994-2004),if the prime rate fell to 10 percent and were held at 10 percent for five years,the average rate of real GDP growth over the five-year period would rise to3.15 percent.
2. Interest rates and inflation. The same 1 percentage point decline in theprime lending rate will lead to a moderate increase in inflation. Our modelestimates that over the course of 5 years, a sustained 1 percentage pointdecline in the prime rate would generate an increase in the average inflationrate on the order of 0.2 percent. For example, if the economy is experienc-ing a 5 percent inflation rate before the decline in interest rates, then dur-ing the five years of a lower interest rate regime, the inflation rate wouldaverage 5.2 percent.
3. Interest rates and exchange rate. The same 1 percentage point fall inthe nominal prime lending rate will produce a depreciation in the value ofthe rand relative to the dollar by 0.6 percentage points, as an average overthe 5 year period. Note that over some of this five-year period, the modelpredicts that the rand would actually appreciate relative to the dollar tosome extent. Overall, according to our model, the fluctuations in the randthat would follow from the lower interest rate policy would not be espe-cially large by historical standards. For example, since 1994, the nominalexchange rate has varied from 3.4 rand to the dollar to 11.5, and the averageannual rate of depreciation was 6.1 percentage points.
Monetary policy tools and the prime rateMonetary policy interventions in South Africa now take place through the Re-serve Bank’s interventions in the market for repurchase agreements—i.e. theso-called “repo rate.” The Reserve Bank does not exert direct influence over theprime rate. It is therefore necessary to consider the relationship between move-

An Employment-Targeted Economic Program for South Africa94
ments in the repo and bond rates to determine how effectively the Reserve Bankcould in fact influence the prime lending rate. To obtain some rough sense ofthis in Figure 5.5, we plot the movements of both the repo rate and prime ratebetween 1999-2004. As we see, these two rates do in fact move together in closecorrespondence over these years. This suggests that, if the Reserve Bank didwant to reduce the prime rate to promote accelerated economic growth, they dohave the tools at hand to do so.
How much growth from lowering rates?In our discussion above on growth, labor intensity and employment, we esti-mated the employment effects of raising the growth rate of unsubsidized busi-ness activity in South Africa from 3 percent to 4.5 percent. We can now considerhow much we can use a decline in interest rates to move the unsubsidized activ-ity in the direction of 4.5 percent growth. In Table 5.4 below, we summarize theestimated effects of lowering the prime lending rate by 4 percentage points andmaintaining it at that lower level—in our example from 11 to 7 percent—for fiveyears. As we see, the impact will be to raise GDP growth from 3 percent to, onaverage, 3.6 percent; raise inflation from 5 to 6 percent on average; and to causean acceleration of the average rate of depreciation of the rand/dollar exchangerate. The maximum annual rate of depreciation over the 5 year period wouldrise by 12 percent. At that maximum rate of depreciation the rand/dollar ex-
Figure 5.5 Average Repo and Prime Overdraft Rates in South Africa, 1999-2005
Source: Reserve Bank of South Africa.
6
8
10
12
14
16
18
1999 2000 2001 2002 2003 2004 2005
Inte
rest
rat
es
Repo rate
Prime overdraft rate

95Policy Interventions for Employment-Targeted Program
change rate could go, for example, from 6.3 rands/per dollar to 7.1 rands/dol-lar, i.e., well within the historical range for this relationship. Over the entire 5-year period, the exchange rate impacts are, on average, expected to be moremodest. As the appendix shows, the model predicts that the overall average de-preciation of the exchange rate over the five year period would be around 2percent per year. Compounding this over the 5-year period would also result ina 12 percent depreciation, leading to a depreciation in the exchange rate from6.3 rand per dollars in the first quarter of 2000 to 7.1 by the end of 2004 in theabsence of any other changes in the exchange rate.8
In short, the benefits of the interest rate decline would be substantial, butthey would only bring the economy less than half way toward the growth rate of4.5 percent for the unsubsidized activities in the economy. However, there areother policy options available for closing this gap. First, the Reserve Bank couldlower interest rates by more than 4 percentage points. As we have seen, our modelsuggests that the inflationary effects of these reductions are likely to be relativelymodest. At the same time, exchange rate volatility does increase with furtherdecreases in interest rates. As a result, alternative measures—including capitalmanagement techniques—should be considered as complementary policies.
In addition, if the Treasury were to move back toward the somewhat morerelaxed fiscal stance that it was projecting in its 2004 MTBPS—i.e. a fiscal defi-cit in the range of 3 percent of GDP as opposed to 2 percent of GDP—this will
Table 5.4 Estimating the Impact of Interest Rate Decline on GDP Growth,Inflation and Exchange Rate ChangesIllustrative Model Based on Approximate 2004 Data and VAR Estimates:Effect of Lowering Nominal Prime Lending Rate from 11% to 7% for 5 Years
Figure before Figure afterinterest rate decline interest rate decline
GDP growth(average annual impact) 3.0% 3.6
Inflation(average annual impact) 5.0 6.0
Average Rand/ Average CumulativeRand/ annual dollar annual changedollar depreciation level after depreciation overlevel rate five years rate 5 Years
Exchange rate change(Rand/dollar) 6.3 1.07% 7.1 2.2% 12%
Source: See discussion in text and Appendix 4.

An Employment-Targeted Economic Program for South Africa96
also contribute to accelerating the trend growth rate of unsubsidized activitiestoward the range of 4.5 percent. Thus, in combining this more relaxed fiscalstance with lower unsubsidized interest rates and the growth in private creditassociated with credit subsidies, it is reasonable to anticipate, within the frame-work of this VAR exercise, an average growth trend in the range of 5.3 percent.
As we also see from the discussion above, the reduced interest rates shouldraise the inflation rate modestly and might also contribute to more exchangerate volatility. Such changes should be readily manageable. It is also true thatexpansionary fiscal policy could also exert concurrent upward pressure on in-flation and downward pressure on the rand. But these issues take us to a broaderset of policy concerns regarding controlling inflation and the exchange rate.These are questions we will consider later.
PUBLIC CREDIT ALLOCATIONAND DEVELOPMENT BANKING
Public credit allocation policies in South Africa could play a crucial role in ad-vancing a serious program to expand employment and reduce poverty. Thisfact has clearly been recognized through the country’s “financial charter.” Thecharter is premised on the idea that the country’s financial institutions shouldbe engaged in advancing social development. This proposal offers measures tofurther mobilize the country’s public and private financial institutions in behalfof promoting accelerated economic growth, employment expansion and pov-erty reduction.
What are credit allocation policies? These are the set of policies throughwhich credit is supplied on concessionary terms to private firms, with conces-sions provided on the basis of a country’s developmental goals. Credit alloca-tion policies are often conducted through development banks that are eitherpublicly owned or semi-public entities. However, credit allocation policies neednot operate only through development banks. Indeed, because South Africacurrently operates with such an extensive, well-developed private financial sys-tem, it follows that this private system should be mobilized, along with the pub-lic development banks, to address the country’s program of employment creation.
Our proposal is actually a hybrid policy intervention, in that it is simulta-neously providing firms with both an employment and a credit subsidy. As such,the proposal has a benefit relative to a more traditional general employment sub-sidy in that the government will not have devote enormous resources to providesubsidies to all firms based on their number of employees. The government alsowould not have to carefully monitor firms to accurately measure their marginalincrease in hires, as would be the case with a marginal employment subsidy pro-gram. This is true even while, as we discuss below, the proposal does entail sig-

97Policy Interventions for Employment-Targeted Program
nificant amounts of monitoring, to ensure that funds are utilized toward theirprimary intended aim of employment creation. Finally, the hybrid approach alsoavoids the problem with a traditional credit subsidy, which is that it is providingincentives for firms to borrow in order to purchase capital equipment—i.e to sub-sidize capital over labor expenditures. Under this sort of measure, there couldstill be employment benefits due to the increase in overall expenditures and out-put by firms because of the availability of cheap credit. But this employment gaincould be counterbalanced to the extent that the credit subsidies encourage furtherincreases in the use of more capital intensive production methods.
Of course, the issue in seeking to mobilize both the public developmentbanks and the private financial system toward addressing the country’s employ-ment problem is how to design policies in which incentives for both borrowersand lenders are clear and strong. We propose that South Africa utilize threemain policy tools to attract private lenders and borrowers into financing activi-ties that will substantially boost employment.
The three policy tools that we propose are:
1. A substantial expansion in both the level and scope of activities of the country’sexisting public development banks.
2. An extensive system of loan guarantees. South Africa does currently guaran-tee loans, but, as we will see, the system is far too modest at present to exerta significant impact on the country’s development path; and
3. A system of asset-based reserve requirements. This refers to requirements thatfinancial institutions hold a given percentage of their loan portfolio in so-cial priority areas, such as small-scale agriculture or biofuels. To the extentthat they do not include these activities in their portfolio, they must holdcash as a substitute. The South African financial system operated between1956 – 1989—i.e. through most of the apartheid era—under a system ofso-called “prescribed assets.” We are certainly not proposing a return tothat previous system. At the same time, allowing for an entirely distincthistorical situation in democratic South Africa, our proposal will includefeatures that resemble the previous system. Significantly, as we will dis-cuss, such measures can be designed with far more flexibility than was thecase with the previous system. In addition, of course, this set of policyinterventions needs to also be directed toward the purpose of fighting un-employment as opposed to upholding the apartheid economy.
We describe the main features of these three proposals in some detail below.But it is first important to emphasize that such a broader approach to creditallocation and development banking—i.e. one involving the private financialsystem as well as public development banks—is consistent with the experiencesof many relatively successful developing countries. This point becomes clear in

An Employment-Targeted Economic Program for South Africa98
the illuminating discussion of development banking by Alice Amsden in TheRise of “The Rest” (2001). Amsden begins her discussion of this topic with thegeneral observation that:
The state’s agent for financing investment was the development bank. From theviewpoint of long-term capital supply for public and private investment, develop-ment banks throughout “the rest” were of overwhelming importance (p. 127, em-phasis in original).
Amsden goes on to document this in the cases of Mexico, Chile, Korea,Brazil, and Indonesia. But she also points out that “the government’s role inlong-run credit allocation was substantial even in parts of “the rest” wheredevelopment banks were of relatively minor importance,” (p. 129). Thesecases include Malaysia, Thailand, Taiwan, and Turkey. She writes of thesecases, “when necessary, the whole banking sector in these countries was mobi-lized to steer long-term credit to targeted industries, acting as a surrogatedevelopment bank.”9
The general point here is that development banks can play a central role infinancing a major employment-generating program in South Africa. But weneed not assume that using credit allocation policies to promote employmentshould be limited to the possibilities that exist through using the existing devel-opment banking apparatus.
The Current State of Credit Allocation Policies in South Africa
As mentioned above, South Africa does already operate with an extensive sys-tem of development banks as well as a modest loan guarantee program. It is notcurrently making use of the system of prescribed assets that operated between1956 – 1989. We review here the current status of the credit allocation pro-grams in the country before outlining our proposals for a more ambitious set ofpolicies aimed at employment creation and economic growth.
Development banksTo our knowledge, South Africa does now have in place eight national institu-tions that operate, through various types of lending and other activities, as pub-lic development banks. These eight institutions are:
• The Industrial Development Corporation of South Africa (IDC);• The Development Bank of Southern Africa (DBSA);• The Land Bank of South Africa• The National Housing Finance Corporation• The Rural Housing Loan Fund• The Postbank

99Policy Interventions for Employment-Targeted Program
• Khula Enterprise Finance• The National Empowerment Fund
There are regional development corporations in addition to these, suchas Ithala Development Finance Corporation, which is 100 percent owned bythe Kwa-Zulu Natal government; and the Eastern Cape Development Corpo-ration.
In terms of lending activity, the largest development bank in South Africaat present is the Industrial Development Corporation (IDC). According to theIDC’s 2005 Annual Report, in 2004-05 the bank approved R3.8 billion in newloans. This is 1.6 percent of South Africa’s gross capital formation for 2004.The IDC also “anticipated” creating 16,700 jobs through its 2004-05 activities.This is equal to slightly more than 0.1 percent of the official South Africaworkforce for 2004 and 0.4 percent of the number of officially unemployed as ofthat year. In short, from this most current evidence, the IDC is playing a verymodest role in addressing the country’s needs in terms of financing capital for-mation and creating employment. The other two large public development banksin South Africa are the Development Bank of Southern Africa (DBSA) and theLand Bank. 10 For the current discussion, we focus on the activities of the IDC,the country’s largest development bank.
The IDC’s 2003 Annual Report explains its overall goals and performancestandards in more detail than the more recent 2004 and 2005 Reports. It isuseful to review some of the points presented in the 2003 document. In particu-lar, the 2003 Report states that the IDC’s corporate performance should bemeasured according to six parameters, which are assigned relative weights inthe degree of their importance. The relative weights for the different criteriaare as follows:
1. Financial returns—40%2. Role in economy—20%3. Developmental Role—15%4. Strategic Imperative—Human Resources—7%5. Strategic Imperative—Implementation of New IT System—5%6. Strategic Imperative—Key Initiatives—5%
Of course, the distinctions between some of these categories are artificial,e.g. between “role in economy” and “developmental role.” Nevertheless, thiscategorization is indicative of how the IDC operates. Let us consider these in abit of detail.
Financial returns. According to its established criteria, the single mostimportant purpose of the IDC, by a significant margin, is to make profits. This

An Employment-Targeted Economic Program for South Africa100
becomes clear by examining their summary performance statistics further. Interms of their “average interest rate differential”—their first indicator of “fi-nancial returns”—the IDC had set a goal in 2002-03 of earning a 1 percentdifferential between their portfolio rate and their average borrowing costs. How-ever, the IDC exceeded this goal by quite a bit: its actual interest rate differen-tial was 3 percent. In short, the IDC appears to be operating according tostandards of profitability comparable to what would be true for a private bank.This is fully consistent with what officials of the IDC had told us when wevisited their offices in August 2004. This approach would also be consistentwith the fact that IDC is a self-financing entity.
Role in Economy. The IDC’s total loan approvals in 2003–04, at 3.2 per-cent of gross capital formation, were somewhat below the stated goal of financ-ing between 3.4 – 4.2 percent of gross investment. Nevertheless, the moreimportant point is that the range they are setting for themselves is very modest.Consider again Amsden’s discussion of the experiences in other countries:
Mexico’s Nacional Financiera accounted for about twice the value of long-term loansof all private credit institutions in 1961…. It also accounted for over 60 percent of thetotal of stocks held by private credit institutions. Nor was [Mexico’s] position atypical.In India, it was estimated by the late 1960s that more than one-fifth of total privateinvestment in industry was financed through development banks and ‘the share ofdevelopment banks in medium- and long-term loans would, of course be muchhigher….’ In Chile, between 1961 and 1970, the fixed investment of targeted projectsby CORFO was scheduled at 55 percent of all fixed investment in industry, includingartisan industry. CORFO is estimated to have controlled over 30 percent of invest-ment in machinery and equipment, more than one-fourth of public investment, andclose to 20 percent of gross domestic investment (p. 127-29).
The proportions that Amsden reports for development banks as a share ofinvestment were maintained at roughly these levels through the 1980s and eventhe 1990s, though the figures do decline somewhat with time. As such, we canconclude that relative to other developing country experiences, the role of theIDC in the South African economy is very small. This point remains true if weinclude the lending activity of the DBSA, the Land Bank, and all other devel-opment banks in South Africa.
Developmental Role. The IDC defines its “developmental role” in termsof the total number of jobs that will be created through its lending activity. Aswe have already seen for 2004-05, that contribution has been only modest.
In short, to date, the IDC—and by extension South Africa’s developmentbanks as a whole—are making very limited contributions in terms of their im-pact on the overall economy as opposed to the benefits they are providing toindividual businesses and projects.

101Policy Interventions for Employment-Targeted Program
At the same time, it is important to recognize that, at the time of writing, theIDC has undertaken a major new initiative to refocus their resources in behalf ofpromoting employment expansion. This new IDC initiative is described in depthin an April 2006 paper, “Targeted Employment Programs: The Case of the In-dustrial Development Corporation” by the IDC’s Chief Economist LumkileMondi. To the extent that the IDC succeeds in implementing this new initiative,it will have moved strongly in the direction that we are advocating here.
Loan guarantee programThe government does already operate a loan guarantee program. We obtain asense of the size of the program through the figures in Table 5.5. As we see, thetotal stock of contingent liabilities ranged from 1999/2000 to 2002/03 betweenR84 billion and R70.7 billion. Of this total, nearly 90 percent are loans for publicenterprises, with the largest recipient of guarantees being Transnet (R18 billion in2002/03—25% of total contingent liabilities), followed by the Trans-CaledonTunnel Authority (R15.2—22%), and the Development Bank of Southern Africa(R11.3—16%). Thus, these three recipients absorb 55 percent of the loan guar-antee program, as reported in the 2004 Medium-Term Budget Policy Statement.
We can also see from the table that accruals on the contingent liabilities—the amounts the government actually pay out when loans default—are a trivialproportion of government expenditures—at 1/100th of one percent or less inthree of the four years, and only 0.3 percent in 2001/02 when the Treasury paid
Table 5.5 South African Government Loan Guarantee Program:Contingent Liabilities and Accruals
Estimated EstimatedStock of Estimated flow accruals as a accruals as
outstanding of accruals on proportion of proportion ofcontingent contingent contingent total govern-liabilities liabilities1 liabilities ment expenditure
1999/2000 R79 billion R22.6 million 0.03% 0.01%2000/01 R73.2 billion R19.2 million 0.03% 0.01%2001/02 R84.2 billion R274 million 0.32% 0.1%2002/03 R70.7 billion R10 million 0.01% 0.003%
Source: Medium Term Budget Policy Statement, 10/26/04 Statistical Annexure B, Tables 4 and 8.a) Accruals are estimated on the basis of data in Table 4 (p. 202) of the Statistical Annexure B. Therelevant data series in the table is “standing appropriations.” According to Kuben Naidoo of theNational Treasury, this category includes approximately R20 million/year for subscription fees tothe UN, IMF and other organizations. The remainder of the category consists of accruals oncontingent liabilities. Contingent liabilities are from Table 8 (p. 214), the bottom “total” line of thetable.
An Employment-Targeted Economic Program for South Africa102
out lenders following a major bank failure.11 These ratios indicate the very lowlevel of risk the government has been willing to assume with its loan guaranteeprogram. Of course, the priority of assuming little risk establishes virtually noflexibility for the loan guarantees to promote an ambitious program of employ-ment targeting.
Asset reserve requirements and prescribed asset policiesDuring the apartheid era, South Africa’s financial system did operate under asystem of so-called “prescribed assets.” However, our proposal varies sharplyin several important respects from the previous prescribed asset system.
The prescribed asset system was introduced in the Pensions Fund Act of1956. It was compulsory for every fund to invest at least 10 percent of its totalassets in government stock and another 40 percent in prescribed stock (whichalso included government stock). These figures peaked at 22.5 and 55 percentrespectively at the height of apartheid. Prescribed assets included investmentsin National Defense Bonds, Iscor, Sasol, various water services, economic de-velopment, and homeland development corporations. When the system wasabolished in 1989, the prescribed asset level was at 53 percent of total pensionfund assets. At the same time, many funds voluntarily held an even higher pro-portion of their total funds in the prescribed assets.
Though no new system of prescribed assets has been implemented in thedemocratic era, several proposals have been advanced along these lines. In par-ticular, at the 2003 Growth and Development Summit, President Mbeki em-phasized as one of the three “key agreements” of the summit a proposal thatwould
Develop suitable instruments to direct 5% of investible income of a wide range ofpublic and private organizations, including the pension funds and insurance compa-nies, towards job creating and poverty alleviating projects, (p. 4 of Growth and Devel-opment Summit 2003).
Mbeki emphasized the importance of the point in also stating that:
We should be certain of when the investment mechanism for the employment of the5% of investible income from retirement income and other businesses, would be setup and start operating.
President Mbeki’s point coming out of the Growth and Development Sum-mit is also reiterated by presidential economic advisor Alan Hirsch in his paper,“South Africa’s Development Path and the Government’s Programme of Ac-tion.” Under the heading “Growth of the First Economy,” Hirsch lists a seriesof interventions that could contribute toward raising the country’s investmentrate. The first item that he lists is as follows:

103Policy Interventions for Employment-Targeted Program
The completion of the Growth and Development Summit discussion on the mean-ing of the commitment for 5% of institutional funds to be committed to infrastruc-ture and productive investments, (p. 7).
More than two years after the Growth and Development Summit propos-als, however, no serious progress had been made in establishing a workable planfor committing financial resources for job creation and poverty reduction. In-deed, a news story of July 19, 2004, in This Day reported that “President ThaboMbeki publicly expressed his annoyance with the poor progress on the commit-ments by the growth and development partners at the national Economic De-velopment and Labour Council in April last year.” In short, the development ofan effective system of credit allocation consistent with the country’s employ-ment needs and other social goals remains to be done.
Credit Allocation Proposals
Size of programThe credit allocation program should be a key instrument for promoting employ-ment growth. This would suggest a level of subsidized lending that is roughlyR40 billion per year (in 2004 prices). This would mean underwriting loans equalto about 25 percent of the country’s private fixed capital formation as of 2004.
Borrowers: who should receive subsidized credit?The fundamental purpose of the expanded credit allocation policies, of course,will be to underwrite a program of rapid employment growth. Subsidized creditshould be directed towards businesses and projects that are viable as businessactivities but that will also make significant contributions to employment growth.
As an initial organizing principle, we propose that businesses can becomeeligible for subsidized credit based on two main sets of criteria. The first is whatwe will term “social priority lending” for small-scale activities. We identitythree areas for social priority lending:
1. Land reform and rural developmentThe most serious problems of poverty and unemployment in South Africaare in the rural areas. Even if it were feasible, it is obviously not desirable topromote policies that would encourage more people to move into the citiesto find decent work. Therefore, we need to advance policies that create jobsin rural areas. Credit allocation, as well as infrastructure spending, can bea primary tool for achieving this.2. Promotion of small and medium-sized enterprises.This is a stated government priority. It is also clear that there is consider-able opportunity for increasing the representation of small- and medium-sized enterprises in townships and other historically oppressed areas. This

An Employment-Targeted Economic Program for South Africa104
need also coincides exactly with the additional government priority of “blackeconomic empowerment” in the area of business opportunities.3. Promotion of collectives and other alternative ownership formsPromoting collective private enterprises is a priority for the South Africangovernment. As MP Jeremy Cronin pointed out forcefully in our August2004 interview with him, collective enterprises capture much of the spiritof solidarity that was nurtured in the country’s long freedom struggle. Inthis spirit, it is only logical that, just as there should be special financialopportunities for private SMMEs, there should be comparable opportuni-ties for small- and medium-sized cooperatives to develop. Indeed, financialcooperatives are one potentially very important organizational form thatshould be supported.
By their nature, cooperatives will tend to operate with relatively labor-in-tensive production processes. Therefore, providing subsidized loans to theseactivities will also promote rapid employment expansion.
The second criterion is straightforward: any firm that does not fall withinthe “social priority” criterion will be eligible for concessionary loans if it candemonstrate that its projects will produce large positive employment effects.Thus, in applying for loans, a firm will have to provide an Employment ImpactStatement (EIS) demonstrating the overall number of jobs that its investmentwill create. The Employment Impact Statement should include both the directand indirect job effects—i.e. both the number of hires that the firm itself willmake and the up- and downstream impact when the firm receiving the loanpurchases inputs from other South African firms.
Under this criterion, firms will not be obligated to provide a formal em-ployment multiplier analysis comparable to that which we presented earlier. Buteven if they do not provide such a formal analysis, the firms should have toproduce compelling evidence demonstrating clearly the overall employmentbenefit of their projects, both directly through their own hiring increases as wellas through their domestic upstream linkages.
Under this criterion, the types of activities that are well known to be able togenerate large employment multipliers—such as bio-fuels and other forms ofagro-processing—will have an easier time producing a credible EmploymentImpact Statement, even while other types of firms and activities will be equallyeligible to try to meet the established employment criteria.
Of course, the requirement of producing an EIS will itself create barriersto entry for firms seeking subsidized credit. To produce the EIS will entailsignificant time and costs, and some degree of expertise in producing docu-ments of this nature. Projects that will be capable of carrying out the necessarysteps to apply for loans by this criterion are therefore likely to be large-scale. Assuch, both small and medium, as well as large-scale firms will be eligible for

105Policy Interventions for Employment-Targeted Program
subsidized credit. But each firm type will become eligible for subsidized creditthrough a different set of procedures.
Lenders: utilizing both public and private banking systemsTaken as a whole, our credit allocation proposals would entail a coordinatedeffort between the public and private financial sectors, and between the threetypes of proposed measures—i.e. expanding the role of the public developmentbanks as well as mobilizing the private financial system through loan guaranteesand asset reserve requirement policies.
Returning to the performance standards stated in the IDC’s 2003 AnnualReport, the key idea for expanding the role of the country’s development banksis to substantially increase the relative importance of what the IDC terms its“development goal” of job creation, as well as its “role in the economy” of fi-nancing capital formation, while, concurrently, allowing the standard of “finan-cial returns” to be relaxed for the IDC as well as the other development banks.
We have stated above that total subsidized credit in the economy wouldneed to amount to roughly 25 percent of private investment in order to promoteemployment growth adequately. There is no need to assert a hard-and-fast ruleas to what proportion of this roughly R40 billion in annual lending (in 2004prices) should be provided by public versus private financial institutions. Butwe can use the IDC’s high-end lending target for 2003 – 04 of 4.2 percent of allinvestment an initial point of departure. This standard for the IDC is alreadyestablished for 2003 – 04 lending, and it suggests that all the country’s eightnational development banks (as well as, perhaps, its regional banks) could com-bine to provide loans on the order of roughly eight percent of all investment—or roughly double the amount pledged by the IDC alone in 2003—without havingto dramatically reorganize the existing organizational structures of the develop-ment banks. At 2004 levels of investment, that would mean about R13 billion inloans from development banks. As we discuss below, it should not be difficultfor the private financial system to supply the remaining R27 billion in loans forthis program (assuming the 2004 level of investment).
Encouraging Small-Scale Banking to Serve this Market Segment. Atpresent, South Africa’s financial institutions are not especially well designed tomake loans to small-scale borrowers in the social priority sectors. It is thereforeimportant to develop a new sector of the banking industry capable of makingthese loans effectively. Thus, one feature of the expansion of lending activitiesto SMMEs, coops, and smallholding farmers—the social priority areas—willnecessarily entail encouraging the formation of financial institutions capable ofoperating at this level.
One way this could work effectively would be through the existing develop-ment banks. That is, in increasing the capitalization of the development banks,

An Employment-Targeted Economic Program for South Africa106
part of their expanded responsibilities would include promoting the formationof small-scale financial institutions capable of operating a system of lending andloan guarantees such as we have described here. Large-scale private banks couldthen form partnerships with the newly created small-scale institutions servingthe social priority markets. As we discuss further below, this would also facili-tate the process through which the large-scale banks can fulfill their asset re-serve requirements.
Sources of New Loan Funds. The subsidized credit program we have out-lined does not necessarily entail increasing the overall amount of lending andborrowing in the South African economy. The source of funds for the increasein subsidized credit could conceivably be a pure reallocation of a given amountof overall credit, with non-priority areas obtaining less credit by exactly theamount that priority areas receive subsidized loans. However, it is likely that thesubsidized credit program will generate some net increase in lending in theSouth Africa economy. As discussed in the previous section, we have factoredan expansion of private credit into our VAR modeling exercise.
What will be the sources of this net increase in loan funds? Over time, theincreased level of output and income generated from the expanded activities inpriority areas will generate, through the expenditure multiplier, a correspond-ing increase in domestic saving. But in the initial phase of this program, beforenet saving rises, the increased loan funds could still be made available as neededat appropriate interest rates. This could be done through conventional expan-sionary monetary policy interventions—that is, a Central Bank intervention toincrease reserve funds of private banks through open-market operations. Suchinterventions would be consistent with the low interest rate policy we have de-scribed above.
Note that these allocation measures would make it unnecessary for theeconomy to increase its domestic saving rate, expand the growth of monetaryreserves or the velocity of circulation, or attract foreign savings. Of course, ifthe economy were to maintain its current level of non-productive credit alloca-tion, it would be necessary to generate more reserves through some combina-tion of the expansionary measures mentioned above.
Costs of programHow much would such an expanded program likely cost the Treasury in termsof accruals on contingent liabilities? The following exercise provides a sense ofthe relevant proportions. We assume, as above, that we would want about R40billion in concessionary loans per year being granted (that is, as a share of GDPequal to its 2004 level). In pursuing such an aggressive government-sponsoredcredit program, we would also have to assume that the default rate on the subsi-dized loans would rise sharply relative to the ratio of accruals/contingent li-

107Policy Interventions for Employment-Targeted Program
abilities within the current government budget. Let us therefore make threebasic assumptions about a renewed government loan guarantee program:
1. The government program underwrites R40 billion in loans per year.2. The default rate on the loans is 15 percent.3. The guarantee on these loans covers 75 percent of principal.
Under these three assumptions, it follows that the accruals to the govern-ment would amount to R4.5 billion/year (i.e. R40 x .15 x .75). This figurewould of course represent a significant commitment by the government. Still,with the government’s budget at nearly R370 billion for 2005-06, a commitmentof R4.5 amounts to 1.2 percent of total government spending. One could obvi-ously also alter the assumptions in the exercise—e.g. assume a 10 or 20 percentdefault rate as opposed to 15 percent; or a coverage guarantee of 50 percent asopposed to 75 percent. Changing these assumptions will then alter the figurefor government accruals. Nevertheless, under any broadly similar set of as-sumptions, a crucial result nevertheless emerges: the government has the ca-pacity to underwrite a major loan guarantee program, equivalent to roughly 25percent of all private investment in 2004, with a budgetary commitment of nomore than 1–2 percent of total government spending.
Extent of Credit Subsidy. The terms of the subsidy must meet four crite-ria:
1. Subsidies must be large enough for the program to succeed in stimulatingborrowing for productive purposes and, in particular, employment genera-tion;
2. The program must still be seen as providing potential profit opportunitiesfor lenders;
3. The loan terms must be broadly consistent with the structure of interestrates, rewards, and risks within the South African financial market as itcurrently operates; and
4. The terms must be easily understood by participants in the financial system.
A logical starting point for establishing an appropriate interest rate on sub-sidized loans is the government bond rate. Government bonds have the lowestdefault risk of all bonds within the South African financial system. At the sametime, the South African government bond rate reflects everything about thegeneral level of risk in South Africa, including both inflation risk and countryrisk.
A subsidized loan to a private borrower would also incorporate general lev-els of country risk and inflation risk. The default risk on a subsidized loan

An Employment-Targeted Economic Program for South Africa108
would then depend on 1) the credit profile of the individual borrower; and 2)the extent of the loan guarantee. Based on this, the rate on concessionary loansshould be set as an increment above the government bond rate. How large anincrement above the government bond rate should then depend on the borrower’sprofile and on the extent of the government guarantee on loans.
To make this clearer, we can stipulate that a government bond issue in randfaces virtually zero default risk. Thus, the interest rate on a private loan with a100 percent guarantee should be set at exactly the government bond rate. Bycontrast, the appropriate rate on a loan with no guarantee is, by definition, themarket interest rate on that loan. As such, the government bond rate and themarket interest rate define the range within which concessionary rates shouldbe set.
The appropriate concessionary rate can therefore be derived simply as fol-lows:
Ilg = im – LC, whereLC = C(im – ib),
and Ilg is the rate on loan guarantees, im is the market interest rate for a loan of agiven risk class and maturity, C is the percentage of a loan that the governmentis guaranteeing, and ib is the government bond rate for a given maturity.
To illustrate this calculation with an example, consider a case, which closelyapproximates actual South African financial market conditions in November2005, in which the government bond rate is seven percent and the so-called“marginal lending rate” is 12 percent. In such a case, and assuming a 75 percentloan guarantee program, the concessionary loan rate Ilg would be 8.25 percent.
Of course, the concessionary loan rate would rise if the government guar-antee were less. Thus, if we assume that the loan guarantee is 50 percent ratherthan 75 percent, the concessionary loan rate rises to 9.50 percent.
Would this Program be Profitable to Private Lenders? If the South Afri-can financial market is accurately assessing the risk differential between differ-ent types of loans, then it follows that lending under the loan guarantee programat concessionary rates should be profitable to lenders. This is especially the casesince the loan guarantees would not be extended on the basis of funding morerisky activities per se, but rather activities that are capable of generating rapidincreases in employment. It is likely that projects with large employment ef-fects will tend to be more risky than other projects, if for no other reason thanthe aim of the program will be to bring in new borrowers—SMMEs, small land-holders, and coops—under the “social priority” lending category. However, thelarger-scale projects that will require an Employment Impact Assessment neednot be especially high-risk ventures.

109Policy Interventions for Employment-Targeted Program
However, to illustrate the issue of profitability for lenders, consider a simpleexample, which we present in Table 5.6, where we assume that the default rate isindeed substantially higher for a portfolio of guaranteed loans. Following theearlier discussion, we still assume that the default rate on guaranteed loans is 15percent. This means that the default rate on non-guaranteed loans is 5 percent.Now let us compare two loan portfolios, one of guaranteed loans and the otherof non-guaranteed loans. Assume the gross cash revenue on both portfolios isR1 million if there are no defaults on either loan. In Table 5.6, we see the netlosses for lenders at these default rates. As we see there, losses for private bor-rowers with non-guaranteed loans are R50,000, but are R37,500 under the port-folio of guaranteed loans.
This simple example doesn’t take into account all of the factors that mightaffect the profitability of the portfolio of loan guarantees. First, we need toallow that, for lenders, making guaranteed loans would entail extra administra-tive burdens. This would reduce the relative profitability of making guaranteedloans.
On the other hand, for lenders seeking a low-risk portfolio, there is likely tobe a scarcity of government bonds and low-risk private borrowers available fortheir portfolio. The loan guarantee program would effectively expand the poolof low-risk lending opportunities by a substantial amount. It should thereforealso tend to reduce the rates on all loans in the low-risk class.
In addition, if the government also implemented a system of asset reserverequirements, financial institutions would face costs of holding sterile cash re-serves if they did not make employment-targeted loans. Through combining theloan guarantees with the asset reserve requirements, financial institutions wouldbenefit both from holding a low-risk loan portfolio and from avoiding having tohold a portfolio of cash reserves rather than employment-targeted loans.
Incentive Structure and Monitoring of Borrowers. Under the East Asianmodel, the incentive structures, performance standards, and accountability re-
Table 5.6 Losses to Lenders from Loan Defaults with Non-Guaranteed andGuaranteed Loan PortfoliosAssuming R1 million in gross revenue for no-default case
Non-guaranteed Guaranteedloan portfolio loan portfolio
Default rate on R1 million contracted interest and principal 5 percent 15 percentLosses to lender from defaults R50,000 R150,000Lenders’ share of losses from defaults R50,000 R37,500

An Employment-Targeted Economic Program for South Africa110
quirements were straightforward. The fundamental performance standard wasexport success. Firms that received loans but then failed to succeed as export-ers were no longer eligible for subsidized loans. More generally, operating withclear performance standards, as well as with penalties for failing to meet thestandards, was the key to the success of credit allocation programs in SouthKorea and other economies described by Amsden (2001).
The situation in the current South African case is not as straightforward.For one thing, measuring success at employment generation is likely to be moredifficult than measuring export success. In addition, and more important, op-portunities to receive subsidized credit should be open to a wide range of firms.The social priority category especially should clearly be open to firms that can-not provide significant collateral or do not have a substantial prior record ofbusiness success.
At the same time, while the aim of the credit allocation program is to be asopen and inclusive as possible in terms of providing opportunities to receivesubsidized credit, it will also be crucial that the program operate with effectiveincentive and monitoring structures in place, including significant penalties forfailure as well as rewards for success. In the absence of effective incentive andmonitoring structures, the probability is high that the program will not achieveits goals of generating a major expansion of employment opportunities.
In short, the incentive and monitoring systems should at once be consistentacross firm types, while also recognizing the different requirements and needsof small firms, coops, and farmers, as opposed to large-scale operations.
Proposals for Incentive and Monitoring Structures. Of course, all firmswill first be evaluated by the most basic criterion of whether they are meetingthe schedules for repaying interest and principle on the loan. Moreover, whereappropriate, businesses will also be obligated to pledge collateral to receive credit.However, as mentioned above, there will be some cases where businesses willnot be able to produce adequate collateral but should still be eligible to receiveloans. At the same time, given that government funds will be pledged in theseloans, normal collateral requirements are not likely to be adequate as a disincen-tive to default. Thus the need for both greater flexibility and more stringentsafeguards in the subsidized credit program.
Design of Escrow AccountsThe creation of escrow accounts can serve as a flexible tool with both small-
and large-scale loan contracts. With small-scale loans, the escrow account can beused in cases where potential borrowers do not have adequate collateral to pledge.With large-scale borrowers operating under the terms of their Employment Im-pact Statements, the escrow account can serve as an incentive for borrowers tomeet their employment commitments and to penalize firms failing to do so.

111Policy Interventions for Employment-Targeted Program
Social priority lending. As noted above, SMMEs, small-scale farmers, andcoops should all be eligible for social priority loans. In some cases, significantlevels of collateral can be included as a component of a loan agreement. Thiswould clearly be the case when land or structures are owned by the borrowerand can be pledged. However, many potential borrowers that would be eligiblefor social priority loans will not own assets. In addition, the government will notnecessarily wish to have large amounts of land and buildings reverting to themin the case of loan defaults. Thus, there is a need to create an escrow system thatboth opens wide opportunities for small-scale and first-time borrowers, whileconcurrently establishing firm incentives for them to repay their debts.
A system of escrow accounts could be designed to reflect this set of consid-erations. To be eligible for loans, borrowers at all levels would have to makesome cash contribution to an escrow fund. The level could be adjusted accord-ing to how expansive the government would choose to be in offering opportuni-ties for small businesses and asset-poor people. At the same time, some portionof the total loan amount would also be committed to the escrow account ratherthan being immediately available to the borrower. In addition, some portion ofthe borrowers’ repayments would also be deposited in the escrow account ratherthan received by the lender. The full amount of the escrow account would thenbe released to the borrower at the time the loan had been repaid. If the borrowerdefaults on the loan, the escrow funds would revert to the government. Thelender, of course, would receive the government-guaranteed funds.
Let’s illustrate this with a simple example, presented in Table 5.7. Assumea small business firm receives a loan for R10,000, with a simple interest rate onthe loan of 10 percent, to be repaid with interest over 10 years. To be eligible toreceive the loan, the borrower would have to pledge, say, R500 to the escrowaccount. As such, those unable to raise the R500 would not be eligible for a loanof this amount. The lender would then place, say, R1,500 in the escrow account.So the initial amount received by the borrower would be R8,500. The escrowaccount would then be funded initially at R2,000. In addition, when the bor-
Table 5.7 Creation of Escrow Account for Social Priority LendingR10,000 Loan at 10 percent simple interest
Contributions toescrow account
1) Borrower contribution to qualify for loan R5002) Lender contribution at loan approval R1,5003) Funding of escrow account at loan disbursal (= lines 1 + 2) R2,0003) Borrower annual contributions as share of interest payments R100/year4) Accumulated value of account at time of loan maturity R3,000

An Employment-Targeted Economic Program for South Africa112
rower pays R1,000/year in simple interest, R100 is also deposited directly intothe escrow account. Thus, by the end of the 10-year loan period, the escrowaccount is now worth R3,000. The borrower receives this R3,000 if the loan isrepaid, but the funds revert to the government if the loan is in default. Anescrow account figure at roughly this level—i.e. at roughly 30 percent of thevalue of the initial loan—should, in most cases, provide a significant incentivefor borrowers to pay off their loan as contracted. At the same time, only modestdemands on borrowers resources—i.e. R500—would be needed for borrowersto be eligible for this social priority lending program.
Of course, this type of incentive system assumes that the borrowers wouldn’tbe aiming to simply pocket the R8,500 loan disbursement then default on theirobligation. Yet it is safe to assume that some borrowers will be planning todefault after receiving their disbursement. The way to protect the integrity ofthe lending system in this case would be to only offer much shorter-term loandisbursements—say, a 2-year maximum loan period rather than a 10-year timeto maturity. But the 2-year loan would also include provisions to provide fur-ther credit once an initial disbursement has been repaid.
Beyond some variation on this escrow account system, firms that receivesocial priority loans should only face the normal monitoring that occurs be-tween borrowers and lenders.
Large-scale employment impact loans. Firms that produce Employment Im-pact Statements will need to be monitored so that they demonstrate that theyare fulfilling their pledges in terms of employment generation. In the UnitedStates, for example, there has been considerable experience with state and mu-nicipal governments providing incentives for businesses in exchange for thesefirms’ pledges to create large amounts of new employment. But for the mostpart, businesses receiving such subsidies face little monitoring to determinewhether they are fulfilling their employment pledges, much less facing penaltiesfor failure to achieve those pledges (see Pollin and Luce 2000, Chapter 3). Ob-viously, this would not be a desirable approach to employment policy in SouthAfrica.
To the contrary, as a component of the overall employment expansion ini-tiative, firms would have to face some significant penalties for not fulfilling theiremployment targets. Without this feature of the program, there will not beincentives for firms to meet the terms on which they were awarded loans.
We propose three types of penalties:
1. Standard credit evaluations. Borrowers who fail to achieve their em-ployment targets will not be eligible for additional subsidized credit; whileat the same time, borrowers that do meet these terms will be viewed favor-ably for further loans.

113Policy Interventions for Employment-Targeted Program
2. Reductions in loan guarantees for lenders. Lenders to firms that fail tomeet employment targets will have to forfeit a share of their loan guaranteeat stipulated points as the loan moves toward maturity. Consider, for ex-ample, a 10-year loan with a 75 percent government guarantee. The firmand lender will have to provide evidence on employment impacts every threeyears, for example. If the firm fails to fulfill its employment target over thefirst three years, then the loan guarantee falls to 50 percent. If the businessthen succeeds in meeting its target by the sixth year, the guarantee returnsto 75 percent. Note that this stipulation would put a burden of monitoringemployment effects on the lenders as well as the borrowers. It follows thatthe lenders should assume this burden if they are also going to be eligiblefor such substantial guarantees.3. Use of an escrow account. The use of escrow accounts here would besimilar to our proposal for social priority lending. Loans that are subsi-dized will require the establishment of an escrow account into which bor-rowers and lenders would both contribute. For example, on an R1000 loan,the borrower will need to contribute, say, R50 into the account, while thelender will contribute R100. The borrower will therefore receive R900 asthe principal distribution from the loan. In addition, say R25 in annualinterest payments are also deposited in the escrow account as loan pay-ments are made. If the employment target has been reached by the end ofthe loan payment, then the escrow funds are released to the borrower. Ifthe borrower fails to reach the employment target, then the escrow fundsrevert to the government. Since both the borrower and lender would losemoney through the failure to meet the employment target, that would cre-ate an incentive on both sides to meet the targets.
Creating Disincentives to Defraud the SystemThe obvious way to defraud the system of loan guarantees is for borrowers
and lenders to collude in obtaining guaranteed loans from the government, thendeliberately default on these loans to collect the government guarantee. Ascolluders in such an enterprise, the borrower and lender would then share thegovernment guarantee payment.
As a simple example, consider a case in which a bank makes a R10,000social priority loan purportedly to a farmer. But in fact, the loan is actuallymade to a person colluding with the banker to collect funds from the default—both borrower and lender have entered into the loan contract only to have theloan recorded as a default as quickly as possible. Once the default is accepted aslegitimate by the government, the government is then obligated to pay the lenderR7,500, assuming a 75 percent guarantee on the loan. The borrower and lendercan then split these funds. Of course, they would have also earlier worked outan arrangement for sharing the R10,000 in fraudulent “loan funds.”

An Employment-Targeted Economic Program for South Africa114
A loan guarantee system can be designed to minimize the opportunities forsuch fraud. The first type of disincentive would be to set the guarantee and theinitial escrow contributions such that the incentives for fraud are minimized. Inaddition, this set of incentives can be combined with strict penalties for fraud aswell as rewards for people who discover and report on such schemes. We nowillustrate these considerations in Table 5.8, building from our previous numeri-cal examples.
As Table 5.8 shows, the main parameters of this case are as follows:1. Amount of Loan: R10002. Terms of Loan: 10 years at 5 percent annual simple interest3. Government Guarantee: 75 percent of principal on loan4. Escrow Account: Borrower contributes R100; Lender contributes R2005. Amount of Funds for Borrower Expenditure: R800
No Default Case. With this loan, if there is no default, the borrower paysR50 per year in interest plus repaying principal. At the end of 10 years, theborrower also receives the R300 (plus accrued interest) on the escrow account.
Default Case. Borrower is out R100 of own money, plus opportunity toreceive the R200 additional money in the escrow funds. The lender is out R250,receiving R750 in government guarantee.
Incentive to defraud the system. Assume the borrower and lender are in aconspiracy to defraud the government of the R750 of the loan guarantee. Theirarrangement is that each will receive half of the money coming from the gov-ernment guarantee, i.e. each receives R375 from loan guarantee.
The net outcomes are as follows:
Borrower: Nets R275 (= R375 from guarantee - R100 contribution to escrow)Lender: Nets R175 (=R375 from guarantee - R200 to escrow).
This incentive to defraud the system could be large enough to encourage thistype of operation. If so, the way to weaken such incentives would, straightfor-wardly, entail some combination of either 1) reducing the level of the guarantee;or 2) increasing the escrow fund obligations for both the borrower and lender.
If we assume that the guarantee is only 50 percent of the loan, but the es-crow commitment remains the same, the incentives reduce to the following:
Borrower: Nets R150 (= R250 from guarantee - R100 contribution to escrow)Lender: Nets R50 (= R250 from guarantee - R200 contribution to escrow)
We go through these two examples in Table 5.8.From these examples, we can see that reducing the size of the guarantees

115Policy Interventions for Employment-Targeted Program
and increasing the amount of the escrow commitments reduce incentives forfraud. But by pursuing such measures, one also obviously weakens the benefitsto be accrued from the loan guarantee program, and thereby the prospect thatthe program could be used as a major financing tool contributing to employ-ment expansion.
Incentive-based monitoring. The way to sustain a more expansionary loanguarantee program—including higher guarantee ratios and lower escrow con-tribution ratios—is to also create severe penalties for fraud along with strongincentives for “whistleblowers” to report abuses of the system. This meansmobilizing incentives to monitor the system rather than relying primarily ongovernment investigators to prevent fraud. This approach to monitoring fi-nancial market regulations was developed by Dean Baker (2003) with respectto the so-called Tobin Tax—a tax on speculative transactions in global cur-rency markets. A variation on Baker’s idea could be applicable here. For ex-ample:
In the case of a R1000 loan with a 75 percent guarantee:
1. Penalty to lender for gaming the system: “treble damages”—i.e. R22502. Reward for whistleblowing: Full amount of guarantee—i.e. R750
Through combining the escrow system with the incentive-based monitoringapproach, it should be possible to establish a workable set of incentives to oper-ate a loan guarantee program for both small-scale social priority projects andlarge-scale employment impact loans.
Table 5.8 Numerical Example on Collateral and Escrow Fund
Loan terms: R1000, 10 years at 5 percentGovernment guarantee: Varies, 75 percent versus 50 percentEscrow contributions: Constant at 10 percent borrower; 20 percent lender
Case 1 Case 2
Guarantee R750 $500EscrowTotal escrow R300 $300Borrower contribution R100 $100Lender contribution R200 $200If default, govt. pays R750 $500Net gains from fraud Borrower gain R275 (=R375 - R100) R150 (=250-100) Lender gain R175 (=375 – 200) R50 (=250-200)

An Employment-Targeted Economic Program for South Africa116
Asset reserve requirementsSouth Africa has had considerable experience with its previously operating sys-tem of prescribed assets for pension funds. The system that we propose incor-porates features similar to those of the earlier program. However, it departsfrom the earlier approach in several significant ways:
1. The proposed system is more extensive, in that it would apply to all privatebanks, not only to pension fund holdings.
2. The costs of participating in the system are balanced by benefits. Bankswould fulfill their asset reserve requirement through their loans to the pri-ority projects, i.e. through providing the subsidized loans that will be guar-anteed by the government.
3. The system can be designed to be far more flexible for any single financialinstitution than was the case with the prescribed asset framework. As wedescribe below, no single institution will itself be required to hold any setproportion of assets in its loan portfolio.
The system we are outlining draws from experiences in the United States,Western Europe, and many developing economies (see Pollin 1993, 1995). Table5.9 illustrates the basic principle of how the policy works. It would require finan-cial institutions to hold a designated proportion of their assets in loans to priorityareas or else hold the same proportion of their total assets in a sterile cash reserveaccount. The cost that the financial institutions would face, of course, would bethe loss of interest income from holding the sterile cash asset rather than loans tofirms in the targeted industries. The example in the table stipulates that institu-tions hold 20 percent of their loans in the priority areas. If they hold less than 20percent, they need to cover this gap by holding cash. By holding less than 20percent in priority loan areas, of course, the bank would also be losing out on itsopportunity to include government-guaranteed loans in its portfolio.
Beyond this most simple example, there are some ways to significantly in-crease the flexibility of this system while maintaining its overall purpose. Firstof all, it would not be necessary for every financial institution to carry a loanportfolio that included all targeted industries. Banks could distribute their lend-ing to targeted industries according to their own priorities. Second, not everyfinancial institution would need to make direct loans of any kind to businesses intargeted industries. What could rather evolve is a system of market niches andspecializations—for example, Khula Enterprise Finance would be focused onmaking loans to small-scale businesses, while the Rand Merchant Bank, in turn,would make loans to Khula. More generally, as we mentioned above, the publicdevelopment banks could encourage the formation of small-scale banking op-erations that could serve the market for social priority lending. As this small-scale banking sector expands through serving the social priority sectors, the

117Policy Interventions for Employment-Targeted Program
larger private banks could enter into partnerships with these banks as a way ofmeeting their reserve requirements.
The asset requirement system could become more flexible still if the re-quirements were implemented as proposed by former U.S. Federal Reserve Gov-ernor Sherman Maisel (1973), as a system of market auctions rather than quotas.Through an auction system, institutions would not be required to carry thespecified proportion (say, 20 percent, following the example in Table 5.9) inloans to priority areas. Financial institutions that exceed the limit would obtaina permit that they could then sell to institutions whose loans to targeted indus-tries are below the minimum. Individual institutions could therefore choose tomaintain particular market niches. At the same time, the system would ensurethat some market niches carried an extra burden of either higher reserves orpurchases of “preferred asset permits.”
Overall then, a system of asset reserve requirements would serve as an effec-tive complement to the loan guarantee program. The key feature of both pro-grams combined is that they will enable the financial system to be mobilized inbehalf of an employment-targeted economic program while still allowing consid-erable decision making freedom both for financial institutions and non-financialbusinesses. The financial institutions, for example, would still be responsible forestablishing the creditworthiness of businesses and the viability of their projects.The businesses would still be responsible for the design and implementation oftheir investments. Indeed, businesses would still be free to pursue nonpreferred
Table 5.9 Applying a Simple Asset Reserve Requirement Formulato South African Financial InstitutionsAsset reserve requirement: 20% of loans allocated to targeted industries
BANK 1: MEETS RESERVE REQUIREMENT
Assets Liabilities
LoansFor stock and bond purchases— 800 Time deposits— R1000For targeted industries — R200
Reserves 0
BANK 2: DOES NOT MEET RESERVE REQUIREMENT
Assets Liabilities
LoansFor stock and bond purchases— R800 Time deposits— R1000For targeted industries— 0
Reserves R200

An Employment-Targeted Economic Program for South Africa118
projects and banks could still finance them. It would simply be the case thatfinancing costs for non-preferred projects would be higher, and this difference incosts would need to be high enough so that the aims of the employment-targetedprogram would become a priority throughout the financial system.
CONTROLS ON EXCHANGE RATESAND CAPITAL FLOWS
Exchange rate variability can create significant problems for monetary policy.Excessive depreciations can raise inflation rates, while excessive appreciationscan generate loss of output, profits, and employment in some industries. Vari-ability itself can be harmful by generating more uncertainty and thereby possi-bly discouraging private investors.
All of these issues will become central if South Africa commits itself to amore expansionary set of fiscal, monetary, and credit allocation policies—i.e. toa set of measures that we believe will be the foundation of an employment-targeted program. Policymakers have to take seriously the possibility that fi-nancial market investors might have a negative reaction to such a program, andthis could lead to a sell-off of the rand. Such a reaction by the financial marketscould happen entirely as a result of a shift in investor perceptions, regardless ofwhether the fundamental indicators of economic stability—such as fiscal defi-cits and the inflation rate—may have only changed by the relatively modestamounts we are proposing. If there were to be a significant shift in investorattitudes causing significant downward pressure on the rand, this in turn couldlead to undesired movements in interest rates, thereby making it difficult forpolicymakers to lower interest rates as a means of promoting faster growth ofGDP and jobs. Of course, this scenario would not necessarily occur, but it isnevertheless important to acknowledge that the possibility exists and to exam-ine options for responding effectively.
The problem we are describing here is an instance of the famous policy“trilemma” governments face in conducting macroeconomic policy within theframework of highly integrated global capital markets. With highly integratedcapital markets, it becomes impossible for a country such as South Africa to pur-sue these three goals at once: 1) to conduct an autonomous monetary policy, inbehalf of an inflation target, employment target or any other target; 2) to maintainfixed exchange rates; and 3) to allow free capital flows into and out of the country.Thus, if South Africa is committed to an autonomous monetary policy and toliberalized capital markets, then, according to this view, it must be willing to allowunrestrained fluctuations in the value of the rand. However, letting the rand fluc-tuate at will can, in turn, undermine the country’s capacity to advance an effectiveprogram of accelerated GDP growth and employment expansion.

119Policy Interventions for Employment-Targeted Program
Capital controls, exchange controls, and more generally, capital managementtechniques—encompassing a variety of policy interventions to manage a country’scapital inflows and outflows—have been proposed as mechanisms for reducingthe sensitivity of domestic financial markets, including exchange rates, to macro-economic policy. For South Africa, such measures could potentially serve to atleast partially insulate the economy against any excessive negative overreactionsby financial markets to an employment-targeted economic program such as weare proposing. The key question for South Africa then is: to what extent andunder what conditions can capital management policies enhance the autonomy ofmacroeconomic policy, including helping to manage exchange rates? Unfortu-nately, as we will see, there aren’t simple answers to this question. At the sametime, the evidence we have surveyed leads us to conclude that, at the least, suchmeasures would support efforts by the Reserve Bank to lower nominal interestrates within the range of about 4 percentage points that we are proposing. Inaddition, severe bouts of exchange rate volatility will be less likely when capitalmanagement policies are deployed to prevent such episodes. The fact that SouthAfrica has a long history of utilizing capital management techniques, includingexchange and capital controls, enhances the prospect that such measures could beused effectively at present to at least provide support for a more expansionary setof fiscal, monetary, and credit allocation policies.
Background on Exchange Controls in South Africa
South Africa has used exchange controls and other capital management tech-niques since at least 1939. The application of these techniques has ebbed andflowed over the years. The current governing legislation was set out in 1961.
A.M. Bruce-Brand of the Reserve Bank has written a useful history andoverview of how South Africa has used exchange controls (2002). According toBruce-Brand’s official account, the purposes of exchange controls have beenthe following:
1. To ensure the repatriation within the South African banking system of allcurrency acquired by residents of South Africa;
2. To prevent the loss of foreign currency resources through the transfer abroadof real or financial capital assets held in South Africa; and
3. To effectively control the movement into and out of South Africa of finan-cial and real assets while at the same time not interfering with the efficientoperation of the country’s commercial, industrial, and financial systems.
In sum, according to Bruce-Brand, the main goals of the exchange controlshave been the preservation of savings and the management of inflows and out-flows.

An Employment-Targeted Economic Program for South Africa120
Prior to 1979, the rand was pegged to either the U.S. dollar or the poundsterling. Exchange controls restricted residents’ capital flows. Moreover, pro-ceeds from the sale of assets by nonresidents were placed in blocked rand ac-counts, which made the repatriation of capital difficult (Aron, et al. 2004). Thedual currency exchange rate established in 1979 introduced greater flexibility inthe use of controls. A commercial exchange rate was announced on a daily basisin line with market forces. A financial exchange rate applied to most non-resi-dent transactions, with all other transactions channeled through the commer-cial rand market. As described by Aron et al., the intended impact of the dualsystem was to break the direct link between domestic and foreign interest rates,as well as to insulate the capital account from certain categories of capital flows.In 1983 the commercial rate was set free to be determined in the market, subjectto direct intervention by the Reserve Bank, and the dual rates were unified. Atthat time, controls on non-resident capital movements were removed. Those onresidents remained but were treated more leniently.
The unified currency remained stable for a few months, but began a sharpdescent in 1983, in correspondence with the gold price decline at that time. In1985, following a prolonged period of political crisis, and more immediately,after then-President Botha’s Rubicon speech and the declaration of the state ofemergency, U.S. banks recalled their loans, precipitating a debt crisis. This wasfollowed by a debt standstill, and subsequently a series of debt reschedulingagreements. The unified rand fell even further, and eventually the financial randwas reintroduced and capital controls on residents were tightened in 1985. Thedual-currency system remained in existence until its unification a decade later,in March 1995, under a managed float. (Aron et al. 2004).
With the reintegration of South Africa into the world following the end ofthe apartheid regime in 1994, the government decided to progressively liberal-ize the capital and exchange controls. According to Bruce-Brand’s study for theReserve Bank, the government followed this sequence:
1. Abolish exchange controls on all current account transactions;2. Abolish exchange controls on non-residents;3. Gradually become more lenient in approving applications for outward FDI;4. Allow institutional investors to acquire more foreign assets to diversify their
portfolios;5. Progressively relax all other controls on resident individuals;6. Release emigrants’ blocked funds.
According to official statements, the government authorities “graduallybecame much more lenient in the exercise of discretion in the administration ofexchange controls.” In short, since 1994, the government has progressively re-laxed both the rules and the level of enforcement of these rules.
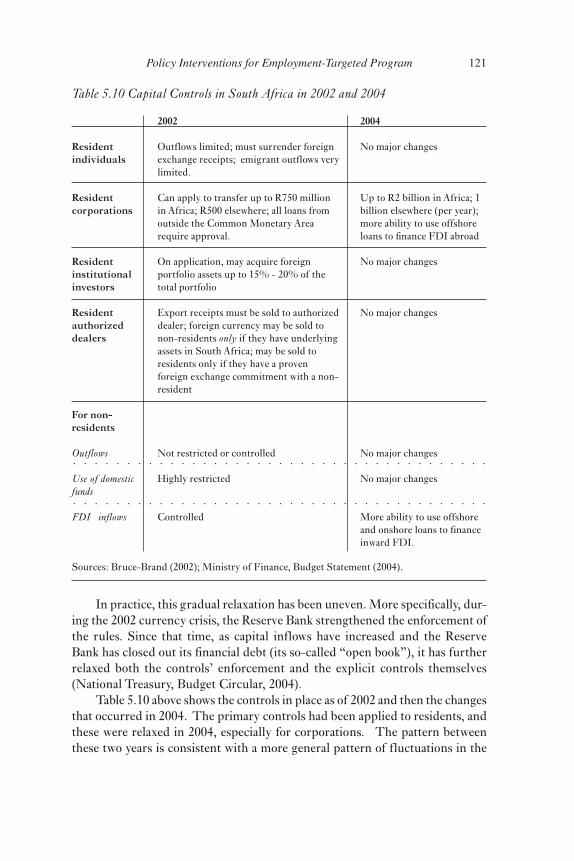
121Policy Interventions for Employment-Targeted Program
In practice, this gradual relaxation has been uneven. More specifically, dur-ing the 2002 currency crisis, the Reserve Bank strengthened the enforcement ofthe rules. Since that time, as capital inflows have increased and the ReserveBank has closed out its financial debt (its so-called “open book”), it has furtherrelaxed both the controls’ enforcement and the explicit controls themselves(National Treasury, Budget Circular, 2004).
Table 5.10 above shows the controls in place as of 2002 and then the changesthat occurred in 2004. The primary controls had been applied to residents, andthese were relaxed in 2004, especially for corporations. The pattern betweenthese two years is consistent with a more general pattern of fluctuations in the
Table 5.10 Capital Controls in South Africa in 2002 and 2004
Residentindividuals
Residentcorporations
Residentinstitutionalinvestors
Residentauthorizeddealers
For non-residents
Outflows
Use of domesticfunds
FDI inflows
2002
Outflows limited; must surrender foreignexchange receipts; emigrant outflows verylimited.
Can apply to transfer up to R750 millionin Africa; R500 elsewhere; all loans fromoutside the Common Monetary Arearequire approval.
On application, may acquire foreignportfolio assets up to 15% - 20% of thetotal portfolio
Export receipts must be sold to authorizeddealer; foreign currency may be sold tonon-residents only if they have underlyingassets in South Africa; may be sold toresidents only if they have a provenforeign exchange commitment with a non-resident
Not restricted or controlled
Highly restricted
Controlled
2004
No major changes
Up to R2 billion in Africa; 1billion elsewhere (per year);more ability to use offshoreloans to finance FDI abroad
No major changes
No major changes
No major changes
No major changes
More ability to use offshoreand onshore loans to financeinward FDI.
Sources: Bruce-Brand (2002); Ministry of Finance, Budget Statement (2004).
○ ○ ○ ○ ○ ○ ○ ○ ○ ○ ○ ○ ○ ○ ○ ○ ○ ○ ○ ○ ○ ○ ○ ○ ○ ○ ○ ○ ○ ○ ○ ○ ○ ○ ○ ○ ○ ○ ○
○ ○ ○ ○ ○ ○ ○ ○ ○ ○ ○ ○ ○ ○ ○ ○ ○ ○ ○ ○ ○ ○ ○ ○ ○ ○ ○ ○ ○ ○ ○ ○ ○ ○ ○ ○ ○ ○ ○

An Employment-Targeted Economic Program for South Africa122
degree to which controls have been applied. This longer-term pattern is por-trayed in Figure 5.6, which presents an index on the degree of openness of theSouth African financial markets between 1966 – 95. As the figure shows, thedegree of financial openness began increasing before the transition to democ-racy in 1994. Though the index number doesn’t continue past 1995, the generalpattern would be toward continued openness, with a temporary tightening ofcontrols in 2002.
Impacts of Capital Management Techniques
Brief general review of studiesThere is a large literature that attempts to assess the effectiveness of capitalcontrols (see Dooley 1995; Epstein and Schor 1992; and Epstein, Grabel andJomo, K.S. 2005 as three surveys in a large literature). Effectiveness is examinedin such studies along two primary dimensions: 1) Their ability to maintain a“wedge” between domestic interest rates and foreign rates; and 2) Their abilityto help prevent currency crises, i.e., either large-scale changes in exchange ratesor the forcing of countries off of a peg through reserve loss. More recent re-search has also looked at the ability of controls (especially on capital inflows) toprevent over-valued currencies and currency instability and the ability of con-trols to provide autonomy for central bank expansion.
No clear-cut consensus exists on these issues. However, Michael Dooley’ssurvey for the National Bureau of Economic Research suggests at least one largearea of agreement with respect to the effectiveness of controls on insulatinginterest rates and exchange rates from international pressures. Dooley con-cludes that
Capital controls do seem to be effective in insulating domestic interest rates andexchange rates from international factors, but usually only to a moderate degree,especially if the time period is a long one; and only if the overall set of macroeco-nomic policies are internally consistent. (1995, p. 29).
Beyond this, more recent studies provide stronger evidence that capital con-trols can help prevent serious bouts of financial instability or crisis (Epstein,Grabel, and Jomo 2005). During the 1997–98 Asian financial crisis, for example,countries that used controls on outflows and/or inflows were more likely to beable to avoid the contagion effects flowing out of the crisis. In addition, theevidence suggests that Chile was able to avoid an overvalued exchange rate andtilt toward a longer-maturity structure of borrowing. In the case of Malaysia,Kaplan and Rodrik (2001) have found that controls on outflows temporarilyallowed policymakers to pursue a more expansionary macroeconomic policy.
Overall then, a careful reading of the evidence would suggest that, whenimplemented with reasonable care, controls can be effective in reducing finan-

123Policy Interventions for Employment-Targeted Program
0.0
0.4
0.8
1.2
1.6
2.0
2.4
1970 1975 1980 1985 1990 1995
cial instability, and can also make at least a modest contribution toward enhanc-ing the autonomy of policymakers vis-à-vis global financial forces.
Effectiveness of controls in South AfricaThere have been surprisingly few studies of the effectiveness of capital controlsin South Africa. The most rigorous and important is a 2001 paper by G.N. Farrellof the Reserve Bank (2001). Farrell studied the effectiveness of the period ofdual exchange rates and tighter controls on residents of South Africa. The goalof the dual exchange rate system was to insulate the market for current accounttransactions from the more volatile financial market transactions, i.e. accordingto Farrell, “to separate the foreign exchange transactions of non-resident port-folio investors on the capital account from all other foreign exchange transac-tions,” (Farrell, 2001 p. 1). Farrell studied the period February 1983 to August1995 in which a dual exchange rate system was operating. He then comparedthis period with an earlier period and later period—February 1983 – August1985; and March 1995 – October 1998, during which a unified exchange ratesystem was in place. Using formal statistical techniques, Farrell found that thevolatility of the rand was lower during the dual exchange rate period than dur-ing the two periods of unified exchange rates.
Farrell’s findings suggest that policymakers may want to consider reinstat-ing something like the dual exchange rate system that prevailed from 1983 – 95.
Figure 5.6 Financial Integration Index for South Africa, 1966-1995Index range is 0-4, with 0 representing completely controlled markets and 4representing completely open markets
Source: Milesi-Ferretti (1998).

An Employment-Targeted Economic Program for South Africa124
At the same time, something like this dual exchange rate system would not byitself address all the potential financial market forces that could contribute tofinancial instability within the context of a more expansionary macroeconomicpolicy. More specifically, a dual exchange rate system could almost certainlyreduce the impact of lower interest rates on inflation by reducing the link be-tween lower interest rates and the fluctuations of the commercial rand exchangerate (the one used for current account transactions). However, unstable inflowsand outflows of capital might still affect interest rates in financial markets to theextent that they are tied to the financial rand as opposed to the commercial randexchange rate. This suggests that some other configuration of controls—onethat can influence both commercial and financial flows of capital—might bemore effective as a policy tool.
Beyond the Farrell comparative study on the dual exchange rate system,research is limited on the effectiveness of controls in South Africa. It may nev-ertheless be helpful to review some basic data comparing the changes in con-trols with fluctuations in both the levels of interest rates in South Africa and thedifferentials in interest rates between South Africa and the United States. Fig-ure 5.7 presents a basic descriptive picture here. It shows the movements be-tween 1973 – 95 in the financial integration index that we initially presented inFigure 5.6, along with patterns over this time period for both the real prime ratein South Africa and the interest rate differential between South Africa and theUnited States.
We can see in the figure, to begin with, that our real interest rate data seriesand the interest rate differential series move fairly closely together. Beyond this,the graph offers some suggestive evidence on the effectiveness of capital con-trols, as measured by the financial integration index. Thus, we see that the mainperiods of decline in both the real prime rate and the interest rate differentialare periods when capital controls were relatively tight—1978 – 81 and 1985 –90. We also observe the inverse: the periods of most rapid increase in both theinterest rate and the rate differential were periods when controls were beingloosened. This pattern is broadly consistent with the evidence reviewed abovethat capital controls can allow some reduction in interest differentials, at leastover a limited time period.
The information in Figure 5.7 also suggests that the degree of these con-trols varies over time in South Africa. So, by itself, these data cannot provideinformation on the ability of controls to maintain a “wedge” between domesticand world interest rates for an indefinite period. Indeed, if anything, the infor-mation in Figure 5.7 suggests that the effectiveness of the controls for maintain-ing lower interest rates and differentials might be on the order of one or twoyears. As the figure shows, when the financial liberalization index falls to 0 (con-trols are tightened), the interest rate and differential first fall, and begin to riseagain after a few years or so.

125Policy Interventions for Employment-Targeted Program
In Figure 5.8, we again utilize the financial integration index to examinethe relationship between capital controls and exchange rates. It plots the inte-gration index against the movements of the change in the nominal exchangerate. These relative movements suggest that there may be some impact of capi-tal controls on exchange rate changes. When capital controls are tightened, ex-change rate fluctuations diminish. When they are relaxed, exchange rate changesincrease. This is consistent with Farrell’s finding that the dual exchange ratesystem did reduce exchange rate variability.
Overall perspective on exchange and capital controlsSouth Africa has had a long history with exchange and capital controls. Thegovernment has an experienced enforcement apparatus in place, and the privatefinancial institutions are accustomed to dealing with such regulations. In addi-tion, global financial markets are accustomed to South Africa periodically ad-justing the extent of its controls, depending on the broader goals of economicpolicy at any given time. Beyond this, the general professional opinion amongacademic economists and policymakers has become increasingly favorable to-ward controls, especially since the Asian financial debacle. In short, from arange of perspectives, there is a strong case for South Africa to move towardusing its system of controls more actively as one component of a broad employ-ment-targeted economic program. In this context, it should be clear that oper-ating with a relatively modest set of controls would not mean that South Africa
0
1
20
10
20
1974 1976 1978 1980 1982 1984 1986 1988 1990 1992 1994
Inte
grat
ion
inde
x, 0
- 4
ran
ge
Real interest rates
and nominal rate differentials
Figure 5.7 Capital Controls, Interest Rates and Interest Rate Differentials, 1973-95
Source: Milesi-Ferretti (1998), Reserve Bank of South Africa, IMF International Financial Statistics.
Nominal prime rate in South Africa-U.S.Treasury bill rate
Real prime rate
Financial integration index

An Employment-Targeted Economic Program for South Africa126
is moving toward a closed economy. It would rather mean that South Africa iscommitted to using all practical tools at hand to advance an ambitious programof employment creation, even while recognizing the constraints under whichsuch a program would need to operate in order to succeed.
Despite the evidence we have reviewed as well as the shift in professionalopinion in favor of controls, South Africa has been facing growing pressurefrom domestic and global financial institutions to eliminate its controls. Forexample, Goldman Sachs recently published a Global Economics Paper entitled“South Africa: Capital Controls Constraining Growth,” in which they errone-ously claim that there is a negative relationship between capital controls andeconomic growth. However, the IMF itself has not been among those opposingcontrols for South Africa, at least in terms of short-run measures. Thus, in its2003 Staff Report on South Africa, the Fund economists expressed oppositionto relaxing controls until the country’s ratio of foreign reserves to short-termdebt improves. The IMF position was that (1) exchange rate volatility is costlyfor South Africa; (2) a higher ratio of foreign reserves to short-term debt dampensvolatility; (3) exchange controls can also reduce volatility (this is implied); andtherefore (4), exchange controls can be an effective substitute in the short-runfor a less-than-optimal foreign exchange position.
Similarly, IMF economists present indirect supporting arguments for capitalmanagement in a recent analysis on the determinants of interest costs in SouthAfrica (Arora 2004; see also Ahmed 2004). This IMF research studies the de-
0
1
2
3
-8
-4
0
4
8
12
74 76 78 80 82 84 86 88 90 92 94
Exchange rate percentage changes
Fin
anci
al in
tegr
atio
n in
dex
Figure 5.8 Capital Controls and Exchange Rate Changes in South Africa, 1973-95
Source: Milesi-Ferretti (1998), Reserve Bank of South Africa, IMF International Financial Statistics.
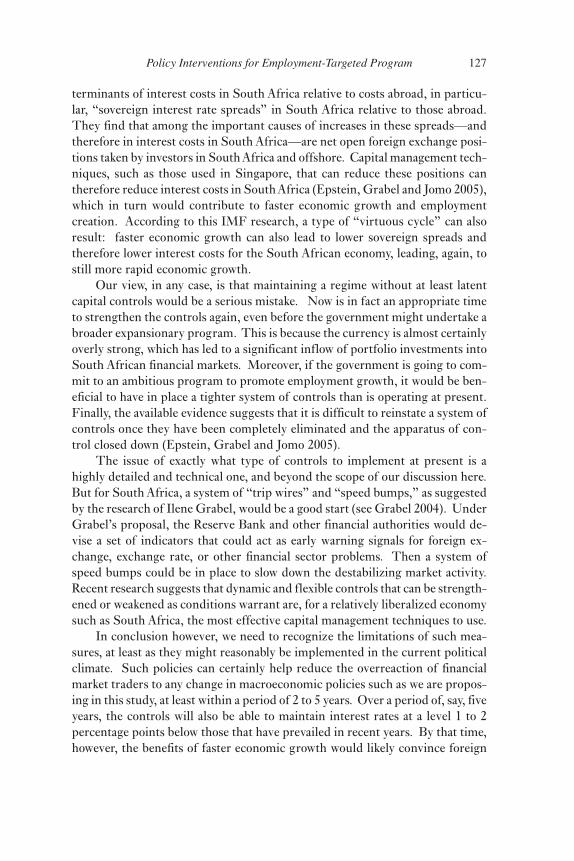
127Policy Interventions for Employment-Targeted Program
terminants of interest costs in South Africa relative to costs abroad, in particu-lar, “sovereign interest rate spreads” in South Africa relative to those abroad.They find that among the important causes of increases in these spreads—andtherefore in interest costs in South Africa—are net open foreign exchange posi-tions taken by investors in South Africa and offshore. Capital management tech-niques, such as those used in Singapore, that can reduce these positions cantherefore reduce interest costs in South Africa (Epstein, Grabel and Jomo 2005),which in turn would contribute to faster economic growth and employmentcreation. According to this IMF research, a type of “virtuous cycle” can alsoresult: faster economic growth can also lead to lower sovereign spreads andtherefore lower interest costs for the South African economy, leading, again, tostill more rapid economic growth.
Our view, in any case, is that maintaining a regime without at least latentcapital controls would be a serious mistake. Now is in fact an appropriate timeto strengthen the controls again, even before the government might undertake abroader expansionary program. This is because the currency is almost certainlyoverly strong, which has led to a significant inflow of portfolio investments intoSouth African financial markets. Moreover, if the government is going to com-mit to an ambitious program to promote employment growth, it would be ben-eficial to have in place a tighter system of controls than is operating at present.Finally, the available evidence suggests that it is difficult to reinstate a system ofcontrols once they have been completely eliminated and the apparatus of con-trol closed down (Epstein, Grabel and Jomo 2005).
The issue of exactly what type of controls to implement at present is ahighly detailed and technical one, and beyond the scope of our discussion here.But for South Africa, a system of “trip wires” and “speed bumps,” as suggestedby the research of Ilene Grabel, would be a good start (see Grabel 2004). UnderGrabel’s proposal, the Reserve Bank and other financial authorities would de-vise a set of indicators that could act as early warning signals for foreign ex-change, exchange rate, or other financial sector problems. Then a system ofspeed bumps could be in place to slow down the destabilizing market activity.Recent research suggests that dynamic and flexible controls that can be strength-ened or weakened as conditions warrant are, for a relatively liberalized economysuch as South Africa, the most effective capital management techniques to use.
In conclusion however, we need to recognize the limitations of such mea-sures, at least as they might reasonably be implemented in the current politicalclimate. Such policies can certainly help reduce the overreaction of financialmarket traders to any change in macroeconomic policies such as we are propos-ing in this study, at least within a period of 2 to 5 years. Over a period of, say, fiveyears, the controls will also be able to maintain interest rates at a level 1 to 2percentage points below those that have prevailed in recent years. By that time,however, the benefits of faster economic growth would likely convince foreign

An Employment-Targeted Economic Program for South Africa128
investors that South Africa is a desirable place to invest. The country’s so-called “risk premium” would then likely decline, facilitating a decline in SouthAfrican interest rates relative to foreign rates.
INFLATION CONTROL AND ECONOMIC GROWTH
The government of South Africa has made clear that it is committed to attack-ing the country’s severe problems of poverty and unemployment. At the sametime, since the adoption of the GEAR program of macroeconomic policy mea-sures, and even more explicitly, since the establishment of the inflation-target-ing regime, the government has been committed to maintaining a low-inflationenvironment. The government clearly holds to the idea that maintaining a low-inflation environment is a necessary foundation for attacking poverty and un-employment in a sustainable way.
We certainly do not advocate a high inflation rate, or a relaxation of theinflation-targeting regime as an end in itself. However, the primary tool thegovernment utilizes to control inflation is to maintain high interest rates. Aspart of our own set of proposals for attacking poverty and unemployment, wehave advanced measures to lower interest rates—both across the board, and alsoby providing a large-scale subsidized credit program. If the government seeks alower interest-rate environment as an intermediate tool for stimulating employ-ment growth, it is likely that inflationary pressures will rise beyond where theyhave been recently under the inflation-targeting regime.
The question we must therefore examine is this: how high would the costsbe to the South African economy of allowing the inflation rate to rise above itscurrent target range of between 3 - 6 percent? This is obviously a major matterof concern. We will first review some relevant literature on the relationshipbetween inflation and growth. We then report results from our own economet-ric examination of the relationship between inflation and growth. We finallydiscuss alternatives to high interest rates as an approach to inflation control,focusing primarily on incomes policies.
What is the Relationship between Inflation and Growth?
Answers to this question vary widely in the professional literature. Some of themost influential recent studies were those produced by the late Michael Bruno,along with his colleague William Easterly. Bruno was Chief Economist at theWorld Bank at the time he conducted his studies.
In his 1995 research, Bruno studied the relationship between inflation andeconomic growth for 127 countries between 1960 and 1992. Bruno found thatthe average growth rates fell only slightly as inflation rates moved up to 20 – 25

129Policy Interventions for Employment-Targeted Program
percent. Of particular importance for our concerns here with South Africa,Bruno found that during 1960 – 72, economic growth on average increased asinflation rose, from negative or low rates to the 15 – 20 percent range. This isbecause, as Bruno explained, “in the 1950s and 1960s, low-to-moderate infla-tion went hand in hand with very rapid growth because of investment demandpressures in an expanding economy,” (1995, p. 35). Thus, inflation that resultsdirectly from economic expansion does not, according to Bruno’s findings, cre-ate any significant barriers to expansion.
Bruno’s 1995 findings were challenged by other researchers, who did in-deed find that inflation leads to lower economic growth. However, in respond-ing to these critics, Bruno and Easterly (1998) found that the clear negativerelationship between inflation and growth operates only at very high inflationrates—what they define as in the range of 40 percent and above. Once theseexperiences of very high inflation are considered separately from those of mod-erate inflation, Bruno and Easterly again find that, for the moderate inflationcases, no clear relationship exists between inflation and economic growth.
Still again, other researchers have produced findings contradictory to Brunoand Easterly, even after separating out the experiences of high (i.e. 40 percent ormore) inflation from moderate inflation. For example, IMF economists Ghoshand Phillips (1998), drawing from a data sample of IMF member countries over1960 - 96, found evidence of a negative inflation/growth threshold at 2.5 per-cent. But they also acknowledge that thresholds of 5 to 10 percent generatestatistical results very similar to their 2.5 percent threshold.
Their particular conclusions aside, the work of Ghosh and Phillips is withina widely accepted current stream of research that distinguishes the relationshipto growth of different levels of inflation—observing how the effects of inflationon growth will vary at, say, 5, 10, 20 and 30 percent inflation rates. These re-searchers rely on nonlinear econometric estimating techniques to distinguishthe growth/inflation effects at these alternative threshold levels. What is alsoespecially relevant for the South Africa case, this most recent stream of researchersnow also consistently finds that the growth/inflation relationship is differentfor industrialized countries and developing countries.
For example, a 2001 study by another team of IMF economists, MoshinKhan and Abdelhak Senhadji, identified the threshold point for industrial coun-tries at which inflation reduces economic growth at a very low 1 – 3 percent.But their threshold point for developing countries was between 11 – 12 percent.This distinction in threshold points was also found in a 2004 study by Burdekin,Denzau, Keil, Sitthiyot, and Willett. They also utilized non-linear estimatingtechniques. However, they reached conclusions nearly opposite to Khan andSenhadji: that the negative inflation/growth threshold was higher for indus-trial countries, at 8 percent, than the threshold for developing countries, whichwas 3 percent.

An Employment-Targeted Economic Program for South Africa130
Robert Pollin and Andong Zhu (2006) have recently developed another modelthat estimates the effects of inflation on economic growth. This model includesinflation as one potential factor influencing economic growth, after controllingfor a range of other potential influences.12 The growth/inflation estimates arebased on data from 80 countries between 1961 – 2000. As with the more recentliterature generally, the Pollin-Zhu model includes a non-linear component tocapture the differential effects of relatively low versus relatively high levels ofinflation. In addition, the models follow Bruno and Easterly in excluding infla-tion episodes in excess of 40 percent. Finally, this model examines the inflation/growth relationship for the full set of countries in different ways. It providesseparate sets of results for OECD countries, middle-income countries, and lowincome countries. It also considers the full sample of countries within four sepa-rate decades between 1961 – 2000. This study then utilizes four different estimat-ing techniques with each of the various country- and time-period groupings totest for the robustness of findings using any given technique.
The main results of these exercises can be summarized quickly. Consider-ing our full data set, they consistently find that higher inflation is associatedwith moderate gains in GDP growth up to a roughly 15 – 18 percent inflationthreshold. But their results do diverge when they divide their full data set ac-cording to income levels. With the OECD countries, no clear pattern emergesin terms of identifying a negative inflation/growth threshold. With the middle-income countries, including South Africa, they then return to a consistentlypositive relationship between inflation and growth up to a 14 – 16 percent thresh-old, though the results are not statistically significant. The positive inflation/growth relationship holds more strongly and consistently with the low-incomecountries. With the groupings by decades, the results indicate that inflation andgrowth will be more positively correlated to the degree that macroeconomicpolicy is focused on stimulating demand. This finding is consistent with Bruno’sobservation that growth and inflation were more positively correlated over 1960-72, when active demand management policies were being widely practiced insupport of maintaining high employment.
In short, the results from Pollin and Zhu’s model are broadly consistentwith Bruno’s earlier studies, despite substantial differences between their meth-odological approaches. That is, the Pollin-Zhu model generates no statisticallyrobust evidence suggesting that moderate inflation, in the range of less than 20percent, will have a negative influence on economic growth. There was rathersome evidence to support the view that such moderate inflation is positivelycorrelated with growth.
Considering the findings from all the studies in addition to our own, noth-ing close to a consensus has been reached on this question, even while increas-ingly sophisticated estimating techniques have been deployed to control forvarious non-linearities in the inflation/economic growth relationship. At the

131Policy Interventions for Employment-Targeted Program
same time, a few basic conclusions from these various studies that are relevantfor the South African case do seem warranted.13 A first basic conclusion is thatregardless of whether researchers observe a negative growth/inflation relation-ship emerging in the low or high double-digit inflation range for developingcountries, only one study found a clear negative relationship between growthand single-digit inflation specifically for the developing countries. This suggeststhat for South Africa, setting an inflation target at between 3 and 6 percent isnot likely to offer benefits in terms of the economy’s growth performance. IfSouth Africa chooses to follow the low-end finding within the professional lit-erature on the inflation/growth trade-off, that would still suggest an inflationtarget in the range of 8 - 9 percent.
A second basic conclusion is that, despite the wide range of techniques nowbeing used to estimate the growth/inflation trade-off, no researcher has chal-lenged one important point emphasized by Bruno in his initial 1995 work—namely, that the relationship between inflation and growth will be differentdepending on what is causing the economy’s inflationary pressures. As Brunofound, demand-pull inflation, resulting from a process of economic expansion,will be positively associated with growth as long as the inflation rate remainsmoderate. Thus, if South Africa pursues an aggressive jobs program, one wouldexpect that the inflationary pressures that may then emerge would not be harm-ful to growth, as long as, again, the inflation remains moderate.
By contrast, following the logic of Bruno’s findings, inflation that results fromexcessive price mark-ups over costs by businesses, supply shocks, or exchange ratevolatility will be associated with negative growth effects. But these negative growtheffects will not be due to the inflation per se, bur rather stem from the monopolis-tic pricing power of businesses or from the economy’s attempt at adjusting to theeffects of supply shocks or to volatile movements of the rand.
Does Inflation Targeting Change the Growth/Inflation Relationship?
Proponents of inflation targeting within international academic and policymakingcircles have argued that operating monetary policy under this type of arrange-ment changes the basic dynamic between growth and inflation. Specifically, theclaim is that inflation targeting will both reduce the rate of inflation and enhancethe credibility of policy. By enhancing credibility, inflation targeting will thenreduce the so-called “sacrifice ratio”—that is, it will support a move to lower in-flation with fewer costs in terms of lost output or increased unemployment.
In recent years, a number of studies have assessed the validity of these claims,including studies by the IMF and the U.S. Federal Reserve. Nearly all of thesestudies find that there is nothing to be gained in terms of a reduced sacrificeratio through pursuing inflation targeting policies. We mention briefly heresome of the main research findings in this area.14

An Employment-Targeted Economic Program for South Africa132
Lawrence Ball and Niamh Sheridan wrote a 2003 IMF Working Paper onthis issue titled, “Does Inflation Targeting Matter?” Their answer was unequivo-cal: they found no evidence that inflation targeting improves economic perfor-mance, either in terms of inflation, interest rates, the variance of inflation, output,interest rates, or the persistence of shocks. They write, “There is no evidencewhatsoever that inflation targeting reduces inflation variability ... Our robustfinding is that inflation targeting has no beneficial effects.”
On the basis of the empirical work on the consequences of inflation target-ing in Australia, New Zealand, and Canada, Alan Blinder, a former Vice Chair-man of the Federal Reserve states, “nor does the recent experience of OECDcountries suggest that central banks that posted inflation targets were able todisinflate at lower cost than central banks without such targets,” (Blinder 1998,p.63).
A 1999 study by Ben Bernanke, the present Chair of the U.S. Federal ReserveBoard of Governors, along with Thomas Laubach, Adam Posen, and FredericMiskin, reaches the same conclusion. Bernanke and colleagues write that:
Inflation targeting is no panacea ... it does not enable countries to wring inflation outof their economies without incurring costs in lost output and employment; nor iscredibility for the central bank achieved immediately on adoption of an inflationtarget. Indeed, evidence suggests that the only way for central banks to earn credibil-ity is the hard way: by demonstrating that they have the means and the will to reduceinflation and to keep it low for a period of time. (Bernanke, et al. 1999, p. 308.)
One exception to this evidence is a 2001 paper written for the Central Bankof Chile by Vittorio Corbo, Oscar Landerretche, and Klaus Schmidt-Hebbel.They find that the sacrifice ratios have declined in emerging markets after adopt-ing inflation targeting. They also find that output volatility has fallen in bothemerging and idustrialized economies after adopting inflation targets at levelssimilar to (and sometimes lower than) those observed in industrial countriesthat do not target inflation.
Despite the Corbo et al. study, the overall weight of evidence still supportsthe view that inflation targeting has no special benefits. Of course, this does notmean that policymakers should necessarily change their commitments to control-ling inflation. It rather means that, in formulating inflation control policies, theyshould 1) recognize the costs that are incurred—the sacrifice ratio—when theypush to keep inflation at a very low level; and 2) consider alternative approaches toinflation control that may be more successful at reducing the sacrifice ratio.
Policy Implications and Proposals
The weight of the professional literature to date suggests that, as South Africapursues an aggressive program of employment expansion, it should not weaken

133Policy Interventions for Employment-Targeted Program
the program as long as inflation remains moderate, i.e. basically within a single-digit range. But what happens if inflation accumulates momentum, such thata rise to a 10 percent inflation rate leads to still greater inflationary pressures?Should South Africa then revert to raising interest rates, its standard policytool at present for controlling inflation? In fact, two other policy tools areavailable, through which South Africa could contain inflation within a moder-ate range, without having to rely on high interest rates as its control mecha-nism.
The first tool is to pursue policies that weaken the monopolistic pricingpower that exists now in some sectors of the economy. We raise this issue in ourdiscussion on sectoral policies, and simply refer to it again in this somewhatdistinct context.
The second tool is to pursue so-called “incomes policies.” Incomes poli-cies have been developed in various specific ways, but the basic idea is straight-forward: that wage and price increases are negotiated economy-wide betweenthe organized sectors of labor and business. The purpose of such economy-wide negotiations is precisely to sustain a process of economic growth withoutallowing accelerating inflation to undermine such growth opportunities. As wehave discussed in Chaper 3, incomes policies can provide an institutional basisthrough which the South African economy can combine employment growthand wage restraint, without having to resort to wage-cutting in its attempt togenerate employment growth.
Incomes policies have been widely used as an inflation control tool in avariety of contexts. One common situation has been in bringing down inflationafter it has risen to a range above 40 percent. For example, in their paper “Mod-erate Inflation” (1991) the late Rudiger Dornbusch and Stanley Fischer, theformer Director of Research at the IMF and currently Governor of the Bank ofIsrael, describe how Mexico in the 1980s drew upon experiences in Argentina,Brazil, Peru, and Israel in developing a strategy to bring inflation down fromthe 100 percent range to something closer to 20 percent. Dornbusch and Fischerreported that the Mexicans learned two lessons from these experiences: 1) “thatdisinflation without fiscal discipline was unsustainable;” but that 2) “disinflationwithout an incomes policy, relying solely on tight money and tight budgets,would be unnecessarily expensive,” (p. 31). In analyzing the Israeli experiencewith disinflation over the 1980s, Michael Bruno—who served as Governor ofthe Bank of Israel during the 1980s before becoming Chief Economist at theWorld Bank—documents in detail the major contributions of incomes policiesto the success of the effort (1993, Chapter 5).
With respect to the current situation in South Africa, perhaps the moredirectly relevant experiences with incomes policies are those of the Nordic coun-tries. This is because, in these countries, incomes policies have been used suc-cessfully as a tool for maintaining relatively low inflation over long periods of

An Employment-Targeted Economic Program for South Africa134
time rather than as primarily an instrument of disinflation, as was true withMexico and Israel. Sweden, for example, succeeded in maintaining unemploy-ment at an average rate below 2 percent between 1951 – 2000 while holdinginflation at a 4.4 percent average rate. The application of incomes policies inSweden, moreover, primarily took the form of centralized bargaining betweenunions and business, through which the aim of inflation control was recognizedin the bargaining process. As such, the government did not have to rely onsetting mandates for acceptable wage and price increases. The government didalso utilize fiscal and monetary policies as tools for controlling inflation. But itdid not have to apply these tools stringently, precisely because it could rely onits well-developed incomes policies as a complement to monetary and fiscal poli-cies.15
The most basic critique of incomes policies is that, in order for the ap-proach to have any chance of success, it is necessary that a country operate witha high level of organization among workers, and that there be some reasonabledegree of common ground between workers and business. Otherwise, therewill be no realistic prospect for economy-wide bargaining to yield results thatwill be honored widely. In the case of South Africa, there does already exist ahigh degree of organization both among sectors of the working class and amongbusiness. The relationship between unions and business is highly contentious.But this could possibly diminish to the extent that both sides saw the benefits ofa program of accelerated economic growth and employment expansion.
Professor Stephen Gelb has developed preliminary sketches of how incomespolicies could operate in South Africa (1996). Gelb argues for a system of vol-untary wage and price constraints negotiated by a tripartite commission of la-bor, business, and government. As Gelb writes:
Voluntary restraint implies the negotiation of a social compact, of which the limits onwage and price increases, as outlined above, form the core. All parties, including gov-ernment, would agree to the ceilings on increases. In addition, other issues should beplaced on the negotiating agenda for the compact, as identified in an earlier document,including monetary and interest rate policy, and the investment regime (p. 10).
The success of such voluntary restraints depends, of course, on their beingunderstood as basic features of a broader program of economic growth, em-ployment expansion, and poverty reduction. In other words, incomes policiesshould be seen as one major element of an alternative to high interest rates andslow economic growth as the mechanism of inflation control. Indeed, throughthe institution of NEDLAC—the National Economic Development and LaborCouncil, which operates precisely to promote economy-wide negotiations amongbusiness, labor, government and civil society representatives—South Africa al-ready has in place the basic institutional structures for developing an incomespolicy approach as an effective means of inflation control.

135Policy Interventions for Employment-Targeted Program
PRODUCTIVE SECTOR POLICIES
We have already examined the South African economy on a sectoral basis throughour earlier sector-by-sector analysis of relative labor intensities and employ-ment multipliers. This analysis, of course, was linked in turn to our proposal forstimulating employment growth through credit subsidies for activities with largecapacities for rapid employment expansion. These ideas certainly form part ofthe foundation of our proposed program for employment targeting in SouthAfrica.
At the same time, we do not wish to suggest that these are the only mattersof concern with respect to sectoral policy. Nor do we believe that credit alloca-tion policies are the only effective instrument for promoting targeted industriesand sectors. In fact, the Department of Trade and Industry (DTI) uses an arrayof policy instruments to address the needs of specific industrial sectors, includ-ing differential trade policies, export incentives, import duty and tax credits,regional coordination and market development, infrastructure provision, andmanaged competition and pricing policies.
In this section, we examine two additional issues that fall within the broadframework of sectoral policy. The first is price setting and market power. Thesecond is the importance of incorporating measures other than employmentimpacts as criteria for promoting specific sectors or activities. As we try toshow, there are legitimate reasons for promoting some sectors within the autoindustry and capital goods industry, even though these industries score poorlywith respect to their overall employment multipliers. Such considerations arewithin the spirit of the preliminary work on the ASGISA program, which, atleast in this preliminary state, has identified “medium-term” priority sectorssuch as chemicals on grounds other than employment expansion. We considerour two sets of issues in turn.
Getting Prices Wrong
The rapid industrialization of many countries in East Asia is frequently cited as anexample of industrial policy being used effectively to solve coordination problemsbetween industrial sectors, take advantage of long-run dynamic efficiencies, andaddress costly market failures (Amsden 2001, Chang 1994). Alice Amsden (2001)argues that rapid industrialization in these countries occurred because govern-ments made a deliberate effort to “get the prices wrong” (p. 10). In other words,state-led interventions were able to achieve allocative and dynamic efficienciesthat would not have been realized if unfettered markets were allowed to coordi-nate economic activities through unregulated price determination.
In South Africa, prices often differ significantly from what would prevailon an idealized competitive market. However, the situation is dramatically dif-

An Employment-Targeted Economic Program for South Africa136
ferent from what occurred in the case of the East Asian miracle economies. Pricesetting often inhibits the realization of dynamic efficiencies and inter-sectoralcoordination that could drive industrial development. These distortions raisethe costs associated with upstream and downstream linkages and limit the ben-efits of multiplier effects in expanding output throughout the economy in re-sponse to an economic stimulus. Moreover, price determinations are frequentlyinconsistent with the objectives of industrial and social policies.
The administered prices of the parastatals—the publicly-owned utilitiesand economic services industries—are a case in point. Enterprises such as Eskom(electricity), Transnet (transportation), and Telkom (telecommunications) pro-vide essential inputs and services to sectors throughout the South Africaneconomy. However, prices are poorly regulated and are not effectively coordi-nated with national policy objectives (Storer and Teljeur 2003). Prices are oftenthe outcome of a process of negotiation rather than an integrated regulatoryframework. For example, large industrial users of electricity are able to negoti-ate more favourable rates than are smaller commercial enterprises (Storer andTeljeur 2003). This effectively subsidizes the costs of production for larger firmsat the expense of smaller-scale users, giving the former a competitive advantagethat may be inconsistent with the objectives of industrial policies.
Similar problems with administered prices exist for other critical segmentsof the economy. In many cases, the monopoly power of public enterprises failsto support broader development goals. For example, high telecommunicationscosts limit the broad-based application of information technologies, placing someindustries at a competitive disadvantage. This issue is properly a current focusof government policy, with the government having granted in December 2005 alicense allowing a second phone company to operate in competition with Telkom.This initiative, in turn, should support the aim of the ASGISA initiative totarget “Business Process Outsourcing” as one of its “immediate priority” sec-tors.
Cross-subsidization within different units of the parastatals is a separatematter of concern with administered pricing in parastatals. For instance, usersof freight rail services effectively subsidize the transport of long-distance pas-sengers, increasing the overall costs of transporting goods. In some cases, suchcross-subsidization might be a useful mechanism for achieving a particular so-cial objective—e.g. universal electrification. However, the institutional struc-ture that currently exists for coordinating administrated prices andsocio-economic goals is weak and fragmented (Storer and Teljeur 2003).
It is important to recognize that blanket solutions, such as privatization,are likely to fail to resolve these problems. Many of these industries are “natu-ral monopolies” that require regulation regardless of who owns the assets. Inothers, the existence of economies of scale and barriers to entry suggests thatmonopolistic pricing would persist even after privatization. It is equally im-

137Policy Interventions for Employment-Targeted Program
portant to recognize that these enterprises have a significant role to play infostering industrial development in South Africa. There is no guarantee thatan unregulated market approach to coordinating industrial activities will bemore efficient than an approach embracing stronger state intervention (Chang1994).
Problems with pricing are not limited to the parastatals. Other pricing prac-tices can raise the costs to sectors along a domestic supply chain. Consider theexample of “import parity pricing” in the South African steel industry. It iscommon for the price of locally produced steel to be set at the internationalprice plus tariff and transportation costs. In addition, a premium for faster de-livery times for domestically sourced steel is frequently added to the price. Ineffect, this practice means that domestic prices reflect the cost of importingsteel from abroad, not the actual costs of production in the local steel industry(Chabane et al. 2003).16
This system of price determination sets up a situation in which steel pro-ducers have an incentive to avoid exporting, since they can sell at a much higherprice to domestic producers. However, it raises the costs to downstream pro-ducers of a critical industrial input and reduces their competitiveness. Down-stream producers effectively subsidize the domestic steel industry. Thisarrangement not only has important consequences for the development of thesedownstream sectors, but also has implications for employment. Steel produc-tion tends to be much more capital-intensive relative to the downstream activi-ties.
This discussion of pricing arrangements in South Africa illustrates some ofthe significant barriers to realizing the benefits of generating dynamic linkagesbetween sectors and capturing the efficiency gains of better coordination. Ifindustrial policy is to succeed in South Africa, these practices and similar im-pediments must be transformed and new approaches established to support in-dustrial development objectives. The specific reforms will vary on a case-by-casebasis, but the individual reforms should be crafted within a more general frame-work to support a broad-based industrial development strategy for employmentcreation.
Targeting Sectors with Low Employment Multipliers
Motor vehiclesThe Motor Industry Development Programme (MIDP) arguably representsthe most successful example of a targeted industrial strategy to date in the post-apartheid era. The goals of the MIDP were to further develop the domesticautomobile industry, to expand industry exports and global integration, to takeadvantage of economies of scale, and to maintain the affordability and quality ofmotor vehicles for the South African market. The primary policy tools designed

An Employment-Targeted Economic Program for South Africa138
to achieve these ends were carefully targeted export and investment incentiveslinked to import duty credits and rebates (Barnes, Kaplinsky, and Morris 2003,Department of Trade and Industry 2003, 2004).
By exporting completely built-up automobiles and motor vehicle parts, firmsearn duty credits that allow them to import completed vehicles and componentstax-free. The domestic market is not large enough to allow firms to simulta-neously produce a wide variety of models and take advantage of economies ofscale. Therefore, increasing exports and significantly reducing the number ofmodels produced domestically allowed South African production to become moreefficient. The duty credits allowed firms to import models not produced locallyat lower prices than would otherwise be the case. This arrangement reducessome of the costs of the MIDP, which are primarily borne by South Africanconsumers (Barnes, Kaplinsky, and Morris 2003). However, it is important torecognize that South African consumers almost certainly pay more for motorvehicles under the MIDP than otherwise, and that the extent to which the sav-ings from import duty credits are passed onto the final consumer is very muchdebatable (Kaplan 2003).
The results of the MIDP are impressive relative to the performance of otherSouth African manufacturing sectors. As of 2003, exports have increased at anaverage annual rate of 33 percent since the MIDP was introduced in 1995 (De-partment of Trade and Industry 2004). Production for the domestic market hasalso increased, although at a significantly slower rate. The motor vehicle indus-try is notable in that its share of value added, relative to other sectors of theSouth African economy, increased during the 1990s (Barnes, Kaplinsky, andMorris 2003).17 The industry’s trade deficit, although still negative, has fallensince 1995, meaning that the sector requires a diminished share of the country’sforeign exchange to continue to operate.
In addition, there is some evidence of growing diversification within themotor vehicles sector, an outcome that has evaded most South African manu-facturing sectors since the democratic transition (Department of Trade andIndustry 2003). Nevertheless, it is important to recognize that the motor ve-hicle industry still cannot be characterized as being composed of extremelydiverse activities. For example, two product types account for the majority ofexported motor vehicle components: catalytic converters and leather seats(Kaplan 2003).
The auto industry’s job creation record is also noteworthy. Employment inmany manufacturing sectors has fallen since the democratic transition (Kaplan2003). However, employment in the motor vehicle sector has bucked this trend,growing by an estimated 8.1 percent from 1999 to 2003 (Department of Tradeand Industry 2004). It is important to recognize that these employment gainsare extremely small relative to the magnitude of South Africa’s unemploymentproblem. Nevertheless, the industry’s record in retaining and expanding decent

139Policy Interventions for Employment-Targeted Program
employment opportunities cannot be dismissed lightly, given the overall job-creation performance of South African manufacturing.
The motor vehicle sector provides an important example of how a targetedindustrial strategy using a handful of policy instruments can have a significantimpact on economic development in South Africa. However, the MIDP is theonly working example of a targeted industrial strategy at this time.18 There is noreason why similar interventions could not be crafted for other strategic sectorsof the economy, if the costs, benefits, and sustainability of such policies are care-fully analyzed (Barnes, Kaplinsky, and Morris 2003).
Capital goodsDespite some domestic production and the export of certain types of machin-ery, South Africa remains heavily dependent on imported capital goods. Forexample, according to the country’s input-output tables, nearly all—i.e. 96 per-cent—of the office equipment used in production is imported. Given SouthAfrica’s large and growing tertiary sector, this is a sizeable market for goodswith potentially strong upstream and downstream linkages. With the notableexception of the building and construction industries, South Africa continuesto depend on imports for many other categories of investment goods. Althoughthese industries are not highly labor-intensive, they possess significant job-cre-ating potential. Their employment-output ratios are comparable to those of themotor vehicle industry and the linkages to sectors throughout the economy arewell established. Developing the capacity to produce certain categories of capi-tal and investment goods for the domestic and export markets would reduceimport dependence, expand access to export markets, and create new linkageswith other sectors of the South African economy.
South Africa is well positioned to become an important supplier of capitalgoods to the African continent in general and the southern African region inparticular. Already the country has been an important provider of some types ofinvestment goods to neighboring economies. For example, the top ten destina-tions for South African exports of medium and heavy commercial vehicles, animportant category of capital goods, include Zimbabwe, Angola, Mozambique,Zambia, Malawi, and Tanzania (Department of Trade and Industry 2004).19 Thefurther development of the South African capital goods industries would helpdevelop stronger economic linkages between the economies of Africa as envi-sioned by the NEPAD strategy.
One potential problem with the development of an expanded domestic capi-tal goods industry using traditional import-substitution techniques is that, asthe exposure of the domestic firms to global competition diminishes, the pricesof investment goods could rise as their quality falls. This could have importantimplications for the country’s overall industrial development and its competi-tiveness in capital goods markets. Therefore, it is important to identify specific

An Employment-Targeted Economic Program for South Africa140
products in which South Africa could develop a core productive competencyand to design policy to allow firms to inexpensively import capital goods thatwill not be produced domestically.
Within the context of an employment-targeted program for South Africa,the overarching idea to emphasize with respect to the motor vehicles and capitalgoods industries is that there are two sides of an important reality: that neitherof these sectors should be targeted for accelerated expansion on the basis oftheir employment multipliers; but that there are other grounds on which theyshould be targeted. It will clearly be crucial over the next decade for the SouthAfrican economy to continue enhancing productivity and the capacity to pro-duce import-competing capital goods. This is so, even as policymakers alsoremain focused on employment creation. Indeed, implementing an effectiveemployment-targeted program should actually enable policymakers to strengthentheir efforts to advance a broader economic policy agenda precisely because theycan pursue these other issues without appearing to neglect the imperatives ofjob creation and poverty reduction.
NOTES
1. Trades by registered brokers in their own names are exempt from the tax.2. The primary way through which the tax might affect the non-wealthy would be indirectly,
through the additional costs incurred in managing pension funds.3. Would this tax raise interest rates on bonds, including government bonds, with bond issuers
simply passing on the increased costs they have incurred with the tax? If this is so, then it ispossible that the revenue that the government would bring in through the tax would simplymove back out of the Treasury coffers through higher interest payments. This is a question thatwas raised by a Treasury official at a seminar we presented in March 2005 in Pretoria. It is ofcourse true that the tax would raise transaction costs for secondary bond traders, though notfor the primary issuers, such as the government. But the tax is also intended to provide a morestable financial environment by reducing the level of speculative noise trading. If the tax suc-ceeds even modestly in creating a more stable financial environment, this would have the counter-effect of lowering the level of risk in the market, and thereby reducing long-term rates. Formore discussion on this and related issues, see Pollin, Baker, and Schaberg (2003).
4. In the 2005 Medium-Term Budget Policy Statement, the Treasury reported on the status ofthis proposal, writing “some complex issues with regard to existing mineral rights holders anda possible review of certain income tax issues related to the mining sector require attention. Itis envisaged that this revised draft Bill will be released for comment during 2006,” (p. 46).
5. This is the CPIX inflation rate, which is the full-basket CPI rate exclusive of changes in inter-est rates on mortgage bonds.
6. See T.T. Mboweni (2002), “The Objectives and Importance of Inflation Targeting,” BusinessDay, Nov. 13, 2002.
7. The rise in food prices put significant downward pressure on the real earnings of workingpeople. Although South Africa produces most of the food it consumes, food commodities areincreasingly traded on international markets and the food distribution networks dominated byoligopolistic firms, providing a transmission mechanism between exchange rates, food prices,and domestic living standards. The Reserve Bank responded to the decline in the exchange rate and subsequent increase ininflation by raising real interest rates. However, the Reserve Bank intentionally did not raiserates to the level necessary to achieve its inflation target. Indeed, the Reserve Bank responded

141Policy Interventions for Employment-Targeted Program
more moderately to this inflationary episode than it did to similar inflationary pressures in therecent past, before the inflation targeting regime was implemented. The Bank was concernedthat raising the interest rates in order to meet the inflation target would have a more detrimen-tal effect on the domestic economy than the rise in inflation above the target range.
8. This is the standard deviation of the rate of change of the exchange rate.9. Amdsen’s evaluation of the centrality of development banking and credit allocation policies for
achieving development is consistent with a wide range of additional recent research, includingthat of Mkandawire on Africa (1999), Wade (1990) and Chang (1994) on East Asia, and Padin(2003) on Puerto Rico. More skeptical perspectives are presented in Ganesh-Kumar, Sen, andViadya (2002) on India, and the multi-country study by Galindo and Micco (2004).
10. The data on the IDC, DBSA, and Land Bank are all from the most recent annual reports ofthese institutions.
11. We wish to thank Kuben Naidoo of the National Treasury for his assistance in enabling us tofind the relevant data for this issue as well as to interpret the data appropriately.
12. These other potential influences include 1) the initial level of GDP; 2) the share of investmentspending in GDP; 3) the share of government spending in GDP; 4) the fiscal deficit; 5) the levelof overall health, as measured by life expectancy; 6) the international economic environment; 7)the effects of natural disasters; and 8) the effects of wars.
13. Epstein (2002) presents a wide-ranging perspective on this issue as it pertains specifically toSouth Africa.
14. See Saad-Filho (2004) for an extensive overview on the issue, in particular as it relates to ad-vancing a pro-poor policy framework.
15. Different perspectives on the Nordic experiences are presented in Calmfors (1993), Pekkarinen,Pohjola, and Rowthorn (1992), Marshall (1994), and Iversen, Pontusson, and Soskice (2000).
16. Import parity pricing has come under increasing scrutiny in conjunction with the practices ofMittal Steel South Africa, which holds a near-monopoly over the South African steel market,with a roughly 80 percent market share. Engineer News Online reported on 3/22/06 about thehearing of the Competition Tribunal on Mittal’s practices. According to Engineering News, “asteel-market expert from MEPS International, which currently develops steel-focused reportscovering 19 countries as well as a series of Web-based price indices, stated that he had neverbefore come across a market where IPP was employed as the basis for setting domestic sellingprices.” By contrast, Peter Fish suggested that, in the markets MEPS analysed, domestic sell-ing prices were set through a process of negotiation between the producers and consumersbased on the prevailing circumstances of the market at the time. His statement contradicts theprevailing assertion by the South African steel industry as well as other resources-based indus-tries that import-parity pricing is international best practice. When pushed by chairperson Dr.David Lewis as to why Mittal Steel South Africa’s pricing computation “was odd,” given thatits near-monopoly status made it rational for Mittal to price “just below” what an importercould charge, Fish responded by saying “I suppose, it is odd because I have never seen it.” Theoutcome of this Tribunal investigation remains undecided at the time of writing.
17. One of the reasons for the rise in rankings in terms of value-added of the motor vehicle indus-try is the relatively poor performance of other manufacturing sectors. The motor vehicle indus-try still relies heavily on imported inputs. Therefore, improvements in value-added under theMIDP, although probably positive, are probably not as large as the substantial export growthwould lead one to believe (Kaplan 2003).
18. Clothing and textiles represent the only other sector in which a targeted industrial strategy isclaimed to exist in South Africa. However, this strategy has not been successful and there arequestions about the long-run viability of an export-oriented garment sector in South Africagiven the removal of quotas in January 2005. For more detailed discussion, see Kaplan (2003).
19. The other four countries in the list of top ten destinations for medium and heavy commercialvehicle exports are the U.S., the U.K., Germany, and France.


APPENDIX 1: Sources of Employment Data andEmployment Elasticity Estimate
Employment Data
Employment data in South Africa are derived from two sources: 1) household sur-veys, such as the October Household Surveys and the Labour Force Surveys and 2)enterprise surveys, such as Survey of Employment and Earnings. These two sourcesare not strictly comparable. They differ in their coverage, methodology, and focus.Moreover, they produce strikingly different estimates of the change of employmentover time in South Africa. This has helped fuel debate, and spread confusion, aroundthe question of whether South Africa has experienced “jobless growth” or a reason-able record of job creation in recent years.
Long-run trends in South African unemployment are difficult to measure withany certainty. Reasonable household surveys that measure unemployment for all SouthAfricans date back to just 1993. Since that time, the survey instruments have under-gone many changes that make unemployment rates from year to year not strictly com-parable. The annual October Household Survey was operable until 1999 after whichtime it was replaced by the biannual Labour Force Survey (LFS). Since 2000, thedrawing of new samples, changes in the nature of the questions asked, and improve-ments in data collection raise some concerns about the strict comparability of em-ployment numbers and unemployment rates from year to year.1
A much longer time series on employment in South Africa is available—the esti-mates of employment generated by enterprise-based surveys, such as the Survey ofEmployment and Earnings. However, there are important limitations in the historicquality of this survey data. The enterprise-based surveys not only exclude agricul-tural employment and the informal economy, they also, until recently, had not at-tempted to incorporate newly emerging sectors.2 In addition, they tend to be biasedtowards large-scale enterprises. The increase in subcontracting in South Africa hasimportant implications for employment data from enterprise surveys. Growth in sub-contracted labor can be counted as a net loss of jobs, although in reality employmenthas simply shifted to firms not covered by the survey.
Those who believe that South Africa has experienced “jobless growth” base theirarguments on the enterprise-survey data. Using this data, it can be shown that, in thesectors and firms covered by the surveys, there has been a net loss of jobs as outputexpanded. In terms of the traditional industrial base of formal employment in SouthAfrica, there apparently has been an overall pattern of jobless growth. However, thisis only part of the story.
The new LFSs have much broader coverage than the enterprise surveys. They arehousehold surveys and therefore sample the workers themselves, not workplaces.Therefore, the LFSs include informal and agricultural employment. Moreover, theyare also more likely to capture other types of employment that the enterprise surveys
143

An Employment-Targeted Economic Program for South Africa144
might miss—such as employment in newly emerging industries. However, as men-tioned above, the LFSs have not yet produced a reliable long-run time series to accu-rately gauge employment trends.
Despite these problems, researchers have used the household surveys to assesschanges in employment. A comparison of the October Household Surveys and theLabour Force Surveys suggests that employment has grown significantly in SouthAfrica over the past 10 years. Much of this employment growth occurred in the infor-mal economy. Therefore, South Africa as a whole does not appear to have experienced“jobless growth,” although the composition of employment has undergone dramaticchanges.
Eventually, future improvements in both the household and enterprise surveysshould help minimize these problems. However, the discrepancies pose a significantchallenge for researchers analyzing employment policy and trends in South Africa.There is no easy solution to this problem.
In this report, we assume that the Labour Force Survey represents the most com-plete picture of the current level and composition of employment in South Africa.Therefore, whenever possible, we use the LFS numbers as a base from which weassess the current situation and make predictions of the future path of employmentgrowth. However, despite its limitations, the enterprise survey data has two advan-tages over the household data. First, it is the only source of data on long-run trends inemployment. Second, it is easier to use the enterprise data to analyze employmentwithin detailed industrial sectors—for example, when using the input-output modeldescribed in this report.
When circumstances warrant, we use the enterprise survey data in our analysis,recognizing that it represents an imperfect, second-best approximation of the realemployment situation in the country. Since the survey data tends to underestimateemployment, the estimates we produce—for example, estimates of employment mul-tipliers—should be taken as conservative estimates. Furthermore, improvements inthe Survey of Employment and Earnings (SEE) after 2001 introduced a structuralbreak in the series. Therefore, we do not use enterprise-based estimates beyond 2001in this report.
Estimation of Employment Elasticity
1. DataAs noted above, time series data on employment for South Africa are problematic.These estimates use the SEE time series data from 1967 to 2001 (Statistics SouthAfrica) for total non-agricultural employment. These figures are based on enterprisesurveys. The sample of enterprises surveyed is flawed and therefore these estimateswill not fully capture the reality in South Africa. For example, the surveys may notaccurately capture developments in new sectors and industries or changes in the em-ployment relation (e.g. the growth of subcontracting in South Africa). Nevertheless,this data represents the only time series data on employment available for South Af-rica prior to 1995 (without resorting to speculative extrapolations).

145Appendix 1
Real value added for non-agricultural sectors of the South African economy (thatis, total value added minus the value added of the agricultural sector) was used tomeasure real output.
All data were taken from the Reserve Bank website. The time series is quarterly,running from 1967:1 to 2001:4. After 2001 there is a structural break in the employ-ment data.
2. Characteristics of the variablesBoth output and employment were expressed in natural logarithms. Both variableshave a unit root and are integrated of the first order. Cointegration tests of the twovariables were inconclusive and not robust—some specifications suggested acointegrating relationship, while others reject this possibility.
Estimate of the simple equation
log(employment) = c + b*log(output)
was unhelpful. There was evidence of strong autocorrelation of the error terms. Adynamic specification of the model addressed the autocorrelation problem. However,the level of employment was almost entirely explained by its lagged values, suggestingenormous inertia. The aggregate impact of output in the simple specification wasnegative.
Because of the inconclusive nature of the cointegration tests and the problemsassociated with the dynamic model expressed in levels, the model was estimated infirst differences.
3. EstimatesThe estimated model was
dlog(employment) = c + b*dlog(output) +d*dlog(employment)t-1.
The dynamic specification was necessary to address problems of autocorrelation.
The employment elasticity of output was estimated for three different time periods.The results are:
1967:1 to 2001:4. Elasticity=0.281980:1 to 2001:4. Elasticity=0.251990:1 to 2001:4. Elasticity=0.09 (coefficient not significant),
with reported elasticities representing the long-run elasticity estimates generated bythe dynamic model.
The very low and insignificant coefficient for the last time period is consistentwith the “jobless growth” patterns observed during this time in the SEE data. These

An Employment-Targeted Economic Program for South Africa146
trends are not apparent to the same degree in other data sources (e.g. the LabourForce Surveys that have been conducted in recent years).
Notes
1. In particular, whether individuals classified themselves as “economically active” or not mighthave changed from sample to sample and with the nature of the questions asked. For example,a new sample was drawn in September 2001 in which a higher proportion of respondents mighthave classified themselves as “not economically active.” This may account for a portion of theincrease in the unemployment rate in that particular Labour Force Survey.
2. In particular, critics argue that the most recent incarnation of the enterprise-based employ-ment survey, the Survey of Employment and Earnings failed to capture important changes inrapidly expanding sectors, such as information technology. Since 2002, changes in how firmsare sampled have attempted to correct these problems of non-representative employment sta-tistics.

APPENDIX 2: Macroeconomic Policy Factorsand Private Investment in South Africa
1. Background
Empirical studies have identified a number of key determinants of the rate of privateinvestment in the South African economy. We summarize the key findings from theliterature in Table A2.1 in this appendix (all the results discussed in this appendix arepresented in Tables A2.1 - A2.7 on pp. 150-157). The key factors that drive invest-ment include domestic demand (the “accelerator” effect), the cost of capital, profit-ability and relative returns to investment in physical capital, and indicators ofuncertainty and instability. We explore further the determinants of investment byfocusing on the factors that are most directly related to macroeconomic policy. Mac-roeconomic policy may affect investment through the cost of capital. We decomposethe cost of capital to investigate the factors that are most pertinent in driving privateinvestment. We explore the interest rate and exchange rate channels of the impact ofmonetary policy on investment as well as the effects of fiscal policy on investmentthrough public investment, taxation, and government domestic borrowing. The ob-jective is to shed light on strategies for increasing private investment.
2. The empirical model, the data, and estimation methodology
The analysis is based on an empirical investment model designed to allow us to estimatethe effects of macroeconomic policy variables, controlling for other determinants ofinvestment demand. The policy variables explored are: the interest rate (the lendingrate), the real interest rate differential with the U.S., the corporate tax rate, the realexchange rate (both the level and variability of the exchange rate1), public investment,and government domestic borrowing. The model controls for the following determi-nants of investment demand: the “accelerator” effect proxied by the growth rate of theindustry’s and sector’s real GDP; unit labor costs; profits; and the cost of capital.
For an industry or sector i, the cost of capital is calculated as follows:
where ppi is the producer price index, p is the GDP deflator, R is the nominal interestrate, π π π π π is the inflation rate, δδδδδ is depreciation rate, and τττττ is the corporate tax rate. Realprofits are obtained by deducting the real wage bill from real value added:
where va is real value added, w is real earnings per employee, and L is employment.2
The analysis is based on the following dynamic investment model:
cocit = (ppiit / pit).(Rt - πt + δit)/(1-τt),
profitit = vait / pt - wit * Lit,
147

An Employment-Targeted Economic Program for South Africa148
where I/K is the ratio of investment to beginning-of-period capital stock; POL is anindicator of macroeconomic policy; X is a vector of other determinants of investmentdemand; vi is an industry- or sector-specific effect; and εεεεε is a white-noise error term.To handle the fixed effects, various methods may be used. The regressions on indus-try data are instrumental-variable estimates with two-way fixed effects (that is, in-cluding yearly effects). In the regressions on manufacturing subsectors we use thetwo-step GMM estimation procedure.
We use data on the nine major industries and 27 sub-sectors of the manufacturingsector for the period 1970-2001.
3. Key regression results
One of the most consistent empirical results is the positive effect of demand on in-vestment. The accelerator effect is robust to alternative specifications and estimationtechniques both in industry data and in manufacturing sector data. The results sug-gest that an increase in the growth rate of GDP from 3 percent to 4.5 percent wouldresult in a one percent increase in investment.
Profitability is positively related to investment. Note that this result casts doubton findings in some micro-level studies that suggest that high profitability in Africanprivate sectors has not generated high investment (e.g., Bigsten et al 1999). Thisresult is worth investigating further.
The cost of capital has a negative effect on investment, but the result is not robust toalternative specifications. In the industry regressions (not reported here for reasons ofspace), the effect of the cost of capital is significant in the static model (not including thelag of the dependent variable), but insignificant in the dynamic model. In the manufac-turing sector regressions, the cost of capital enters negatively and significantly.
As a next step in the analysis of the effects of the cost of capital, we decompose thecost of capital variable into its policy components—monetary policy (the interest rateand inflation) and fiscal policy (the corporate tax rate). This allows us to make infer-ences with regard to policies that may help stimulate private investment.
Effects of monetary policy factorsThe real lending rate has a negative effect on investment, with an estimated elasticityof -0.07 at the economy-wide level and -0.05 in the manufacturing sector. The nomi-nal lending rate has a negative effect on investment, with an estimated economy-wideelasticity of -0.26 and -0.18 in the manufacturing sector. Inflation has a negativeeffect on investment; the estimated elasticity is -0.29 at the economy-wide level and-0.12 in the manufacturing sector.
Both the short-term and long-term interest rate differential between South Africaand the U.S. have a negative and significant effect at the economy-wide level, althoughthe effect is insignificant in the manufacturing sector (results not reported here). Notethat the estimated economy-wide investment elasticities of the interest rate differen-
(I/K)it + a0 + a1(I/K)i,t-1 + a2POLit + βββββ’ Xit + vi + εεεεεit,

149Appendix 2
tial (-0.015 for the short-term differential and -0.037 for the long-term interest rate)are smaller than those for the real and nominal interest rate.
The real exchange rate has a positive effect on investment, with an elasticity of0.43 at the economy-wide level and 0.29 in the manufacturing sector. The positiveeffect of the real exchange rate on investment may be due to the fact that a significantportion of production factors (equipment and machinery) are imported, so that anappreciation of the exchange rate reduces the cost of imported inputs and the overallcost of production.
To further investigate the effect of the exchange rate on investment, we include aninteraction term between the real exchange rate and a dummy for export orientation(high or low) for the 27 manufacturing sub-sectors. The results show that, amongexport-oriented sub-sectors, exchange rate appreciation discourages investment.
The results show that exchange rate variability has a negative effect on investment.This supports the view that stabilization of the exchange rate is an important compo-nent of strategies for encouraging private investment.
Fiscal policy factorsThe corporate tax rate has a negative effect on investment. However, this effect is notrobust to alternative specifications of the investment equation. Moreover, the esti-mated elasticity of investment with respect to the tax rate is very small: -0.002 for theindustry regressions and -0.003 for the manufacturing sector.
The results indicate that public investment crowds-in private investment. How-ever, government borrowing from the domestic markets has a negative effect on in-vestment, even controlling for the effects of government debt on investment thatoperate through inflation and the interest rate. The results suggest that there areimportant limitations to government’s ability to stimulate private investment by in-creasing public investment that is funded by domestic borrowing. The positive ef-fects of public infrastructure accumulation on private investment may be offset by thecrowding-out effects of government borrowing.
Macroeconomic instabilityIt is worth reiterating the results for inflation and exchange rate variability. Thesetwo variables are proxies, along with perhaps the debt overhang variable, for macro-economic uncertainty. The results for these indicators suggest that macroeconomicuncertainty is a deterrent to investment.
Notes
1. A proxy for the variability of the real exchange rate is calculated as the absolute value of thedeviation of the annual value from the average of the previous three years. A drawback of thisproxy is that it assumes symmetry of the effects of exchange rate instability on investment (appre-ciation vs. depreciation). Regressions with the actual difference yield an insignificant coefficient.
2. We do not have data on value added by sub-sector in the manufacturing sector. Therefore, thisvariable is not included in the manufacturing sector regressions.

An Employment-Targeted Economic Program for South Africa150
Tabl
e A
2.1
Det
erm
inan
ts of
Pri
vate
Inv
estm
ent –
Sel
ecte
d E
mpi
rica
l Evi
denc
e
Fact
or
Sam
ple
peri
od,
data
,m
etho
dolo
gy
Dem
and;
capa
city
;ou
tput
Mac
roec
onom
icun
cert
aint
y
Polit
ical
unce
rtai
nty
Rat
e of
ret
urn
(lev
el a
ndun
cert
aint
yof
ret
urn)
Fedd
erke
(200
4)
1970
-97;
pan
el d
ata;
27
man
ufac
-tu
ring
sec
tors
; pan
el d
ata
anal
ysis
Prox
y: e
xpec
ted
chan
ge in
out
put
Res
ult:
pos
itiv
e ef
fect
(lar
gest
effe
ct);
Ela
stic
ity
= +
0.75
Prox
y: w
eigh
ted
aver
age
of 1
1in
dica
tors
of r
epre
ssio
nR
esul
t: n
egat
ive
effe
ctE
last
icit
y =
-0.
06
Fie
ldin
g (1
997)
1946
-92;
agg
rega
te (d
isti
ngui
shin
gbe
twee
n tr
aded
and
non
trad
ed c
apit
al);
Tim
e se
ries
ana
lysi
s
Prox
y: c
hang
e in
rea
l GD
P at
fact
or c
ost
Res
ult:
pos
itiv
e ef
fect
Ela
stic
ity
= +
0.91
(non
trad
ed);
+1.
07 (t
rade
d)
Prox
y: n
umbe
r of
str
ikes
Res
ult:
neg
ativ
e ef
fect
on
trad
ed c
apit
alE
last
icit
y: -
0.09
(tra
ded)
Prox
y: c
ombi
nati
on o
f var
iabi
lity
ofre
turn
s an
d co
st o
f ca
pita
l and
indu
stri
alun
rest
Res
ult:
neg
ativ
e ef
fect
on
nont
rade
dca
pita
l; po
sitiv
e ef
fect
on
trad
ed c
apit
alE
last
icit
y =
-0.
49 (n
ontr
aded
); +
0.35
(tra
ded)
Mla
mbo
and
Nel
l (20
00)
1960
-94;
agg
rega
te;
Tim
e se
ries
ana
lysi
s
Prox
y: c
hang
e in
rea
l out
put
Res
ult:
pos
itiv
e (s
mal
l) e
ffec
tE
last
icit
y: 0
.000
1
Var
iabi
lity
of m
acro
econ
omic
envi
ronm
entP
roxy
: inf
lati
on;
term
s of
trad
e, b
udge
t def
icit
;de
btR
esul
ts: a
ll si
gnifi
cant
Hei
ntz
(200
0; 2
002)
1970
-93;
7 in
dust
rial
sect
ors;
pane
l dat
a an
alys
is
Prox
y: s
ecto
r va
lue
adde
dR
esul
t: p
osit
ive
effe
ctE
last
icit
y: +
0.01
4
Prox
y: c
ombi
nati
on o
fpr
ison
pop
ulat
ion,
dete
ntio
ns, s
trik
esR
esul
t: n
egat
ive
effe
ct(=
fact
or e
ffec
t)E
last
icit
y: -
0.02
7
Prox
y: p
rofit
rat
eR
esul
t: p
osit
ive
effe
ctE
last
icit
y: +
0.02
7

151Appendix 2
Fedd
erke
(200
4)
Prox
y: re
al in
tere
st r
ate
+ d
e-pr
ecia
tion
rate
+ c
orpo
rate
tax
rate
Res
ult:
neg
ativ
e bu
t ins
igni
fican
tE
last
icit
y =
0
Prox
y: r
eal w
age
Res
ult:
insi
gnifi
cant
Ela
stic
ity
= 0
Prox
y: p
ublic
inve
stm
ent
Res
ult:
cro
wdi
ng-i
nE
last
icit
y =
0.0
4
Prox
y: c
hang
e in
ope
rati
ng p
rofit
sR
esul
t: in
sign
ifica
ntE
last
icit
y =
0
Prox
y =
(exp
orts
+im
port
s) /
valu
ead
ded
Res
ult:
insi
gnifi
cant
Ela
stic
ity
= 0
Tabl
e A
2.1
(con
t) D
eter
min
ants
of P
riva
te I
nves
tmen
t – S
elec
ted
Em
piri
cal E
vide
nce
Fact
or
Use
r co
st;
inte
rest
rate
Lab
orco
sts;
wag
es
Gov
ernm
ent
inve
stm
ent
Fin
ance
and
cred
it
Tra
delib
eral
izat
ion;
Exc
hang
e ra
te
Fis
cal p
olic
y
Fie
ldin
g (1
997)
Prox
y: r
eal i
nter
est r
ate
Res
ult:
neg
ativ
e ef
fect
Ela
stic
ity
= -
1.36
(non
trad
ed);
-1.
14 (t
rade
d)
Prox
y: a
ggre
gate
rea
l wag
e bi
llR
esul
t: p
osit
ive
(non
trad
ed)
Ela
stic
ity
= +
2.50
Prox
y: p
ublic
inve
stm
ent
Res
ult:
pos
itiv
e ef
fect
Ela
stic
ity
= +
0.44
(non
trad
ed);
+0.
36 (t
rade
d)
Prox
y: c
redi
t to
the
priv
ate
sect
orR
esul
t: in
sign
ifica
ntE
last
icit
y =
0
Prox
y: (1
– e
ffec
tive
tax
on c
apit
alin
com
e =
τ−1
)R
esul
t: n
egat
ive
(non
trad
ed c
apit
al)
Ela
stic
ity
= +
2.28
Mla
mbo
and
Nel
l (20
00)
Prox
y: r
eal i
nter
est r
ate
Res
ult:
neg
ativ
e ef
fect
Ela
stic
ity
= 0
.008
Prox
y: u
nit l
abor
cos
tR
esul
t: n
egat
ive
effe
ctE
last
icit
y: -
0.00
9
Prox
y: p
ublic
inve
stm
ent
Res
ult:
pos
itiv
e ef
fect
Ela
stic
ity:
+0.
37
Prox
y: d
omes
tic
cred
itR
esul
t: p
osit
ive
effe
ctE
last
icit
y: +
0.00
03
Prox
y: r
eal e
xcha
nge
rate
Res
ult:
neg
ativ
e ef
fect
Ela
stic
ity:
-0.
0001
Prox
y: b
udge
t def
icit
Res
ult:
neg
ativ
e ef
fect
of b
ond-
finan
ced
defic
it (n
o ef
fect
of
mon
ey-f
inan
ced
defic
it)
Ela
stic
ity:
-0.
067
Hei
ntz
(200
0; 2
002)
Prox
y: r
eal i
nter
est r
ate
+de
prec
iati
on +
tax
rate
Res
ult:
neg
ativ
e bu
t ins
igni
fican
tE
last
icit
y =
0
Prox
y: p
ublic
inve
stm
ent
Res
ult:
pos
itiv
e bu
t ins
igni
fican
tE
last
icit
y =
0
Sour
ce: F
edde
rke,
J.W
., 20
04. “
Inve
stm
ent i
n fix
ed c
apit
al s
tock
: Tes
ting
the
impa
ct o
f se
ctor
al a
nd s
yste
mic
unc
erta
inty
.” O
xfor
d B
ulle
tin o
f Eco
nom
ics a
nd S
tatis
tics,
66 (2
),16
5-18
7; F
ield
ing,
D.,
1997
. “A
ggre
gate
inve
stm
ent i
n So
uth
Afr
ica:
A m
odel
wit
h im
plic
atio
ns fo
r po
litic
al fr
eedo
m.”
Oxf
ord
Bul
letin
of
Eco
nom
ics a
nd S
tatis
tics,
59 (3
), 3
49-
369;
Hei
ntz,
Jam
es, 2
000.
“Po
litic
al u
nres
t, d
istr
ibut
ive
conf
lict,
and
inve
stm
ent:
the
case
of
Sout
h A
fric
a.”
Pape
r pr
esen
ted
at th
e PE
RI
wor
ksho
p on
Inv
estm
ent i
n A
fric
a,O
ctob
er 2
000.
Hei
ntz,
Jam
es, 2
002.
“Po
litic
al c
onfl
ict a
nd th
e so
cial
str
uctu
re o
f ac
cum
ulat
ion:
The
cas
e of
Sou
th A
fric
an a
part
heid
.” R
evie
w o
f Rad
ical
Pol
itica
l Eco
nom
ics,
34(3
), 3
19-3
26; M
lam
bo, K
. and
Kev
in N
ell,
2000
. “Pu
blic
pol
icy
and
priv
ate
inve
stm
ent i
n So
uth
Afr
ica:
An
empi
rica
l inv
esti
gati
on.”
In
Elb
adaw
i, I.
and
T. H
artz
enbe
rg (E
ds.)
.D
evel
opm
ent I
ssue
s in
Sou
th A
fric
a. N
ew Y
ork:
St.
Mar
tin’
s Pr
ess,
80-
109.

An Employment-Targeted Economic Program for South Africa152
Table A2.2 Industry Regression Results – Effects of Monetaryand Fiscal Policy Factors(instrumental-variable two-way fixed effects estimates)
Short-termReal Nominal interest Public Government Exchange
interest interest differential investment/ domestic raterate rate with U.S. GDP debt/GDP variability(1) (2) (3) (4) (5) (6)
Lagged investment 0.526 0.526 0.526 0.526 0.526 0.526(0.00) (0.00) (0.00) (0.00) (0.00) (0.00)
Output growth 0.039 0.039 0.039 0.039 0.039 0.039(0.06) (0.06) (0.06) (0.06) (0.06) (0.00)
Lagged output 0.046 0.046 0.046 0.046 0.046 0.046growth (0.02) (0.02) (0.02) (0.02) (0.02) (0.00)
Profit 0.0003 0.0003 0.0003 0.0003 0.0003 0.0003(0.01) (0.01) (0.01) (0.01) (0.01) (0.01)
Real unit labor 0.015 0.016 0.015 0.015 0.015 0.015costs (change) (0.64) (0.64) (0.64) (0.64) (0.64) (0.64)
Corporate tax rate -0.100) -0.425 -0.021 -0.049 -0.370 0.058(change) (0.00) (0.00) (0.80) (0.69) (0.00) (0.56)
Real interest rate -0.170(0.00)
Nominal interest -0.175 -0.056 -0.203rate (0.00) (0.25) (0.04)
Inflation -0.262 -0.157 -0.307(0.00) (0.00) (0.00)
Interest rate -0.203differential (0.00)
Public investment 0.415(0.01)
Government -0.099domestic debt (0.04)
Exchange rate -0.198variability (0.00)
R-sq within 0.850 0.85 0.850 0.85 0.85 0.85R-sq between 0.99 0.99 0.99 0.98 0.99 0.990R-sq overall 0.86 0.86 0.86 0.86 0.86 0.86F-test for fixed 7.05 7.05 7.05 7.05 7.05 7.05effects (0.00) (0.00) (0.00) (0.00) (0.00)
- Sample: 9 industries, 1972-2001, N=256 observations.- The dependent variable is gross investment as a percentage of capital stock. The numbers inparentheses are the p-values.

153Appendix 2
Table A2.3 Industry Regression Results – Effects of the Exchange Rate(instrumental-variable two-way fixed effects estimates)
Real Exchange rateexchange rate variability
(1) (2)
Lagged investment 0.526 0.526(0.00) (0.00)
Output growth 0.039 0.039(0.00) (0.00)
Lagged output growth 0.046 0.046(0.00) (0.00)
Profit 0.0003 0.0003(0.01) (0.01)
Real unit labor costs (change) 0.015 0.015(0.64) (0.64)
Corporate tax rate (change) 0.116 0.058(0.29) (0.56)
Real exchange rate 0.046(0.00)
Real exchange rate variability -0.198(0.00)
R-sq within 0.85 0.85R-sq between 0.99 0.99R-sq overall 0.86 0.86F-test for fixed effects 7.05 7.05
(0.00) (0.00)
- Sample: 9 industries, 1972-2001, N=256 observations.- The dependent variable is gross investment as a percentage of capital stock. The numbers inparentheses are the p-values.

An Employment-Targeted Economic Program for South Africa154
Table A2.4 Estimated Elasticities from Industry Regressions(Tables 2-3; elasticity =(dy/dx) (x/y))
Variable Table (equation) Partial effects Elasticities
OUTPUT (SUM) 2 (1) 0.085 0.019Profit 2 (1) 0.0003 0.02Unit labor costs (growth rate) 2 (1) 0 0Real interest rate 2 (1) -0.170 -0.067Nominal interest rate 2 (2) -0.175 -0.264Inflation 2 (2) -0.262 -0.293Corporate tax rate (change) 2 (1-5) 0 to -0.425 0 to -0.003Short-term interest rate differential 2 (3) -0.203 -0.015Exchange rate variability 3 (2) -0.198 -0.182Public investment/GDP 2 (4) 0.415 0.282Government borrowing 2 (5) -0.099 -0.350
Note: a value of 0 means that the partial effect or the elasticity is not statistically significant at the10% level.

155Appendix 2
Table A2.5 Manufacturing Sector Results – Monetary and Fiscal Policy Factors(dynamic specification – GMM two-step results)
Policy Govern-Cost Real components ment Exchange
of interest of cost of Public domestic ratecapital rate capital investment debt/GDP variability
(1) (2) (3) (4) (5) (6)
Lagged investment 0.547 0.577 0.608 0.633 0.561 0.513(0.00) (0.00) (0.00) (0.00) (0.00) (0.00)
Output growth 0.034 0.03 0.025 0.033 0.037 0.043(0.00) (0.01) (0.01) (0.00) (0.00) (0.00)
Lagged output growth 0.033 0.016 0.029 0.033 0.047 0.041(0.00) (0.04) (0.00) (0.00) (0.00) (0.00)
Real unit labor costs -0.052 -0.039 -0.036 -0.018 -0.034 -0.033(0.00) (0.09) (0.12) (0.43) (0.18) (0.06)
Cost of capital -0.048(0.07)
Real interest rate -0.19(0.03)
Nominal lending rate -0.186 -0.274 -0.139(0.08) (0.02) (0.26)
Inflation -0.273 -0.159 -0.324(0.02) (0.28) (0.03)
Corporate tax rate -0.046 -0.215 -0.283 -0.324(change) (0.66) (0.03) (0.00) (0.01)
Public investment 0.886(0.02)
Government domestic debt -0.229(0.04)
Exchange rate variability -0.065(0.00)
First-order autocorrelation -3.3 -3.13 -3.4 -3.44 -3.29(0.00) (0.00) (0.00) (0.00) (0.00)
Second-order -1.27 -1.23 -1.19 -1.13 -1.21autocorrelation (0.2) (0.22) (0.23) (0.25) (0.23)
Sample: 27 sub-sectors of the manufacturing sector; N=756

An Employment-Targeted Economic Program for South Africa156
Table A2.6 Manufacturing Sector: Exchange Rate, Exchange Rate Variability,and Export Orientation(dynamic specification – GMM two-step results)
Real Exchange rate: Tradeexchange level + orientation:
rate variabilitya High exports(1) (2) (3)
Lagged investment 0.536 0.588 0.560(0.00) (0.00) (0.00)
Output growth 0.048 0.002 0.052(0.00) (0.01) (0.00)
Lagged output growth 0.030 0.002 0.042(0.00) (0.02) (0.00)
Real unit labor costs -0.002 -0.018 -0.017(0.85) (0.93) (0.39)
Real exchange rate 0.050 0.298 0.082(0.00) (0.00) (0.00)
Exchange rate variability -0.012(0.04)
(Exchange rate)* -0.066(high exports dummy)b (0.00)
First-order -3.240 -3.760 -3.430autocorrelation (0.00) (0.00) (0.00)Second-order autocorrelation -1.280 -0.630 -1.210
(0.20) (0.53) (0.23)
a Logarithmic specificationb High exports dummy = 1 if the sector is classified as having high export orientation

157Appendix 2
Table A2.7 Estimated Elasticities from Manufacturing Sector Regressions(Tables 5-6; elasticity = (dy/dx) (x/y))
Table (equation) Partial effects Elasticities
Output (sum) 4 (3) 0.054 0.01User cost of capital 4 (1) -0.048 -0.085Unit labor costs 4 (1) -0.052 -0.35Real interest rate 4 (2) -0.190 -0.049Nominal interest rate 4 (3) -0.186 -0.178Inflation 4 (3) -0.273 -0.190Exchange rate variability 5 (2) -0.065 -0.044Corporate tax rate (change) 4 (2,3,5) 0 to -0.324 0 to -0.001Public investment 4 (4) 0.886 0.387Government borrowing 4 (5) -0.229 -0.552
Note: a value of 0 means that the partial effect or the elasticity is not statistically significant at the10% level.


APPENDIX 3: Estimation of ConsumptionFunction for South Africa
Household consumption primarily depends on the long-run disposable income ofhouseholds, adjusted for changes in inflation and the price level. Household con-sumption cannot increase at a faster rate than disposable income for an extended pe-riod of time without triggering a corrective adjustment. Of course, in the short- tomedium-term, individual households that have access to credit can borrow againstfuture expected earnings and increase consumption above the level that can be sus-tained by their immediate incomes. In South Africa, rotating savings and credit ar-rangements (e.g. stokvels) can also allow for short- and medium-term consumptionsmoothing among poorer households. However, debt payments (or payments into thestokvels) will reduce the discretionary income that indebted households can dedicateto consumption in the future. Therefore, we expect to find a long-run relationshipbetween consumption and disposable income in South Africa.
Household disposable income is taken from the series published by the ReserveBank of South Africa. Sources of disposable income include wages and salaries, in-come from property and investments, and transfers (grants and subsidies) from thegovernment. Taxes and fees are subtracted from household income to derive an esti-mate of disposable income.
Payments on household debt are not included in the calculation of disposable in-come. Fluctuations in debt payments can have a significant impact on the discretion-ary income households have at their disposal. For example, households with variableinterest rate bonds on their houses or flats can experience rapid changes in their dis-cretionary income when interest rates rise and fall. The size of the debt payments,adjusted for inflation, depends on two variables: the real stock of debt and the nomi-nal interest rate.1 Data on the total debt stock of households is not readily available.Therefore, we will use the nominal lending rate in South Africa to estimate the im-pact of non-discretionary debt payments on consumption.
In the short- to medium-term, as noted above, interest rates have a substitutioneffect, as well as an income-effect, on the consumption of households with access tocredit. The lower the interest rates, the more likely households will be to substitutecurrent consumption for future consumption (i.e. they borrow to consume more now).
Unexpected inflation can also affect a household’s consumption. If prices rise sud-denly, a household can be expected to reduce consumption in the short run. In thelong run, inflation should only have an effect on household consumption if it reducesdiscretionary income. If incomes do not keep pace with increases in the price level,real incomes will fall and we would expect consumption to be reduced. If real in-comes remain constant, high inflation can have a positive effect on consumption if itreduces the value of the debt stock and, hence, the value of real debt payments. How-ever, this positive impact on the stock of debt will likely be offset to a significantdegree by the increase in the inflation premium reflected in the nominal lending rate.
159

An Employment-Targeted Economic Program for South Africa160
In the aggregate household consumption function that we estimate, consumptiondepends on real disposable income, the nominal interest rate, and the inflation rate:
C = C(Y, r, ð),
in which C is real household consumption; Y is real disposable income; r is the nomi-nal lending rate; and ð is the inflation rate. All variables are taken from the ReserveBank of South Africa, with the exception of the nominal lending rate, which comesfrom the IMF’s International Financial Statistics database.
Statistical tests show that C, Y, and r are non-stationary.2 Furthermore, cointegrationtests reveal the existence of one cointegrating relationship among the variables. Thissuggests that a long-run equilibrium relationship exists between household consump-tion, disposable income, and the nominal interest rate. However, no long-run rela-tionship exists between consumption and the inflation rate.
Because of the possible existence of a long-run cointegrating relationship betweenthree of the four variables in the consumption function, an error-correction modelwill be used.
The econometric model estimated is:
dln(C) = á + ã[ln(C)t - ô1ln(C)t-1 - ô2ln(C)t-2 - ô3ln(Y)t – ô4ln(r)t]
+ â1dln(C)t-1 + â2dln(C)t-2 + â3dln(Y)t + â4dln(r)+t-1
+ â5ln(ð)t + â6ln(ð)t-1 + â7ln(ð)t-2
The symbol “d” represents the first difference of the variable in question and “ln”the natural logarithm. Because the equation is estimated in logarithms, the coeffi-cients of the model can be interpreted as elasticities (more details on elasticities aregiven below).
The estimated model is (t-statistics appear in parentheses):
dln(C) = -0.002 - 0.7[ln(C)t-1 - 0.81ln(C)t-2 - 0.08ln(C)t-3 - 0.13ln(Y)t-1 + 0.02ln(r)t-1](-0.5) (-4.2) (11.2) (1.3) (4.8) (-4.2)+ 0.6dln(C)t-1 + 0.3dln(C)t-2 + 0.13dln(Y)t – 0.04dln(r)+t-1
(3.8) (3.8) (5.1) (-2.3)- 0.004ln(ð) - 0.002ln(ð)t-1 + 0.006ln(ð)t-2
(-1.8) (-0.9) (2.5)
The cointegrating relationship (presented above in italics) is well-behaved in terms ofthe adjustment to a long-run equilibrium and the stationarity of the residuals.
Economic estimates of the responsiveness of consumption to other economic fac-tors are frequently expressed as elasticities. An elasticity is simply the percentage changein consumption associated with a one percent change in one of the determinants ofconsumption. For example, if the income elasticity of consumption were one, then aone percent increase (decrease) in income would be associated with a one percent

161Appendix 3
increase (decrease) in consumption. Likewise, an interest elasticity of consumptionof -0.5 means that a 10 percent increase in interest rates results in a 5 percent decreasein consumption.
The model produces the following long-run elasticity estimates of consumption:income: 1.2 (not statistically different from 1.0, as predicted by theory)nominal lending rate: -0.2
Short-run elasticities from the first-difference relationships are:income: 0.13 (contemporaneous), 0.91 (overall)lending rate: -0.04 (contemporaneous), -0.28 (overall)
Cumulative inflation effects on consumption:contemporaneous period: -0.0039one-period lag: -0.0065two-period lag: -0.0007 (not significantly different from zero).
Notes
1. Nominal debt payments would be calculated as the stock of debt times the nominal interestrate. Real debt payments are therefore the real stock of debt (the stock of debt divided by thecurrent price level) multiplied by the nominal interest rate.
2. Augmented Dickey-Fuller tests suggest that these variables are first-order integrated.


APPENDIX 4: Input-Output Modeland Employment Multipliers
The Input-Output (I-O) model used to estimate the employment and output multi-pliers used in the report was derived from the 2000 Supply and Use Tables con-structed by Statistics South Africa. The South African supply table shows the value ofproducts supplied in 153 different product categories by 94 industrial categories. TheSouth African use table shows the value of industrial output used by product category(95 categories) and industry (94 categories). The use table also contains the final de-mand for products by product category. Import supply and export demand are in-cluded in the supply and use tables, respectively.
An I-O table shows the value of domestic output supplied by industry X and usedby industry Y. Industry X and industry Y can refer to the same industrial category.The I-O table also reports the final demand for domestically supplied output by in-dustry. A standard I-O table can be constructed from the South African supply anduse tables. To do this, the product categories of the two tables have to match. There-fore, the 153 product categories in the supply table had to be consolidated to matchthe 95 product categories in the use table.
The full I-O table is too large to reproduce conveniently in this appendix. How-ever, we can reproduce a small section of the I-O table to illustrate its construction:
From the table, it is easy to read off the linkages between industries. For example,the domestic agricultural industry supplied R1,931.5 million in output for use byenterprises within the agricultural industry itself. Coal mining and related industriessupplied R5.5 million in output to gold mining.
Often, I-O tables are not expressed in monetary values, but rather in coefficientsthat represent a fraction of the total value of output produced by that industry. Eachcell in the I-O table would be converted into a fraction that represents the value ofinputs supplied by industry X as a fraction of the total output produced by industryY. In order words, the I-O table would be transformed to show the amounts suppliedand used by the various industries in order to produce one rand of output.
An I-O model uses the basic I-O table described above to draw conclusions aboutthe interrelationships between the various industries that comprise an economy and
Use
Agriculture Gold mining Coal
SupplyAgriculture 1931.5 13.9 24.3Gold mining 2.3 1.5 21.5Coal 4.3 5.5 13.9
2000 Input-Output Table. R millions
163

An Employment-Targeted Economic Program for South Africa164
to describe how industrial output might respond to various external changes. Mostcommonly, I-O models are used to describe how industrial output and employmentrespond to changes in final demand for an industry’s output or for a category of ex-penditure (e.g. household consumption or fixed capital investment).
The standard I-O model is expressed as follows:
x – Ax = d,
in which
x is a vector of total demand for industrial output (total demand = industrydemand + final demand);
A is the I-O coefficient matrix described above; andd is a vector of final demand for each industry’s output.
In essence, the expression for the I-O model represents a simple accounting rela-tionship: total demand for domestic industrial output (x) less the industrial uses fordomestic output (Ax) must equal the final demand for domestic output (d).
However, we are often interested in how total industrial output responds to changesin final demand. Therefore, the I-O model must be solved for ‘x’:
x = [I-A]-1d
in which I represents the identity matrix. The inverse matrix [I-A]-1 is often referredto as a “Leontief Inverse.”
Output multipliers can be derived directly from the Leontief inverse matrix. Thecoefficients in the matrix show how industrial output responds to a R1 increase in thefinal demand for the products of any of the industries—taking into account the inter-connections between the various industries and leakages due to imports. For example,a R1 million increase in the demand for agricultural goods in South Africa clearly willhave a direct impact on agricultural output, but it will also have indirect impacts on allthose industries that supply the agricultural industry with products used in produc-tion. These industries, in turn, will demand inputs from other industrial sectors, andso forth. The output multipliers derived from the I-O model take into account allthese interconnections.
The basic I-O model described above can be extended to include feedback effectsthat impact final demand. Increases in output also increase the value added that in-dustries generate. A portion of this value added is distributed to households in theform of salaries and wages. This household income, in turn, is spent on consump-tion—a component of final demand. Therefore, increases in industrial output canalso affect final demand. To capture these dynamics, the basic I-O model describedabove has to be extended to include the household sector and value added in the coreI-O coefficient matrix. I-O models that include the household sector are often de-scribed as “endogenous household models.”

165Appendix 4
Employment multipliers can also be computed using the I-O models describedhere. In order to estimate employment effects, we need to know the number of jobsper unit of output (e.g. R1 million of output) for each industrial sector. These em-ployment-output ratios can then be used to transform the Leontief inverse matrix toexpress multipliers in terms of employment instead of output. In this report, theemployment-output ratios for each industrial sector were estimated using 2000 in-dustrial employment data from the Trade and Industrial Policy Secretariat (TIPS)database.
Unless otherwise noted, all output and employment multipliers discussed in thebody of the report were calculated using an endogenous household I-O model and theemployment data from the TIPS database. It should be noted that the employmentdata are derived from the enterprise surveys of Statistics South Africa and thereforerefer to formal employment only. In addition, enterprises in certain sectors of theSouth African economy, particularly new firms and small- and medium-sized formalenterprises, are likely to be underrepresented in the survey data for 2000. Therefore,the employment multipliers generated by this methodology are conservative estimatesof overall employment effects.


CO
UN
TRY
Arg
entin
a
Aus
tral
ia
Aus
tria
Bel
gium
Bra
zil
Chi
le
Chi
na
Col
ombi
a
Den
mar
k
Ecu
ador
Fin
land
Fran
ce
Ger
man
y
STO
CK
S
0.60
%
0.30
%
0.15
%
0.17
%
0.3%
[0.3
8%]
18%
VA
T o
n tr
ade
cost
s
0.5%
or
0.8%
1.50
%
[0.5
%]
[0.1
%]
1.60
%
0.15
%
[0.5
%]
CO
RPO
RAT
EB
ON
DS
0.60
%
0.15
%
0.15
%
0.07
%
0.3%
[0.3
8%]
18%
VAT
on
trad
e co
sts
[0.1
%]
1.5%
[0.5
%]
1.0%
— See
note
0.4%
GOV
ERN
MEN
TB
ON
DS
0.60
%
— — 0.07
%
0.3%
[0.3
8%]
— 0 1.50
%
— — — 0.2%
FU
TU
RE
S
0.60
%
— — — — — — — — — —
DE
TA
IL
tax
of 0
.6%
on
all f
inan
cial
tran
sact
ions
app
rove
d by
legi
slat
ure
Mar
ch 2
000
Red
uced
twic
e in
199
0s; c
urre
ntly
0.1
5 ea
ch o
nbu
yer
and
selle
r
Pres
ent
Pres
ent
Tax
on
fore
ign-
exch
ange
tran
sact
ions
red
uced
from
2%
to 0
.5%
199
9. T
ax o
n st
ocks
incr
ease
dan
d on
bon
ds r
educ
ed Ju
ne 1
999
Pres
ent
Tax
on
bond
s el
imin
ated
200
1, H
ighe
r ra
te o
nst
ock
tran
sact
ions
app
lies
to S
hang
hai e
xcha
nge
Intr
oduc
ed Ju
ne 2
000
Red
uced
in 1
995,
199
8, A
bolis
hed
effe
ctiv
e O
ct. 1
999
Tax
on
stoc
ks in
trod
uced
199
9, a
bolis
hed
2001
.ta
x on
bon
ds in
trod
uced
199
9
Intr
oduc
ed J
anua
ry 1
997;
app
lies
only
to tr
ades
off H
EX
(mai
n el
ectr
onic
exc
hang
e)
Pres
ent
Rem
oved
199
1
Tabl
e A
5.1
Sec
uriti
es T
rans
actio
n Ta
xes A
roun
d th
e W
orld
as o
f 200
2APPENDIX 5: Securities Transaction TaxesAround the World as of 2002
167

An Employment-Targeted Economic Program for South Africa168
Tabl
e A
5.1
(con
t.) S
ecur
ities
Tra
nsac
tion
Taxe
s Aro
und
the
Wor
ld a
s of 2
002
CO
UN
TRY
Gre
ece
Gua
tem
ala
Hon
g K
ong
Indi
a
Indo
nesi
a
Irel
and
Ital
y
Japa
n
Mal
aysi
a
Mor
occo
Net
herl
ands
Paki
stan
Pana
ma
Peru
Phili
ppin
es
STO
CK
S
0.60
%
3.00
%
.3%
+ $
5 st
amp
fee
0.50
%
0.14
% +
10%
VAT
on
com
mis
sion
s
1.00
%
[1.1
2%]
[.1%
], [0
.3%
]
0.50
%
0.14
% +
7%
VA
T o
n tr
ade
cost
s
[0.1
2%]
0.15
%
— 18%
VAT
on
trad
e co
sts
[0.5
%] +
10%
VA
T o
ntr
ade
cost
s
CO
RPO
RAT
EB
ON
DS
0.60
%
3.00
%
[0.1
%]
0.5%
0.03
%
— — [0.1
6%]
0.5%
7% V
AT o
ntr
ade
cost
s
[0.1
2%]
0.15
%
— 18%
VAT
on
trad
e co
sts
—
GO
VE
RN
ME
NT
BO
ND
S
— See
note
[0.1
%]
— 0.03
%
— — — 015%
[.03%
]
7% V
AT
on
trad
e co
sts
0 — — — —
FU
TU
RE
S
— — — — — — — — 0.00
05%
— — — — —
DE
TA
IL
Impo
sed
1998
; dou
bled
in 1
999
Pres
ent
tax
on s
tock
tran
sact
ions
red
uced
from
0.6
%19
93; t
ax o
n bo
nds
elim
inat
ed F
eb. 1
999
Pres
ent
Intr
oduc
ed 1
995
Pres
ent
Stam
p du
ties
elim
inat
ed 1
998
Rem
oved
Apr
il 19
99
Pres
ent
Pres
ent
1970
-199
0
Pres
ent
stam
p du
ties
elim
inat
ed J
an. 2
000
Pres
ent
VAT
pre
sent
169Appendix 5
CO
UN
TRY
Port
ugal
Rus
sia
Sing
apor
e
Sout
h K
orea
Swed
en
Swit
zerl
and
Tai
wan
Uni
ted
Kin
gdom
Vene
zuel
a
Zim
babw
e
STO
CK
S
[0.0
8%]
0.8%
on
seco
ndar
yof
feri
ngs
+ 2
0% V
AT o
ntr
ade
cost
s
0.05
% +
3%
VA
T o
ntr
ade
cost
s
.3%
[.45
%]
[1%
]
0.15
%
.3%
[.6%
]
0.50
%
0.5%
[1%
]
0.45
% V
AT
on
trad
e co
sts
CO
RPO
RAT
EB
ON
DS
[0.0
4%]
— .3%
[.45
%]
— 0.15
%
0.1%
— - -
GO
VE
RN
ME
NT
BO
ND
S
[0.0
08%
]
— — — 0.15
%
— — - -
DE
TA
IL
Rem
oved
199
6
Pres
ent
Red
uced
199
4, e
limin
ated
199
8; V
AT
pre
sent
Red
uced
199
6
Rem
oved
199
1
Pres
ent;
0.3
% o
n fo
reig
n se
curi
ties
, 1%
on
new
issu
es
Red
uced
199
3
Pres
ent
Red
uced
May
200
0
Pres
ent
FU
TU
RE
S
— — — — 0.05
%
— - -
Tabl
e A
5.1
(con
t.) S
ecur
ities
Tra
nsac
tion
Taxe
s Aro
und
the
Wor
ld a
s of 2
002
Not
es:
[…] i
ndic
ates
form
er ta
x ra
te.
Sour
ces
ambi
guou
s as
to w
heth
er ta
x ap
plie
s to
bon
ds in
Fra
nce
and
gove
rnm
ent b
onds
in G
uata
mal
a. A
ustr
ia, B
elgi
um,
Fin
land
, Ger
man
y, I
taly
, Jap
an, M
exic
o, P
ortu
gal a
nd S
pain
als
o im
pose
VA
T-t
ype
taxe
s on
com
mod
ity
futu
res
trad
es.
Sour
ces:
The
LG
T G
uide
to W
orld
Equ
ity M
arke
ts (L
ondo
n: E
urom
oney
Pub
licat
ions
, 199
7); 1
994
Han
dboo
k of
Wor
ld S
tock
and
Com
mod
ity E
xcha
nges
(Lon
don:
Bla
ckw
ell F
inan
ce, 1
994)
; Opp
enhe
im S
ecur
ities
Mar
kets
Aro
und
the
Wor
ld (N
ew Y
ork:
Joh
n W
iley
& S
ons,
198
8); O
EC
D F
inan
cial
Mar
ket T
rend
s (Pa
ris:
OE
CD
, 199
3);
Tren
ds (S
ecur
ity
Indu
stry
Ass
ocia
tion
, Aug
ust 1
8, 1
994)
; Tax
atio
n of
Sto
ck T
rans
fers
in V
ario
us F
orei
gn C
ount
ries
(Was
hing
ton:
Law
Lib
rary
of
Con
gres
s, 1
989)
; Tax
Not
es I
nter
natio
nal a
nd W
orld
Tax
Dai
ly (w
ww.
taxb
ase.
org)
; IB
FD
, Int
erna
tion
al B
urea
u of
Fis
cal D
ocum
enta
tion
(ww
w.ib
fd.n
l). T
he S
alm
on S
mith
Bar
ney
Gui
de to
Wor
ld E
quity
Mar
kets
; D
ow J
ones
Int
erac
tive;
Pri
ceW
ater
hous
eCoo
pers
Gui
des t
o D
oing
Bus
ines
s.


APPENDIX 6: South Africa Monetary Policy Alternatives:VAR-Based Simulation Models
In this appendix, we present details of the data, procedures, and estimates underly-ing the monetary policy simulation results presented in the body of the report. Theappendix reports on the following components of our study:
1. The objectives of the analysis and an overview of the techniques used;2. The data used in the study;3. A presentation of the estimations and simulations of monetary policy
experiments;4. A presentation of the estimations and simulations of credit policy changes.
1. Monetary and Credit Policy Experiments
Our study proposes a set of interconnected policy and structural changes designedto generate significant increases in employment in South Africa over a 10-year period.It is crucial to generate a set of plausible estimates to indicate how much employmentour policies can generate, and what side benefits and costs might be associated with ourpolicy suggestions in order to assess their economic feasibility and desirability.
Rather than try to create a very large—and therefore possibly highly complexand obscure—policy model to incorporate all the policies we are suggesting, we havedecided to build a series of smaller models designed specifically to assess one or afew aspects of our overall program. We believe this approach yields much more trans-parent and focused results, perhaps at the expense of some checks for consistencyacross models and issues.
In this appendix, we describe the models we used to assess the impacts of our pro-posed changes in monetary and credit policy on the macroeconomy. To do this, wehave implemented a set of techniques widely used in monetary policy analysis: vectorautoregression (VAR) simulation models (see, for example, Aron and Muellbauer, 2002;Bernanke 1986 and Bernanke, et al. 1997; Leeper and Zha 2003; Stock and Watson,2001; Walsh 2003). This approach uses a minimum number of assumptions about thestructure of the economy to estimate a small, simplified model of the macroeconomy.Based on that estimation, we simulate the model with changes in various policy toolsand estimate the impact of those changes in policy on the economy. We do this byestimating the difference between the baseline path of economic variables such as in-flation and economic growth, and the path these variables take under the new (hypo-thetical) settings of the monetary policy tools. The difference between these is taken tobe the “impact” of the policy change on the economy.
In this appendix we describe two such models. The first focuses on the impact ofchanges in the South African Reserve Bank monetary policy’s rule on exchange rates,inflation and economic growth. The goal is to estimate the effect of different interest
171

An Employment-Targeted Economic Program for South Africa172
rate settings on economic growth, inflation and exchange rate variability. The sec-ond model, using the same basic techniques, estimates the impact of private creditgrowth on economic growth and inflation. Both models incorporate some importantexogenous variables as well.
Before describing the estimates and the simulations, we first discuss our datavariables and sources.
2. Data
All data are either originally quarterly data or have been transformed into quarterlydata from monthly data.
Prime rate: The “prime rate” is the “prime lending rate.” It tracks closely thechanges in the repurchase (or “repo”) rate, which is the main tool of monetary policy.The reason we use the prime rate rather than the repo rate is that it has a longer dataseries. Source: IMF International Financial Statistics (IFS) South Africa (hereafterIFS), lending rate.
Exchange Rate: The nominal rate relative to the U.S. dollar. Our measure is thefour quarter rate of change of the rand, measured so that an increase means an in-crease in the rate of depreciation of the rand. Source: IFS.
Inflation Rate: We use the CPIX variable, as calculated by Aron and Muellbauer.This is the consumer price level, excluding mortgage interest. We use the four-quar-ter rate of inflation. Source: http://www.csae.ox.ac.uk/resprogs/smmsae/datasets.html.
GDP Growth: The four quarter rate of growth of real GDP. Source: South AfricanReserve Bank (http://www.reservebank.co.za/).
US T-bill: The 3-month U.S. Treasury Bill rate. Source: IFS.
Private Credit: The four-quarter rate of growth of private credit created by allmonetary institutions; monthly data transformed to quarterly data. Source: SouthAfrican Reserve Bank (http://www.reservebank.co.za/).
Terms of Trade: Four-quarter change in the terms of trade. Source: South AfricanReserve Bank (http://www.reservebank.co.za/).
Stationarity Tests on VariablesAll of the variables were tested for stationarity using the Augmented Dickey-Fullertests. Table A6.1 shows the results.
For the estimates that follow, we report on results using the growth variable (ofreal GDP). We have also done the estimates with detrended GDP growth, and the

173Appendix 6
results are roughly the same. We report on the non-detrended variable because ofgreater ease of interpretation.
3. VAR Estimates of Monetary Policy
Using some of the data discussed above, we estimated a VAR model with four endog-enous variables (prime, exchange rate change, inflation and growth) and one exog-enous variable (U.S. Treasury Bill), over the period 1989, first quarter (1989.1) to2004, fourth quarter (2004.4), with 4 quarter lags. We then estimated the impulseresponse function using the Choleski decomposition, with the following ordering(prime, change in exchange rate, inflation, growth). We tried the results with differ-ent orderings and the results did not seem very sensitive to the reorderings. A posi-tive shock in the prime reduces economic growth, has a modest, cyclical impact oninflation, and is associated with increased variability in the exchange rate.
Figure A6.1 presents the impulse response functions from this model. This modelwas then transformed into a simulation model to be used for monetary policy ex-periments.
Simulation ResultsThe goal of the simulation exercise is to estimate the impacts of a medium- to long-term decline in the prime lending rate on exchange rate variability, inflation, andgrowth. In order to estimate these effects, we undertook the following steps:
1. We solved the estimated VAR model, using a dynamic simulation, over the period1994.1 – 2004.4. We call the results of this dynamic simulation the “baseline”results. We use these baseline estimates in combination with data generated by“policy experiments” to estimate the impacts of changing the prime lending ratein the steps described below. As seen in Figure A6.2, the baseline estimates, when compared to the actualdata, capture basic trends in the data for the most part, but do not do a good job oftracking all turning points. Unfortunately, this is a common problem in such mod-els.
Table A6.1 Stationarity Tests
Stationary InterceptVariable (significance level) Intercept and Trend
Exchange Rate Change Yes (5%) Yes NoCredit Change Yes (5%) Yes NoGrowth Yes (1%) No YesInflation Yes; I(1) (1%) Yes NoPrime Yes; I(1) (1%) Yes NoU.S. T-Bill Yes; I(1) (1%) Yes

An Employment-Targeted Economic Program for South Africa174
0
4
8
12
1 2 3 4 5 6 7 8 9 10
-20
0
20
1 2 3 4 5 6 7 8 9 10
-5
0
5
1 2 3 4 5 6 7 8 9 10
-4
-2
0
1 2 3 4 5 6 7 8 9 10
2. The next step is to create alternative scenarios in which the prime lending rate isadjusted according to a different monetary policy than that which prevailed inpractice. In this respect, we report on two alternative scenarios:
a. lowering the prime rate so that it remains one point below the baseline sce-nario for five years;
b. lowering the prime rate so that it remains four percentage points below thebaseline for five years.
Figure A6.1 Accumulated Response to Cholesky One Standard DeviationInnovations (± 2 Standard Errors)
Source: See Appendix 5 text.
ACCUMULATED RESPONSE
OF PRIME TO PRIME
ACCUMULATED RESPONSE OF
EXCHANGE RATE CHANGE TO PRIME
ACCUMULATED RESPONSE
OF INFLATION TO PRIME
ACCUMULATED RESPONSE
OF GROWTH TO PRIME
Accumulated Responses Are over 10 Quarters
Prim
e R
ate
Exc
hang
e R
ate
Cha
nge
Infl
atio
n
Gro
wth

175Appendix 6
-40
0
40
1992 1996 2000 2004-4
0
4
1992 1996 2000 2004
5
10
15
1992 1996 2000 2004
10
20
30
1992 1996 2000 2004
0
5
10
1992 1996 2000 2004
Figure A6.2 Baseline Estimates from VAR Model Versus Actuals 1994.1-2004.4
Source: See Appendix 5 text.
EXCHANGE RATE CHANGE GROWTH
INFLATION PRIME RATE
U.S. TREASURY BILL-ACTUAL
Actual
Estimate
Actual
Estimate
Actual
Estimate
Actual
Estimate
Actual Estimate

An Employment-Targeted Economic Program for South Africa176
A One-Point Drop in the Prime RateFigure A6.3 shows the model’s estimated impact of a one-point drop in the primerate below the baseline on inflation, growth, and exchange rate variability for theperiod 2000.1 to 2004.4. Figure A6.4 shows the difference between the baseline andthe simulated monetary policy change.
Table A6.2 (p. 179) presents the numerical summary of the main effects of thispolicy experiment. According to these results, real GDP growth is estimated toincrease by approximately 0.15 percentage points as a result of the drop in the primeby one percentage point below the baseline. Inflation increases by 0.2 percentagepoints on average. The exchange rate depreciates by up to 1.5 percentage pointsmore during the period.
Simulation II: Reduce the Prime Rate by Four Percentage Points, 2000.1-2004.4.In this simulation, we estimated the impacts of lowering the prime rate by four per-centage points and holding it there over the period, 2000.1 to 2004.4. Figure A6.5describes the impacts by showing the difference from the baseline. The Figure A6.5results show that GDP growth goes up on average by about 0.6 percent for the 2001-04 period (about 0.5 percent on average for the whole 5-year period), inflation in-creases by about one percentage point on average, and the exchange rate changes becomemore variable.
These are the results reported in the text. Of course, it is important to keep inmind the limitations of estimates such as these. We will discuss those in somewhatmore detail towards the end of this appendix.
3. Credit and Monetary Policy
As we discuss in the text, our plan for generating more employment in South Africaincludes reallocating credit to employment-oriented investments, as well as increas-ing the quantity of credit to some extent. Because of limited degrees of freedom,among other problems, we cannot simply add a credit variable to our VAR. More-over, because ours is an aggregative model, we cannot use the same VAR model toestimate the effects of credit reallocation. Instead, we estimate the effects of increasesin private credit growth on the economy first by using so-called “Granger causalitytests” and then by using a different, smaller VAR model and simulation exercises insome respects similar to the ones we used for interest rate policy.
First we should say a word about our choice of a credit variable. We have chosenthe growth of private credit as our credit variable primarily because we expect thatour credit policies described in the body of the text will largely result in increases(and reallocations) of private credit, rather than public credit.
Granger Causality TestsWe conducted a battery of Granger causality tests. Table A6.4 presents the results.
The Granger tests indicate that changes in credit affect growth and inflation, butno other relations are statistically significant.

177Appendix 6
Figure A6.3 Simulation of a 1 Percentage Point Reduction in Prime Rate,2000.1 - 2004.4
Source: See Appendix 5 text.
-5
0
5
10
15
1994 1996 1998 2000 2002 20040
2
4
6
1994 1996 1998 2000 2002 2004
4
6
8
10
12
1994 1996 1998 2000 2002 20048
12
16
20
1994 1996 1998 2000 2002 2004
0
2
4
6
8
1994 1996 1998 2000 2002 2004
EXCHANGE RATE CHANGE GROWTH
INFLATION PRIME RATE
U.S. TREASURY BILL-ACTUAL
Baseline Simulation

An Employment-Targeted Economic Program for South Africa178
-1
0
1
2
3
1994 1996 1998 2000 2002 2004.0
.1
.2
.3
1994 1996 1998 2000 2002 2004
-.2
.0
.2
.4
1994 1996 1998 2000 2002 2004-1.2
-0.8
-0.4
0.0
1994 1996 1998 2000 2002 2004
-1
0
1
1994 1996 1998 2000 2002 2004
Figure A6.4 Estimated Deviations off of Baselines from One Percentage PointDecline in Prime Interest Rate, 2000.1 - 20004.4
Source: See Appendix 5 text.
GROWTHEXCHANGE RATE CHANGE
PRIME RATEINFLATION
U.S. TREASURY BILL RATE

179Appendix 6
Table A6.2 Impact of a 1 Percentage-Point Drop on Growth, Inflation andExchange Rates
2000 2001 2002 2003 2004
Exchange Rate Change 1.54 1.44 -0.48 0.09 0.32Growth 0.05 0.20 0.11 0.15 0.14Inflation 0.03 0.32 0.24 0.19 0.21Prime Rate -1.00 -1.00 -1.00 -1.00 -1.00U.S. T-Bill 0.00 0.00 0.00 0.00 0.00
Source: VAR-based simulation, as described in text.
Table A6.3 Impact of 4 Percentage-Point Decline in Prime Rate
2000 2001 2002 2003 2004
Exchange rate change 6.16 5.74 -1.91 0.35 1.29Growth 0.22 0.79 0.44 0.61 0.55Inflation 0.12 1.29 0.96 0.76 0.85Prime rate -4.00 -4.00 -4.00 -4.00 -4.00U.S. T-Bill 0.00 0.00 0.00 0.00 0.00
Source: VAR-based simulation as described in text.
Table A6.4 Granger Tests of Effects of Credit Expansion on Macro Variables
Variable relationship Does It Granger Cause? (At 10% Level)
Credit Growth cause Economic Growth? YesEconomic Growth Cause Credit Growth? NoCredit Growth Cause Inflation? YesInflation Cause Credit Growth? NoCredit Growth Cause Exchange Rate Change? NoExchange Rate Change Cause Credit Growth? NoCredit Growth Cause Prime Rate? NoPrime Rate Cause Credit Growth? No

An Employment-Targeted Economic Program for South Africa180
Figure A6.5 Impact of 4 Percentage Point Drop in Prime Interest RateRelative to Baseline, 2000.1 - 2004.4
Source: See Appendix 5 text.
-4
0
4
8
12
1994 1996 1998 2000 2002 20040.0
0.5
1.0
1994 1996 1998 2000 2002 2004
-0.5
0.0
0.5
1.0
1.5
1994 1996 1998 2000 2002 2004-6
-4
-2
0
1994 1996 1998 2000 2002 2004
-1
0
1
1994 1996 1998 2000 2002 2004
GROWTHEXCHANGE RATE CHANGE
PRIME RATEINFLATION
U.S. TREASURY BILL RATE

181Appendix 6
Credit VAR and SimulationTo pursue these relationships further, we built a small VAR with private credit growthas one of the three variables, with the other two endogenous variables being inflationand real GDP growth. As exogenous variables, we used the U.S. T-Bill rate to con-trol for the impacts of foreign financial factors, the terms of trade facing South Af-rica to control for foreign-related price factors, and the prime rate. We put the primerate as an exogenous variable because of the lack of evidence from the Granger teststhat the prime rate was associated with the credit variable. We also did this to saveon degrees of freedom.
Figure A6.6 shows the basic accumulated impulse response functions from thismodel.
The impulse response functions show that private credit growth is positively re-lated to real economic growth, and, in turn, more rapid economic growth is posi-tively associated with more rapid growth in private credit. The most surprising resultsin these estimates is the negative relationship between private credit growth andinflation: higher growth in private credit is associated with lower inflation, quitecontrary to normal expectations. This relationship appears to make a re-appearancein the policy experiment simulations reported presently.
Based on this VAR model, Figure A6.7 shows the simulated impacts of a five per-centage point increase in private credit growth plus a two percentage point decline inthe prime rate, relative to the baseline, for a five-year period, 2000.1 to 2004.4.
The simulation estimates, in the example used in the text, that real GDP growthwould rise by about 1.5 percentage points from the baseline, say from 3 – 4.5 per-cent. It further predicts that inflation would fall. Without fully believing that infla-tion would actually fall in these circumstances, we think the results still suggest thatlarge increases in inflation rates resulting from these policies are unlikely to occur.
In other simulations, not reported, we added the exchange rate changes to theVAR as an endogenous variable. The combined policy of lowering the prime rate andexpanding private credit is not estimated to have a large effect on the exchange ratevariability, greater than what we saw above.
In short, these results suggest that combining private credit growth with lowerinterest rates can be an effective means of raising economic growth without causing
Table A6.5 Impact of Increased Credit Growth (5%) and Lower Prime Rate(by 2%)
2001 2002 2003 2004
Private Credit 5.00 5.00 5.00 5.00Terms of Trade 0.00 0.00 0.00 0.00Growth 0.71 1.37 1.48 1.45Inflation -0.56 -1.77 -2.12 -1.98Prime Rate -2 -2 -2 -2U.S. T-Bill 0.00 0.00 0.00 0.00

An Employment-Targeted Economic Program for South Africa182
-4
0
4
8
1 2 3 4 5 6 7 8 9 10
-4
0
4
8
1 2 3 4 5 6 7 8 9 10
-4
0
4
8
1 2 3 4 5 6 7 8 9 10
0
4
1 2 3 4 5 6 7 8 9 10
0
4
1 2 3 4 5 6 7 8 9 10
0
4
1 2 3 4 5 6 7 8 9 10
0
1 2 3 4 5 6 7 8 9 10
0
1 2 3 4 5 6 7 8 9 10
0
1 2 3 4 5 6 7 8 9 10
Figure A6.6 Accumulated Responses to Cholesky One Standard DeviationInnovations (± 2 Standard Errors)
Source: See Appendix 5 text.
ACCUMULATED RESPONSE
OF PRIVATE CREDIT TO
PRIVATE CREDIT
ACCUMULATED RESPONSE
OF GROWTH TO
PRIVATE CREDIT
ACCUMULATED RESPONSE
OF PRIVATE CREDIT
TO GROWTH
ACCUMULATED RESPONSE
OF PRIVATE CREDIT
TO INFLATION
ACCUMULATED RESPONSE
OF GROWTH TO
GROWTH
ACCUMULATED RESPONSE
OF GROWTH TO
INFLATION
ACCUMULATED RESPONSE
OF INFLATION TO
PRIVATE CREDIT
ACCUMULATED RESPONSE
OF INFLATION
TO GROWTH
ACCUMULATED RESPONSE
OF INFLATION
TO INFLATION
Accumulated Responses Are Over 10 Quarters

183Appendix 6
0
2
4
6
1994 1996 1998 2000 2002 2004-1
0
1
1994 1996 1998 2000 2002 2004
0
1
2
1994 1996 1998 2000 2002 2004-2.0
-1.5
-1.0
-0.5
0.0
1994 1996 1998 2000 2002 2004
-2
-1
0
1994 1996 1998 2000 2002 2004-1
0
1
1994 1996 1998 2000 2002 2004
Figure A6.7 Impact of 5 Percentage Point Increase in Private Credit Growth and2 Percentage Point Reduction in Prime Interest RateDeviations from Baseline
Source: See Appendix 5 text.
TERMS OF TRADEPRIVATE CREDIT GROWTH
INFLATIONGROWTH
PRIME RATE U.S. TREASURY BILL

An Employment-Targeted Economic Program for South Africa184
enormously difficult problems of increased inflation or exchange rate depreciationsand instability.
CaveatsA number of cautions are necessary in interpreting these results. First of all, thedegrees of freedom at our disposal are very limited because of the short period sincethe end of apartheid, which was obviously a major structural change. Second, it iswell known that VAR models are highly simplified models of the economy becauseby requiring many degrees of freedom, they are limited in the number of endog-enous variables they can incorporate. In addition, the simulation model is highlyimperfect: it misses many important fluctuations and turning points in the data. Asa result, it will only give a very rough guide to the impact of policy experiments.Hence, all the results in this appendix should be seen only as indicative.

REFERENCES
Ahmed, Faisel (2004) “Determinants of Interest Rates in South Africa,” manuscript, In-ternational Monetary Fund.
Amsden, Alice (2001) The Rise of ‘The Rest’: Challenges to the West from late-industrializingeconomies, Oxford: Oxford University Press.
Aron, Janine and Muellbauer, John (2000) “Financial Liberalization, Consumption, andDebt in South Africa,” Working Paper Series 2000-22, Center for the Study of AfricanEconomies.
Aron, Janine and Muellbauer, John (2002) “Interest Rate Effects on Output: Evidencefrom a GDP Forecasting Model for South Africa,” IMF Staff Papers, special issues.
Aron, Janine, Muellbauer, John and Smit, Benjamin (2004) “A Structural Model of theInflation Process in South Africa,” Working Paper Series 2004-08, Center for the Studyof African Economies.
Aron, Janine and Muellbauer, John (2005) “Monetary Policy, Macro-Stability and Growth:South Africa’s Recent Experience and Lessons,” World Economics (http://www.world-economics-journal.com/)
Arora, Vivek (2004) “Sovereign Spreads in South Africa,” power point presentation atOECD Conference on How to Reduce Debt Costs in Southern Africa, Johannesburg,March 25-26, 2004.
Baker, Dean (2003) “Tobin Taxes: Are They Enforceable?” in Weaver, James, Dodd,Randall, and Baker, Jamie eds. Debating the Tobin Tax: New Rules for Global Finance,Washington, DC: New Rules for Global Finance Coalition, pp. 101-08.
Ball, L. and Sheridan, N. (2003) Does Inflation Targeting Matter? IMF Working Paper No.03/129.
Barnes, Justin, Kaplinsky, Raphael, and Morris, Mike (2003) “Industrial Policy In Devel-oping Economies: Developing Dynamic Comparative Advantage In The South Afri-can Automobile Sector,” Paper presented at the TIPS and DPRU Annual Forum 2003,Johannesburg, South Africa.
Barro, Robert J. and Lee, Jong-Wha (2000) “International Data on Educational Attain-ment: Updates and Implications,” CID Working Paper no. 42 (http://www.cid.harvard.edu/ciddata/ciddata.html)
Bell, Trevor and Cattaneo, Nicolette (1997) “Foreign Trade and Employment in SouthAfrican Manufacturing Industry,” Occasional Report 4, Employment and TrainingDepartment, International Labour Office, Geneva.
Bernanke, Ben S. (1986) “Alternative Explanations of the Money-Income Correlation.”Carnegie-Rochester Conference Series on Public Policy, Autumn. Pp. 49-100.
Bernanke, Ben S., Gertler, Mark and Watson, Mark (1997) “Systematic Monetary Policy andthe Effects of Oil Price Shocks,” Brookings Papers on Economic Activity, 1, pp. 91-157.
185

An Employment-Targeted Economic Program for South Africa186
Bernanke, Ben S., Thomas Laubach, Adam S. Posen and Frederic S. Mishkin (1999) In-flation Targeting: Lessons from the International Experience. Princeton, NJ: PrincetonUniversity Press.
BIG Financing Reference Group (2004) Breaking the Poverty Trap: Financing a Basic In-come Grant in South Africa, Johannesburg: Economic Policy Research Institute.
Bigsten, A., Collier, A.P., Dercon, S., Gauthier, B., Gunning, J.W., Isaksson, A., Oduro,A., Oostendorp, R., Pattillo, C., Söderbom, M., Sylvain, M., Teal, F., Zeufack, A.(1999) “Investment in Africa’s manufacturing sector: a four country panel data analy-sis.” Oxford Bulletin of Economics and Statistics 61 (4), 489-512.
Blinder, Alan S. (1998) Central Banking in Theory and Practice. Cambridge, MA: MITPress.
Bruce-Brand, A. M. (2002) “Overview of Exchange Controls in South Africa,” Statementto the Commission of Inquiry into the Rapid Depreciation of the Exchange Rate of theRand, Reserve Bank of South Africa.
Bruno, Michael (1993) Crisis, Stabilization, and Economic Reform: Therapy by Consensus.Oxford: Clarendon Press.
Bruno, Michael (1995) “Does Inflation Really Lower Growth?” Finance and Development,September, pp. 35–38.
Bruno, Michael and Easterly, William (1998) “Inflation Crises and Long-Run Growth,”Journal of Monetary Economics, 41, pp. 3–26.
Burdekin, Richard C.K., Denzau, Arthur T., Keil, Manfred W., Sitthiyot, Thitithep,and Willett, Thomas D. (2004) “When Does Inflation Hurt Economic Growth?Different Nonlinearities for Different Economies,” Journal of Macroeconomics, 26,pp. 519–32.
Calmfors, Lars (1993) “Centralization of Wage Bargaining and Macroeconomic Perfor-mance,” OECD Economic Studies, No. 21, Winter, pp. 161-91.
Casale, Daniela, Muller, Colette, and Posel, Dorrit (2004) “‘Two million net new jobs.’ Areconsideration of the rise in employment in South Africa, 1995-2003,” The SouthAfrican Journal of Economics, 72:5, December, pp. 978–1002.
Cassim Rashad, Onyango, Donald, Skosana, Zola, and van Seventer, Dirk (2003) “A Re-view of the Changing Composition of the South African Economy,” Report preparedfor the 10-Year Review Project, Office of the Presidency.
Chabane, Neo, Machaka, Johannes, Molaba, Nkululeko, Roberts, Simon, and Taka, Milton(2003) “10 Year Review: Industrial Structure And Competition Policy,” Report pre-pared for the 10-Year Review Project, Office of the Presidency.
Chang, Ha-Joon (1994) The Political Economy of Industrial Policy. New York: St. Martin’sPress.
Corbo, Vittorio, Landerretche, Oscar and Schmidt-Hebbel, Klaus (2001) “Does InflationTargeting Make a Difference?” Central Bank of Chile Working Papers, No. 106.http://www.bcentral.cl/Estudios/DTBC/doctrab.htm

187References
Davies, Rob, and van Seventer, Dirk Ernst (2006) “An Economy-wide Impact Assessmentof the Economic Infrastructure Investment Component of the Accelerated & SharedGrowth Initiative (ASGISA),” forthcoming Working Paper, Political Economy Re-search Institute, University of Massachusetts-Amherst.
Deininger, Klaus, and Squire, Lyn (1999) “Measuring Economic Inequality: A NewDataset Measuring Income Inequality,” The World Bank Group http://www.worldbank.org/research/growth/dddeisqu.htm.
Department of Labour for South Africa (2003) Growth and Development Summit 2003,Pretoria: Chief Directorate of Communication, Department of Labour.
Department of Trade and Industry (2002) “Accelerating Growth And Development: TheContribution Of An Integrated Manufacturing Strategy,” Pretoria: Department ofTrade and Industry.
Department of Trade and Industry (2003) “Current Development in the Automotive In-dustry 2003,” September, Pretoria: Department of Trade and Industry.
Department of Trade and Industry (2004) “Current Developments in the AutomotiveIndustry 2004,” Pretoria: Department of Trade and Industry.
Dooley, Michael P. (1995) “A Survey of Academic Literature on Controls over Interna-tional Capital Transactions,” NBER Working Paper, No. 5352.
Dornbusch, Rudiger and Fischer, Stanley (1991) “Moderate Inflation,” National Bureauof Economic Research Working Paper 3896.
Easterly, William and Sewadeh, Mirvat (2002) “Global Development Network GrowthDatabase,” http://www.worldbank.org/research/growth/GDNdata.htm.
Edwards, Lawrence (2001a) “Globalisation and the Skill Bias of Occupational Employ-ment in South Africa,” South African Journal of Economics, 69(1), pp. 40-71.
Edwards, Lawrence (2001b) “Trade and The Structure of South African Production, 1984-97,” Development Southern Africa, 18(4), pp. 471-91.
Edwards, Lawrence and Golub, Stephen (2004) “South Africa’s International Cost Com-petitiveness And Exports In Manufacturing,” World Development, 32(8), pp. 323-1339.
EM-DAT: The OFDA/CRED International Disaster Database www.em-dat.net Brus-sels, Belgium: Université Catholique de Louvain.
Epstein, Gerald (2002) “Employment-Oriented Central Bank Policy in an Integrated WorldEconomy: A Reform Proposal for South Africa,” University of Massachusetts-Amherst:Political Economy Research Institute, Working Paper #39, http://www.umass.edu/peri/pdfs/WP39.pdf
Epstein, Gerald, Grabel, Ilene, and Jomo, K.S. (2005) “Capital Management Techniquesin Developing Countries,” in Gerald Epstein, ed. Financialization and the WorldEconomy. Northampton, MA: Elgar Press.
Epstein, Gerald and Schor, Juliet (1992) “Structural Determinants and Economic Effectsof Capital Controls in OECD Countries,” in Banuri, T. and Schor, J., eds. Financial

An Employment-Targeted Economic Program for South Africa188
Openness and National Autonomy: Opportunities and Constraints. Oxford, England:Clarendon Press, pp. 136-161.
Fallon, Peter, and Lucas, Robert (1998) “South African Labor Markets Adjustment andInequalities,” Discussion Paper 12, Informal Discussion Papers on Aspects of theEconomy of South Africa, The World Bank Southern Africa Department.
Farrell, G. N. (2001) “Capital Controls and the Volatility of South African Exchange Rates,”South African Reserve Bank, Occasional Paper No. 15, July.
Fedderke, J.W. (2004) “Investment in Fixed Capital Stock: Testing the Impact of Sectoraland Systemic Uncertainty.” Oxford Bulletin of Economics and Statistics, 66 (2), pp. 165-187.
Fedderke, J.W. and Vaze, P (2001) “The Nature Of South Africa’s Trade Patterns by Eco-nomic Sector and the Extent of Trade Liberalization During the Course of the 1990s,”South African Journal of Economics, 69(3), pp. 436-73.
Fielding, David (1996) “Consumer Expenditure in South Africa: A Time Series Model,”Applied Economic Letters, 3, pp. 385-389.
Fielding, David (1997) “Aggregate Investment In South Africa: A Model With Implica-tions For Political Freedom,” Oxford Bulletin of Economics and Statistics, 59 (3), pp.349-369.
Galindo, Arturo and Micco, Alejandro (2004) “Do State Owned Banks Promote Growth?Cross-Country Evidence for Manufacturing Industries,” Economic Letters, 84, pp. 371-76.
Ganesh-Kumar, A., Sen, Kunal, and Vaidya, Rajendra R. (2002) “Financial Markets, Fi-nancial Intermediaries, and Investments in India,” Journal of International Develop-ment, 14(2): pp. 211-28.
Gelb, Stephen (2004) “The South African Economy: An Overview, 1994-2004.” Type-script, EDGE Institute and University of Witwatersrand, Johannesburg.
Gelb, Stephen and Black, Anthony (2004) “Foreign Direct Investment in South Africa,”in Meyer, K. and Estrin, S., Investment Strategies in Emerging Markets, Edgar Elgar,Cheltenham, UK: Edward Elgar.
Ghosh, Atish and Phillips, Steven (1998) “Warning: Inflation May Be Harmful to YourGrowth,” IMF Staff Papers, 45 (4), pp. 672-86.
Ghosh, Jayati (2003) “Exporting Jobs or Watching Them Disappear? Relocation, Em-ployment and Accumulation in the World Economy,” in Ghosh, J. and Chandrasekhar,C.P., Work and Well-Being in the Age of Finance, New Delhi: Tulika Books, pp. 99-119.
Gleditsch, Nils Petter, Wallensteen, Peter, Eriksson, Mikael, Sollenberg, Margareta andStrand, Håvard (2002) “Armed Conflict 1946–2001: A New Dataset,” Journal of PeaceResearch 39(5): pp. 615-37.
Grabel, Ilene (2004) “Trip Wires and Speed Bumps: Managing Financial Risks and Re-ducing the Potential for Financial Crises in Developing Economies,” United NationsConference on Trade and Development (UNCTAD). G-24 Discussion Paper, No. 33,November.

189References
Griffith-Jones, Stephany and Fuzzo de Lima, Ana Teresa (2004) “Alternative Loan Guar-antee Mechanisms and Project Finance for Infrastructure in Developing Countries,”Typescript, Institute of Development Studies, University of Sussex, February.
Heintz, James, (2000) “Political Unrest, Distributive Conflict, and Investment: The Caseof South Africa.” Paper presented at the PERI workshop on Investment in Africa,October.
Heintz, James, (2002) “Political Conflict and the Social Structure of Accumulation: TheCase of South African Apartheid.” Review of Radical Political Economics, 34 (3), pp.319-326.
Heintz, James, and Pollin, Robert (2003) “Informalization, Economic Growth and theChallenge of Creating Viable Labor Standards in Developing Countries,” PoliticalEconomy Research Institute Working Paper Series, #60.
Heston, Alan, Summers, Robert and Aten, Bettina (2002) Penn World Table Version 6.1,Center for International Comparisons at the University of Pennsylvania (CICUP),October.
Hirsch, Alan (2004) “South Africa’s Development Path and the Government’s Programmeof Action,” typescript, Office of The Presidency Policy Coordination and AdvisoryServices.
Hirsch, Alan (2005) Season of Hope: Economic Reform under Mandela and Mbeki, Scottsville,SA: University of KwaZulu-Natal Press; and Ottawa, Canada: International Devel-opment Research Centre.
Hoogeveen, Johannes G., and Ozler, Berk (2004) “Not Separate, Not Equal: Poverty andInequality in Post-Apartheid South Africa,” manuscript, Washington, DC: World Bank.
IMF (2003) South Africa: Selected Issues. IMF Country Report, No. 03/18, January.
IMF (2004) South Africa: Selected Issues. IMF Country Report, No. 04/379, December.
Inter-American Development Bank (2003) “Guarantee Disbursement Loans (GDLs) withSovereign Guarantee: Pilot Program to Provide the Option of Disbursing Loans inthe Form of a Guarantee,” Typescript, March.
Iversen, T., Jonas Pontusson, Jonas, and Soskice, David, eds., (2000) Unions, Employers,andCentral Banks, Cambridge, UK: Cambridge University Press.
Jacobson, Tor, Per Jansson, Anders Vredin and Anders Warne, (1999) “A VAR Model forMonetary Policy Analysis in a Small Open Economy,” mimeo.
Kaplan, David (2003) “Manufacturing Performance and Policy in South Africa: A Re-view,” Paper Presented At The TIPS And DPRU Annual Forum 2003, Johannesburg,South Africa.
Kaplan, Ethan and Rodrik, Dani (2001) “Did the Malaysian Capital Controls Work?”February KSG Working Paper No. 01-008. http://ssrn.com/abstract=262173
Khan, Azizur (2004) “Growth, Employment and Poverty: An Analysis of the Vital NexusBased on Some Recent UNDP and ILO/SIDA Studies,”paper presented at the UNDPInternational Policy Conference on Strengthening the Employment Nexus Between

An Employment-Targeted Economic Program for South Africa190
Growth and Poverty Reduction, Brasilia, Brazil, January 11 – 12, 2005, UNDP Inter-national Poverty Centre.
Khan, Mohsin S. and Senhadji, Abdelhak S. (2001) “Threshold Effects in the Relation-ship Between Inflation and Growth,” IMF Staff Papers, 48:1, 1-21.
Leeper, Eric M. and Zha, Tao (2002) “Empirical Analysis of Policy Interventions,” NBERPaper, No. 9063.
Leeper, Eric M., and Zha, Tao (2003) “Modest Policy Interventions,” Journal of Mon-etary Economics. 50, pp. 1673-1700.
Lewis, Jeffrey D. (2001) “Policies to Promote Growth and Employment in South Africa,”Discussion Paper 16, Informal Discussion Papers on Aspects of the Economy of SouthAfrica, World Bank Southern Africa Department.
Liebbrandt, Murray, Levinsohn, James, and McCrary, Justin (2005) “Incomes in SouthAfrica Since the Fall of Apartheid,” Working Paper 11384, Cambridge, MA: NationalBureau of Economic Research.
Li, Wenli (1998) “Government Loan, Guarantee, and Grant Programs: An Evaluation,”Economic Quarterly, Federal Reserve Bank of Richmond, 84:4, pp. 25-51.
Marshall, Mike (1994) “Lessons from the Experience of the Swedish Model,” in P. Arestisand M. Marshall eds., The Political Economy of Full Employment, Northampton, MA:Edward Elgar, Chapter 10.
Maisel, Sherman (1973) “Improving Our System of Credit Allocation,” in Federal Re-serve Bank of Boston, Credit Allocation Techniques and Monetary Policy, Proceedings ofa Conference held at Melvin Village , New Hampshire, pp. 15-30.
Mboweni, T.T. (2002) “The Objectives and Importance of Inflation Targeting,” BusinessDay, Nov. 13, 2002.
McCord, Anna (2004a) “Policy Expectations and Programme Reality: The Poverty Re-duction and Labour Market Impact of Two Public Works Programmes in South Af-rica,” London: Overseas Development Institute.
McCord, Anna (2004b) “Public Works and Overcoming Under-Development in SouthAfrica,” manuscript delivered at UNDP, HSRC, & DBSA conference on “Overcom-ing Under-development in South Africa’s Second Economy,” October.
McCord, Anna and van Seventer, Dirk (2004) “The Economy-Wide Impacts of the LabourIntensification of Infrastructure Expenditures in South Africa,” typescript presentedat DPRU, TIPS & Cornell Conference on African Development and Poverty Reduc-tion, the Macro-Micro Linkages, October.
Meth, Charles (2006) “What Was the Poverty Headcount in 2004? A Critique of theLatest Offering from van der Berg et al.,” manuscript, South African Labour and De-velopment Research Unit (SALDRU), University of Capetown, April.
Milesi-Ferretti, Gian Maria (1998), “Why Capital Controls? Theory and Evidence,” inEijffinger, S. and Huizinga, H., eds. Positive Political Economy: Theory andEvidenceCambridge: Cambridge University Press, 1998, 217-47.

191References
Mkandawire, Thandika (1999) “The Political Economy of Financial Reform in Africa,”Journal of Internaitonal Development, May/June, pp. 321-44.
Mlambo, K. and Nell, Kevin (2000) “Public Policy and Private Investment in South Af-rica: An Empirical Investigation.” in Elbadawi, I. and T. Hartzenberg (Eds.). Develop-ment Issues in South Africa. New York: St. Martin’s Press, pp. 80-109.
Mlambo, K. and Oshikoya, T.W. (2001) “Macroeconomic Factors and Investment in Af-rica,” Journal of African Economies, 10 (2) (Supplement), pp. 12-47.
Mondi, Lumkile (2006) “Targeted Employment Programs: The Case of the IndustrialDevelopment Corporation of South Africa,” Santon: The Industrial DevelopmentCorporation of South Africa, April.
National Treasury, Republic of South Africa (1996) Growth, Employment and Redistribu-tion, June, Pretoria.
National Treasury, Republic of South Africa (2004) Medium Term Budget Policy Statement,Communications Directorate, National Treasury, www.treasury.gov.za.
Padin, Jose A. (2003) “Puerto Rico in the Post War: Liberalized Development Bankingand the Fall of the ‘Fifth Tiger,’” World Development, 32:2, pp. 281-301.
Pekkarinen, P., Pohjola, M. and Rowthorn, B. (1992) Social Corporatism: A Superior Eco-nomic System? New York : Oxford University Press.
Phillips, Sean (2004a) “Expanding Employment in Public Works in South Africa,” ILO:ASIST, Bulletin No. 18, September 2004, http://www.ilo.org/public/english/em-ployment/recon/eiip/asist/bulletin/bul-18/bul-18.pdf
Phillips, Sean (2004b) “The Expanded Public Works Program,” typescript, NationalDepartment of Public Works, Government of South Africa.
Pollin, Robert (1993) “Public Credit Allocation through the Federal Reserve: Why It’sNecessary; How It Should Be Done,” in R. Pollin, G. Dymski and G. Epstein, eds.,Transforming the U.S. Financial System: Equity and Efficiency for the 21st Century,Armonk, NY: M.E. Sharpe, pp. 321-354.
Pollin, Robert (1995) “Financial Structures and Egalitarian Economic Policy,” New LeftReview, 214, November/December, 26-61.
Pollin, Robert (1997) “Financial Intermediation and the Variability of the Saving Con-straint,” in R. Pollin ed., The Macroeconomics of Saving, Finance and Investment, AnnArbor, MI: University of Michigan Press, pp. 309-366.
Pollin, Robert (2006) “Globalization and the Transition to Egalitarian Development,” inBoyce, James, Cullenberg, Stephen, Pattanaik, Prasanta, and Pollin, Robert, eds., Hu-man Development in the Era of Globalization: Essays in Honor of Keith B. Griffin,Northampton, MA: Edward Elgar, pp. 211-38.
Pollin, Robert (2003) “Savings,” in J. King, ed., Elgar Companion to Post-Keynesian Eco-nomics, Edward Elgar, pp. 304-08.
Pollin, Robert, Baker, Dean, and Schaberg, Marc (2003) “Securities Transaction Taxesfor U.S. Financial Markets,” Eastern Economic Journal 29(9), Fall, pp. 527-58.

An Employment-Targeted Economic Program for South Africa192
Pollin, Robert and Luce, Stephanie (1998) The Living Wage: Building a Fair Economy,New York: The New Press.
Pollin, Robert and Zhu, Andong (2006) “Inflation and Economic Growth: A Cross-CountryNon-linear Analysis,” Journal of Post Keynesian Economics, forthcoming. Available athttp://www.umass.edu/peri/pdfs/WP109.pdf
Rodrik, Dani (2004) “Rethinking Growth Policies in the Developing World,” manuscript,October, Harvard University.
Saad-Filho, Alfredo (2004) “Pro-Poor Monetary and Anti-Inflation Policies: DevelopingAlternatives to the New Monetary Policy Consensus,” A Report Commissioned bythe United Nations Development Program, Typescript, Department of DevelopmentStudies, School of Oriental and African Studies, University of London.
Selvanathan, E.A. and Selvanathan, Saroja (2003) “Consumer Demand in South Africa,”The South African Journal of Economics, 71:2, 325-344.
Standing, Guy, Sender, John, and Weeks, John (1996) Restructuring the Labour Market:The South African Challenge, Geneva: International Labour Office.
Stock, James H. and Watson, Mark W. (2001) “Vector Autoregressions,”Journal of Eco-nomic Perspectives, 15(4) Fall, pp. 101-115.
Storer, David and Teljeur, Ethel (2003), “Administered Prices,” Paper presented at theTIPS and DPRU Annual Forum 2003, Johannesburg, South Africa.
United Nations Conference on Trade and Development (2002) Trade and DevelopmentReport 2002, Geneva.
United Nations Conference on Trade and Development (2004) World Investment Report:The Shift Toward Services, New York and Geneva.
USAID (2005) “Overview of USAID Partial Credit Guarantees,” http://www.usaid.gov/our_work/economic_growth_and_trade/development_credit/index.html.
van der Berg, Servaas, Burger, Ronelle, Burger, Rulof, Louw, Megan, and Yu, Derek (2006)“Trends in Poverty and Inequality since the Political Transition,” Development PolicyResearch Unit Working Paper 06/104, University of Stellenbosch, March.
van Seventer, Dirk (2001) “The Level and Variation of Tariff Rates: An Analysis of Nomi-nal and Effective Tariff Rates in South Africa for the Years 2000 and 2001,” Paperpresented at the TIPS Annual Forum 2001, Johannesburg, South Africa.
Wade, Robert (1990) Governing the Market: Economic Theory and the Role of Governmentin East Asian Development. Princeton, NJ: Princeton University Press.
Walsh, Carl E. (2003) Monetary Theory and Policy. 2nd Edition. Cambridge, MA: MITPress.
World Bank (2003) World Development Indicators, Washington, DC, CD-ROM.

AAccelerated and Shared Growth
Initiative for South Africa(ASGISA)... xiii, xix, 2–3, 19, 61,66, 69
Accelerated growthindustries targeted for... 57, 68–70, 75labor intensity and... 72
Agricultural sectoremployment multipliers in... 64input-output tables... 163–164land reform... 10poverty reduction in... 68productivity in... 69–70subsidies for... 66
Alternative projectionseconomic growth... 11–13, 75–81employment... xv, xxv, 11–13, 75–81labor intensity... 11–13, 75–81poverty... xv
Amsden, Alice... 98, 100, 110, 135Apartheid era, real growth rate before
and after... xxi–xxiiAsset reserve requirements
formula for... 117loan guarantee program... 116–118prescribed asset policies... 97, 102,
116private banks... xxvi–xxviiproposal for... xvi, xxvi–xxvii
BBaker, Dean... 115Balance of payments
analysis by sector... 64, 65–67constraints on economic growth
imposed by... 51–52, 64, 65–67Ball, Lawrence... 132Ball-Sheridan study... 132Banks
asset reserve requirements (See Assetreserve requirements)
development banks (See Developmentbanks)
Industrial Development Corporation(See Industrial DevelopmentCorporation (IDC))
Banks (cont.)loan guarantee program (See Loan
guarantee program)small-scale banks (See Small-scale
banking)South African Reserve Bank (SARB)
(See South African ReserveBank (SARB))
Basic Conditions of Employment Act(BCEA)... 23
Bernanke, Ben... 132Black workers... 5–6, 23, 25–28Black, Anthony... 47Blinder, Alan... 132Bonds
government bond trading differentialwith US... 91, 148
securities transaction taxes... 84–87trading... 44–46
Bruce-Brand, A.M... 119, 120Bruno, Michael... xxviii–xxix, 128–130,
131, 133Burdekin, Denzau, Keil, Sitthiyot, and
Willet study... 129Burdekin, Richard... 129
CCapital controls
comparison, 2002 and 2004... 121dual exchange rate system... 124–125effectiveness... 122–125exchange rates and... xvi, xxvii–
xxviii, 119–122, 125–128interest rates and... 125International Monetary Fund study...
126–127, 129, 132proposals for... xvii, 127–128studies on effectiveness... 126–127,
129, 132Capital management techniques
capital controls (See Capital controls)exchange rate controls (See Exchange
rate)generally... 119–122
Casale, Daniela... 8, 33Casale, Muller and Posel study... 8, 33
INDEX
193

An Employment-Targeted Economic Program for South Africa194
Consumption spendingdomestic spending channel... 51economic growth spurred by... 49–51estimate of... 14–15, 159–161inflation’s impact on... 50–51, 159–161interest rates and... 50
Cooperatives, subsidized... 104Corbo, Vittorio... 132Credit subsidy programs... 36–37Cronin, Jeremy... 104Cross-subsidization within parastatals...
136
DDenzau, Arthur... 129Department of Trade and Industry
(DTI)... 135Development banks
expansion of... xxvi–xxvii, 96, 98–101Industrial Development Corporation
(See Industrial DevelopmentCorporation (IDC))
job creation and... 105Disinflation... 133–134Dooley, Michael... 122Dornbusch, Rudiger... 133DTI. See Department of Trade and
Industry (DTI)Dual exchange rate system... 124–125Duration of job seeking, unemployment
by... 6–7
EEasterly, William... 128–130Economic growth
alternative scenarios... 11–13, 75–81apartheid era rate... xxi–xxiiconsumption spending and... 49–51export-led growth strategy... 24, 51–52figures for 1984-2004... xxi, 9gross domestic product (See Gross
domestic product (GDP))Growth, Equity and Redistribution
(GEAR) program (See Growth,Equity and Redistribution(GEAR) program)
high employment growth industries...70–71
income growth (See Income growth)inflation control and... xxvii–xxix,
88–92, 128–134
Economic growth (cont.)interest rates and... 93lower rates’ impact on... 95negative inflation/growth threshold...
129–130private investment (See Private
investment)rising labor intensity and... 70–71supply-side perspectives (See
Supply-side perspectives onemployment expansion)
trade liberalization’s effects... 24, 31–32, 52–56, 151
Edwards, Lawrence... 24–25, 30–32Edwards-Golub study... 24–25, 30–32Efficiency wage effect... 34–35EIS. See Employment Impact StatementsEmployment data. See also Unemployment
elasticity data sources... 143–146GDP/formal employment ratio... 11–
13input-output model for... 163–165sources of... 143–146
Employment Equity Act... 23Employment growth under alternative
assumptions... xv, xxv, 11–13, 75–81Employment Impact Statements... 104,
110, 112Employment multipliers
input-output model and... 163–165labor intensity and... xxiii, 62–64
Employment stagnation in formaleconomy... 16–19
Employment subsidies... 36–37, 82, 84,85, 86, 96–101
Employment/output ratio... 10–13, 60,70–75, 165
Epstein, Gerald... 92EPWP. (See Expanded Public Works
Program (EPWP))Escrow accounts
numerical example... 115social priority lending, for... 110–113
Exchange controls (See Exchange ratecontrols)
Exchange ratecontrols and... xvii, xxvii–xxviii, 119–
122, 125–128defined... 172dual exchange rate system... 124–125interest rates and... 93, 95–100

195Index
Exchange rate (cont.)investment, impact on... 148–150proposals for... xvii, xxvii–xxviii
Expanded Public Works Program(EPWP)... xvi, xxiii, 4, 56–61
Exportsbalance of payments (See Balance of
payments)competitiveness by industrial sector...
30–32GDP, as percent of... 53global competitiveness... 52–56growth strategy based on... 24, 51–52labor costs as factor... 30–32share by country... 54
FFallon, Peter... 25, 26, 27–28Fallon-Lucas study... 25, 26, 27–28Farrell, G.N... 123–125Financial institutions
asset reserve requirements (See Assetreserve requirements)
development banks (SeeDevelopment banks)
Industrial Development Corporation(See Industrial DevelopmentCorporation (IDC))
loan guarantee program (See Loanguarantee program)
Financial integration index... 123–125Fischer, Stanley... 133Foreign direct investment... 24–25, 47–48Formal employment ratio to GDP... xxiii,
11–13
GGEAR. See Growth, Equity and
Redistribution (GEAR) programGelb, Stephen... 17, 47, 134Gender, unemployment comparison by...
5–6Ghosh, Atish... 129Ghosh, Jayati... 10GJMC. See Greater Johannesburg
Metropolitan Council (GJMC)Global competitiveness
exports... 52–56labor costs... 24–25
Goldman Sachs... 126Golub, Stephen... 24–25, 30–32
Government budgetbalance, 1970-2001... 82fiscal deficit/GDP ratio... 81–82loan guarantee program (See Loan
guarantee program)policy recommendations for
increased spending... xvii–xviii, 79, 82–84
revenue as share of GDP... xvii–xviii,xxx–xxxi, 83
spending programs and tax policy...xxx–xxxi, 82–84
tax revenue sources... 84–94Government loan guarantee program.
(See Loan guarantee program)Grabel, Ilene... 127Granger causality tests... 176, 179, 181Greater Johannesburg Metropolitan
Council (GJMC)... 29Gross domestic product (GDP)
exports as percent of... 53fiscal deficit/GDP ratio... 81–82formal employment ratio to, 1967-
2001... 11–13interest rate decline’s impact... 95–100investment as share of... 41–43real growth rate... 9revenue as share of... xvii–xviii, xxx–
xxxi, 83Growth, Equity and Redistribution
(GEAR) programinvestment projections... 47, 48policies under... 16–19
Gundo Lashu program... 58, 59
HHeintz, James... 73, 150, 157High-employment growth industries...
68–71High-employment impact activities...
61–64, 70Hirsch, Alan... 1, 16, 40, 43, 102Hoogoveen, Johannes... 14–15, 33, 34Hoogoveen-Ozler study... 14–15, 33, 34
IIDC. See Industrial Development
Corporation (IDC)IMF. See International Monetary Fund
(IMF)

An Employment-Targeted Economic Program for South Africa196
Income growthcomparison, 1995-2000... 13–14consumption, effect on... 49–51Hoogoveen-Ozler study... 14–15, 33, 34income groupings, by... 13–14income policies as inflation control
tool... 133–134Liebbrandt, Levinsohn and McCrary
study... 13–14poverty reduction and... 87
Income inequality... 3, 13–15, 16, 33, 34Industrial Development Corporation
(IDC)annual report... 99, 105financial returns... 99–100role of... 100–101
Industrial sectors. See Sector policiesInflation
as deterrent to private investment...43–44, 147–150
Bruno study... xxviii–xxix, 128–130,131, 133
consumption and... 50–51, 159–161disinflation... 133–134economic growth and control of...
xxviii–xxix, 88–92, 128–134income policies as inflation control
tool... 133–134interest rates and... 88–93, 95–100Mexico, controls in... 100proposals to control... xvii, xxviii–xxixrate of... 88–89, 172Sweden, controls in... 134wages, impact on... 27–29
Informal employment defined... 7Input-output model and employment
multipliers... 163–165Instability
capital controls as remedy... 122–124deterrent to private investment... 43–
44, 147–150Interest rate decline
consumption spurred by... 50employment impact... 94GDP impact... 95–100inflation impact... 88–92, 95–100unsubsidized activities, impact on...
94–96Interest rates
capital controls and... 125consumption and... 50
Interest rates (cont.)decline (See Interest rate decline)differentials... 91, 125economic growth and... 93exchange rate and... 93, 95–100inflation and... 88–93, 95–100investment as promoted by... 42–43,
46–47long-term differential with US... 91,
148nominal and real... 90prime rate (See Prime rate)
International Monetary Fund (IMF)Ball-Sheridan study... 132Ghosh-Phillips study... 10, 129Khan-Senhadji study... 129study on capital controls... 126–127,
129, 132Investment
bonds (See Bonds)capital investment... 44–45exchange rate’s impact on... 148–150fiscal policy impact... 149–155foreign direct investment... 24–25,
47–48GDP, as share of... 41–43instability as deterrent... 43–44, 147–
149interest rates as promoting... 42–43,
46–47policy recommendations... 48–49portfolio investment... 44–45private investment (See Private
investment)projections vs. actual... 48real investment... 44savings rates as stimulus... 46–47stock trading (See Stock trading)taxes and... 42–43, 84–87, 149
JJob creation
development banks and... 105government subsidies for... 36–37, 82,
84, 85, 86, 96industry-by-industry analysis... 63–
66, 138lower interest rates and... 94policy approach of study... 2, 15–16productivity and... 21–22, 64–65public works programs... 57–61

197Index
Job creation (cont.)supply-side perspectives... xiv, 3, 8–9,
21–36Joblessness. See Unemployment
KKaplan, Ethan... 122Keil, Manfred... 129Khan, Moshin... 129
LLabor costs
analysis by sector... 24–25global competitiveness... 24–25real wage increases... 26–27reduction, policy recommendations
for... 32–37trade competitiveness and... 24–25,
30–32, 155–157unemployment as caused by... 3, 25–32wage elasticity of demand... 25–26,
32–33Labor intensity
accelerated growth and... 72alternative scenarios... 11–13, 75–81decline in... xiii–xiv, 10–13employment increases resulting
from... 10–13employment multipliers and... xxiii,
62–64employment/output ratio... 10–13, 60,
70–75, 165Expanded Public Works Program...
56–61industry sector analysis... 63–66public works programs... 56–61rising intensity and increased
growth... 70–71scenario for 2014... 12, 75subsidies based on... xxiii
Labor market inflexibility... 22–23, 35–36Labor Relations Act (LRA)... 23Labour Force Surveys... 143–144Land reform... 103Landerretche, Oscar... 132Laubach, Thomas... 132Levinsohn, James... 13–14, 15, 16Lewis, Jeffrey... 22–23, 26–27, 29, 32, 35,
36Liebbrandt, Levinsohn and McCrary
study of incomes... 13–14, 15, 16
Liebbrandt, Murray... 13–14, 15, 16Loan guarantee program
asset reserve requirements... 116–118contingent liabilities and accruals...
101–108cost of program... 106–107credit evaluations... 112defaults... 101, 109–112Employment Impact Statements...
104, 110, 112escrow accounts... 110–113, 115expansion of program... xvi, xxviextent of credit subsidy... 107fraud deterrence... 113–115incentive-based monitoring... 110–113penalties for employment pledge
failure... 113profitability to private lenders... 108–
109whistleblowers, incentives for... 115
Low employment multipliers, targetingsectors with... 137–140
Lucas, Robert... 25, 26, 27–28
MMaisel, Sherman... 117Manufacturing sector... 55, 138–139, 148–
150, 155–157Mbeki, Thabo... xix, 1, 40, 102–103Mboweni, T.T... 88McCord, Anna... 58, 59McCrary, Justin... 13–14, 15, 16Meth, Charles... 15–16Mexico, inflation control in... 100MIDP. See Motor Industry Development
Programme (MIDP)Mineral and Petroleum Royalty Bill... 84,
86–87Miskin, Frederic... 132Monetary policy
alternatives based on VAR simulationmodel... 171–184
inflation (See Inflation)interest rates (See Interest rates)prime rate (See Prime rate)private investment impact (See Private
investment)stimulus recommendations... xv–xvi,
xxiv–xxviiMonopolistic pricing... 131, 133, 136–137

An Employment-Targeted Economic Program for South Africa198
Motor Industry DevelopmentProgramme (MIDP)... 137–139
Motor vehicle sector... 137–139Muller, Colette... 8, 33
NNational budget. See Government budgetNational Economic Development and
Labor Council (NEDLAC)... 134Ndikumana, Leonce... 41–44, 46NEDLAC. See National Economic
Development and Labor Council(NEDLAC)
OOverdraft rates... 94Ozler, Berk... 14–15, 33, 34
PParastatals... xxxi, 136–137Phillips, Sean... 57Phillips, Steven... 129Policy recommendations
asset reserve requirements... xvi,xxvi–xxvii
credit subsidy program... 36–37development banking... xxvi–xxviiemployment-targeted program... xiv–
xvexchange rate controls... xvi, xxvii–
xxviiiexpanded public works programs...
xvigovernment spending... xvii–xviii,
xxx–xxxii, 79increasing fiscal deficit... xxiv, 79–84inflation controls... xvii, xxviii–xxixinvestment... 48–49labor costs, reduction of... 32–37monetary stimulus... xv–xvi, xxiv–xxviiprice setting... xviiiproductive sectors... xxxi–xxxiipublic credit allocation... xxvi–xxviipublic works programs... 57–58sector policies (See Sector policies)social priority lending... 103–113subsidized activities, growth stimulus
for... xvi, 64–68taxes... xvii–xviii, 82–84
Pollin, Robert... 73, 130Pollin-Zhu model... 130
Posel, Dorrit... 8, 33Posen, Adam... 132Poverty
alternative employment projectionand... xv
Hoogoveen-Ozler study... 14–15, 33, 34minimum income levels... 14–16number of people in... 14–16reduction (See Poverty reduction)van der Berg, Burger, Burger, Louw
and Yu study... 15–16wage-cutting resulting in... 33–34
Poverty reductionagricultural sector, in... 68income growth and... 87public works programs and... 58social grants as factor in... 15–16subsidies used for... 76
Prescribed asset system... 97, 102, 116Price-setting... 135–137Prime rate... 93–94, 124–125, 172, 176Private banks
asset requirements for... xxvi–xxviicredit allocation policies and... 105–106profitability of loan guarantee
program... 108–109Private investment
foundation for economic growth... 39–40
growth... 39–47Hirsch study... 40–41, 43instability as deterrent to... 43–44,
147–150macroeconomic policy factors and...
147–149Ndikumana study... 40–43sources of growth... 40–42
Productivityagricultural sector... 69–70balance between expanding jobs and...
21–22, 64–65means of increasing... 27, 34–35
Proposals. See Policy recommendationsProvincial statistics on unemployment... 6Public credit allocation policies
costs... 106–107defined... 96–98development banking (See Develop-
ment banks)recommendations... xxvi–xxvii, 103–
118

199Index
Public works programsExpanded Public Works Program
(EPWP) (See Expanded PublicWorks Program (EPWP))
RRace
employment rate differences... 5–6wage differences... 26–28
Ratesexchange rate (See Exchange rate)inflation... 88–89, 172interest rates (See Interest rates)overdraft rates... 94prime rate (See Prime rate)repo rates (See repo rates)savings rates as investment stimulus...
46–47Repo rates... 88, 93–94, 172Rigidity of real wages... 27–29Rodrik, Dani... 122Rural population
land reform... 103public works programs for... 70unemployment among... 5–6, 59
SSARB. See South African Reserve Bank
(SARB)Schmidt-Hebbel, Klaus... 132Sector policies
balance of payment considerations...67
employment generation by... 63–66export competitiveness and... 30–32high employment growth sectors...
68–70, 70input-output model used for... 163–165low employment multipliers, sectors
with... 137–139manufacturing sector... 138–139, 148–
150, 155–157motor vehicle sector... 137–139price-setting... 137steel industry... 137
Securities transaction taxes... 84–87Senhadji, Abdelhak... 129Sheridan, Niamh... 132Sitthiyot, Thitithep... 129Skilled workers... 22–23, 26–27Skills Development Levy of 1998... 23
Small-scale banking... 103, 105–106, 110,111, 116–117
Social priority lending... 103–113South African Reserve Bank (SARB)...
88, 92, 93–94, 95, 119, 121, 171Spending programs
public works programs (See ExpandedPublic Works Program (EPWP))
taxes and... xxx–xxxi, 82–84Steel industry... 137Stock trading... 43–46, 47–48, 84–86, 95Subsidized activities
agriculture... 66balance of payments constraints... 65–
67cooperatives... 104credit allocation proposals (See Public
credit allocation policies)criteria for selecting... xxiii, 36–37,
64–68cross-subsidization within
parastatals... 136development banks (See Development
banks)employment subsidies... 36–37, 82, 84,
85, 86, 96–101funding for... xivgrowth stimulus for... xvi, 64–68labor intensity as basis for subsidy...
xxiiiloan guarantee program (See Loan
guarantee program)poverty-reduction grants... 76social priority lending... 103–113sustained growth for... xvi
Supply-side perspectives on employmentexpansion... xiv, 3, 8–9, 21–36
Sweden, inflation control in... 134
TTaxes
investment impact... 42–43, 149Mineral and Petroleum Royalty Bill...
84, 86policy recommendations for in-
creased... xvii–xviiirevenue sources for national budget...
84–94securities transaction taxes... 84–87spending programs and... xxx–xxxi,
82–84

An Employment-Targeted Economic Program for South Africa200
Taxes (cont.)tax revenue/GDP ratio... xvii–xviii,
xxx–xxxi, 83Trade
analysis of performance by sector...31–32
balance of payments (See Balance ofpayments)
competitiveness... 24, 30–32, 31, 34,36, 147, 155–157
exports (See Exports)liberalization of policies... 24, 31–32,
52–56, 151reliance on imported capital goods... 139
UUnemployment
age, by... 7alternative scenarios... 75–81classical explanation... 22–23definition... 1discouraged workers... 6–7duration of job seeking, by... 6–7employment stagnation in formal
economy... 16–19employment subsidies... 64–65gender, by... 5–6labor costs as cause... 3, 25–32long-term unemployed... 6–7population group, by... 5poverty and, overview... 2provincial statistics... 5–6race, by... 5–6reduction through wage-cutting... 21–
23, 26, 32–34rural population... 5–6, 59skilled workers... 22–23, 26sources of employment data... 143–146supply-side issues... xiv, 8, 21–36unskilled workers... 8wage cutting to reduce... 22–23, 26,
32–34youth rates... 7
Unionization as cause of unemployment...xxix, 28–29, 35–36
United Nations Development Program... 1United States’ interest rate differential
with South Africa... 91Unskilled workers... 8, 22–23, 26–27
Unsubsidized activitiesinterest rate decline’s impact on... 94–96sustained growth for... xv–xvi
Vvan der Berg, Burger, Burger, Louw and
Yu study... 15van der Merwe, Claude... 26van Seventer, Dirk... 58, 59Vector Autoregression macroeconomic
(VAR) model... xxv, 92–93, 95–96,181, 184
WWages
black workers... 22–23, 26–27, 28cuts as reducing unemployment... 21–
23, 26, 32–34efficiency wage effect... 34–35elasticity of demand... 25–26, 32–33inflation’s impact on... 27–29poverty line... 14–16real wage increases... 26–27rigidity of real wages... 27–29skilled workers... 22–23, 26–27unskilled workers... 22–23, 26–27white workers... 26–27
Whitesemployment rate... 5–6wages... 26–27
Willet, Thomas... 129Women
income inequality... 13unemployment rate... 5–6
World Bank studiesBruno study... xxviii–xxix, 128–130,
131, 133Fallon-Lucas study... 25, 26, 27–28Ghosh-Phillips study... 129Hoogoveen-Ozler study... 14–15, 33, 34Lewis, Jeffrey... 26–27, 29, 32, 35, 36relationship between inflation and
growth... xxviii–xxvix
YYouth unemployment... 7
ZZhu, Andong... 130

ABOUT THE AUTHORS
Robert Pollin (Project Director) is Professor in the Department of Economicsand founding co-director of the Political Economy Research Institute at theUniversity of Massachusetts-Amherst. He received a Ph.D. in Economics fromthe New School for Social Research in New York City in 1982. His researchcenters on macroeconomics, conditions for low-wage workers in the U.S. andglobally, and the analysis of financial markets. His recent books include Contoursof Descent: U.S. Economic Fractures and the Landscape of Global Austerity (Verso2003); The Living Wage: Building a Fair Economy (with Stephanie Luce, TheNew Press 1998); and the edited volumes Human Development in the Era ofGlobalization (with James Boyce, Stephen Cullenberg, and Prasanta Pattanaik,E. Elgar 2006 and The Macroeconomics of Saving, Finance, and Investment(University of Michigan Press 1997). He writes and consults extensivelythroughout the United States on the viability of “living wage” policies. Parallelto his work in South Africa, he is also directing a UNDP-sponsored project onemployment promotion and poverty reduction in Kenya. He has workedpreviously with the UNDP in Bolivia, the Joint Economic Committee of theU.S. Congress, and as a member of the Capital Formation Subcouncil of theU.S. Competitiveness Policy Council.
Gerald Epstein is Professor of Economics and a founding Co-Director of thePolitical Economy Research Institute (PERI) at the University of Massachusetts,Amherst. He received his Ph.D. in Economics from Princeton University in1981. He has written articles on numerous topics including the political economyof central banking, capital management techniques, international credit relations,and multinational corporations. He has worked with the United NationsDevelopment Program in the areas of Pro-Poor Macroeconomic Policy andHuman Development Impact Assessments of Trade Policies, and with UN-DESA on developing alternatives to inflation targeting monetary policy. Epstein’scurrent research focuses on employment oriented macroeconomic and tradepolicies. He is the editor or co-editor of several books, including Globalizationand Progressive Economic Policy, (Cambridge University Press, 1998, with DeanBaker and Robert Pollin), Capital Flight and Capital Controls in DevelopingCountries, (E. Elgar, 2005) and Financialization and the World Economy (E. Elgar,2005).
James Heintz is Associate Research Professor and Associate Director at thePolitical Economy Research Institute, University of Massachusetts-Amherst.He received his Ph.D. in Economics from the University of Massachusetts in2001 and an MS in Economics in 1992 from the University of Minnesota. He
201

An Employment-Targeted Economic Program for South Africa202
has written on a wide range of economic policy issues, including job creation,global labor standards, egalitarian macroeconomic strategies, and investmentbehavior. In addition to this project in South Africa, he has also worked as aninternational consultant on projects in Ghana and and Kenya, sponsored by theInternational Labor Organization and the United Nations DevelopmentProgram, that focus on employment-oriented development policy. He is co-author, with Nancy Folbre, of The Ultimate Field Guide to the U.S. Economy.From 1996 to 1998, he worked as an economist at the National Labour andEconomic Development Institute in Johannesburg, a policy think tank affiliatedwith the South African labor movement. His current work focuses on globallabor standards, employment income, and poverty; employment policies for low-and middle-income countries; and the links between macroeconomic policiesand distributive outcomes.
Léonce Ndikumana is Associate Professor of Economics at the University ofMassachusetts at Amherst where he teaches courses in macroeconomics, moneyand banking and African economic development. He received his Ph.D. inEconomics in 1996 from Washington University in St. Louis. His researchinvestigates the role of financial systems for domestic investment, the issues ofexternal borrowing and capital flight from African countries, and the politicsand economics of conflict and civil wars in Africa. Since January 2006,Ndikumana is on leave at the United Nations Economic Commission for Africawhere he serves as Senior Economic Affair Officer in the Economic and SocialPolicy Division. He also has served as consultant, researcher and resource personfor several organizations including the World Bank, UNU/WIDER, ILO,UNCTAD, and the AERC. His work has appeared in The Journal of PostKeynesian Economics, World Development, The Journal of African Economies,International Journal of Money and Finance, Development and Change, The Journalof Development Studies, International Review of Economics and Finance, TheAfrican Studies Review, and The Journal of Modern African Studies. He has alsocontributed numerous chapters to edited volumes.